Next Article in Journal
SOC Estimation of a Rechargeable Li-Ion Battery Used in Fuel Cell Hybrid Electric Vehicles—Comparative Study of Accuracy and Robustness Performance Based on Statistical Criteria. Part II: SOC Estimators
Next Article in Special Issue
Heat Generation in NMC622 Coin Cells during Electrochemical Cycling: Separation of Reversible and Irreversible Heat Effects
Previous Article in Journal
Cell Replacement Strategies for Lithium Ion Battery Packs
Previous Article in Special Issue
A Review on Temperature-Dependent Electrochemical Properties, Aging, and Performance of Lithium-Ion Cells
 
 
Correction published on 25 June 2021, see Batteries 2021, 7(3), 43.
Article

Thermal Modeling Approaches for a LiCoO2 Lithium-ion Battery—A Comparative Study with Experimental Validation

by
Edwin Paccha-Herrera
1,*,
Williams R. Calderón-Muñoz
1,2,
Marcos Orchard
2,3,
Francisco Jaramillo
3 and
Kamal Medjaher
4
1
Department of Mechanical Engineering, Faculty of Physical and Mathematical Sciences, Universidad de Chile, Beauchef 851, Santiago 8370456, Chile
2
Energy Center, Universidad de Chile, Tupper 2007, Santiago 8370456, Chile
3
Department of Electrical Engineering, Faculty of Physical and Mathematical Sciences, Universidad de Chile, Tupper 2007, Santiago 8370456, Chile
4
École Nationale d’Ingénieurs de Tarbes, LGP, 47 Avenue d’Azereix, 65016 Tarbes, France
*
Author to whom correspondence should be addressed.
Batteries 2020, 6(3), 40; https://doi.org/10.3390/batteries6030040
Submission received: 29 June 2020 / Revised: 21 July 2020 / Accepted: 24 July 2020 / Published: 1 August 2020

Abstract

:
Temperature prediction of a battery plays a significant role in terms of energy efficiency and safety of electric vehicles, as well as several kinds of electric and electronic devices. In this regard, it is crucial to identify an adequate model to study the thermal behavior of a battery. This article reports a comparative study on thermal modeling approaches by using a LiCoO 2 26650 lithium-ion battery, and provides a methodology to characterize electrothermal phenomena. Three approaches have been implemented numerically—a thermal lumped model, a 3D computational fluid dynamics model, and an electrochemical model based on Newman, Tiedemann, Gu and Kim formulation. The last two methods were solved using ANSYS Fluent software. Simulations were validated with experimental measurements of the cell surface temperature at constant current discharge and under a highway driving cycle. Results show that the three models are consistent with actual temperature measurements. The electrochemical method has the lower error at 0.5C. Nevertheless, this model provides the higher error ( 1.3 C ) at 1.5C, where the maximum temperature increase of the cell was 18.1 C . Under the driving cycle, all the models are in the same order of error. Lumped model is suitable to simulate a wide range of battery operating conditions. Furthermore, this work was expanded to study heat generation, voltage and heat transfer coefficient under natural convection.

Graphical Abstract

1. Introduction

The use of electric vehicles (EVs) is becoming increasingly relevant to reduce oil consumption and avoid environmental pollution. Nevertheless, the primary challenge for clean energy vehicles is to improve the performance of their energy storage system, typically comprised of lithium-ion (Li-ion) batteries. A weak point of Li-ion batteries (LIBs) is that their behavior is strongly dependent on temperature, which advisable range of operation is between 15 C and 35 C [1]. Exploring the performance of the models for LIBs has potential utilization in several fields such as: condition monitoring, health assessment, remaining useful life (RUL) prediction and battery thermal management systems (BTMS).
In order to estimate the temperature of a LIB, there exist some models such as: thermal, electrochemical, equivalent circuit model (ECM) or a combination among them. A thermal model can be a lumped, one-dimensional (1D), two-dimensional (2D), or three-dimensional (3D) system, where the main input requirements for modeling are thermal properties and the heat generation rate of the battery.
Regarding the thermal lumped model, it can simulate the whole cell at a uniform temperature taking into consideration that the gradient temperature within the battery is negligible [2], and is also capable to estimate the center and surface temperature of the cell considering an internal thermal resistance [3] and the degradation of a battery pack [4]. Moreover, there exists many other thermal studies based on a lumped system. For instance, Bryden et al. [1] determined the heat capacity of many cells, Coman et al. [5] studied thermal abuse conditions, Lin et al. [6] formulated an electro-thermal model for a battery, and Gao et al. [7] proposed a reduced order model to control a battery pack. Most of the aforementioned studies on lumped models were developed employing small size batteries such as 18650 (18 mm diameter and 65 mm height) and 26650 (26 mm diameter and 65 mm height). For large format batteries, it is appropriate to study the cooling parameters to maintain a maximum temperature and uniformity of the cell [8] since the temperature gradient is considerable. For instance, in Reference [9], the authors reported the non-uniform temperature distribution for a 20 Ah LIB at discharging rates of 2C, 3C, and 4C. C-rate is the measurement of the charging or discharging current with respect to the rated capacity, for example, for a 1 Ah battery, 1C rate represents the current that completely discharges the battery in one hour.
Samba et al. [10] studied the thermal distribution for a pouch battery using a 2D computational fluid dynamics (CFD) model. Besides, some studies have employed analytical techniques such as polynomial approximation in order to estimate the heat conduction inside the battery for 1D and 2D models [11,12].
Three-dimensional thermal model is generally based on CFD solvers, and has been widely utilized by researchers to study the thermal performance of a single cell [13] and battery packs such as the work developed in References [14,15,16].
On the other hand, electrochemical models can be solved using multi-scale multi-domain (MSMD) approach by using electrochemical equations according to the physics of Li-ion transport in the battery at different domains and different scales [17]. This approach is useful to determine not only the temperature profile, but also relevant characteristics such as: heat generation, voltage, current flow field, and so forth. MSMD approach is implemented into Commercial software ANSYS Fluent through three sub-models: an equivalent circuit model (ECM) [18], a full electrochemical model based on Newman Pseudo-2D equations [19], and a Newman, Tiedemann, Gu and Kim (NTGK) model, which is a semi-empirical electrochemical model that requires discharging tests as input data [20]. When using NTGK model, the differences between simulated and measured cell temperatures could be less than 1 C [21]. Furthermore, MSMD model is capable to simulate a battery pack with the cells connected electrically [22,23] and thermal runaway [24,25]. Panchal et al. [19] applied MSMD framework by solving a Newman model to determine the temperature and voltage of a 26650 LFP lithium-ion battery discharged at constant discharge rates, whereas G. Li and S. Li [17] simulated a prismatic battery under a driving cycle by the same approach.
The aforementioned models have been studied independently. For instance, Xu et al. [26] presented a comparative study oriented to thermal control for cylindrical LIBs without considering electrochemical and CDF models. A suitable thermal management system is a priority for optimal performance and safety of the batteries [27]. In particular, comparisons between an electrochemical model and the other approaches are very scarce. The main contributions of this paper are:
  • To provide a methodology to characterize the electrothermal behavior of LIBs studying the heat transfer coefficients under free convection including thermal radiation effects, heat generation, and the estimation of thermal parameters.
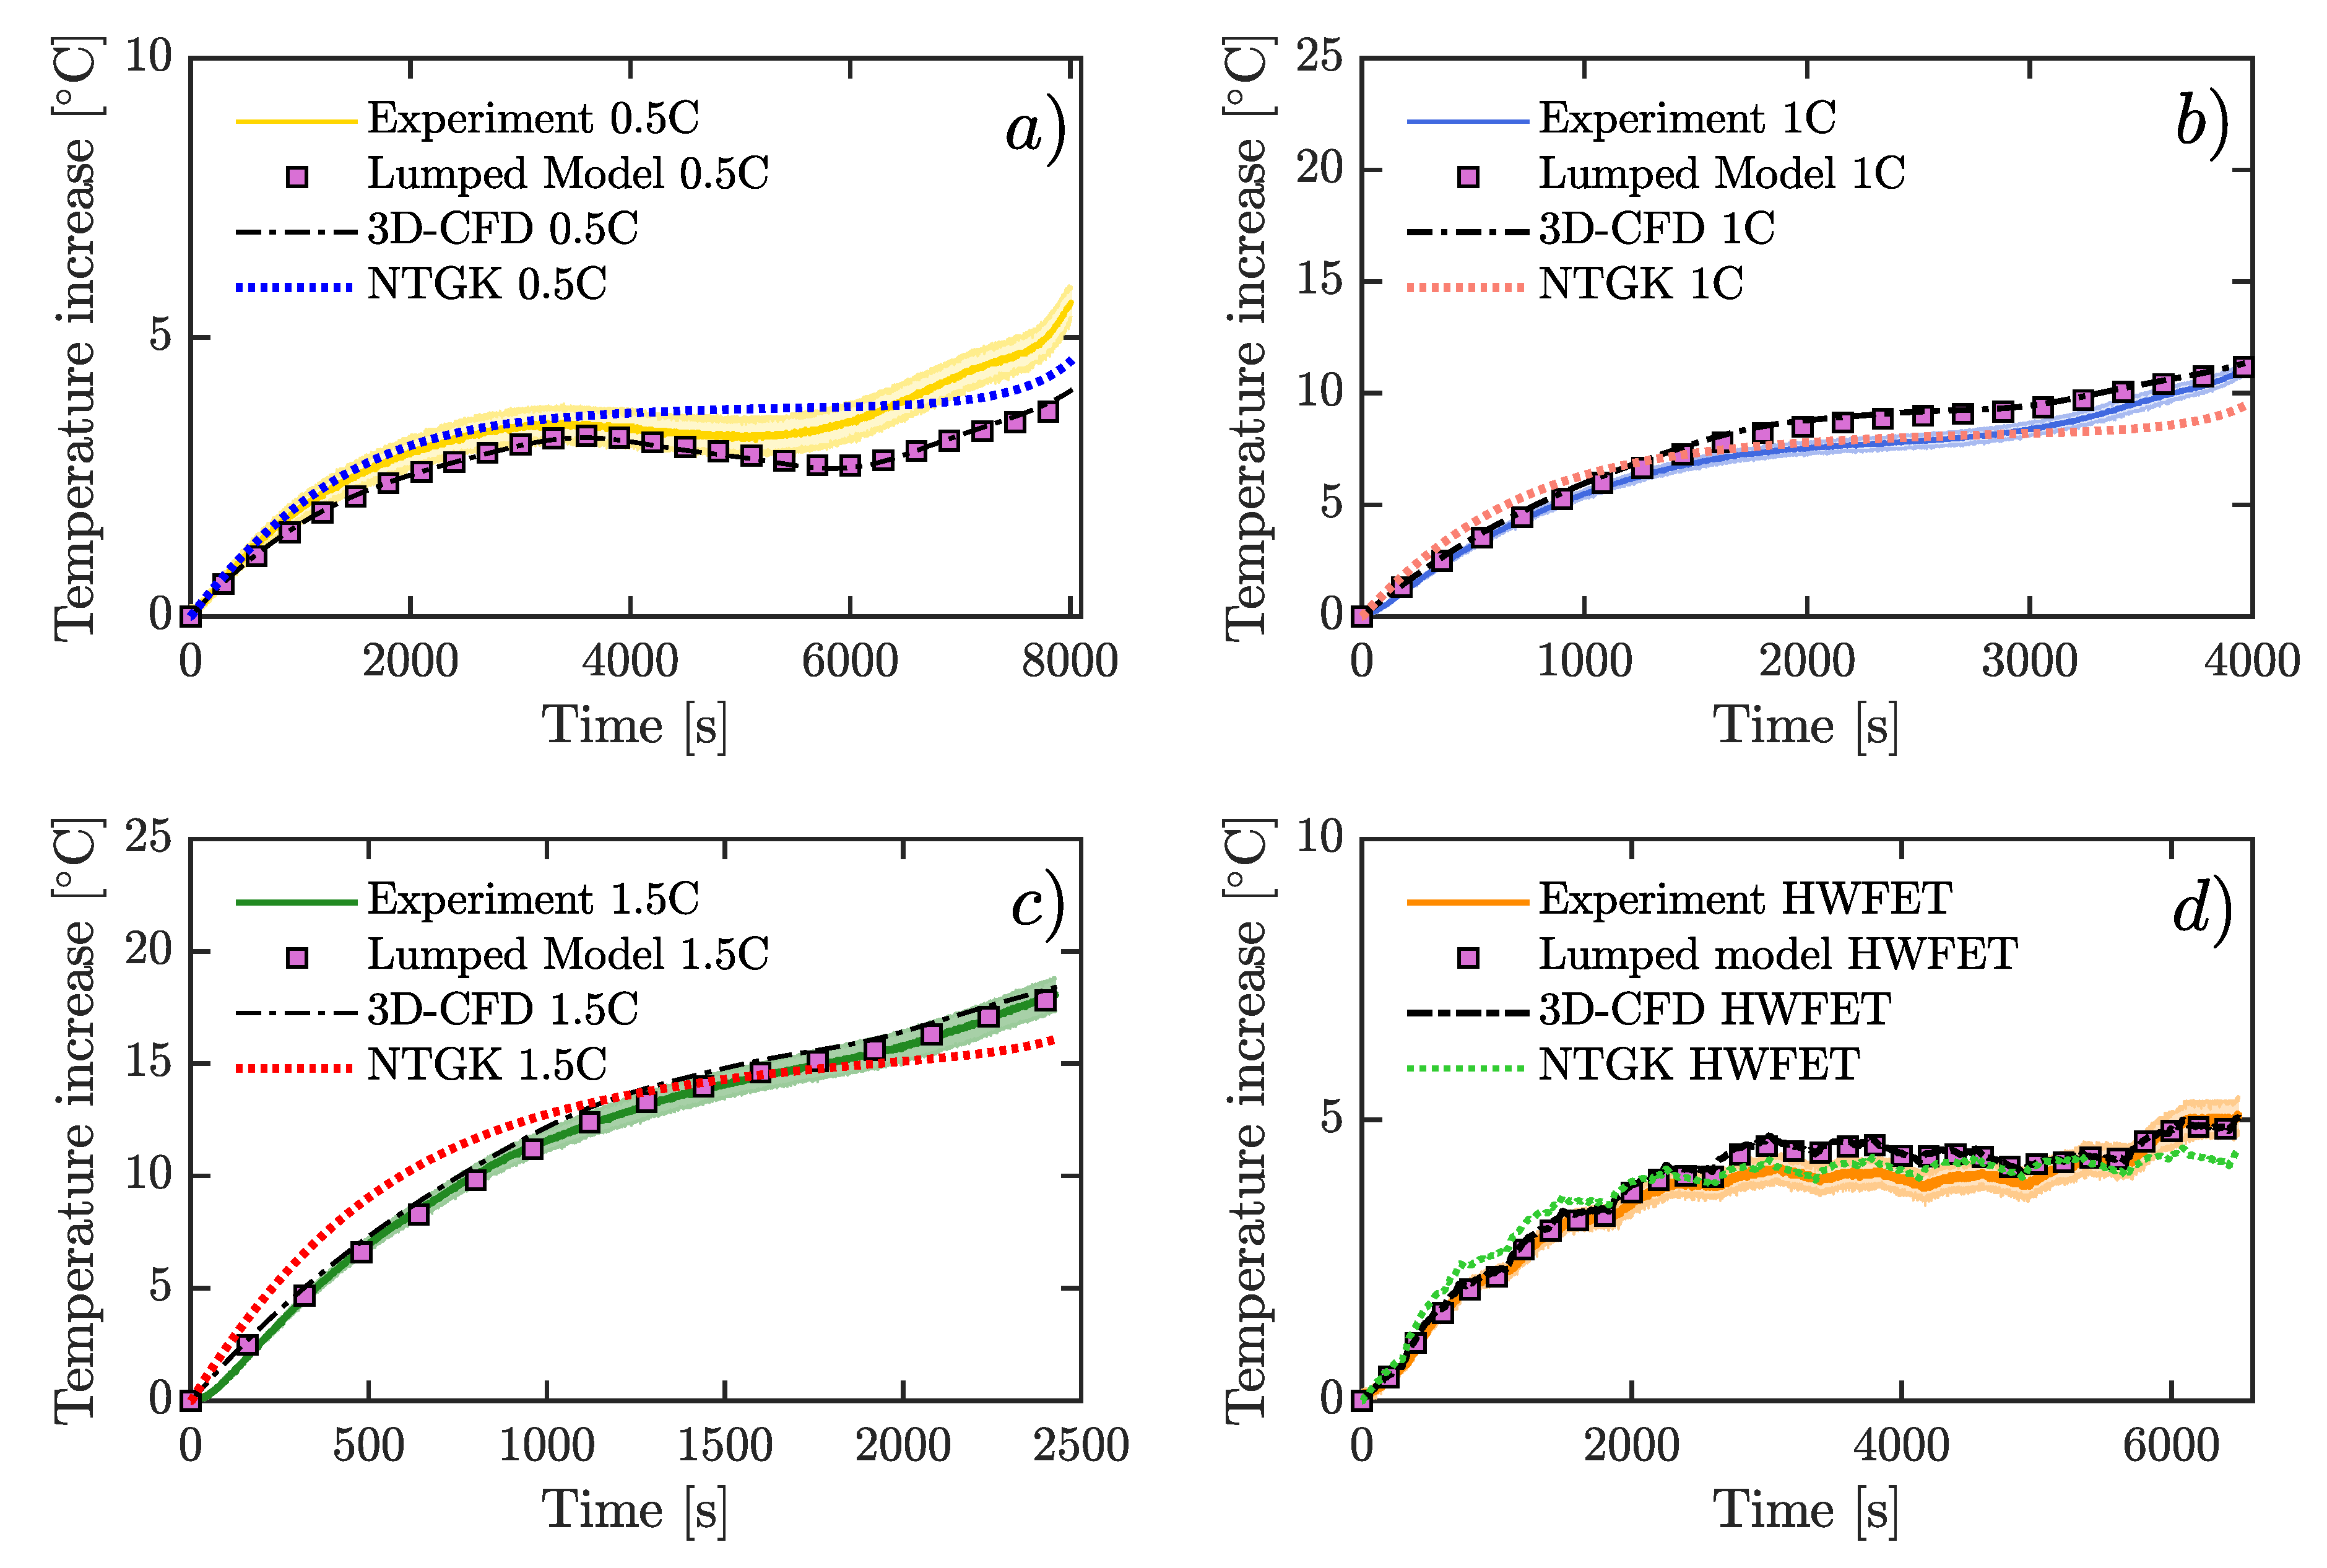
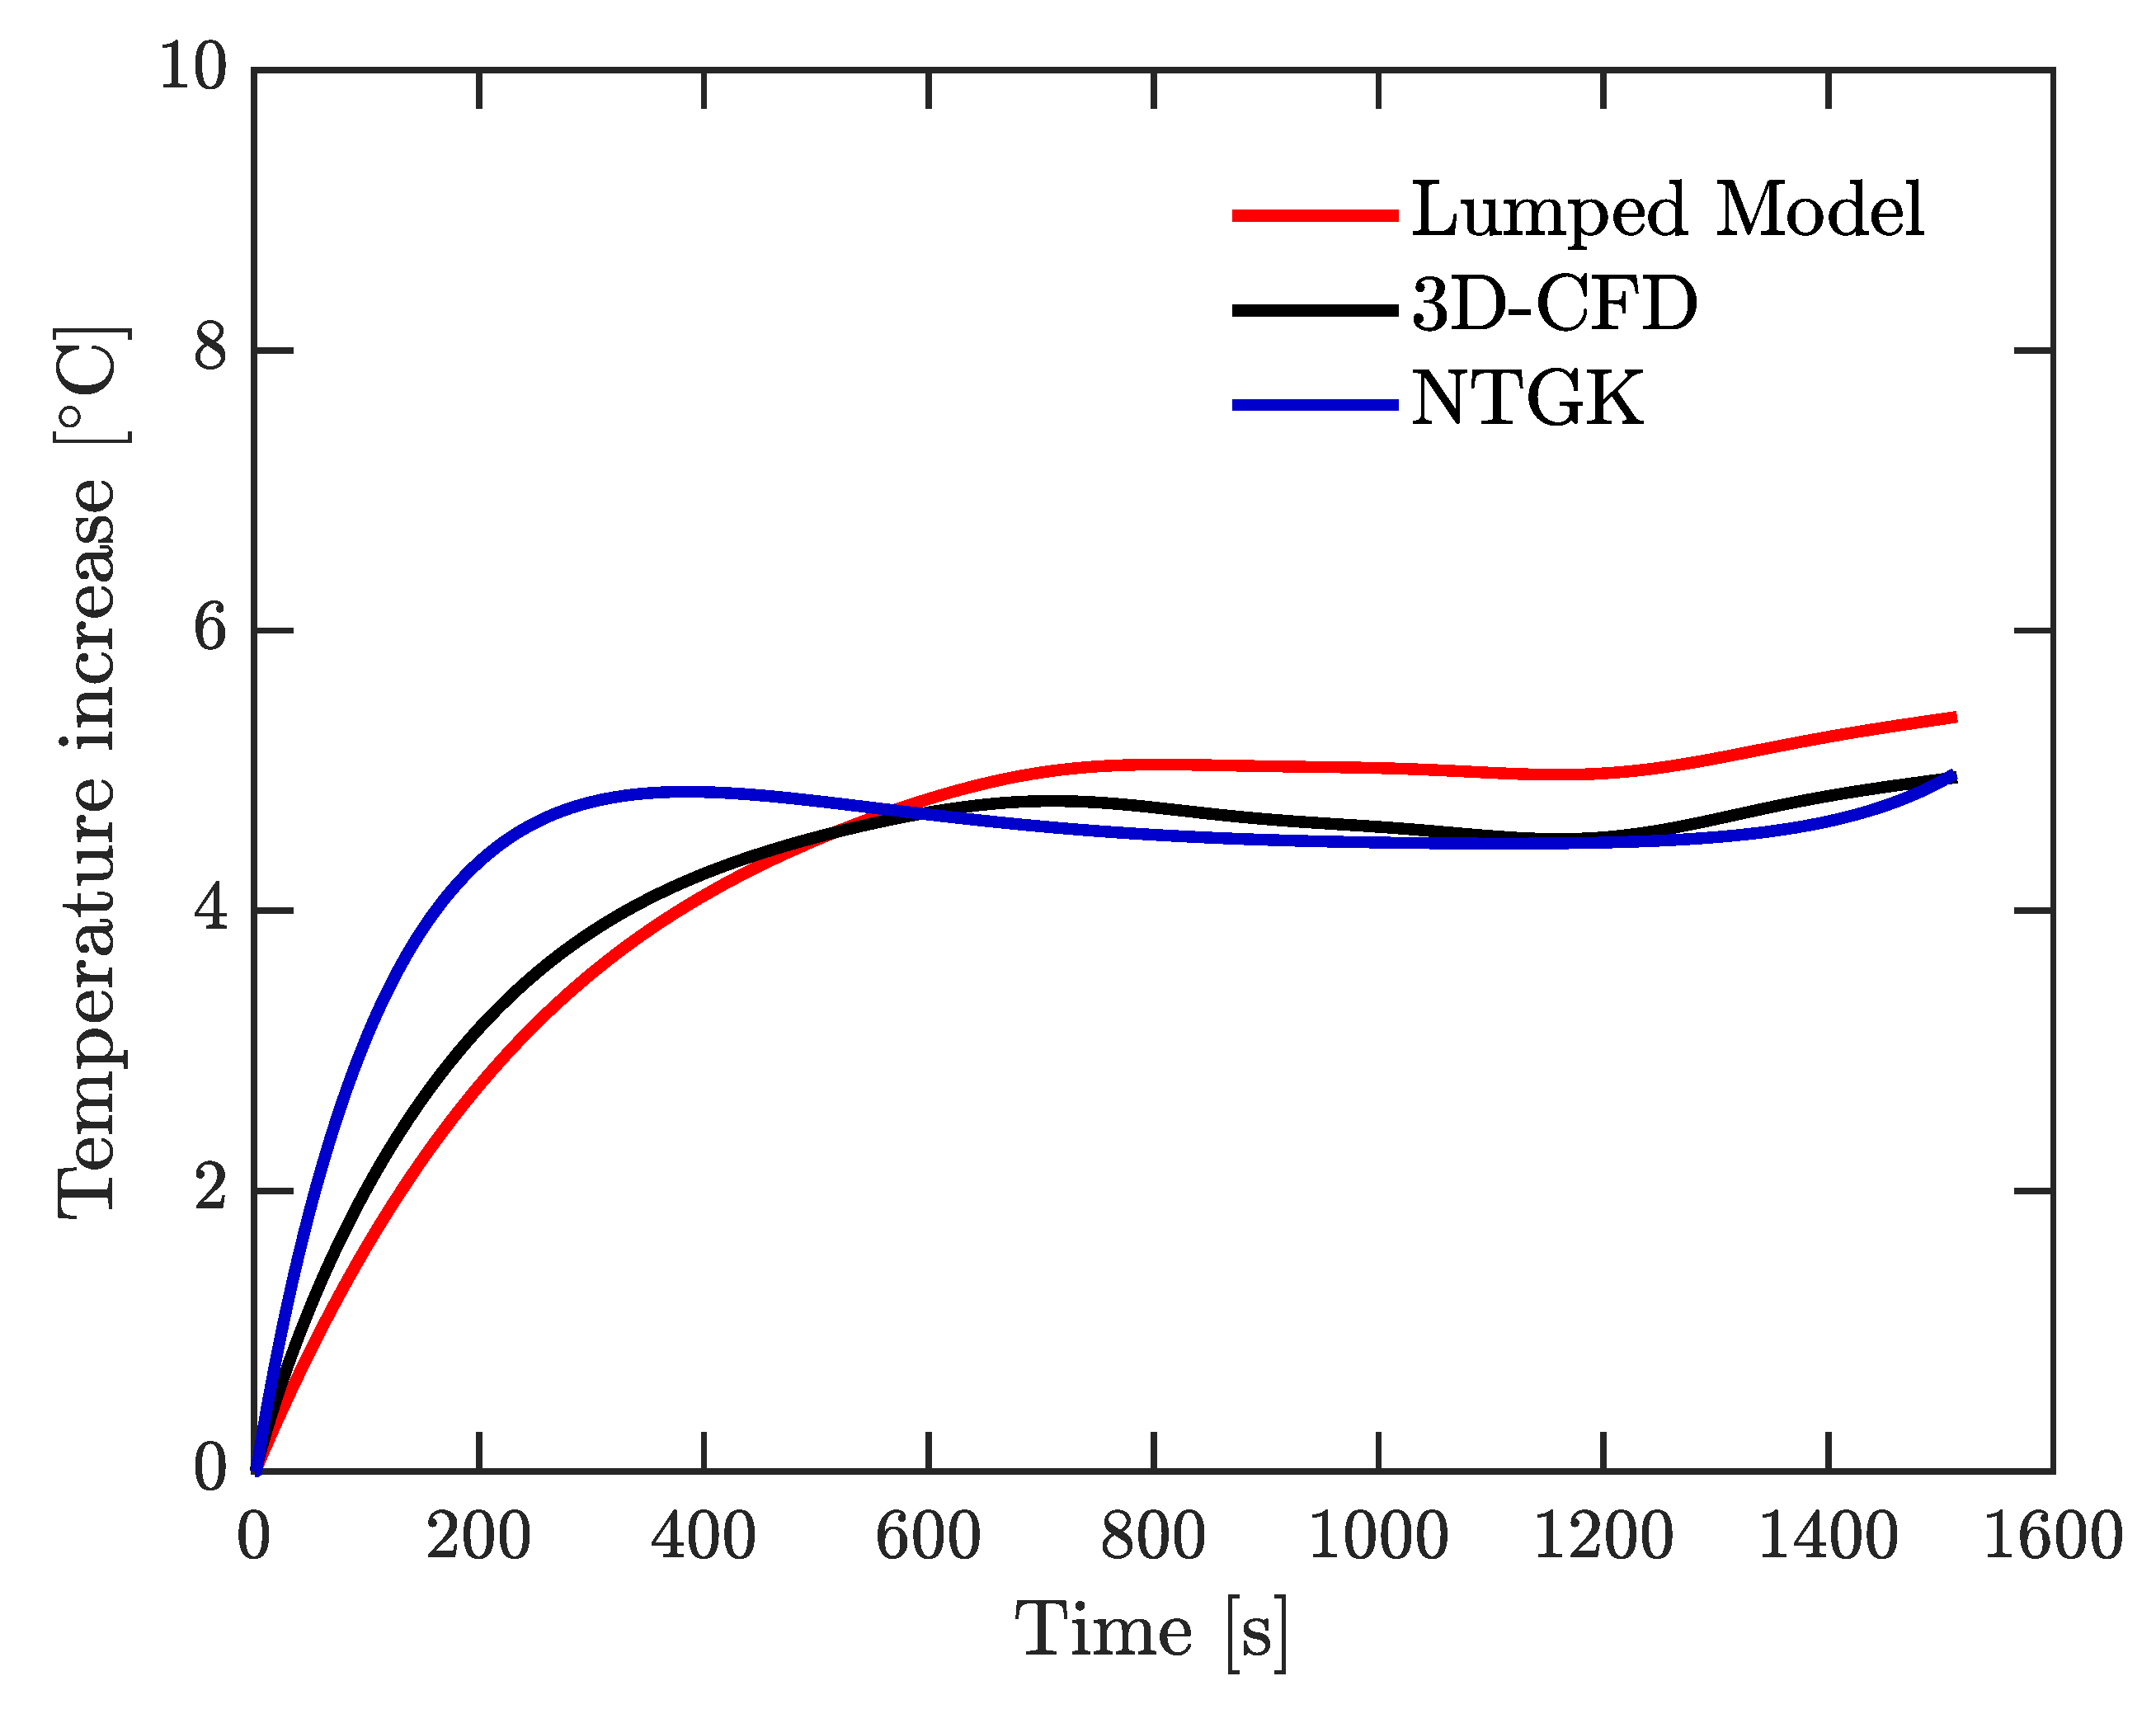
  • To compare the main approaches used for thermal modeling of a cylindrical LIB with experimental validation for a same case study.
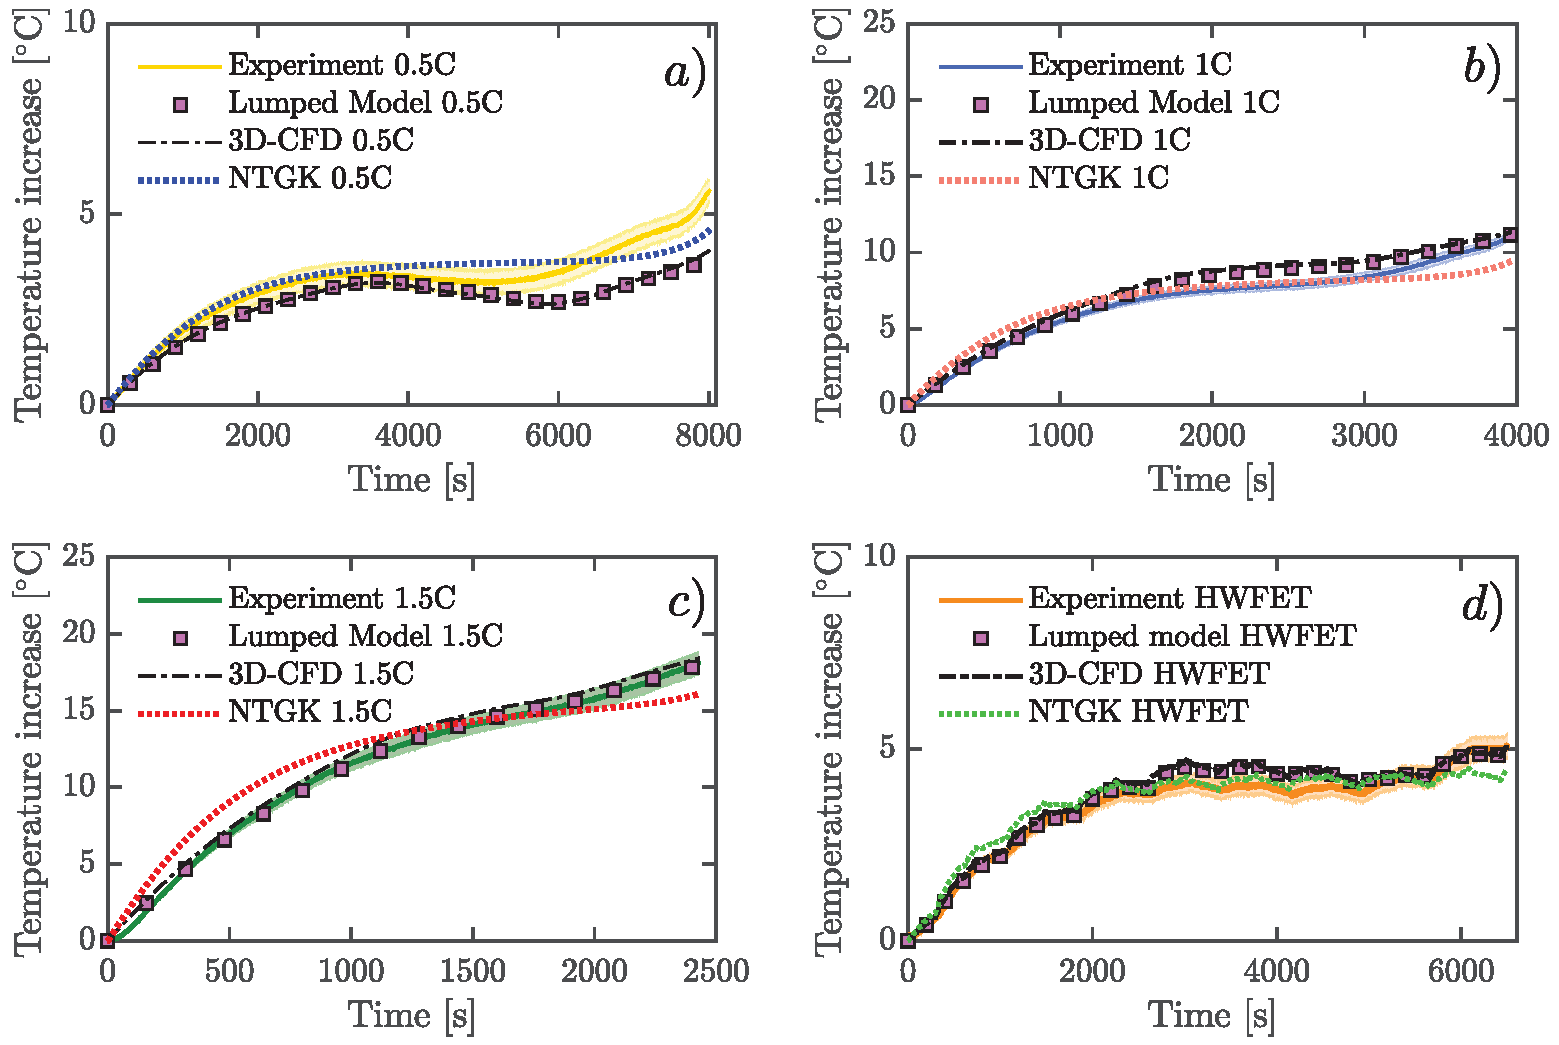
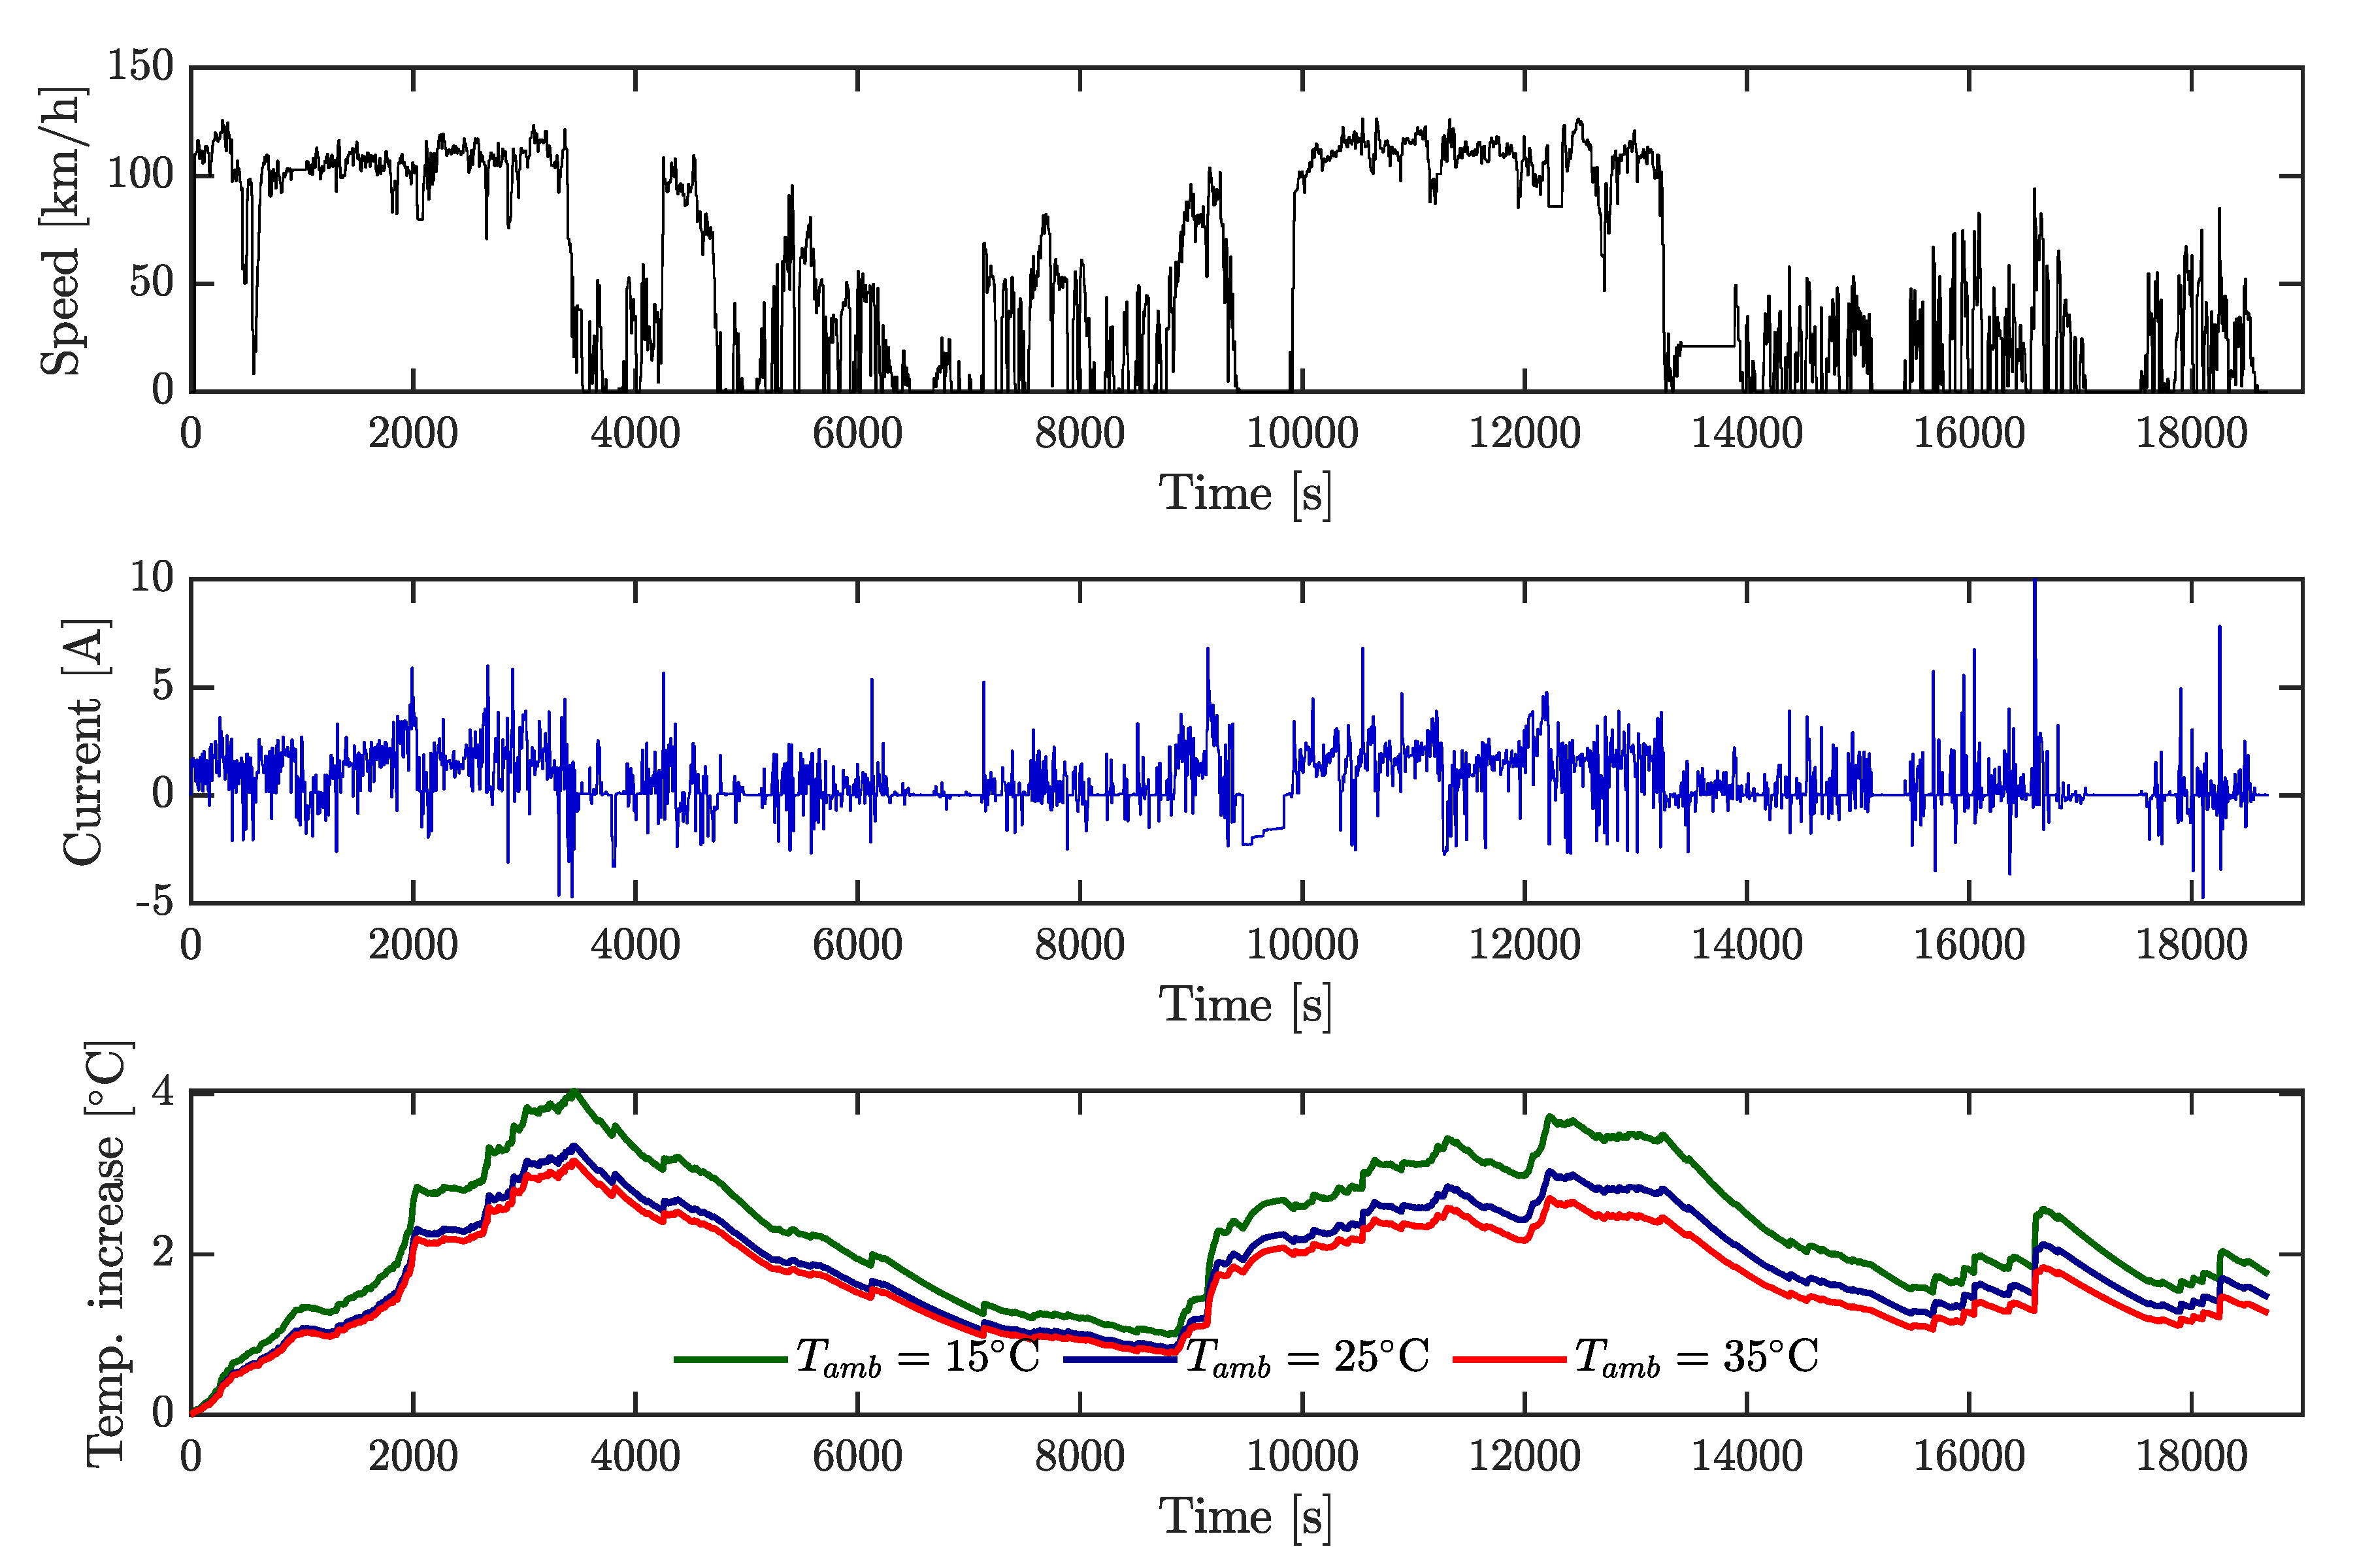
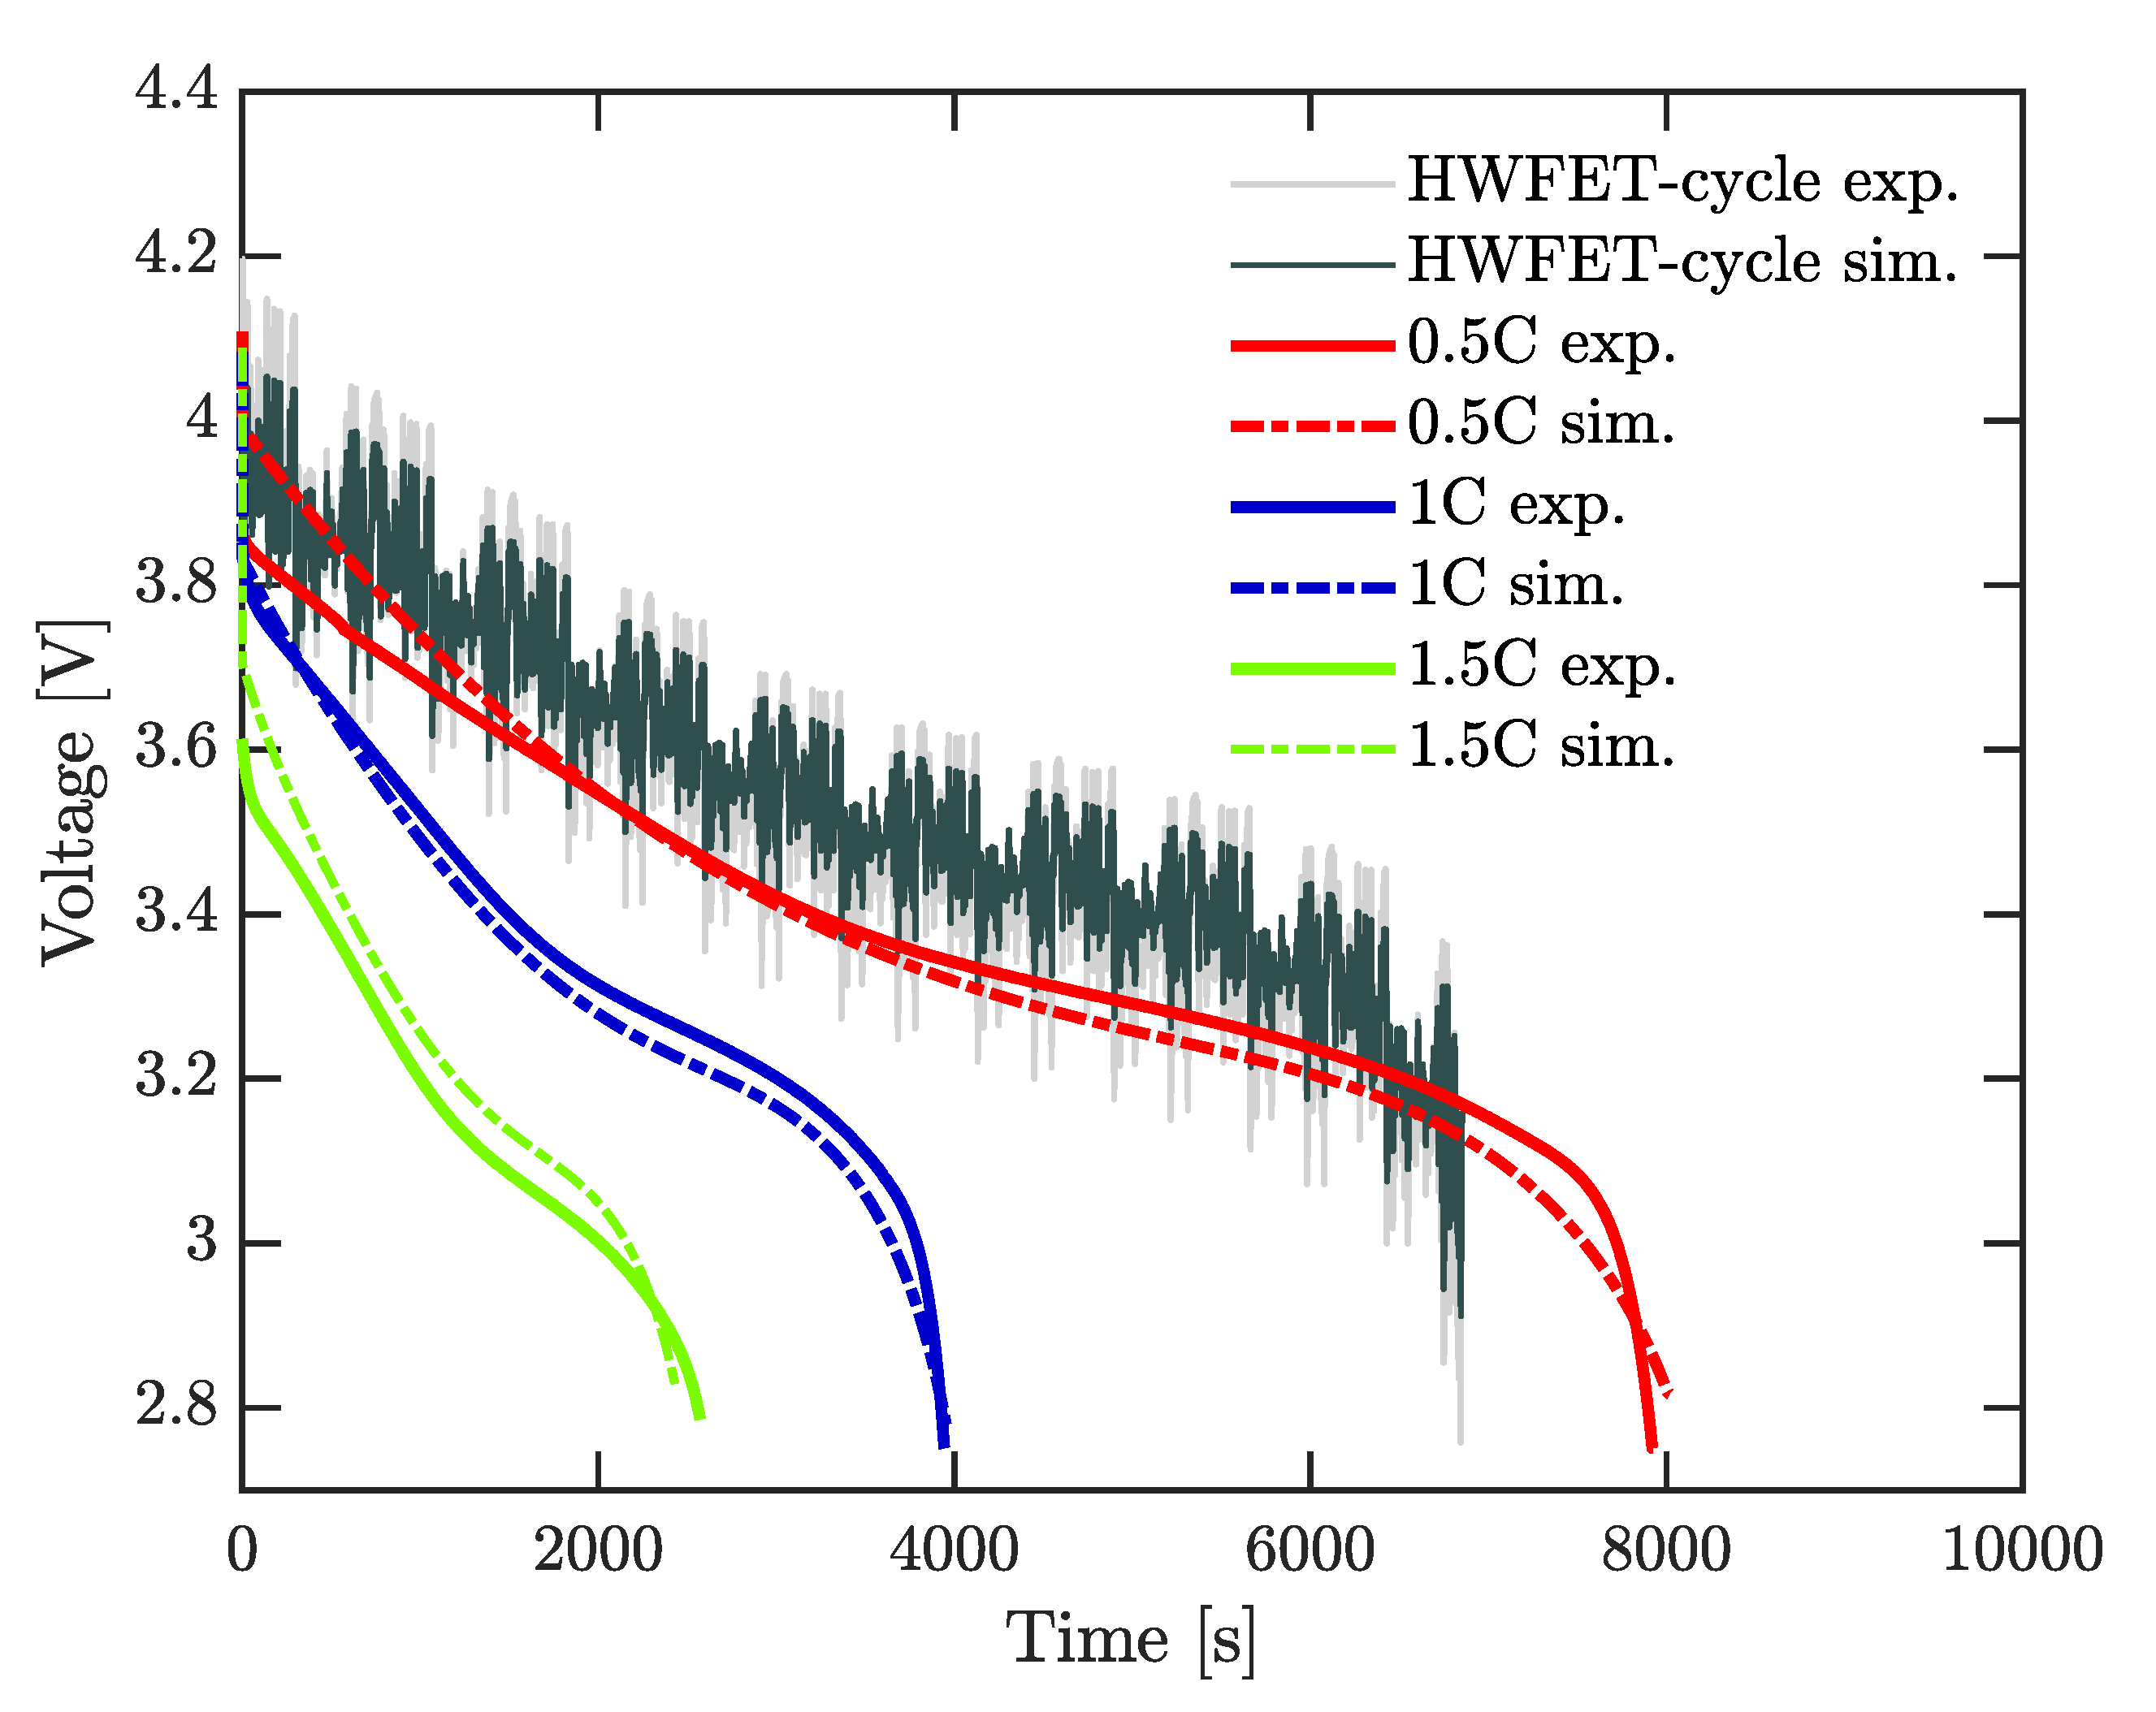
A 26650 lithium cobalt oxide (LCO) battery was used. Three of the most employed models to study the thermal behavior of LIBs were solved numerically: a lumped model, a 3D-CFD model, and an electrochemical approach using the NTGK model. Furthermore, voltage was simulated using NTGK formulation. All of these simulations were done at the same physical conditions of the experimental tests, at constant current discharge rate, and under the highway fuel economy test (HWFET) driving cycle. Moreover, a real driving-cycle of a Nissan Leaf was studied using the lumped model.
This article is organized as follows: Section 2 presents a theoretical framework on the methods for battery modeling utilized in this work. Section 3 describes the procedure to estimate thermal parameters and heat generation rate. Comparison among the models is provided in Section 4. Conclusions are given in Section 5.

2. Theoretical Background

2.1. Battery Geometry and Meshing

Some geometry considerations are necessary to take into account depending on the model applied. The lumped model is formulated without solving spacial temperatures, except for the cell surface, where the temperature is uniform. The battery geometry employed to solve the 3D-CFD model is a solid cylinder 65 mm length and 26 mm diameter. The cell geometry for the NTGK model has three components: anode (negative tab), cathode (positive tab), and jelly-roll, as shown in Figure 1a. A detail of the jelly-roll is provided in Figure 1b. Thermal resistance through the shell is considered negligible, then it is not modeled. Also, the thermal effect due to battery holder is not studied.
A mesh independence study was carried out to solve the 3D-CDF (Table 1), and NTGK model (Table 2), both modeled with a discharge current of 6 A. In each case, mesh 2 was selected taking into account that maximum temperature and total heat transfer rate do not vary when number of mesh elements is increased. In this way, a mesh with 45604 elements was selected for 3D-CFD model, and a mesh with 38777 elements was chosen for NTGK model.

2.2. Battery Modeling

This section exposes the thermal models solved in the present study.

2.2.1. 3D-CFD Model

The energy equation employed by CFD solver to model the battery as a solid is governed by [20]:
t ρ h e + · V ρ h e = · k T + S h ,
where ρ is the density, h e = c p d T is the sensible enthalpy, c p is the specific heat, k is the thermal conductivity, T is the temperature, S h is the volumetric source term, and the velocity V is obtained from the motion of the fluid. In the present study, instead of solving flow equations, an experimental heat transfer coefficient was utilized.

2.2.2. Thermal Lumped Model

Energy balance for a single cell also can be written as:
C p T t = Q c o n v + Q r a d + Q g e n ,
where C p is heat capacity, Q g e n is the heat generation (source term), and heat exchange rate is transferred by convection Q c o n v and radiation Q r a d .
This work employs a thermal lumped model proposed by Forgez et al. [3], which simplifies Equation (2) into Equation (3):
d T s d t = T a m b T s C p R i n + R o u t + Q g e n R o u t C p R i n + R o u t ,
where T s , and T a m b are the surface temperature of the battery, and ambient temperature, respectively. The heat capacity, conduction resistance in the inner of the cell R i n , and external resistance R o u t between the surface of the cell and surrounding fluid; can be determined via parameter identification such as References [1,28]. An equivalent thermal circuit is illustrated in Figure 2, where Q g e n is represented as a source of current, and C p allows to store energy as a capacitor. Internal cell temperature T i n could be compute as well.

2.2.3. Heat Transfer

The heat transfer rate by convection, and radiation are defined as:
Q c o n v = A s u r f , c h c o n v T s T a m b
Q r a d = A s u r f , c ϵ σ T s 4 T s u r 4 ,
where A s u r f , c is the surface area of the cell, h c o n v is the convection heat transfer coefficient, ϵ is the emissivity of the cell surface, σ = 5 . 67 × 10 8 Wm 2 K 4 is the Steffan-Boltzmann constant, and T s u r is the surrounding temperature for radiative heat transfer.
Considering that T a m b = T s u r , total heat transfer rate Q h t = Q c o n v + Q r a d can be expressed in terms of a combined heat transfer coefficient h c o m b as follows [29]:
Q h t = h c o m b A s u r f , c T s T a m b
h c o m b = h c o n v + h r a d
h r a d = ϵ σ ( T s 2 + T a m b 2 ) ( T s + T a m b ) .
Then, the following expression for R o u t in Equation (3) can be written:
R o u t = 1 h c o m b A s u r f , c .
Convection coefficient h c o n v is governed by:
h c o n v = Nu D · k f d ,
where k f is the thermal conductivity of the fluid, d is the battery diameter, and Nu D is Nusselt number computed through Equation (11), formulated by Morgan for free convection from a horizontal cylinder [29]:
Nu D = C N u · R a D n ,
where C N u and n are constants according to the Rayleigh number R a D .

2.2.4. Heat Generation

Bernardi et al. [30] developed the following expression to compute the heat generation inside a battery:
Q g e n = I V O C V I T d V O C d T = I 2 R T I T d V O C d T ,
where the current I is positive for discharging and negative for charging. Both open circuit potential ( V O C ) and the total internal resistance of the battery R T depend on the state-of-charge (SOC) and temperature of the cell. The term I V O C V of Equation (12) represents the heating due to the Joule effect (irreversible heat generation). The second term is the entropy change (reversible heat generation), attributed to electrochemical reactions [15]. Besides, phase change effect, mixing effect, and simultaneous reactions are neglected in the Bernardi’s formulation.
In the present approach, the battery state-of-charge (SOC) is estimated by ampere-hour integration or Coulomb counting method [11]:
S O C = S O C t = 0 1 C N I ( t ) d t ,
where S O C t = 0 = 1 (when the battery is 100% charged), and C N is the nominal capacity of the cell.
Regarding the total internal resistance of a cell, the most common method to determine its value is the hybrid pulse power characterization (HPPC) test [31,32]; nonetheless, electrochemical impedance spectroscopy (EIS) can help to characterize the internal impedance of the battery, and evaluate individually all components of total resistance [33].

2.2.5. Electrochemical Impedance Spectroscopy (EIS)

EIS is a non-destructive method based on frequency analysis, which helps to characterize the internal impedance of cells at specific SOC values. A small amplitude signal, either voltage (potentiostatic) or current (galvanostatic), is applied to the battery during the test trying to minimize disturbances on the actual battery SOC. The collected data allows to identify a model for the battery, capturing the electrical dynamic response in terms of an ECM such as a lumped-parameter Thévenin Equivalent Circuit [34].
Results of EIS test are normally presented through a Nyquist plot as shown in Figure 3. Pure ohmic resistance R o is the value at the interception of the curve and the horizontal axis. The real part of the impedance at local minimum point A corresponds to the total resistance quantified from methods such as HPPC test [33,35]. Hence, the total internal resistance of the battery is considered as the sum of ohmic resistance and charge transfer resistance R C T .

2.2.6. Ntgk Model

The NTGK model based on dual potential MSMD framework computes the thermal and electric field of the battery as follows [20]:
ρ C p T t · k c T = σ p o s ϕ p o s 2 + σ n e g ϕ n e g 2 + q ech
· σ p o s ϕ p o s = j · σ n e g ϕ n e g = j ,
where σ is the electric conductivity, ϕ is the electric potential, and subscripts p o s and n e g refer to positive and negative electrode, respectively.
The volumetric current transfer rate j is formulated as [37]:
j = C N C r e f V o l Y U ϕ p o s ϕ n e g ,
where V o l is the volume of active zone, C r e f is the capacity of the battery used to obtain the parameters of the functions U and Y (Table 3), which are determined by the Parameter Estimation Tool in Fluent by using discharging experiments. Based on the deep-of-discharge (DoD), these functions are computed as follow [37]:
U = n = 0 5 a n D o D n C 2 T T r e f Y = n = 0 5 b n D o D n exp C 1 1 T 1 T r e f ,
where C 1 and C 2 are constants for a specific battery, and T r e f is the reference temperature.
The heat due to electrochemical reactions q ech is written as [20]:
q ech = j U ϕ p o s ϕ n e g T d U d T ,
where the firs term represents the overpotential heat, and the second term is the entropic component. Properties of the materials for NTGK model are detailed in Table 4.

3. Materials and Methods

The contributions in this paper are as follows—firstly, to characterize the heat transfer coefficients of a battery under free convection including thermal radiation effects; secondly, to estimate the parameters; and thirdly, to compare the main approaches used for thermal modeling of a LIB with experimental validation at constant and variable current rates. Besides, heat generation and voltage are solved.
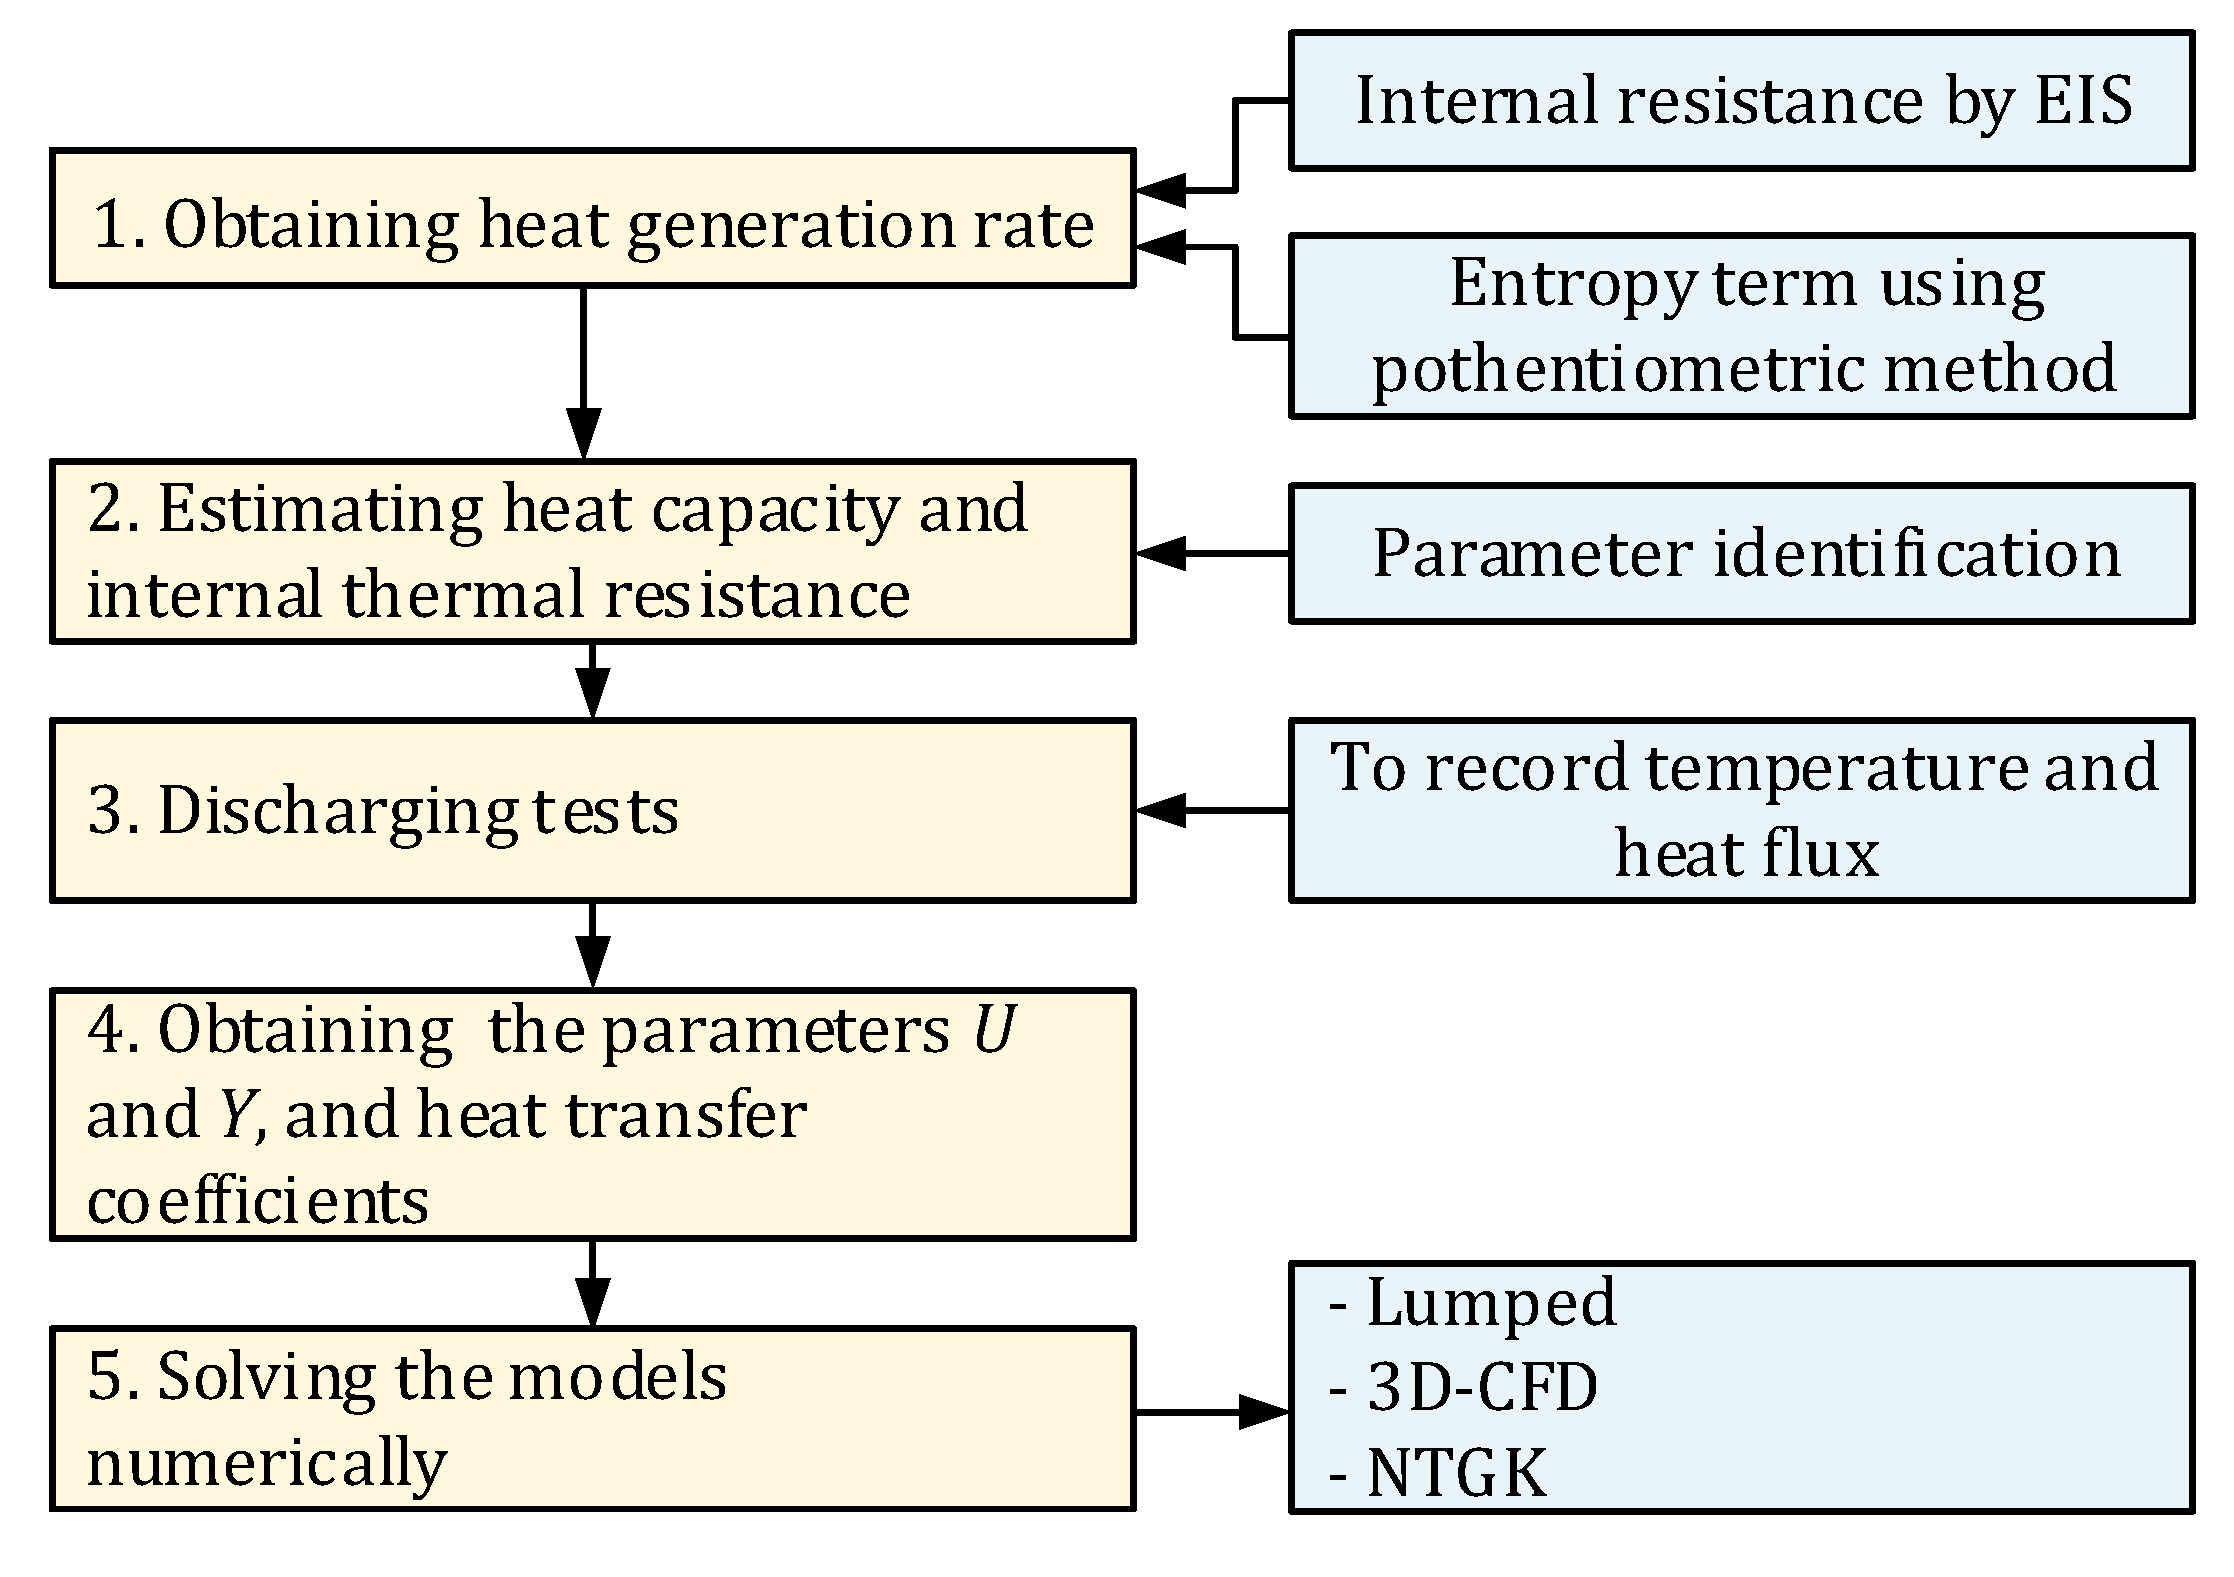
Figure 4 depicts the general procedure to develop the present study. The first step is to obtain the heat generation rate of the battery by estimating the internal resistance R T using EIS, and the entropic coefficient applying the potentiometric method. Next stage is to estimate heat capacity and internal thermal resistance of the cell R i n via parameter identification. Next step is to perform battery discharging tests while ambient temperature, cell surface temperature, and heat flux from the LIB are recorded. Discharging tests allow to obtain U and Y functions using parameter estimation tool in Fluent. Finally, the models are numerically solved using MATLAB for lumped model, and ANSYS Fluent 19.2 based on finite volume method, for both 3D-CFD and NTGK models.

3.1. Experimental Set-Up

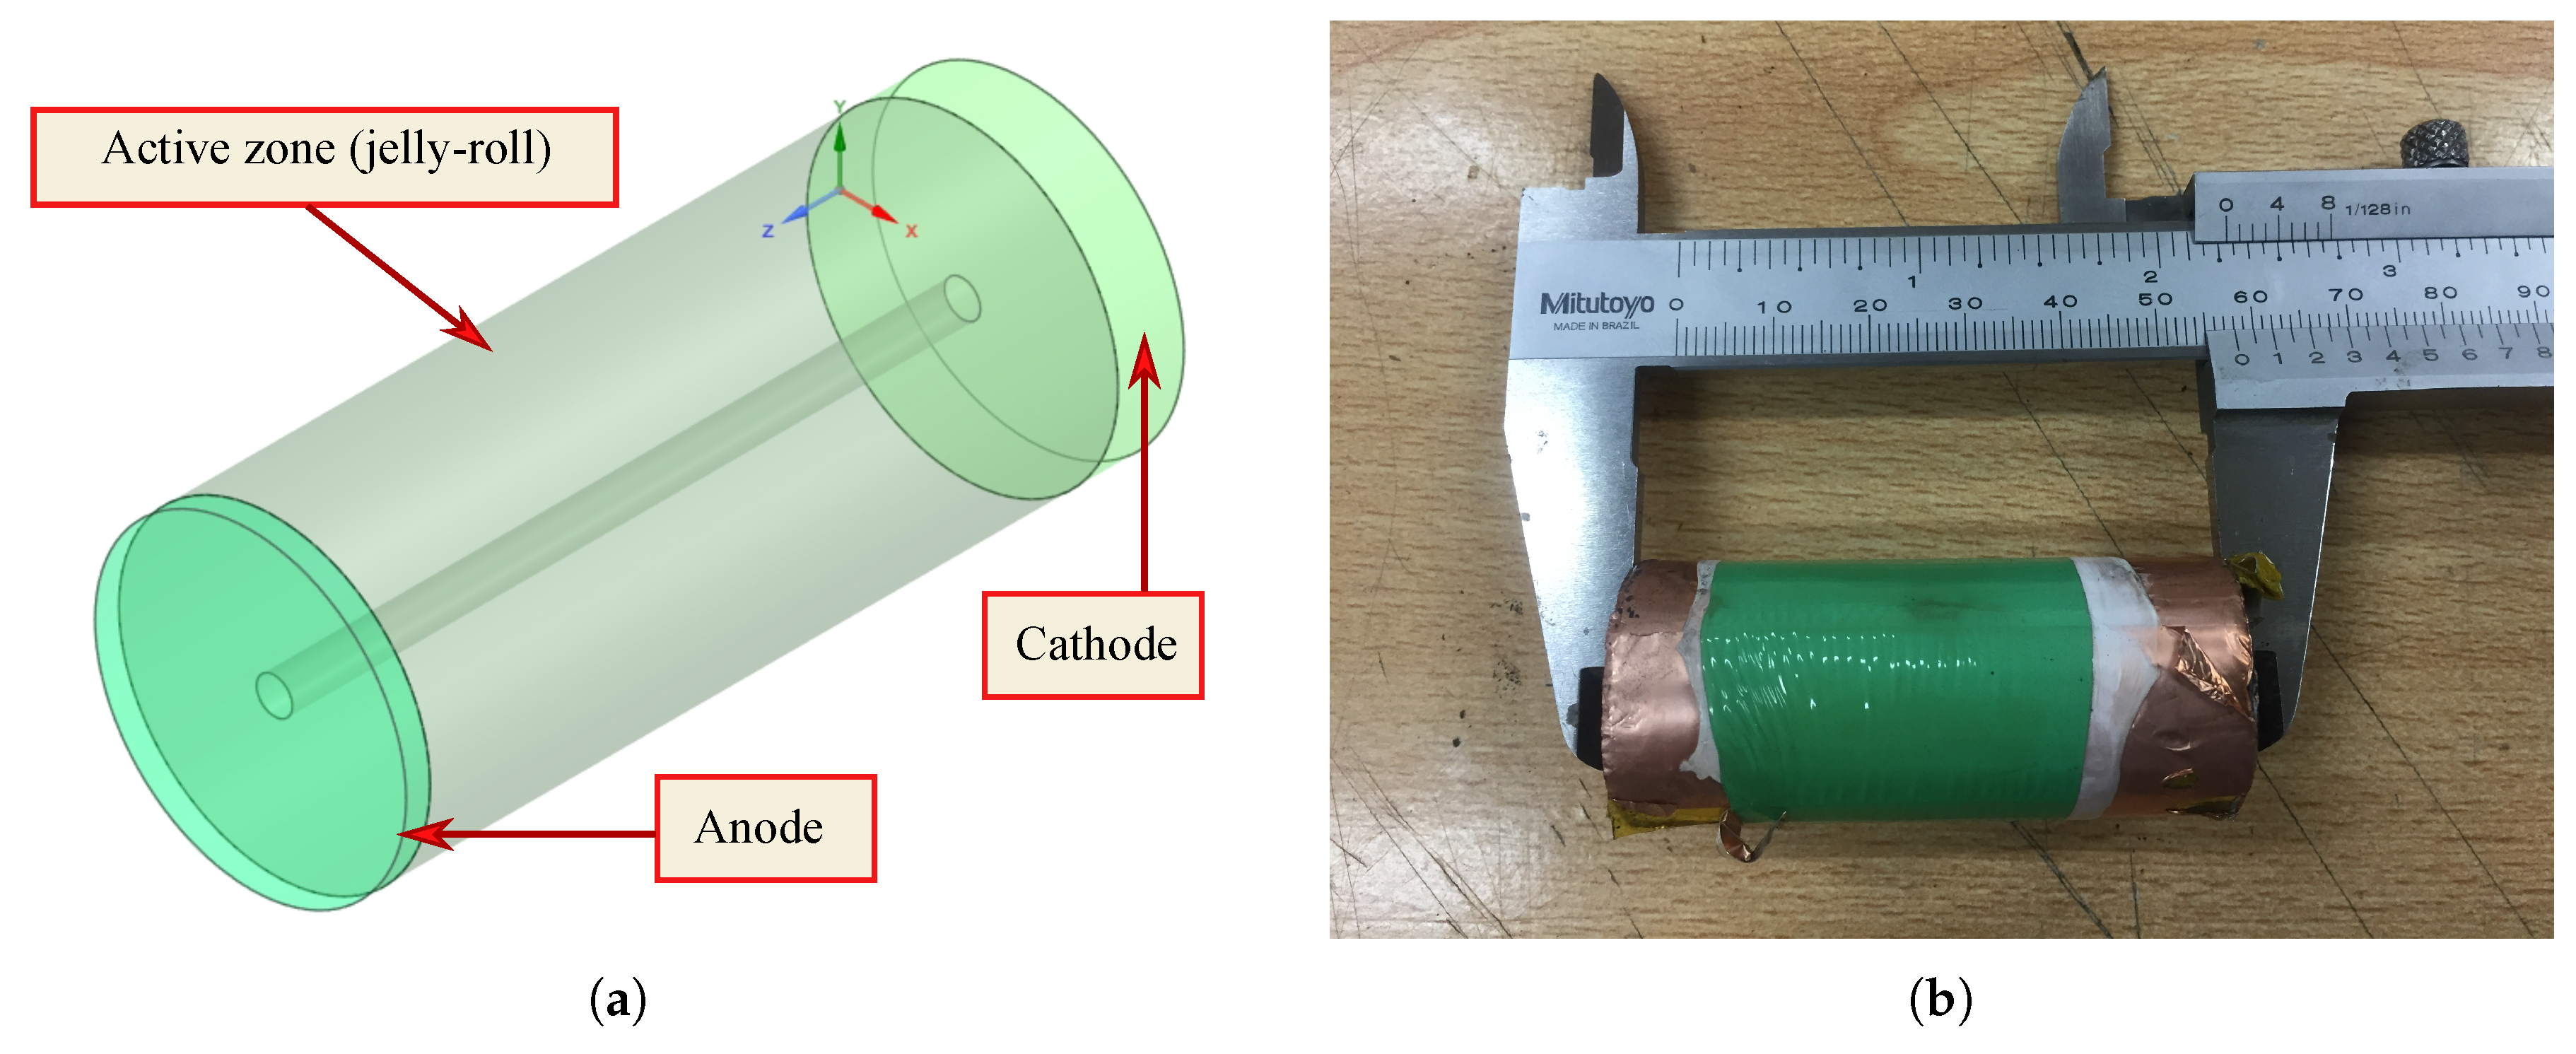
An ICR 26650 battery (see specifications in 
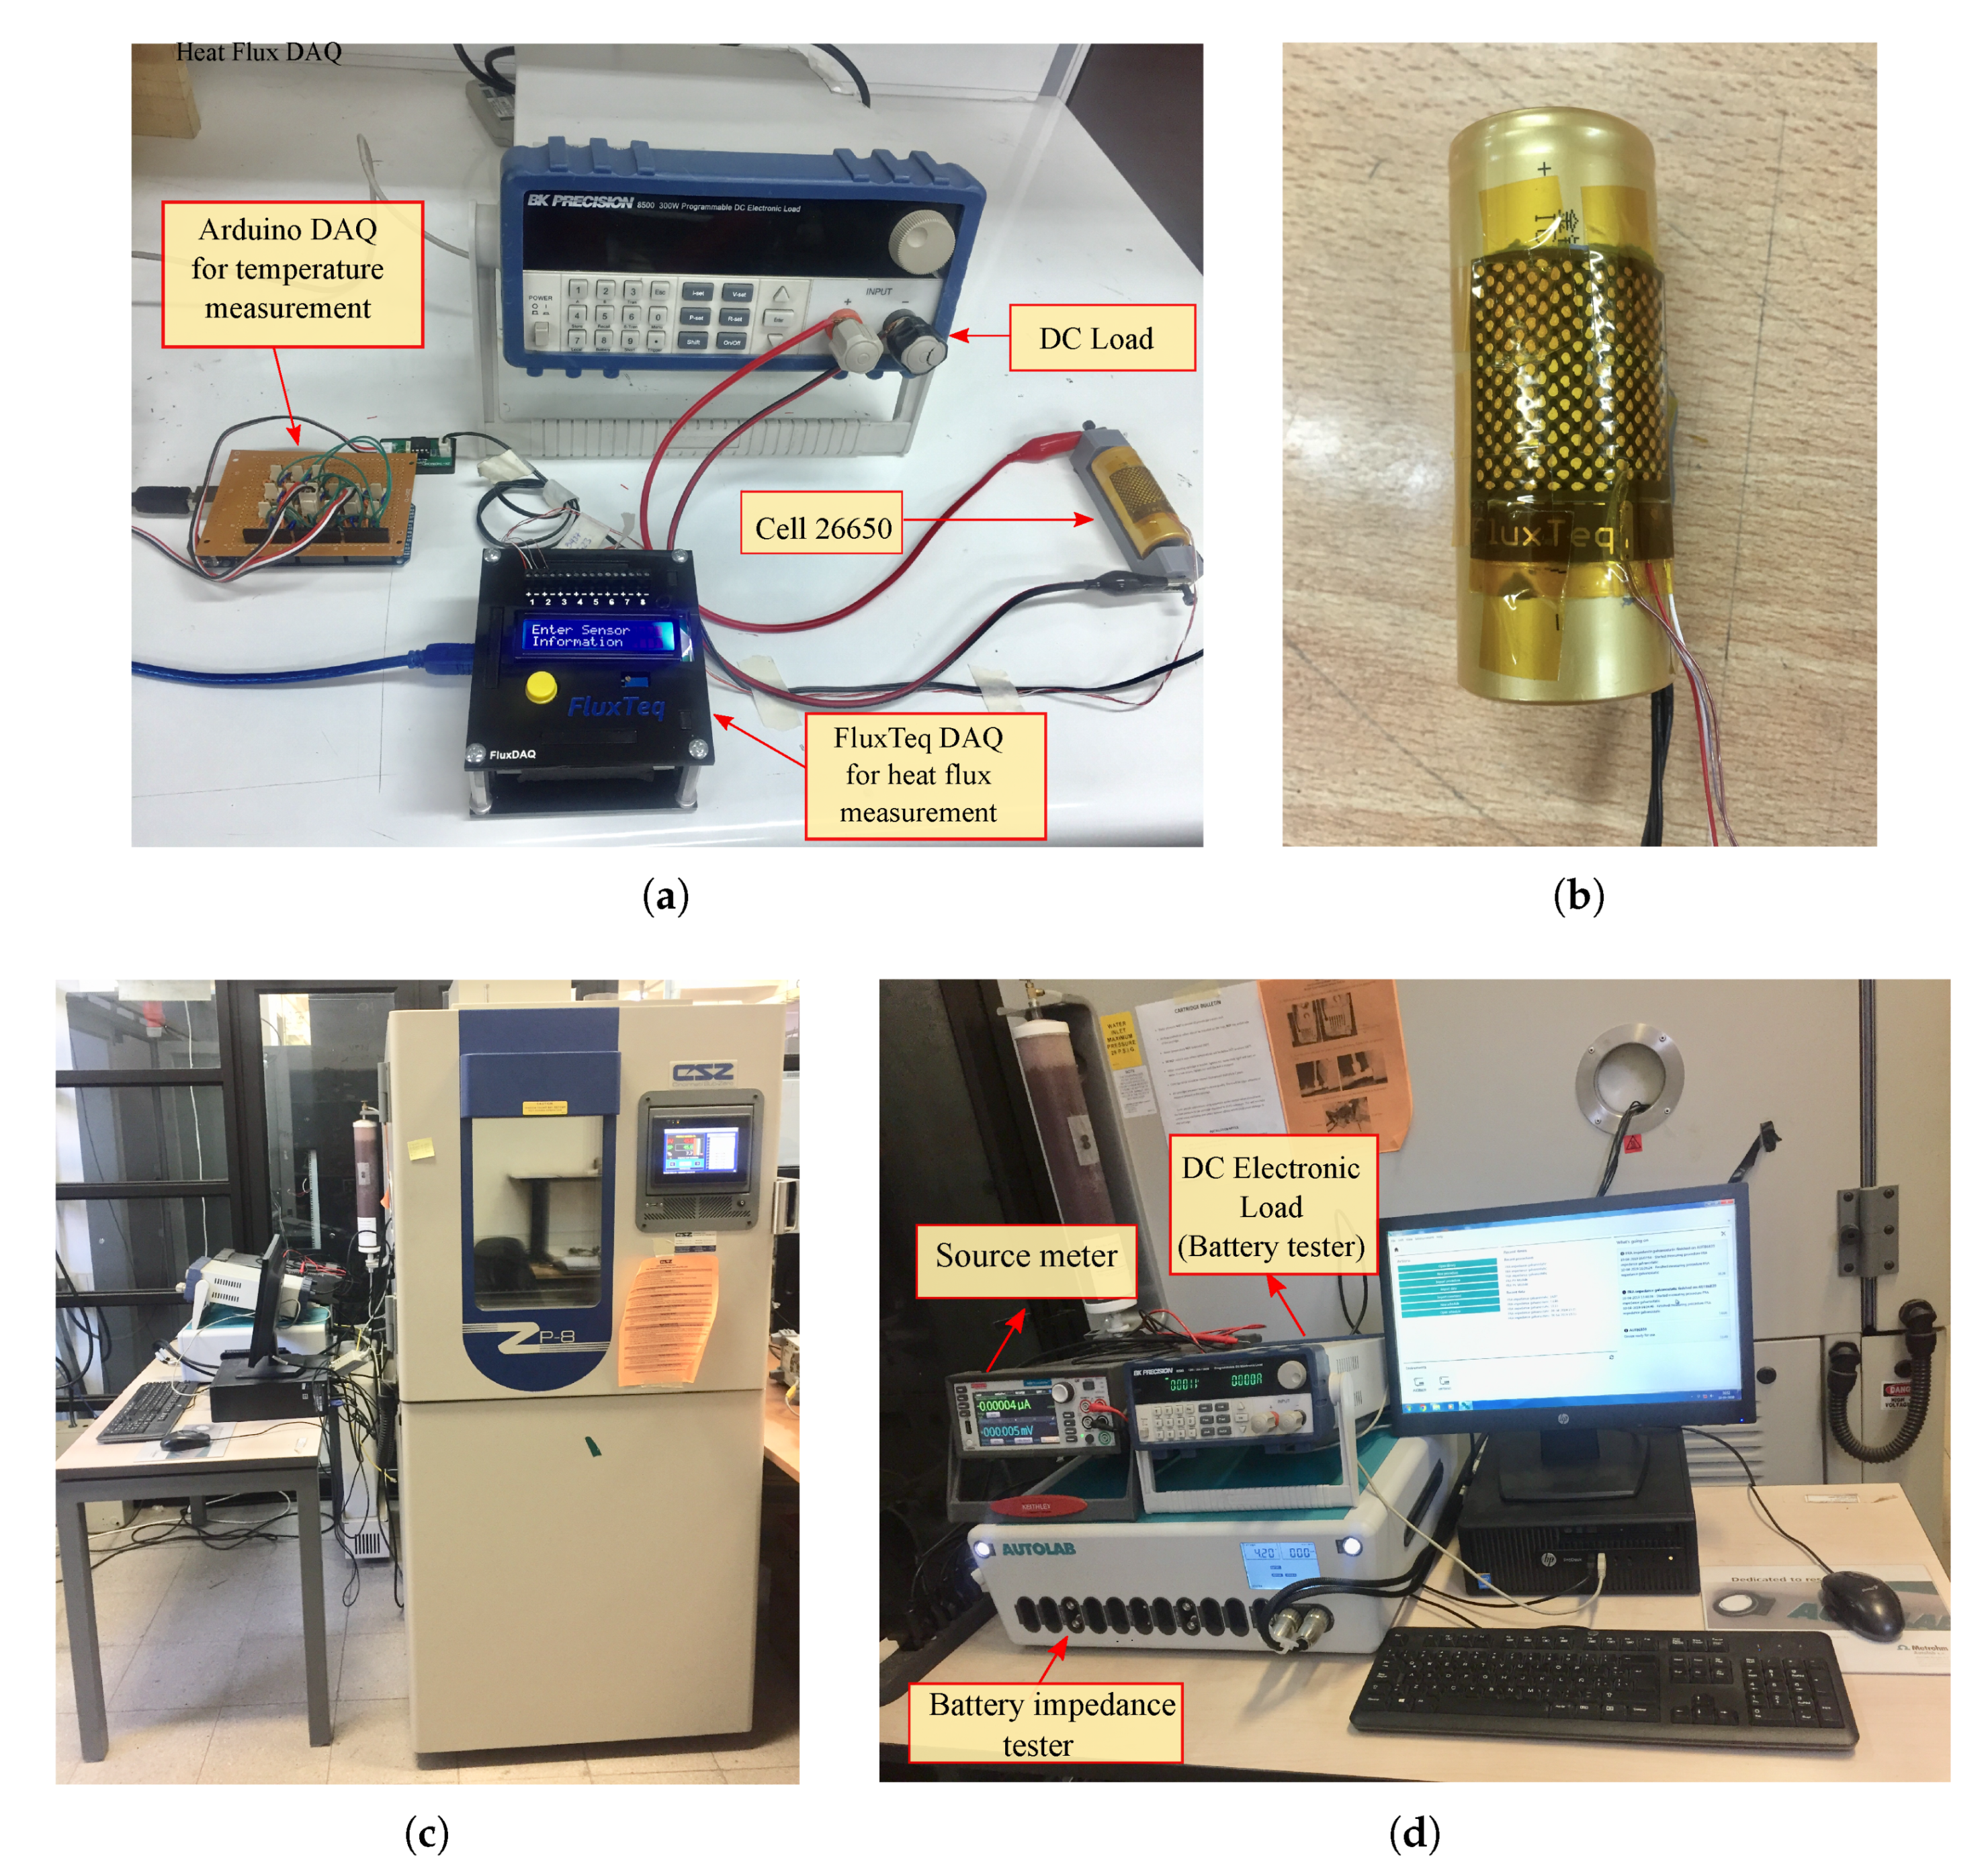
Table 5) was fully charged following the constant-current constant-voltage (CC-CV) protocol using a battery charger (iCharger 208B). The first stage (constant-current) was at 2 A, then the charger turns to constant voltage. Subsequently, the battery was discharged using a BK Precision 8500 programmable DC load (Figure 5a). Current rates applied were 2 A (0.5C), 4 A (1C), 6 A (1.5C), and also a variable current profile. This last profile was obtained by ADVISOR software selecting a highway HWFET-driving cycle as velocity input for an electric vehicle. The simulated current was scaled at a maximum of 5.5 A, as shown in Figure 6, and this cycle was repeatedly applied to the cell until the energy extracted was 4 Ah. Regeneration current was not considered.
All discharging tests were repeated five times to ensure repeatability measurements. Ambient temperature and cell temperature were recorded through a negative temperature coefficient (NTC) thermistor (ZX-Thermometer) connected to an Arduino processor board. This sensor operates between 20 C and 85 C with an uncertainty of ± 0.5 C . It requires a direct-current supply voltage between +1.8 V and +5.0 V. A code was developed using MATLAB software to convert voltage input (from Arduino board) into temperature. Since ambient temperature fluctuations were less than 1 C during all tests, this value was assumed to be constant. Heat flux from the cell was measured by a PHFS-01 FluxTeq heat flux sensor (Figure 5b) connected to a FluxTeq DAQ (see Figure 5a). Measurements of heat flux are plotted in Figure 7.

3.2. Heat Generation Estimation

Heat generation in the cell was computed from Equation (12) that includes internal resistance and entropy change.

3.2.1. Experiment for Internal Resistance

Electrochemical impedance spectroscopy (EIS) was carried out to estimate the internal resistance of the battery. First, the fully charged battery was placed in a thermal chamber EZT-570i (see Figure 5c) at 15 C . After 2 h of rest, galvanostatic EIS was conducted by using an impedance tester equipment PGSTAT302N (see Figure 5d). Details of the setup are listed in Table 6. This process was repeated at 25 C , 35 C , and 45 C . After performing the experiment at 45 C , the battery was discharged at 90% SOC and overnighted. The whole process was repeated until the cell was completely discharged (0% SOC), decreasing the battery SOC in intervals of 10% between each of the EIS tests.
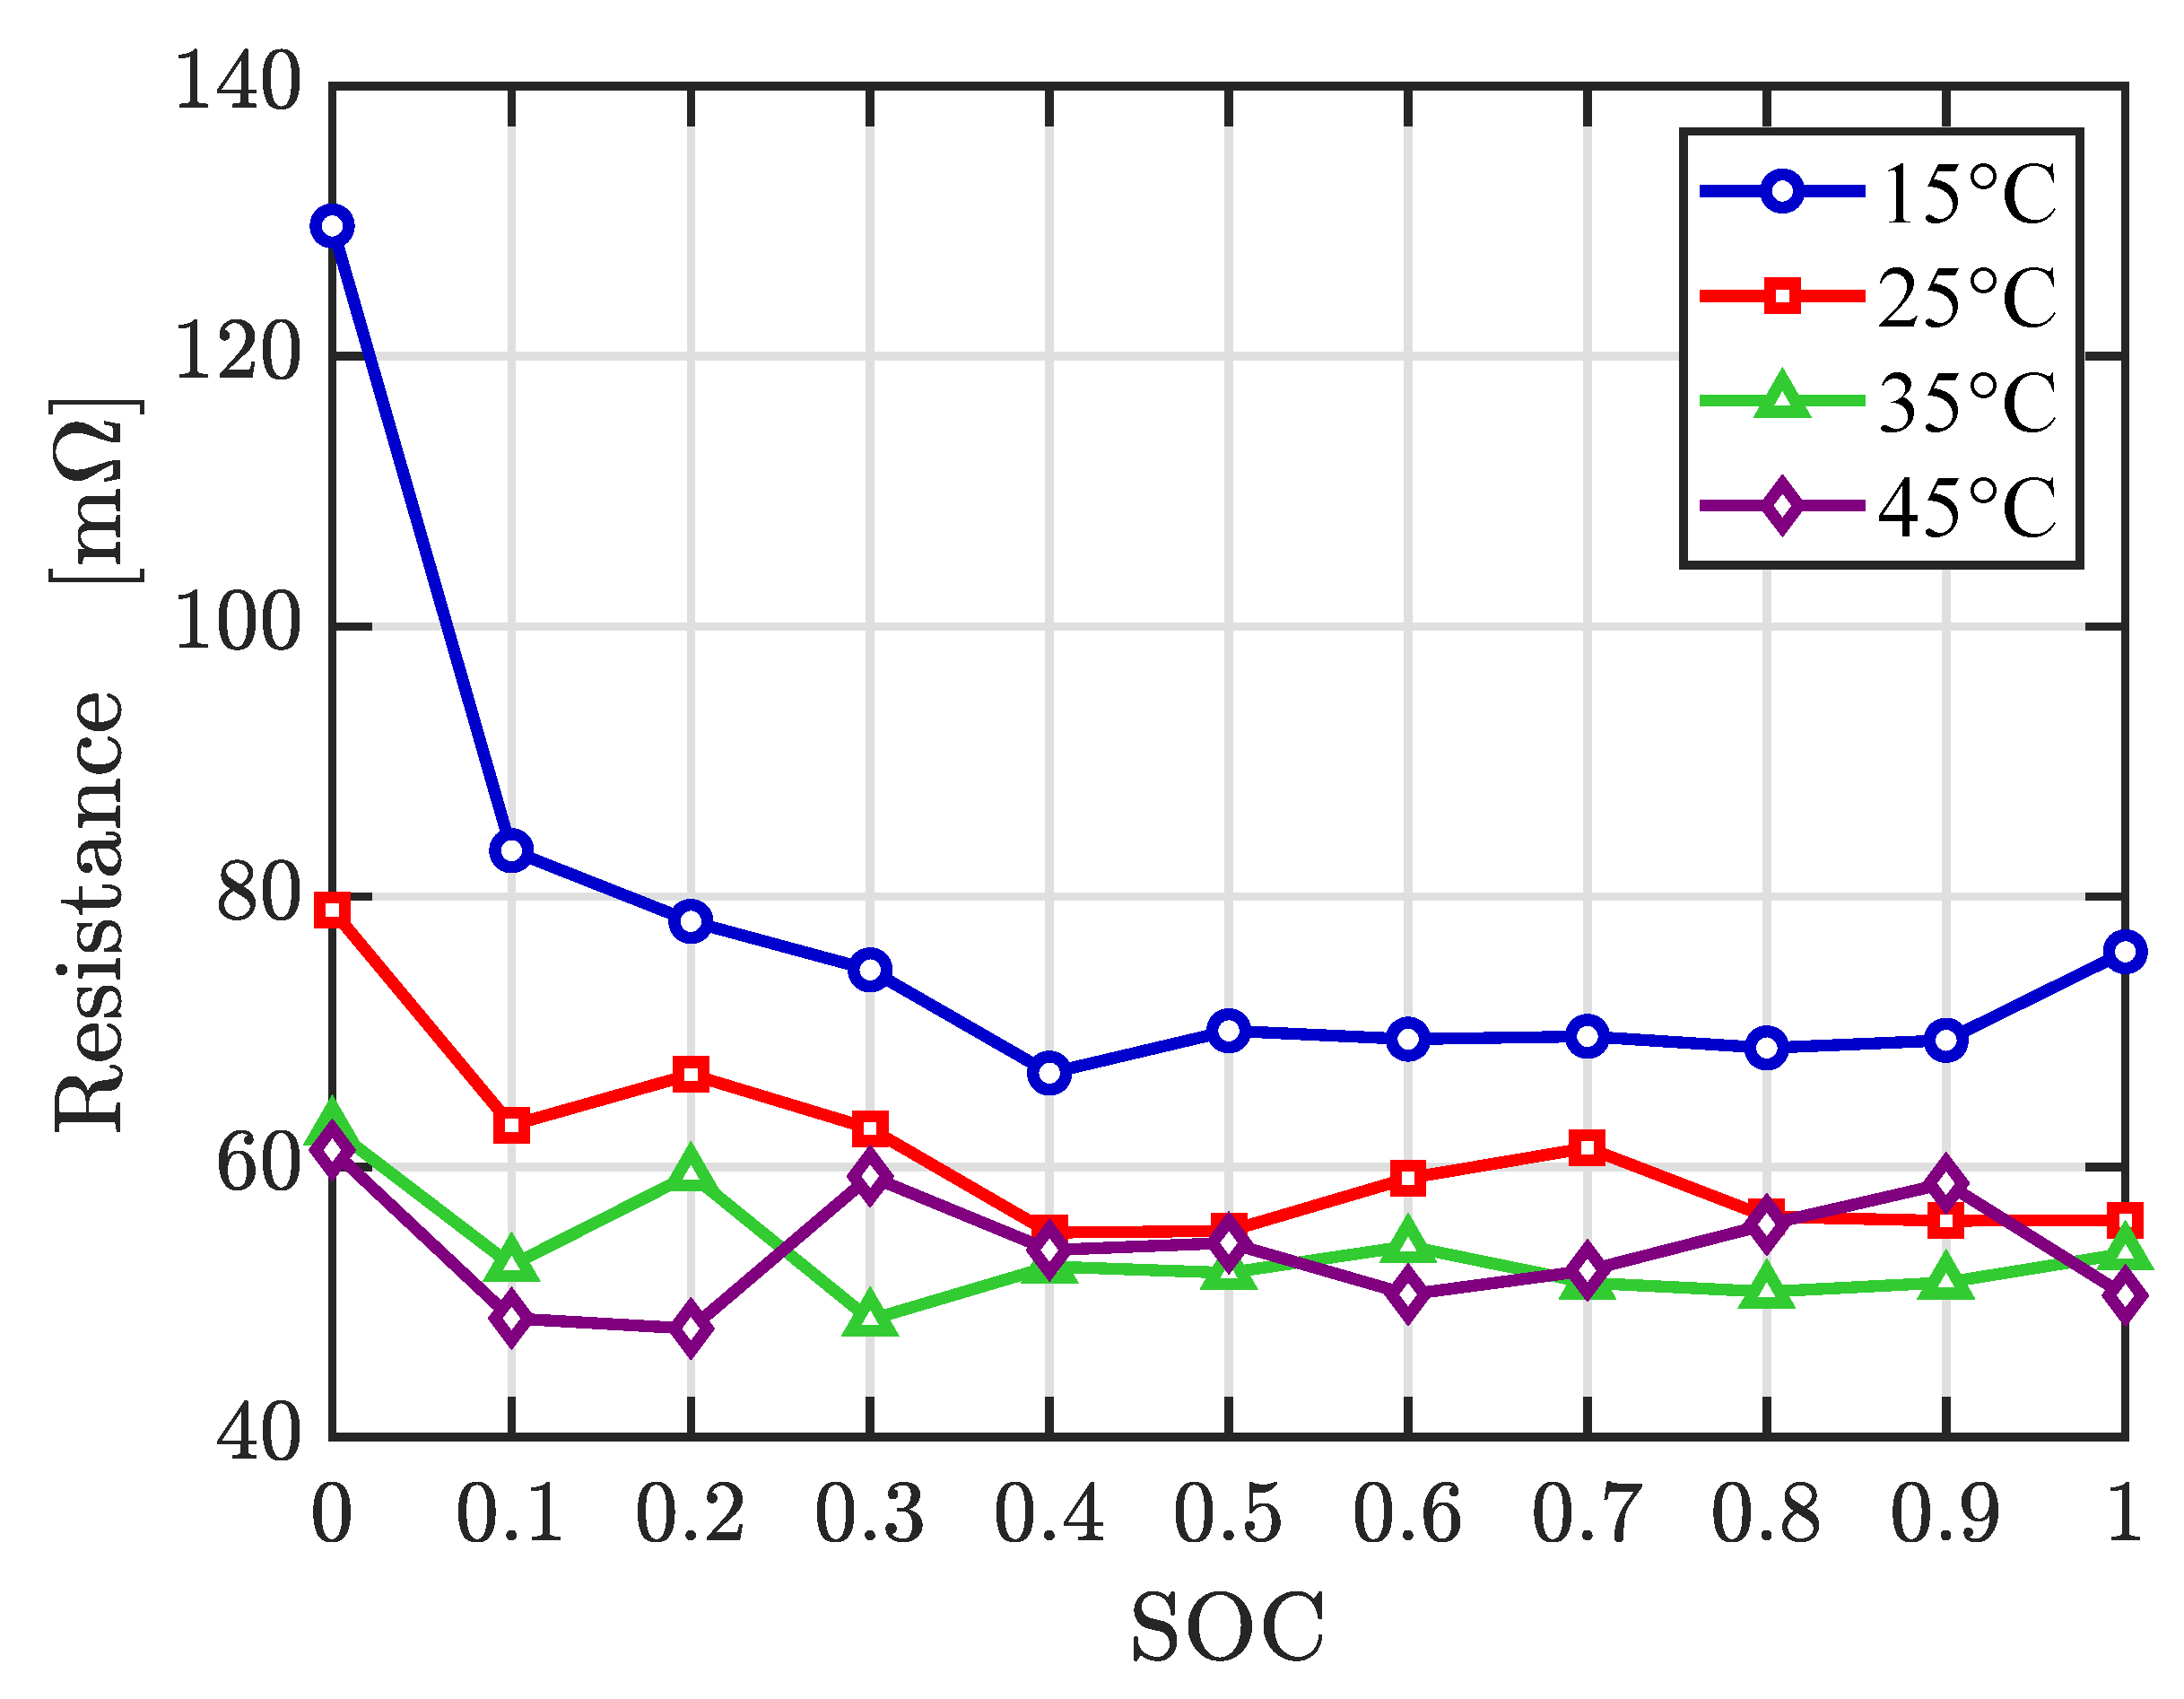
The experimental characterization of the battery internal resistance at different temperatures, obtained from EIS tests, is depicted in Figure 8. It reveals that at lower temperature, and near to 0% of SOC, the cell resistance increases. At 35 C and 45 C , the resistance has practically the same value.
Average battery resistance for each discharging rate test is detailed in Table 7. It is evident that at lower discharge rates, the resistance increases. Each value represents R T in Equation (12), that is, it allows to compute the irreversible heating.

3.2.2. Entropy Coefficient Experiment

Entropy change term is expressed as a relationship between open circuit voltage and cell temperature, and was obtained by applying the potentiometric method: the battery 100% charged was put into a thermal chamber at 15 C . After it rested for two hours to reach thermal equilibrium [15], and the voltage was measured by using a KEITHLEY 2460 sourcemeter. In order to obtain the relationship d V O C / d T , the same process was performed progressively at 25, 35, and 45 C , respectively. Next, the cell was discharged at 90% SOC and overnighted. The whole test described before was repeated with intervals of 10% of SOC until the charge of the battery drops to 0% of SOC [39].
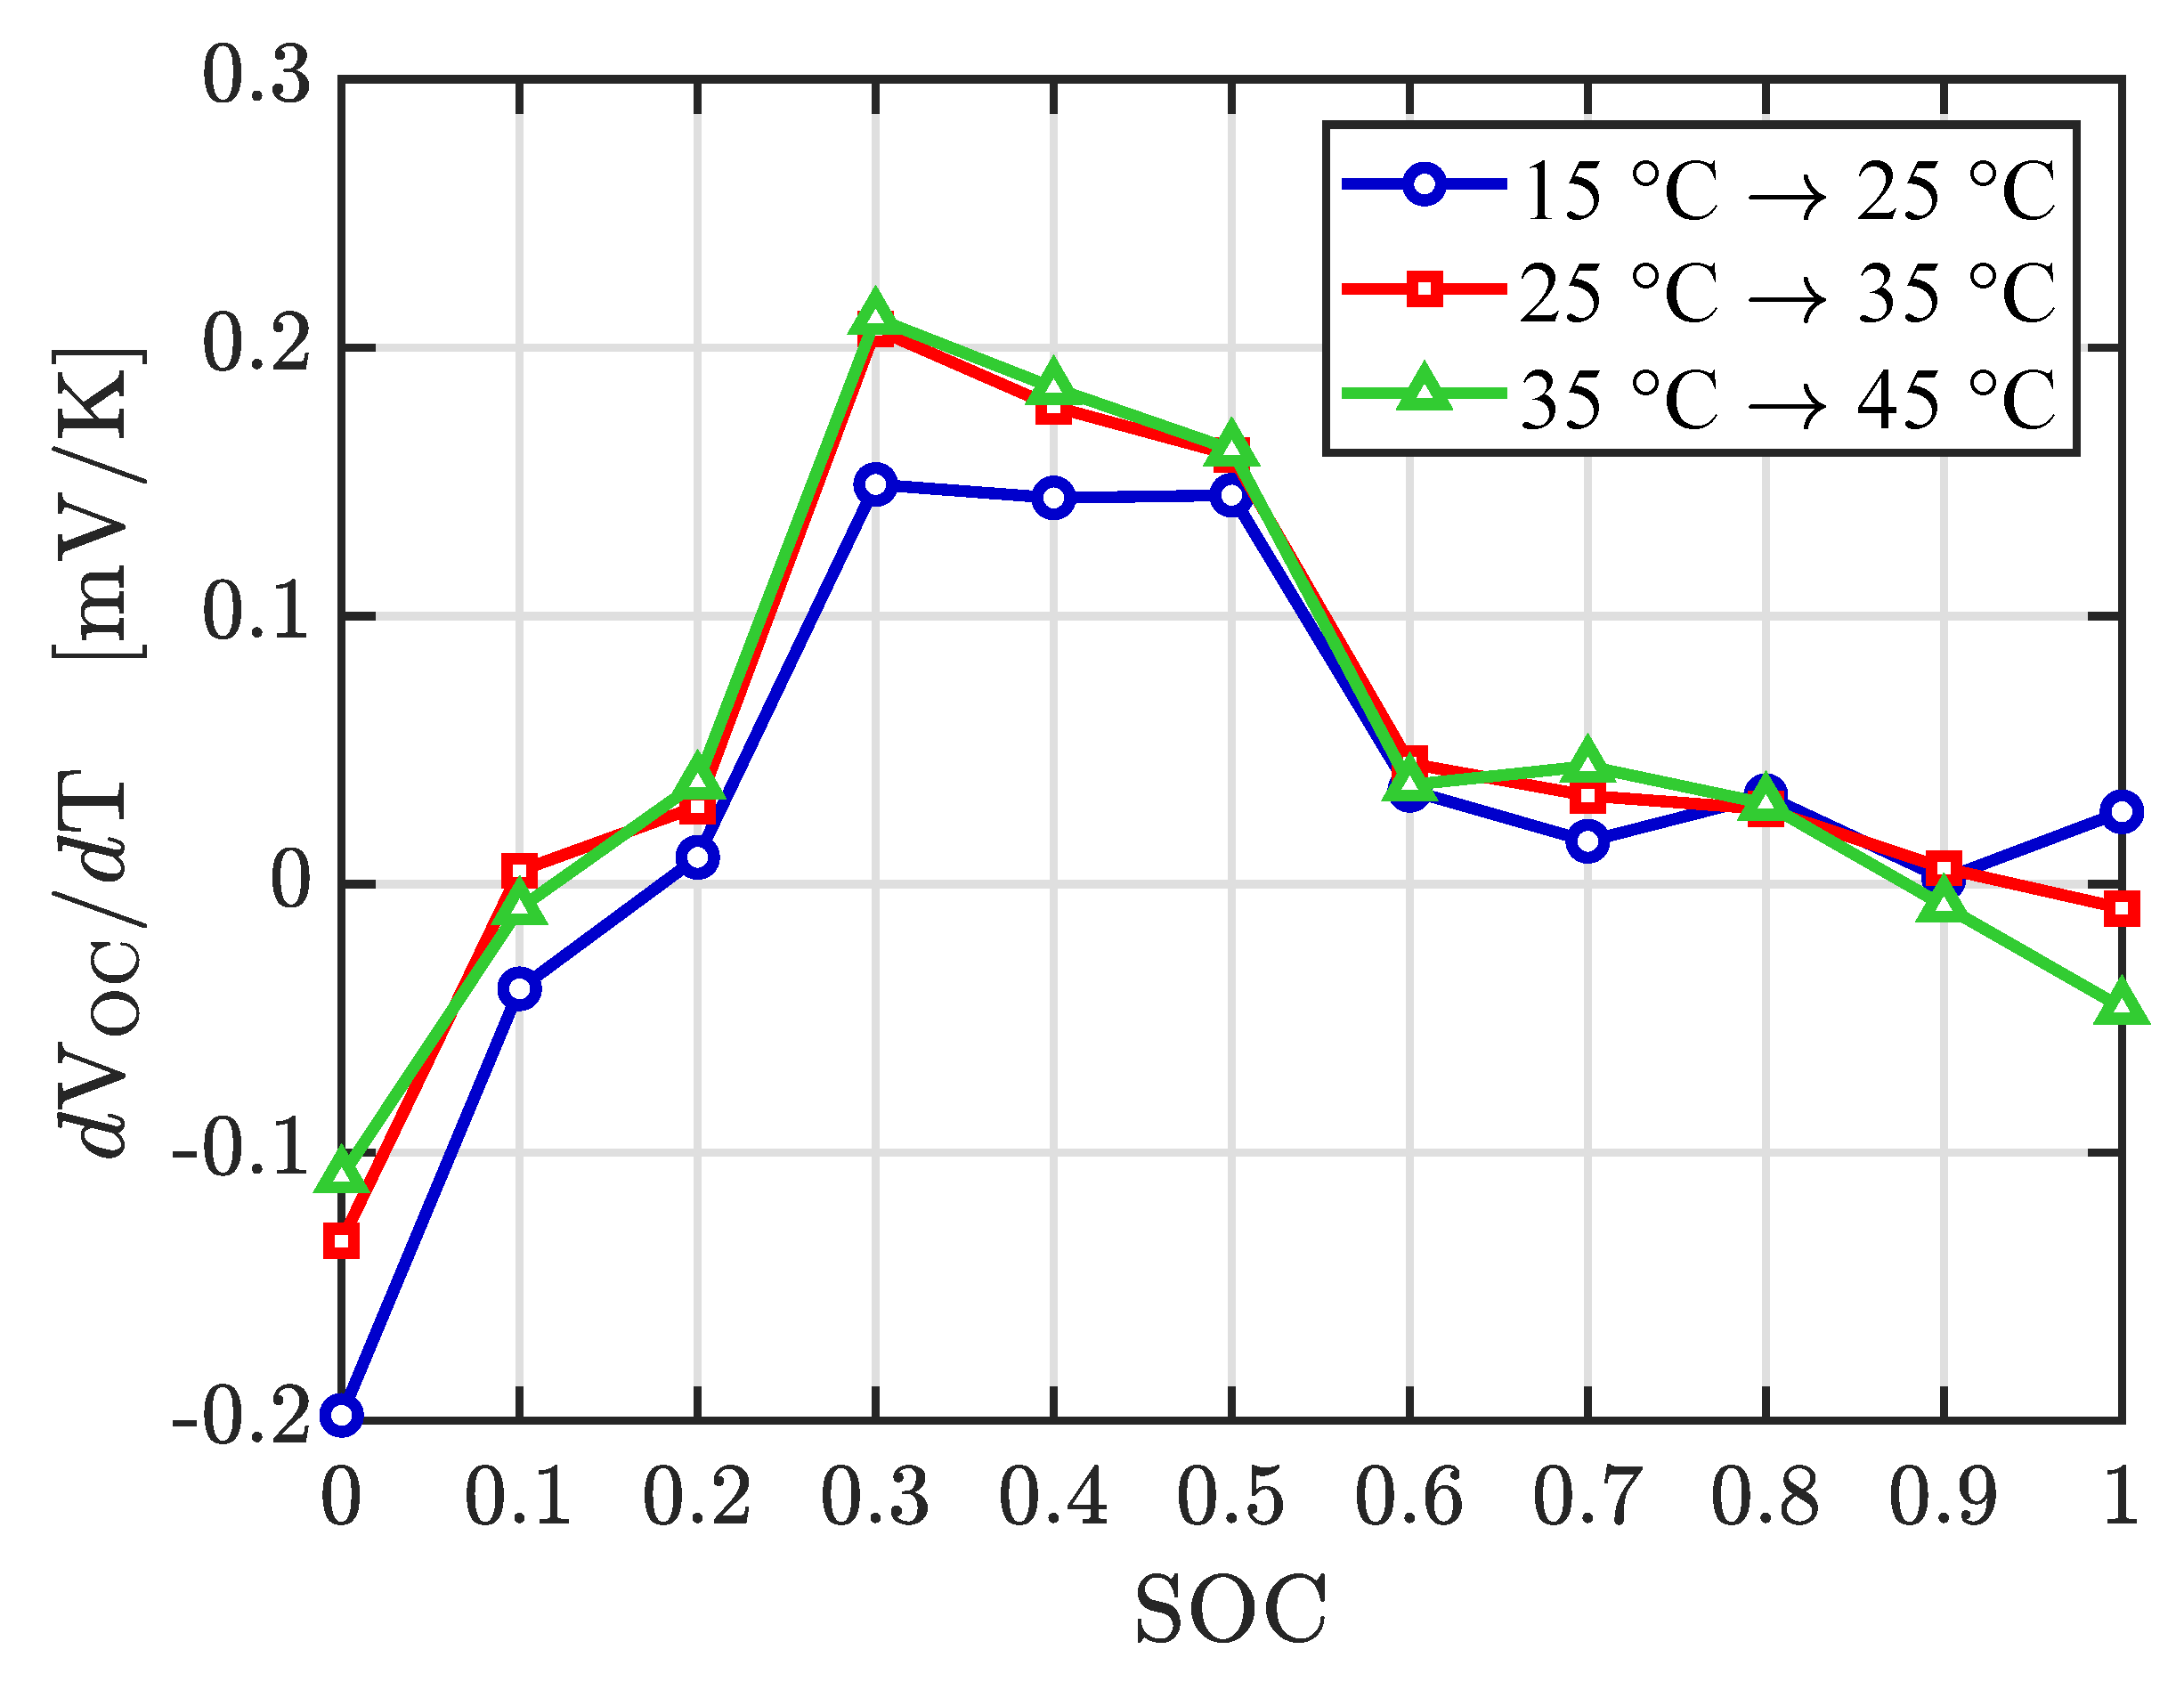
Experimental values for the entropy term are presented in Figure 9. There does not exist a significant variation of entropy change at the different temperatures. In the interval of 20% to 80%, the entropy change is positive with a maximum value near to 0.2 mV/K. A similar entropy profile was reported by Zhang et al. [40].

3.3. Heat Capacity and Internal Thermal Resistance

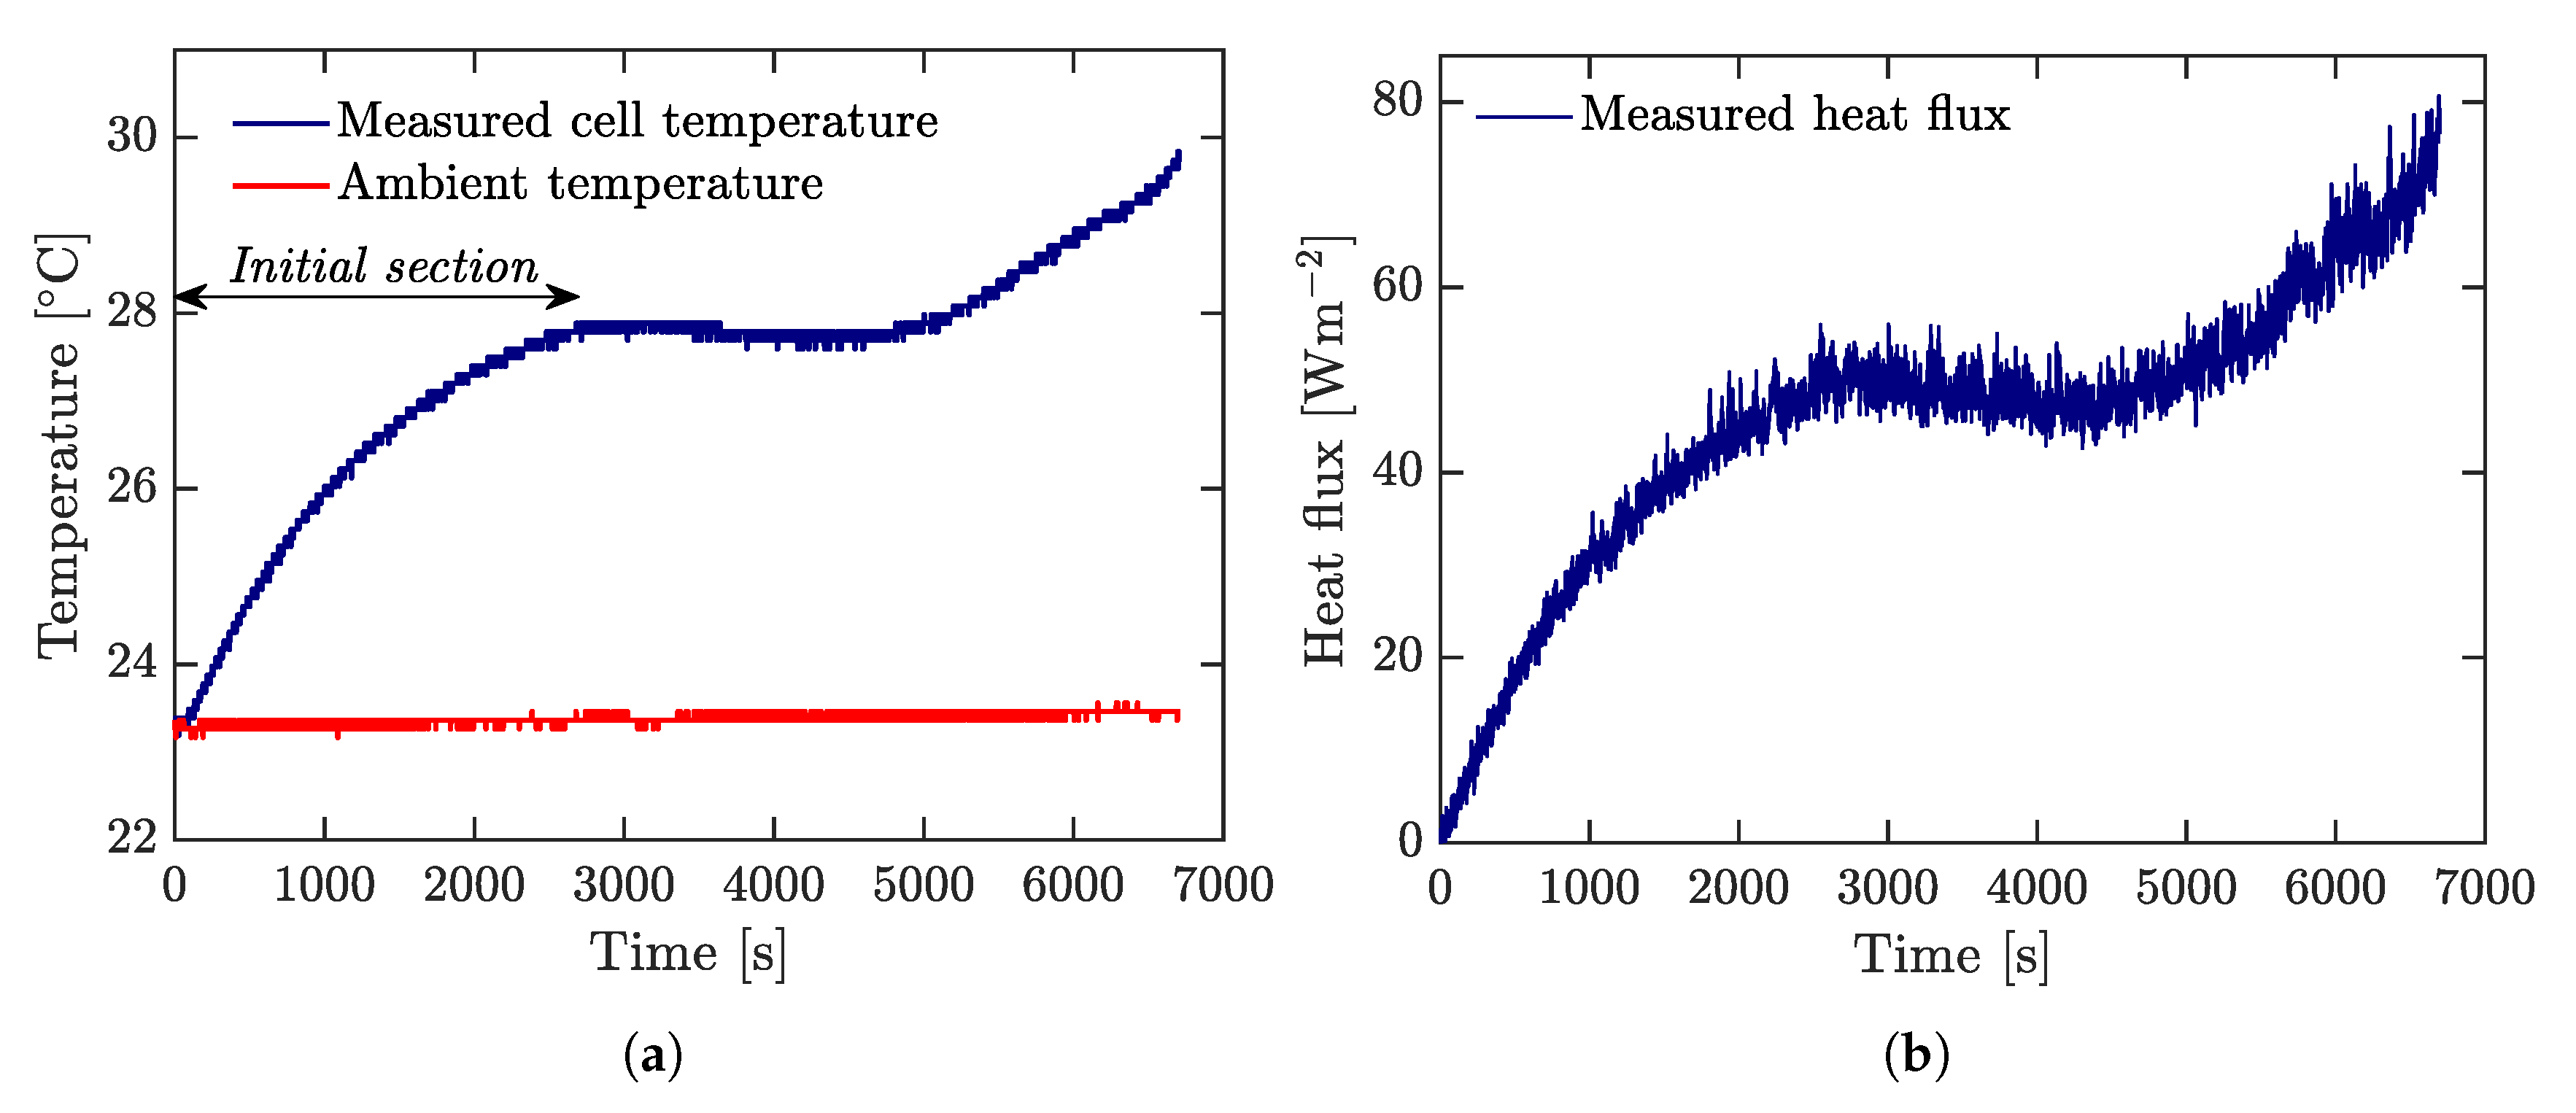
To estimate heat capacity and internal thermal resistance, a consecutive current pulse of 0.4 A, 2 A, 4 A, and 3 A, each one of them with a duration of 10 s, was continuously applied until the battery was discharged. Ambient and battery temperatures, and heat flux were recorded as depicted in Figure 10a, and Figure 10b, respectively. These measurements allow to compute h c o m b by least squares regression from Equation (6), and then, R o u t from Equation (9). After obtaining h c o m b , it is possible to figure out an experimental h c o n v from Equation (7).
Following a similar procedure proposed by Bryden et al. [1], the next stage was to estimate C p and R i n from Equation (3) by fitting the initial section of the measured cell temperature (see Figure 10a), where the temperature gradient is greater. This region was taken for the first 2700 s. Parameters obtained from this section are given in Table 8. Then, specific heat is obtained by c p = m 1 C p = 1197 Jkg 1 K 1 . The aforementioned authors reported values of R i n = 1.4 KW 1 and c p = 1169 Jkg 1 K 1 for a 26650 LFP battery.

3.4. Physical Properties and Solving

Properties detailed in Table 9 were used to solve the lumped and 3D-CFD models. For NTGK approach, parameters and properties are given in Table 3 and Table 4, respectively. Besides, for all three proposed models, there were utilized experimental heat transfer coefficients based on heat flux and temperature measurements of the cell surface. These coefficients are discussed in the Section 4.2, and were obtained following a similar procedure described in the Section 3.3. Furthermore, it was assumed that the external radiation temperature is the same as the ambient temperature.. The nominal capacity of the cell is 4 Ah; however, the average tested capacity was 4.3 Ah, and this last value was employed.
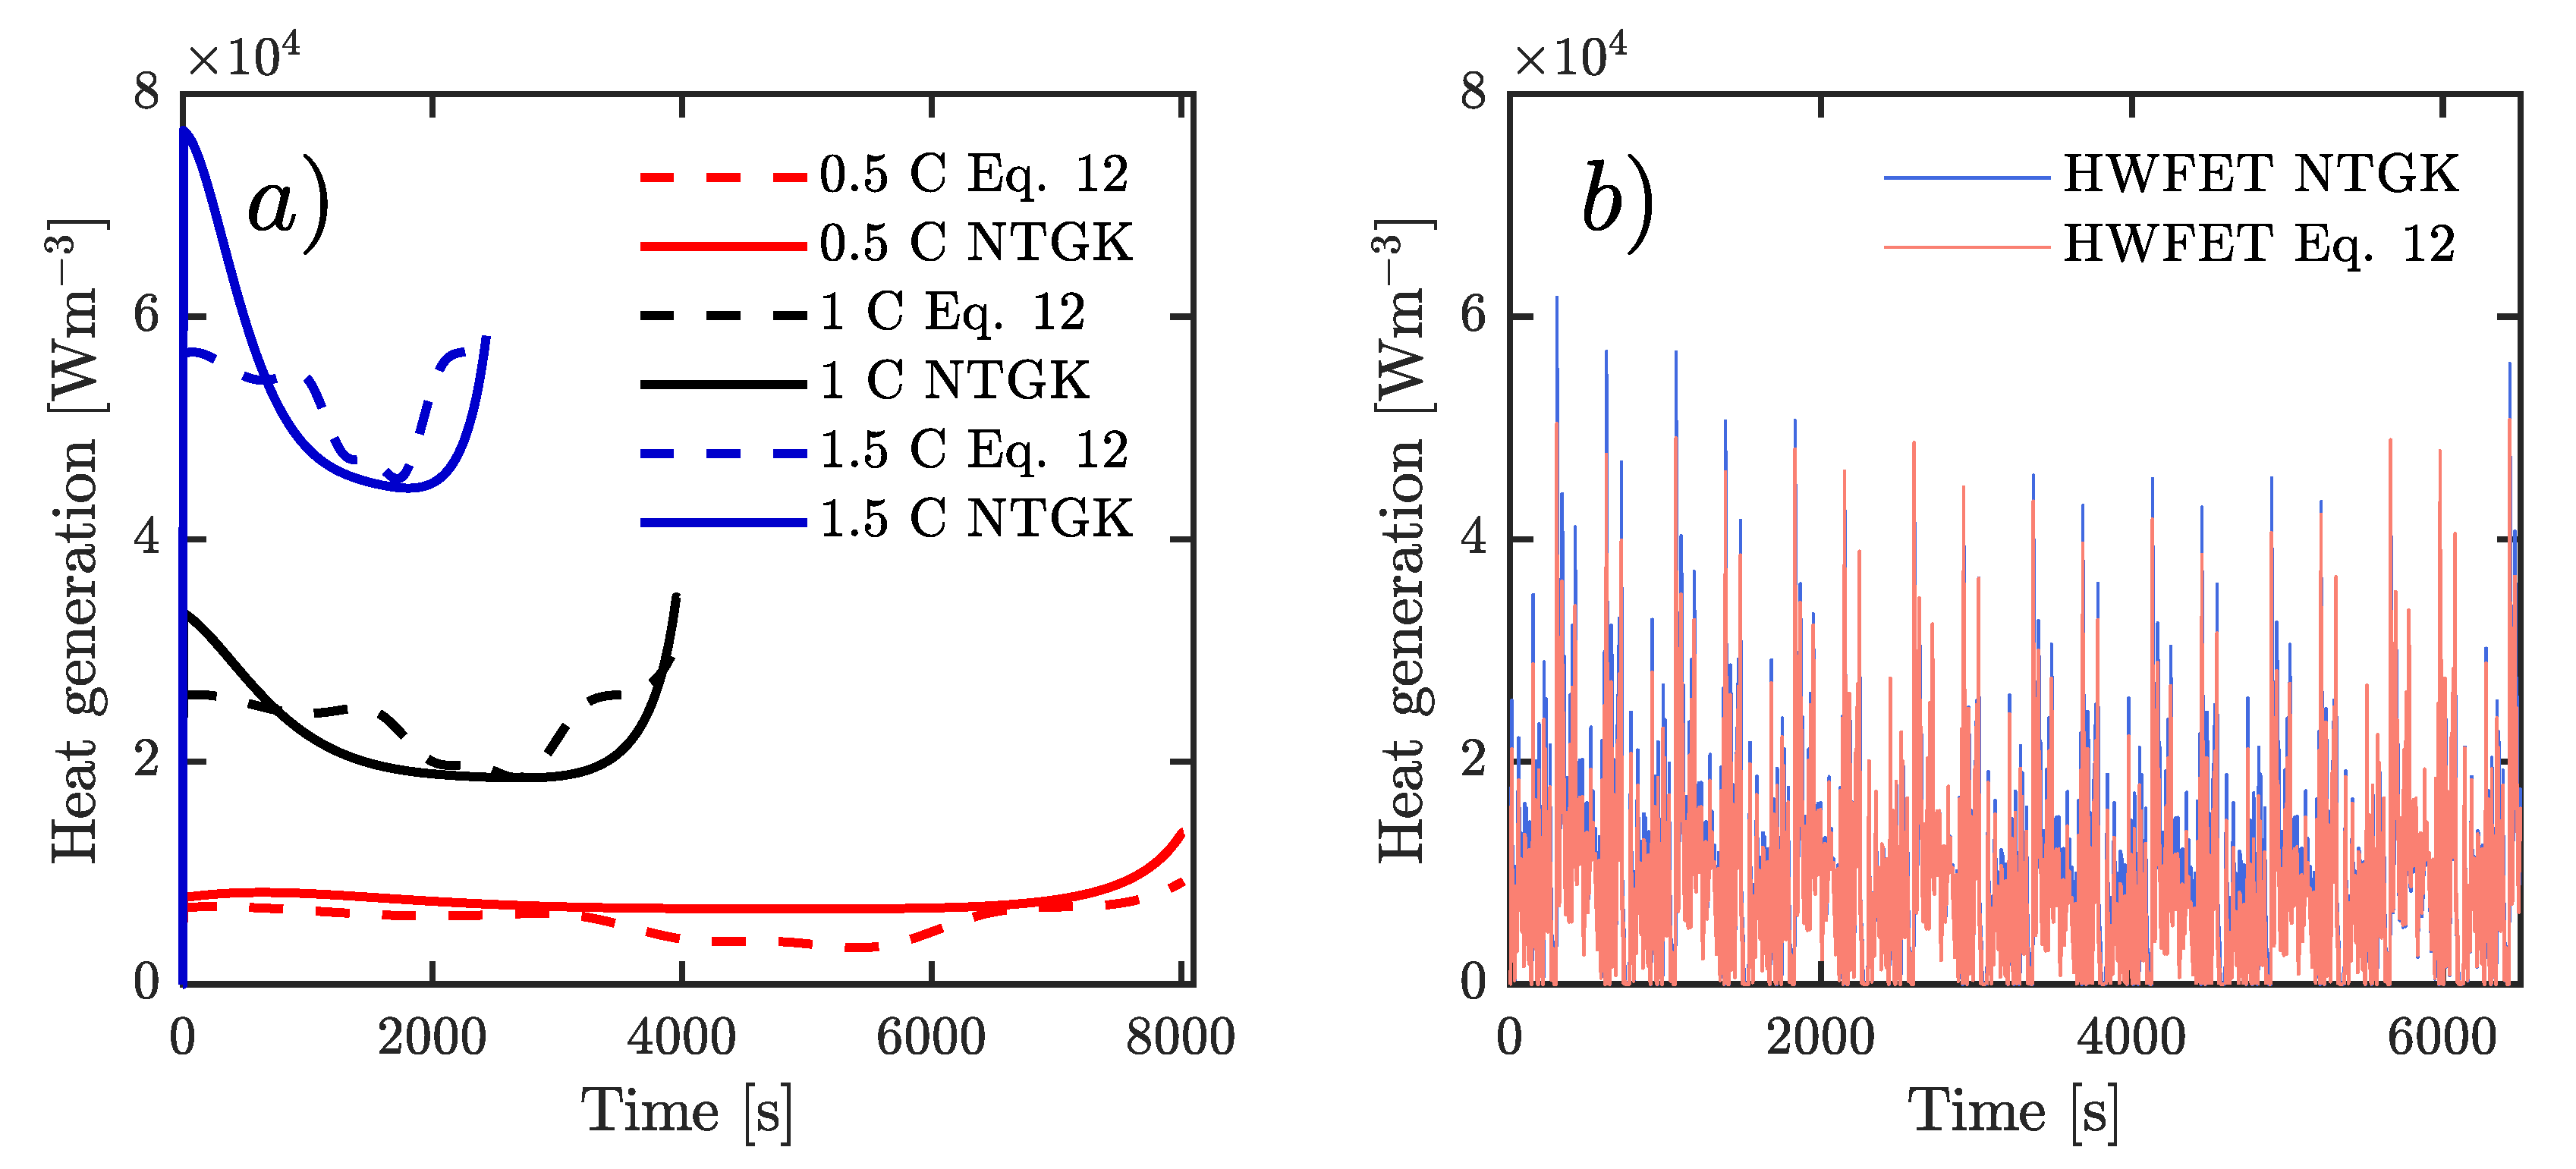
According to the current profile applied to simulate the 3D-CFD approach, there are two considerations to couple the heat generation per unit volume to the energy equation. Firstly, for constant current rates, a User Define Function (UDF) was utilized. Secondly, for variable currents (HWFET-cycle), a transient table was employed. In contrast, the NTGK model automatically computes the heat generation rate.
Numerically, the lumped model was solved by Runge Kutta Fourth order method, and the other two models were computed through a Semi-Implicit Method for Pressure Linked Equations (SIMPLE) scheme. For current rates of 2 A, 4 A, 6 A, and HWFET-cycle, the simulation time was 8015 s, 3964 s, 2430 s, and 6500 s, respectively. Furthermore, 1 s time step was utilized in all cases.

4. Results and Discussion

4.1. Heat Generation Rate

The behavior of the volumetric heat generation rate computed by Equation (12) and the NTGK model is depicted in Figure 11. Heat generation given by NTGK approach at constant current tends to increase, specially at the beginning and at the end of the discharge time (Figure 11a). The curves based on Bernardi’s equation (dashed lines) have a concave region due to the effect of the entropic term. For HWFET driving cycle, heat generation varies according to the current profile as shown in Figure 6.
Average of volumetric heat generation is reported in Table 10. In general, experimentally-based values (Equation (12)) are moderately close to values obtained numerically by NTGK model, but there exists a maximum percentage of variation of 30.9% at 0.5C.

4.2. Heat Transfer Coefficient

According to Table 11, experimental heat transfer coefficients are in moderate agreement with their computed values, although the first ones are slightly higher than predicted results. Moreover, h c o n v is very close to a value of 5 Wm 2 K 1 used by some authors [17,24,41] for studies on LIBs performance under natural convection. Besides, it is evident from Table 11 that h r a d has practically the same contribution of h c o n v in terms of heat exchange under free convection. This was also reported by Allafi et al. [42]. In general, heat transfer coefficient raises as discharge current increases.

4.3. Temperature Performance Comparison

All three evaluated approaches successfully estimate the cell temperature as displayed in Figure 12. The standard deviation of the experimental temperatures at each discharging test is 0.3 C , 0.2 C , 0.3 C , and 0.2 C for 0.5C, 1C, 1.5C, and HWFET-cycle, respectively. The maximum temperature increase was 18.1 C for 1.5C rate. Moreover, the measured temperature distribution of the cell is the same as its respective heat flux curve, as shown in Figure 7.
All the simulated models are consistent with their experimental temperature. The lumped and 3D-CFD models have practically the same temperature distribution, it is mainly due to the heat generation term is the same for both. Nevertheless, there exist minimal discrepancies comparing the temperature profile among the proposed methods. This fact is supported by computing root mean square (RMS) errors, which are detailed in Table 12, where NTGK model has the lower error at 0.5C and 1C; however, this model has the maximum error ( 1.3 C ) at 1.5C. For the HWFET-cycle, all models are in the same order of RMS error capturing satisfactorily the dynamics of the battery temperature under a real driving cycle (Figure 12d). In general, electrochemical models are widely used to model temperature and voltage of batteries due to their good agreement between numerical and experimental data [43], although these models require cautious attention to determine parameters such in References [44,45]. One advantage of CFD-based models is the computation of spatial temperatures, and also their flexibility to combine cells into a pack under different cooling conditions.
Moreover, lumped model can be more practical to evaluate long simulation time profiles. For instance, Figure 13 (bottom) shows the temperature behavior of the LCO battery considered in this study, simulated at different ambient temperatures under a real driving-cycle of a Nissan Leaf in a rural road with light traffic during approximately 5.2 h. The simulation time for each temperature distribution was 29.1 s. The application of the lumped model could be extended to estimate the temperature of a battery pack [7,46], and also battery degradation in electric vehicles [47]. Currently, the application of lumped model to estimate the temperature of an EV battery pack under different real driving cycles is being investigated. Further results will be reported in future research publications.
Besides, the models also estimate the battery temperature under forced convection. For example, Figure 14 shows a simulation of the models under the maximum discharging rate (2C) of the battery studied here considering h c o n v = 100 Wm 2 K 1 . As the discharge current increase, the temperature given by the NTGK model tends to be greater with respect to the other models at the beginning of the discharge time. This behavior mainly depends on the functions U and Y, and could be improved by adjusting the constant C 1 . Moreover, one characteristic of the ICR 26650 battery is that its tested capacity decreases to approximately 3.6 Ah when the maximum discharging current is applied.
The behavior of all the approaches can be improved. For instance, the heat capacity is the most sensitive parameter for thermal modeling while thermal conductivity has a minor impact on the simulations [13]. Then, a more accurate value of thermal parameters can be found by using calorimetric techniques. Moreover, the use of a full electrochemical model (Newman formulation) is relevant to study the physical phenomena of Li-ion transport.

4.4. Voltage

Figure 15 depicts the comparison between experimental and simulated voltage by using NTGK model. Both values are in good agreement. For HWFET driving-cycle, peak values of experimental voltage are slightly higher than the numerical result. In general terms, the dynamical behavior of the system is well captured. There exist some discrepancies specially at the end of the discharge process, where the minimal voltage is not reached; this behavior was also reported by Celik et al. [21] using NTGK model, and by Li et al. [18] using the MSMD approach under the electric circuit model. Voltage given by NTGK model could be improved by adjusting the C 2 constant.

Computational Time

CPU time consuming is a relevant aspect while comparing among different proposed models in this work. All cases were run using a standard CPU (3.5 GHz, 16 GB RAM). As indicated in Table 13, the lumped model requires time in the order of seconds for solving the temperature profile. NTGK model is more time consuming since it has to evaluate many electrochemical equations in the battery domain, even under the consideration that its mesh has fewer number of elements with respect to 3D-CFD approach. Moreover, if a mesh with more number of elements is used, and if fluid flow around them is solved, the computational time will increase considerably.

5. Conclusions

The temperature profile of a LCO 26650 lithium-ion battery under constant and complex current rates was evaluated by comparing three of the most used methods to study the thermal behavior of LIBs: a lumped model, 3D-CFD approach and an electrochemical method based on NTGK with dual potential approach. The heat generation rate, heat capacity, and heat transfer coefficients were estimated to predict the temperature at the cell surface. Thus, the following conclusions are drawn:
  • In general, NTGK model has the best performance over the rest of the studied models due to that it is capable to solve not only the temperature field of the cell, but also voltage, heat generation and other properties. This approach provides the lower temperature error at 0.5C. Nevertheless, this model presents the higher RMS error of 1.3 C at 1.5C, where the maximum temperature increase of the cell was 18.1 C . Under the driving cycle, the temperature increase was 5.1 C , and all the models were in the same order of error.
  • Lumped model is suitable to use satisfactorily in a wide range of LIB operating conditions and it presents a very similar temperature profile as 3D formulation since both models depend on the same heat generation rate and thermal parameters.
  • Under free convection, radiation plays a relevant role in terms of heat transfer rate, this contribution is practically the same as convection. Besides, the heat transfer coefficient increases as the discharging current does.

Author Contributions

Conceptualization, E.P.-H. and W.R.C.-M.; methodology, W.R.C.-M., M.O. and K.M.; simulations, E.P.-H.; experiments, W.R.C.-M., M.O. and E.P.-H.; validation, W.R.C.-M., F.J. and M.O.; writing—original draft preparation, E.P.-H. and F.J. All the authors reviewed the paper. All authors have read and agreed to the published version of the manuscript.

Funding

This research was funded by SENESCYT Ecuador, and FONDECYT Chile grant number 1170044.

Acknowledgments

The authors would like to acknowledge to The Advanced Center for Electrical and Electronic Engineering, AC3E, Basal Project FB0008, ANID. Also, thanks to Jorge Reyes for his support in the laboratory.

Conflicts of Interest

The authors declare no conflict of interest. The funders had no role in the design of the study; in the collection, analyses, or interpretation of data; in the writing of the manuscript, or in the decision to publish the results.

Abbreviations

The following abbreviations are used in this manuscript:
Acronyms
1DOne-dimensional
2DTwo-dimensional
3DThree-dimensional
BTMSBattery thermal management system
CDischarge rate
CC-CVConstant-current constant-voltage
CFDComputational fluid dynamics
DAQData acquisition
DoDDepth-of-discharge
ECMEquivalent circuit model
EISElectrochemical impedance spectroscopy
EVElectric vehicle
Exp.Experiment
HPPCHybrid pulse power characterization
HWFETThe Highway Fuel Economy Test
LCOLithium cobalt oxide
LFPLithium iron phosphate
LiLithium
LIBLithium-ion battery
LiCoO 2 Lithium cobalt oxide
MSMDMulti-scale multi-domain
NTCNegative temperature coefficient
NTGKNewman, Tiedemann, Gu, and Kim
OCVOpen circuit voltage
RMSRoot mean square
RULRemaining useful life
SOCState-of-charge
Constants and variables
V Velocity ( m · s 1 )
AArea ( m 2 )
C 1 Temperature constant for a specific battery for NTGK model
C 2 Voltage constant for a specific battery for NTGK model
C N Nominal capacity of the battery (Ah)
C p Heat capacity ( JK 1 )
c p Specific heat capacity ( J · kg · K 1 )
C N u Constant for Nusselt number
C r e f Reference capacity of the cell (Ah)
dBattery diameter (m)
EActivation energy (J)
HEnthalpy ( J · kg 1 )
hHeat transfer coefficient ( Wm 2 K 1 )
h e Sensible enthalpy ( J · kg 1 )
ICurrent (A)
jVolumetric current ( Am 3 )
k f Thermal conductivity of the fluid ( Wm 1 K 1 )
k c Thermal conductivity of the cell ( Wm 1 K 1 )
mMass (kg)
QHeat transfer rate (W)
q ech Electrochemical heat (W)
Q h t Total heat transfer rate (W)
R o Ohmic resistance ( Ω )
R T Total internal resistance ( Ω )
R C T Charge transfer resistance ( Ω )
R i n Internal thermal resistance ( K · W 1 )
R o u t External thermal resistance ( K · W 1 )
S h Source term ( Wm 3 )
TTemperature (K)
tTime (s)
UFunction for equilibrium potential for NTGK model
VVoltage (V)
V o l Volume of active zone ( m 3 )
YFunction for NTGK model
ZImpedance ( Ω )
CRate of current discharge
NuNusselt number
RaRayleight number
Greek Symbols
ϵ Emissivity
Divergence operator
ϕ Potential (V)
ρ Density ( kg · m 3 )
σ Steffan-Boltzmann constant σ = 5.67 × 10 8 Wm 2 K 4 , electrical conductivity (S/m)
Subscripts
a m b Ambient
cCell
c o m b combined
c o n v convection
C T Charge transfer
e c h Electrochemical heat
fFluid
h t Heat transfer
i n Internal
NNominal
n e g Relative to anode
O C Open circuit
o u t External
p o s Relative to cathode
r a d radiation
r e f Reference
sSurface
s u r surround
s u r f , c Cell surface
TTotal
Superscripts
nConstant for Rayleigh number
Degree

References

  1. Bryden, T.S.; Dimitrov, B.; Hilton, G.; Ponce de León, C.; Bugryniec, P.; Brown, S.; Cumming, D.; Cruden, A. Methodology to determine the heat capacity of lithium-ion cells. J. Power Sources 2018, 395, 369–378. [Google Scholar] [CrossRef]
  2. Reyes-Marambio, J.; Moser, F.; Gana, F.; Severino, B.; Calderón-Muñoz, W.R.; Palma-Behnke, R.; Estevez, P.A.; Orchard, M.; Cortés, M. A fractal time thermal model for predicting the surface temperature of air-cooled cylindrical Li-ion cells based on experimental measurements. J. Power Sources 2016, 306, 636–645. [Google Scholar] [CrossRef]
  3. Forgez, C.; Vinh Do, D.; Friedrich, G.; Morcrette, M.; Delacourt, C. Thermal modeling of a cylindrical LiFePO4/graphite lithium-ion battery. J. Power Sources 2010, 195, 2961–2968. [Google Scholar] [CrossRef]
  4. Liu, X.; Ai, W.; Naylor Marlow, M.; Patel, Y.; Wu, B. The effect of cell-to-cell variations and thermal gradients on the performance and degradation of lithium-ion battery packs. Appl. Energy 2019, 248, 489–499. [Google Scholar] [CrossRef]
  5. Coman, P.T.; Rayman, S.; White, R.E. A lumped model of venting during thermal runaway in a cylindrical lithium cobalt oxide lithium-ion cell. J. Power Sources 2016, 307, 56–62. [Google Scholar] [CrossRef]
  6. Lin, X.; Perez, H.E.; Mohan, S.; Siegel, J.B.; Stefanopoulou, A.G.; Ding, Y.; Castanier, M.P. A lumped-parameter electro-thermal model for cylindrical batteries. J. Power Sources 2014, 257, 12–20. [Google Scholar] [CrossRef]
  7. Gao, X.; Ma, Y.; Chen, H. Active thermal control of a battery pack under elevated temperatures. IFAC-PapersOnLine 2018, 51, 262–267. [Google Scholar] [CrossRef]
  8. Patil, M.S.; Seo, J.H.; Panchal, S.; Jee, S.W.; Lee, M.Y. Investigation on thermal performance of water-cooled Li-ion pouch cell and pack at high discharge rate with U-turn type microchannel cold plate. Int. J. Heat Mass Transf. 2020, 155, 119728. [Google Scholar] [CrossRef]
  9. Panchal, S.; Mathewson, S.; Fraser, R.; Culham, R.; Fowler, M. Measurement of Temperature Gradient (dT/dy) and Temperature Response (dT/dt) of a Prismatic Lithium-Ion Pouch Cell with LiFePO4 Cathode Material; WCX™ 17: SAE World Congress Experience; SAE International: Detroit, MI, USA, 2017. [Google Scholar] [CrossRef]
  10. Samba, A.; Omar, N.; Gualous, H.; Van den Bossche, P.; Van Mierlo, J.; Boubekeur, T.I. Development of 2D thermal battery model for Lithium-ion pouch cells. World Electr. Veh. J. 2013, 6, 629–637. [Google Scholar] [CrossRef] [Green Version]
  11. Kim, Y.; Mohan, S.; Siegel, J.B.; Stefanopoulou, A.G.; Ding, Y. The estimation of temperature distribution in cylindrical battery cells under unknown cooling conditions. IEEE Trans. Control Syst. Technol. 2014, 22, 2277–2286. [Google Scholar] [CrossRef]
  12. Richardson, R.R.; Zhao, S.; Howey, D.A. On-board monitoring of 2-D spatially-resolved temperatures in cylindrical lithium-ion batteries: Part I. Low-order thermal modelling. J. Power Sources 2016, 326, 377–388. [Google Scholar] [CrossRef] [Green Version]
  13. Gümüşsu, E.; Ekici, Ö.; Köksal, M. 3-D CFD modeling and experimental testing of thermal behavior of a Li-Ion battery. Appl. Therm. Eng. 2017, 120, 484–495. [Google Scholar] [CrossRef]
  14. Xia, Q.; Wang, Z.; Ren, Y.; Sun, B.; Yang, D.; Feng, Q. A reliability design method for a lithium-ion battery pack considering the thermal disequilibrium in electric vehicles. J. Power Sources 2018, 386, 10–20. [Google Scholar] [CrossRef]
  15. Jiaqiang, E.; Yue, M.; Chen, J.; Zhu, H.; Deng, Y.; Zhu, Y.; Zhang, F.; Wen, M.; Zhang, B.; Kang, S. Effects of the different air cooling strategies on cooling performance of a lithium-ion battery module with baffle. Appl. Therm. Eng. 2018, 144, 231–241. [Google Scholar] [CrossRef]
  16. Jilte, R.D.; Kumar, R. Numerical investigation on cooling performance of Li-ion battery thermal management system at high galvanostatic discharge. Eng. Sci. Technol. Int. J. 2018, 21, 957–969. [Google Scholar] [CrossRef]
  17. Li, G.; Li, S. Physics-based CFD simulation of lithium-ion battery under the FUDS driving cycle. ECS Trans. 2015, 64, 1–14. [Google Scholar] [CrossRef]
  18. Li, Y.; Zhou, Z.; Wu, W.T. Three-dimensional thermal modeling of Li-ion battery cell and 50 V Li-ion battery pack cooled by mini-channel cold plate. Appl. Therm. Eng. 2019, 147, 829–840. [Google Scholar] [CrossRef]
  19. Panchal, S.; Mathew, M.; Fraser, R.; Fowler, M. Electrochemical thermal modeling and experimental measurements of 18650 cylindrical lithium-ion battery during discharge cycle for an EV. Appl. Therm. Eng. 2018, 135, 123–132. [Google Scholar] [CrossRef]
  20. ANSYS Inc. ANSYS Fluent Theory Guide (Release 18.0); ANSYS Inc.: Canonsburg, PA, USA, 2017. [Google Scholar]
  21. Celik, A.; Coban, H.; Göçmen, S.; Ezan, M.; Goren, A.; Erek, A. Passive thermal management of the lithium-ion battery unit for a solar racing car. Int. J. Energy Res. 2019, 43, 3681–3691. [Google Scholar] [CrossRef]
  22. Liu, Y.; Liao, Y.G.; Lai, M.C. Transient temperature distributions on lithium-Ion polymer SLI Battery. Vehicles 2019, 1, 8. [Google Scholar] [CrossRef] [Green Version]
  23. Li, G.; Li, S.; Cao, J. Application of the MSMD framework in the simulation of battery packs. In Proceedings of the ASME 2014 International Mechanical Engineering Congress and Exposition, Volume 8B: Heat Transfer and Thermal Engineering, Montreal, QC, Canada, 14–20 November 2014; pp. 1–7. [Google Scholar] [CrossRef]
  24. Madani, S.S.; Swierczynski, M.; Kær, S. Cooling Simulation and Thermal Abuse Modeling of Lithium-Ion Batteries Using the Newman, Tiedemann, Gu, and Kim (NTGK) Model. ECS Trans. 2017, 81, 261–270. [Google Scholar] [CrossRef]
  25. Li, Q.; Yang, C.; Santhanagopalan, S.; Smith, K.; Lamb, J.; Steele, L.A.; Torres-Castro, L. Numerical investigation of thermal runaway mitigation through a passive thermal management system. J. Power Sources 2019, 429, 80–88. [Google Scholar] [CrossRef]
  26. Hu, X.; Liu, W.; Lin, X.; Xie, Y. A Comparative Study of Control-Oriented Thermal Models for Cylindrical Li-Ion Batteries. IEEE Trans. Transp. Electrif. 2019, 5, 1237–1253. [Google Scholar] [CrossRef]
  27. Bandhauer, T.M.; Garimella, S.; Fuller, T.F. A Critical Review of Thermal Issues in Lithium-Ion Batteries. J. Electrochem. Soc. 2011, 158, R1. [Google Scholar] [CrossRef]
  28. Sun, J.; Wei, G.; Pei, L.; Lu, R.; Song, K.; Wu, C.; Zhu, C. Online internal temperature estimation for lithium-ion batteries based on Kalman filter. Energies 2015, 8, 4400–4415. [Google Scholar] [CrossRef] [Green Version]
  29. Bergman, T.; Lavine, A. Fundamentals of Heat and Mass Transfer, 8th ed.; John Wiley & Sons, Inc.: Hoboken, NJ, USA, 2017; p. 1046. [Google Scholar]
  30. Bernardi, D.; Pawlikowski, E.; Newman, J. A general energy balance for battery systems. J. Electrochem. Soc. 1985, 132, 5. [Google Scholar] [CrossRef] [Green Version]
  31. Barai, A.; Chouchelamane, G.H.; Guo, Y.; Mcgordon, A.; Jennings, P. A study on the impact of lithium-ion cell relaxation on electrochemical impedance spectroscopy. J. Power Sources 2015, 280, 74–80. [Google Scholar] [CrossRef]
  32. Stroe, D.I.; Swierczynski, M.; Stroe, A.I.; Knudsen Kær, S. Generalized Characterization Methodology for Performance Modelling of Lithium-Ion Batteries. Batteries 2016, 2, 37. [Google Scholar] [CrossRef] [Green Version]
  33. Barai, A.; Uddin, K.; Widanage, W.D.; McGordon, A.; Jennings, P. A study of the influence of measurement timescale on internal resistance characterisation methodologies for lithium-ion cells. Sci. Rep. 2018, 8, 1–13. [Google Scholar] [CrossRef]
  34. Pérez, A.; Benavides, M.; Rozas, H.; Seria, S.; Orchard, M. Guidelines for the characterization of the internal impedance of lithium-ion batteries in PHM algorithms. Int. J. Progn. Health Manag. 2018, 9, 1–10. [Google Scholar]
  35. Waag, W.; Käbitz, S.; Sauer, D.U. Experimental investigation of the lithium-ion battery impedance characteristic at various conditions and aging states and its influence on the application. Appl. Energy 2013, 102, 885–897. [Google Scholar] [CrossRef]
  36. Huang, J.; Li, Z.; Ge, H.; Zhang, J. Analytical solution to the impedance of electrode/electrolyte interface in lithium-ion batteries. J. Electrochem. Soc. 2015, 162, A7037–A7048. [Google Scholar] [CrossRef]
  37. Kwon, K.H.; Shin, C.B.; Kang, T.H.; Kim, C.S. A two-dimensional modeling of a lithium-polymer battery. J. Power Sources 2006, 163, 151–157. [Google Scholar] [CrossRef]
  38. Li, Q.; Yang, C.; Pesaran, A. Thermal Runaway Propagation Modeling in Lithium Ion Modules with and without PCM; Technical Report; International Battery Seminar & Exhibit: Fort Lauderdale, FL, USA, 2017. [Google Scholar]
  39. Damay, N.; Forgez, C.; Bichat, M.P.; Friedrich, G. A method for the fast estimation of a battery entropy-variation high-resolution curve—Application on a commercial LiFePO4/graphite cell. J. Power Sources 2016, 332, 149–153. [Google Scholar] [CrossRef]
  40. Zhang, Y.; Song, W.; Feng, Z. An energy efficiency evaluation research based on heat generation behavior of lithium-ion battery. J. Electrochem. Soc. 2013, 160, 1927–1930. [Google Scholar] [CrossRef]
  41. Kim, Y.; Siegel, J.B.; Stefanopoulou, A.G. A computationally efficient thermal model of cylindrical battery cells for the estimation of radially distributed temperatures. In Proceedings of the 2013 American Control Conference, Washington, DC, USA, 17–19 June 2013; pp. 698–703. [Google Scholar] [CrossRef]
  42. Allafi, W.; Zhang, C.; Uddin, K.; Worwood, D.; Dinh, T.Q.; Ormeno, P.A.; Li, K.; Marco, J. A lumped thermal model of lithium-ion battery cells considering radiative heat transfer. Appl. Therm. Eng. 2018, 143, 472–481. [Google Scholar] [CrossRef] [Green Version]
  43. Wang, Q.; Jiang, B.; Li, B.; Yan, Y. A critical review of thermal management models and solutions of lithium-ion batteries for the development of pure electric vehicles. Renew. Sustain. Energy Rev. 2016, 64, 106–128. [Google Scholar] [CrossRef]
  44. Bahiraei, F.; Ghalkhani, M.; Fartaj, A.; Nazri, G.A. A pseudo 3D electrochemical-thermal modeling and analysis of a lithium-ion battery for electric vehicle thermal management applications. Appl. Therm. Eng. 2017, 125, 904–918. [Google Scholar] [CrossRef]
  45. Madani, S.; Schaltz, E.; Knudsen Kær, S. Review of Parameter Determination for Thermal Modeling of Lithium Ion Batteries. Batteries 2018, 4, 20. [Google Scholar] [CrossRef] [Green Version]
  46. Lin, X.; Stefanopoulou, A.; Siegel, J.; Mohan, S. Temperature Estimation in a Battery String Under Frugal Sensor Allocation. In Proceedings of the ASME 2014 Dynamic Systems and Control Conference, San Antonio, TX, USA, 22–24 October 2014; Volume 1. [Google Scholar] [CrossRef] [Green Version]
  47. Calearo, L.; Thingvad, A.; Marinelli, M. Modeling of Battery Electric Vehicles for Degradation Studies. In Proceedings of the 2019 54th International Universities Power Engineering Conference (UPEC), Bucharest, Romania, 3–6 September 2019; pp. 1–6. [Google Scholar] [CrossRef] [Green Version]
Figure 1. Battery details for Newman, Tiedemann, Gu and Kim (NTGK) model: (a) Cell geometry. (b) Jelly-roll of the lithium cobalt oxide (LCO) 26650 cell.
Batteries 06 00040 g001
Figure 2. Simplified lumped model. Adapted from Reference [3].
Batteries 06 00040 g002
Figure 3. Nyquist plot scheme of electrochemical impedance spectroscopy (EIS). Adapted from Reference [36].
Batteries 06 00040 g003
Figure 4. Methodology scheme.
Batteries 06 00040 g004
Figure 5. Experimental set-up. (a) Set-up for a discharging test. (b) Detail of the heat flux sensor. (c) Thermal chamber. (d) Equipment for EIS test.
Batteries 06 00040 g005
Figure 6. Scaled current profile of a highway fuel economy test (HWFET)-driving cycle.
Batteries 06 00040 g006
Figure 7. Measured heat flux at different discharging rates.
Batteries 06 00040 g007
Figure 8. Internal resistance.
Batteries 06 00040 g008
Figure 9. Entropy change coefficient.
Batteries 06 00040 g009
Figure 10. Measurements under applying the current pulse of 0.4 A, 2 A, 4 A, and 3 A: (a) Battery surface temperature and ambient temperature. (b) Battery heat flux.
Batteries 06 00040 g010
Figure 11. Volumetric battery heat generation: (a) At constant C-rate, (b) Under HWFET driving cycle.
Batteries 06 00040 g011
Figure 12. Comparison of temperature increase among different methods at different discharging currents: (a) 0.5C-rate. (b) 1C-rate. (c) 1.5C-rate. (d) HWFET-cycle.
Batteries 06 00040 g012
Figure 13. Battery temperature simulation under a real driving cycle. (Top) Velocity profile of a Nissan Leaf in a rural road with light traffic. (Middle) Scaled current. (Bottom) Temperature increase of the LCO 26650 LIB simulated at different ambient temperatures using the lumped model.
Batteries 06 00040 g013
Figure 14. Comparison of methods for a simulated discharge at 2C under h c o n v = 100 Wm 2 K 1 .
Batteries 06 00040 g014
Figure 15. Comparison of experimental and simulated voltage using the NTGK model.
Batteries 06 00040 g015
Table 1. Mesh independence test for 3D-computational fluid dynamics (CFD) model.
DescriptionMesh 1Mesh 2Mesh 3
Number of elements110445604161124
Maximum temperature ( C)41.3041.4241.43
Total heat transfer rate (W)1.511.521.52
Table 2. Mesh independence test for multi-scale multi-domain (MSMD) model.
DescriptionMesh 1Mesh 2Mesh 3
Number of elements181238777132892
Maximum temperature ( C)39.2339.1039.10
Total heat transfer rate (W)1.311.311.31
Table 3. Parameters for NTGK model.
FunctionsCoefficients
U a 0 a 1 a 2 a 3 a 4 a 5
4.0682 1.2669 −0.90723.7550−2.3108−0.1701
Y b 0 b 1 b 2 b 3 b 4 b 5
16.5066−27.0367237.3297−632.603725.0825−309.8760
Table 4. Properties of materials for MSMD model.
PropertyActive Zone
(Jelly-Roll)
Positive Tab
(Aluminium)
Negative Tab
(Steel)
Density ( kg m 3 )2226 a27198030
Specific heat ( Jkg 1 K 1 )1197 b871502.48
Thermal conductivity: radial, tangential, axial ( Wm 1 K 1 )0.8, 27, 27 [38]202.416.27
Electric conductivity ( Sm 1 )03.541 × 10 7 8.33 × 10 6
a Measured. b Parameter estimation.
Table 5. Battery specifications.
PropertyValue
Diameter26 mm
Height65 mm
Mass (measured)0.088 kg
Cathode material LiCoO 2
Anode materialGraphite
Nominal capacity4 Ah
Tested capacity4.3 Ah
Nominal voltage3.7 V
Cut off voltage2.75 V
Charge limit voltage4.2 V
Maximum charge current1 C
Maximum discharge current2 C
Emissivity [5]0.8
Table 6. Parameters for the EIS experiment.
ParameterDescription
First applied frequency 10 4 Hz
Last applied frequency0.005 Hz
Number of frequencies10 per decade
Frequency step typePoints per decade
Amplitude0.05 A
Wave typeSine
Table 7. Average cell resistance.
CurrentResistance (m Ω )Ambient Temperature ( C )
0.5C57.724
1C55.324
1.5C53.923
HWFET-cycle56.825
Table 8. Thermal parameters obtained.
R o u t (KW 1 ) R i n (KW 1 ) C p (JK 1 )
15.8 ± 2.71.8 ± 0.4105.3 ± 3.8
Table 9. Properties of materials for lumped and 3D-CFD models.
PropertyValueLumped3D-CFD
Density ( kgm 3 )2550 a
Specific heat ( Jkg 1 K 1 )1197 b
Thermal conductivity: radial, tangential, axial ( Wm 1 K 1 )0.8, 27, 27 [38]
Inner thermal resistance ( KW 1 )1.8 b
a Computed. b Parameter estimation.
Table 10. Average heat generation.
CurrentEquation (12) (Wm 3 )NTGK Model (Wm 3 )Percentage of Variation (%)
0.5C5761754230.9
1C23588222285.8
1.5C52715524650.5
HWFET-cycle8597986114.7
Table 11. Convection coefficient comparison.
Current h comb ( Wm 2 K 1 ) h conv ( Wm 2 K 1 ) h rad ( Wm 2 K 1 )
Exp.Computed Equations (7), (8) and (10)Exp.Computed Equation (10)Equation (8)
0.5C8.48.53.63.74.8
1C10.29.25.34.34.9
1.5C12.89.87.74.85.0
HWFET-cycle8.88.73.93.84.9
Table 12. Root mean square (RMS) errors for the different cases. Units C.
CurrentLumped3D-CDFNTGKExperimental Δ T ( C )
0.5C0.70.60.35.6
1C0.70.90.811.1
1.5C0.20.61.318.1
HWFET-cycle0.30.30.35.1
Table 13. Execution time for the different models.
CurrentLumped3D-CDFNTGK
0.5C2.03 s1612 s27120 s
1C1.08 s776 s14280 s
1.5C0.61 s463 s8989 s
HWFET-cycle7.23 s1296 s26460 s

