Article

SOC Estimation of a Rechargeable Li-Ion Battery Used in Fuel Cell Hybrid Electric Vehicles—Comparative Study of Accuracy and Robustness Performance Based on Statistical Criteria. Part II: SOC Estimators

by
Roxana-Elena Tudoroiu
1,
Mohammed Zaheeruddin
2,
Nicolae Tudoroiu
3,* and
Sorin-Mihai Radu
4
1
Department of Mathematics and Informatics, University of Petrosani, 332006 Petrosani, Romania
2
Department of Building, Civil and Environmental Engineering, University Concordia from Montreal, Montreal, QC H3G 1M8, Canada
3
Department of Engineering Technologies, John Abbott College, Saint-Anne-de-Bellevue, QC H9X 3L9, Canada
4
Department of Control, Computers, Electrical and Power Engineering, University of Petrosani, 332006 Petrosani, Romania
*
Author to whom correspondence should be addressed.
Batteries 2020, 6(3), 41; https://doi.org/10.3390/batteries6030041
Submission received: 4 August 2020 / Revised: 11 August 2020 / Accepted: 13 August 2020 / Published: 14 August 2020
(This article belongs to the Special Issue Battery Management Systems of Electric and Hybrid Electric Vehicles)

Abstract

:
The purpose of this paper is to analyze the accuracy of three state of charge (SOC) estimators of a rechargeable Li-ion SAFT battery based on two accurate Li-ion battery models, namely a linear RC equivalent electrical circuit (ECM) and a nonlinear Simscape generic model, developed in Part 1. The battery SOC of both Li-ion battery models is estimated using a linearized adaptive extended Kalman filter (AEKF), a nonlinear adaptive unscented Kalman filter (AUKF) and a nonlinear and non-Gaussian particle filter estimator (PFE). The result of MATLAB simulations shows the efficiency of all three SOC estimators, especially AEKF, followed in order of decreasing performance by AUKF and PFE. Besides, this result reveals a slight superiority of the SOC estimation accuracy when using the Simscape model for SOC estimator design. Overall, the performance of all three SOC estimators in terms of accuracy, convergence of response speed and robustness is excellent and is comparable to state of the art SOC estimation methods.

1. Introduction

In recent years, the lithium-ion battery has proven to be an ideal safety battery for hybrid electric vehicles, with high discharge power, environmental protection, low pollution, and long life [1,2,3,4,5,6,7,8,9,10,11,12,13,14,15,16,17,18,19]. Some details about its features, modelling, and hybrid combinations with different power sources in a fuel cell electric vehicle (FCEV) and power distribution controlled and optimized by an energy management system (EMS) are shown in Part 1 [20]. It is worth mentioning that the battery SOC is an essential internal parameter that is continuously monitored by a battery management system (BMS) to prevent dangerous situations and improves battery performance. The Li-ion battery as a direct energy supply and its SOC have a significant impact on the HEV’s performance. Besides, the amount of SOC is crucial for safe operation of the Li-ion battery and its prolongation of life, so an accurate estimate of the SOC has an important theoretical significance and application value [1,2,5,6]. Typically, for calculation based on the coulomb counting method, the SOC is “tracking according to the discharging current” [5,6,12]. In the absence of a measurement sensor, the SOC cannot be measured directly; thus, its estimation using a Kalman filter technique is required [5].
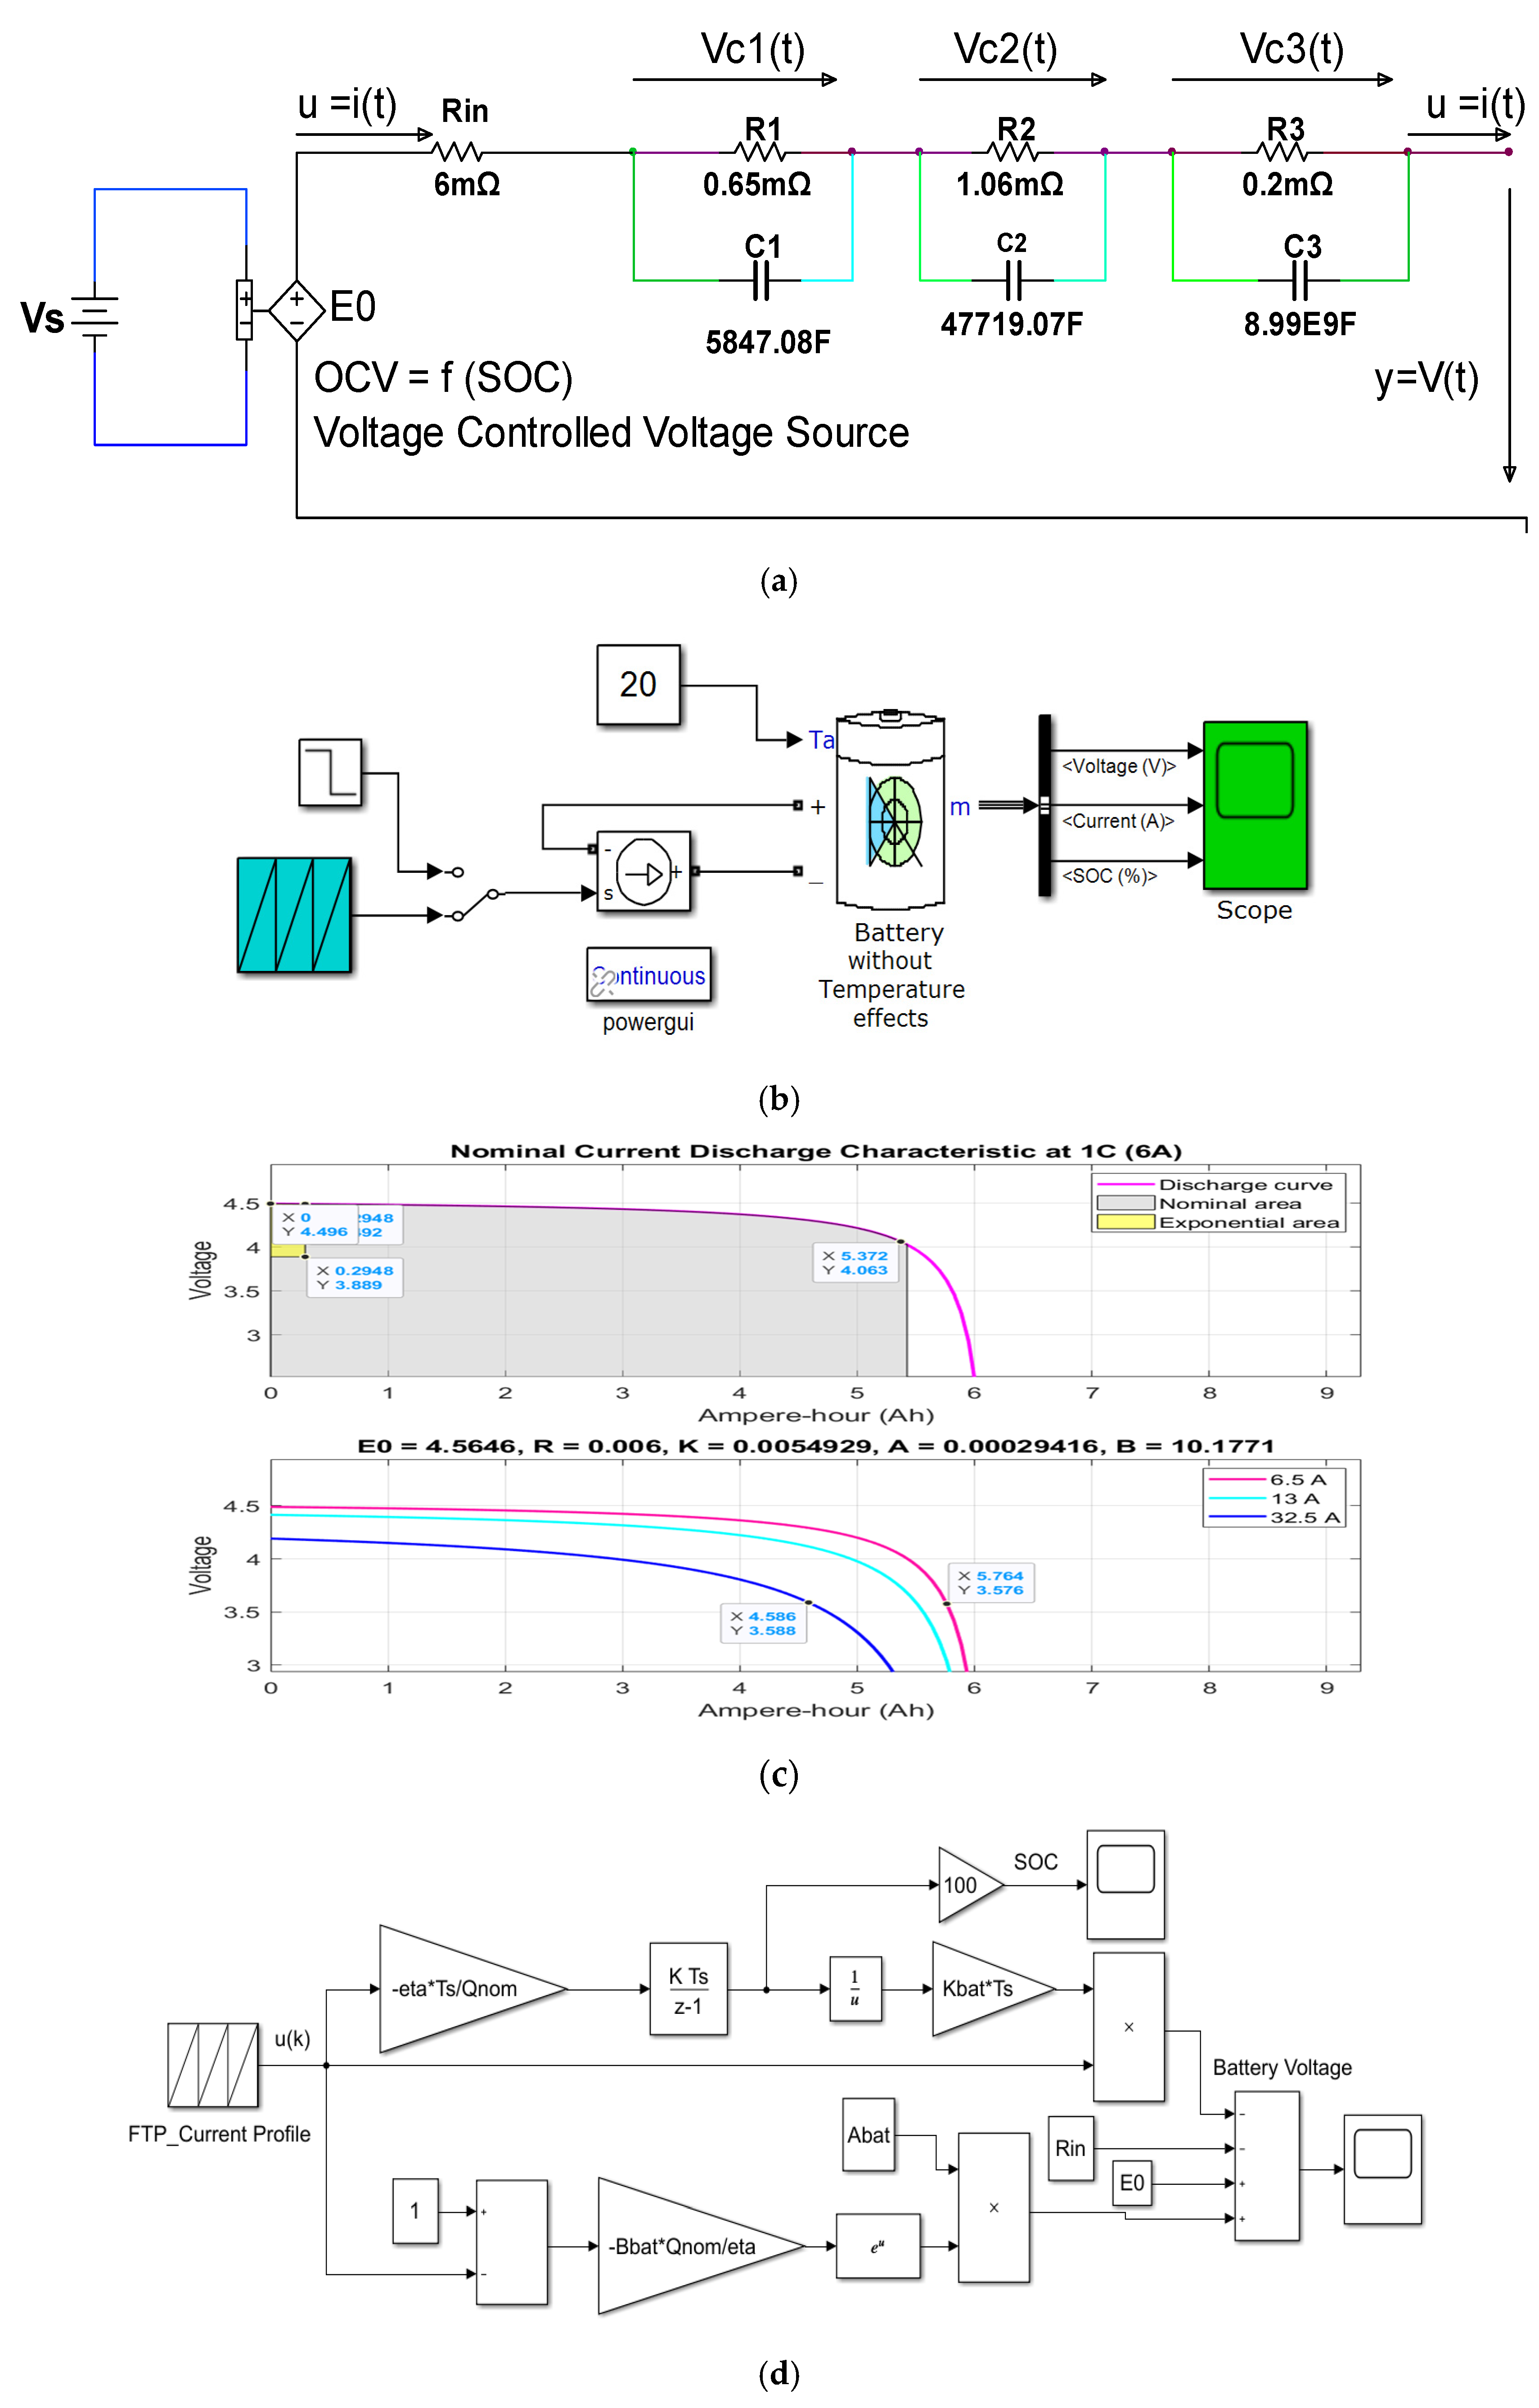
Typically, the Kalman filter SOC estimators are model based, so both battery models—the linear RC equivalent electrical circuit (ECM) and the nonlinear Simscape generic model developed and analyzed in Part 1 [20] are beneficial for designing and implementing a high accuracy SOC estimator [1,2,3,4,5,6,7,8,9,10,12,13,14,15,16,17,18,19]. For better documentation and information for the reader, the diagrams of both models represented in Part 1 [20] are taken over and repeated in Appendix A.1, Figure A1a–c. The Li-ion battery is an essential component of the battery management system (BMS) that plays an important role for improving the battery performance [2,5,6,12]. More details on the definition, the role, the main components (hardware and software) and the multitask functions can be found in [2,5]. Motivated by the results obtained in Part 1 [20], this article focuses on the design and implementation of three real-time SOC estimators on a MATLAB R2020a simulation environment. The remaining sections of this paper are structured as follows. Section 2 makes a presentation of state of the art of Li-ion battery SOC estimation Kalman filter techniques. Section 3 describes three of the most suitable SOC estimators in HEV applications and for each estimator shows the MATLAB simulation results. Section 4 analyses, for each SOC estimator, the SOC accuracy, convergence speed and robustness performance using six statistical criteria, defined in Part 1 [20]. Section 5 highlights the authors’ contributions to this research paper.

2. State of the Art of Li-Ion Battery SOC Estimation Kalman Filter Techniques

The most popular nowadays, Kalman filter (KF) is the “optimum state estimator and intelligent tool for a linear system”, beneficial for estimating the Li-ion battery dynamic states and parameters [8].
Its “predictor–corrector” structure, more precisely the “self-correcting” nature, is the most attractive feature of the KF algorithm when the system is running, which helps to “tolerate large variations” in the estimated SOC values, as mentioned in [6]. Besides, it can significantly improve the “accuracy and robustness of battery SOC estimation”, as well as the filtering of noise that realistically occurs in the measurement output dataset and the battery model process. The accuracy, response speed convergence, robustness, and noise filtration, in the proposed case study, are approached in some detail in Section 4.1, Section 4.2, Section 4.3, Section 4.4 and Section 4.5. The values of statistical criteria from Table 1 and Table A1, Table A2, Table A3 and Table A4 analyzed in Section 4.5, play an essential role in the analysis of SOC estimation performance for all three SOC estimators and both models of the Li-ion battery. It is worth mentioning that all the Kalman filter state estimators played a crucial role in the last six decades, reforming the whole theory of automatic control systems, both theoretically and in terms of applicability. A combination of the KF state estimator and the Ah Coulomb counting method can be used to “compensate for the non-ideal factors that can prolong the operation of the battery” [6]. However, there are situations when some Li-ion battery models have a dynamic that is “extremely nonlinear” and therefore “the linearization error may occur due to the lack of precision in the extension of the first series Taylor series in extremely nonlinear conditions” [5]. The simplicity of the SOC EKF estimator design and real-time MATLAB implementation is among two main features that motivated many researchers to apply it to a variety of Li-ion battery models, as in [2,3,6,7,8,9]. A new state of the art analysis on Li-ion BMSs is presented in [12], which includes a brief overview presentation of the most common adaptive filtration techniques for SOC estimation reported in the literature. Similarly, in [6], the authors present an interesting state of the art study on SOC estimation of the Li-ion battery for electric vehicles, in which an entire subsection examines all existing adaptive SOC filtration estimation techniques reported in the literature. A brief review on SOC estimating techniques related to Li-based batteries can be found in [13]. In [14], a new approach, the dual EKF SOC estimator of first-order RC ECM Li-ion battery model state and parameters, is well documented. The SOC simulations resulting from research paper [14] reveal excellent accuracy for SOC estimation.
Still, the robustness of the algorithm in [14] is lacking; it is strengthened in our research for five different scenarios and two battery models. Besides this, six performance analysis criteria are defined and used to assess the accuracy and robustness of SOCs. On the other hand, the authors of [14], in a new frame of a fault detection and isolation (FDI) approach, develop an SOC AEKF estimator for a Li-ion battery. A rigorous analysis of fault estimation performance, injected into BMS current and voltage sensor, showed a high accuracy and robustness to a 20% initial initialization of SOC error for an urban dynamometer driving schedule (UDDS) driving cycle profile test. The SOC accuracy and robustness performance are comparable to those obtained in our research for 30% initialization SOC error (scenario R1 for both battery models and each SOC estimator) and for an FTP-75 driving cycle profile test that includes the UDDS in the first 1379 s. Of course, to analyze the impact of each fault on the SOC estimation performance it was beneficial to see the fault SOC estimated values. An AEKF fading (AFEKF) approach is proposed in [15] for the accuracy of Li-ion battery SOC estimation and the convergence rate, which can reduce the SOC estimation error to less than 2%. The AFEKF SOC estimator performs better in terms of accuracy, robustness and convergence speed for a 20% initialization SOC error, but in our research similar performances are obtained at the initialization of 30% and 50% SOC errors (scenario R1), and also in combination with capacity degradation (scenario R2), noise level change (scenario R3) and the effects of temperature on the internal resistance of the battery (scenario R4). The result of the MATLAB simulations reveals that the AEKF SOC estimator works successfully in all five scenarios, especially for the Simscape model.
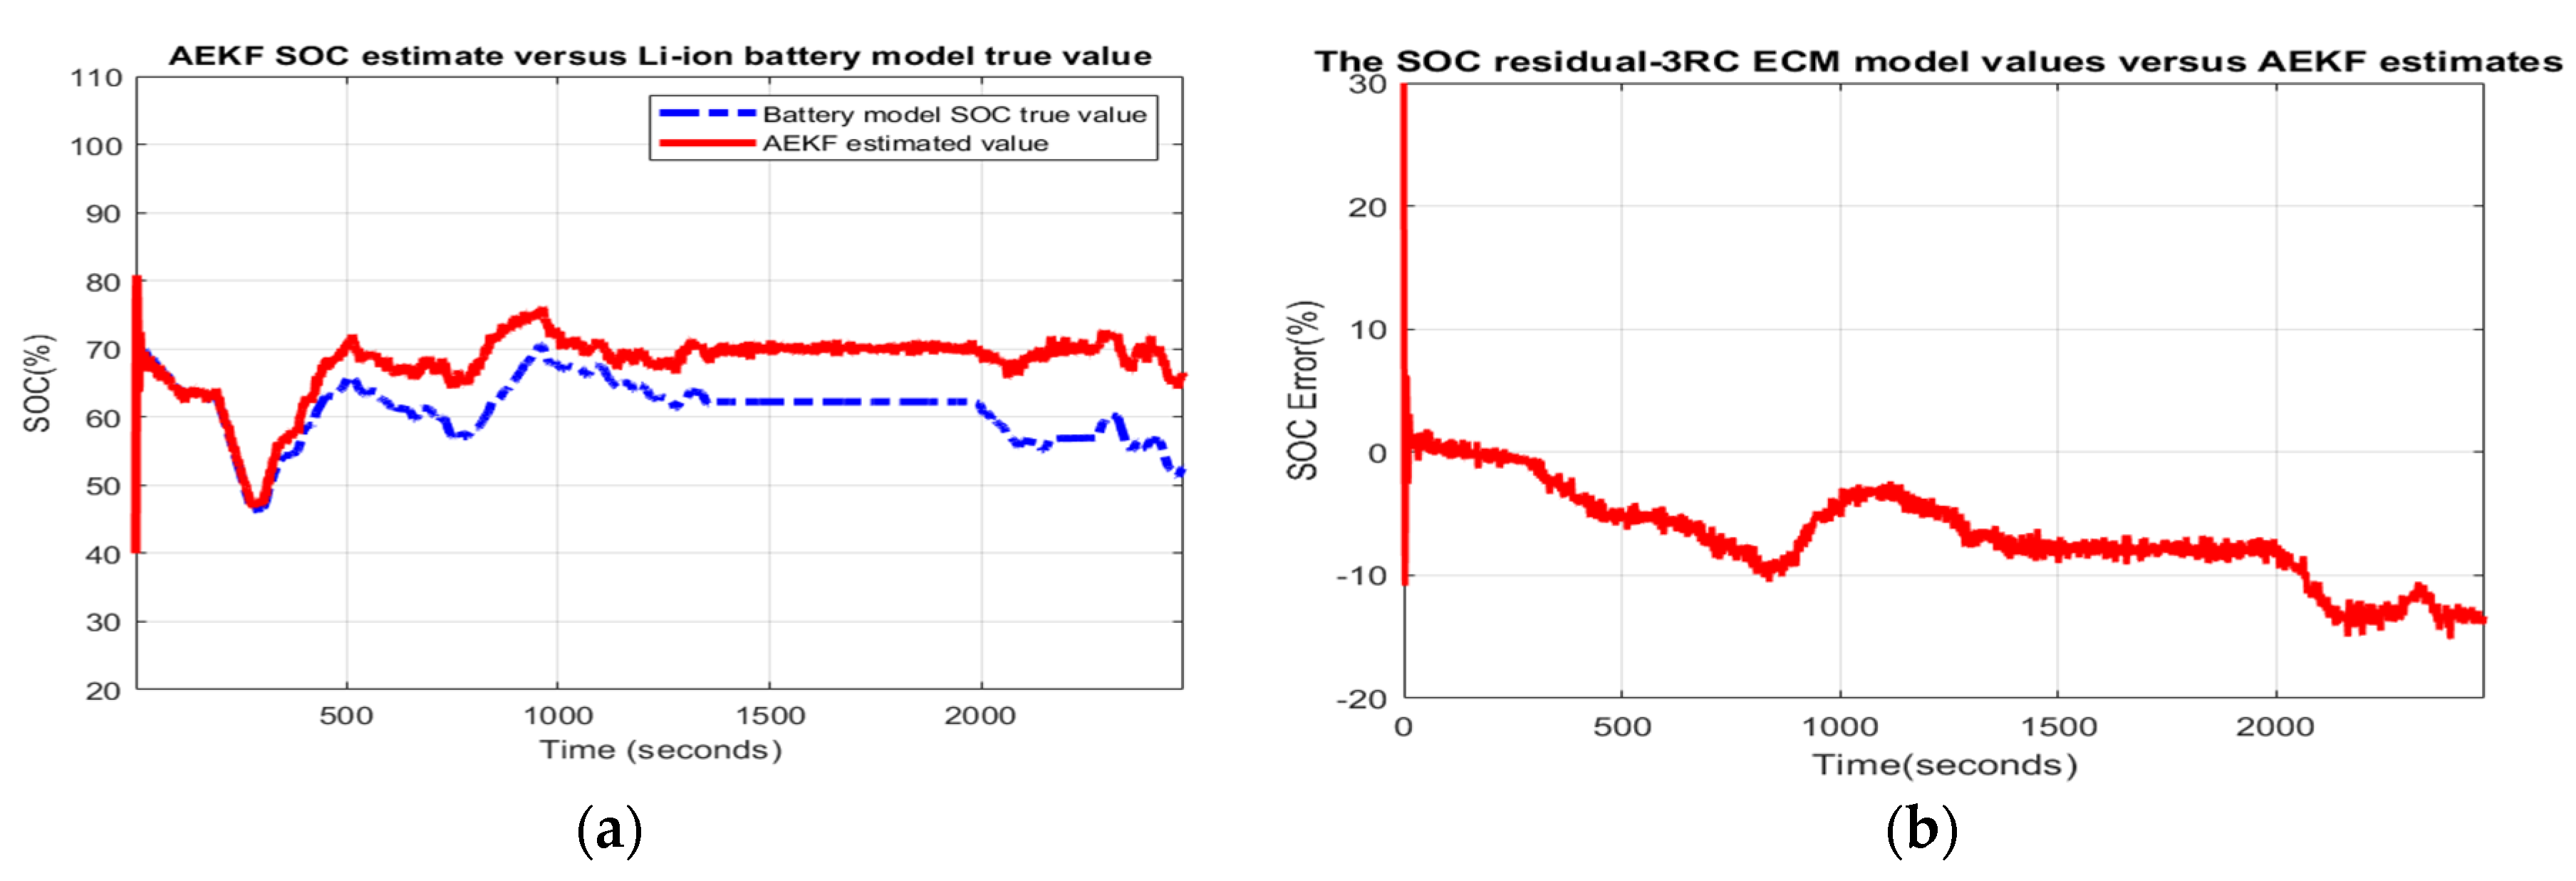
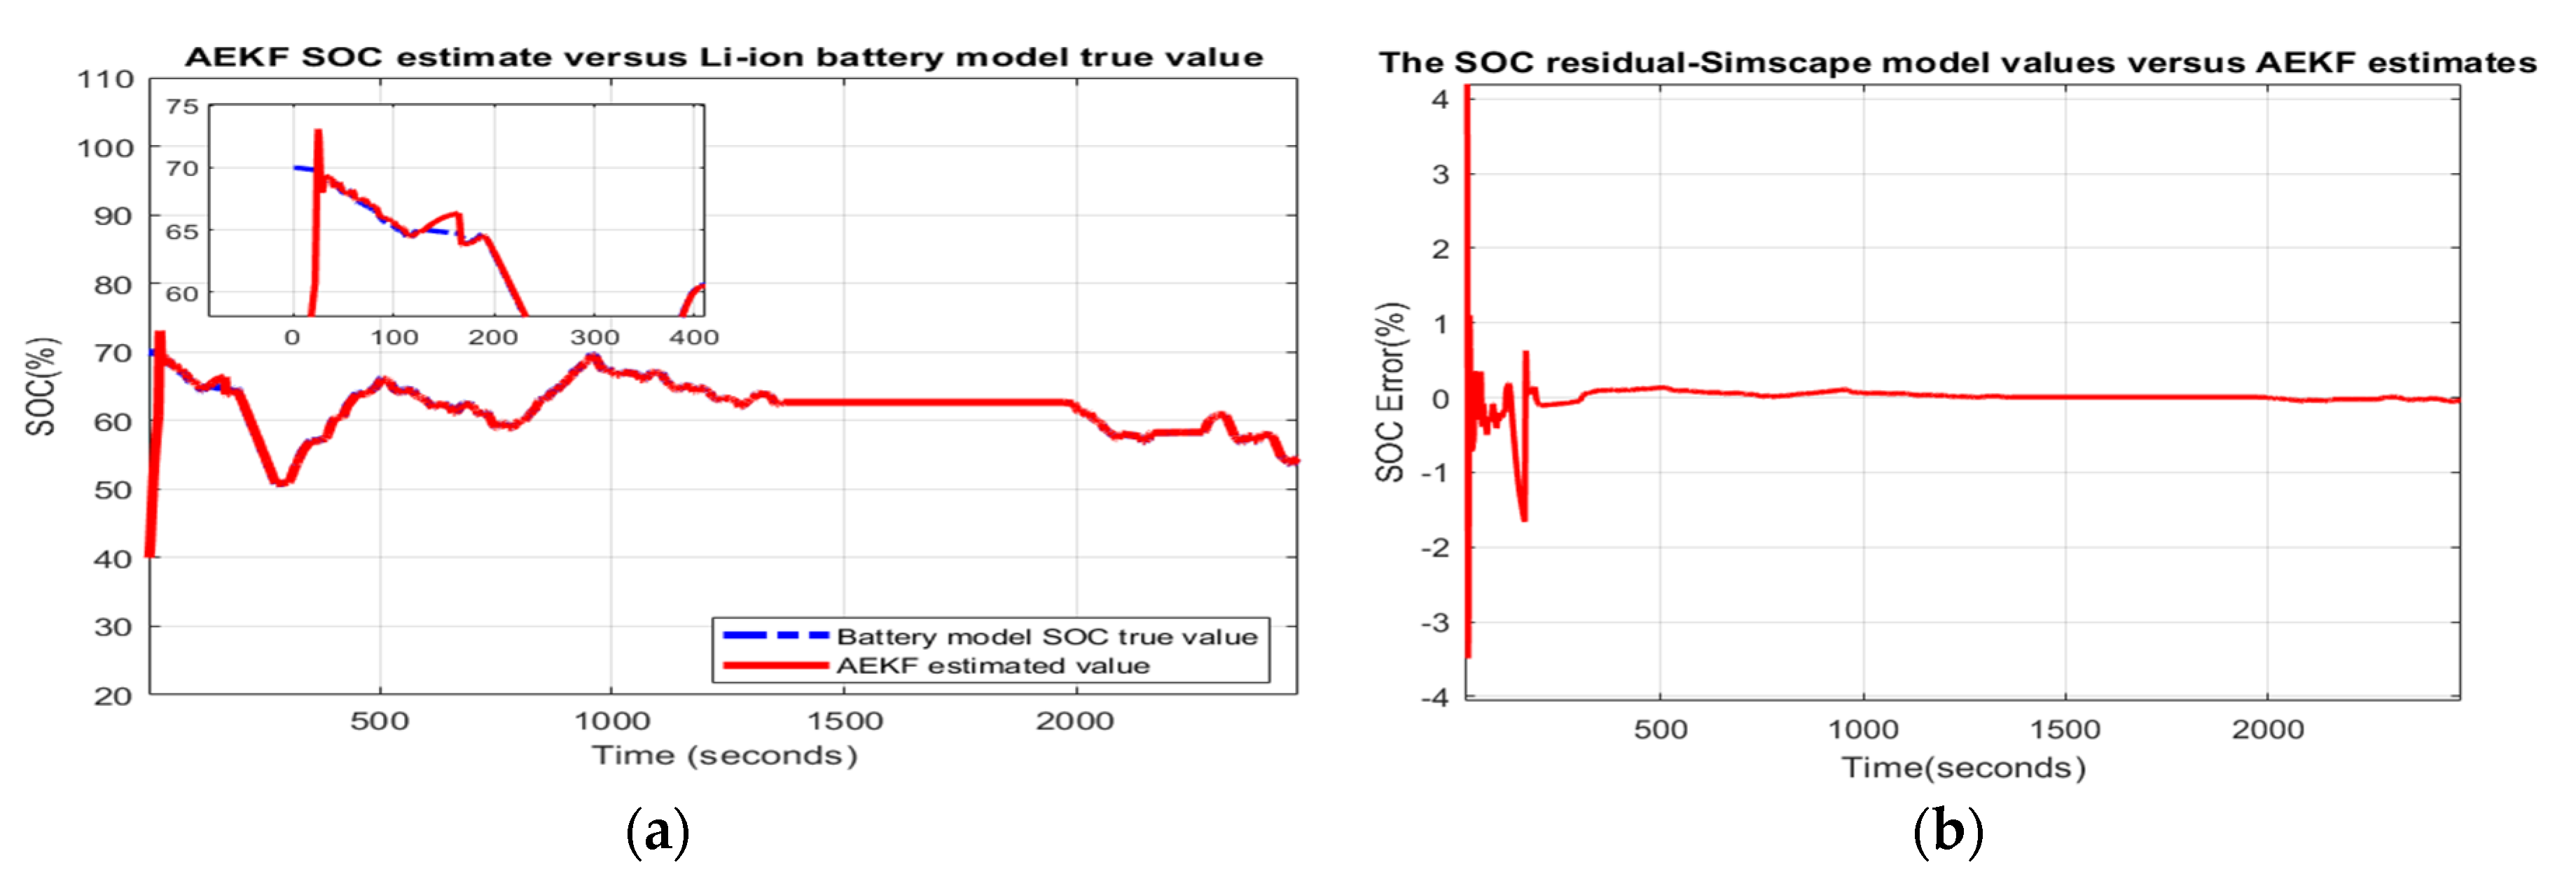
A similar situation is reported in the literature, in reference [16], where the authors investigate an RC ECM Li-ion battery model, and the SOC accuracy performance and robustness are analyzed for 20% initialization of SOC error. The SOC estimated error of the AEKF SOC estimator is more significant than 2% during the steady-state for a considerable window length t ( 800 , 2200 )   s of SOC residual [16] compared to the AEKF SOC estimator used in our research for which the SOC estimated error is 0.32% for third order resistor capacitor (3RC) equivalent circuit model (ECM), if a 20% initialization SOC error (SOCini = 50%) is under investigation. For performance comparison purposes, Figure 1 shows a complete picture of Li-ion battery AEKF SOC, i.e., accuracy and robustness performance, for a 20% initialization SOC error, such as is reported in several references in the literature. Typically, in our research, for MATLAB simulations, 30% and 50% initialization of SOC errors, in combination with different scenarios, are under consideration.
For a similar RC ECM battery model, reference [17] shows the SOC accuracy and robustness of the AEKF SOC estimator for a UDDS current profile test, and 20% initialization SOC error. The simulation results in [17] reveal that the estimated SOC error reaches, during the UDDS driving cycle test, even 5%. In reference [18], based on an RC ECM model, an adaptive Kalman filter (AKF) is implemented and the SOC is set for initialization to SOCini = 76% and SOCini = 81%, compared to the default value SOCini = 80%. During the driving cycle the SOC errors reach 5% for first case and 4% for the second case. The selective results reported in the literature, highlighted in this paragraph, are significant for demonstrating the effectiveness of all three Kalman filter SOC estimators. In conclusion, comparing the simulation results obtained in our research work with those reported in the literature and mentioned above, it can be affirmed that the proposed SOC estimators and both models of Li-ion batteries are very efficient and work very well. The AEKF SOC estimator was chosen as a baseline because its results have a slight superiority compared to the other two competitors, namely the AUKF and PFE SOC estimators. AEKF proved to be a strong competitor compared to many other SOC estimators reported in the literature. In general, it can be said with confidence that the SOC AEKF estimator adopted in the present research with a correct design and with the parameters established at appropriate optimal values has better results than those found in the literature. Fundamental work related to the unscented Kalman filter (UKF) estimator is outlined in [7], which provides a strong theoretical background. Moreover, a particle filter estimator (FPE) is used to estimate the states, estimating the “probability density function” of a nonlinear dynamics of the Li-ion battery model, using a Monte-Carlo simulation technique, such as is developed in [11].

3. Li-Ion Battery SOC—Adaptive and Particle Filter Estimators

In this section, an overview of two Kalman filter SOC estimators with adaptive function is provided, namely a linearized adaptive Kalman filter (AEKF) [5,6,15,16,17,18,19] and an unscented adaptive Kalman filter (AUKF). A successful implementation of both SOC estimators is performed on the software platform MATLAB R2020a, which estimates the SOC of a Li-ion SAFT battery with a rated capacity of 6 Ah and a nominal voltage of 3.6 V. Both SOC estimators under investigation are model based; thus, a dynamic state space representation model of the Li-ion battery is required in order to develop a simulation model for the emulation of nonlinear battery behavior [5,6]. In the case study, the set of equations that describe both models developed in Part 1 [20] is used, namely a 3RC ECM Li-ion battery model and a Li-ion battery Simscape model.

3.1. Adaptive Extended Kalman Filter (AEKF) Overview Presentation

The AEKF SOC estimator is a standard EKF, such as those developed in [2,5,6,15,16,17,18,19], with improved performance by using a memory fading factor [16] or adaptive correction of process and measurement noise covariances [6]. In [5], the SOC AEKF estimator combines both memory fading and noise correction. Encouraged by the preliminary results obtained in [5], the current research paper implements the same version of the AEKF SOC estimator adapted for each of the Li-ion battery models under investigation, namely the 3RC ECM and Simscape models. In the following are underlined only some interesting implementation aspects related to the AEKF estimation algorithm. The AEKF algorithm can improve SOC estimation performance by using “a fading memory factor to increase the adaptiveness for the modelling errors and the uncertainty of Li-ion battery SOC estimation, as well as to give more credibility to the measurements” [19]. It is based on the linearized models of the Li-ion battery described in the previous section. An excellent feature of the AEKF SOC estimator is that it is easy to implement in real time, due to its “recursive predictor–corrector structure that allows the time and measurement updates at each iteration” [5,19].
The tuning parameters of the AEKF SOC estimator are the following: Q ( 0 ) and R ( 0 ) , P ^ ( 0 ) = P ^ ( 0 | 0 ) , the fading factor α and the window length L, obtained by a “trial and error” procedure based on the designer’s empirical experience.
For simulation purposes, to test the effectiveness of the AEKF SOC estimator, the Kalman filter estimator parameters are set up for an FTP = 75 driving cycle profile test to the following set of values, Q ( 0 ) = 5 × 10 4 ,   R ( 0 ) = 0.4 × 10 4 ,   = 0.9 ,   P ^ ( 0 ) = 10 10 ,   L = 100 samples for the Simscape battery model, and a second set of values Q ( 0 ) = d i a g ( [ q w   q w   q w   q w S O C ] ) ,   q w = 2 × 10 3 ,   q w S O C = 0.5 , R ( 0 ) = 0.02 , = 0.9 , P ^ ( 0 ) = 10 10 , L = 80 samples for the 3RC ECM Li-ion battery model.
The MATLAB simulation results for an FTP-75 driving cycle current profile test are shown for all three SOC estimators, adapted for each Li-ion battery model described in the previous section and for the following five main scenarios, defined as:
  • Scenario R0—SOC estimator accuracy based on the SOC residual curve, for an SOC initial value SOCini = 70% (i.e., same as the advanced vehicle simulator (ADVISOR) SOC estimated value) and the statistical criteria values, i.e., RMSE, MSE, MAE, std, MAPE and R-squared, given in Table 1.
  • Scenario R1—SOC estimator robustness to changes in initial SOC value, SOCini = 0.4. The MATLAB simulation results are shown in Appendix A.1, and the statistical criteria values are provided in Appendix A.2, Table A1.
  • Scenario R2—SOC estimator robustness to simultaneous changes, i.e., SOCini = 1 and battery ageing effects (a decrease in battery capacity by 30%, i.e., Qnom decreases from 6 Ah to 4.2 Ah). The MATLAB simulation results are shown in the main part of the manuscript, and statistical criteria values are given in Appendix A.2, Table A2.
  • Scenario R3—SOC estimator robustness to simultaneous changes, namely in SOCini (SOCini = 0.4) and to 10 times increase in measurement noise level (e.g., σ = 0.01). The MATLAB simulation results are shown in Appendix A.1, and the statistical criteria values are given in Appendix A.2, Table A3.
  • Scenario R4—SOC estimator robustness to simultaneous changes, such as in SOCini (SOCini = 0.2), temperature effects on internal resistance Rin and polarization constant Kp (only for Simscape Li-ion battery model) to changes in ambient temperature ( T 0 = 293.15   K ,   equivalent   to   20 °C), as is shown in Part 1 [20], p. 12 for thermal model.
The MATLAB simulation results are depicted in the main part of the manuscript and in Appendix A.1, and the statistical criteria values are given in Appendix A.2, Table A4.
For each SOC estimator, these abbreviations of the five scenarios in the following text inserted into the manuscript are used to avoid repeating the words.

3.1.1. MATLAB Simulation Results for 3RC ECM Battery Model—Accuracy and Robustness Scenarios

  • Scenario R0. The MATLAB simulation results for this scenario are shown in Appendix A.1, Figure A12a–c, and the statistical criteria values are given in Table 1.
    Performance analysis:
    SOC of high accuracy and a great battery output voltage prediction.
    The residual error is quite close to 1.5%, which is comparable to the results reported in the literature.
  • Scenario R1. The MATLAB simulation results for the first scenario are presented in Appendix A.1, Figure A13a–c, and the statistical criteria values are given in Appendix A.2, Table A1.
    Performance analysis:
    The simulation results reveal excellent SOC accuracy and a great robustness to changes in the initial SOC value.
    The steady-state residual error is quite close to zero, which is an excellent result.
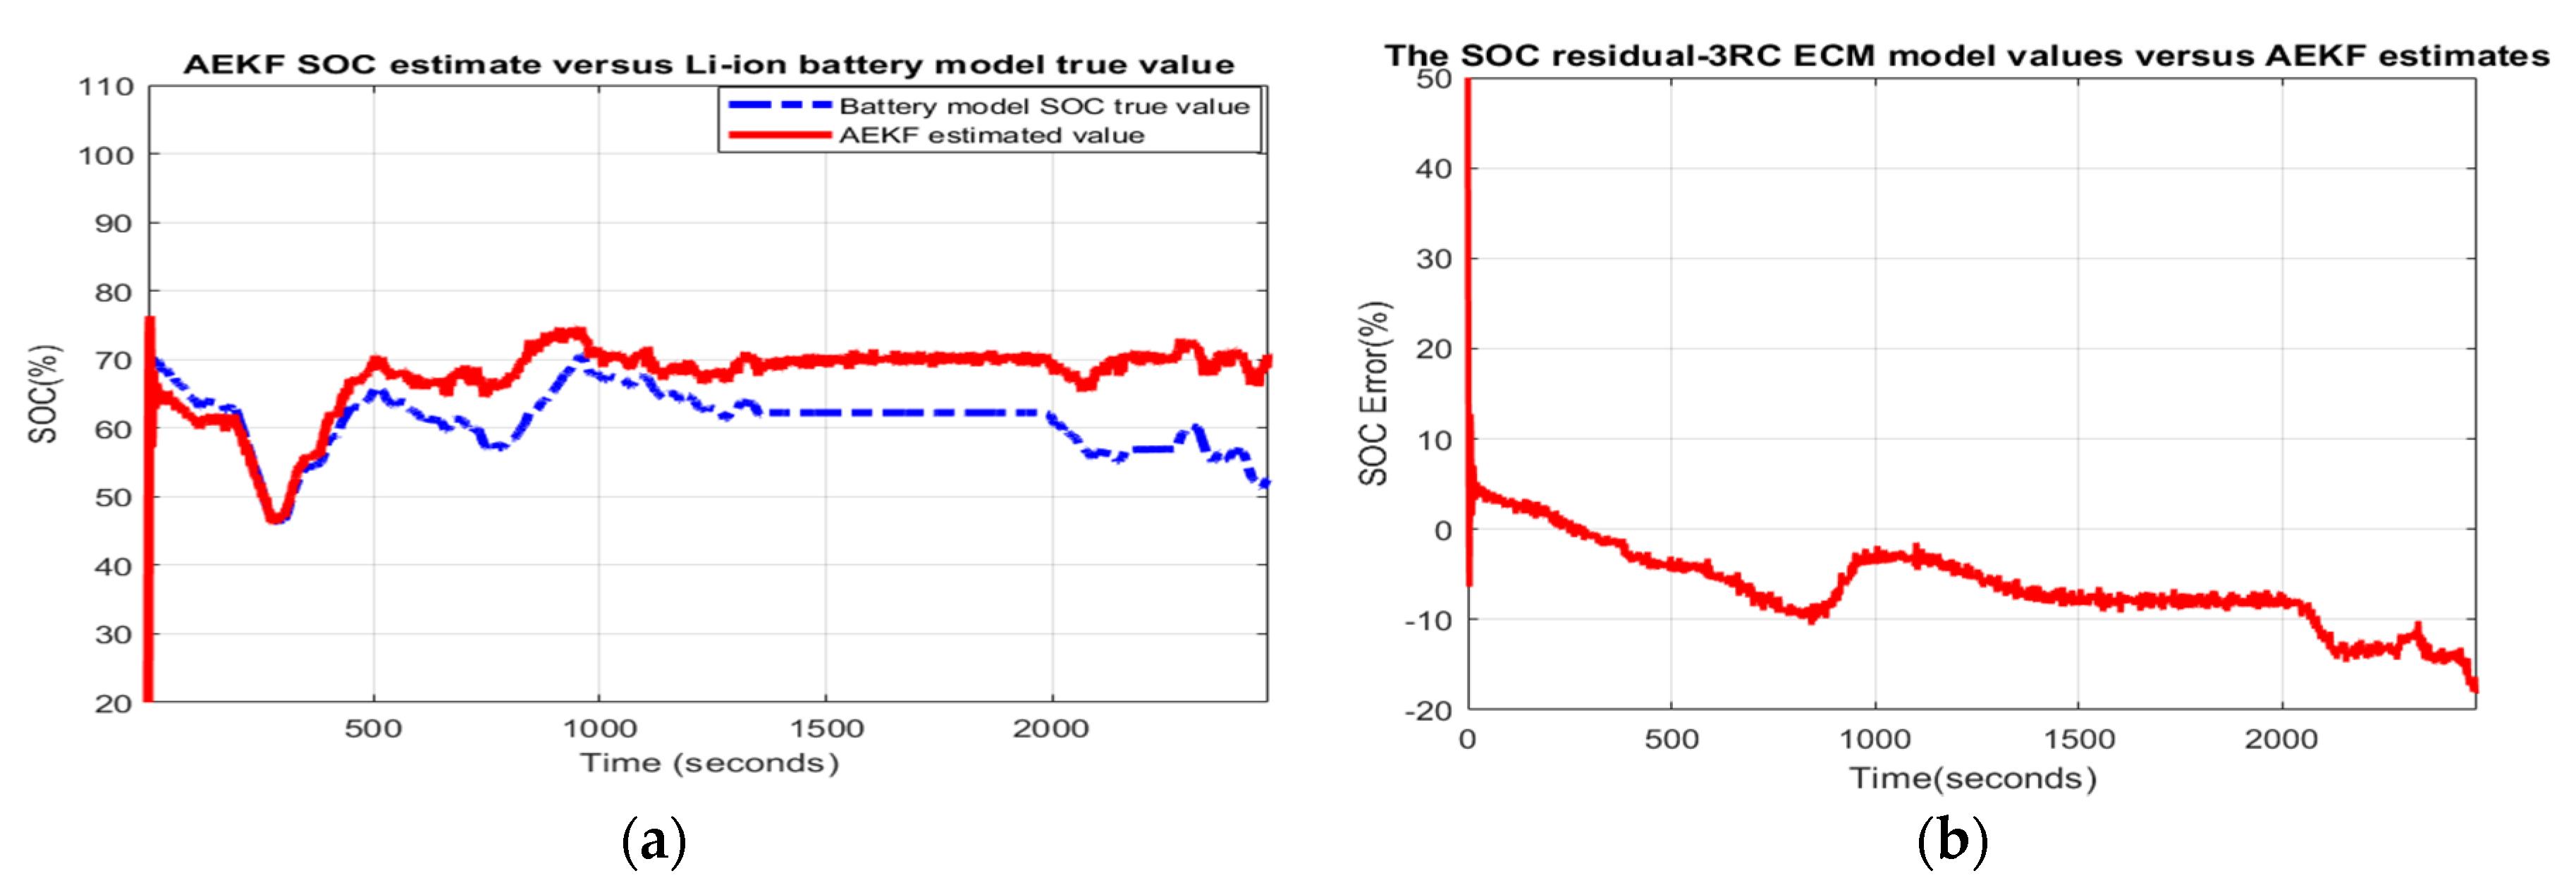
  • Scenario R2. The MATLAB simulation results for the second scenario are depicted in Figure 2 and statistical criteria values are given in Appendix A.2, Table A2.
    Performance analysis:
    The SOC accuracy is good and the robustness to ageing effects is great.
    The steady-state residual error converges to −2%, which is a good result.
  • Scenario R3. The MATLAB simulation results for the third scenario are shown in Appendix A.1, Figure A14a–c, and the statistical criteria values are given in Appendix A.2, Table A3.
    Performance analysis:
    The SOC accuracy is bad and the robustness to an increased noise level is bad.
    The steady-state residual error converges to −11%, which is a bad performance.
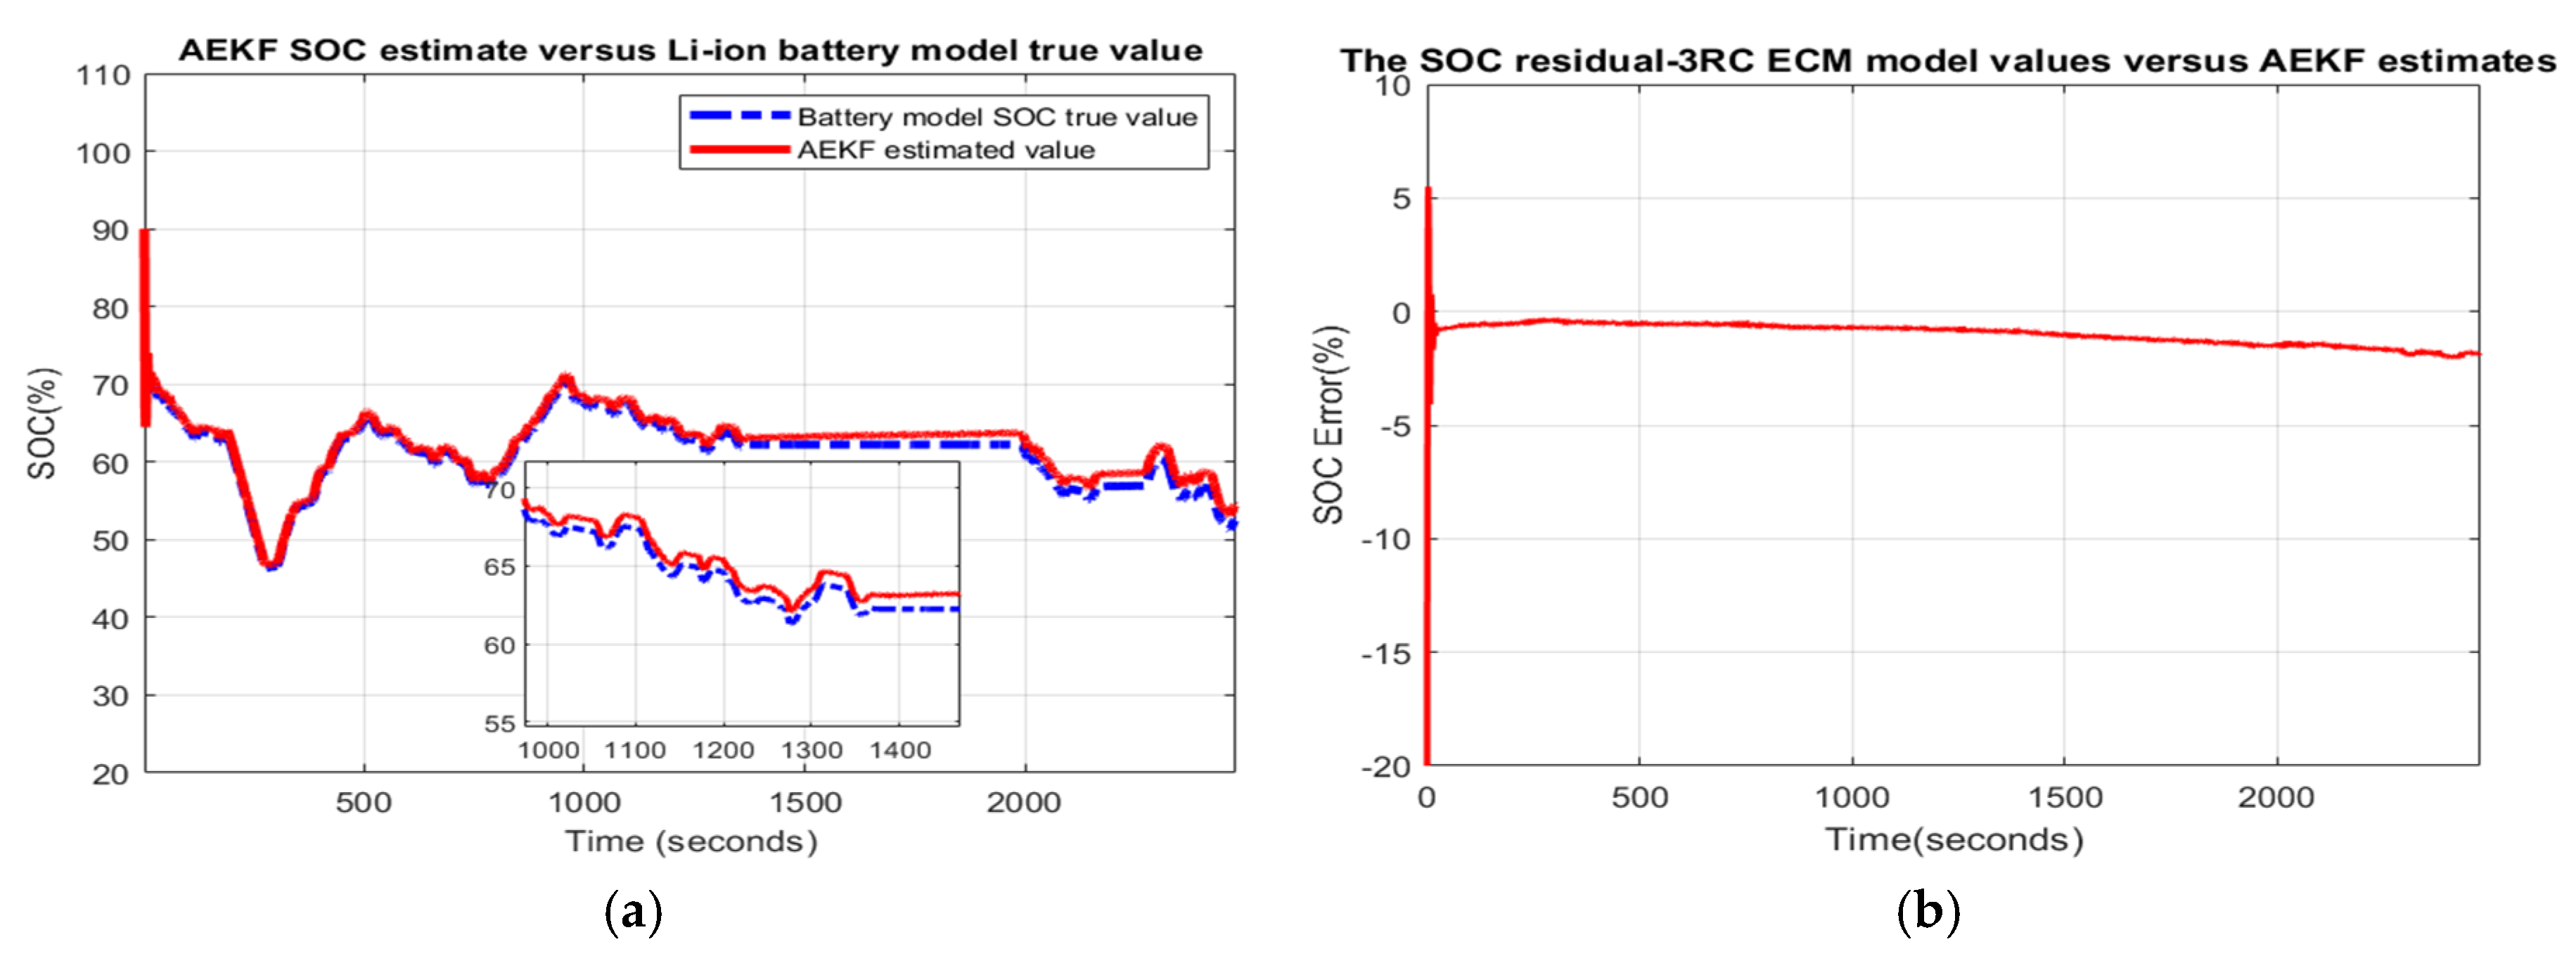
  • Scenario R4: The MATLAB simulation results for the fourth scenario are shown in Figure 3 and the statistical criteria values are given in Appendix A.2, Table A4.
    Performance analysis:
    The SOC accuracy is bad and the robustness to temperature effects is bad.
    The steady-state residual error converges to −18%, which is a bad performance.

3.1.2. MATLAB Implementation and Simulation Results for Simulink Simscape Battery Model—Accuracy and Robustness Scenarios

  • Scenario R0. The MATLAB simulation results for this scenario are depicted in Appendix A.1, Figure A15a–c, and the statistical criteria values are given in Table 1.
    Performance analysis:
    SOC accuracy is excellent and battery output voltage prediction is great.
    The residual error is quite close to 0.4%, which is very good result.
  • Scenario R1. The MATLAB simulation results for first scenario are exposed in Appendix A.1, Figure A16a–c, and the statistical criteria values are given in Appendix A.2, Table A1.
    Performance analysis:
    SOC accuracy is excellent and the robustness to changes in the SOCini is great.
    The residual error has some variations near the origin but is quite close to zero in steady state, which is very good result.
  • Scenario R2. The MATLAB simulation results for the second scenario are visible in Figure 4 and statistical criteria values are given in Appendix A.2, Table A2.
    Performance analysis:
    SOC accuracy is good and robustness to ageing effects is great.
    The residual error is quite close to 2% in steady state, which is a good result
  • Scenario R3. The MATLAB simulation results for the third scenario are shown in Appendix A.1, Figure A17a–c, and the statistical criteria values are given in Appendix A.2, Table A3.
    Performance analysis:
    SOC accuracy is good and robustness to noise level is great.
    The residual error has some variations near origin and in steady state it is quite close to 2%, which is a good result.
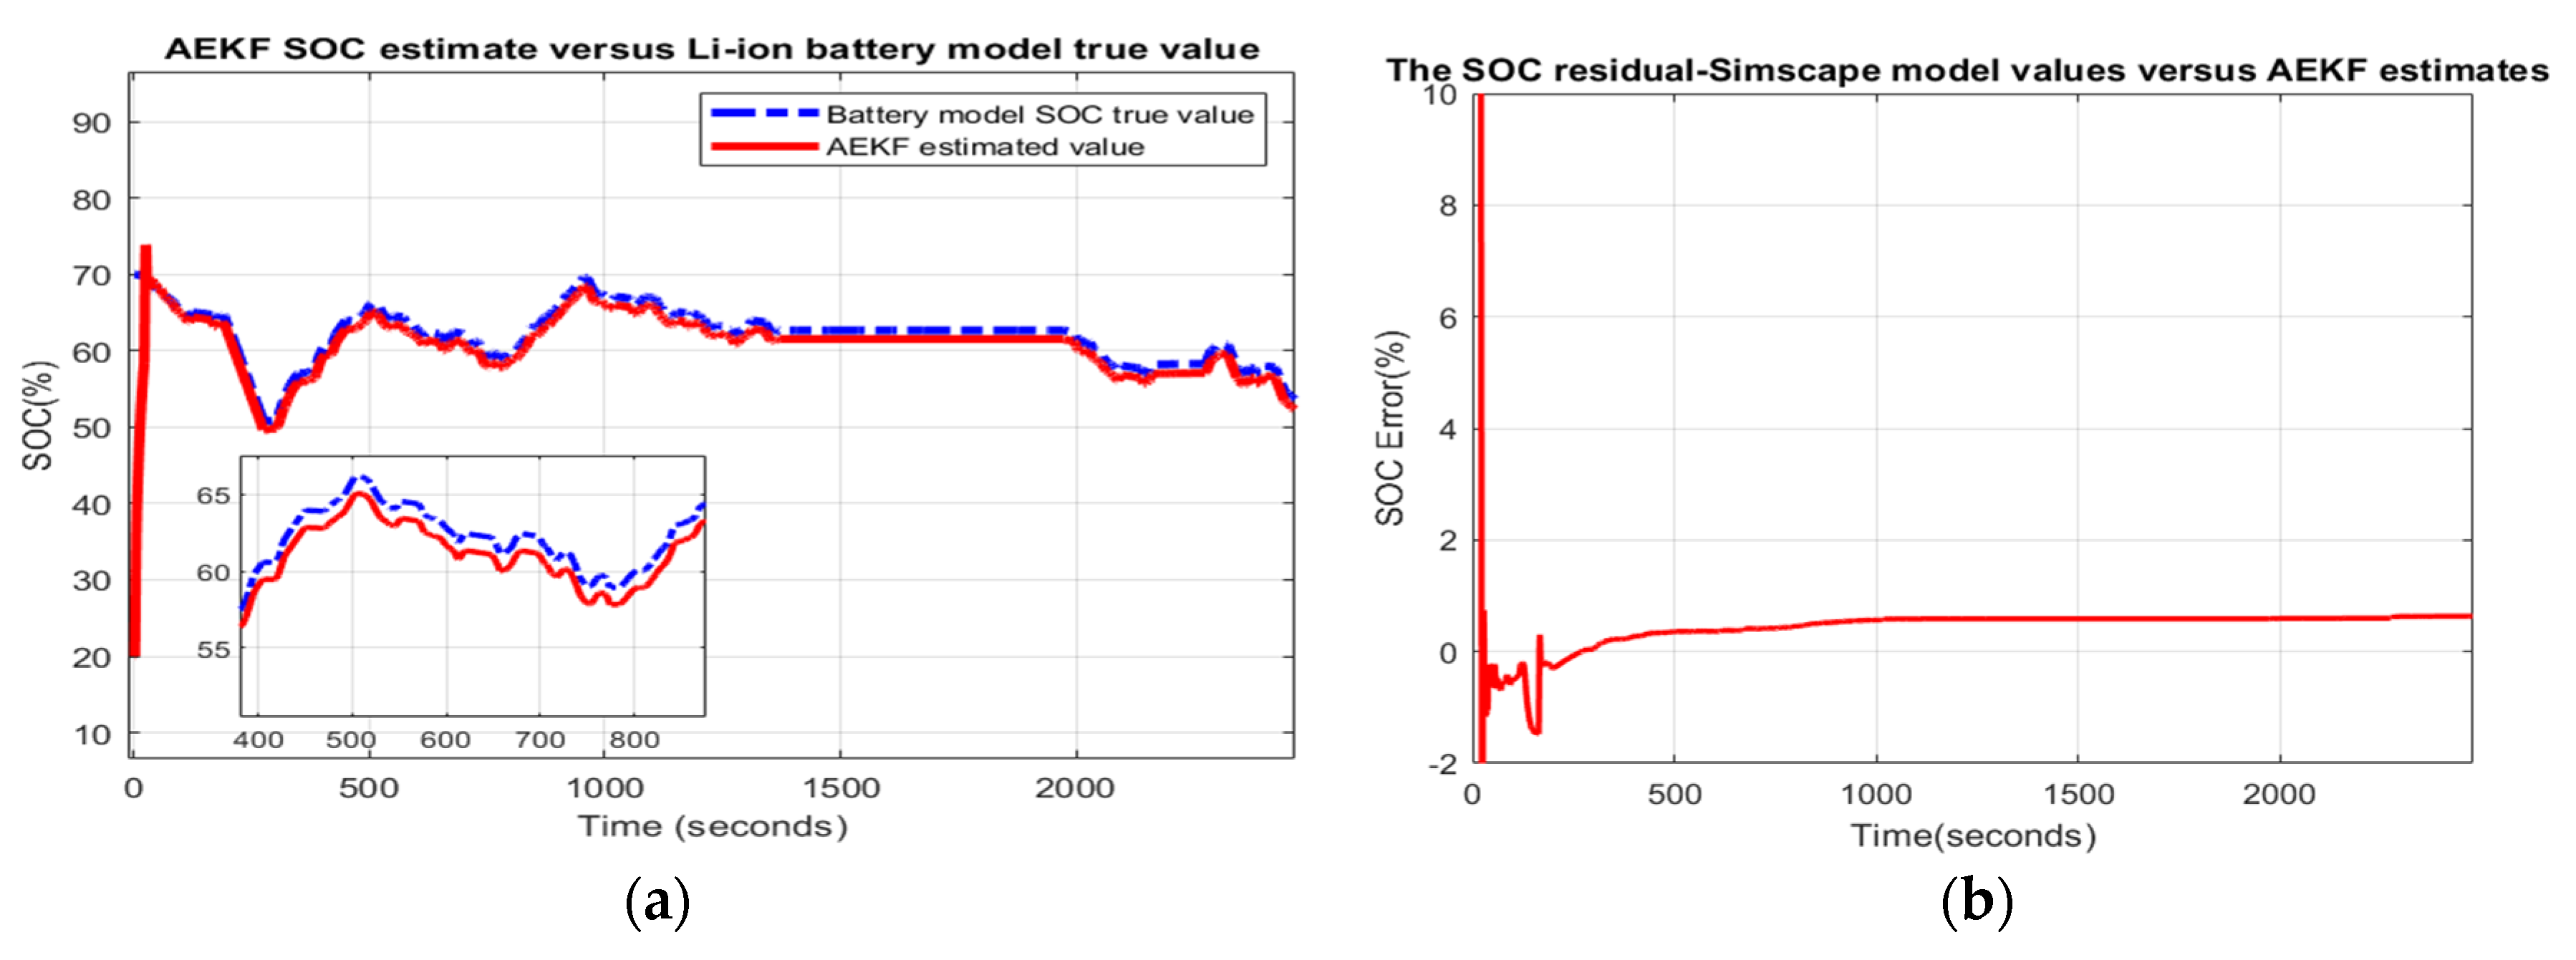
  • Scenario R4. The MATLAB simulation results for the fourth scenario are depicted in Figure 5 and the statistical criteria values are given in Appendix A.2, Table A4.
    Performance analysis:
    SOC accuracy is good and robustness to temperature effects is great.
    The residual error is quite close to 0% in steady state, which is an excellent result.
Roughly, based on the MATLAB simulation results of the AEKF SOC performance obtained for each model, both the 3RC ECM and Simscape models, it seems that the AEKF SOC estimator works better in all five scenarios based on the Simscape model.

3.2. Adaptive Unscented Kalman Filter (AUKF)

The AUKF SOC estimator [4,6,8,9] is an extremely precise algorithm, suitable for nonlinear dynamics of Li-ion battery models, compared to the AEKF SOC estimator [5,6,15,16,17,18,19], which only deals with models that have a linearized dynamic, so the calculation of Jacobian matrices is required, which is time consuming.
In the following, the steps of a general formulation of the AUKF SOC estimator that can be easily adapted to each model under investigation are presented briefly.
A standard UKF estimator is today one of the most popular estimators for states and nonlinear process parameters reported in the literature [7,12]. The AUKF SOC estimator adopted for the current research paper has the same steps as in [6]; our contribution is the adaptation of the algorithm to both the proposed Li-ion battery models, described in the previous section, and the parameter adjustment procedure for achieving an excellent accuracy for SOC.
UAKF SOC estimator algorithm steps [5,6]:
[UAKF1]. Write the battery model equations in discrete time state space representation.
1.1
The Simscape model is given by a set of two equations described in Part 1 [20], p. 20.
1.2
The 3RC ECM is given by a compact set in a matrix representation, as is shown in Part 1 [20], p. 12.
1.3
Model general formulation:
x k + 1 = f ( x k   , u k ) + q w , k .
y k = g ( x k   ,   x k ) + r v , k .
[UAKF2]. Initialization.
For   k = 0 ,   let :
x ^ 0 + = E [ x 0 ] denotes the mean of initial value (predicted value).
P x , 0 ^ + = E [ ( x 0 x ^ 0 + ) ( x 0 x ^ 0 + ) T is the state covariance matrix (predicted state).
[UAKF3]. Computation.
3.1
Generate sigma points and weighting coefficients at time k 1 ,   k = [ 1 , ¯ ]
X ˜ 0 = X ^ k 1 is the mean of the state at time k 1 .
X ˜ k 1 i = X ^ k 1 + ( ( n + λ ) P k 1 ) i ,   i = 0 , n ¯ represent the sigma points.
X ˜ k 1 j = X ^ k 1 + ( ( n + λ ) P k 1 ) j n ,   j = n + 1 , 2 n ¯ are the sigma points.
W m ( 0 ) = λ n + λ mean   weights .
W c ( 0 ) = λ n + λ + 1 α 2 + β   denote   the   covariance   weights .
W m ( i ) = W c ( i ) = λ 2 ( n + λ )   are   the   mean   and   covariance   weights .
[UAKF4]. Prediction phase (Forecast):
For   k = [ 1 , n ] ¯ ,   compute :
4.1
State estimate time update:
X ˜ k | k 1 i = f ( X ^ k | k 1 i , u k ) is the prediction state vector (passing sigma points through function f (.,.)).
x ^ k 1 = i = 0 2 n W m ( i ) X ˜ k | k 1 i designates the state estimate at time k − 1.
P x , k | k 1 = i = 0 2 n W c ( i ) [ X ˜ k | k 1 i x ^ k 1 ] [ X ˜ k | k 1 i x ^ k 1 ] T denotes the prediction covariance matrix.
Y k | k 1 i = g ( X ^ k | k 1 i , u k ) are the output sigma points (passing sigma points through output function g(.,.)).
y ^ k 1 = i = 0 2 n W m ( i ) Y k | k 1 i is the output mean estimate.
[UAKF5]. Correction update phase (analysis):
5.1
Update the covariance output matrix and cross-covariance matrix.
P y , k = i = 0 2 n W c ( i ) [ Y k | k 1 i y ^ k 1 ] [ Y k | k 1 i y ^ k 1 ] T .
P x y , k = i = 0 2 n W c ( i ) [ X ˜ k | k 1 i x ^ k 1 ] [ Y k | k 1 i y ^ k 1 ] T is the cross-covariance x-y.
5.2
Compute the Kalman filter gain:
K k = P x y , k P y , k 1 .
5.3
State estimate update:
x ^ k =   x ^ k | k 1 + K k ( y k y ^ k | k 1 ) .
5.4
State covariance matrix estimate update:
P k =   P x , k | k 1 K k P y , k K k T .
[UAKF 6]. Correction measurement covariance matrices of noises:
6.1
Compute the output error:
ε k = y k g ( x ^ k , u k ) .
6.2
Compute the adjustment coefficient:
c k = 1 L i = k L + 1 k ε k ε k T L is the window length (number of samples inside the window).
6.3
Compute the covariance matrix of process noise:
q w , k = K k c k K k T .
6.4
Compute the covariance matrix of the measurement noise:
r v , k = c k + i = 0 2 n W c ( i ) [ Y k | k 1 i y k + c k ] [ Y k | k 1 i y k + c k ] T .
For a better understanding of this algorithm, references [6,7,8,9] provide an excellent source of documentation.
The following two sets of tuned parameter values are used in MATLAB simulations for this algorithm:
  • For the 3RC ECM Li-ion battery model: α = 0.05; β = 2 (optimal value); k = −1; L = 150; qw = I4×4(unity matrix); rv = 0.1; Px = 10−10 I4x4; SOCini = 70 (%); VarY = 0.001 (the variance of the noise level in the measurement output dataset used to test the robustness); η = 0.78 for charging cycle; and η = 0.9 for discharging cycle.
  • For the Li-ion battery Simscape model: α = 1; β = 2 (optimal value); k = 0; L = 300; qw = 0.0001; rv = 0.00019; Px = 10−10; SOCini = 70 (%); VarY = 0.001; η = 0.765 for charging cycle; and η = 0.865 for discharging cycle.

3.2.1. MATLAB Implementation and Simulation Results for 3RC ECM Battery Model-AUKF SOC Estimator Accuracy and Robustness Scenarios

  • Scenario R0. The MATLAB simulation results are shown in Appendix A.1, Figure A18a–c, and the statistical criteria values are given in Table 1.
    Performance analysis:
    SOC accuracy is great and battery output voltage prediction is excellent.
    The residual error is quite close to 0.6%, which is an excellent result.
  • Scenario R1. The MATLAB simulations result are shown in Appendix A.1, Figure A19a,b, and the statistical criteria values are given in Appendix A.2, Table A1.
    Performance analysis:
    SOC of high accuracy.
    The residual error is quite close to 0.5%, which is an excellent result.
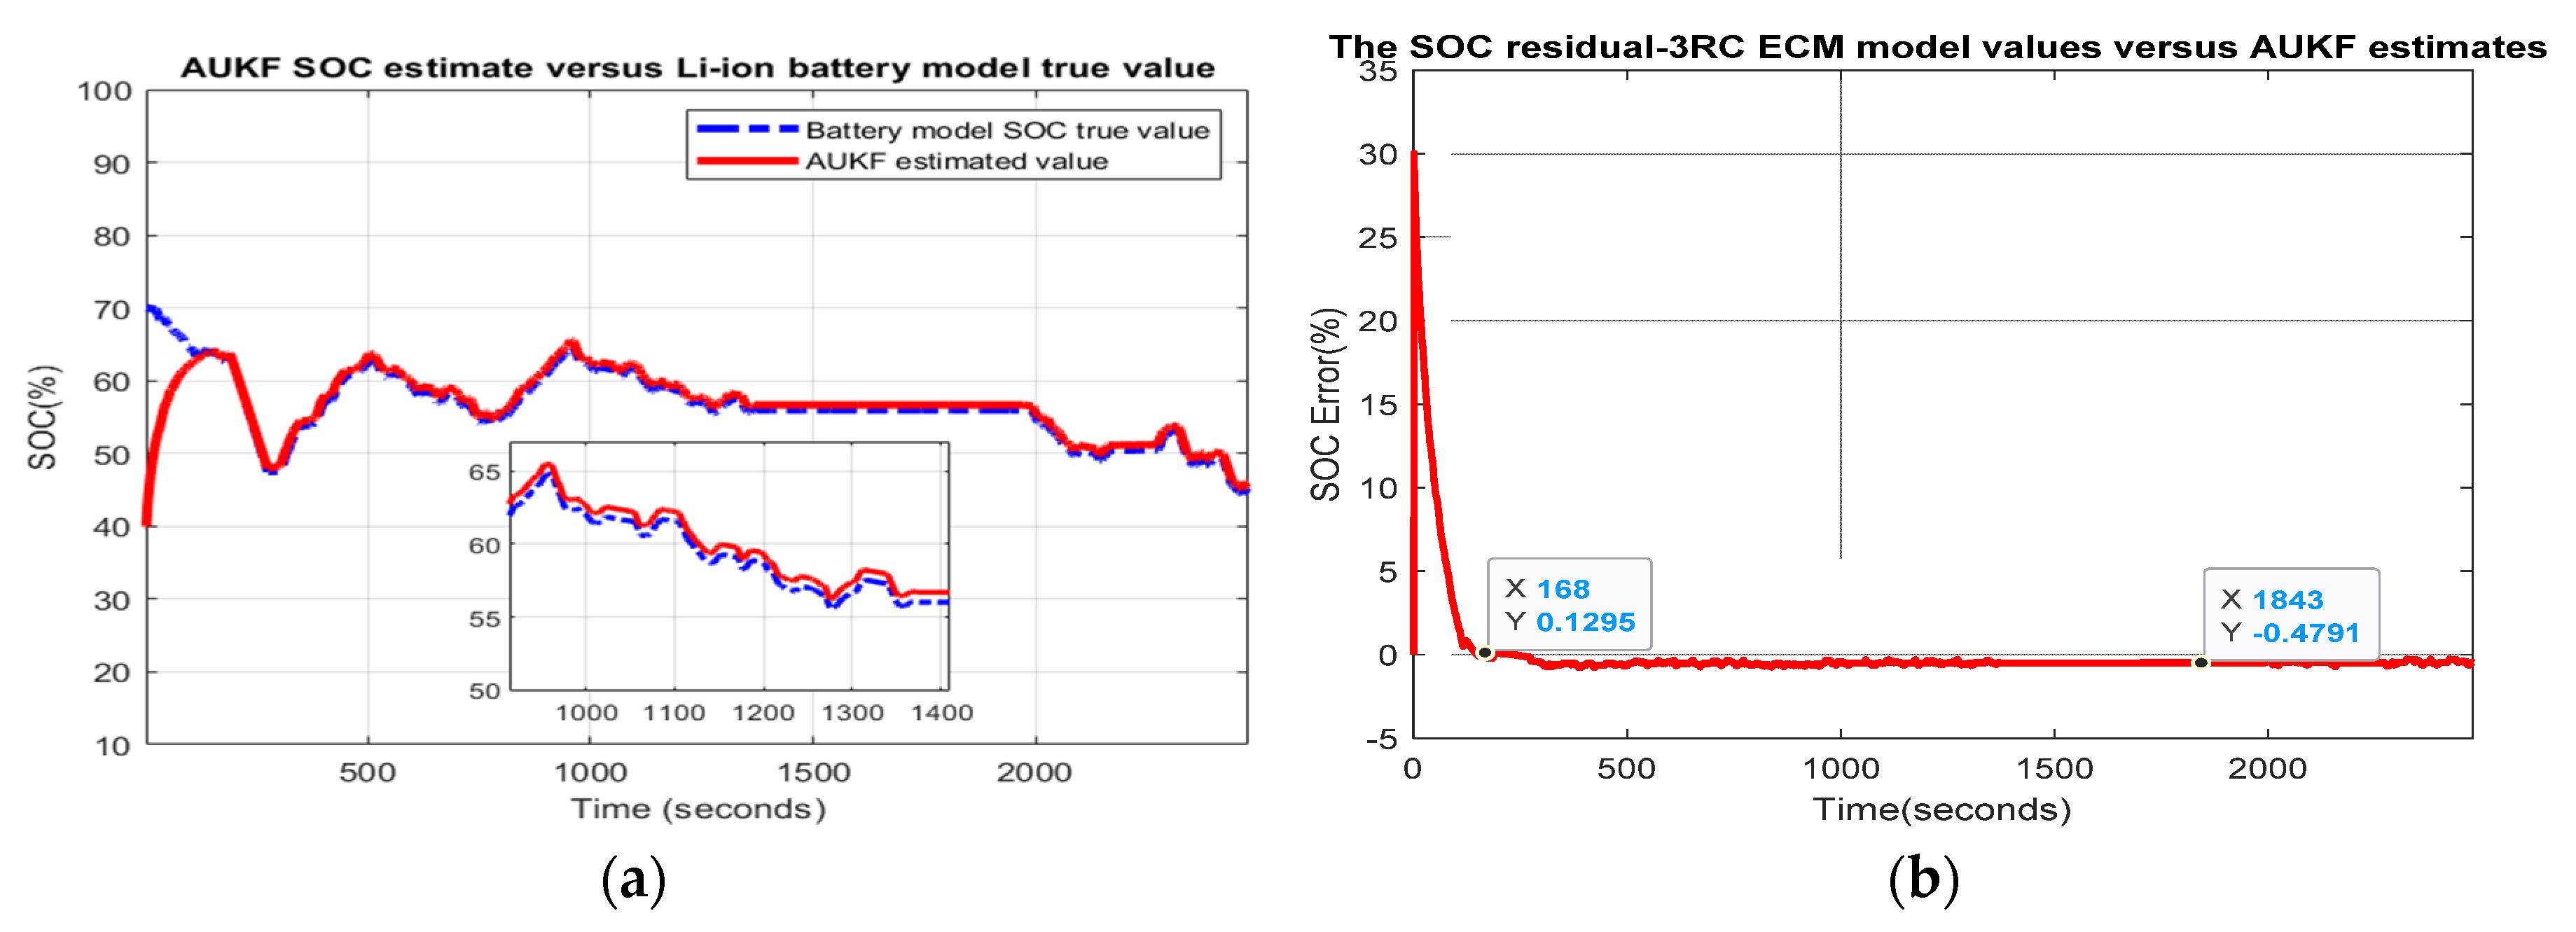
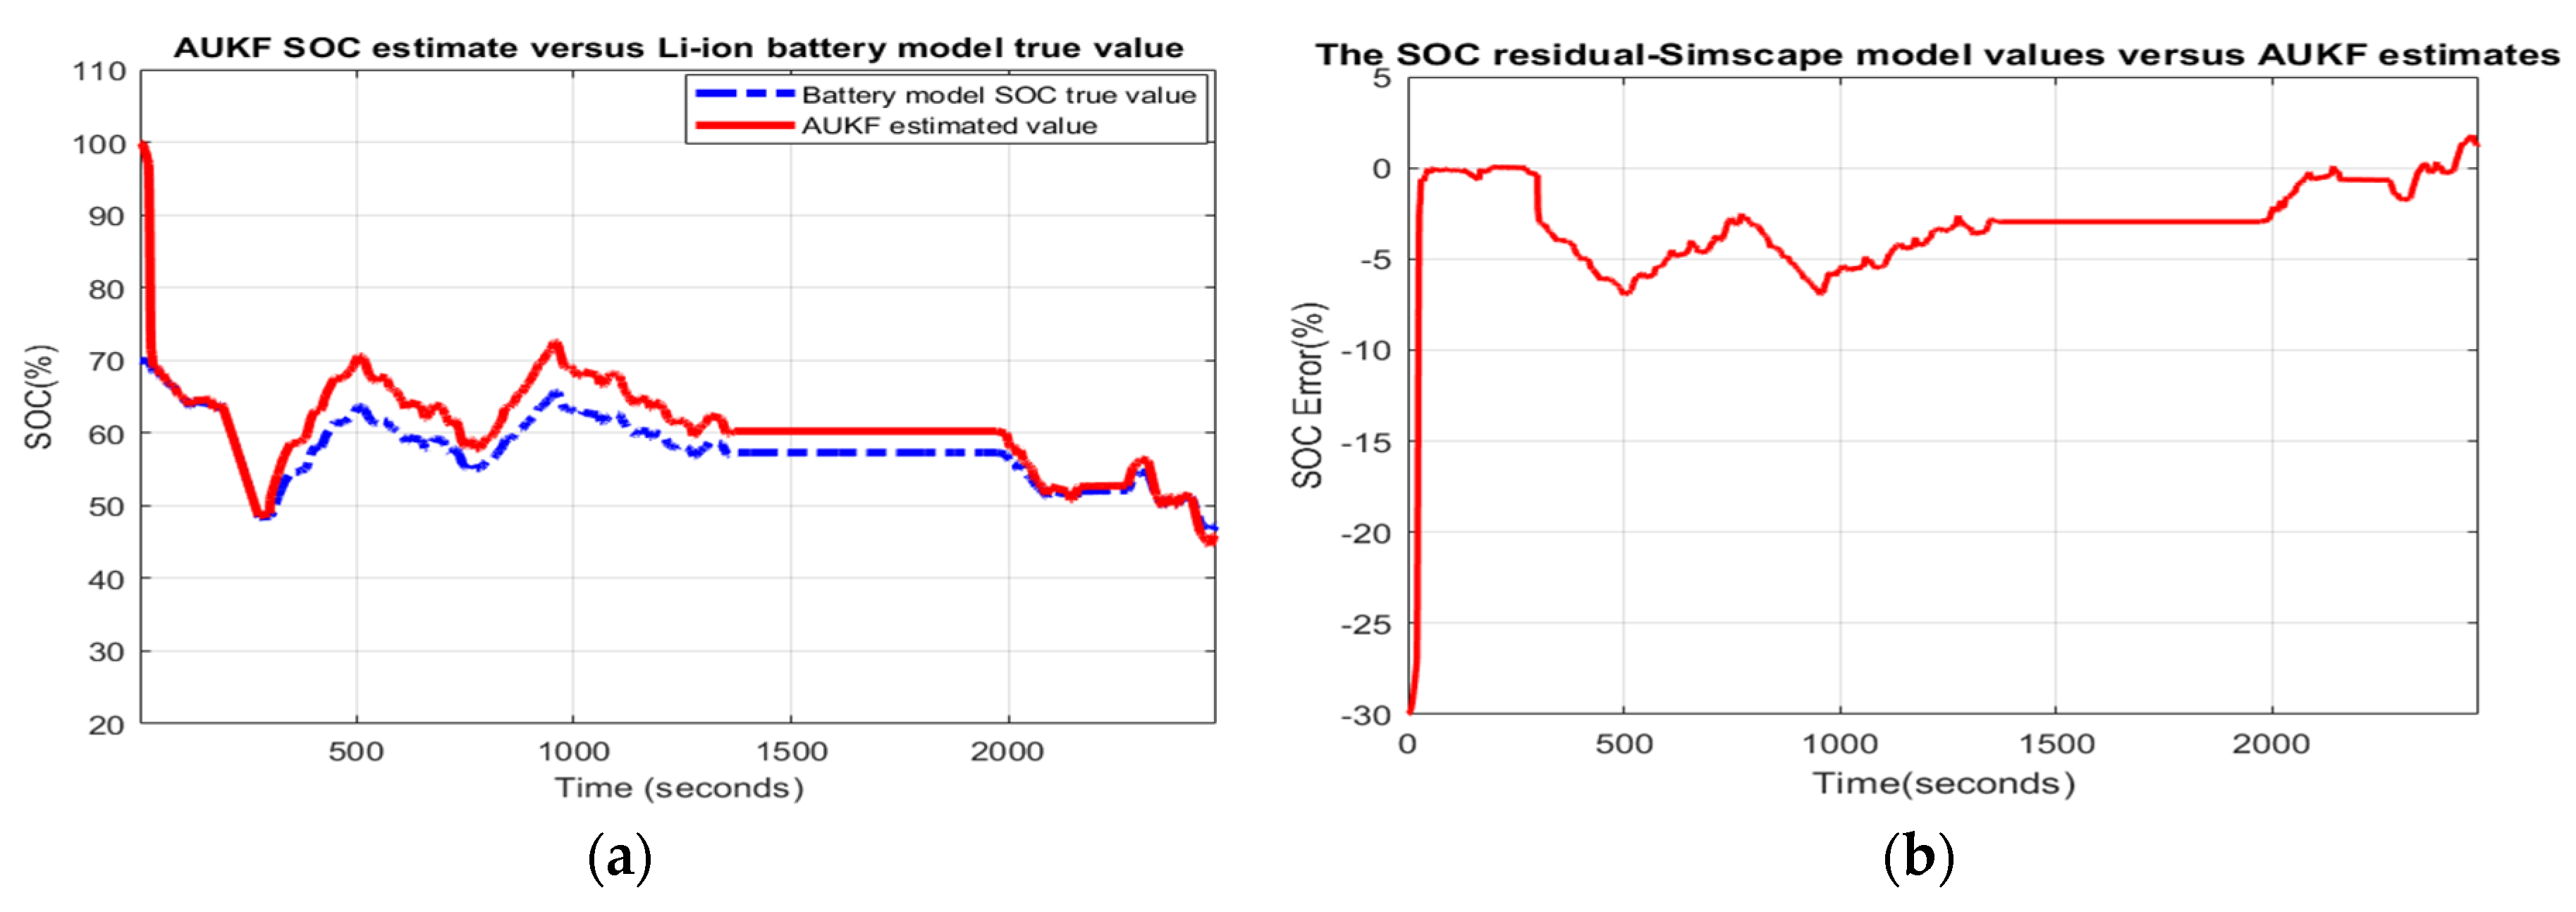
  • Scenario R2. The MATLAB simulation results are shown in Figure 6, and statistical criteria values are given in Appendix A.2, Table A2.
    Performance analysis:
    SOC accuracy is good.
    The residual error is quite close to 5%, which is a weak performance.
  • Scenario R3. The MATLAB simulation results are shown in Appendix A.1, Figure A20a–c, and the statistical criteria values are given in Appendix A.2, Table A3.
    Performance analysis:
    SOC accuracy is great.
    The residual error is quite close to 0.48%, which is excellent.
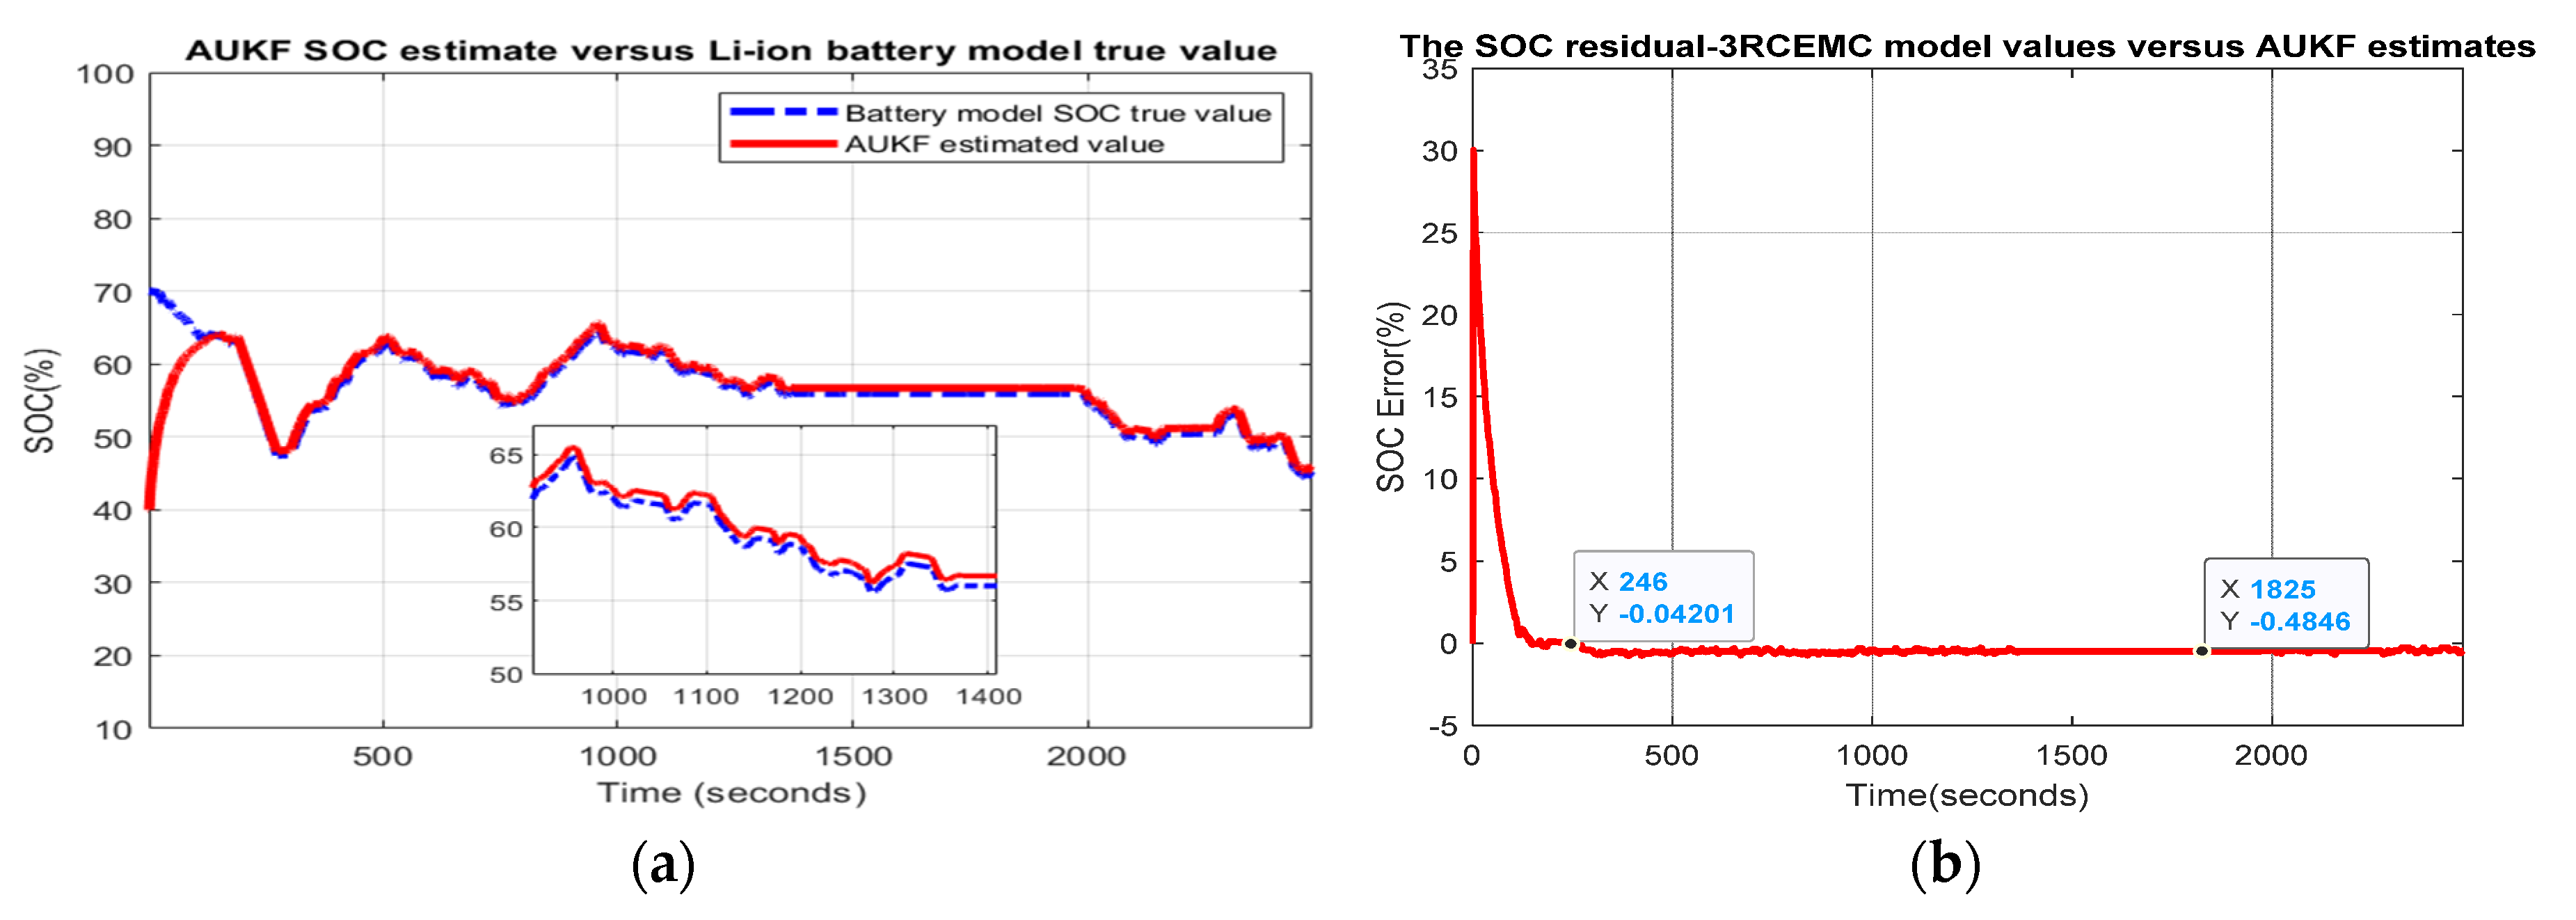
  • Scenario R4. The MATLAB simulations result for fourth scenario is depicted in Figure 7a,b and the statistical criteria values are given in Appendix A.2, Table A4.
    Performance analysis:
    SOC accuracy is great.
    The residual error is quite close to zero in steady state, so an excellent result.

3.2.2. MATLAB Implementation and Simulation Results for Simulink Simscape Battery Model—AUKF SOC Estimator Accuracy and Robustness Scenarios

  • Scenario R0. The MATLAB simulation results for this scenario are shown in Appendix A.1, Figure A21a–c, and the statistical criteria values are given in Table 1.
    Performance analysis:
    SOC accuracy is great and battery output voltage prediction is excellent.
    The residual error is quite close to 2%, which is a great result.
  • Scenario R1. The MATLAB simulation results for the first scenario are depicted in Appendix A.1, Figure A22a–c, and the statistical criteria values are given in Appendix A.2, Table A1.
    Performance analysis:
    SOC accuracy is great.
    The residual error is quite close to 2%, which is an excellent result.
  • Scenario R2. The MATLAB simulation results for the second scenario are visible in Figure 8 and statistical criteria values are given in Appendix A.2, Table A2.
    Performance analysis:
    SOC accuracy is good.
    The residual error is quite close to 7%, which is a bad result.
  • Scenario R3. The MATLAB simulation results for third scenario are shown in Appendix A.1, Figure A23a–c, and the statistical criteria values are given in Appendix A.2, Table A3.
    Performance analysis:
    SOC accuracy is great.
    The residual error is quite close to 1%, which is excellent.
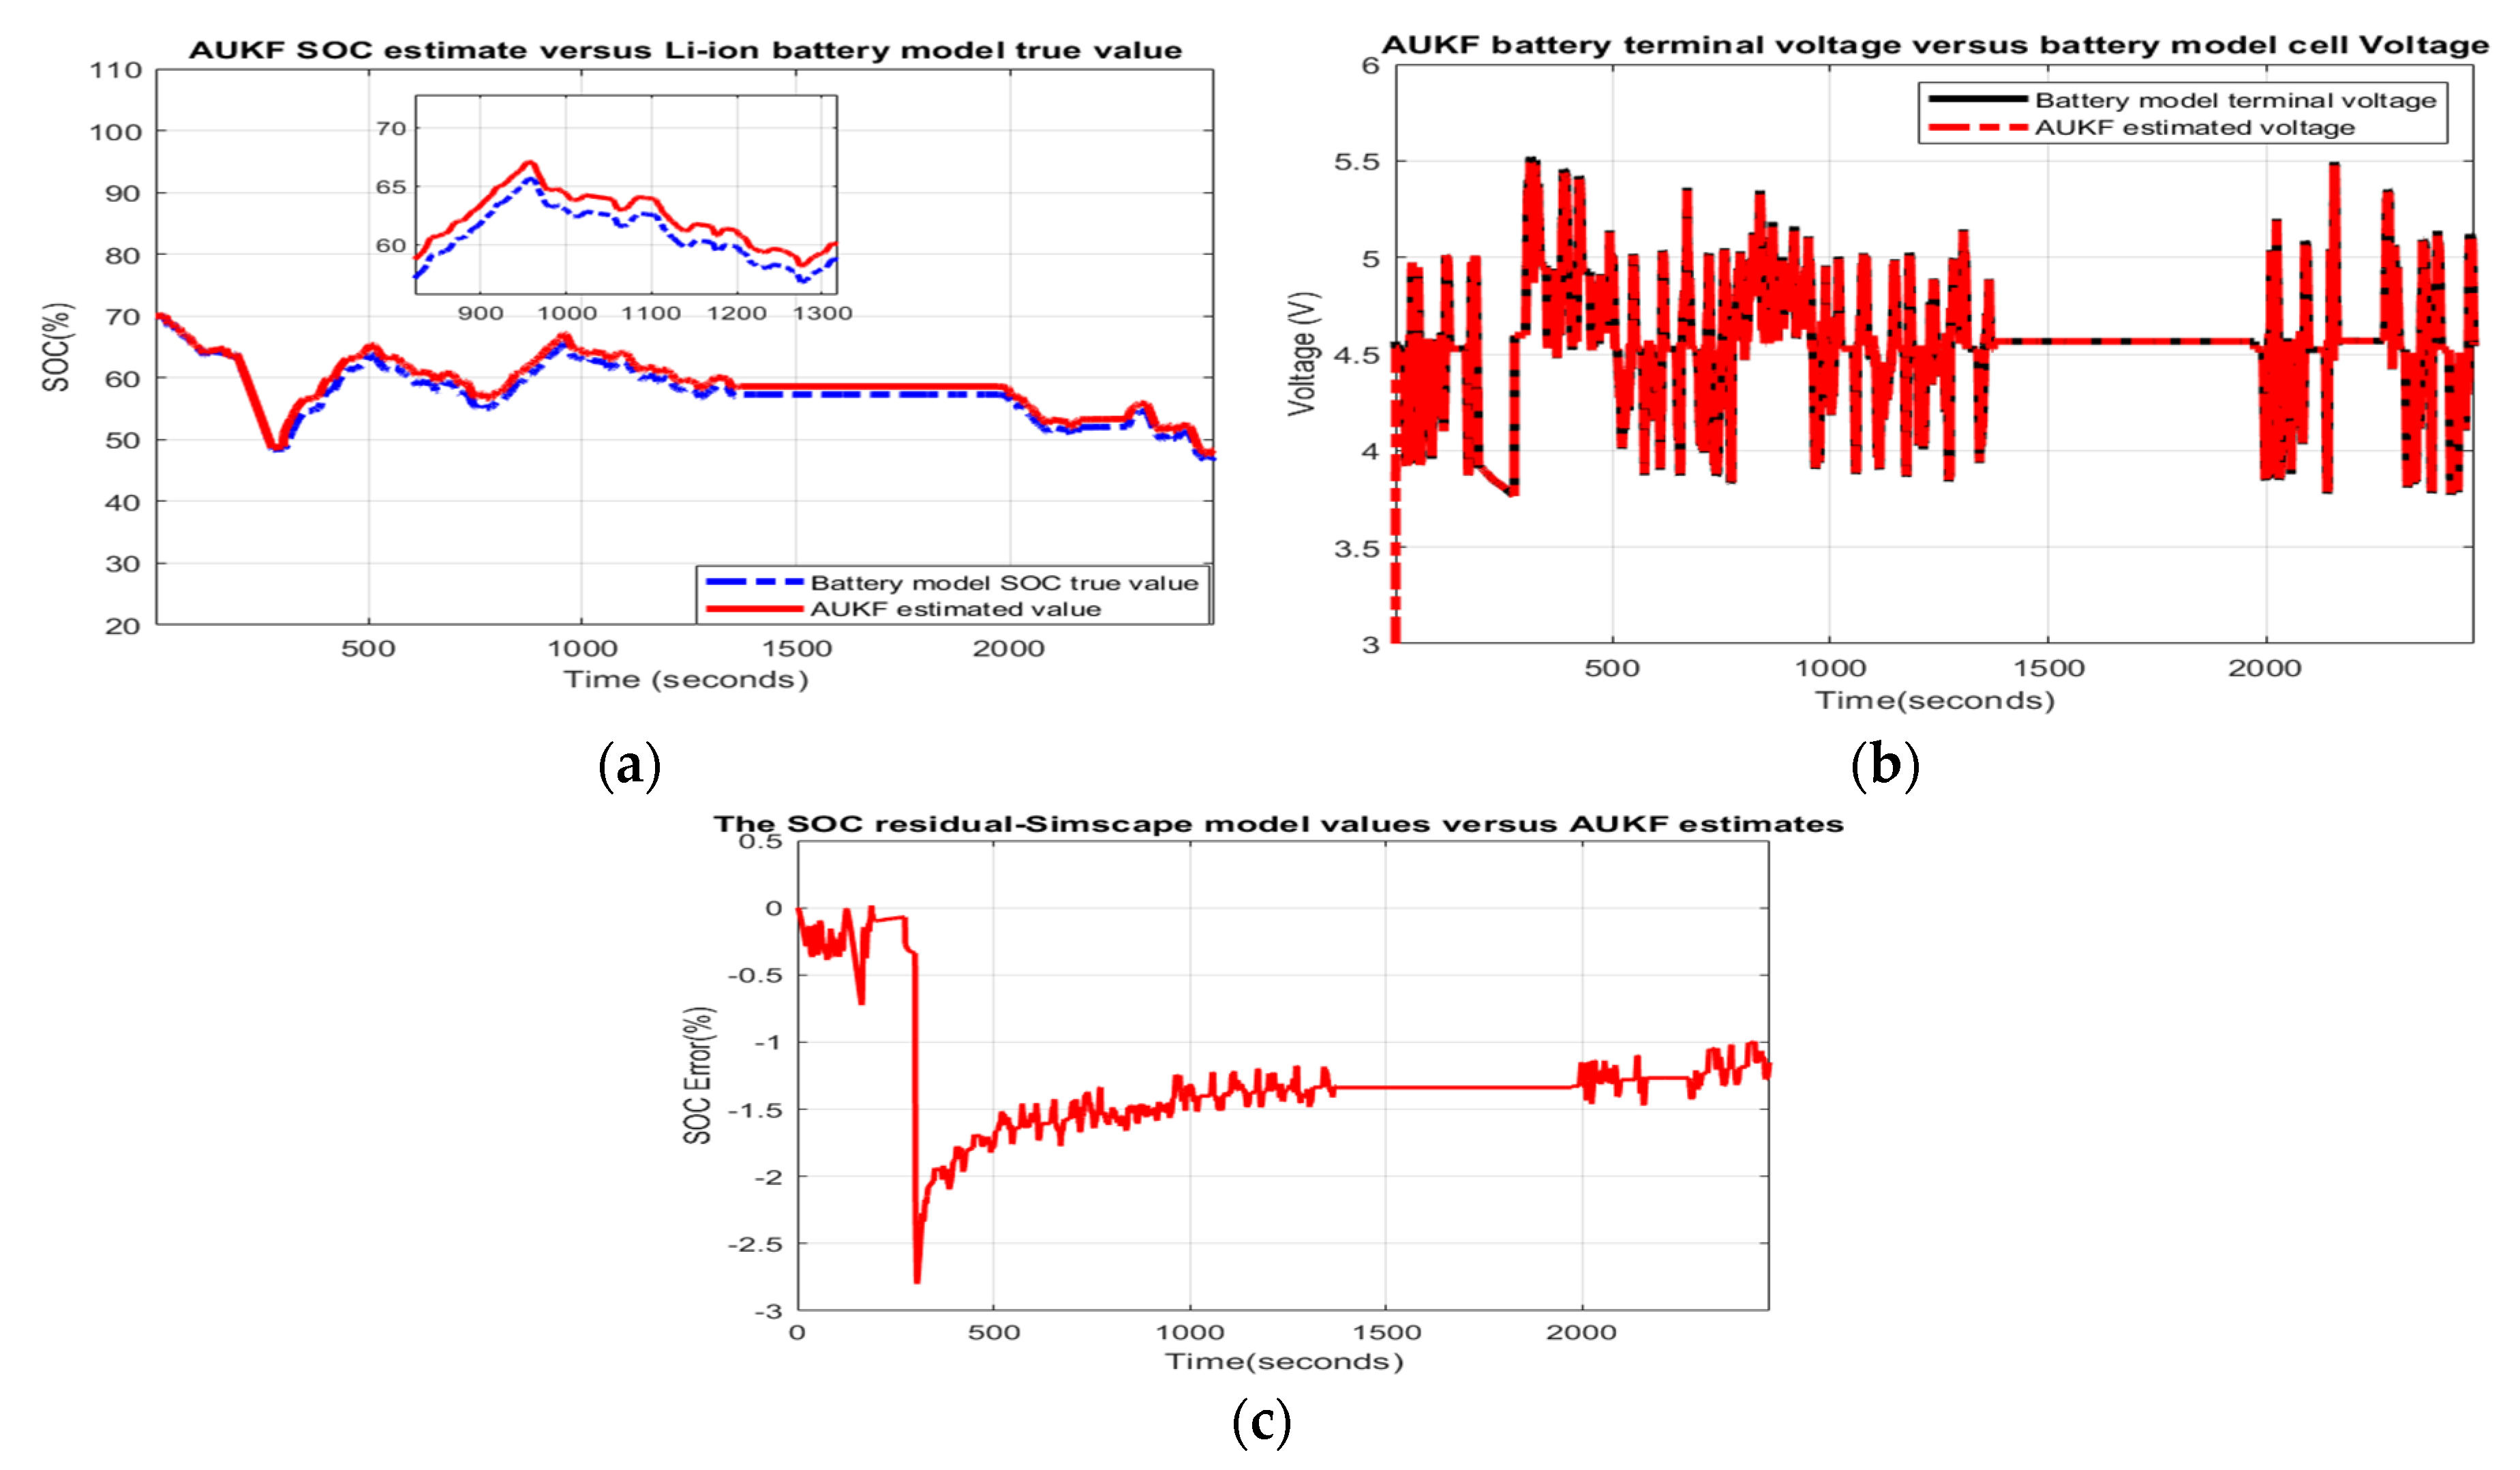
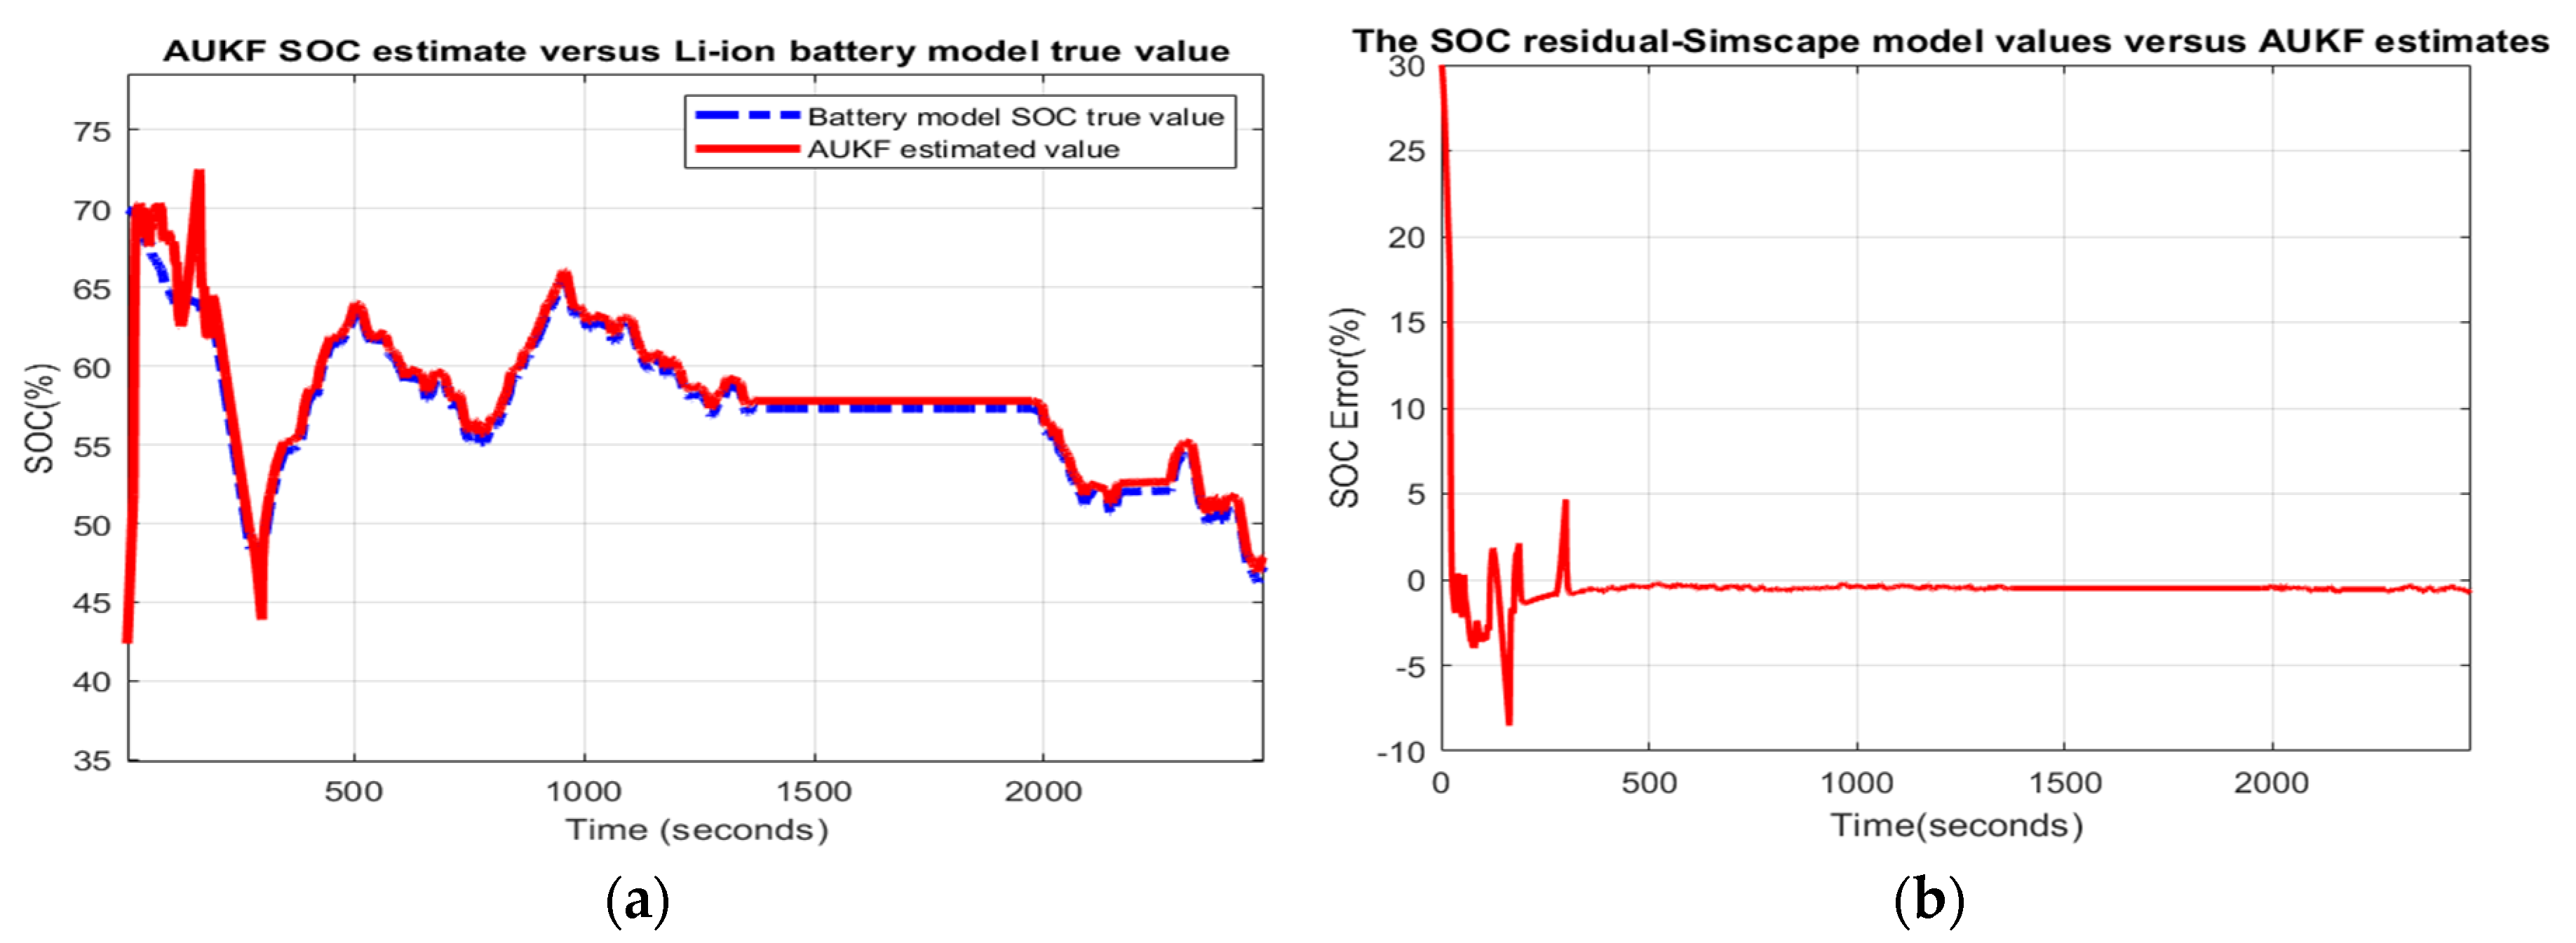
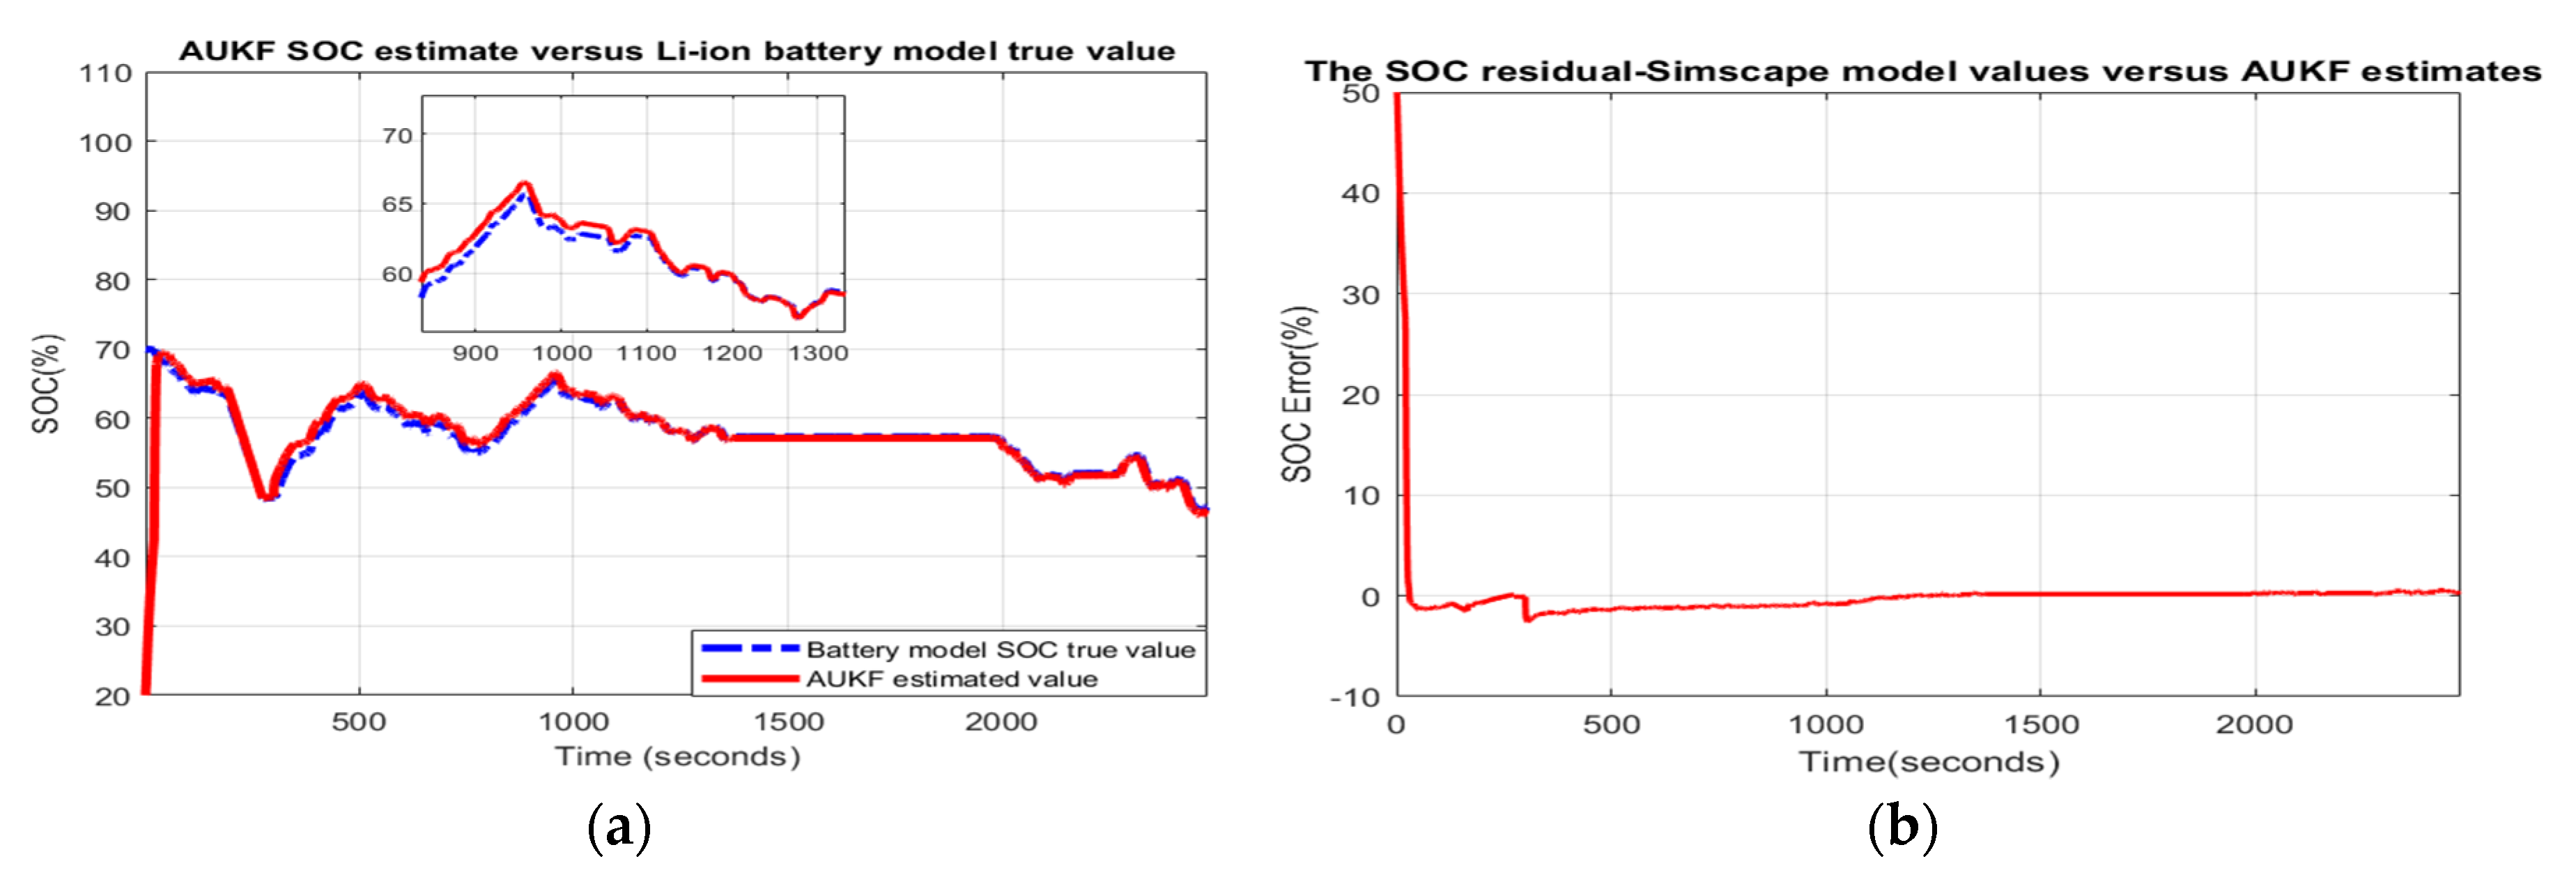
  • Scenario R4. The MATLAB simulation results for the fourth scenario are depicted in Figure 9 and the statistical criteria values are given in Appendix A.2, Table A4.
    Performance analysis:
    SOC accuracy is great.
    The residual error is quite close to 1.2%, so is excellent.
In general, based on the MATLAB simulation results of AUKF SOC performance obtained for each model, it is relevant that the AUKF SOC estimator works well in four scenarios. The simulations from the second scenario (R2) reveal that AUKF is more sensitive to the effects of ageing in both models, so it is difficult to distinguish at this stage. The values of the statistical criteria can provide sufficient information to make a correct delimitation.

3.3. Particle Filter SOC Estimator

In this section, a second nonlinear SOC estimator, namely PFE SOC, is chosen to achieve a high precision SOC for both models of Li-ion batteries, which makes possible a complete, relevant and credible analysis of the performance of all three SOC estimators proposed in our research. It is used “to estimate the states, which approximate the probability density function of a non-linear, non-Gaussian system by using the Monte-Carlo simulation technique”, as is mentioned in [11].

3.4. PFE SOC Brief Presentation

There is a substantial similarity between the non-linear estimator PFE SOC [10,11] and the first two SOC estimators presented in the previous subsections, i.e., AEKF SOC and AUKF SOC, due to the same “prediction-corrector” structure identified in all three. Therefore, it is easy to anticipate that the PFE SOC estimator updates in a “recursively way” the state estimate and then finds the innovations driving a stochastic process based on a sequence of observations (measurement output dataset), as is shown in detail in the original work [11]. In [11] it is stated that the PFE SOC estimator accomplishes this objective by “a sequential Monte Carlo method (bootstrap filtering), a technique for implementing a recursive Bayesian filter by Monte Carlo simulations”, which is also mentioned in [4]. After the initialization stage of the algorithm, in the second stage (i.e., “the prediction phase”), the state estimates of the process are used to predict and to “smooth” the stochastic process. As a result of the prediction, innovations are useful for estimating the parameters of the linear or nonlinear dynamic model [4,11]. The basic idea disclosed in [4] is that any probability distribution function (pdf) of a random state variable x can be approximated by a set of samples (particles), similar to what sigma points do in the AUKF SOC estimator developed in Section 3.2. Each particle has one set of values for each process state variable x. The novelty of the PFE SOC estimator is its ability to represent any arbitrary pdf, even if for non-Gaussian or multi-modal pdfs [4,11]. In conclusion, the nonlinear design of the SOC PFE estimator has a similar approach to that of the AUKF SOC design, as long as a local linearization technique is not required, as in the case of AEKF SOC, or “any raw functional approximation” [4,11]. Furthermore, the PFE SOC “can adjust the number of particles to match available computational resources, so a trade-off between accuracy of estimate and required computation” [11]. Moreover, it is “computationally compliant even with complex, non-linear, non-Gaussian models, as a trade-off between approximate solutions to complex nonlinear dynamic model versus exact solution to approximate dynamic model” [11]. To get a better insight into this estimation technique, the original paper [11] can be accessed. Since, the current research work follows the same PFE design procedure steps as in [11], our focus is directed only at the implementation aspects.

3.5. PFE SOC Parameters’ Setup

The following two sets of tuned parameter values are used in MATLAB simulations for this algorithm:
  • For the 3RC ECM Li-ion battery model: Np = 1000 (total number of particles); qw = 10−6I4×4 (I4×4 is a 4×4 identity matrix) in scientific notation (process state variables noise covariance matrix); rv = 0.0001 (measurement output noise); SOCini = 70 (%); VarY = 0.001 (variance of the noise level in the measurement output dataset used to test the robustness); VarX1 = VarX2 = VarX3 = VarX4 = 0.01 (variance in the initial values of the states variables); η = 0.8 for charging cycle; and η = 0.82 for discharging cycle.
  • For the Li-ion battery Simscape model: Np = 1000 (total number of particles); qw =10−7 for SOC covariance noise; rv = 0.0001 (measurement output noise level); SOCini = 70 (%); VarY = 0.001 (the variance of the noise level in the measurement output dataset used to test the robustness); VarX1 = 0.004 (variance in SOCini); η = 0.76 for charging cycle; and η = 0.78 for discharging cycle.

3.6. MATLAB Simulation Results for 3RC ECM Battery Model—PFE SOC Estimator Accuracy and Robustness Scenarios

  • Scenario R0. The MATLAB simulation results for this scenario are shown in Appendix A.1, Figure A24a–c, and the statistical criteria values are given in Table 1.
    Performance analysis:
    SOC accuracy is good and battery output voltage prediction is good.
    The residual error is quite close to 8%, which is weak.
  • Scenario R1. The MATLAB simulation results for the first scenario are shown in Appendix A.1, Figure A25a–c, and the statistical criteria values are given in Appendix A.2, Table A1.
    Performance analysis:
    SOC accuracy is good.
    The residual error is quite close to 10%, which is weak.
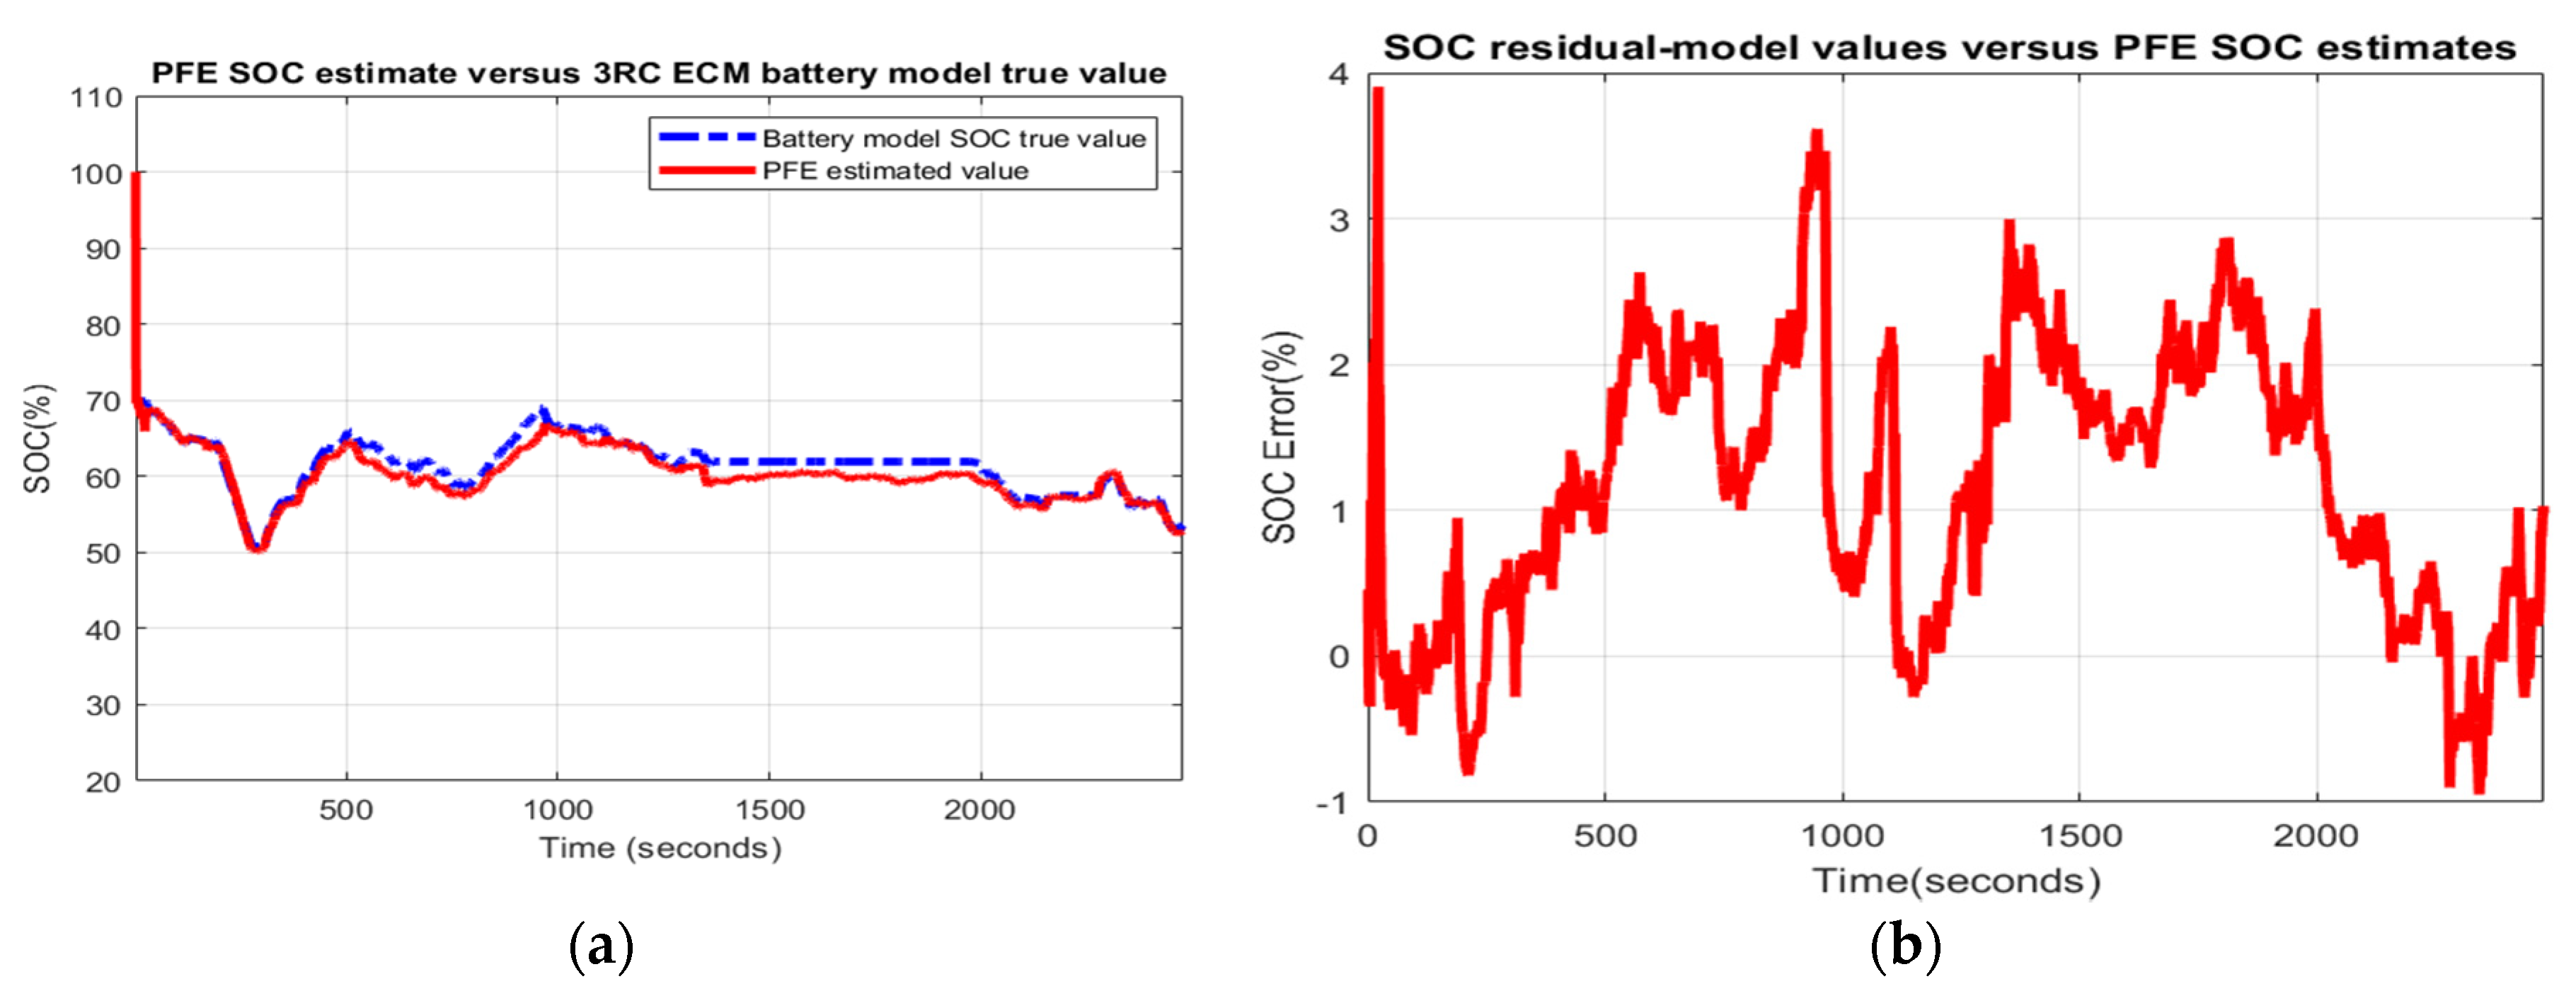
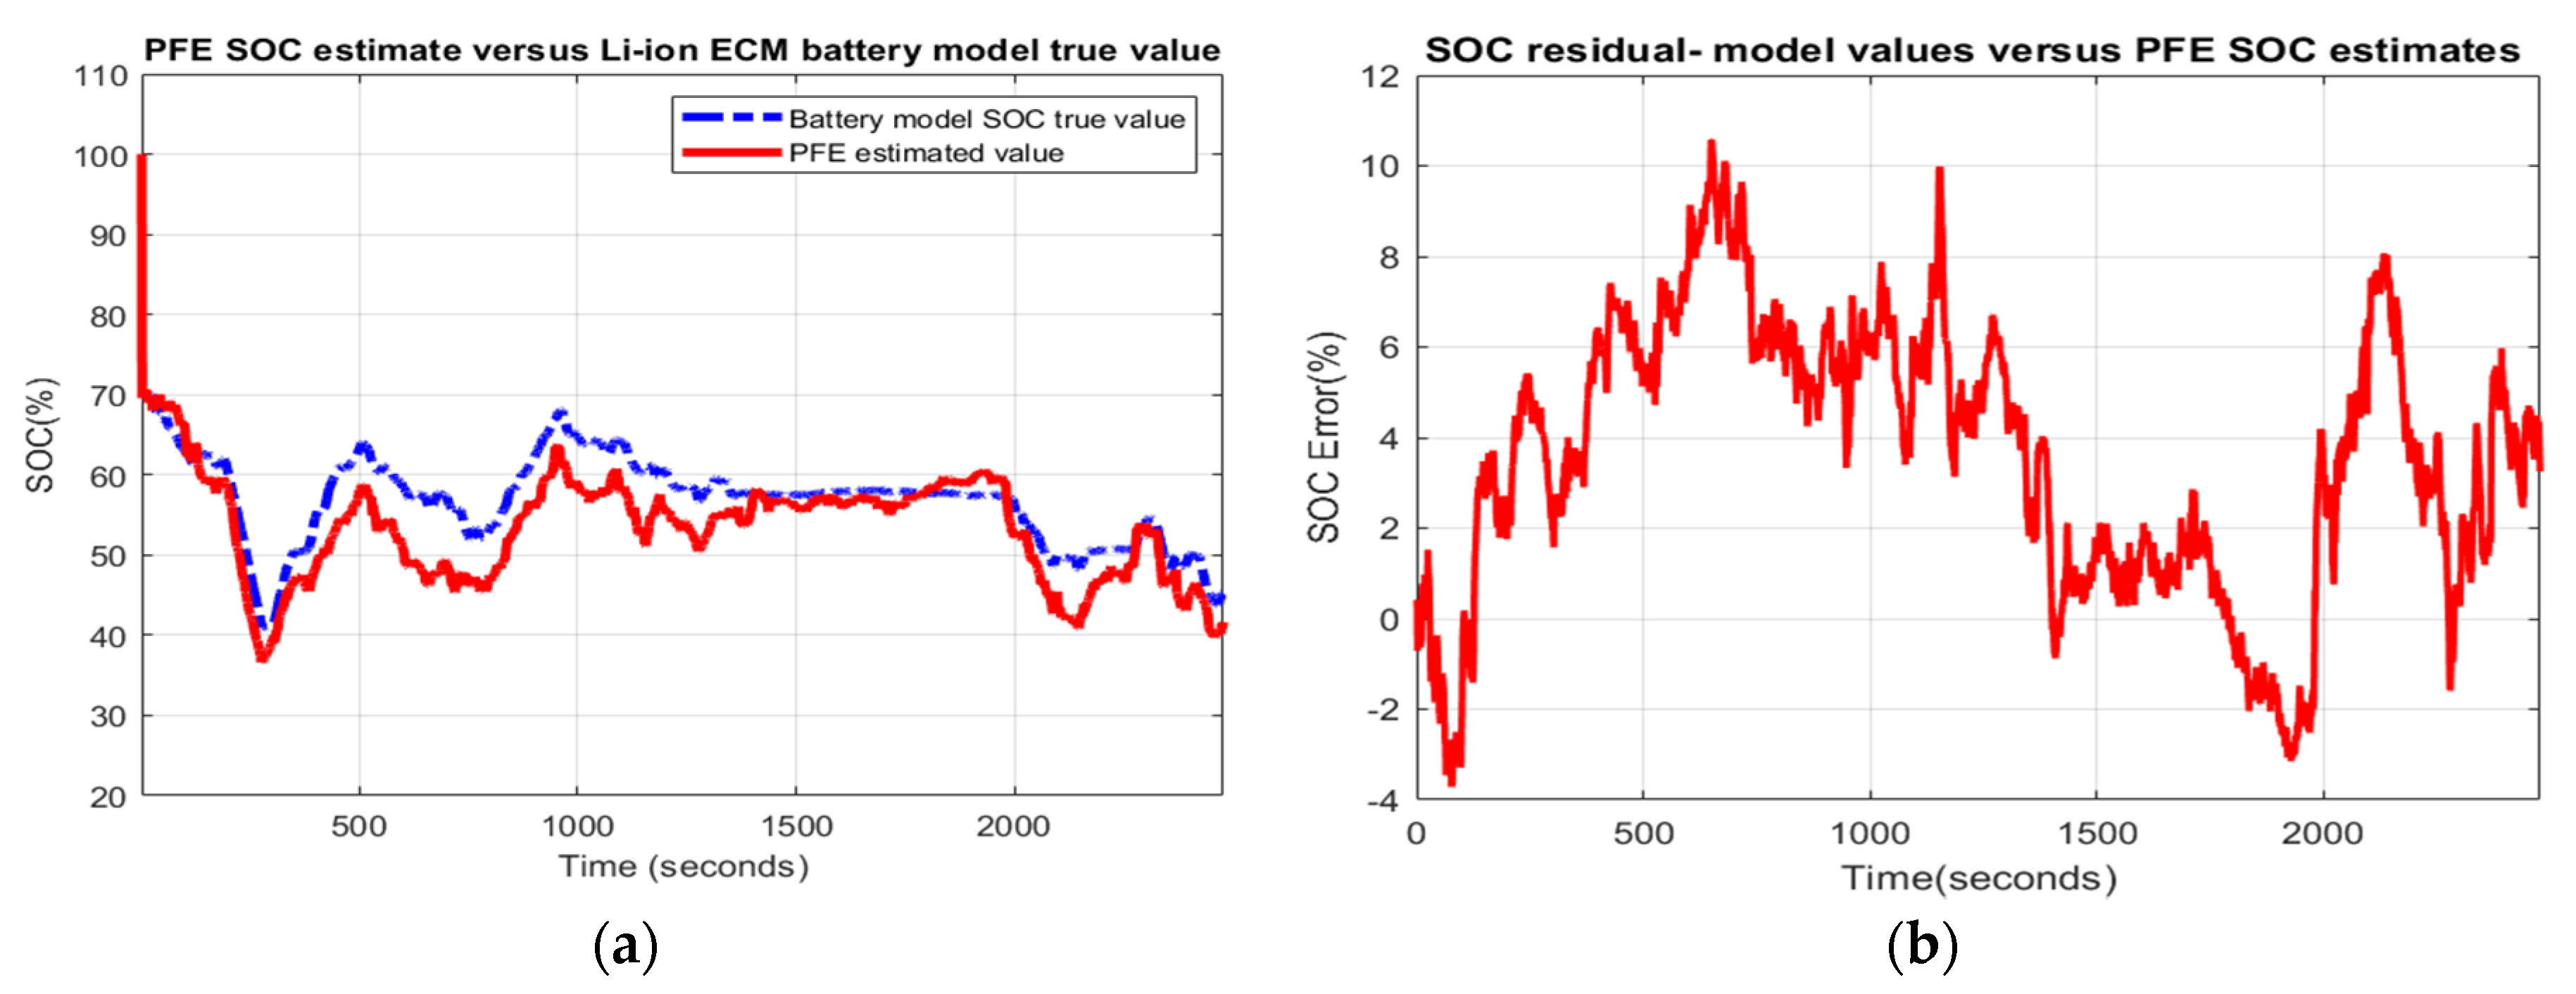
  • Scenario R2. The MATLAB simulation results for the second scenario are visible in Figure 10 and statistical criteria values are given in Appendix A.2, Table A2.
    Performance analysis:
    SOC accuracy is weak.
    The residual error is quite close to 10%, which is bad.
  • Scenario R3. The MATLAB simulation results for the third scenario are revealed in Appendix A.1, Figure A26a–c, and the statistical criteria values are given in Appendix A.2, Table A3.
    Performance analysis:
    SOC accuracy is good.
    The residual error is quite close to 4%, which is weak.
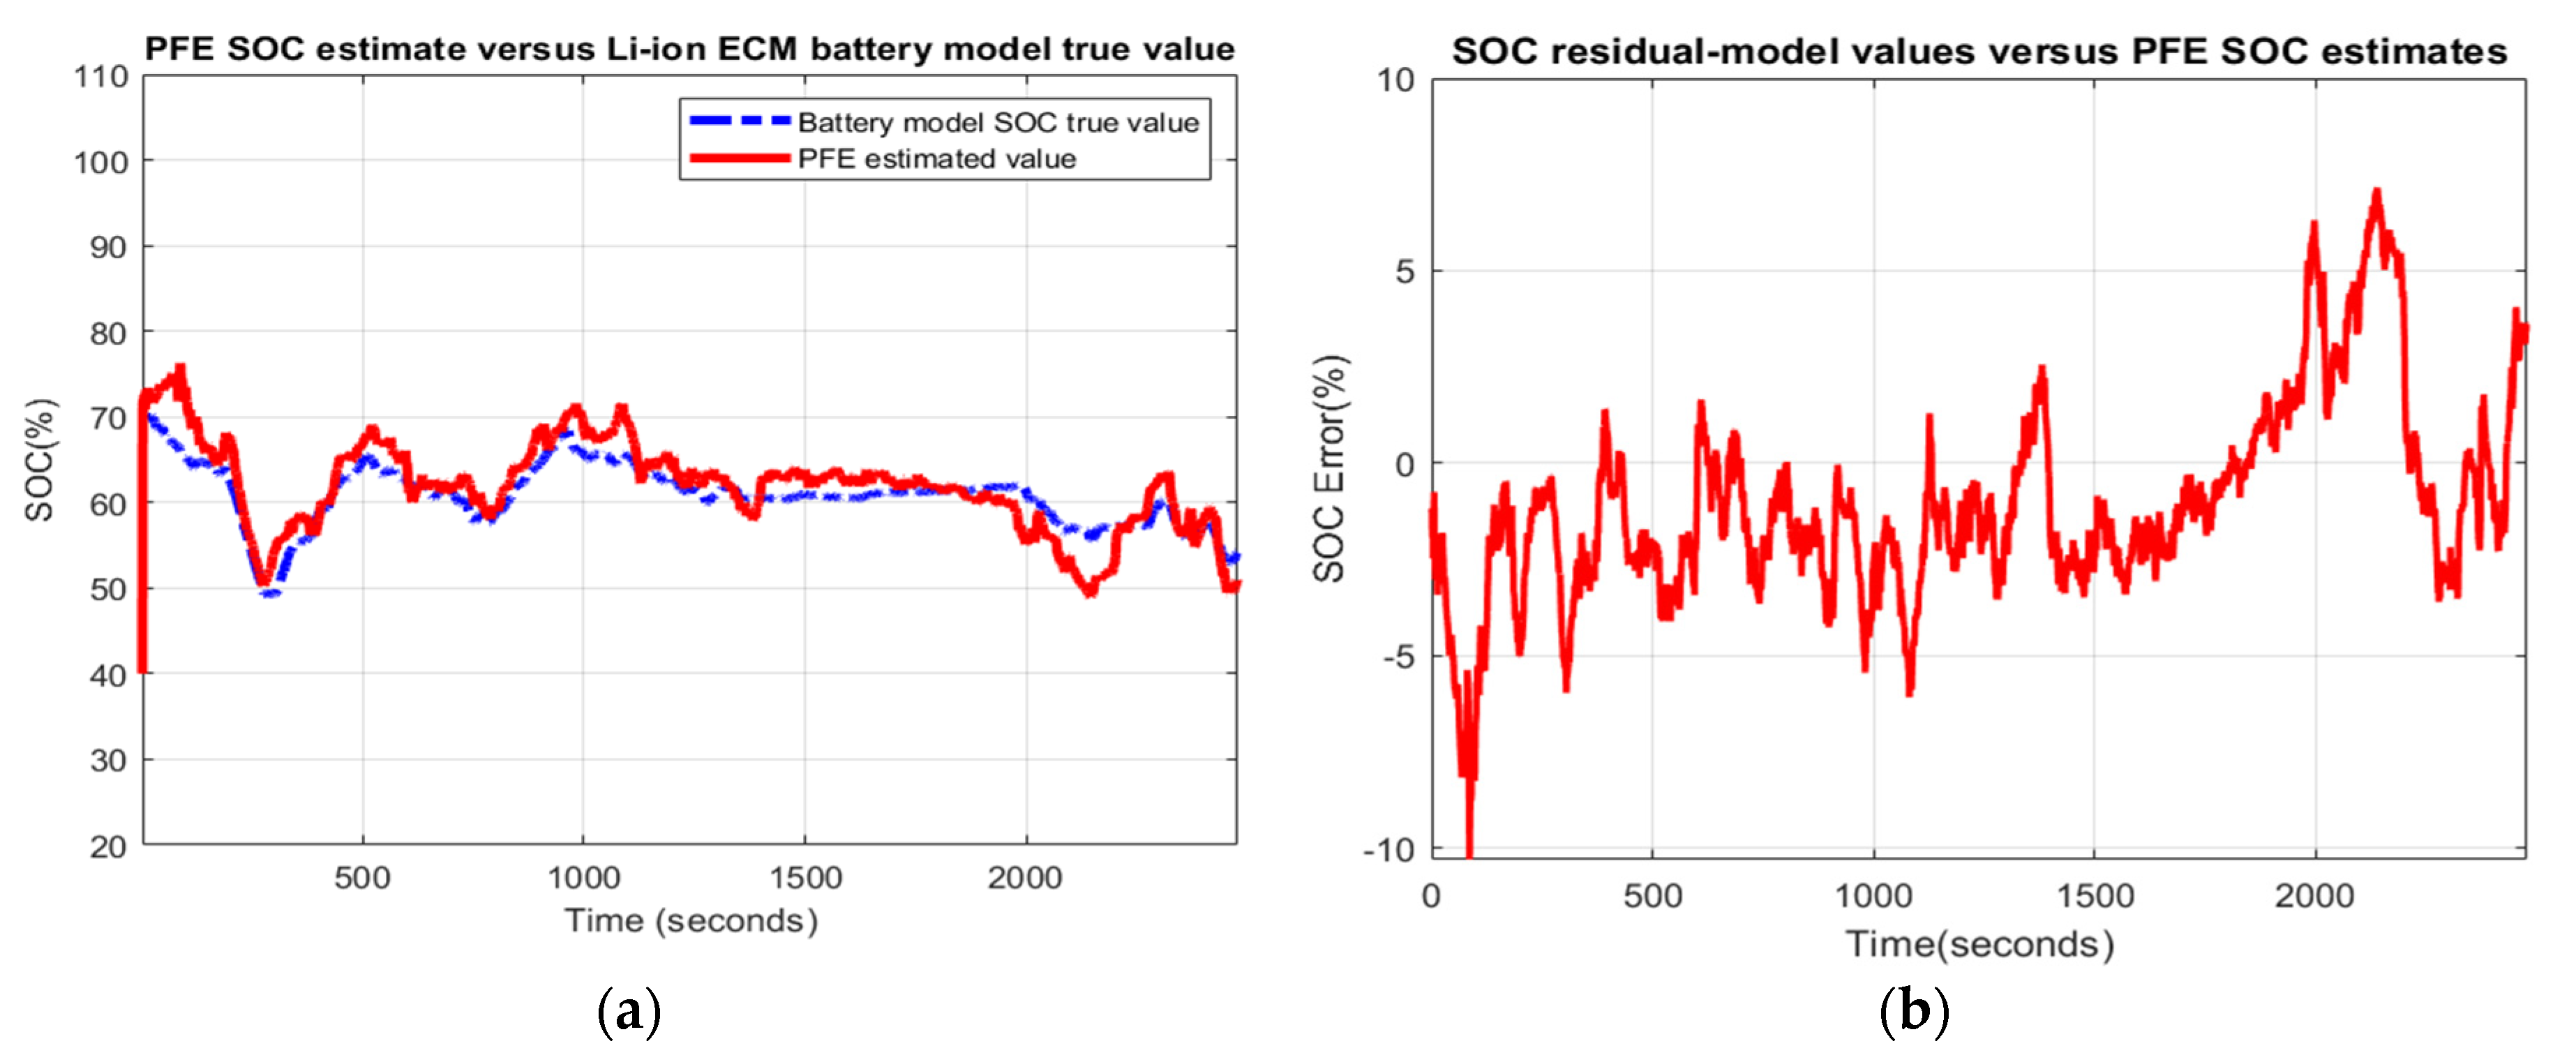
  • Scenario R4. The MATLAB simulation results for fourth scenario are depicted in Figure 11 and the statistical criteria values are given in Appendix A.2, Table A4.
    Performance analysis:
    SOC accuracy is weak.
    The residual error is quite close to 20%, which is bad.

3.7. MATLAB Simulation Results for Simulink Simscape Battery Model—PFE SOC Estimator Accuracy and Robustness Scenarios

  • Scenario R0. The MATLAB simulation results for this scenario are shown in Appendix A.1, Figure A27a–c, and the statistical criteria values are given in Table 1.
    Performance analysis:
    SOC accuracy is good.
    The residual error is quite close to 4%, which is weak.
  • Scenario R1. The MATLAB simulation results for the first scenario are revealed in Appendix A.1, Figure A28a–c, and the statistical criteria values are given in Appendix A.2, Table A1.
    Performance analysis:
    SOC accuracy is good.
    The residual error is quite close to 2%, which is good.
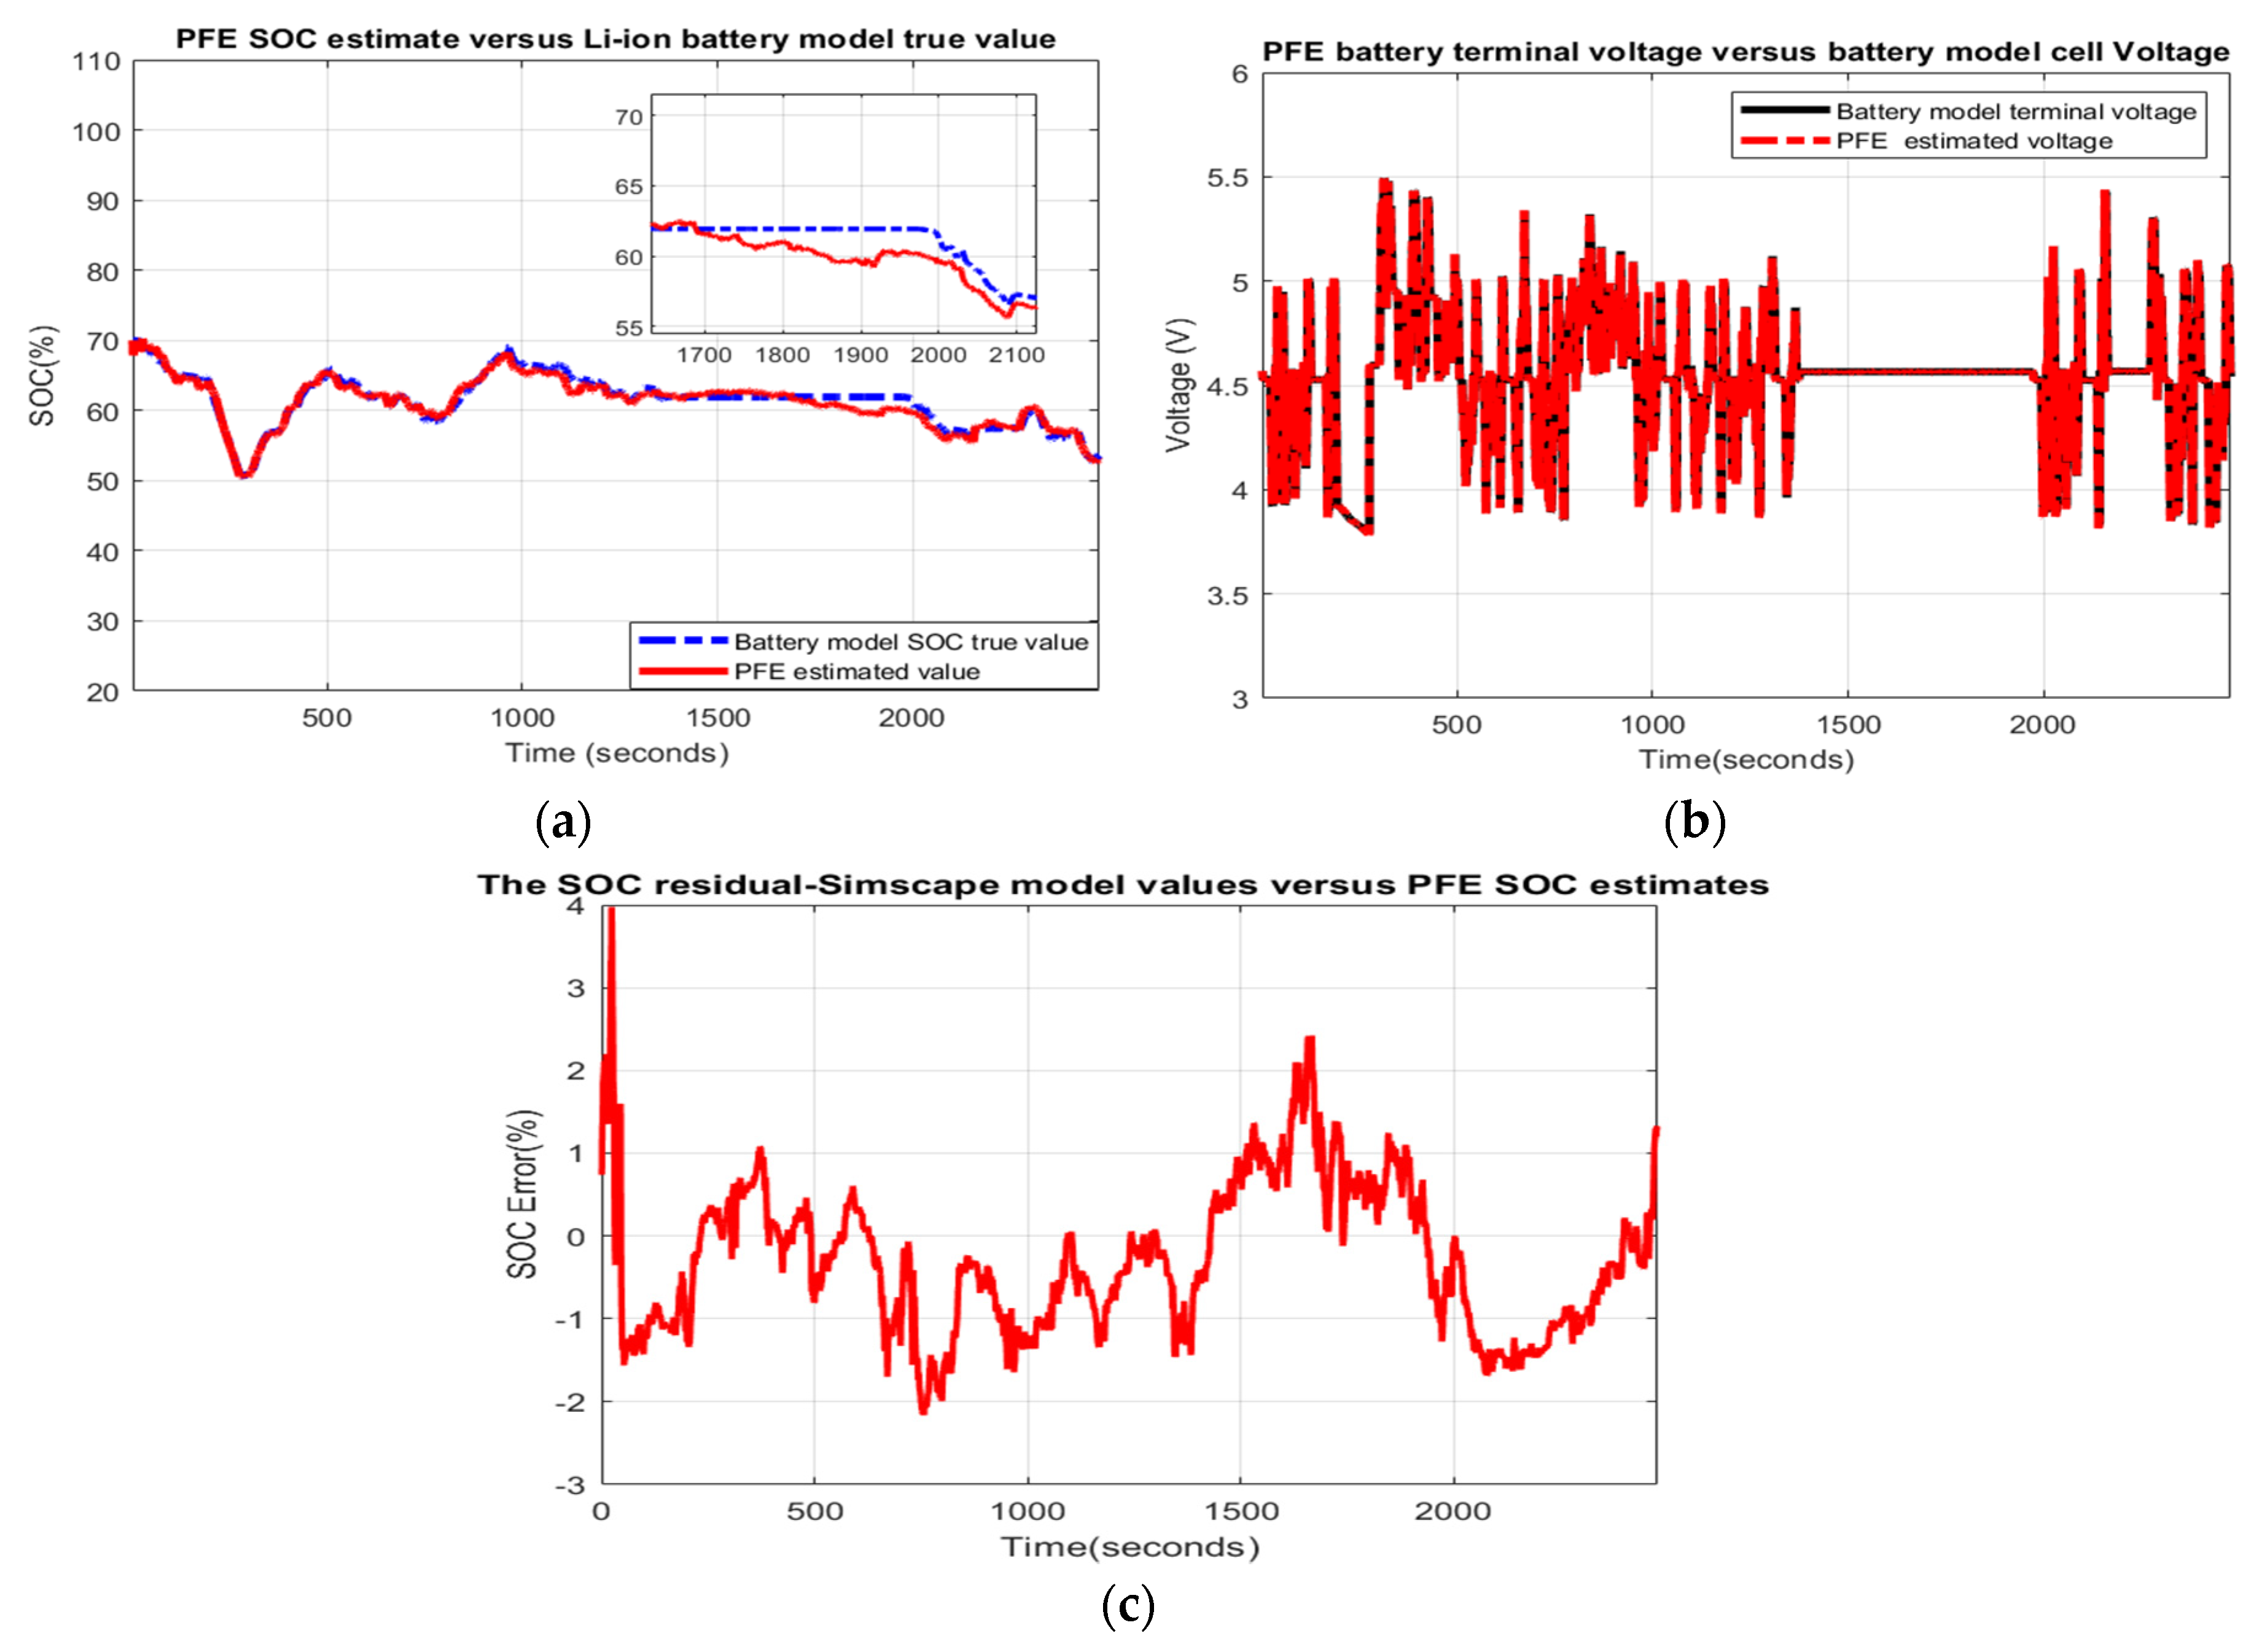
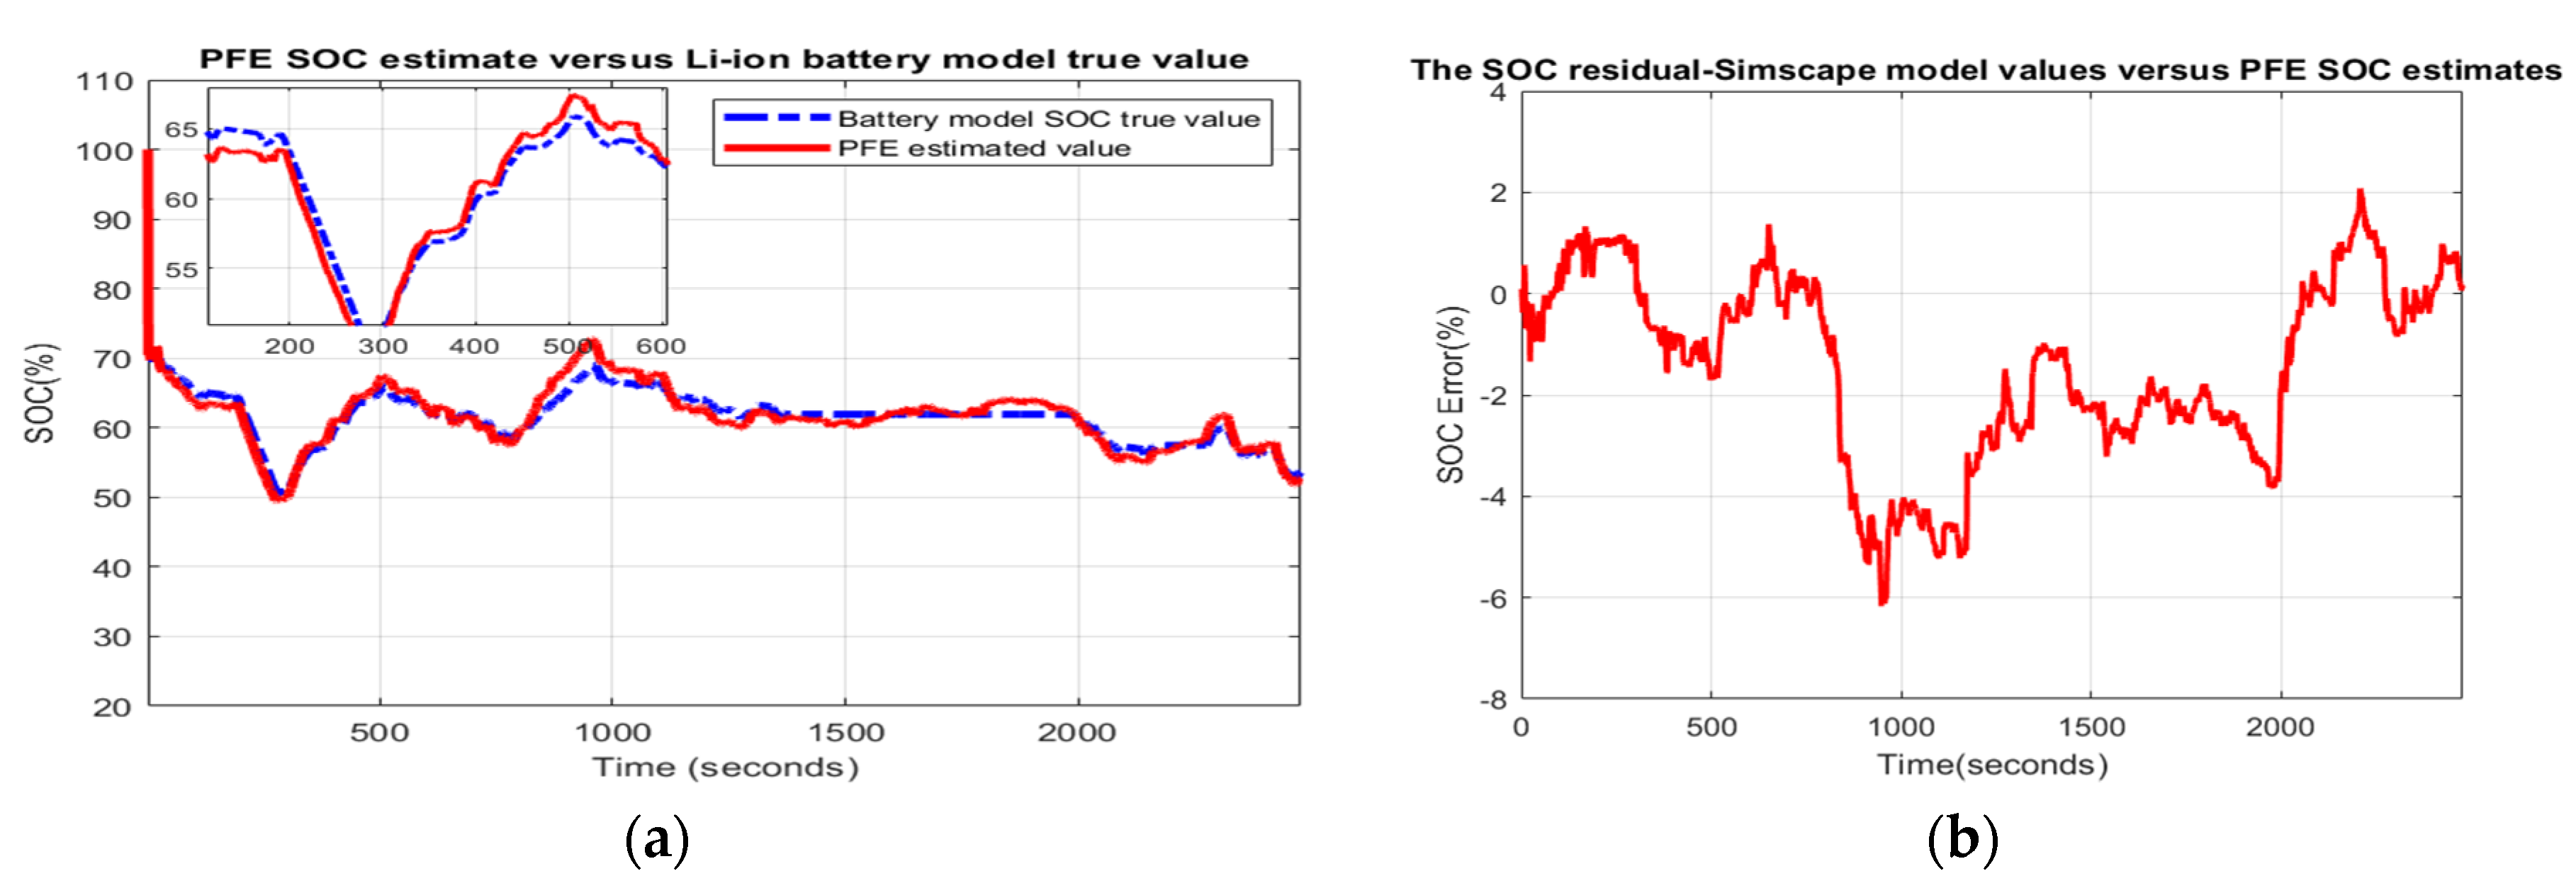
  • Scenario R2. The MATLAB simulation results for the second scenario are depicted in Figure 12 and statistical criteria values are given in Appendix A.2, Table A2.
    Performance analysis:
    SOC accuracy is great.
    The residual error is quite close to 6%, which is weak.
  • Scenario R3. The MATLAB simulation results for the third scenario are visible in Appendix A.1, Figure A29a–c, and the statistical criteria values are given in Appendix A.2, Table A3.
    Performance analysis:
    SOC accuracy is great.
    The residual error is quite close to 3%, which is good.
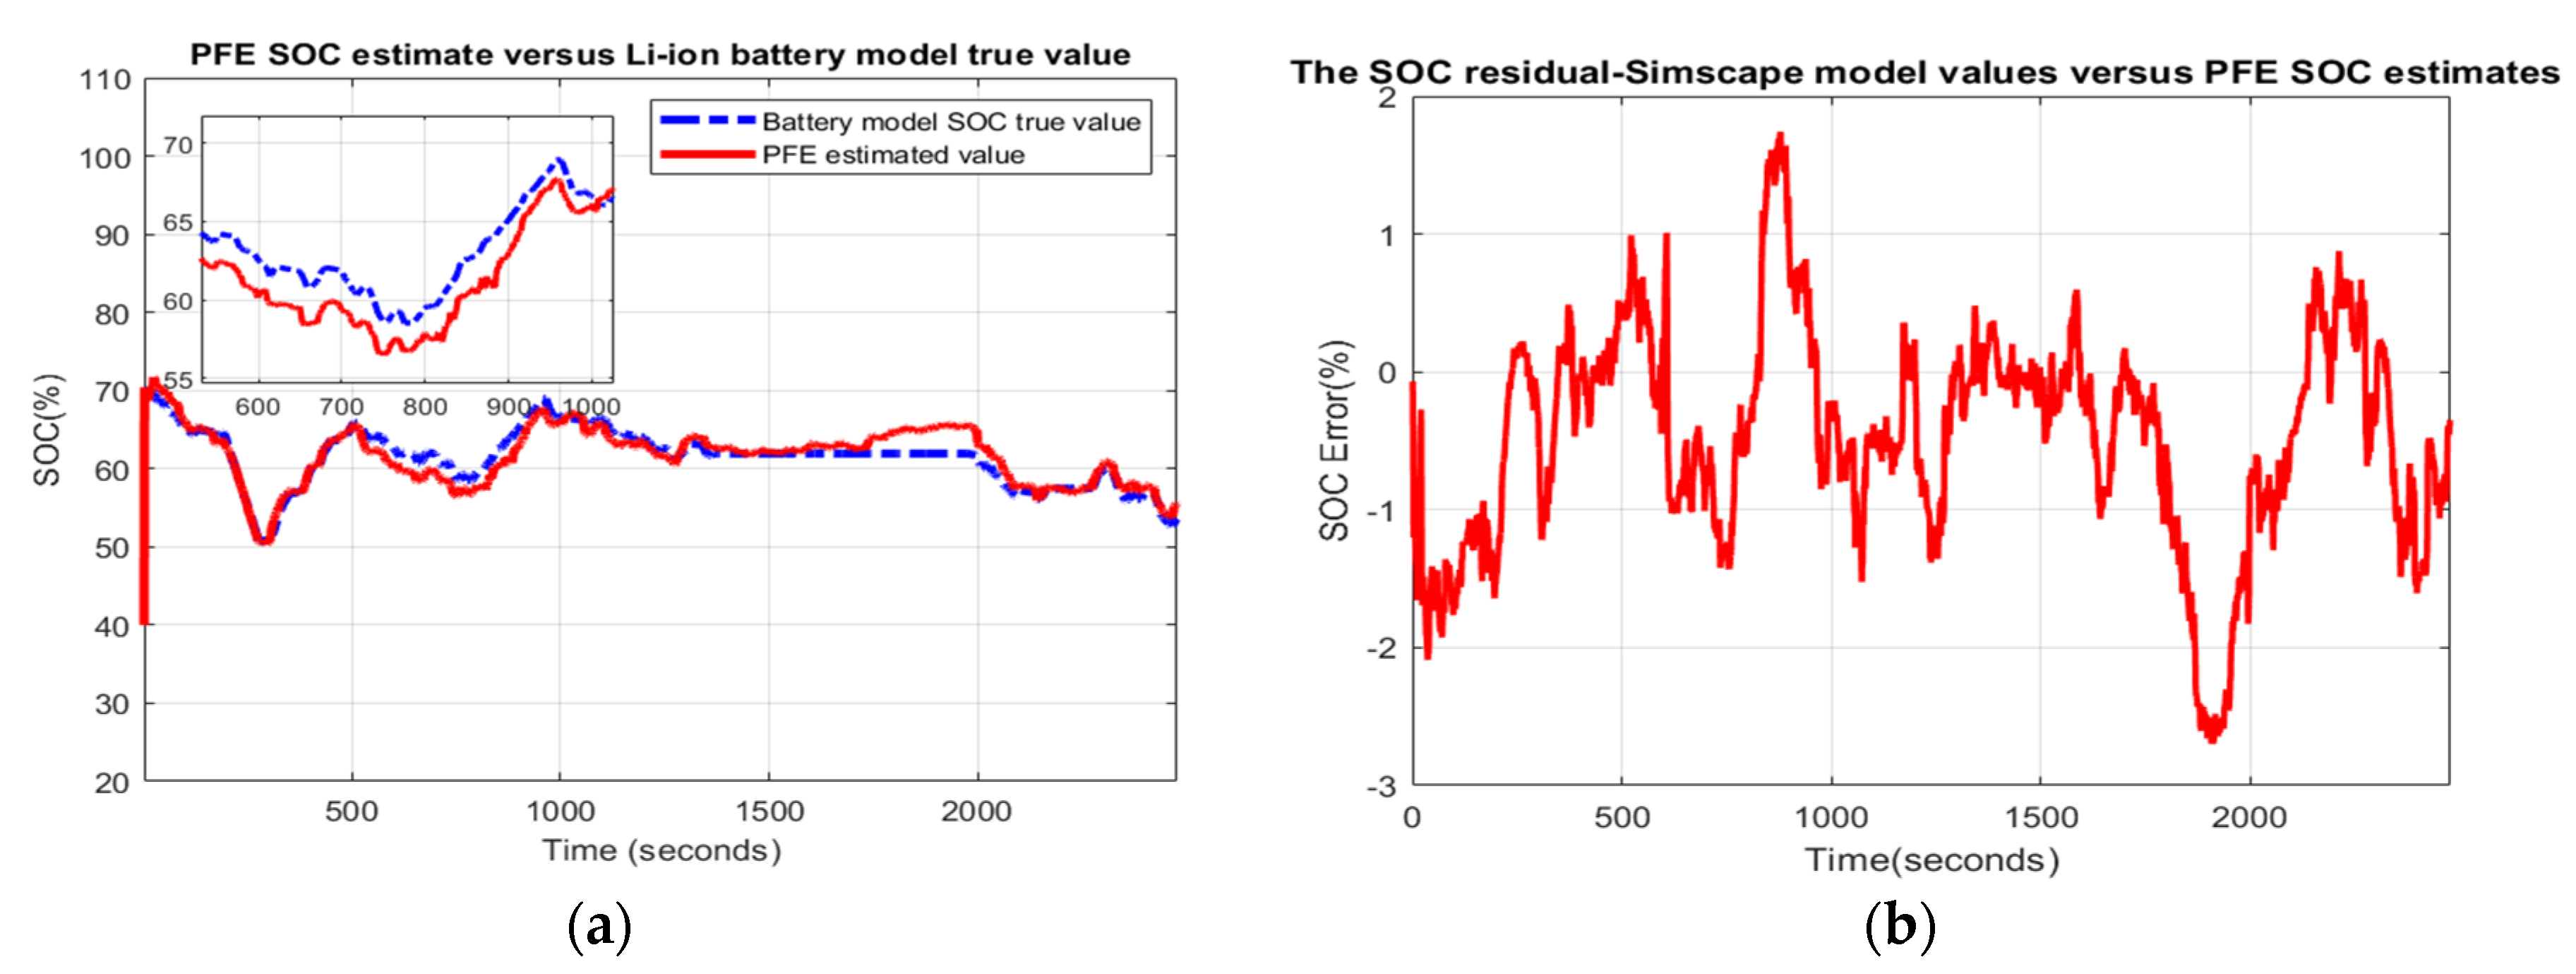
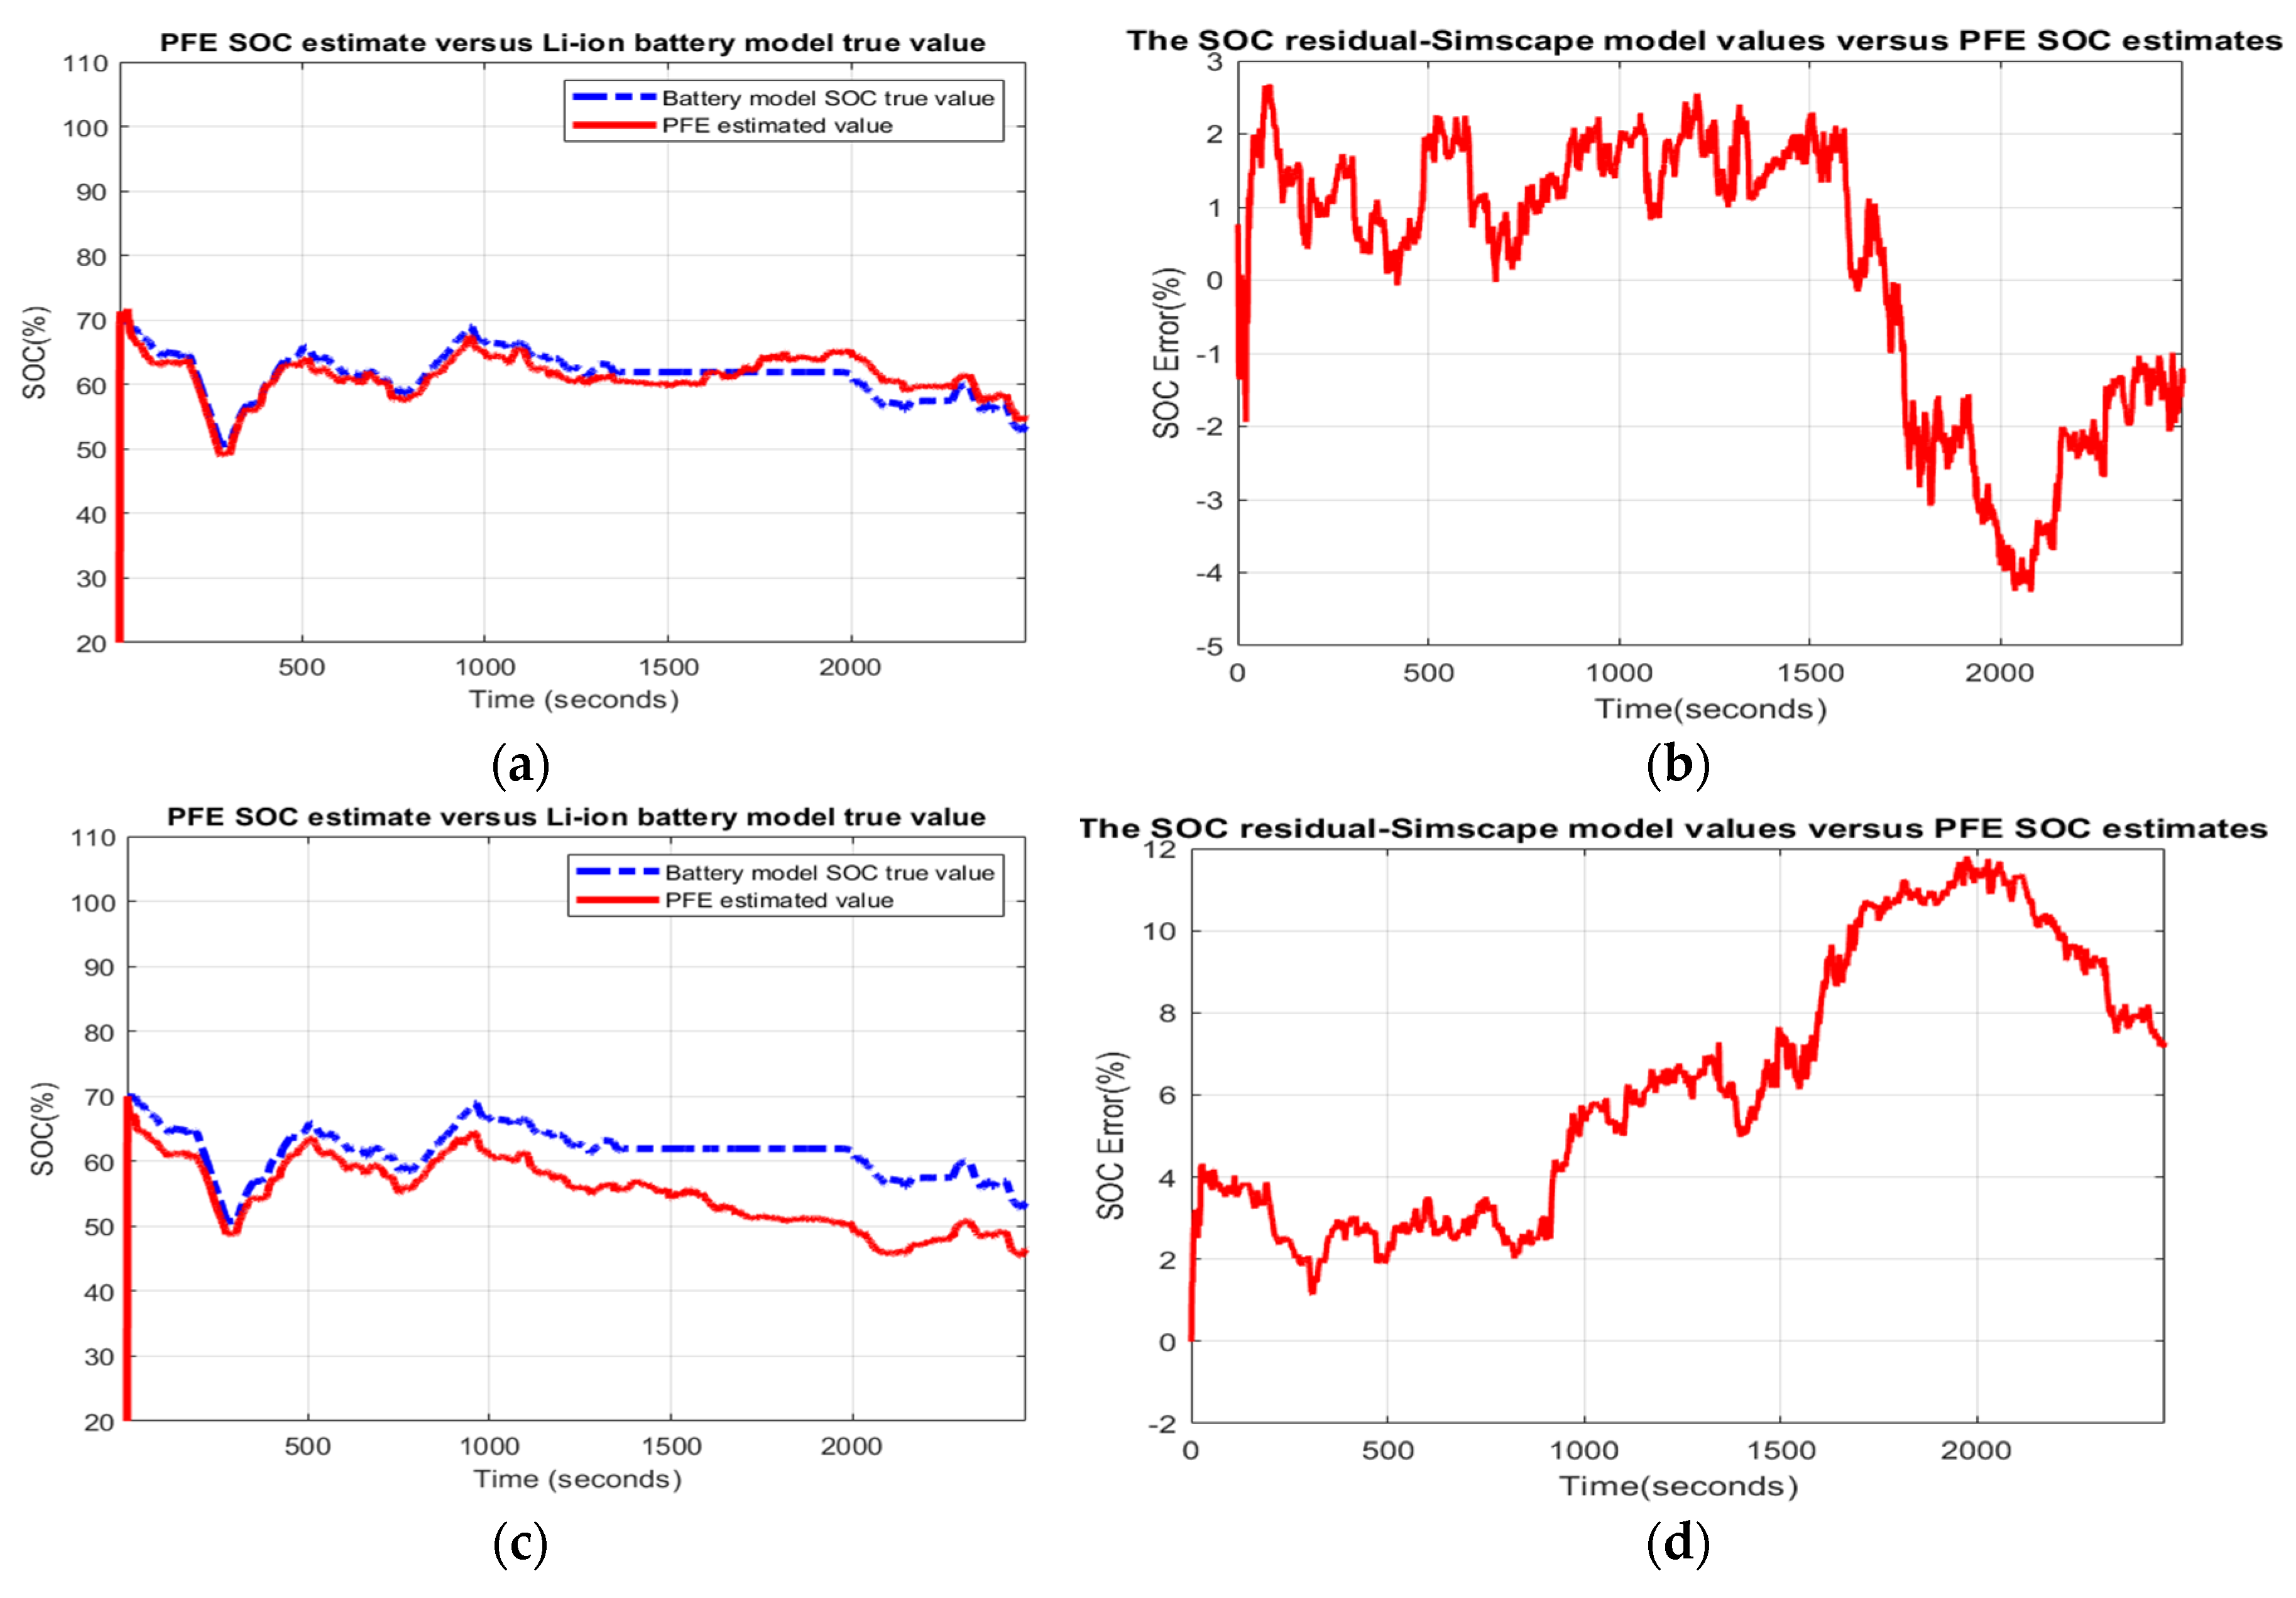
  • Scenario R4. The MATLAB simulation results for the fourth scenario are shown in Figure 13a,b for changes in Kp, and Figure 13c,d for changes in Rin. The statistical criteria values are given in Appendix A.2, Table A4.
    Performance analysis:
    SOC accuracy is weak for changes in Rin and good for changes in Kp.
    The residual error is quite close to 12% for 10% changes in Rin, which is bad.
Similarly, for the first and second SOC estimators, the MATLAB simulation results of the PFE SOC performance obtained for each model reveal that the PFE SOC estimator works satisfactorily in four scenarios (R0, R1, R2, R3) for the Simscape model, and three scenarios (R0, R1, R3) for the 3RC EMC model. Thus, it is confirmed again that the Simulink model is suitable for use as a support for designing and implementing in a real-time MATLAB environment of SOC estimators in HEV applications.

4. Discussion

This research work has been beneficial for us, as our research experience was considerably improved, and we learned some useful lessons for the future. The preliminary results obtained so far in the design, modelling, implementation and validation of Li-ion batteries, development and implementation of real-time SOC estimation algorithms are enriched continuously and supplemented based on a new experience and a considerable routine in using one of the most powerful pieces of software for real-time design and implementation, such as MATLAB and Simulink. In the following are summarized some of the most relevant aspects that have attracted our attention and enriched our research experience in the field so far. In the next five subsections, the performance analysis of each SOC estimator, in terms of SOC convergence speed, real-time implementation, accuracy and robustness performance analysis, is based on the data shown in Table 1 and Table 2 and Figure A12, Figure A15, Figure A18 and Figure A21 from Appendix A.1, corresponding to the scenario R0, for an SOC initial value, SOCini = 70%.

4.1. SOC Estimators’ Convergence Speed

The analysis of Li-ion battery response convergence speed for all three SOC estimators and each model can be done visually by examining the graphs related to SOC or based on the benchmark represented in Table 2. The data from Table 2 correspond to the worst-case scenario that could happen in “real life”, since they analyse a Li-ion capacity degradation by 30% due to ageing effects and for changes in the “guessed” value of initial SOC. Moreover, some noise in measurement output data (battery terminal voltage) has a variance VarY = 0.001. From data provided in Table 2, it can be said that for the 3RC ECM Li-ion battery model SOC the PFE is much faster compared to the other two estimators, followed by the AEKF SOC estimator. For the Li-ion battery Simscape model the AEKF SOC estimator is faster than the other two competitors, followed quite closely by the PFE SOC estimator. By a rigorous analysis of data collected in Table 1, it can conclude that all three SOC estimators perform better for the Li-ion battery Simscape model; the response convergence speed is faster than for the 3RC ECM Li-ion battery model.

4.2. SOC Estimation Accuracy

A rigorous analysis of SOC estimation accuracy performance can be performed using the information extracted from the SOC residual corresponding to the first scenario, Ro, i.e., for a SOCini value of 0.7 and all other parameters of Li-ion battery adjusted to the nominal values, as shown in Table 3. Moreover, the SOC accuracy is strongly related to the battery model accuracy. Since both Li-ion battery models are exactly accurate, as was shown in Part 1, an excellent efficiency for all three estimators based on both battery models can be anticipated. The second assessment procedure of SOC estimation accuracy of each SOC estimator can also be carried out based on all six statistical criteria values obtained from Table 1. Moreover, a complete performance analysis consists of analysing the information provided by each SOC residual value and using statistical criteria. By inspecting the statistical criteria values, column by column, for each model, the AEKF SOC estimator based on the Simulink model behaves slightly better than two other competitors, followed by SOC estimators PFE and AUKF.
On the other hand, for a 3RC ECM battery model the AUKF behaves better, followed closely by AEKF and PFE. By far, combining the results obtained in Table 1 and Table 3, it can be said that the AEKF SOC estimator has better performance for the Simscape battery model, followed quite closely by the AUKF SOC estimator. For a 3RC ECM battery model it is the AUKF that performs better, followed by AEKF and PFE SOC estimators. However, since the values of statistical criteria extracted from Table 1 are close to each other for most of them, it is difficult now to make a net difference between the performance of all three SOC estimators. Moreover, sometimes it is difficult in some situations to make an interpretation that is approximative of each statistical criteria value. Still, in some cases, due to unsuitable values for the tuning parameters, the AEKF, AUKF and PFE SOC estimates are biased. Regarding all three SOC estimators, we observed that the SOC accuracy depends on a “trial and error” empirical adjustment procedure of tuning parameter values. Unfortunately, this procedure takes much time. Moreover, a new readjustment procedure is required when changing the driving conditions and SOC initial value, as well as when ageing and temperature effects take place. The adopted versions of AEKF and AUKF, due to their adaptive features, attenuate the tuning procedure of the parameters significantly.

4.3. SOC Estimator—Measurement Noise Filtration

A critical aspect observed in this research is the measurement noise filtration by all three estimators. Only the AEKF and AUKF have this ability to filtrate the measurement noise due to the noise correction step in each algorithm, compared to the PFE SOC estimator that does not have this feature.

4.4. SOC Estimators—Real Time Implementation

As was mentioned in the previous section, due to their predictor–corrector structure, each SOC estimator becomes a recursive algorithm, more straightforward to implement in real-time and very efficient in terms of computation. Both Li-ion battery models are also simple, easy to design and quickly deploy, especially the Simscape battery model based directly on the manufacturer’s battery specifications. Besides, MATLAB-Simulink software platform provides a valuable and practical Simscape/SimPower Systems library, helpful for use in design and implementation of different HEV and EV powertrain configurations.

4.5. SOC Estimator Robustness Performance Analysis—Statistical Criteria

The values of statistical criteria from Table 1 provide the SOC accuracy of both battery models concerning ADVISOR estimate, beneficial for Li-ion battery model validation performed for an FTP-75 driving cycle profile test. The statistical criteria values from Table A1, Table A2, Table A3 and Table A4 are valuable for analysing the SOC robustness performance of all three SOC estimators. Based on the information extracted from Table A1, Table A2, Table A3 and Table A4 for each SOC estimator, it seems that AEKF SOC is more robust compared to the other two SOC estimators, as is quite evident for the Simulink model. Unfortunately, it is diffficult to make a complete performance analysis by comparison of the results obtained by similar SOC estimators reported in the literature. This happens since many researchers use different input current profiles and various statistical criteria that do not match with those used in our research. However, for the cases that match with our driving cycle profile test, the information collected in Table 1 and Table A1, Table A2, Table A3 and Table A4 can be useful for analysing all similar situations. Thus, the present research work can be a valuable source of inspiration for readers and researchers.

5. Conclusions

In the current research paper, the following most relevant contributions of the authors can be highlighted:
  • Adaptive Extended Kalman Filter SOC estimator with fading feature and covariance matrices of noises correction—brief presentation and MATLAB application.
  • Adaptive Unscented Kalman Filter SOC estimator with covariance matrices of process and measurement noise correction—design and MATLAB implementation.
  • Adaptive Particle Filter SOC estimator—brief presentation and MATLAB application.
  • MATLAB SOC simulations for all three SOC estimators.
  • Performance analysis for five scenarios (SOC accuracy and robustness)—Table 1 and Table A1, Table A2, Table A3 and Table A4 for six statistical errors defined in Part 1 [20], namely RMSE, MSE, MAE, std, MAPE and R-squared.
Based on six statistical criteria values for all three SOC estimators, as a behavior response to an FTP-75 driving cycle profile test, it was possible to choose, from all three competitors, the most suitable SOC estimator. The result of the overall performance analysis indicates that the AEKF SOC estimator performs better than the other two competing SOC estimators.
In future work, our investigations will continue to improve the design and implementation approach by using fuzzy logic, neural networks and learning machine methods from artificial intelligence field.

Author Contributions

R.-E.T. has contributed for, algorithm conceptualization, software, original draft preparation and writing it. N.T. has contributed for battery models investigation and validation, performed MATLAB simulations and formal analysis of the results. M.Z. has contributed for project administration, supervision, and results visualization. S.-M.R. has contributed for methodology, data curation and supervision. All authors have read and agreed to the published version of the manuscript.

Funding

This research received no external funding.

Acknowledgments

In Research funding (discovery grant) for this project from the Natural Sciences and Engineering Research Council of Canada (NSERC) is gratefully acknowledged.

Conflicts of Interest

The authors declare no conflict of interest.

Abbreviations

Ni-Cadnickel cadmium
Ni-MHnickel metal hydride
Li-ion Colithium-ion cobalt
EVelectric vehicle
HEVhybrid electric vehicle
BMSbattery management system
ADVISORadvanced vehicle simulator
EPAenvironmental protection agency
UDDSurban dynamometer driving schedule
FTP-75Federal test procedure at 75 [degrees F]
SMOsliding mode observer
LOElinear observer estimator
RMSEroot mean squared error
MSEmean squared error
MAEmean absolute error
MAPEmean absolute percentage error
R2/R-squaredcoefficient of determination
std (σ)standard deviation
OCVopen-circuit voltage
SOCstate of charge
SOEstate of energy
SOHstate of health
DODdepth of discharge
NRELNational Renewable Energy Laboratory
EKFextended Kalman filter
AEKFadaptive extended Kalman filter
UKFunscented Kalman filter
AUKFadaptive unscented Kalman filter
PFEparticle filter estimator

Appendix A

Appendix A.1. Figures
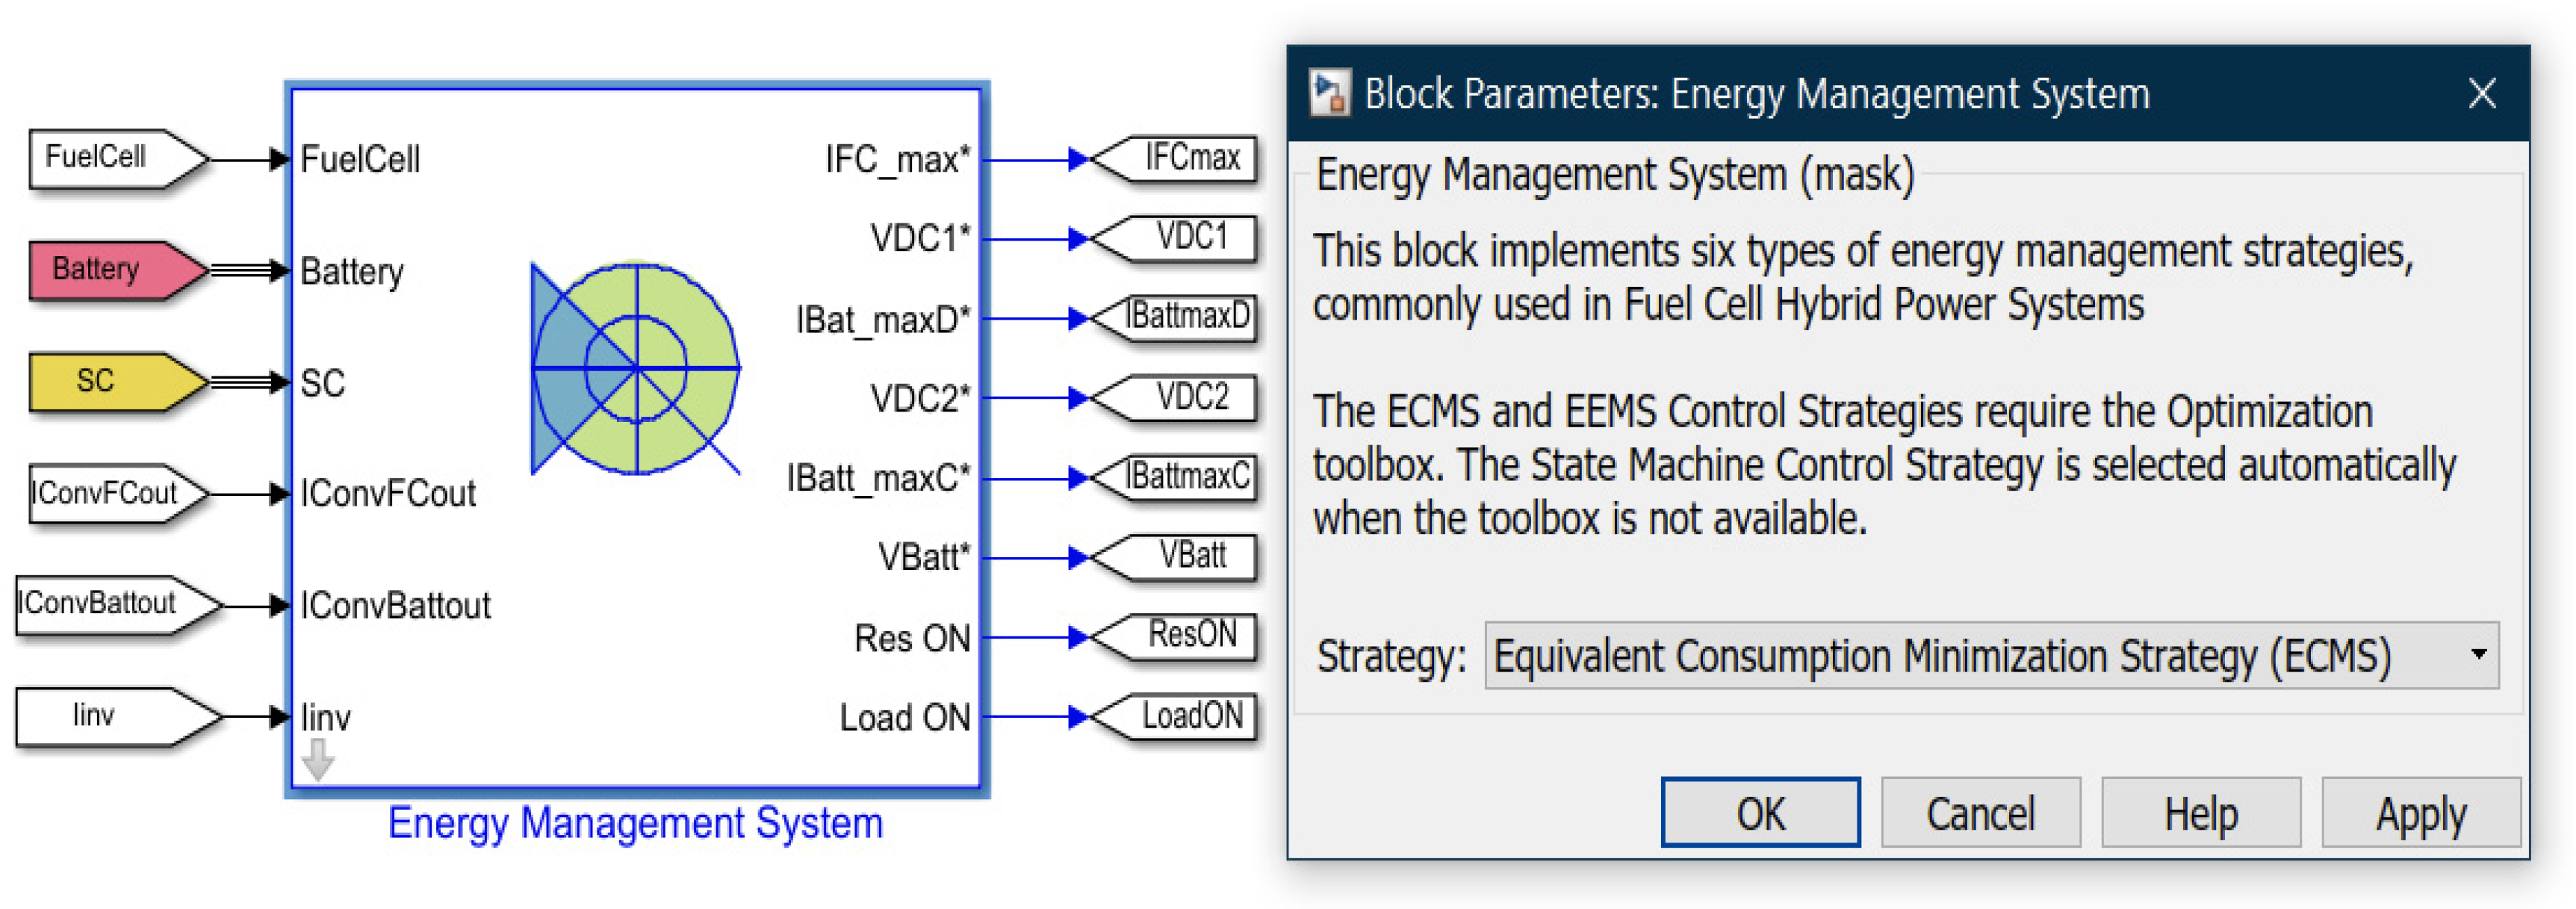
Figure A1. The Li-ion Battery—3RC ECM and Simscape models: (a)Li-ion battery represented in NI Multisim 14.1 editor (see Figure 6—Part 1); (b) Simscape Simulink diagram of Li-ion battery (see Figure A19—Part 1); (c) Simscape SAFT Li-ion battery nominal current discharge characteristic @1C (6A) (top side view); @6.5A, 13A and 32.5A. (d) Simulink diagram of Li-ion Simscape generic model.
Batteries 06 00041 g0a1
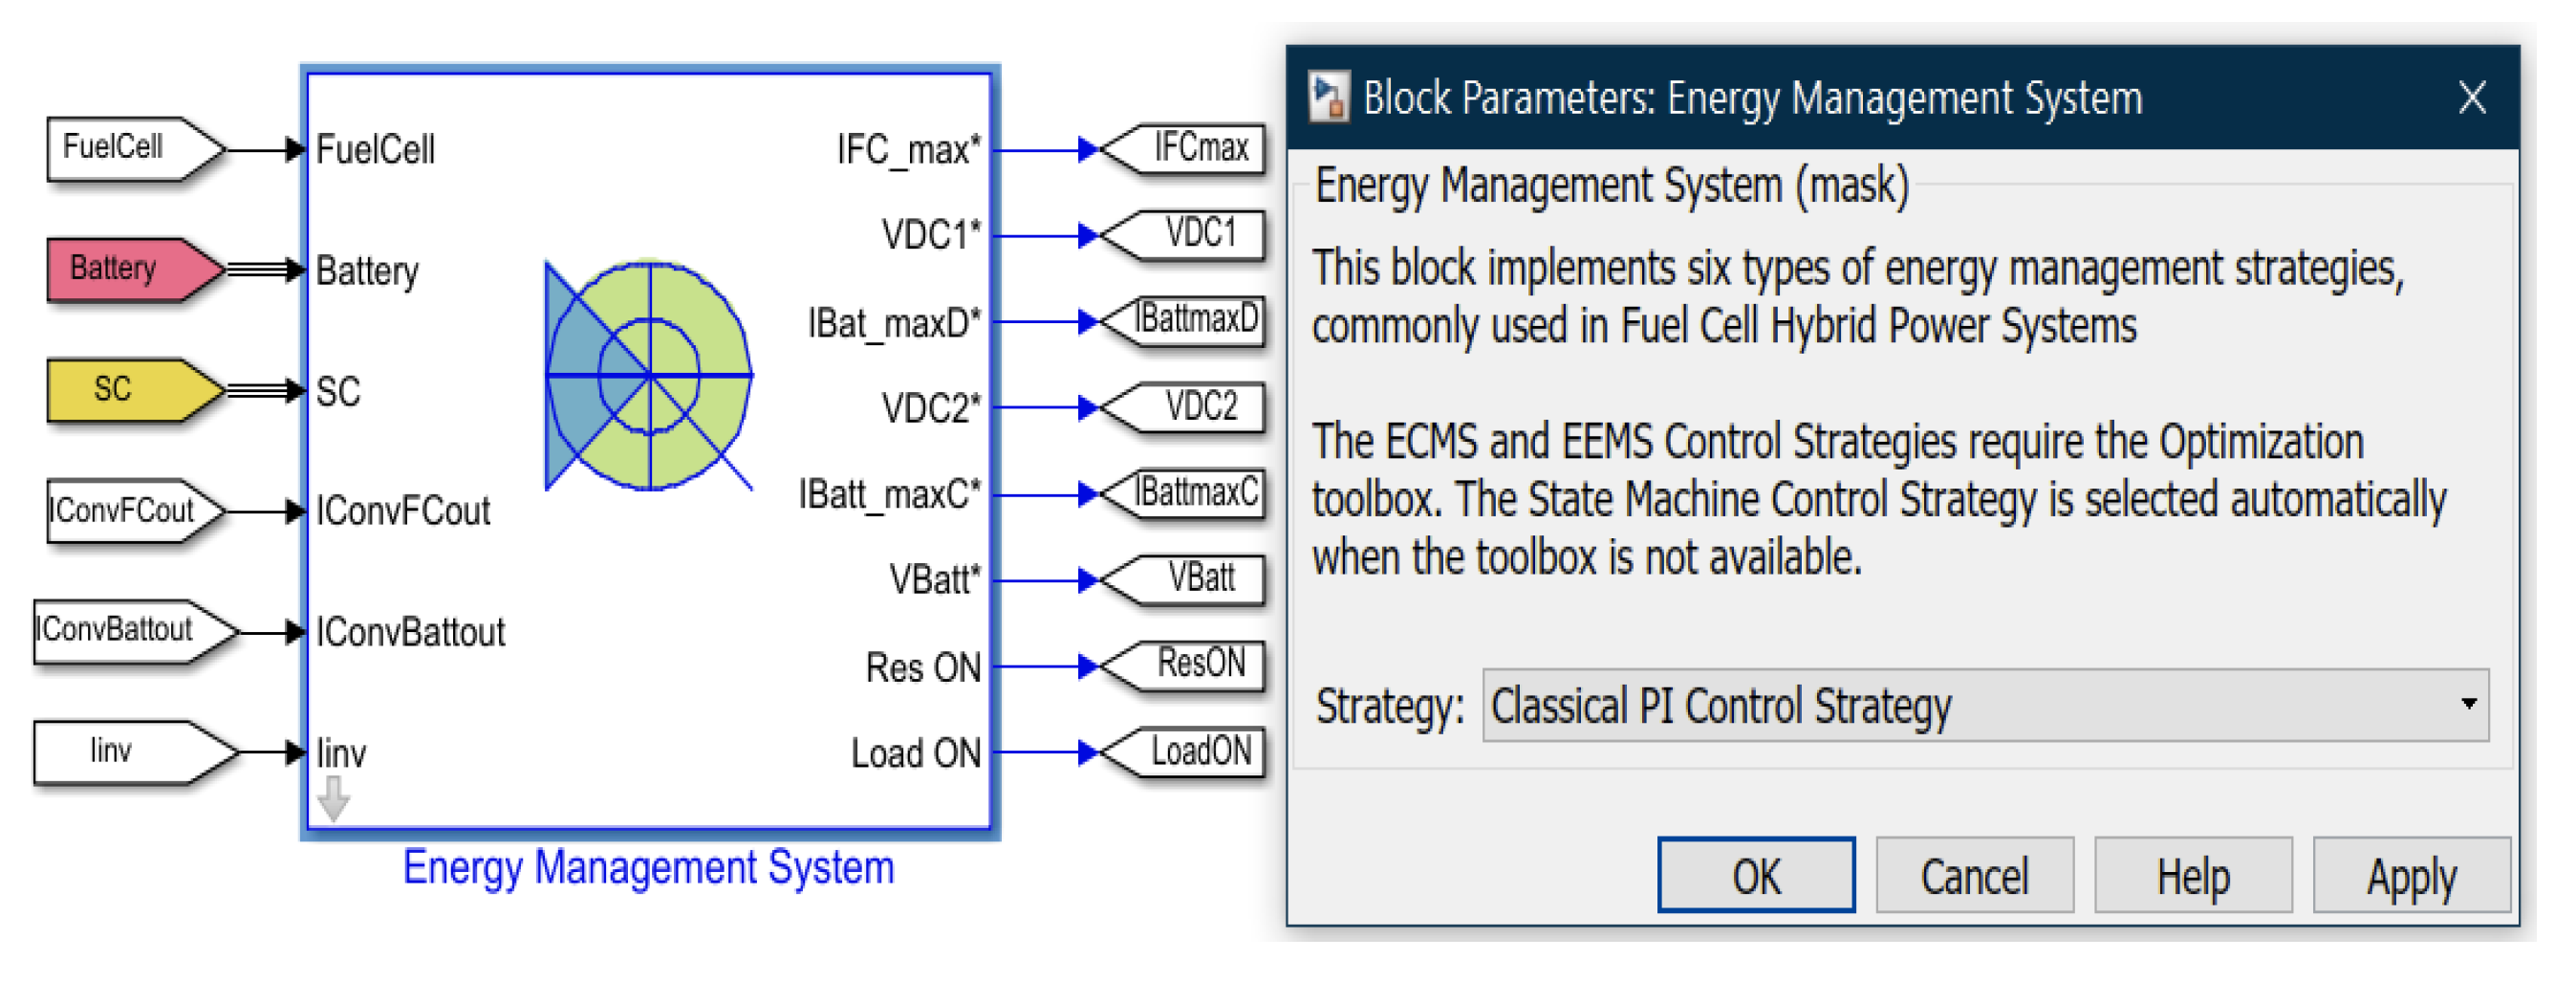
Figure A2. EMS—Classical PI Control Strategy setup.
Batteries 06 00041 g0a2
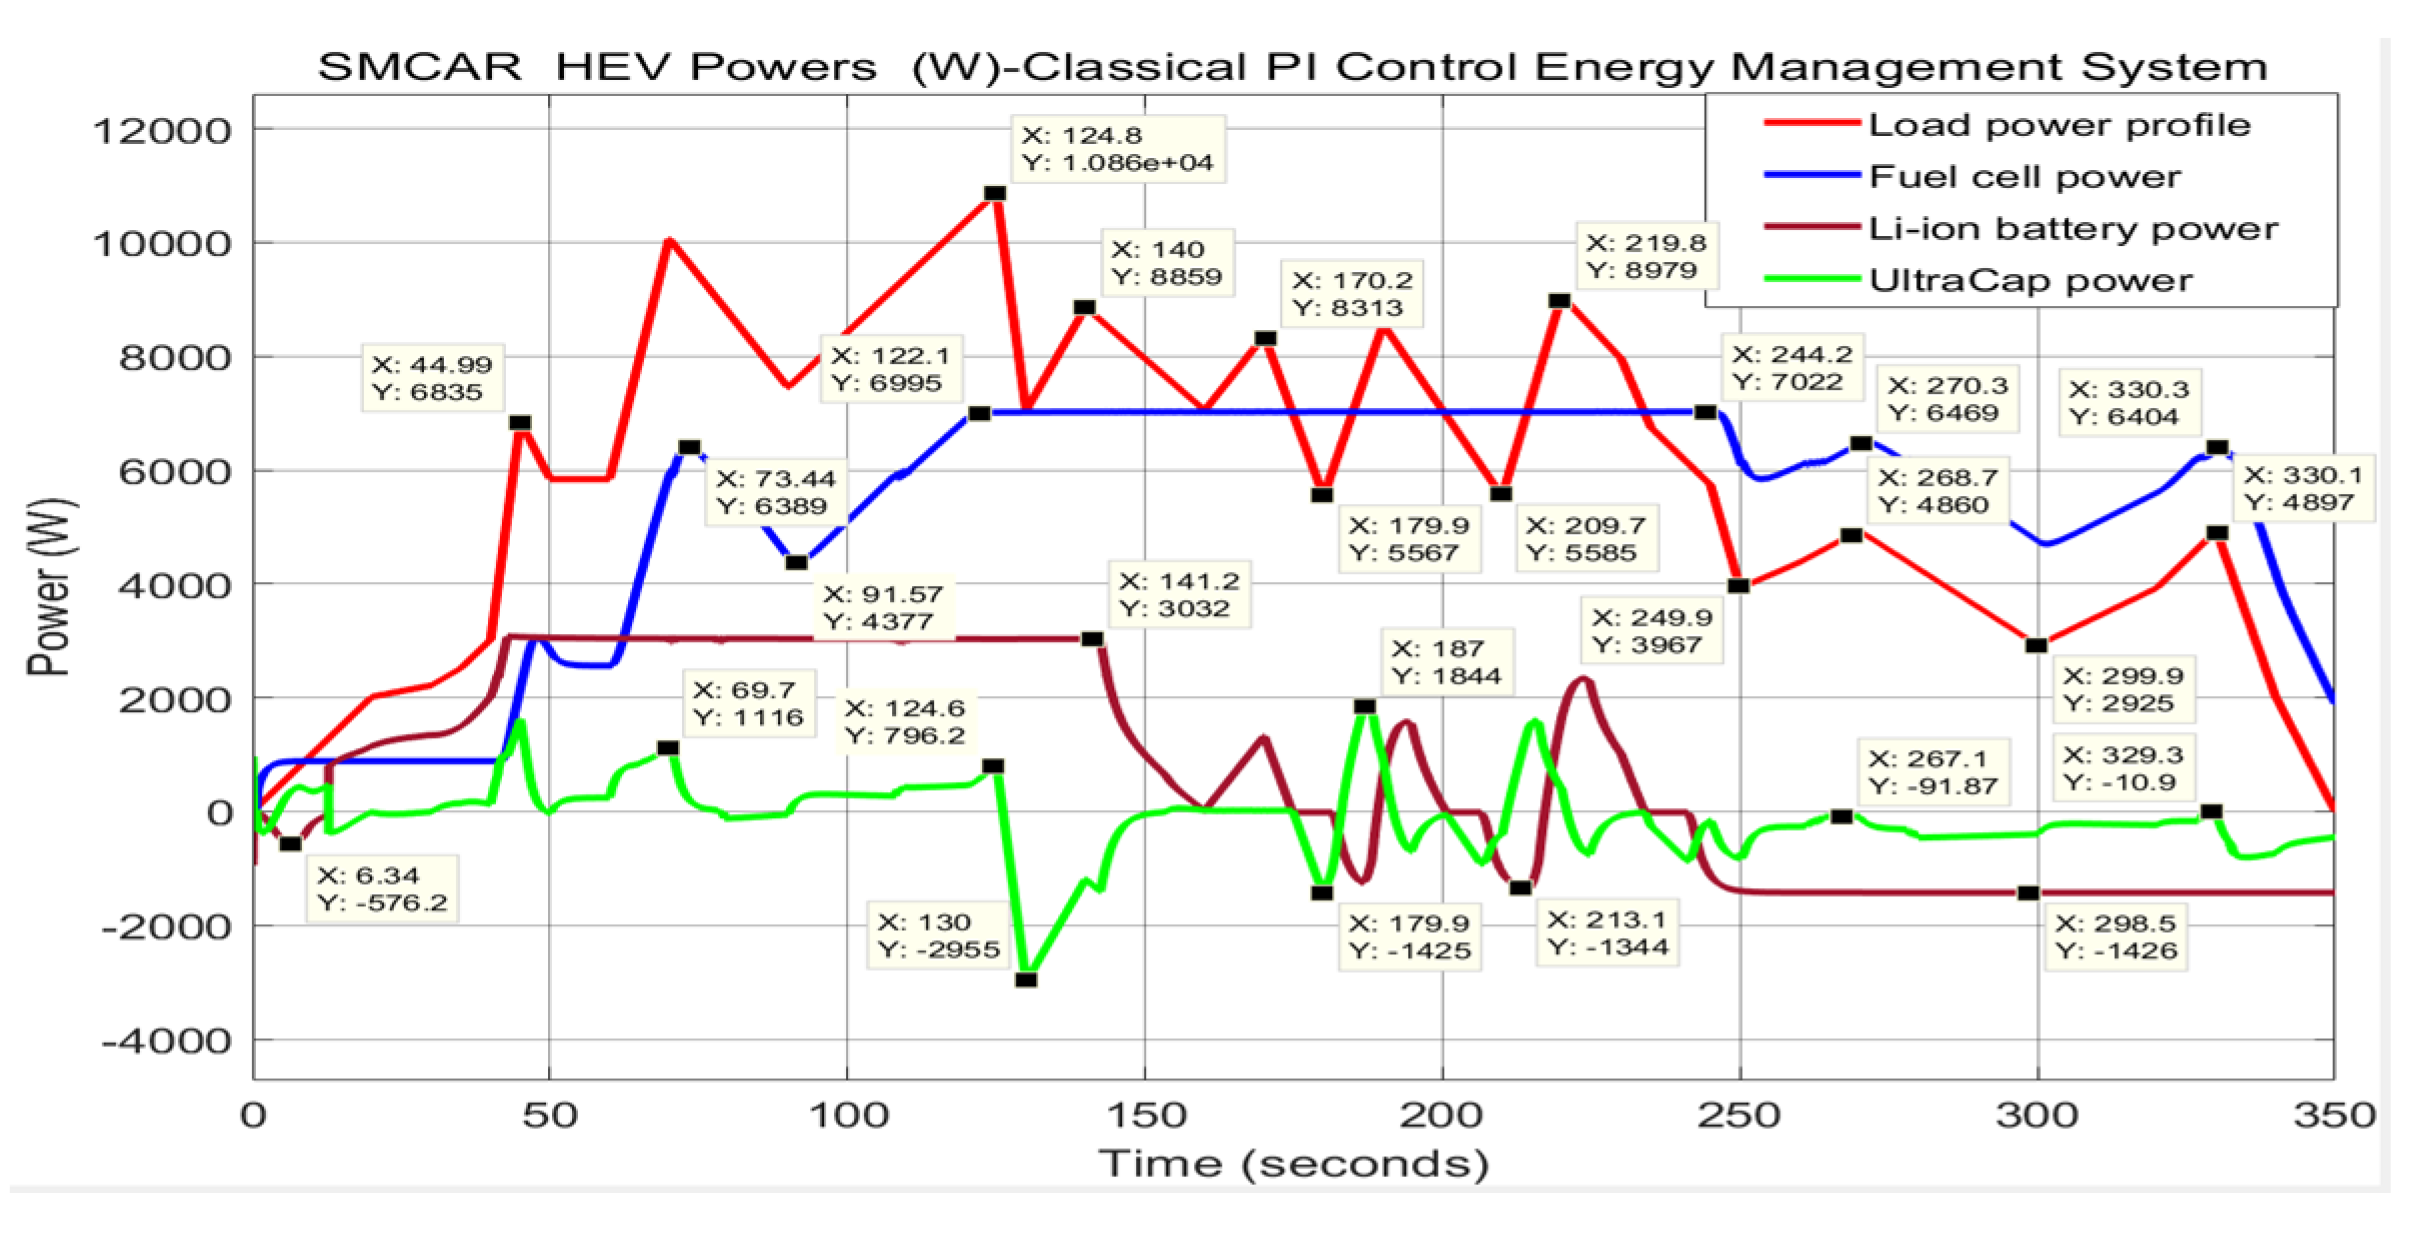
Figure A3. SMCAR HEV Powers—Classical PI Control EMS.
Batteries 06 00041 g0a3
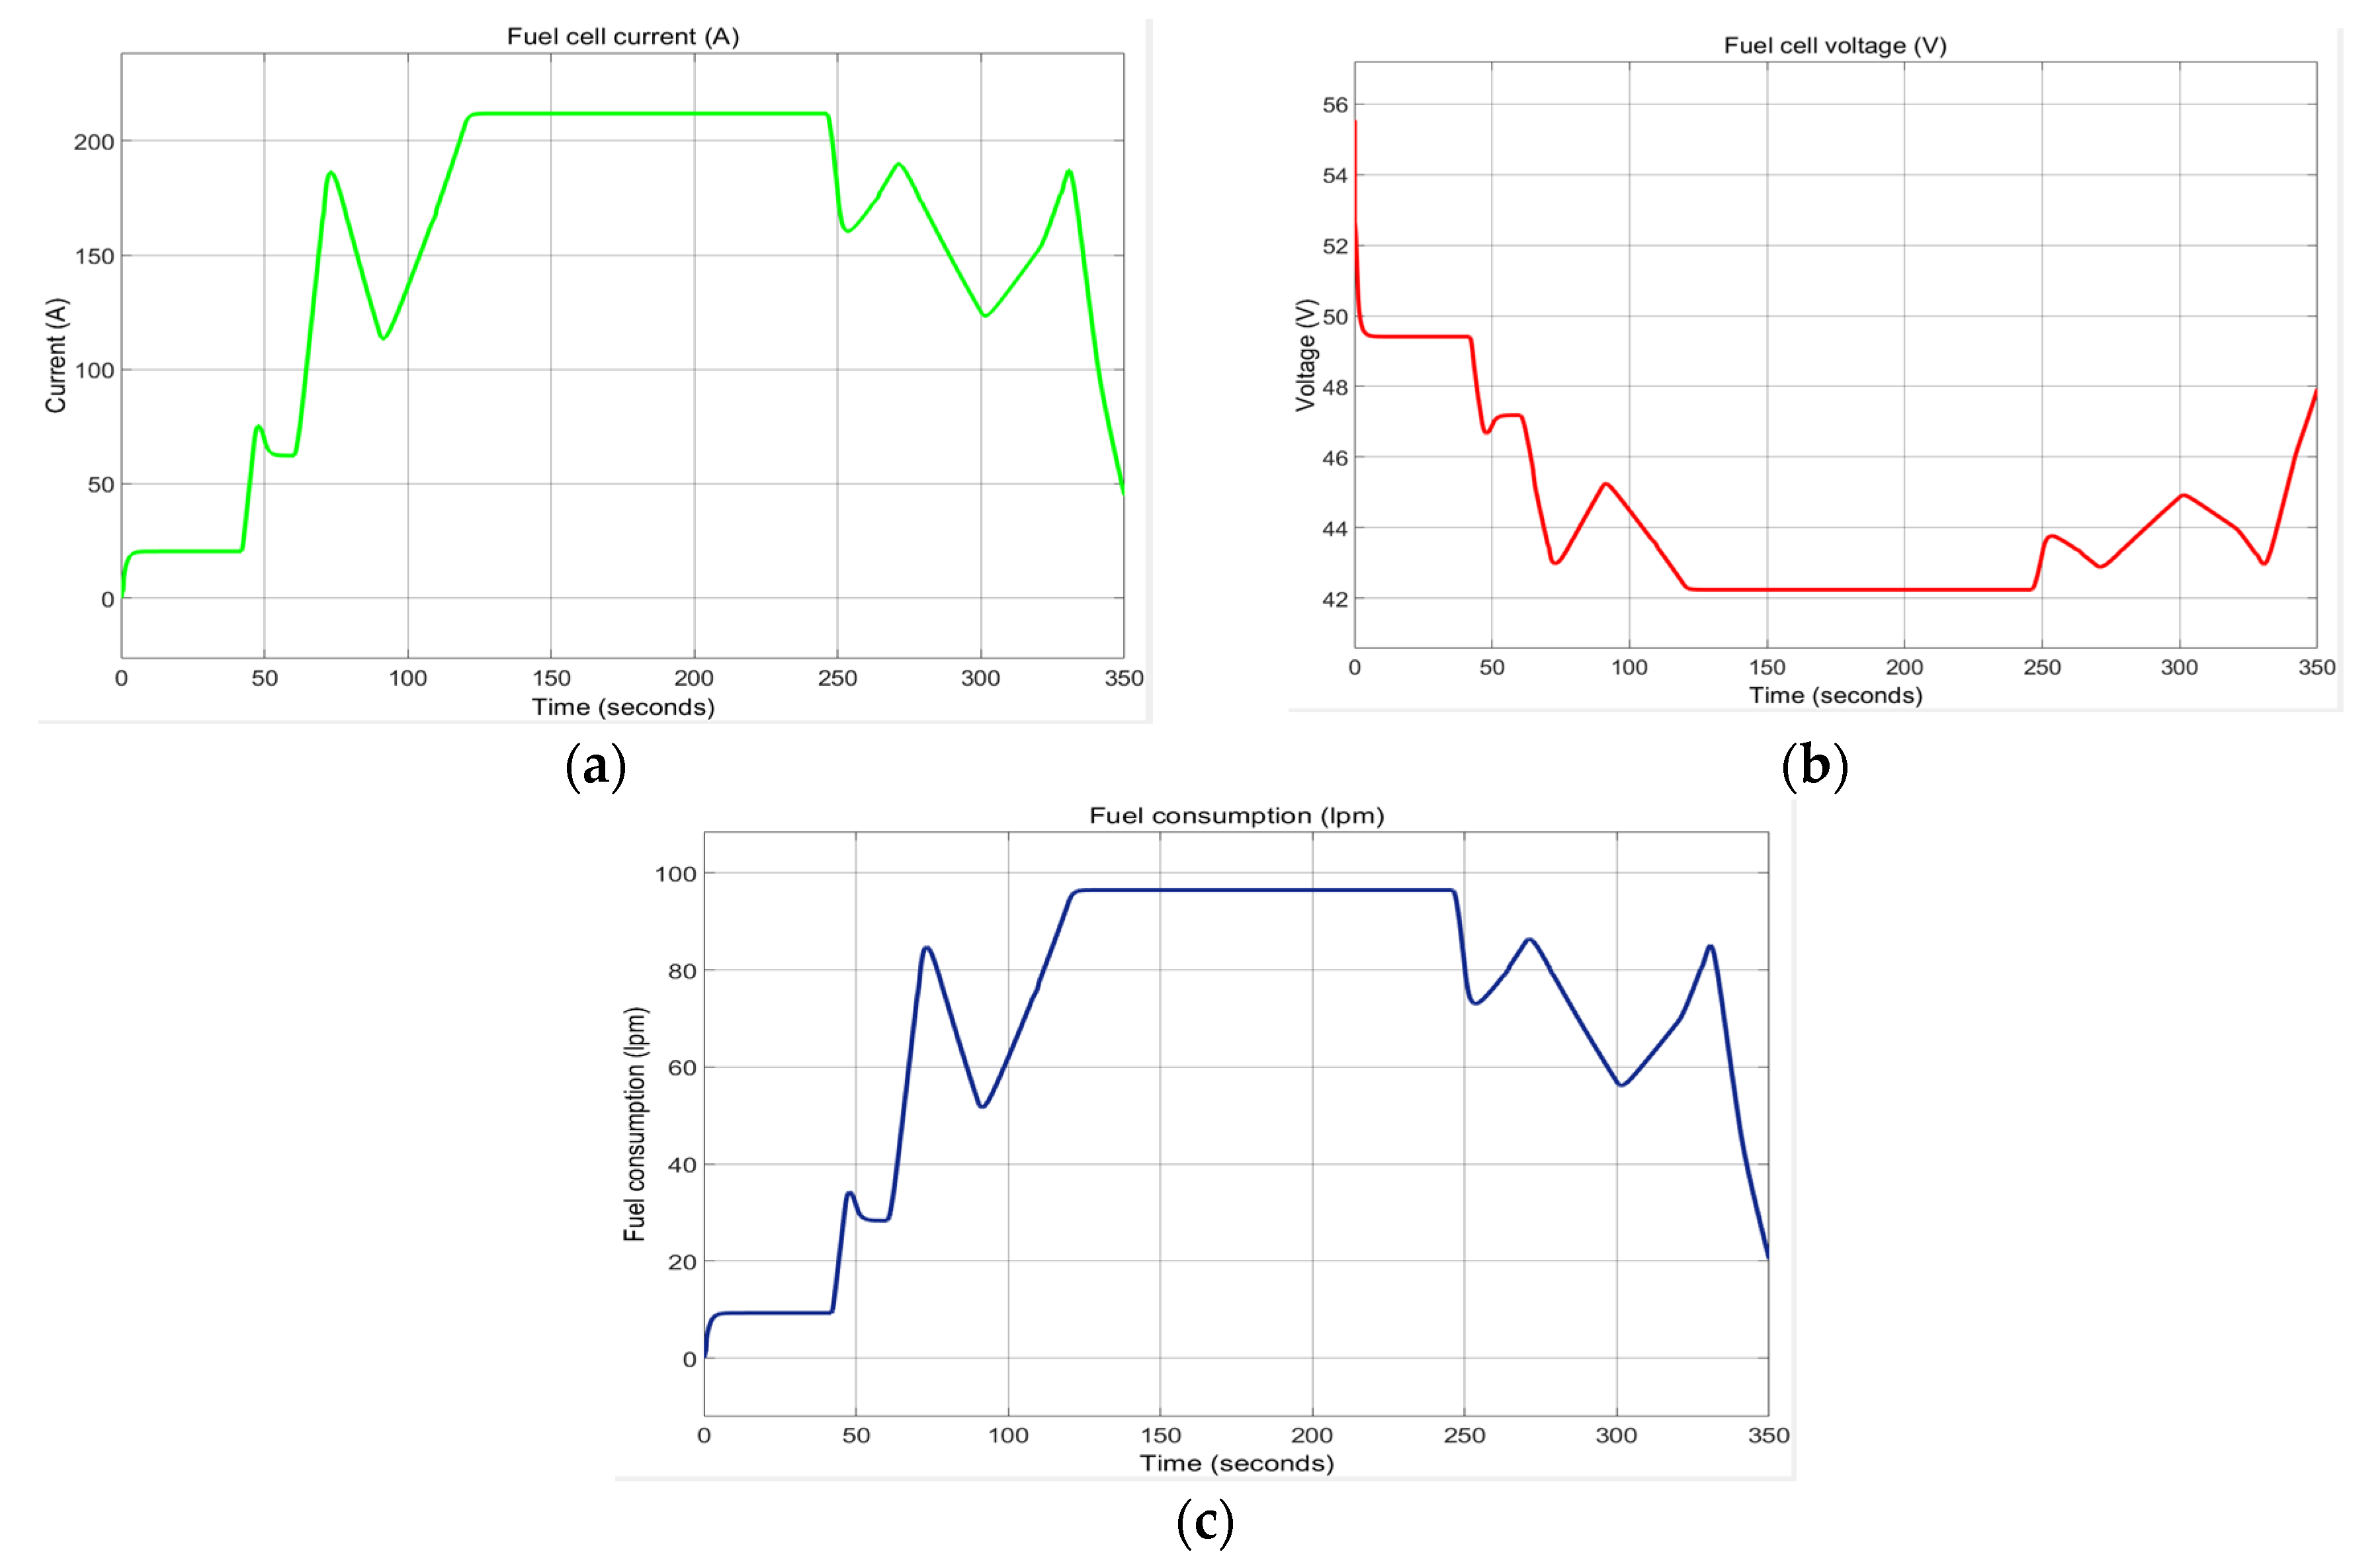
Figure A4. Fuel cell. (a) FC current; (b) FC voltage; (c) FC consumption.
Batteries 06 00041 g0a4
Figure A5. Li-ion battery specific variables. (a) Battery current; (b) Battery voltage; (c) Battery SOC.
Batteries 06 00041 g0a5
Figure A6. SC specific variables. (a) SC current variation; (b) SC voltage.
Batteries 06 00041 g0a6
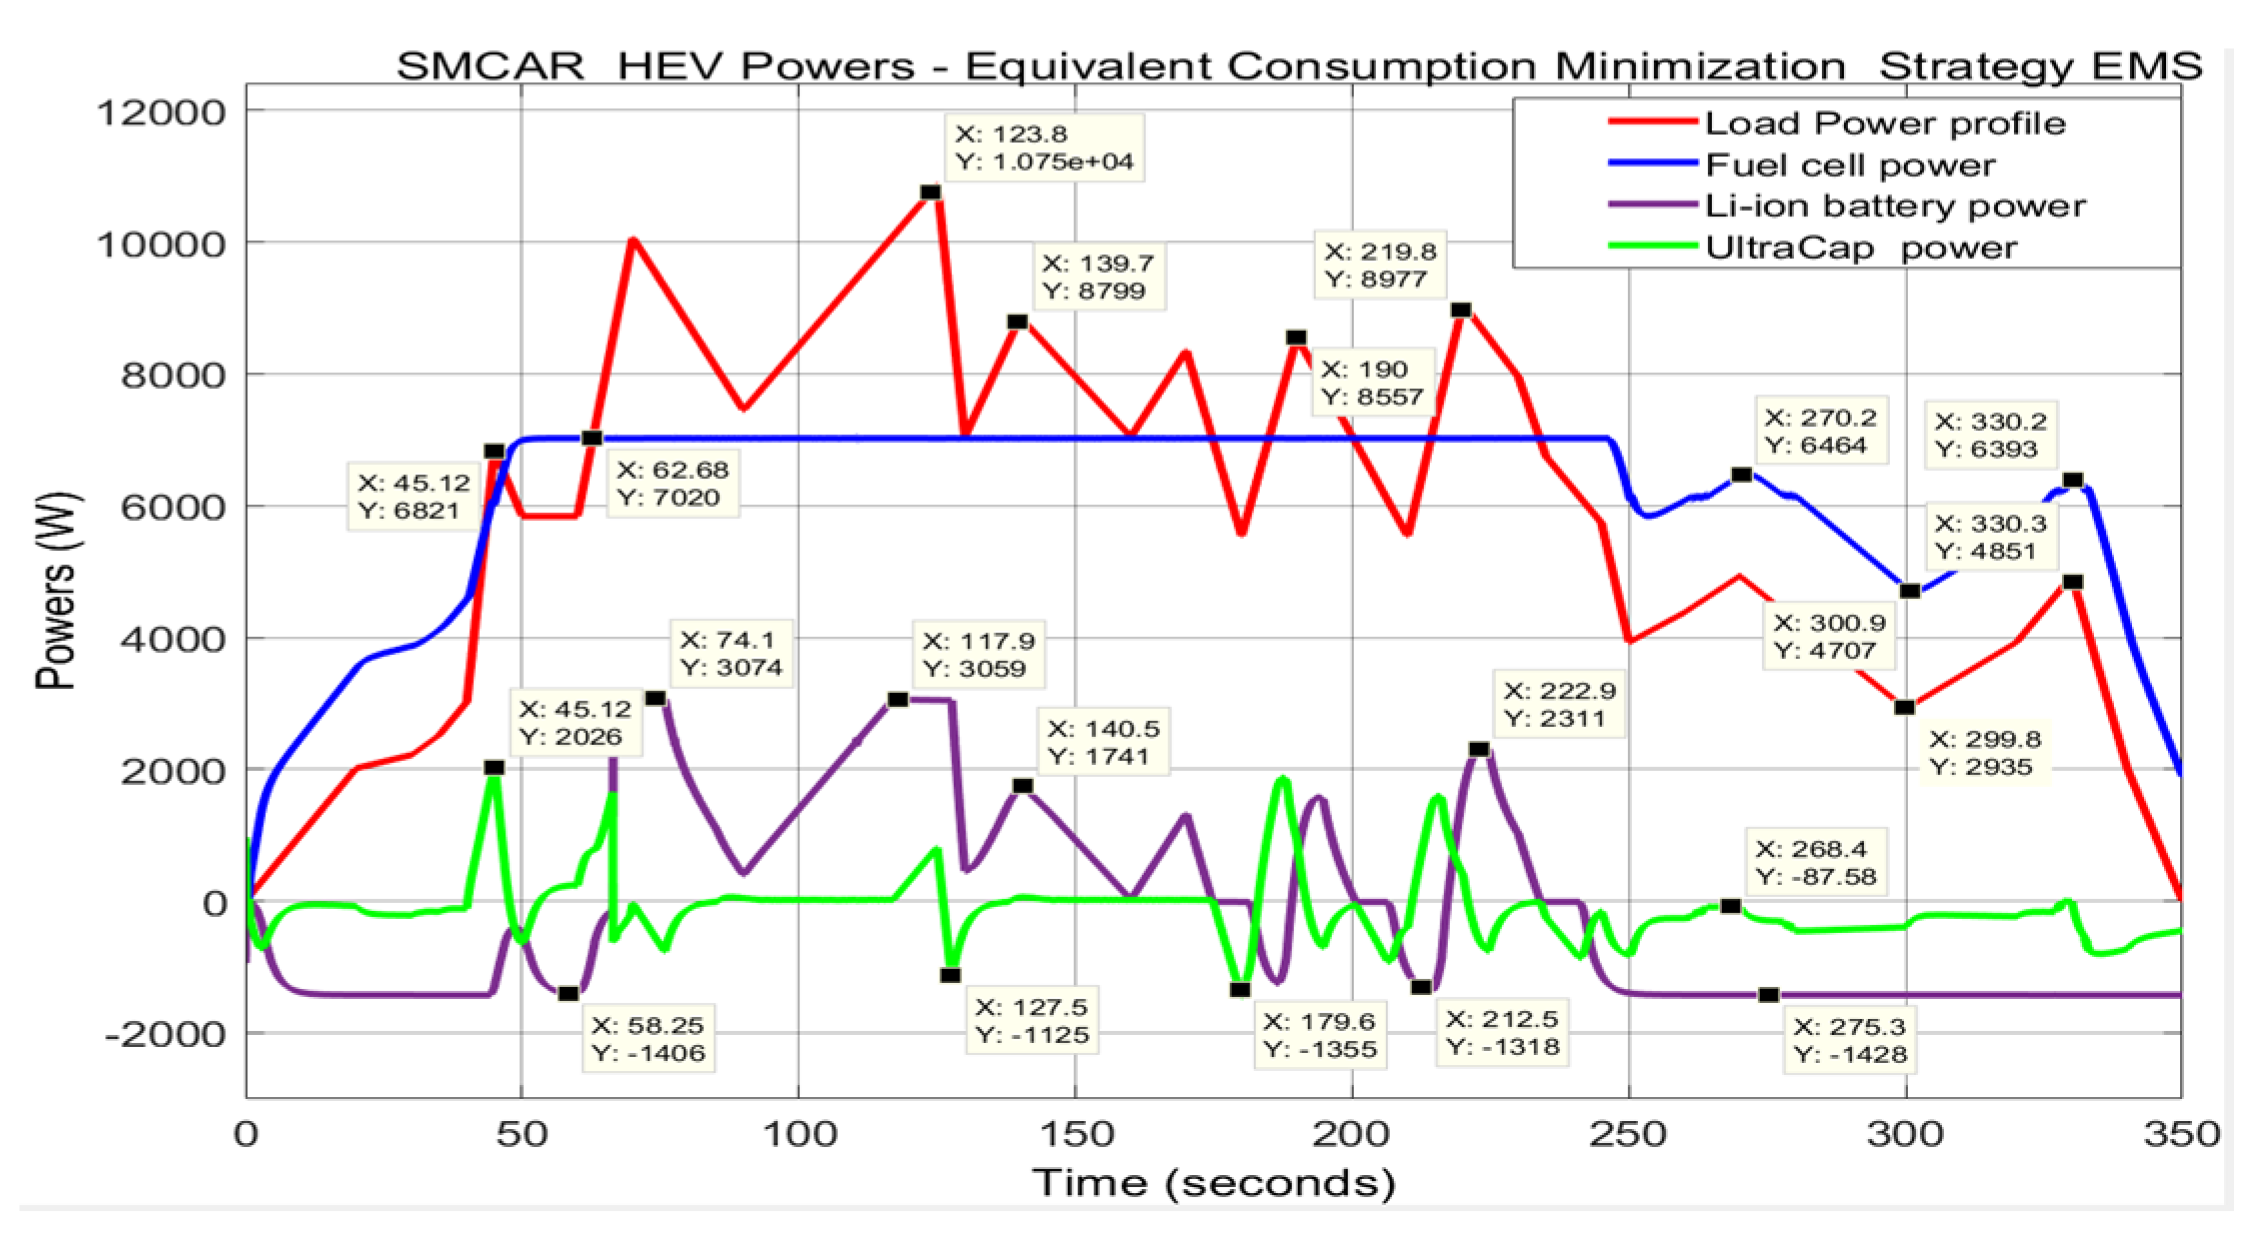
Figure A7. EMS—Equivalent Consumption Minimization Strategy setup.
Batteries 06 00041 g0a7
Figure A8. SMCAR HEV Powers—Equivalent Consumption Minimization EMS.
Batteries 06 00041 g0a8
Figure A9. Fuel cell. (a) FC current; (b) FC voltage; (c) FC consumption.
Batteries 06 00041 g0a9
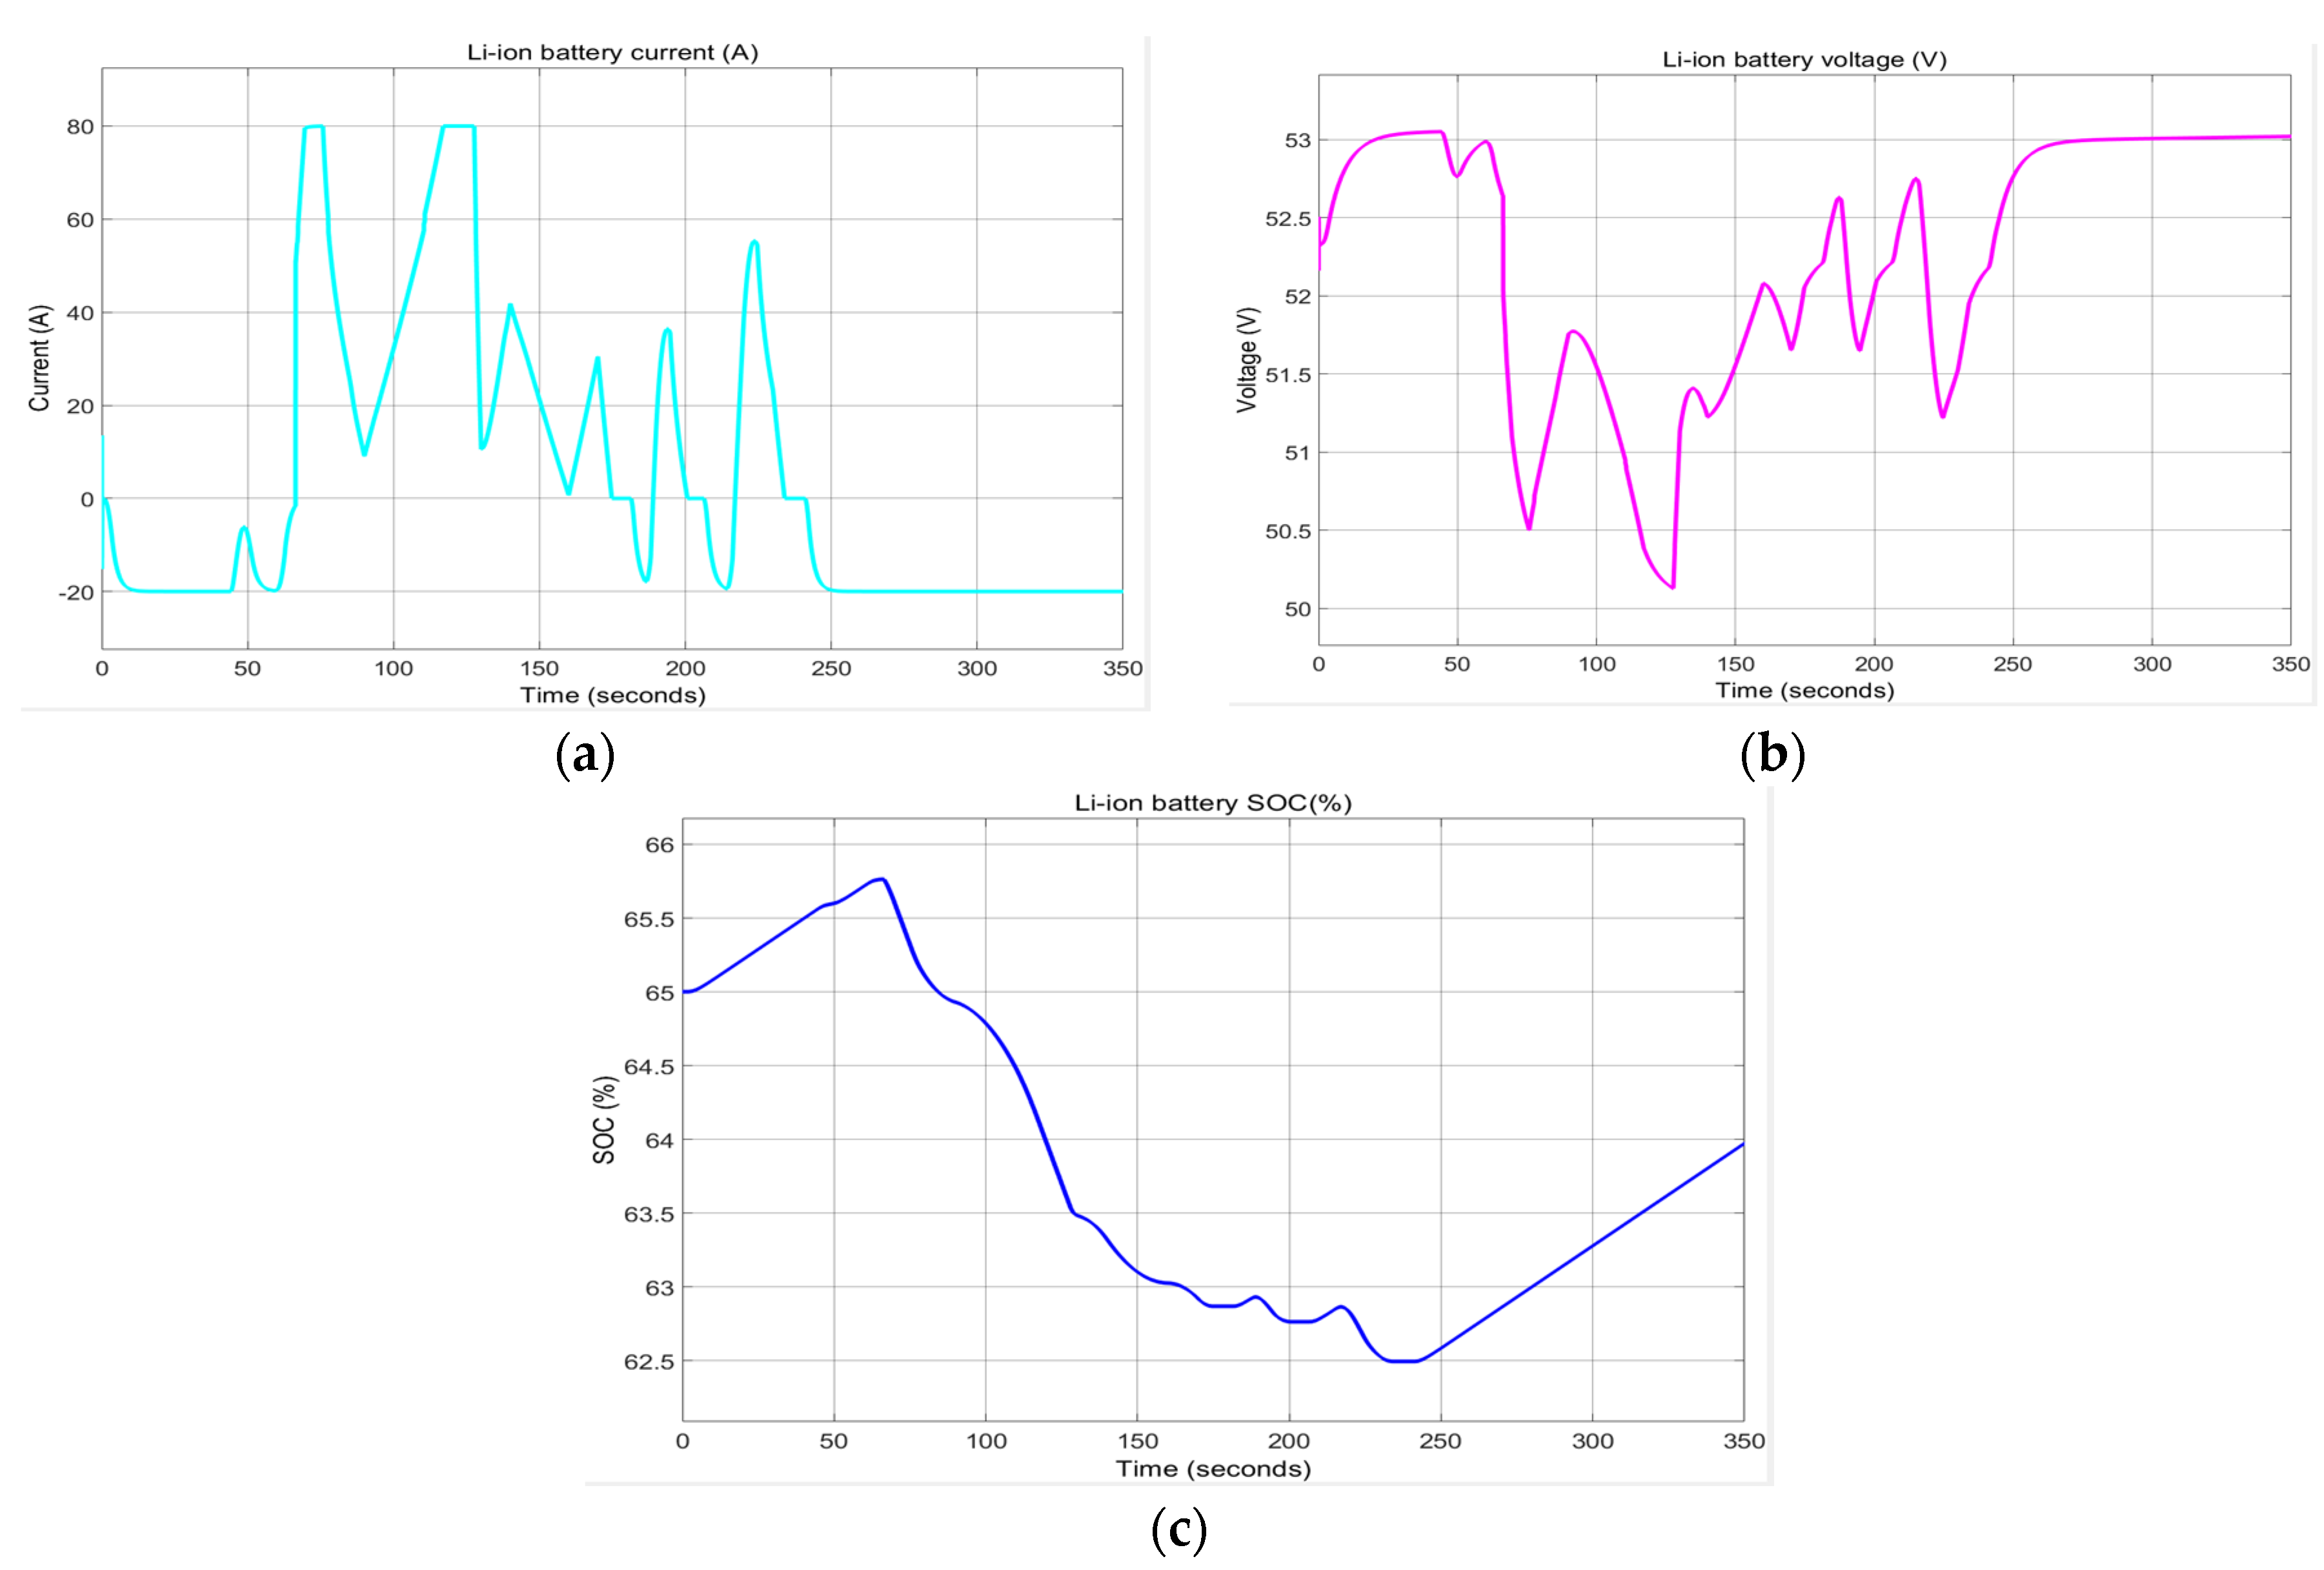
Figure A10. Li-ion battery specific variables. (a) Battery current; (b) Battery voltage; (c) Battery SOC.
Batteries 06 00041 g0a10
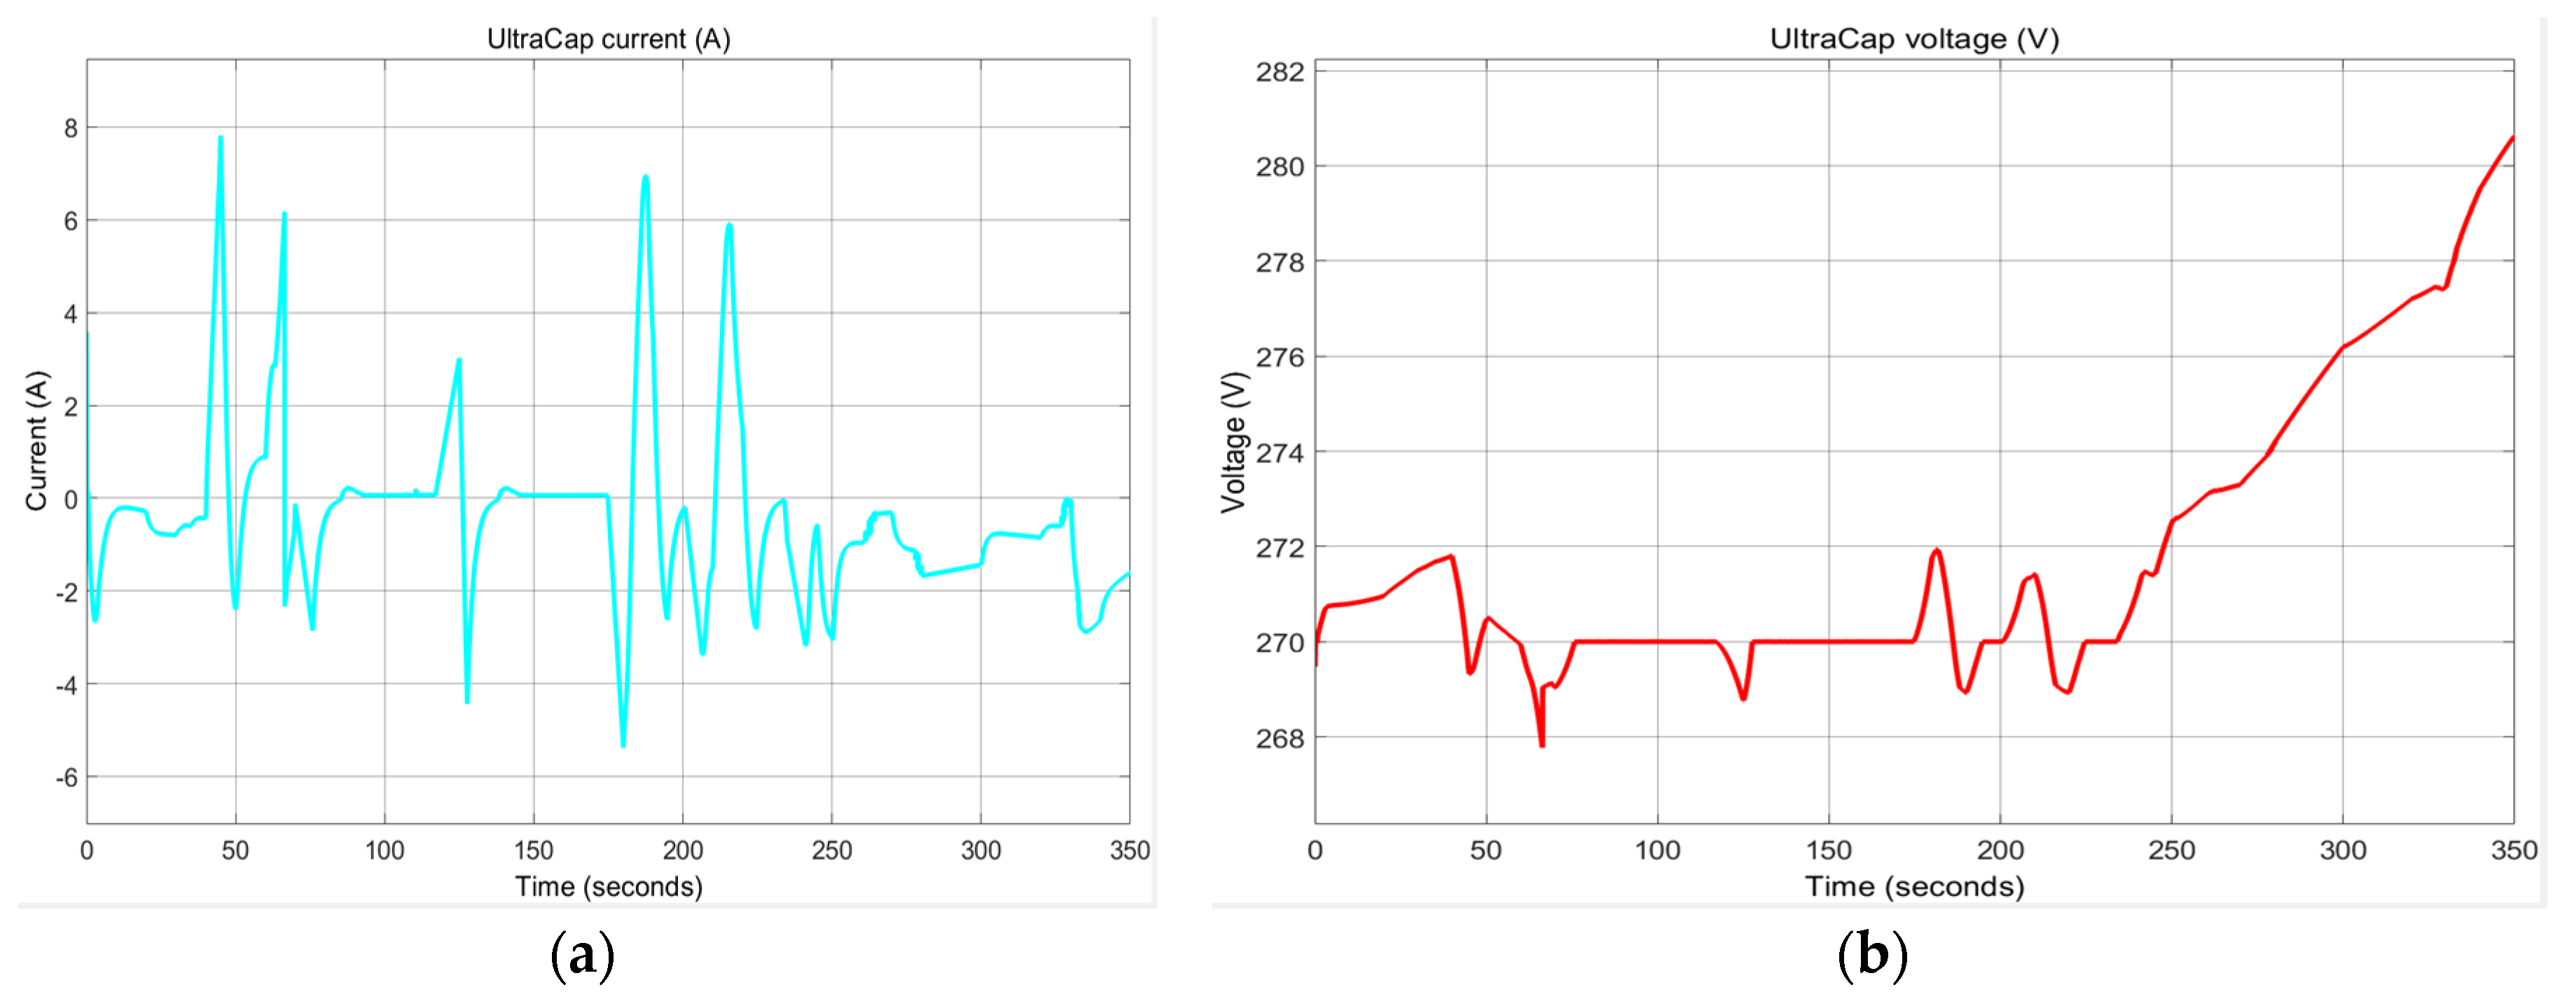
Figure A11. SC specific variables. (a) SC current variation; (b) SC voltage.
Batteries 06 00041 g0a11
  • 3RC EMC Li-Ion Battery Model—A EKF SOC Estimator.
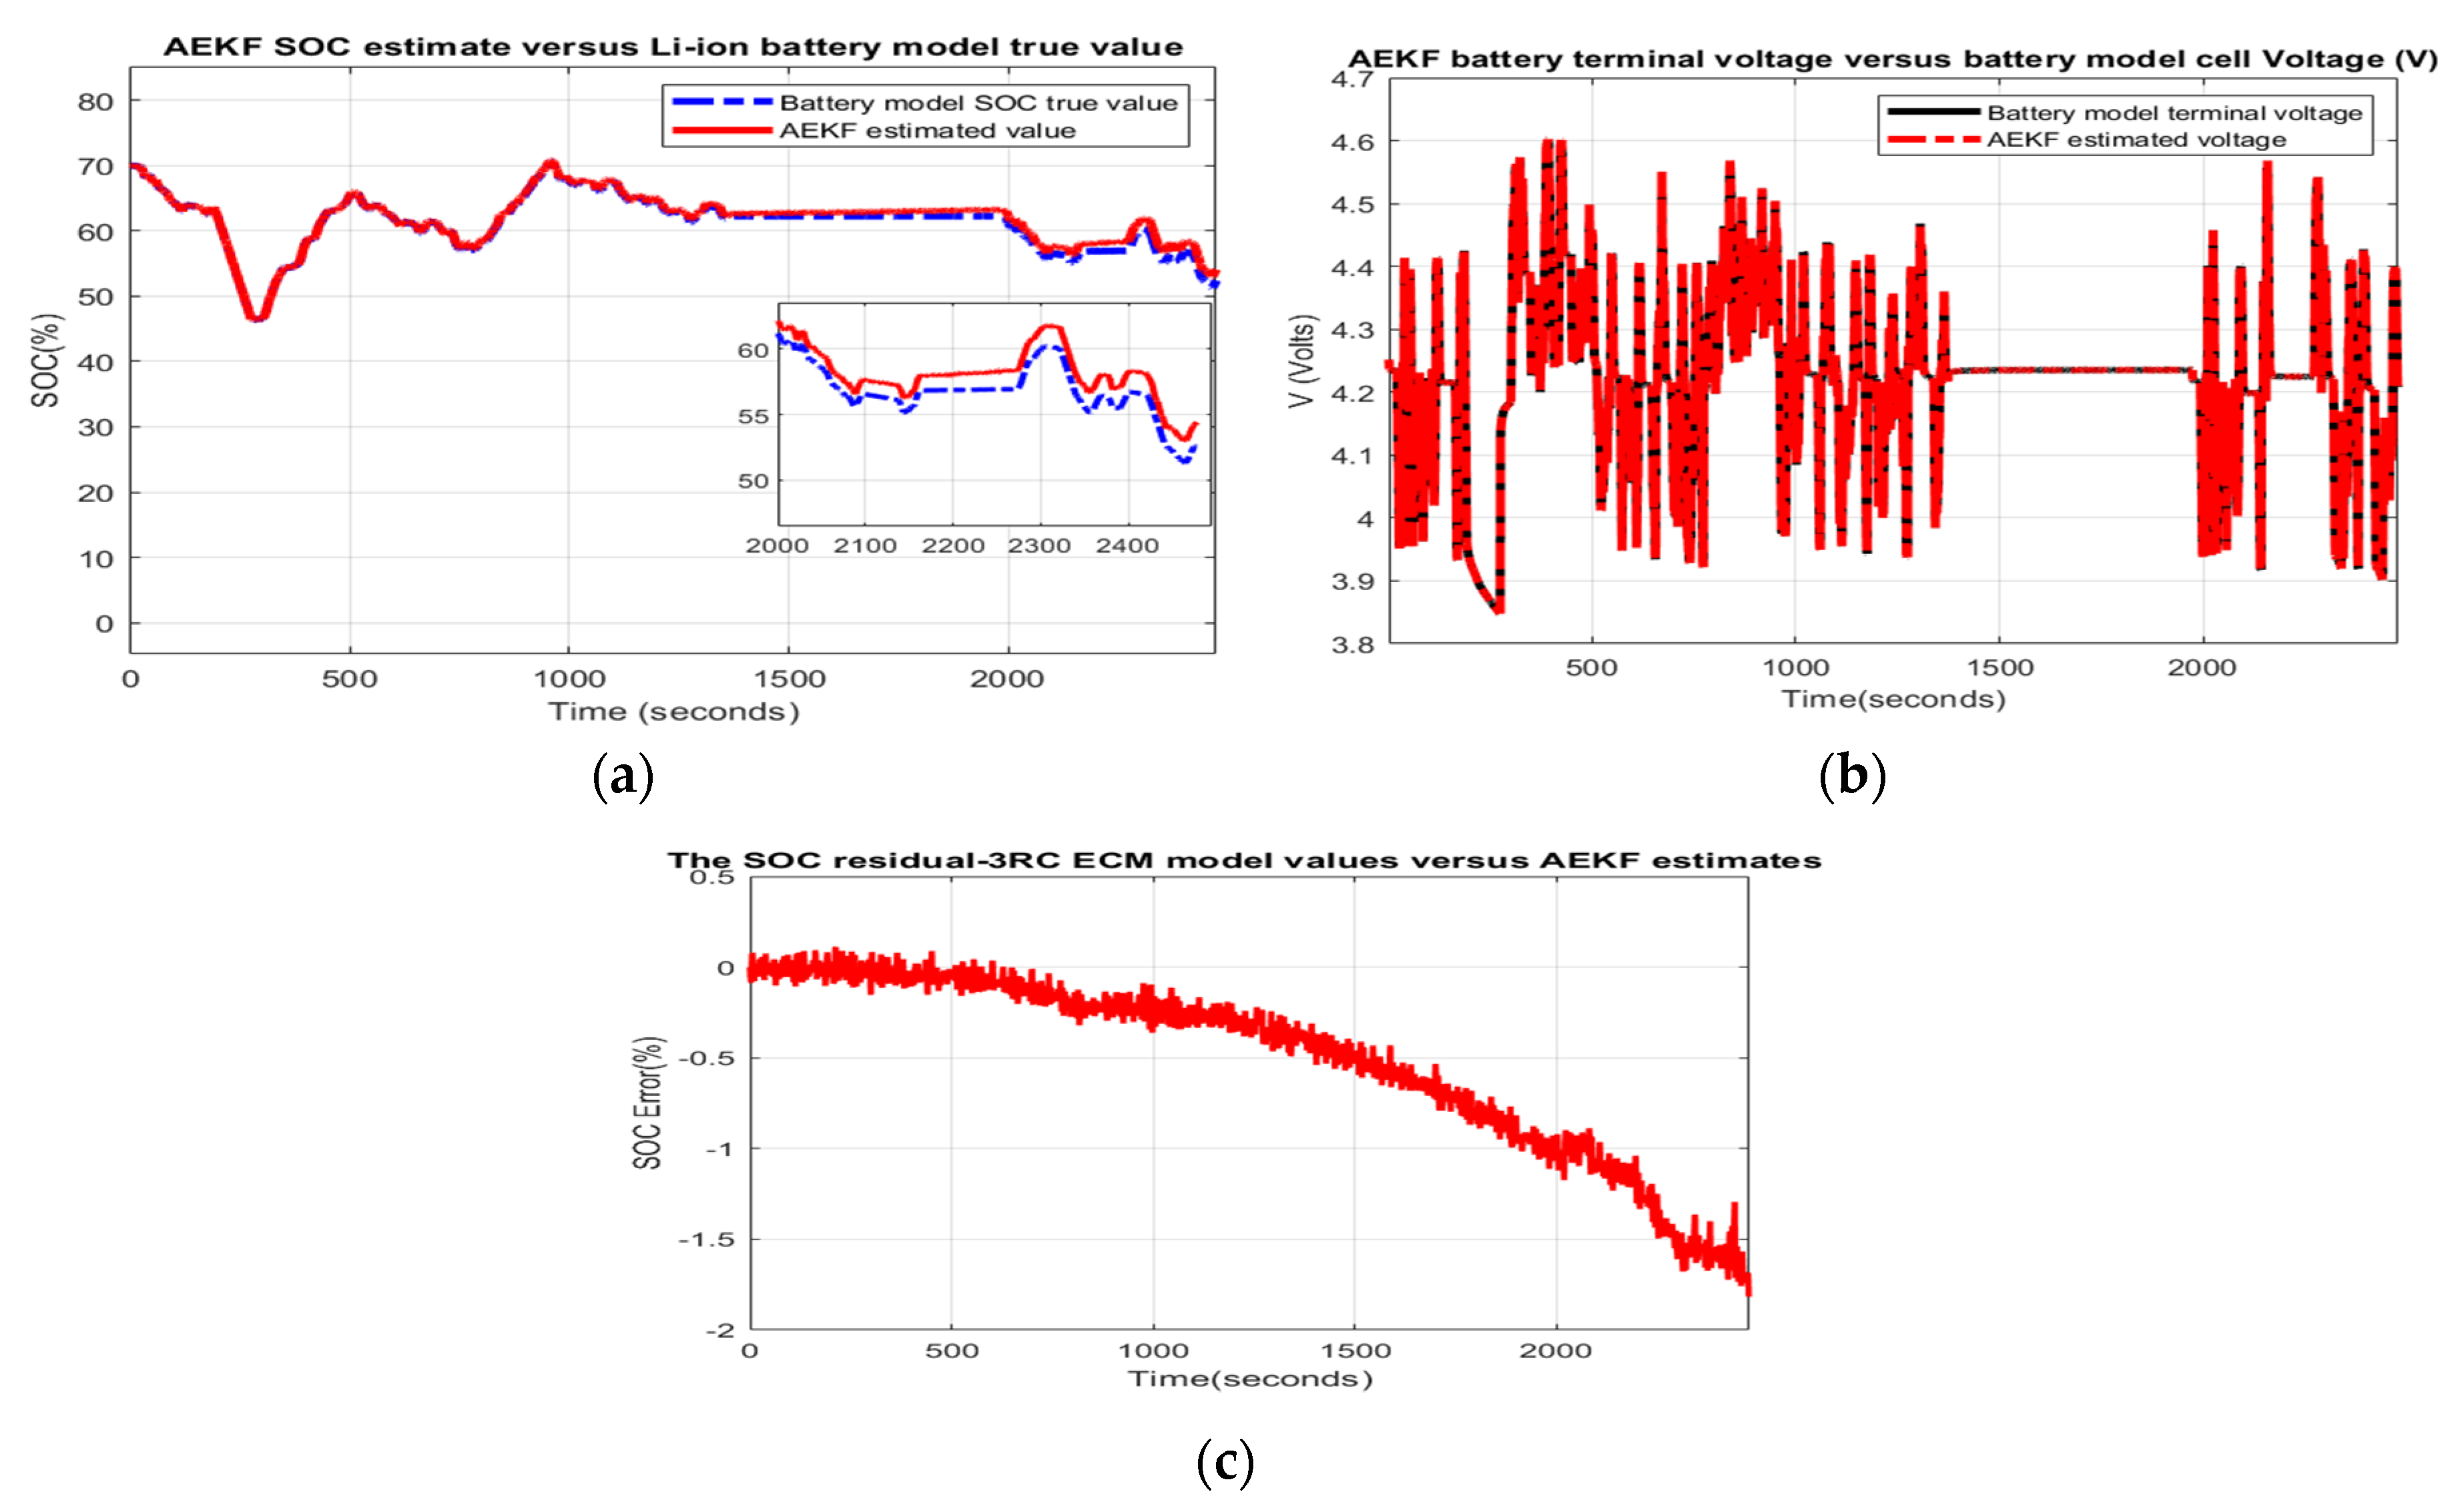
Figure A12. The MATLAB simulation results for Simulink Simscape Li-ion battery. (a) The AEKF SOC value versus battery model SOC true value; (b) The AEKF terminal output voltage versus battery model terminal output voltage true value; (c) The SOC residual.
Batteries 06 00041 g0a12
Figure A13. Robustness to changes in SOC initial value—SOCini = 0.4. (a)AEKF SOC estimate versus battery SOC true value; (b) SOC residual.
Batteries 06 00041 g0a13
Figure A14. Robustness to simultaneous changes, SOCini = 0.4, σ noise = 0.01; (a) AEKF SOC value versus battery model true value; (b) SOC residual.
Batteries 06 00041 g0a14
  • 3 RC AEKF Li-ion Battery Simscape Model.
Figure A15. The MATLAB simulation results for Simulink Simscape Li-ion battery. (a) The AEKF SOC value versus battery model SOC true value; (b) The AEKF terminal output voltage versus battery model terminal output voltage true value; (c) The SOC residual.
Batteries 06 00041 g0a15
Figure A16. Robustness to changes in SOC initial value—SOCini = 0.4. (a)AEKF SOC estimate versus battery SOC true value; (b) SOC residual.
Batteries 06 00041 g0a16
Figure A17. Robustness to simultaneous changes, SOCini = 0.4, σ noise = 0.01; (a) AEKF SOC value versus battery model true value; (b) SOC residual.
Batteries 06 00041 g0a17
  • AUKF 3RC EMC Li-ion Battery Model
Figure A18. The MATLAB simulation results for Simulink 3RC ECM Li-ion battery. (a) The AUKF SOC value versus battery model SOC true value; (b) The AUKF terminal output voltage versus battery model terminal output voltage true value; (c) The SOC residual.
Batteries 06 00041 g0a18
Figure A19. Robustness to changes in SOC initial value—SOCini = 0.4. (a)AUKF SOC estimate versus battery SOC true value; (b) SOC residual.
Batteries 06 00041 g0a19
Figure A20. Robustness to simultaneous changes, SOCini = 0.4, σ noise = 0.01; (a) AUKF SOC value versus battery model true value; (b) SOC residual.
Batteries 06 00041 g0a20
  • AUKF Li-ion Battery Simscape Model
Figure A21. The MATLAB simulation results for Simulink Simscape Li-ion battery. (a) The AUKF SOC value versus battery model SOC true value; (b) The AUKF terminal output voltage versus battery model terminal output voltage true value; (c) The SOC residual.
Batteries 06 00041 g0a21
Figure A22. Robustness to changes in SOC initial value—SOCini = 0.4. (a) AUKF SOC estimate versus battery SOC true value; (b) SOC residual.
Batteries 06 00041 g0a22
Figure A23. Robustness to simultaneous changes, SOCini = 0.4, σ noise = 0.01; (a) AUKF SOC value versus battery model true value; (b) SOC residual.
Batteries 06 00041 g0a23
  • PFE 3RC ECM Li-ion Battery Model
Figure A24. The MATLAB simulation results for Simulink Simscape Li-ion battery. (a) The PFE SOC value versus battery model SOC true value; (b) The PFE terminal output voltage versus battery 3RC ECM model terminal output voltage true value; (c) The SOC residual.
Batteries 06 00041 g0a24
Figure A25. Robustness to changes in SOC initial value—SOCini = 0.4. (a) PFE SOC estimate versus 3RC ECM Li-ion battery SOC true value; (b) SOC residual.
Batteries 06 00041 g0a25
Figure A26. Robustness to simultaneous changes, SOCini = 0.4, σ noise = 0.01; (a) PFE SOC value versus 3RC ECM Li-ion battery model true value; (b) SOC residual.
Batteries 06 00041 g0a26
Figure A27. The MATLAB simulation results for Simulink Simscape Li-ion battery. (a) The PFE SOC value versus battery model SOC true value; (b) The PFE terminal output voltage versus battery model terminal output voltage true value; (c) The SOC residual.
Batteries 06 00041 g0a27
Figure A28. Robustness to changes in SOC initial value—SOCini = 0.4. (a) PFE SOC estimate versus battery SOC true value; (b) SOC residual.
Batteries 06 00041 g0a28
  • Scenario R3: Robustness to simultaneous changes, namely in SOCini (SOCini = 0.4), and measurement noise level, e.g., an increase in noise level 10 times (σ noise = 0.01).
Figure A29. Robustness to simultaneous changes, SOCini = 0.4, σ noise = 0.01; (a) PFE SOC value versus Simscape battery model true value; (b) SOC residual.
Batteries 06 00041 g0a29

Appendix A.2. Tables

Table A1. Statistical errors—SOC estimates versus Li-ion battery Simscape model SOC values—Scenario R1 (SOCini = 0.4).
PerformanceLi-Ion Battery 3RC ECM
σ = 0.03713
Li-Ion Battery Simulink Simscape Model, σ= 0.036248
AEKFAUKFPFAEKFAUKFPF
RMSE0.01010.02890.02840.01850.02830.0163
MSE1.02450.000080.00080.000340.00080.0002
MAE0.00620.001110.02260.06660.01520.0119
Standard deviation (σ)0.04310.04330.05240.03650.0440.0379
MAPE (%)1.0342.011.41.1562.711.89
R20.9480.6360.4040.7370.5980.8019
Table A2. Statistical errors—SOC estimates versus Li-ion battery Simscape model SOC values—Scenario R2: (SOCini = 1, Qnom = 4.2 Ah).
PerformanceLi-Ion Battery 3RC ECM
σ = 0.03713
Li-Ion Battery Simulink Simscape Model
σ = 0.036248
AEKFAUKFPFAEKFAUKFPF
RMSE0.01170.02840.0470.002480.04450.0146
MSE0.0001370.000080.002216.2e-60.001980.0002
MAE0.00990.02030.039980.01010.03190.112
Standard deviation (σ)0.04390.07280.06590.05520.0670.0433
MAPE (%)1.613.782.051.5584.911.77
R20.9300.64830.2860.38580.0130.840
Table A3. Statistical errors—SOC estimates versus Li-ion battery Simscape model SOC values—Scenario R3: (SOCini = 0.4, σ noise = 0.01).
Performance Li-Ion Battery 3RC ECM
σ = 0.03713
Li-Ion Battery Simulink Simscape Model, σ= 0.036248
AEKFAUKFPFAEKFAUKFPF
RMSE0.08120.02890.0160.01880.02520.012
MSE0.00660.00080.002210.000350.000630.0001
MAE0.07280.01090.39980.00290.008790.0083
Standard deviation (σ)0.04570.04330.06590.03790.0470.0366
MAPE (%)10.551.98982.050.521.5781.35
R2−2.340.6370.2860.7290.6810.892
RemarkFail the Test Pass the Test
Table A4. Statistical errors—SOC estimates versus Li-ion battery Simscape model SOC values—Scenario R4: (SOCini = 0.2, temperature effects on Rin and Kp).
PerformanceLi-Ion Battery 3RC ECM
σ = 0.03713
Li-Ion Battery Simulink Simscape Model, σ = 0.036248
AEKFAUKFPFEAEKFAUKFPFE
RMSE0.07890.0420.08660.02670.0360.0211
MSE0.00620.00180.00750.0007140.00120.0004
MAE0.06870.01590.06680.00740.00920.0167
Standard deviation (σ)0.05250.04640.09740.040.0520.0337
MAPE (%)10.53.193.871.442.081.01
R2−2.1550.233−4.20.4560.3520.666

References

  1. Farag, M. Lithium-Ion Batteries, Modeling and State of Charge Estimation. Master’s Thesis, McMaster University of Hamilton, Hamilton, ON, Canada, 2013. [Google Scholar]
  2. Plett, G.L. Extended Kalman filtering for battery management systems of LiPB-based HEV battery packs: Part 3. State and parameter estimation. J. Power Sources 2004, 134, 277–292. [Google Scholar] [CrossRef]
  3. Tudoroiu, R.-E.; Zaheeruddin, M.; Radu, S.-M.; Tudoroiu, N. Real-Time Implementation of an Extended Kalman Filter and a PI Observer for State Estimation of Rechargeable Li-Ion Batteries in Hybrid Electric Vehicle Applications—A Case Study. Batteries 2018, 4, 19. [Google Scholar] [CrossRef] [Green Version]
  4. Tudoroiu, R.-E.; Zaheeruddin, M.; Radu, S.M.; Tudoroiu, N. New Trends in Electrical Vehicle Powertrains-Chapter 4. In New Trends in Electrical Vehicle Powertrains, 4th ed.; Martinez, L.R., Prieto, M.D., Eds.; IntechOpen: London, UK, 2019. [Google Scholar] [CrossRef]
  5. Tudoroiu, N.; Zaheeruddin, M.; Tudoroiu, R.-E. Real Time Design and Implementation of State of Charge Estimators for a Rechargeable Li-ion Cobalt Battery with Applicability in HEVs/EVs-A comparative Study. Energies 2020, 13, 2749. [Google Scholar] [CrossRef]
  6. Zhang, R.; Xia, B.; Li, B.; Cao, L.; Lai, Y.; Zheng, W.; Wang, H.; Wang, W. State of the Art of Li-ion Battery SOC Estimation for Electrical Vehicles. Energies 2018, 11, 1820. [Google Scholar] [CrossRef] [Green Version]
  7. Simon, J.J.; Uhlmann, J.K. A New Extension of the Kalman Filter to Nonlinear Systems. In Proceedings of the SPIE 3068, Signal Processing, Sensor Fusion, and Target Recognition VI, Orlando, FL, USA, 28 July 1997; p. 3068. Available online: https://people.eecs.berkeley.edu/~pabbeel/cs287-fa09/readings/JulierUhlmann-UKF.pdf (accessed on 21 January 2018).
  8. Ge, B.; Zhang, H.; Jiang, L.; Li, Z.; Butt, M.M. Adaptive Unscented Kalman Filter for Target Tracking with Unknown Time-Varying Noise Covariance. Sensors 2019, 19, 1371. [Google Scholar] [CrossRef] [PubMed] [Green Version]
  9. Han, J.; Song, Q.; He, Y. Adaptive Unscented Kalman Filter and its Applications in Nonlinear Control. In Kalman Filter: Recent Advances and Applications; Moreno, V.M., Pigazo, A., Eds.; I-Tech: Vienna, Austria, 2009; pp. 1–24. [Google Scholar]
  10. Tudoroiu, N.; Radu, S.M.; Tudoroiu, R.-E. Improving Nonlinear State Estimation Techniques by Hybrid. Structures, 1st ed.; LAMBERT Academic Publishing: Saarbrucken, Germany, 2017; p. 56. ISBN 978-3-330-04418-0. [Google Scholar]
  11. Arulampalam, M.S.; Maskell, S.; Gordon, N.; Clapp, T. A tutorial on particle filters for online nonlinear/non-Gaussian Bayesian tracking. IEEE Trans. Signal Process. 2002, 50, 174–188. [Google Scholar] [CrossRef] [Green Version]
  12. Alvarez, J.M.; Sachenbacher, M.; Ostermeier, D.; Stadlbauer, H.J.; Hummitzsch, U.; Alexeev, A. Analysis of the State of the Art on BMS; Everlasting D6.1 Report; Lion Smart GmbH: Munchen, Germany, 2017. [Google Scholar]
  13. Chang, W.-Y. The State of Charge Estimating Methods for Battery: A Review. ISRN Appl. Math. 2013, 2013, 953792. [Google Scholar] [CrossRef]
  14. Lee, S.J.; Kim, J.H.; Lee, J.M.; Cho, B.H. The state and parameter estimation of an Li-Ion battery using a new OCV-SOC concept. In Proceedings of the 2007 Power Electronics Specialists conference, Orlando, FL, USA, 17–21 June 2007; pp. 2799–2803. [Google Scholar]
  15. He, H.; Liu, Z.; Hua, Y. Adaptive Extended Kalman Filter Based Fault Detection, and Isolation for a Lithium-Ion Battery Pack. Energy Procedia 2015, 75, 1950–1955. [Google Scholar] [CrossRef] [Green Version]
  16. Zhao, Y.; Xu, J.; Wang, X.; Mei, X. The Adaptive Fading Extended Kalman Filter SOC Estimation Method for Lithium-ion Batteries. Energy Procedia 2018, 145, 357–362. [Google Scholar] [CrossRef]
  17. Feng, K.; Huang, B.; Li, Q.; Yan, H. Online Estimation of battery SOC for Electric Vehicles Based on An Improved AEKF. E3S Web Conf. 2019, 118, 02025. [Google Scholar] [CrossRef]
  18. Ma, M.; Qiu, D.; Tao, Q.; Zhu, D. Sate of Charge Estimation of a Lithium Ion Battery Based on Adaptive Kalman Filter Method for Equivalent Circuit Model. Appl. Sci. 2019, 9, 2765. [Google Scholar] [CrossRef] [Green Version]
  19. Cui, X.; Shen, W.; Zhang, Y.; Cungang, H. A Novel Active Online State of Charge Based Balancing Approach for Lithium-Ion Battery Packs during Fast Charging Process in Electric Vehicles. Energies 2017, 10, 1766. [Google Scholar] [CrossRef] [Green Version]
  20. Tudoroiu, R.-E.; Zaheeruddin, M.; Tudoroiu, N.; Radu, S.M. SOC Estimation of a Rechargeable Li-Ion Battery in fuel-Cell Hybrid Electric Vehicles-Comparative Study of Accuracy and Robustness performance Based on Statistical Criteria. Part I: Equivalent Models. Batteries 2020, 6, 40. [Google Scholar]
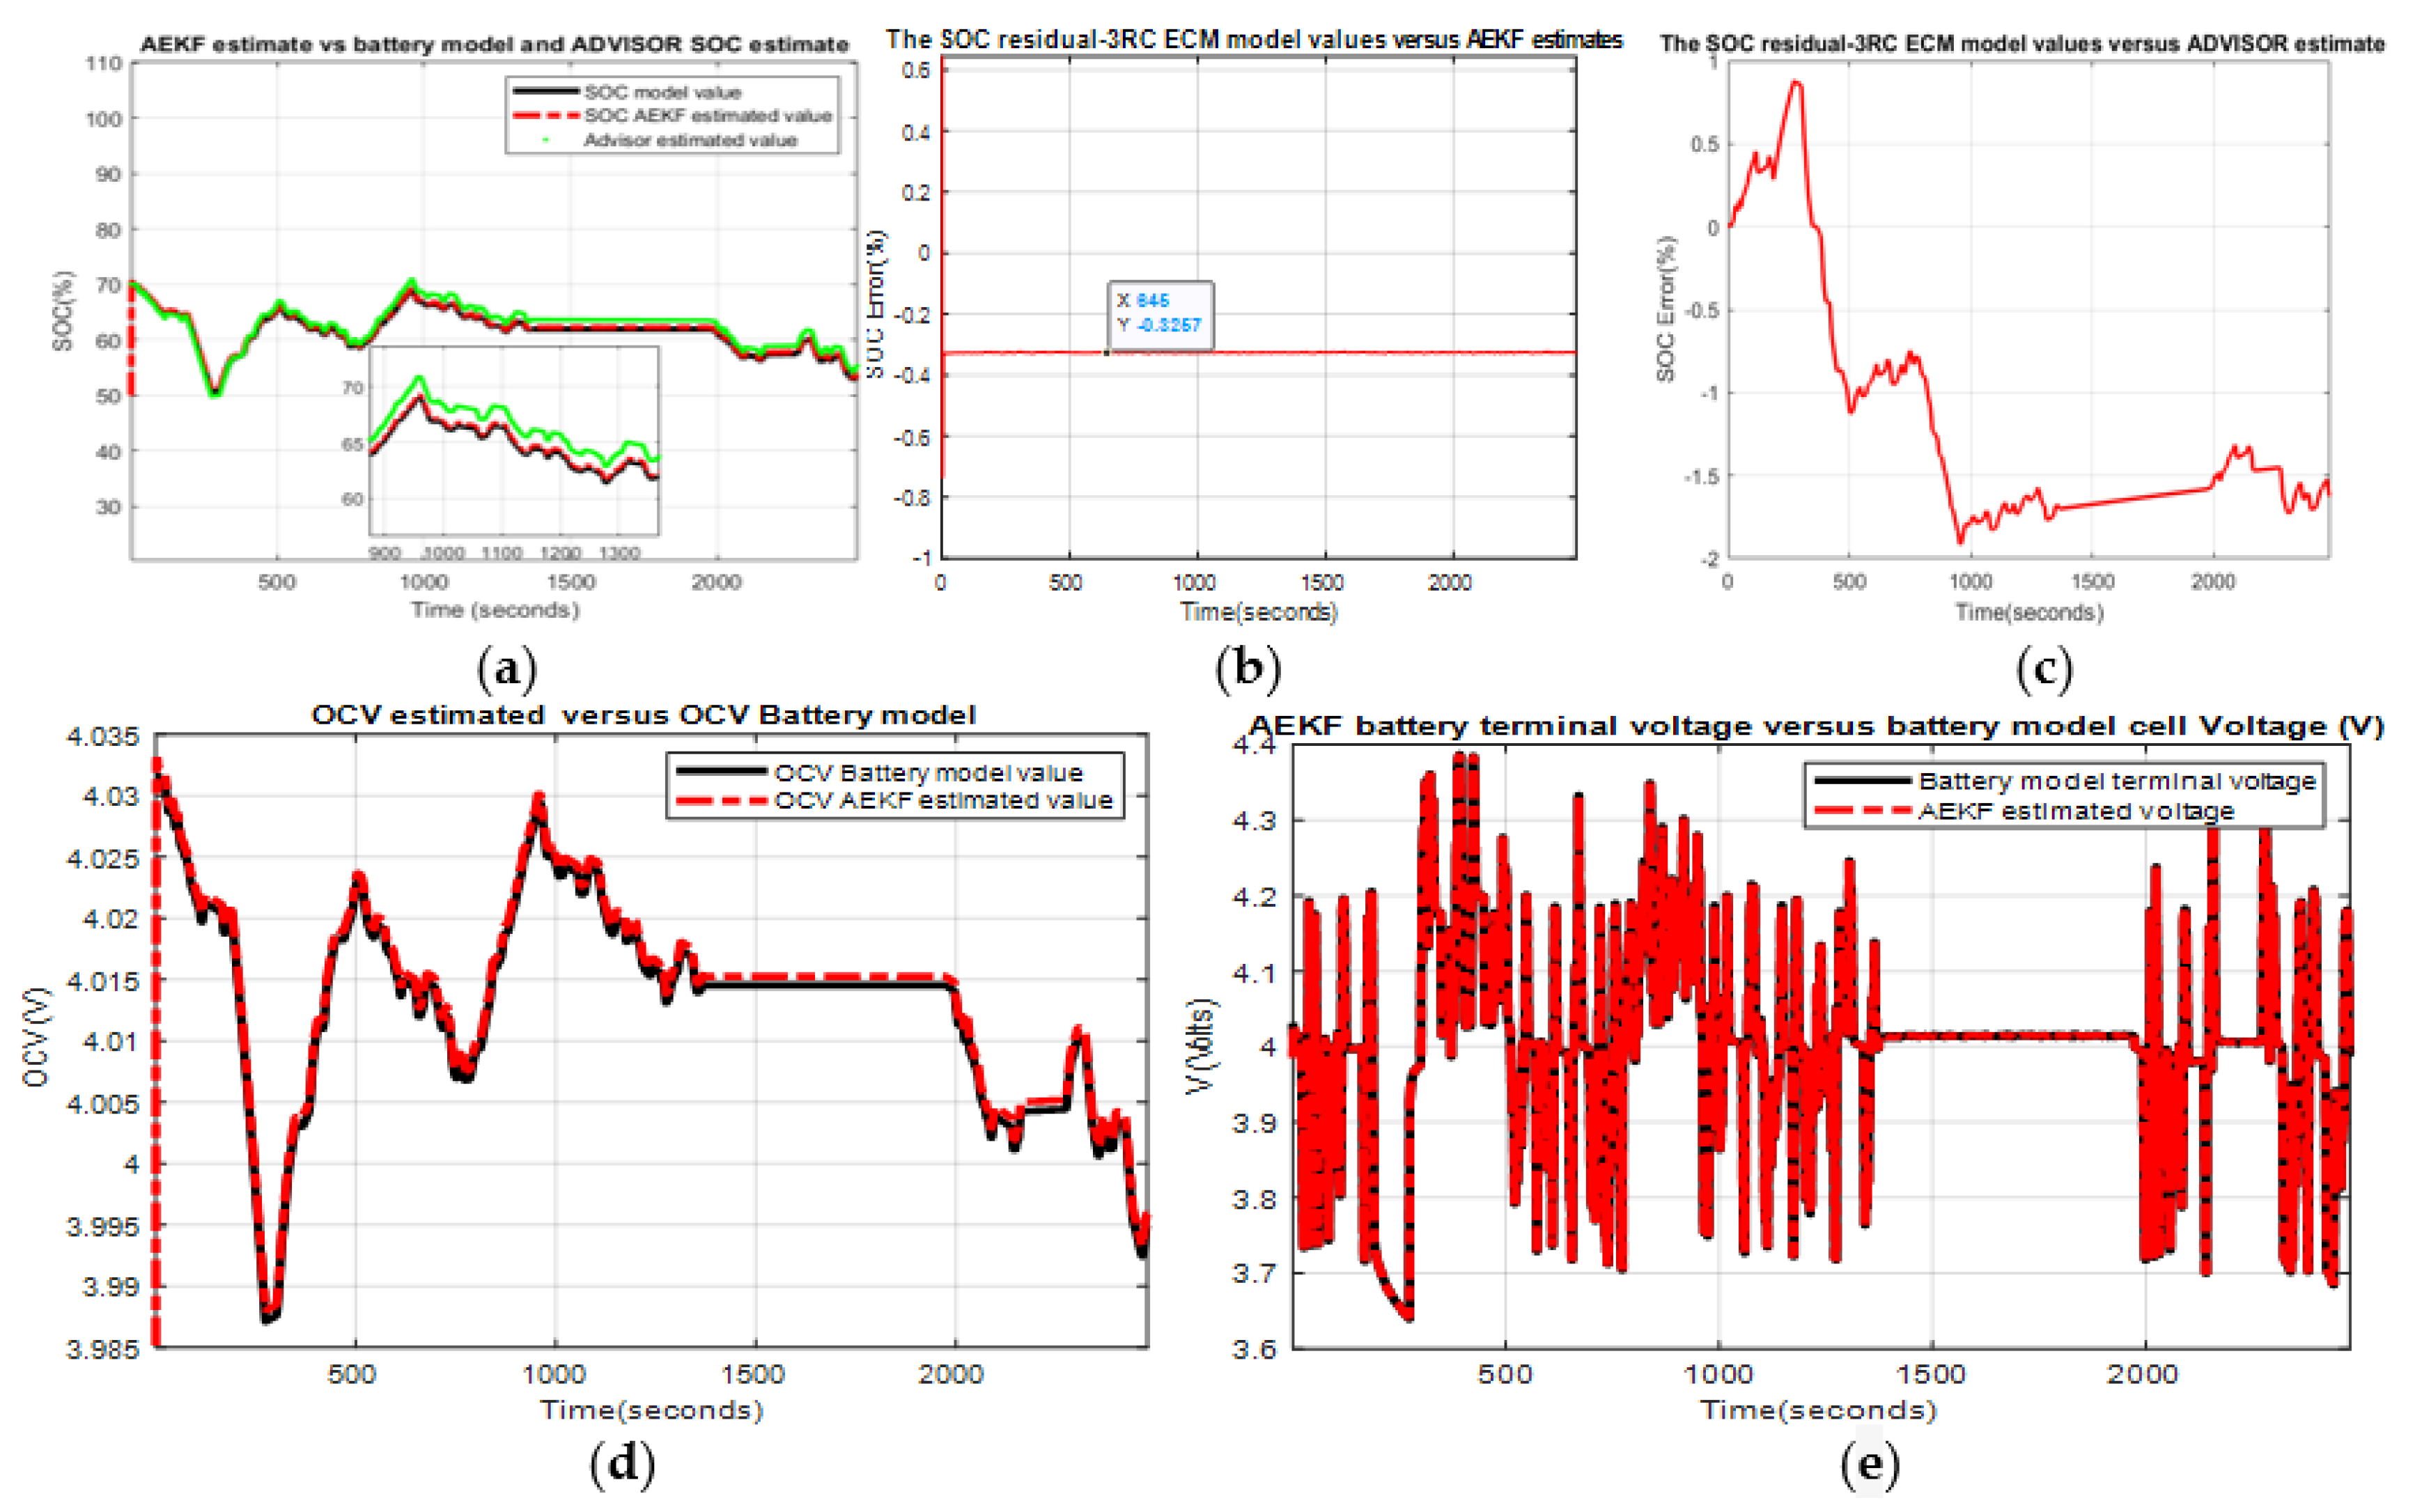
Figure 1. The Li-ion battery adaptive extended Kalman filter (AEKF) SOC and robustness performance for an initializing 20% SOC error (SOCini = 50%; SOCini for advanced vehicle simulator ADVISOR and battery model is 70%) (a) Li-ion battery model SOC (blue), ADVISOR SOC estimate (green), AEKF SOC (red); (b) SOC residual error AEKF vs ADVISOR SOC estimate; (c) SOC residual error AEKF vs battery model; (d) AEKF open-circuit voltage (OCV) vs battery model OCV (true value); (e) AEKF battery terminal output voltage vs battery model terminal output voltage (true value).
Batteries 06 00041 g001
Figure 2. Robustness to simultaneous changes, SOCini = 1, Qnom = 4.2 Ah (ageing effects); (a) AEKF SOC value versus battery model true value; (b) SOC residual.
Batteries 06 00041 g002
Figure 3. Robustness to simultaneous changes, SOCini = 0.2, and output temperature profile changes; (a) AEKF SOC value versus battery model true value; (b) SOC residual.
Batteries 06 00041 g003
Figure 4. Robustness to simultaneous changes, SOCini = 1, Qnom = 4.2 Ah (ageing effects); (a) AEKF SOC value versus battery model true value; (b) SOC residual.
Batteries 06 00041 g004
Figure 5. Robustness to simultaneous changes, SOCini = 0.2, and output temperature profile changes; (a) AEKF SOC value versus battery model true value; (b) SOC residual.
Batteries 06 00041 g005
Figure 6. Robustness to simultaneous changes, SOCini = 1, Qnom = 4.2 Ah (ageing effects); (a) AUKF SOC value versus battery model true value; (b) SOC residual.
Batteries 06 00041 g006
Figure 7. Robustness to simultaneous changes, SOCini = 0.2, and output temperature profile changes; (a) AUKF SOC value versus battery model true value; (b) SOC residual.
Batteries 06 00041 g007
Figure 8. Robustness to simultaneous changes, SOCini = 1, Qnom = 4.2 Ah (ageing effects); (a) AUKF SOC value versus battery model true value; (b) SOC residual.
Batteries 06 00041 g008
Figure 9. Robustness to simultaneous changes, SOCini = 0.2, and output temperature profile changes; (a) AUKF SOC value versus battery model true value; (b) SOC residual.
Batteries 06 00041 g009
Figure 10. Robustness to simultaneous changes, SOCini = 1, Qnom = 4.2 Ah (ageing effects); (a) PFE SOC value versus 3RC ECM battery model true value; (b) SOC residual.
Batteries 06 00041 g010
Figure 11. Robustness to simultaneous changes, SOCini = 0.2, and output temperature profile changes; (a) PFE SOC value versus 3RC ECM Li-ion battery model true value for changes only in Rin; (b) SOC residual for 20% changes in Rin.
Batteries 06 00041 g011
Figure 12. Robustness to simultaneous changes, SOCini = 1, Qnom = 4.2 Ah (ageing effects); (a) PFE SOC value versus battery model true value; (b) SOC residual.
Batteries 06 00041 g012
Figure 13. Robustness to simultaneous changes, SOCini = 0.2, and output temperature profile changes; (a) PFE SOC value versus battery model true value for changes only in Kp; (b) SOC residual for changes only in Kp; (c) PFE SOC value versus battery model true value for 10% changes only in Rin; (d) SOC residual for changes only in Rin.
Batteries 06 00041 g013
Table 1. Statistical criteria—state of charge (SOC) estimators (default value SOCini = 0.7).
PerformanceLi-Ion Battery 3RC ECM, σ = 0.03713Li-Ion Battery Simulink Simscape Model, σ = 0.036248
ADVAEKFAUKFPFEADVAEKFAUKFPFE
RMSE0.00750.0070.00520.023980.00790.00370.01350.0084
MSE0.000050.0000492.6 × 10−50.00056 × 10−51.4 × 10−70.000187 × 10⁻⁵
MAE0.00700.00510.00590.01790.00750.0002140.01270.0065
Standard deviation (σ)0.03840.0430.03690.05540.03840.0362420.0440.0358
MAPE (%)1.12490.8490.79721.081.19650.502.1781.06
R20.95910.8640.98050.6790.95150.9990.9080.946
Result Hierarchy 213 132
First place: 1; second place: 2; third place: 3.
Table 2. The response speed convergence of AEKF SOC, UAKF SOC and PFE SOC (in seconds). Qnom = 4.2 Ah (30% degradation of battery due to ageing effects) VarY = 0.001.
Li-Ion Battery Model3RC ECMSimscape
SOC EstimatorSOCini = 0.2SOCini = 0.4SOCini = 0.9SOCini = 0.2SOCini = 0.4SOCini = 0.9
AEKF1881021252325
AUKF194140170363430
PFE232235322628
Table 3. The Li-ion SOC estimator accuracy based on the SOC residual error (%).
Li-Ion Battery Model3RC ECMSimscape
SOC EstimatorAEKFAUKFPFEAEKFAUKFPFE
Figure A11<1.6
Figure A14 <0.4
Figure A17 <0.8
Figure A20 <2
Figure A23 < 8
Figure A26 <2
ResultGoodHighLowHighGoodGood