Article

Comparison of Single-Ion Conducting Polymer Gel Electrolytes for Sodium, Potassium, and Calcium Batteries: Influence of Polymer Chemistry, Cation Identity, Charge Density, and Solvent on Conductivity

Department of Chemical and Biomolecular Engineering, University of Notre Dame, Notre Dame, IN 46556, USA
*
Author to whom correspondence should be addressed.
Batteries 2020, 6(1), 11; https://doi.org/10.3390/batteries6010011
Submission received: 30 December 2019 / Revised: 25 January 2020 / Accepted: 10 February 2020 / Published: 13 February 2020
(This article belongs to the Special Issue Batteries: Feature Papers 2020)

Abstract

:
From the standpoint of material diversification and sustainability, the development of so-called “beyond lithium-ion” battery chemistries is important for the future of energy storage. Na, K, and Ca are promising as the basis for battery chemistries in that these elements are highly abundant. Here, a series of single-ion conducting polymer electrolytes (SIPEs) for Na, K, and Ca batteries are synthesized and investigated. The two classes of metal cation neutralized SIPEs compared are crosslinked poly(ethylene glycol) dimethacrylate-x-styrene sulfonate (PEGDMA-SS) and poly(tetrahydrofuran) diacrylate-x-4-styrenesulfonyl (trifluoromethylsulfonyl)imide (PTHFDA-STFSI); three cation types, three charge densities, and four swelling states are examined. The impact on conductivity of all of these parameters is studied, and in conjunction with small angle X-ray scattering (SAXS), it is found that promoting ion dissociation and preventing the formation of dense ionic aggregates facilitates ion transport. These results indicate many of the lessons learned from the Li SIPE literature can be translated to beyond Li chemistries. At 25 °C, the best performing Na/K and Ca exchanged polymers yield active cation conductivity on the order of 10−4 S/cm and 10−6 S/cm, respectively, for ethylene carbonate:propylene carbonate gelled SIPEs, and 10−5 S/cm and 10−7 S/cm, respectively, for glyme gelled SIPEs.

1. Introduction

Since the development of the lithium-ion rechargeable battery in the 1990s, there has been a revolution in consumer electronics. The proliferation of lithium-ion batteries is so widespread that there is a high likelihood that the reader enjoying this manuscript is doing so with the use of a lithium-ion powered device, with perhaps one or two more lithium-ion batteries in their pocket or around their office. The importance of this discovery cannot be understated, as Yoshino, Whittingham, and Goodenough were recently recognized with the 2019 Nobel Prize in Chemistry for their pioneering development of the lithium-ion battery. With the utility and significance of the lithium-ion battery at its height, it is a good time to acknowledge that the science of energy usage and storage is in the early stage of another major expansion, one that could dramatically alter the energy landscape.
Uses for the Li-ion battery did not end with small-scale consumer electronics. As the technology improved, it opened the possibility that rechargeable batteries could eliminate the need for fossil fuel based energy. Full electrification of transportation, coupled with grid-scale storage of renewables and grid load-leveling, are goals that promise to eliminate harmful greenhouse gas emissions. Li-ion has been considered for and is in early stage use in all of these areas; however, this is akin to using only a hammer to build an entire house; the next energy revolution will be realized when an energy storage need is paired with a specific chemistry best suited to the application. Each unique rechargeable battery chemistry presents its own set of tradeoffs; however, with a large portfolio of developed storage technologies, the tradeoffs could be matched to the application. Properly matching the battery chemistry to the intended application will make the realization of a carbon neutral future both economically and fundamentally possible.
In certain situations where power density and gravimetric capacity are key, such as small consumer electronics, Li battery technology may continue to dominate the market. However, for applications where requirements on gravimetric or volumetric capacities are less stringent, such as large scale renewable energy storage or vehicle electrification, secondary batteries based on alternative chemistries show great promise. Alkali and alkaline earth metals such as Na, K, Mg, and Ca have a far greater abundance in the earth’s crust and in seawater (see Figure 1) and more widespread distribution than Li [1,2]. From the perspective of material cost, scalability, and sustainability, rechargeable batteries based on these elements are highly attractive. Thus, as the scientific and economic constraints of the Li battery have started to become known, research interest in the development of beyond-lithium-ion batteries has been renewed.
In the development of the cell components for beyond Li-ion chemistries, it is often useful to take inspiration from the expansive body of work on lithium battery materials. An active area of research within the Li battery literature has been devoted to the development of polymer electrolytes, wherein all or part of the traditional volatile, flammable, organic liquid electrolyte is replaced by a polymer. Similarly, most of the state-of-the-art electrolytes for Ca, Na, K, Mg, Al, etc. consist of flammable organic liquids, which makes the development of polymer electrolytes for these systems likewise desirable. Of course, there are aqueous electrolytes for some of these systems, but a water based electrolyte limits the operable cell voltage (lowering the theoretical power) and prohibits the use of reactive metal anodes (limiting energy density). For the purposes of achieving a wider voltage window and high energy density cells, non-aqueous electrolytes and the challenges they pose must be considered.
Compared to the Li systems, beyond Li-ion polymer electrolytes have received far less attention. This is particularly true for a certain subset of polymer electrolytes known as single ion conducting polymer electrolytes (SIPEs). SIPEs are classified as a group of materials in which essentially all of the long-range ion transport can be attributed to the transport of the active cation. Such materials often contain covalently tethered ionic moieties that can dissociate, yielding a mobile cation and anchored anion. By preventing the motion of the anion, theoretically all of the ion transport observed stems from migration of the active cation. This approach prevents the formation of ionic concentration gradients and the continual degradation of anions on the electrodes, improving rate capability and life span, and reducing parasitic decomposition reactions [3,4].
Focusing specifically on the cations Na+, K+, and Ca2+, the work to date on SIPEs for these systems is summarized in Table 1, Table 2 and Table 3. A fair amount of work has been reported for Na+ exchanged SIPEs, a moderate amount for K+, and only a handful for Ca2+. Besides for one example published previously by our group, all of the Ca2+ SIPEs reported are based on perfluorinated sulfonic acid (i.e., Nafion) membranes that have been exchanged with Ca2+. The last two Ca2+ references, while not SIPEs, are included because they are related recent works on conventional Ca polymer electrolytes.
A common challenge for SIPEs regardless of cation is their low conductivity; the development of SIPEs with high conductivity is considered the main challenge in this field. A substantial conductivity must be achieved for these systems to be considered practical. Commonly, this benchmark is considered to be 1 × 10⁻⁴ S/cm for liquid electrolytes. For single-ion conductors, the threshold for practical use is slightly lower, as theoretically all of the observed conductivity can be attributed to the active cation [36]. As can be seen from the work above, a method for improving conductivity is to plasticize or gel the SIPE, wherein an amount of solvent is incorporated into the SIPE.
Of the SIPEs shown above that incorporate solvent, the most conductive are those that have been swelled in high-dielectric solvents such as water, DMSO, or mixtures of carbonates. The early work with Nafion exchanged to various cations was carried out to understand the inherent fundamental transport properties of Nafion, for applications in fuel cells, batteries, and sensors [6]. From the perspective of battery chemistry, only a select number of solvents are compatible with metal-ion electrodes, even fewer with full metal electrodes. Certainly, aqueous electrolytes have limited electrochemical stability windows and are not compatible with unprotected alkali and alkaline metal electrodes, nor with common intercalation cathodes such as lithium cobalt oxide [37]. Carbonates (especially for metal-ion cells) as well as ethereal solvents have received a great degree of attention as they have been demonstrated to present a stable high-voltage operating window and usually display electrode/electrolyte compatibility. These features make these classes of solvents of particular importance as SIPE plasticizers.
In this work we present and compare two gel SIPE systems for the K+, Na+, and Ca2+ cations, in the dry state, and gelled with either a mixture of ethylene carbonate and propylene carbonate (EC:PC), diglyme (DEG), or tetraglyme (TEG). These solvents are chosen for their low-volatility and their use in Ca2+, Na+, and K+ liquid electrolytes [38,39,40,41,42,43]. There are few reports that examine beyond-Li SIPEs for battery applications that incorporate these solvents, let alone compare a wide variety of SIPE chemistries, solvents, etc. under similar test conditions. By comparing a variety of SIPEs under identical conditions, we hope to uncover design principles for the engineering of better polymer electrolytes for beyond Li batteries.
The first class of SIPEs studied consists of entirely commercially available materials, which were among some of the first materials used for Li based SIPEs. These consist of poly(ethylene glycol) diamethacrylate (PEGDMA) copolymerized with ionic monomer styrene sulfonate (SS), resulting in freestanding crosslinked networks. The second set of SIPEs consists of components that, while similar to the commercial set at first glance, are designed specifically to enhance cation transport. The second system consists of synthesized components poly (tetrahydrofuran) diacrylate (PTHFDA) copolymerized with 4-styrenesulfonyl (trifluoromethylsulfonyl)imide (STFSI). Photos of the freestanding UV-crosslinked networks as well as their chemical structures are presented in Figure 2. The two distinct SIPE classes demonstrate the two extremes of possibility for beyond Li-ion SIPEs, namely the floor and approaching the current ceiling.
In exploring the K, Na, and Ca forms of these systems, we show that the fundamental transport insights gained from analogous Li systems can be translated to other cations. In doing so, design characteristics are identified for beyond Li-ion SIPEs, a crucial step for developing these new storage technologies and expanding the portfolio of rechargeable battery possibilities. This work builds on our recent reports on solvent-free lithium and beyond lithium SIPEs based on crosslinked PEG networks and gel SIPEs for Li and Mg batteries [18,44,45,46].

2. Results and Discussion

For each set of chemistries, the impact of cations (K+, Na+, Ca2+), charge density, and swelling state were examined. Three charge densities for each set of SIPEs were targeted, namely a low, medium, and high charge density. For the PEGMDA-SS polymers it was determined that these were 8, 12, and 16 × 10−4 mol of charge per total gram of monomers, respectively. For the PTHFDA-STFSI polymers it was determined that the low, medium, and high charge densities were 7, 10, and 13 × 10−4 mol of charge per gram of monomers, respectively. The nomenclature for the two classes of SIPEs is as follows: The PEGDMA (1000 g/mol)-x-styrene sulfonate of a given charge with a given cation is denoted PEGDMA1000_Ch_SSM. For example, a potassium exchanged SIPE with the lowest charge density would be denoted PEGDMA1000_low_SSK. The PTHFDA (1000 g/mol)-x-STFSI is similarly denoted PTHFDA1000_Ch_STFSIM.
In the following sections, the impact of each of the studied parameters on conductivity as a function of temperature is explored. For the sake of simplicity, a subset of the data is shown in each section that makes it easy to understand the impact of the given variable. Conductivity data for every permutation of the variables above was obtained, with all data that is not shown in the main text displayed in Appendix A, Appendix B and Appendix C as a function of cation, charge density, and swelling state, respectively. The main text figures present trends that are representative of the bulk data, and each section contains a discussion of the entire data set. Largely these results are interpreted in terms of Equation (1):
σ = q n i μ i
where for a single-ion conductor the conductivity σ is a function of the number density of charge carriers n, the charge on the carrier q, and the mobility of the charge carrier μ , recognizing that the charge carrier species may exist in different states that have different ion mobility.
From our previous work with Li and Mg exchanged SIPEs, we established that the PEGDMA-SS polymers have a lower conductivity due to the high dissociation energy of the sulfonate–cation pair (resulting in low n), the propensity of the PEGDMA crosslinker to coordinate with cations (reducing μ compared to solvent coordinated cations), and the tendency of these networks to form dense ionic aggregates (further lowering both n and μ ). The components of the PTHFDA-STFSI SIPE have opposite characteristics, which lead to their enhanced conductivity. These result in a major difference in ion conductivity between these two networks [46]. Additionally, it was found with similar systems that conductivity below 10−9 S/cm could be a mixture of electronic and conductivity [46]. The determination of electronic vs. conductivity was repeated here for the calcium exchanged SIPEs, but the results were inconclusive. Therefore, to be safe, conductivity values below 10−9 S/cm should be considered a mixture of ionic and electronic conductivity. It should be noted that electronic conductivity is not a desired characteristic for electrolytes.
After the various polymer variables are examined, the conductivity data are framed within the context of polymer morphology, as determined via small angle X-ray scatterings (SAXS) and solvent uptake measurements for a select set of SIPEs.

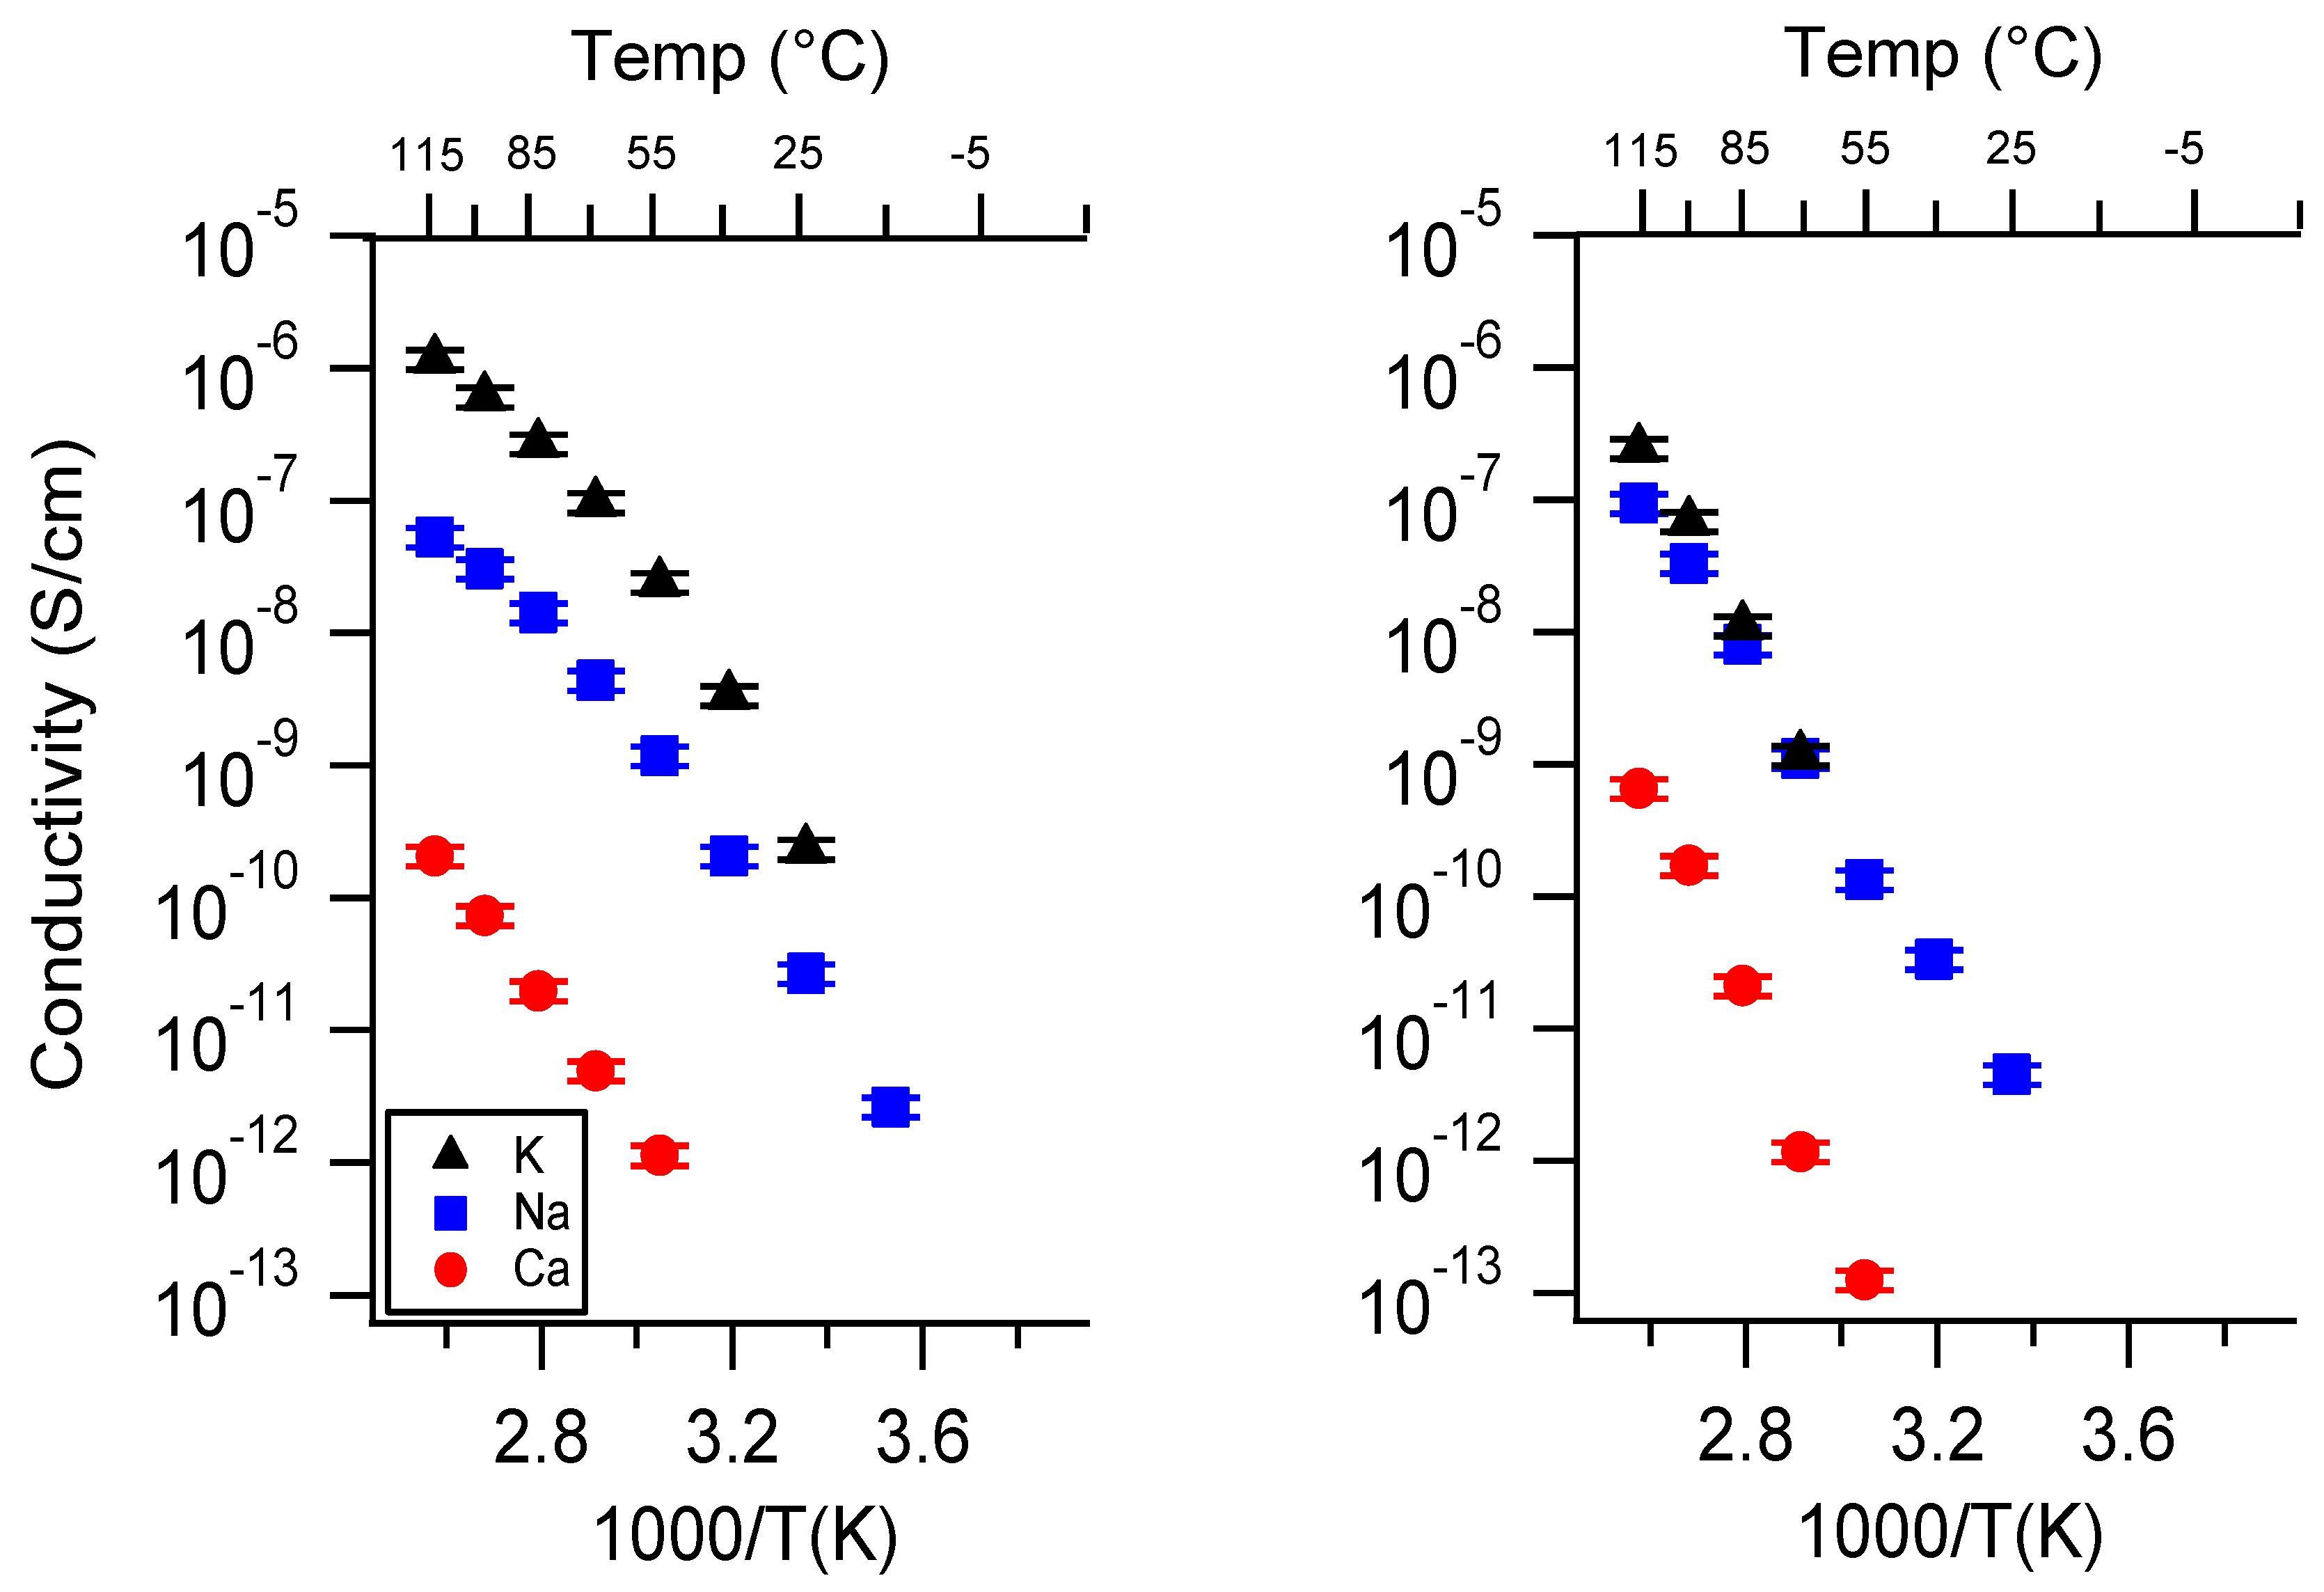
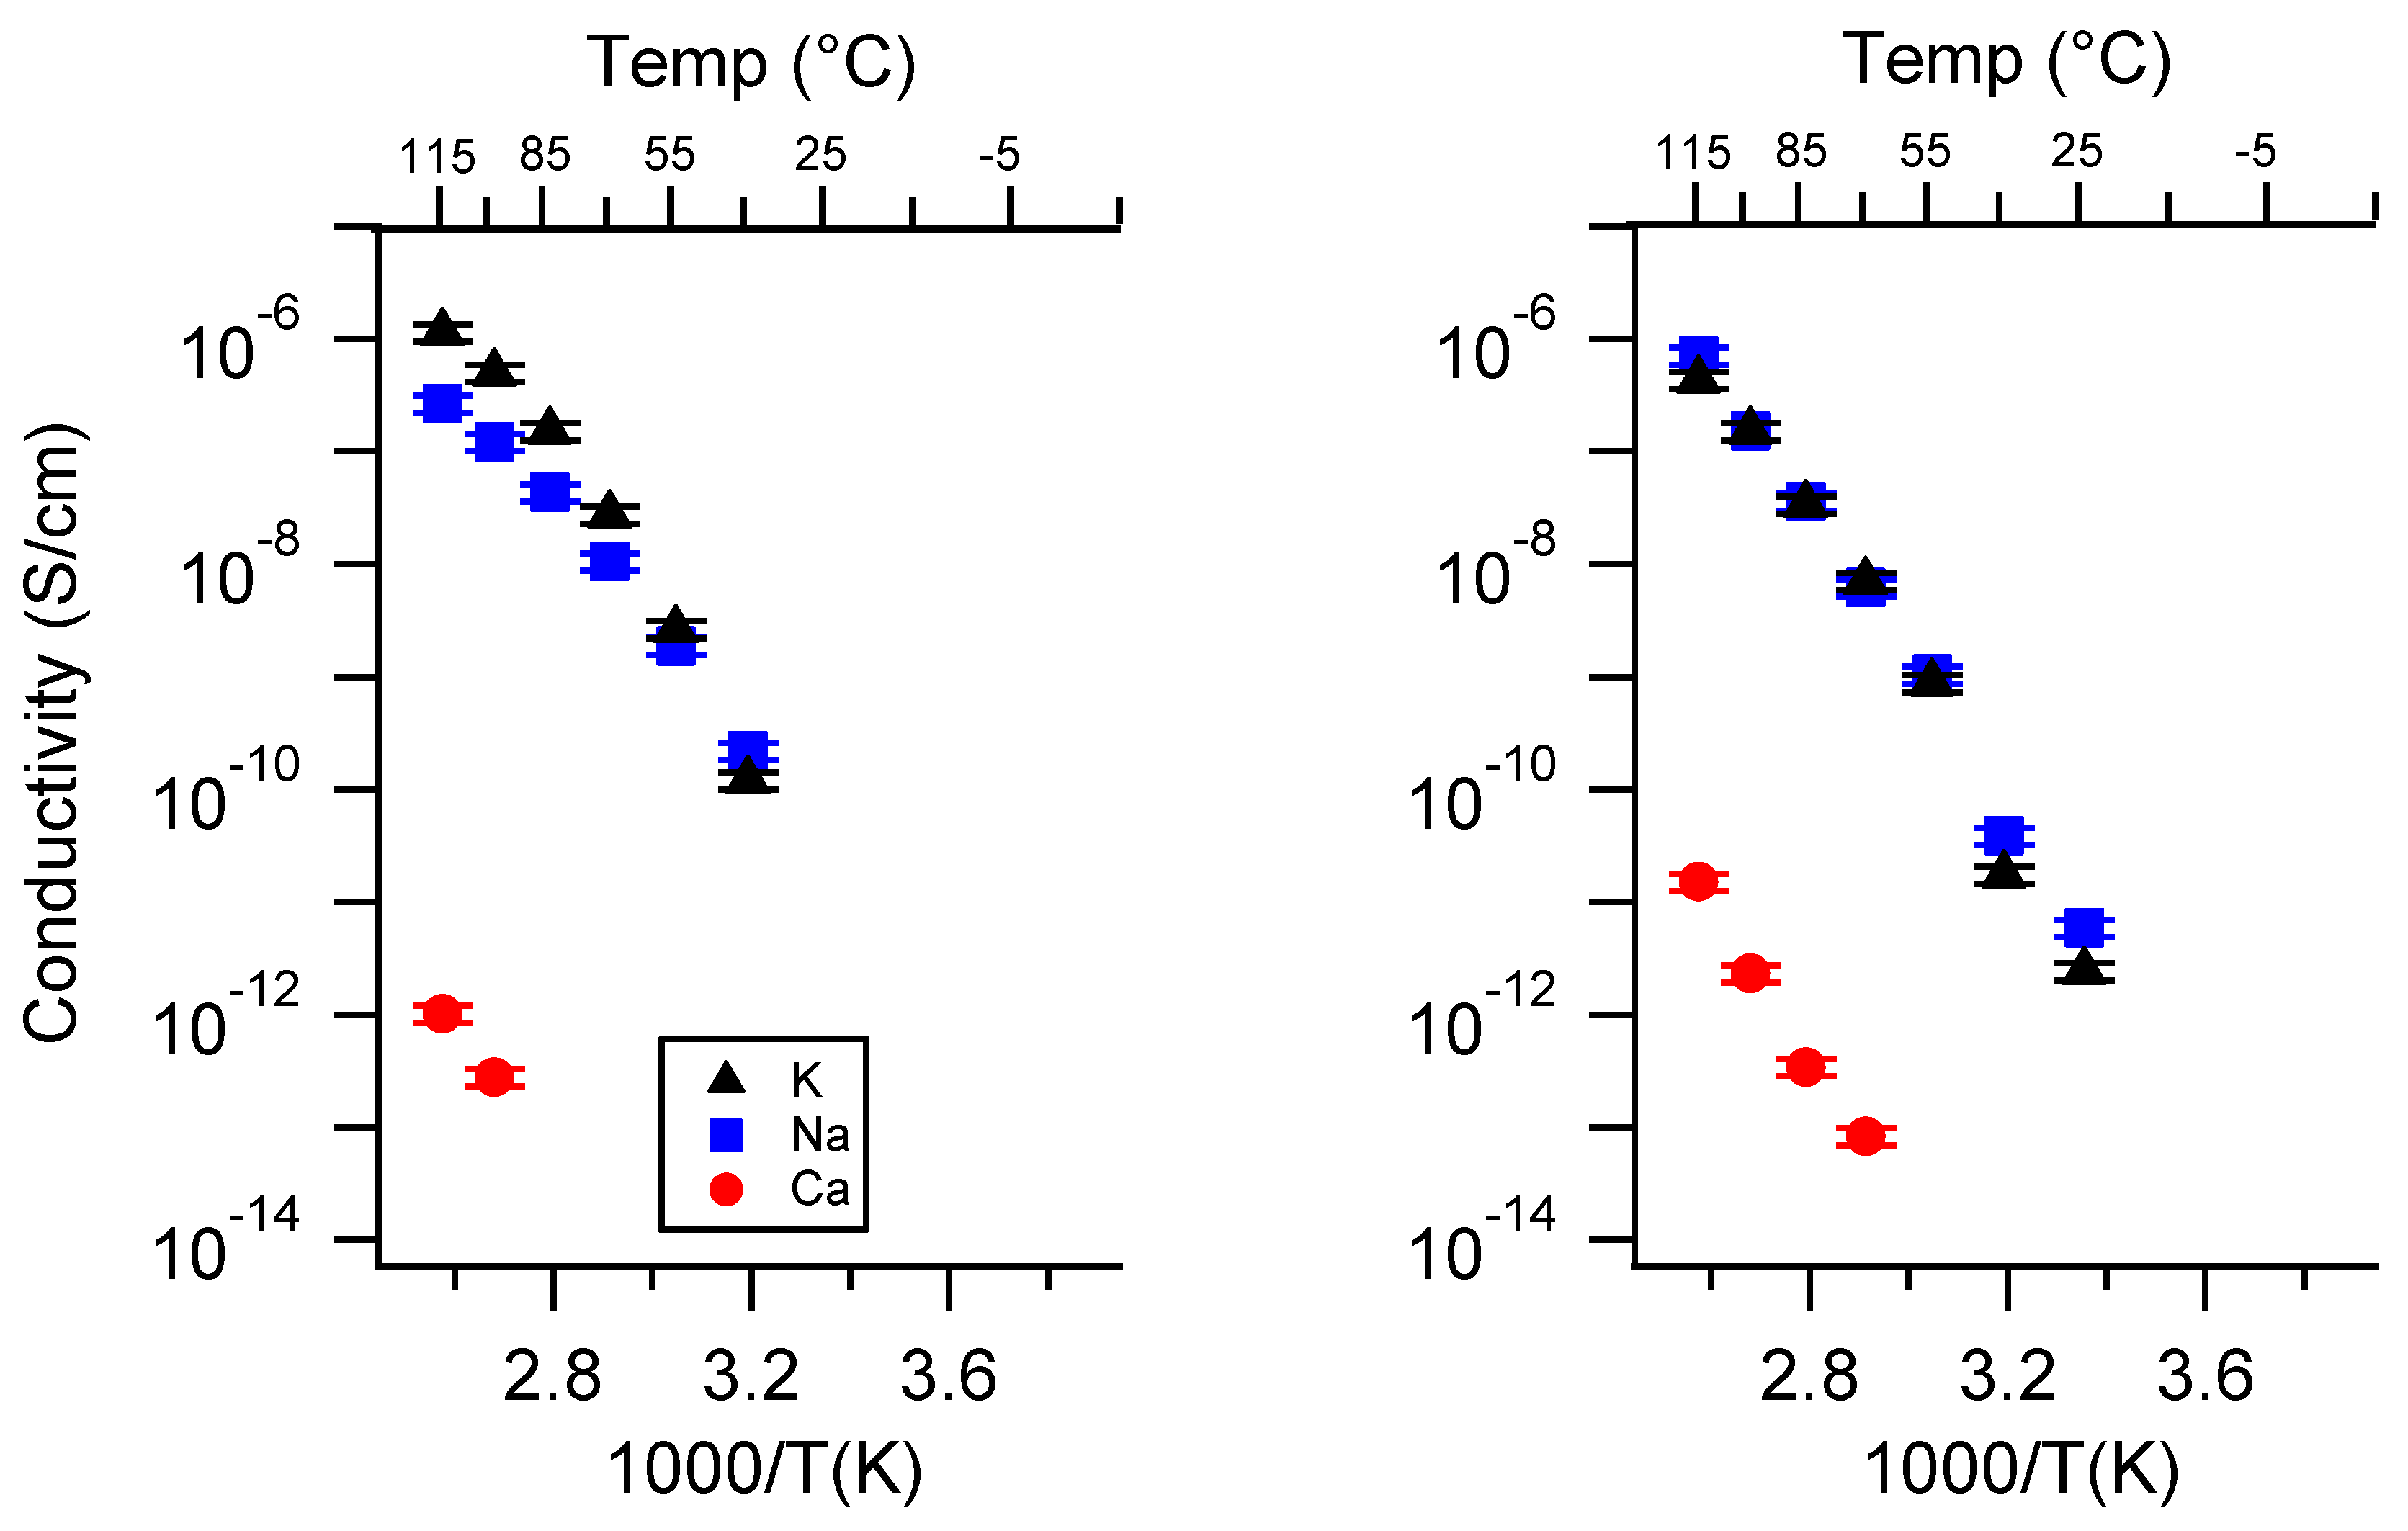
2.1. Effect of the Cation

Figure 3 presents the conductivity of the two classes of SIPEs swelled in DEG as a function of the cation. The PTHFDA-STFSI polymers were significantly more conductive than the PEGDA-SS polymers, as expected. The monovalent SIPEs of both chemistries were more conductive than the Ca exchanged polymers, especially at higher charge densities. The divalency of the Ca2+ cation significantly reduced its ion mobility and increased the energy required for dissociation, resulting in a penalty to μ and n.
For the PEGDMA-SS SIPEs, the Na form was typically more conductive in both the DEG and TEG swelled condition for the charge densities studied, at lower temperatures. This relationship was generally reversed at moderate to high temperatures, where the K form was then more conductive. The notion of various activation energies controlling the transport of the cation may explain the observed conductivity trend. For instance, there was an activation energy for dissociation of the ion pair (Equation (2)), and another for the transport of a dissociated cation (Equation (3)) [47,48].
p o = p exp ( E a R T )
p o is the concentration of free ions, p is the concentration of free ions as T , and Ea is the coulomb energy of a cation–anion pair.
μ = μ exp ( B T T o )
where μ is the mobility of free ions, μ is the mobility of free ions as T , B is a pseudo-activation energy, and T o is the Vogel temperature
Equation (3) is the Vogel–Fulcher–Tammann (VFT) equation, which applies to ion transport coupled to polymer segmental dynamics. A similar compensated Arrhenius form can be applied to model the temperature dependence of ion conduction in liquid electrolytes, which takes into account the inverse relationship between temperature and dielectric constant [49]. In the SIPEs explored here, dissociated cations can be fully solvent coordinated, fully polymer coordinated, or somewhere in between, meaning that including the energy of dissociation, at least three activation energies govern the conductivity–temperature relationship.
It was expected that the cation identity would influence these activation energies to different degrees. Potassium, as a larger ion, has a lower charge density, which should lower the activation energy for anion–cation dissociation. However, the larger ion size and lower charge density of potassium likely results in a larger solvation shell, which increases the activation energy required for transport of the solvated ion through the polymer–solvent matrix [50,51]. This manifests as lower cation mobility.
For the PTHFDA-STFSI polymers swelled in TEG/DEG, the difference in conductivity between the Na and K forms was much smaller. However, in certain cases a similar trend was observed, i.e., Na was more conductive at low temperatures and K at high, albeit only slightly so. The STFSI anion has high charge delocalization, and is therefore significantly easier to dissociate than the sulfonate ion [18]. Additionally, the lower oxygen density of the PTHFDA polymer means that a greater proportion of the dissociated cations are solvent coordinated instead of polymer coordinated, thus having a higher mobility [46]. The conductivity temperature relationship observed for the PTHFDA-STFSI polymers was qualitatively more linear and Arrhenius-like as opposed to exhibiting VFT-like behavior, further indicating the decoupling of ion transport from polymer segmental dynamics in this system. Therefore we proposed that in the PTHFDA polymers, the activation energies associated with the ion dissociation and polymer segmental dynamics were less important than the energy associated with the vehicular transport of the solvent coordinated cation. This implies that the activation energies of ion dissociation and the dynamics of polymer coordinated ions are most sensitive to the cation identity.
For EC:PC swelled PEGMDA-SS polymers, there was generally less of a difference in conductivity between Na and K exchanged polymers. In high dielectric solvents, ion dissociation is more facile, and the dissociated ions are coordinated more strongly with the solvent molecules over the polymer [44,46]. As was determined from the DEG/TEG case, ion dissociation and the transport of polymer-coordinated cations were more sensitive to the cation identity than transport of solvent-coordinated cations. It therefore follows that in EC:PC there is less of a difference between the conductivity of K and Na exchanged PEGDMA-SS polymers, as the nature of EC:PC lowers the impact of cation dissociation and polymer coordinated cation transport on ionic conductivity. Interestingly, the Na, K, and Ca had comparable conductivity for moderate temperatures at the lowest charge density studied. We observed previously that in high dielectric solvents, the cation valency did not impact the observed ionic conductivity until a high enough charge density was reached [45]. In the SIPEs examined here, that appeared to take place between the low and medium charge densities for the PEGDMA-SS SIPEs.
For PTHFDA-STFSI, the Na and K exchanged polymers had likewise nearly identical conductivity, yet at no charge density were the conductivities similar to the Ca exchanged polymer. This trend difference may be attributed to the decreased solvent–polymer interaction observed between high dielectric EC:PC and low dielectric PTHFDA [46]. Indeed, the low and med charge density PTHFDA-STFSI polymers swelled considerably less with EC:PC than the highest charge density, whereas all charge densities of the PEGDMA-SS polymers swelled equally with EC:PC (Appendix D Table A1).
Finally, in the dry case, the K and Na exchanged polymers presented similar conductivity for both SIPE chemistries. In some instances, the K form was more conductive; in others, however, no clear trends are observed.
Generally, it appears that for monovalent systems, the identity of the cation matters most when the ionic conductivity of the system is sensitive to the number of dissociated ions and when those ions are coordinating with the polymer matrix. For the systems studied, when ion dissociation was facile and the dissociated cations were primarily solvent coordinated, there was little difference in ion conduction comparing Na to K exchanged SIPEs.
Enhancing the ionic conductivity of the divalent cation SIPEs remains a challenge; however, increased ion dissociation and decreased ion–polymer interaction (PTHFDA-STFSI) does lead to better Ca2+ conduction. Interestingly, the increase in conductivity for the Na and K cations at low temperatures was about four orders of magnitude comparing the PEGDMA-SS polymers to the PTHFDA-STFSI polymers; yet, the increase for Ca was only two orders of magnitude. This observation drives home the difficulty of enhancing the transport properties of divalent SIPEs.

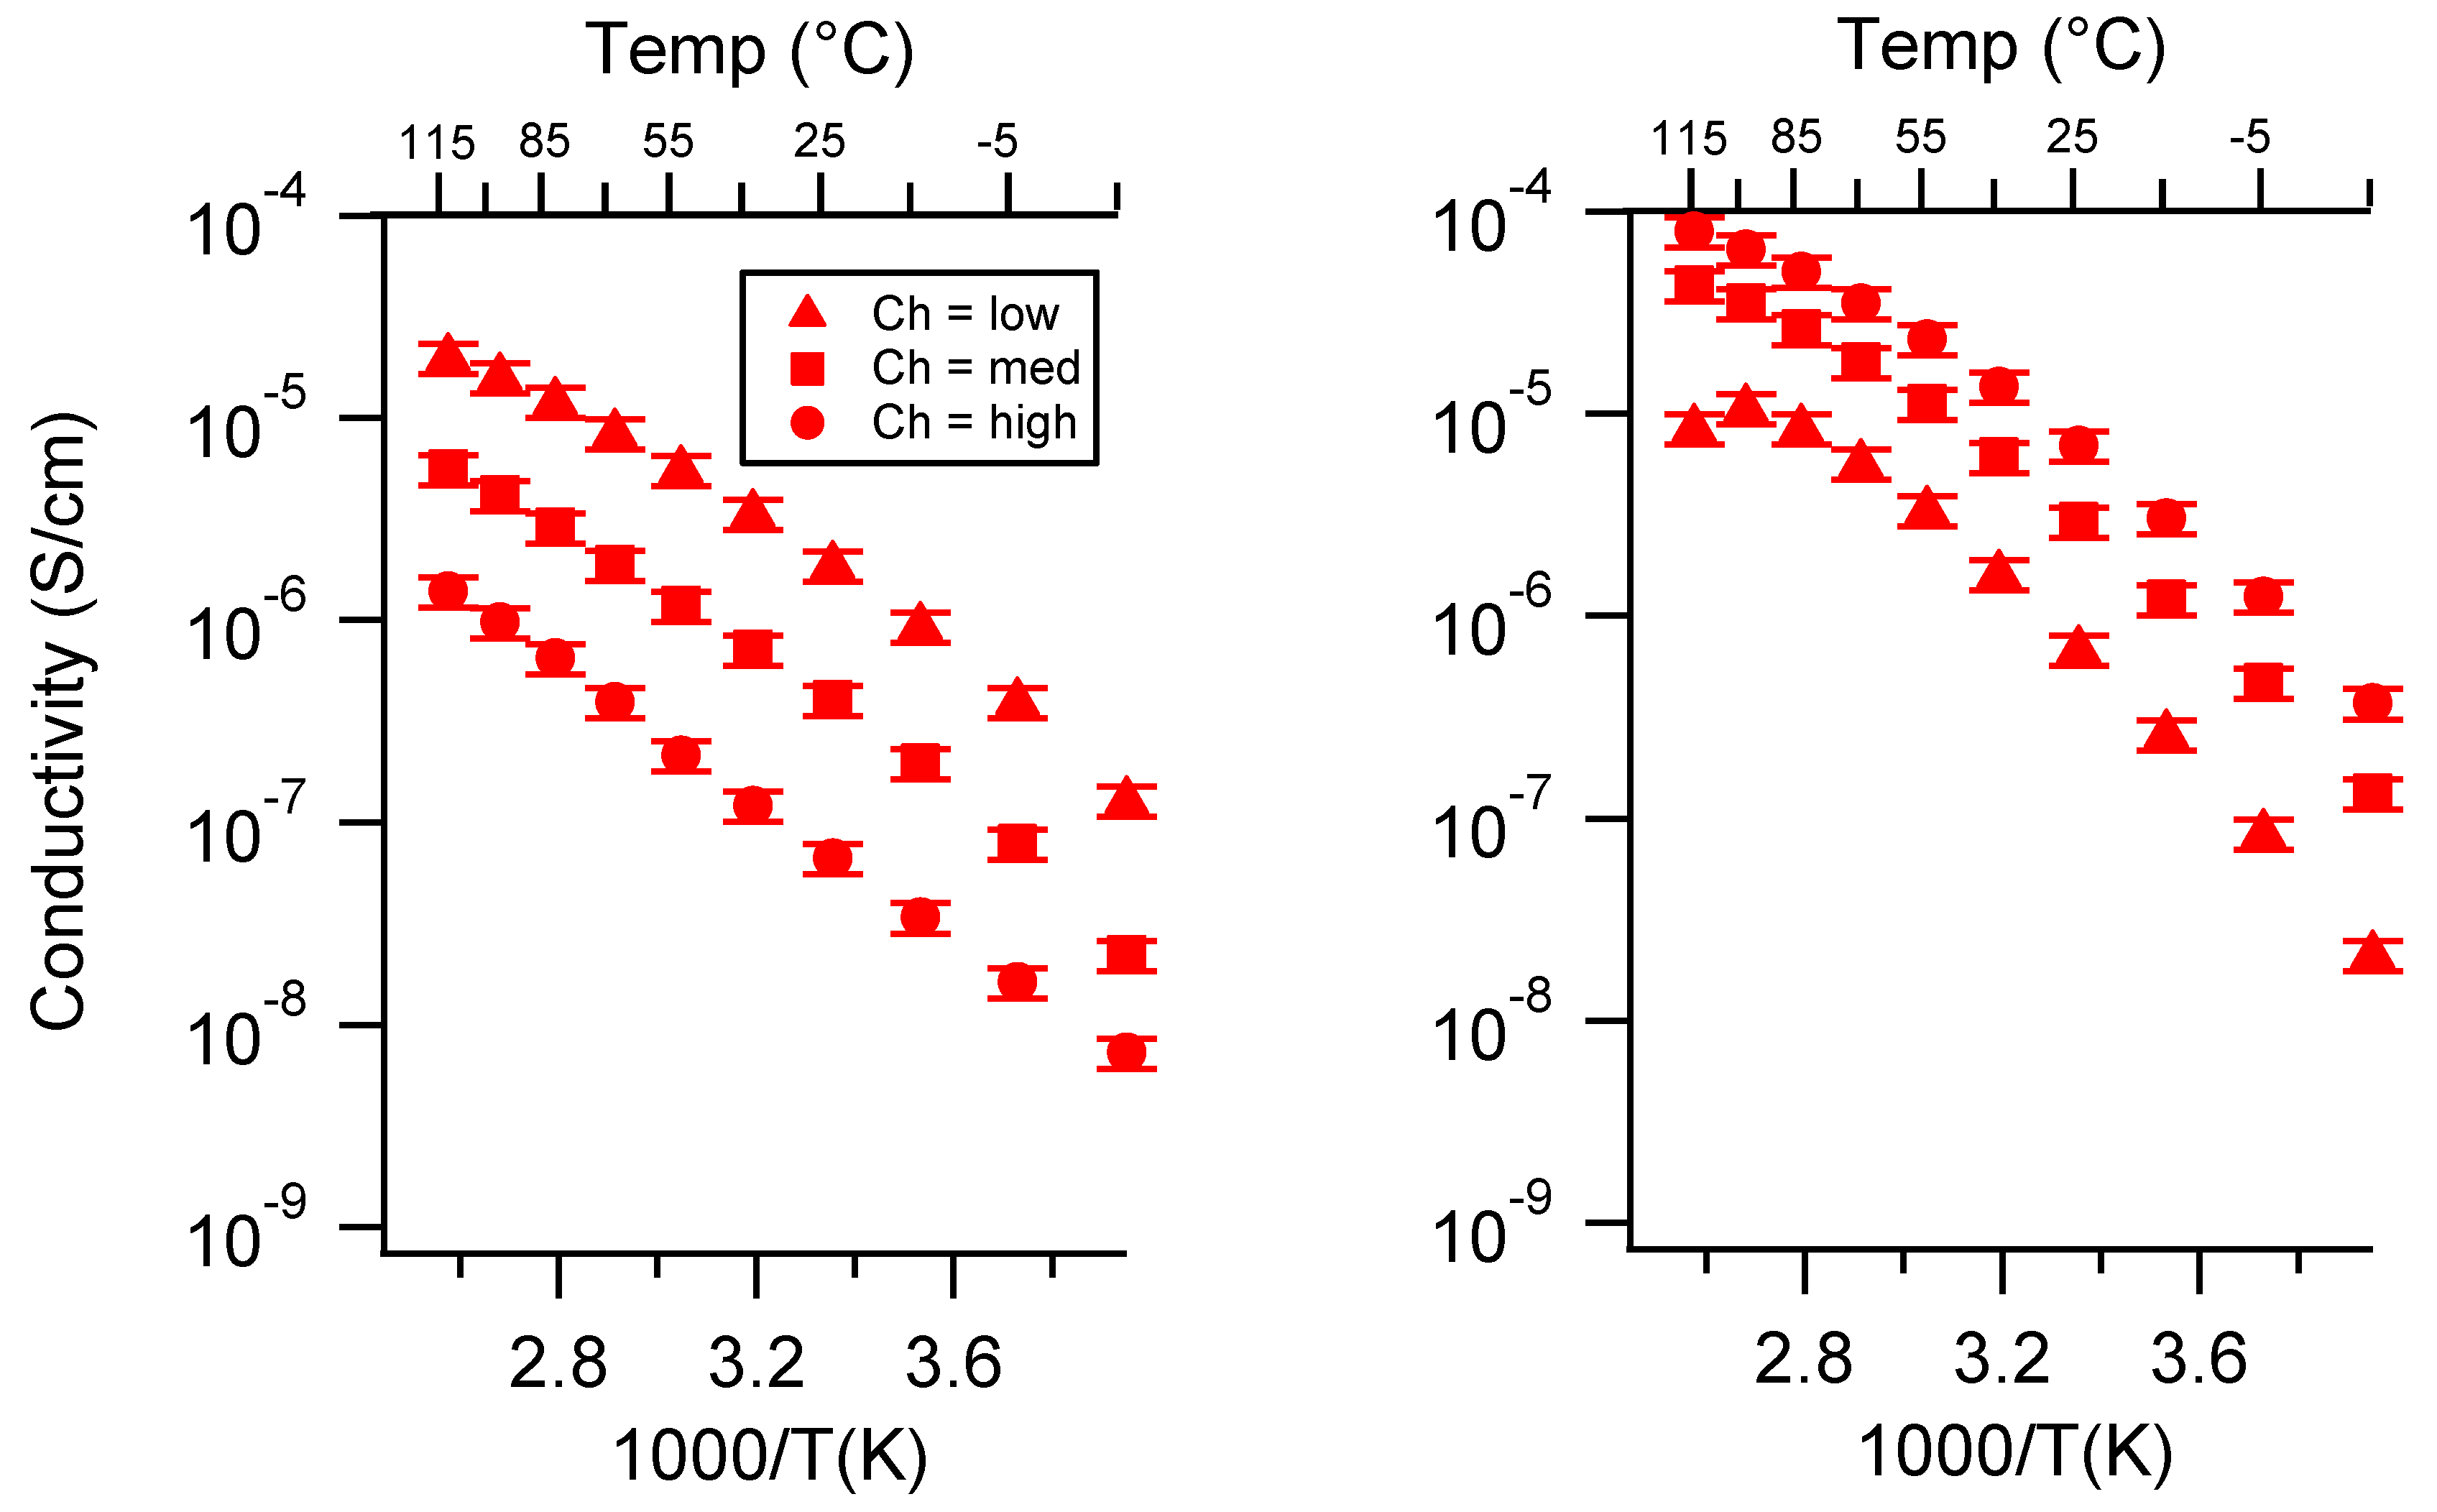
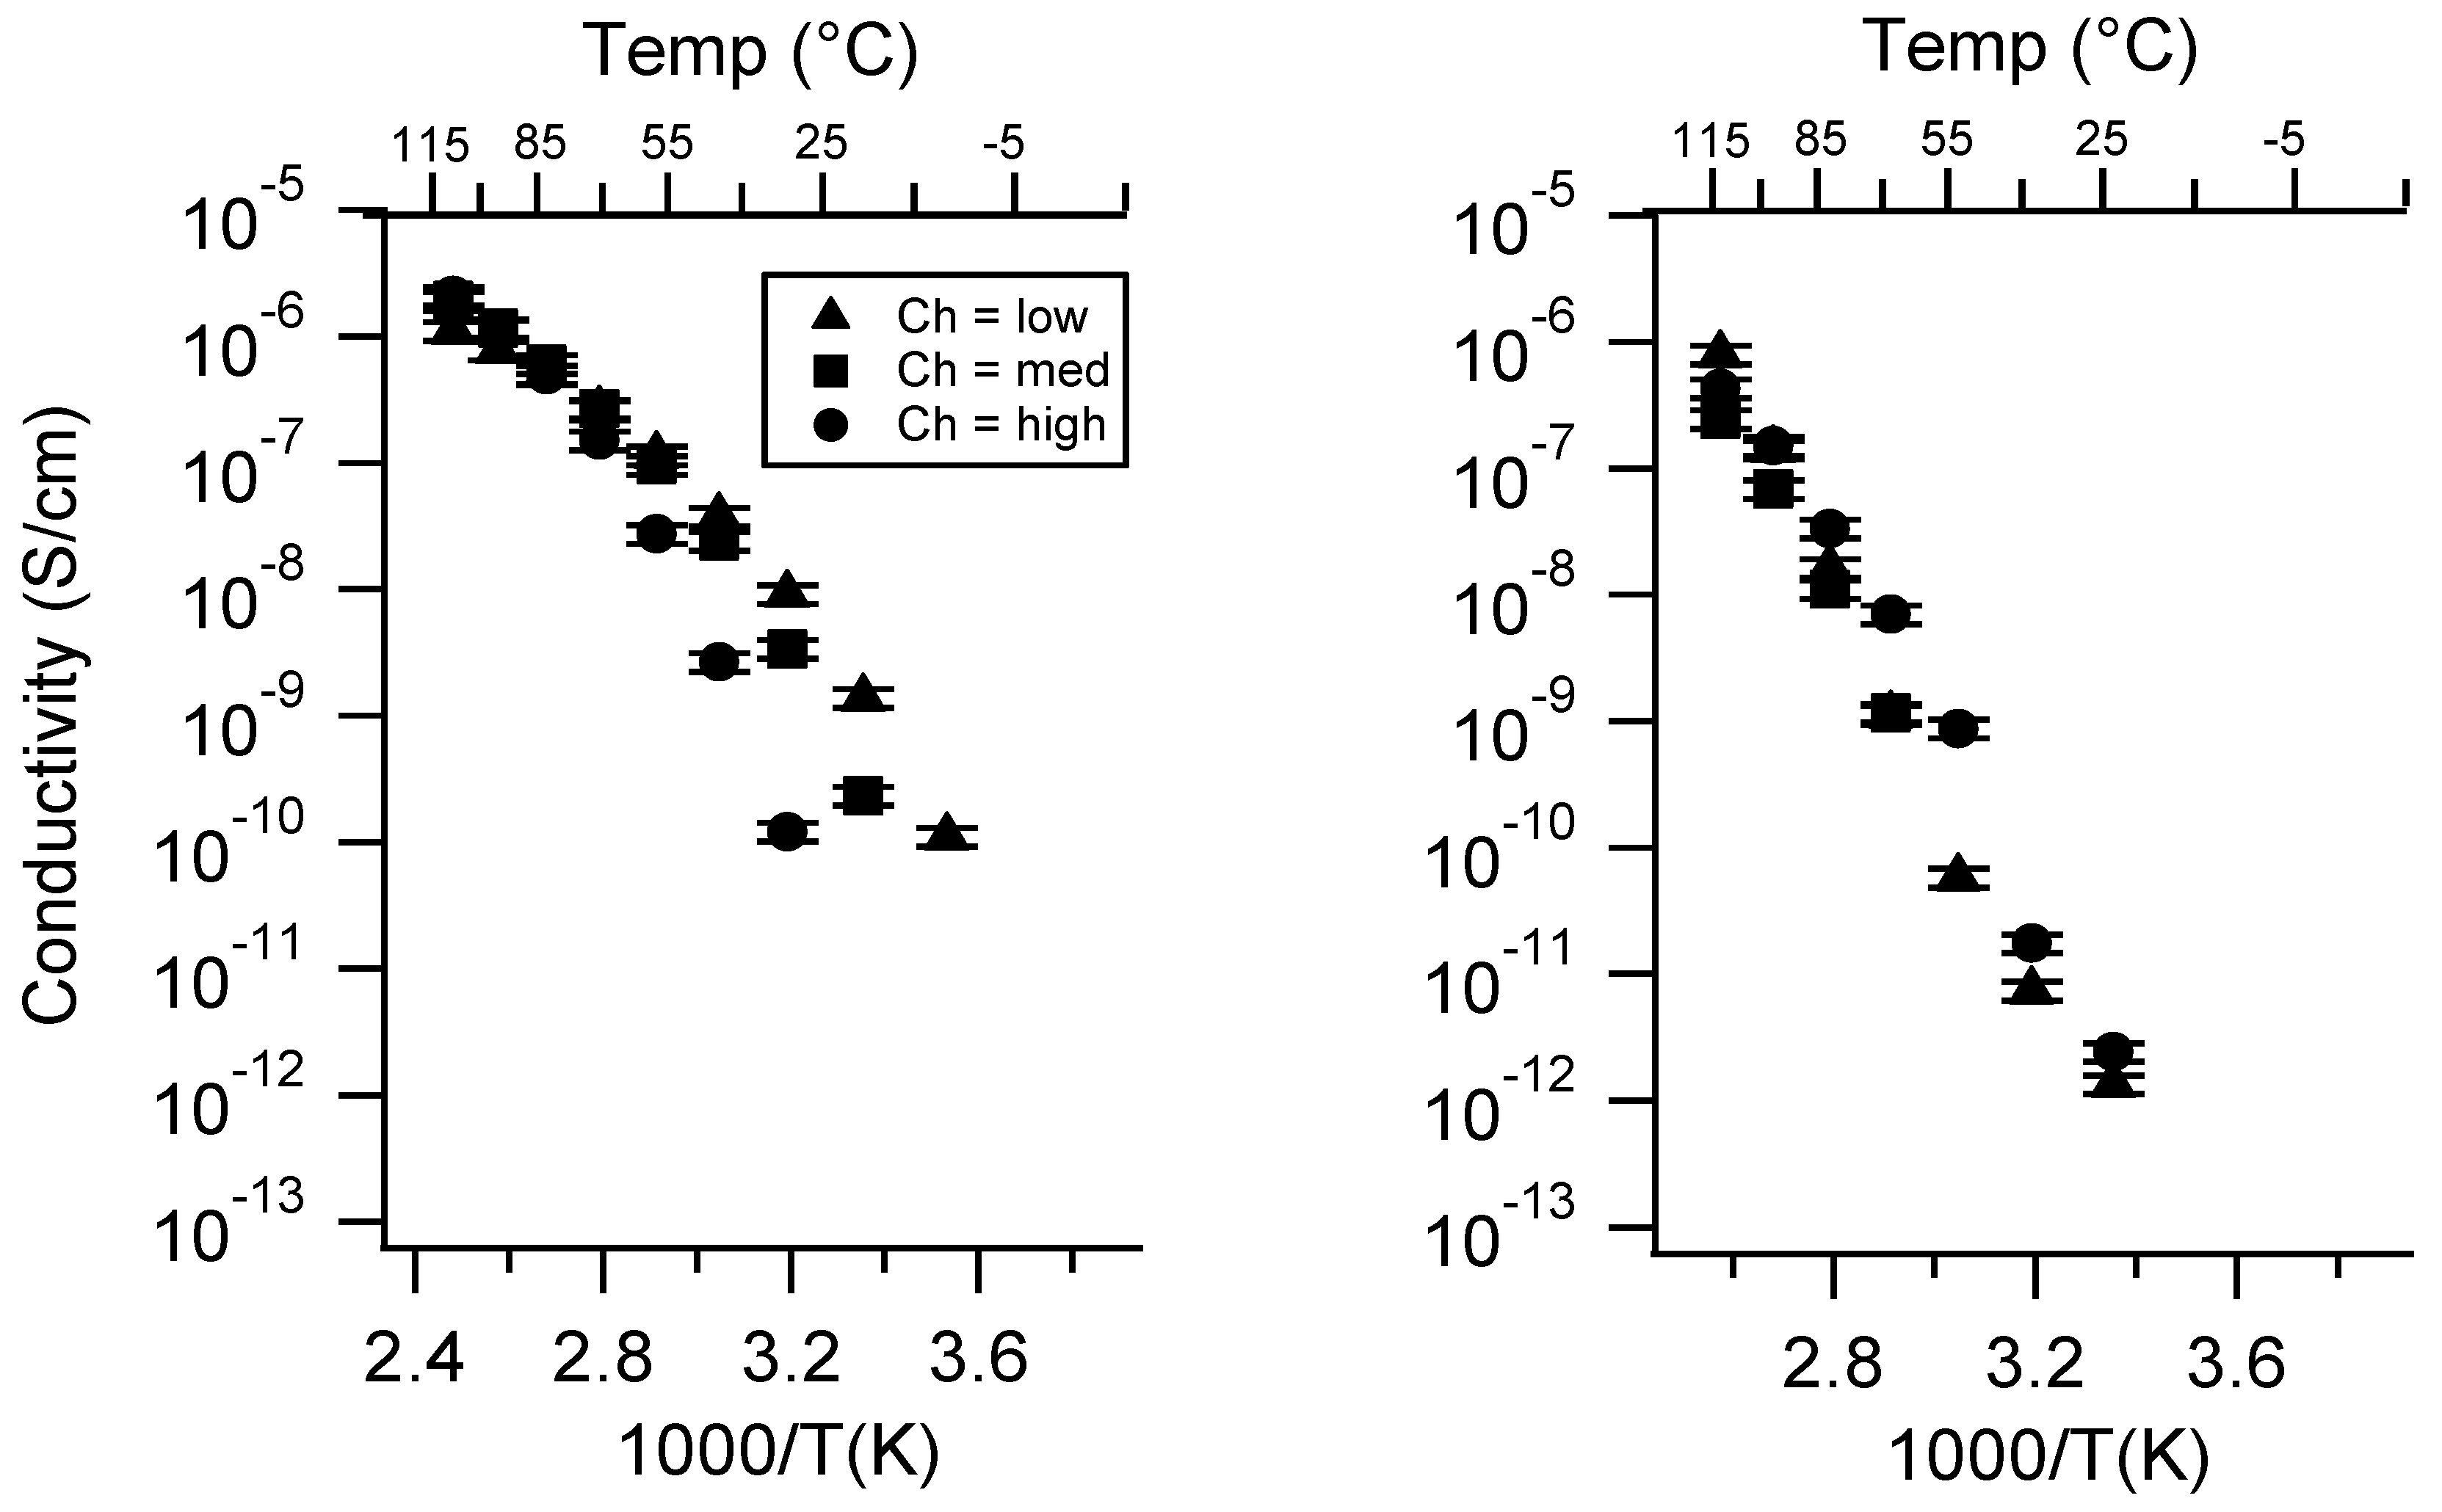
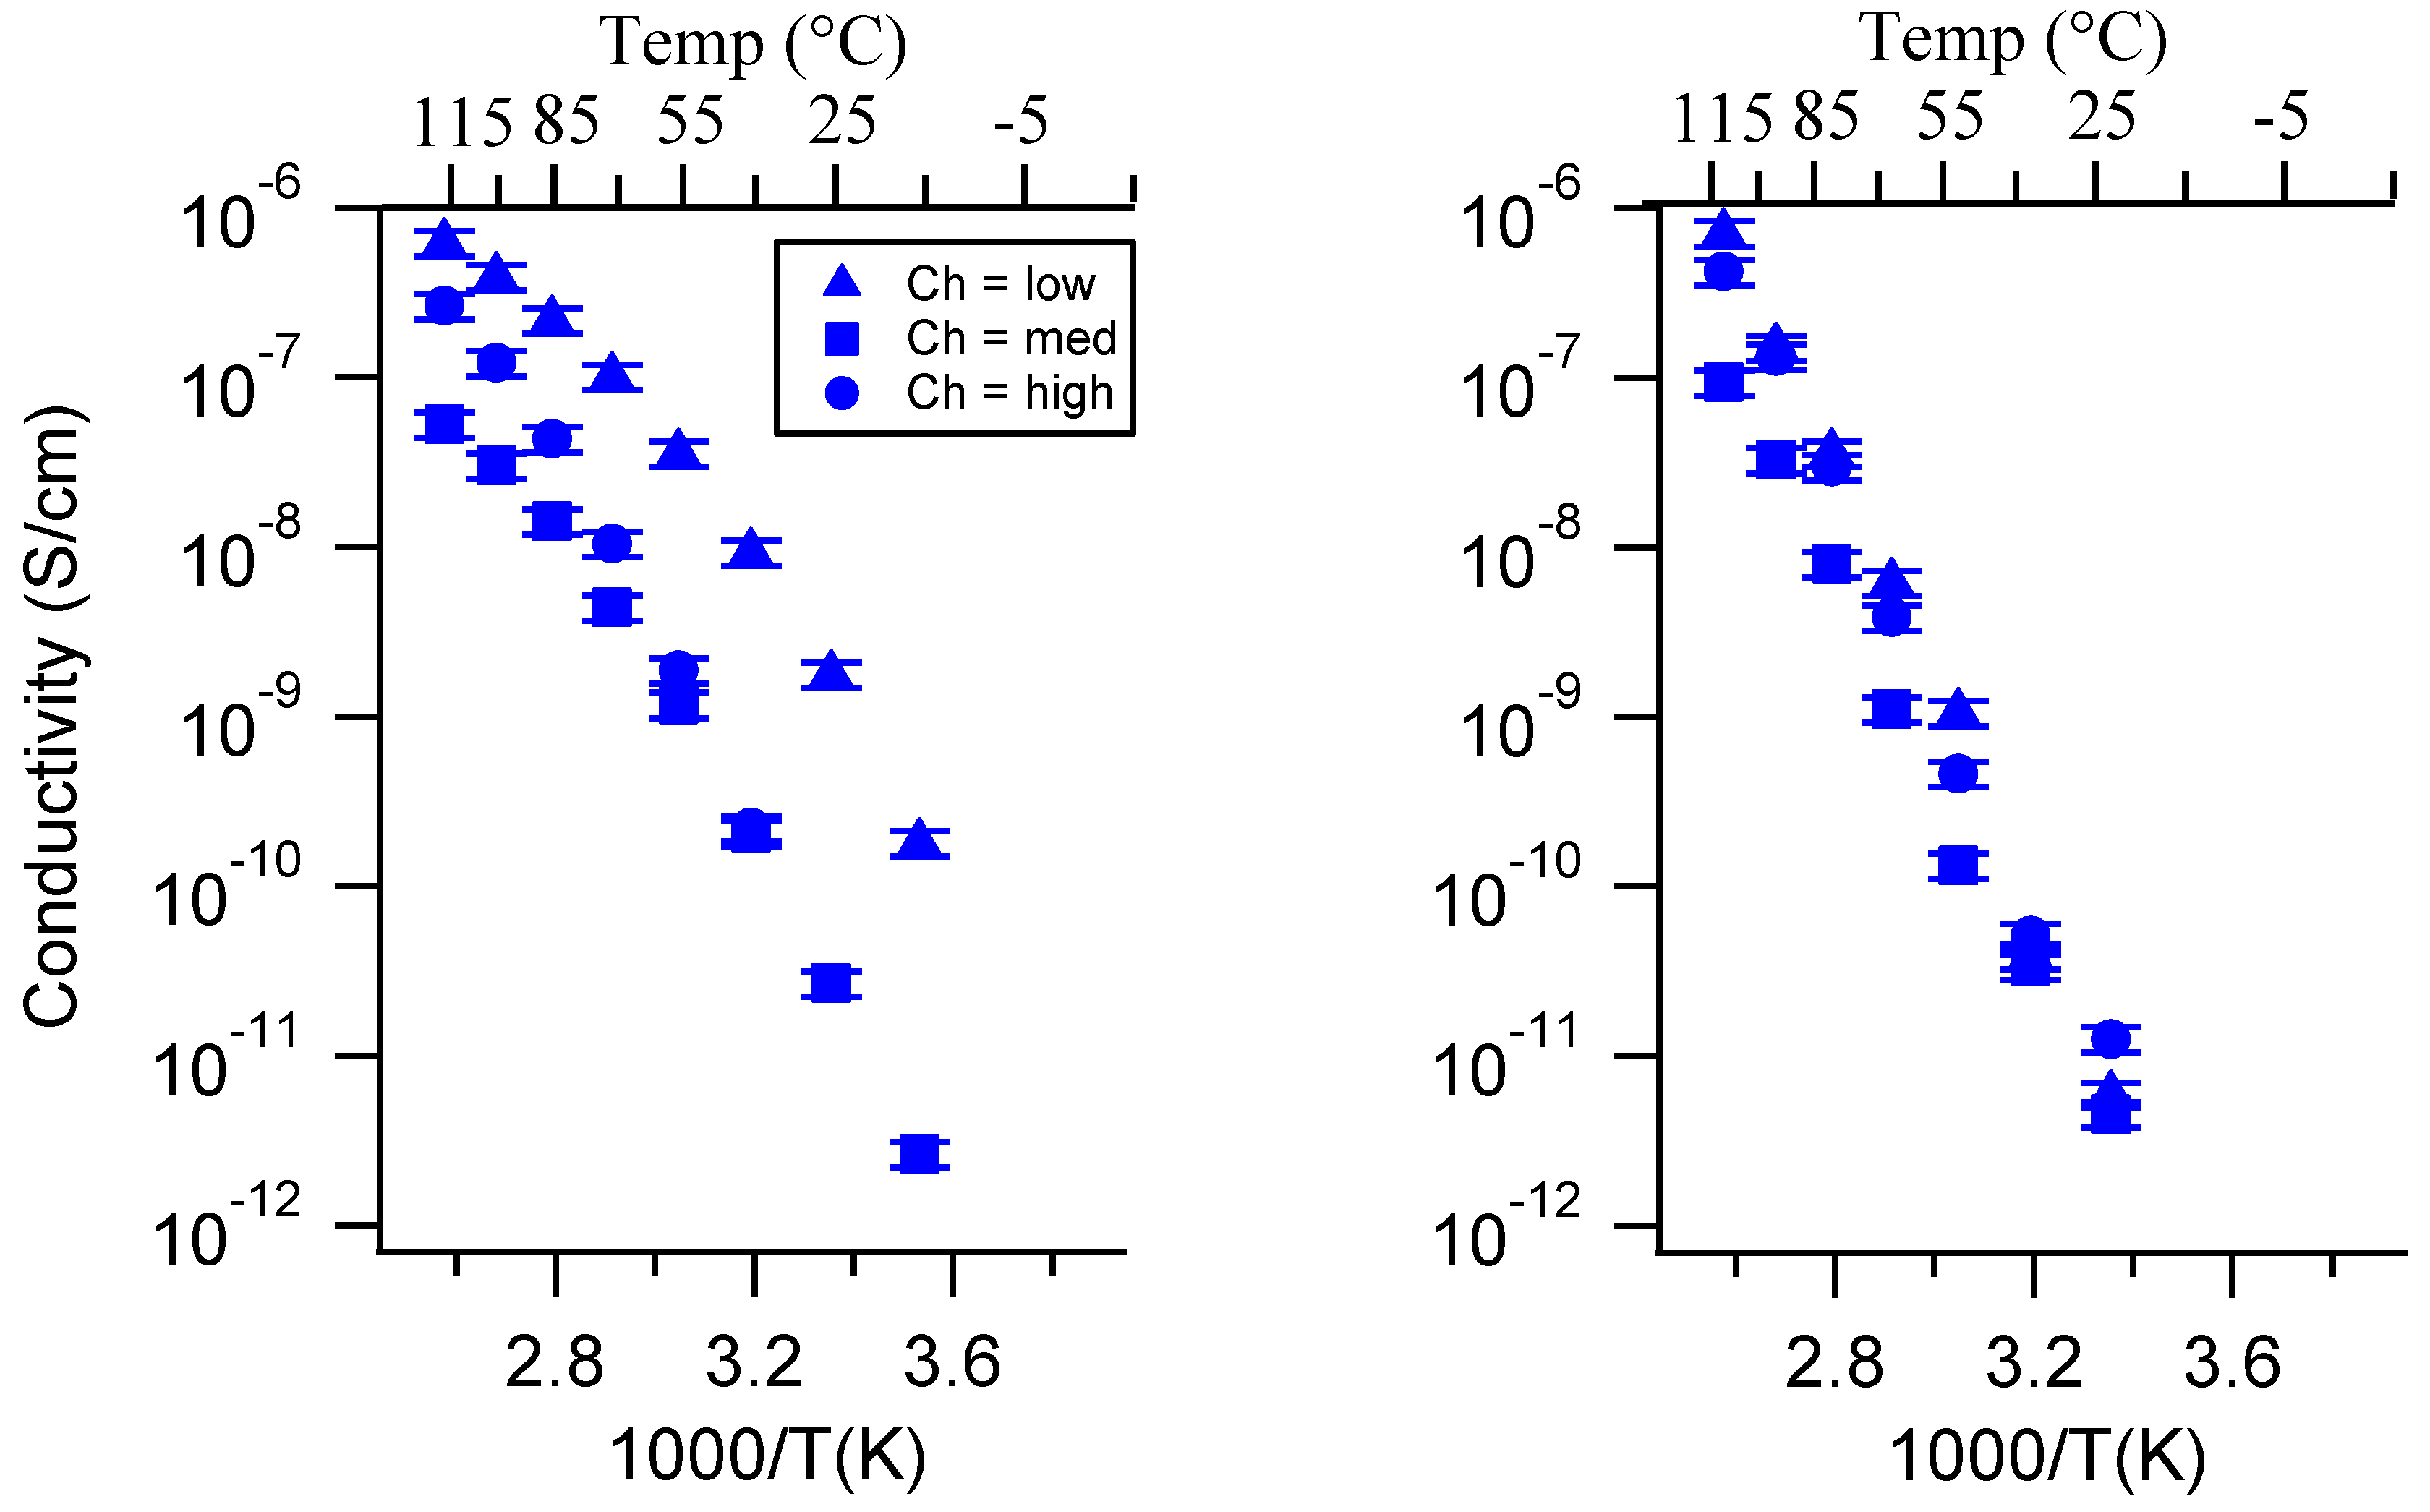
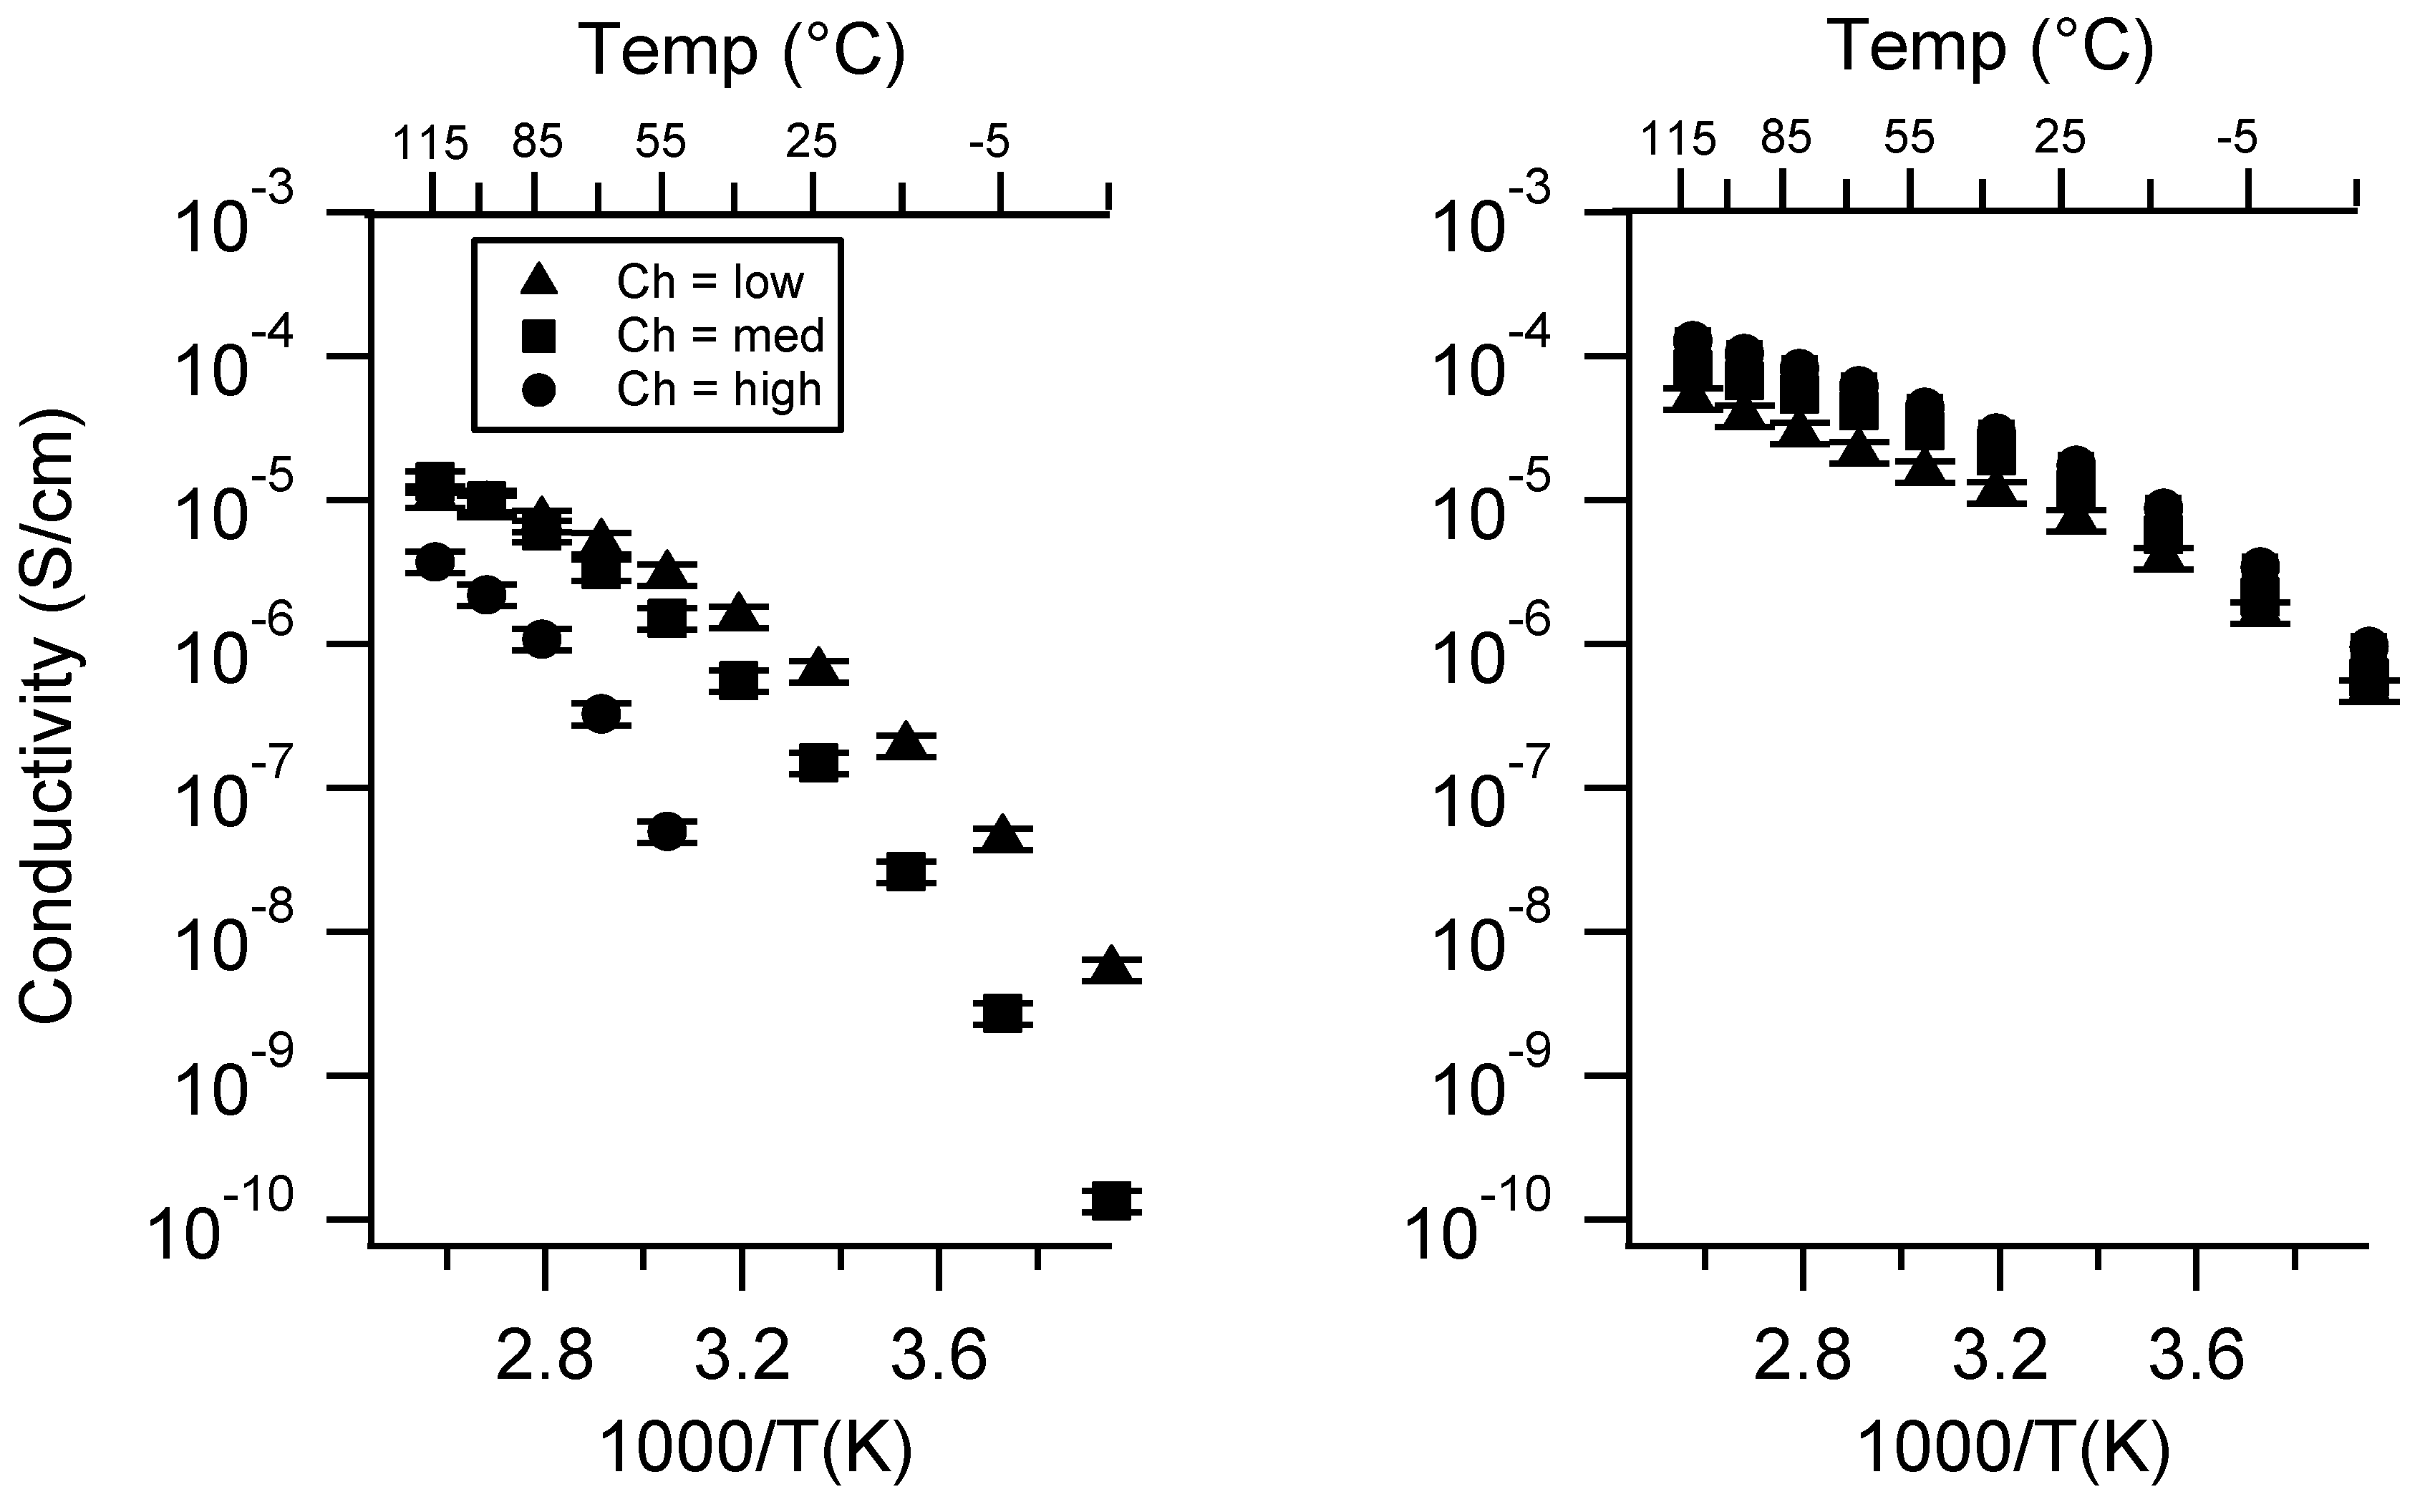
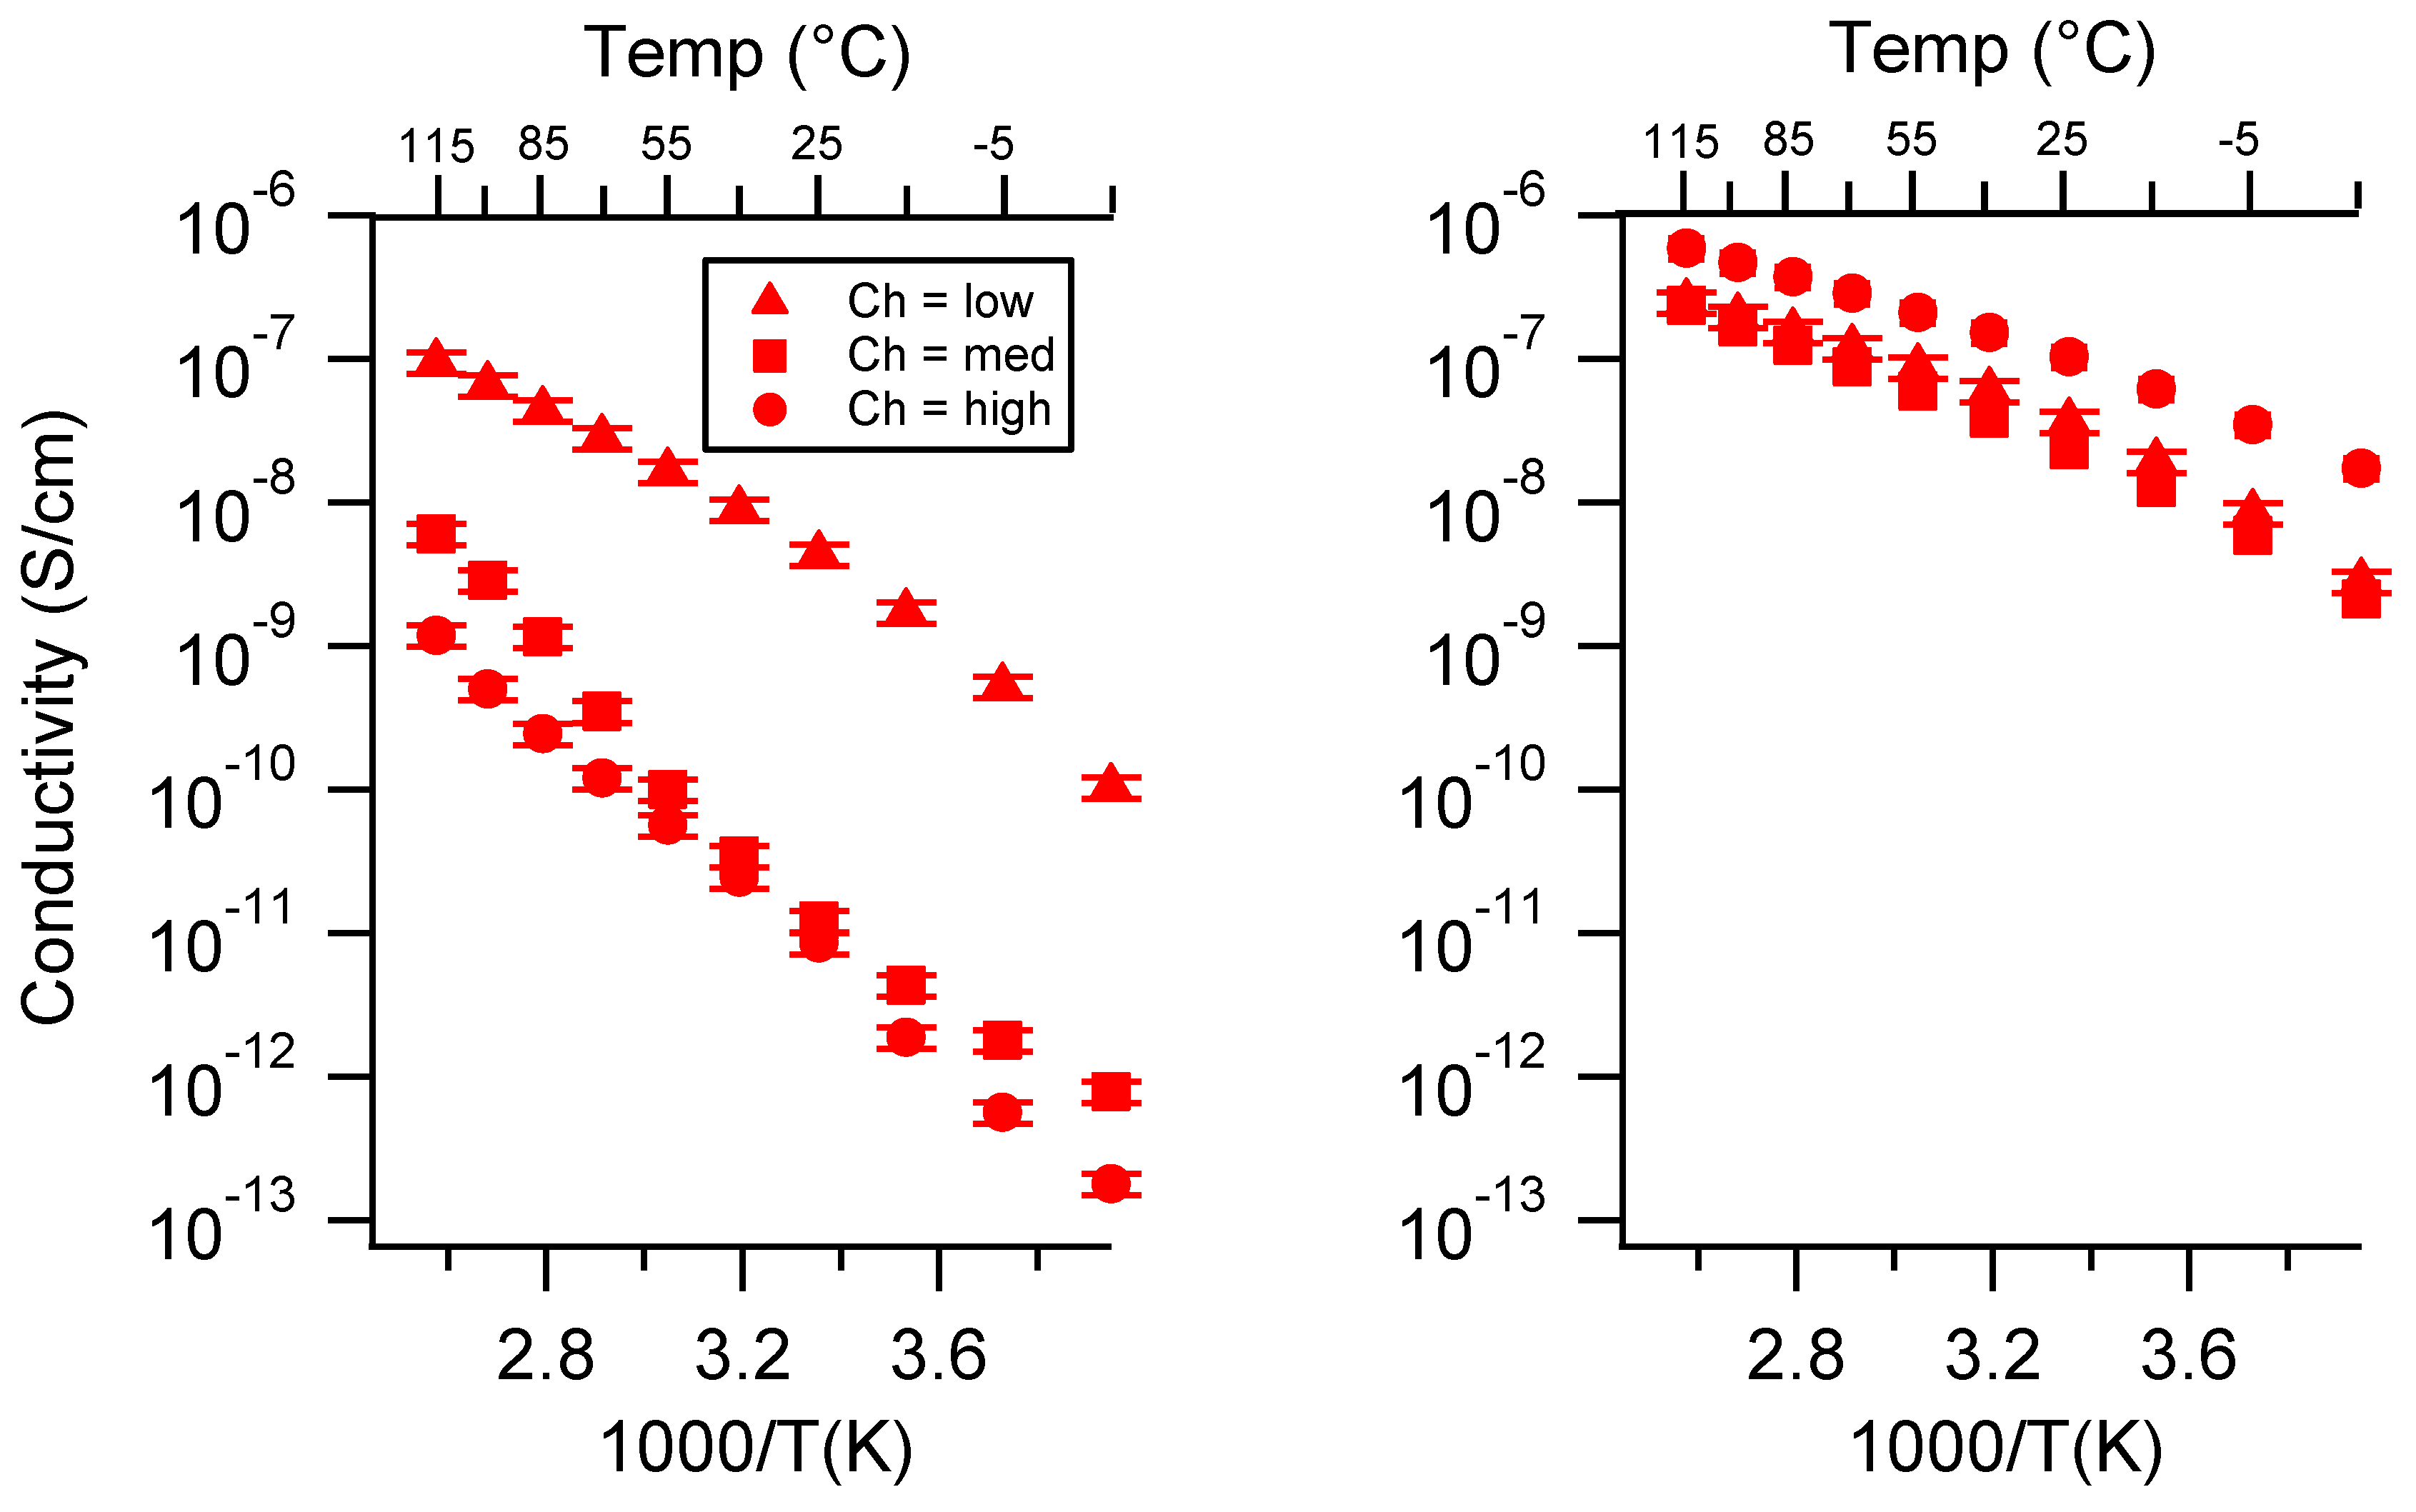
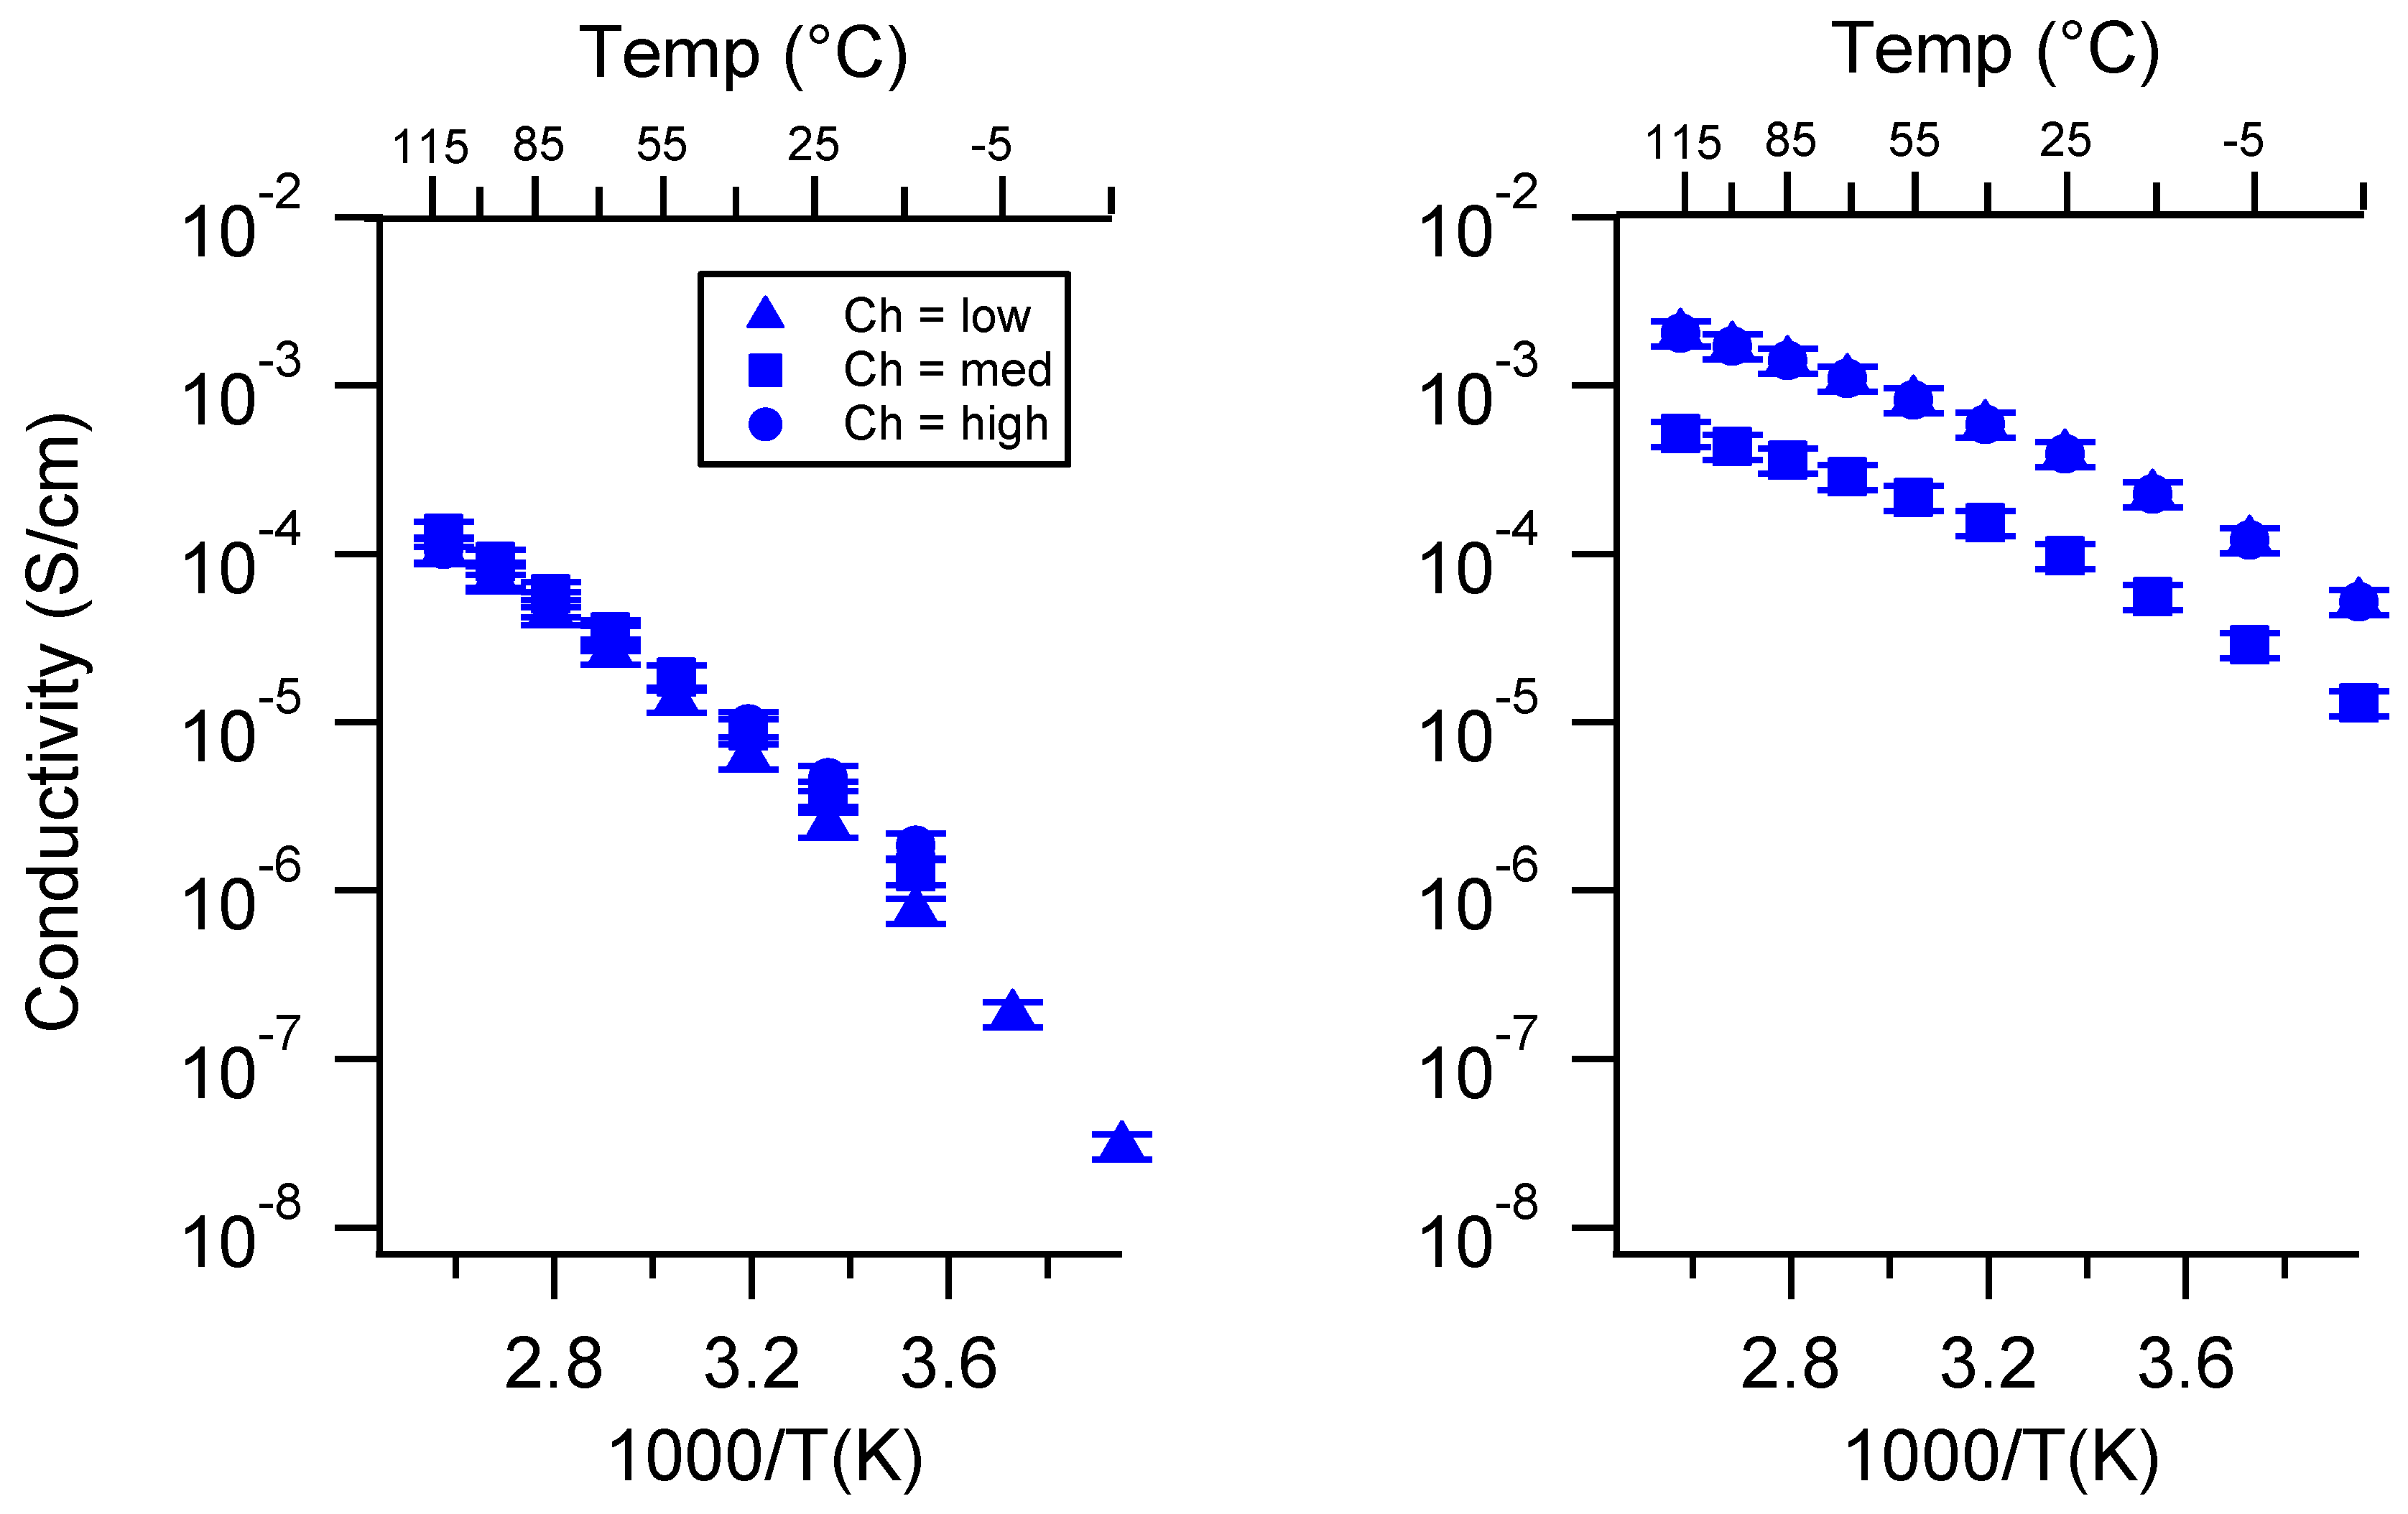
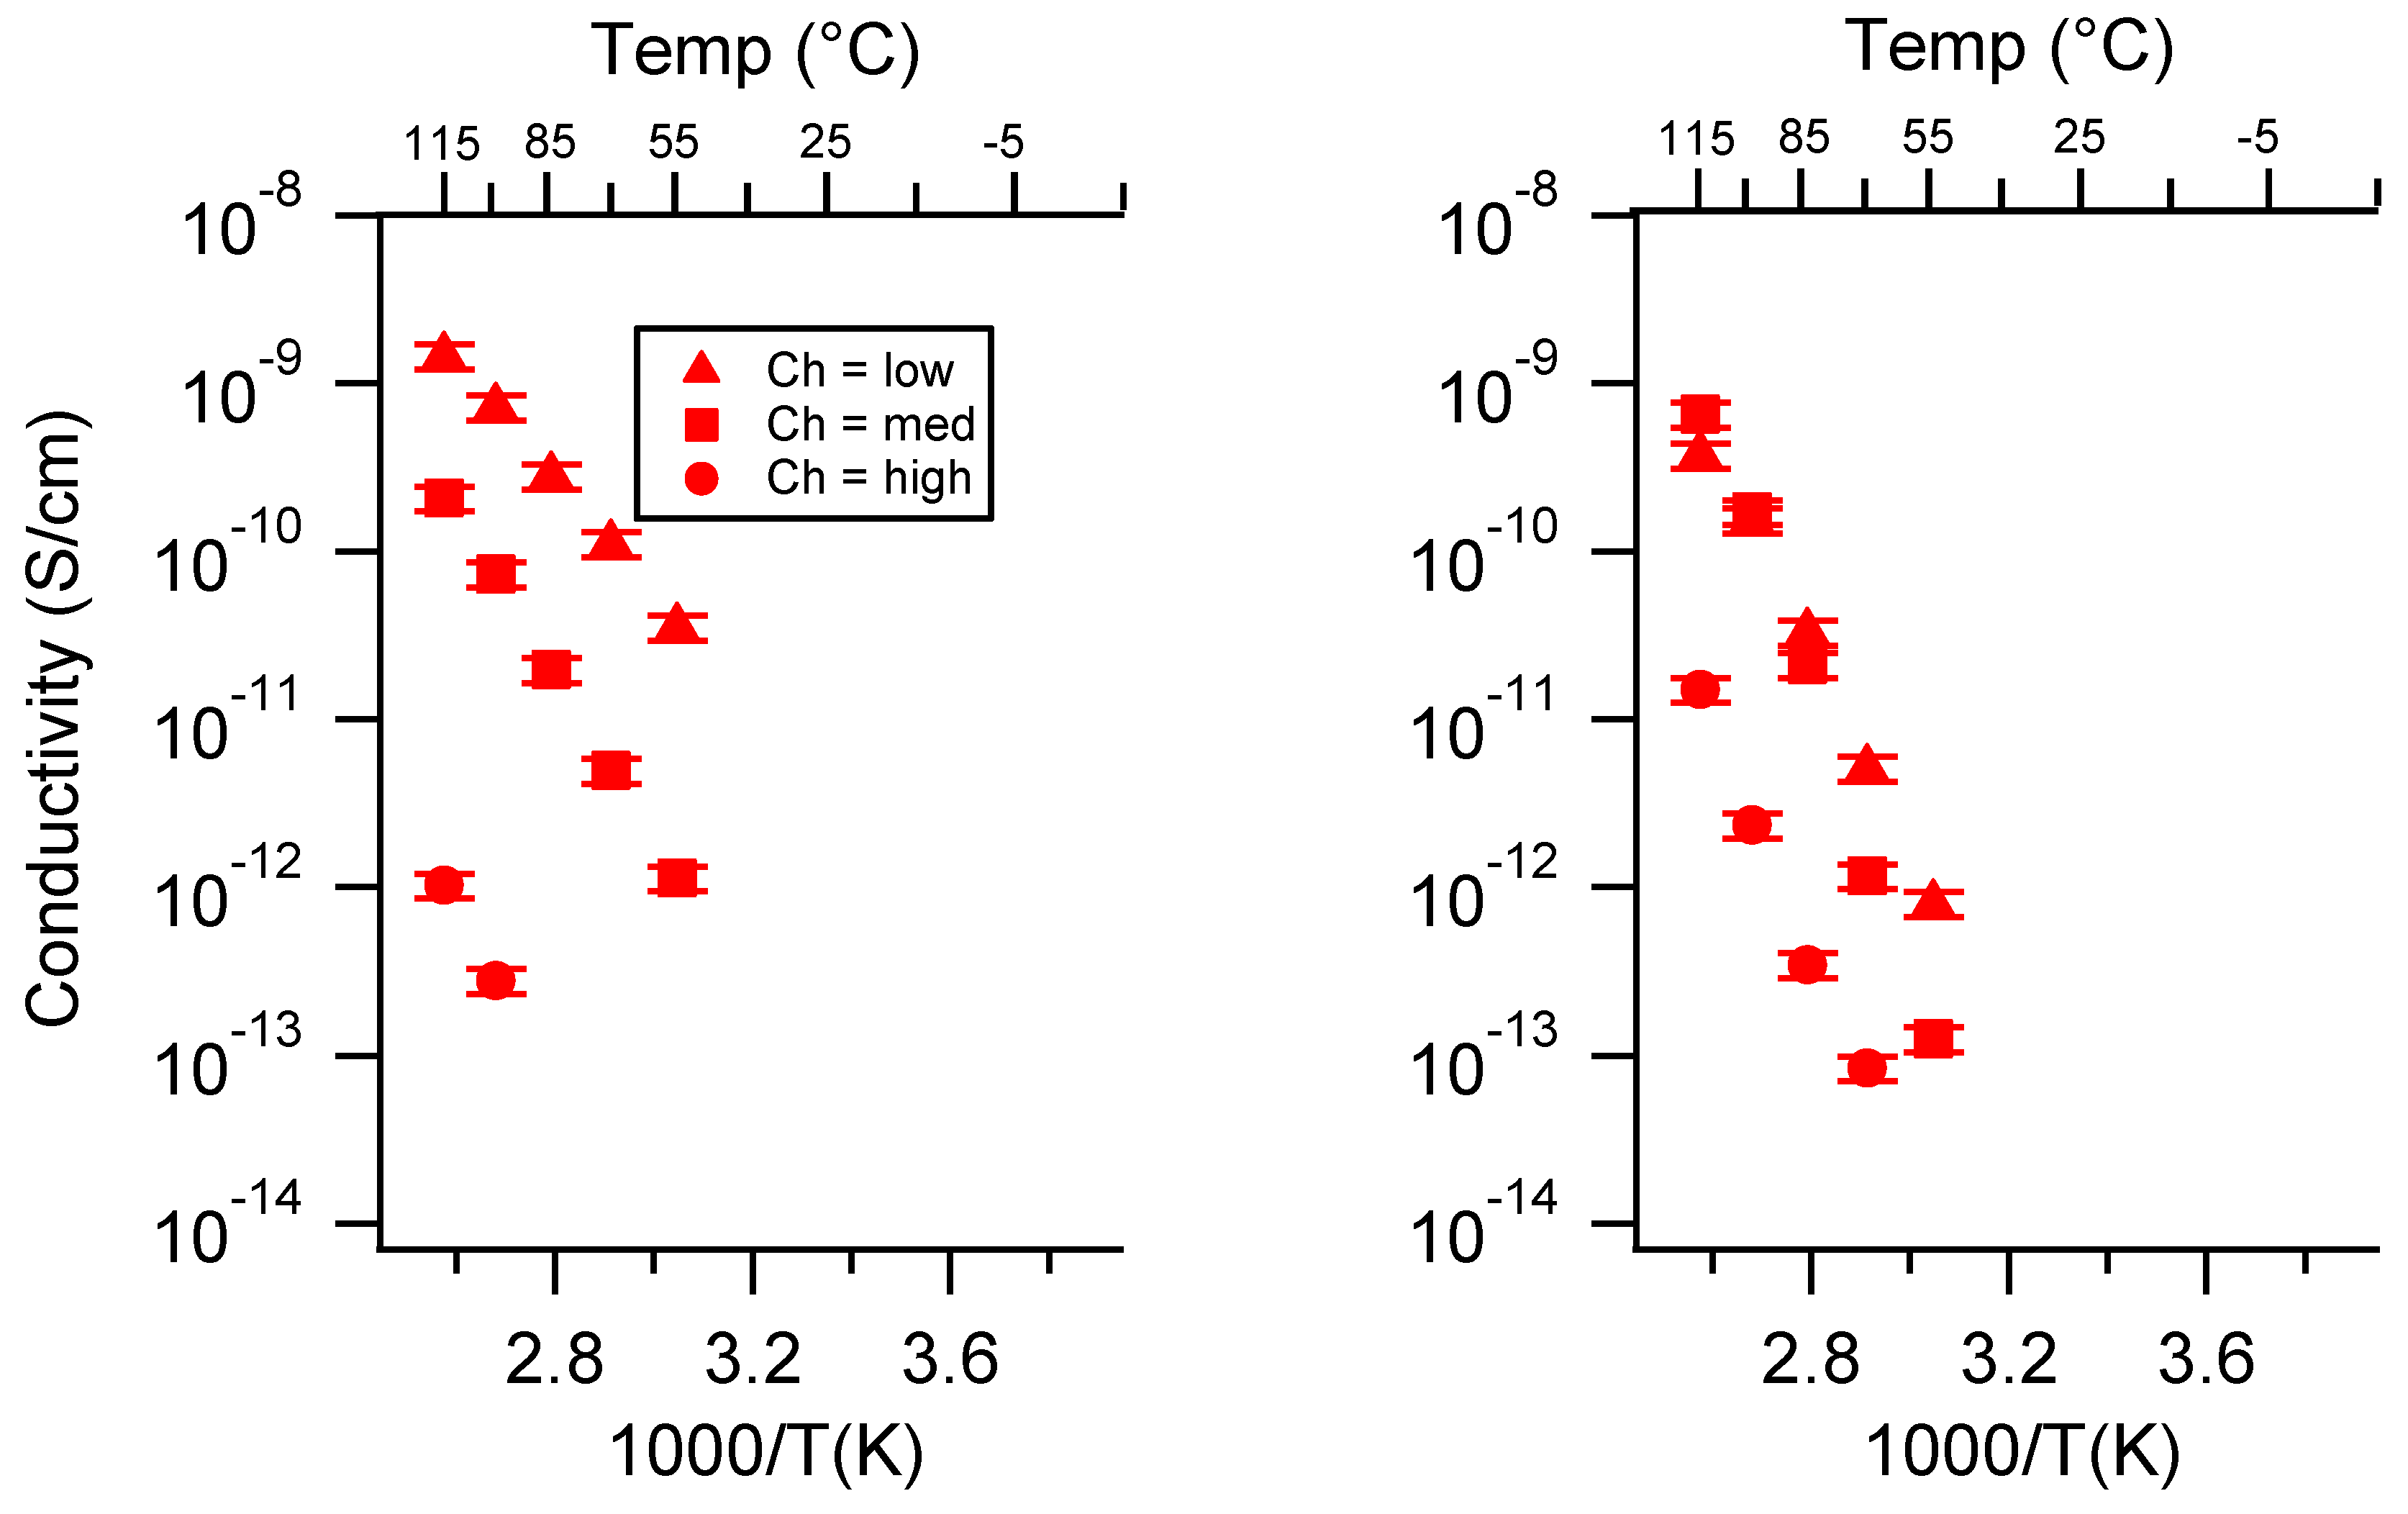
2.2. Effect of Charge Density

Three different charge densities were studied, namely low, medium, and high (8, 12, 16 × 10−4 mol charge/g monomer for PEGMDA-SS and 7, 10, 13 × 10−4 mol charge/g monomer for PTHFDA-STFSI). These values were nominal; they represented the charge density with respect to the amount of monomer used to fabricate the SIPEs. The true charge density (n) takes into account the change in volume/weight upon swelling with the various solvents. This true charge density for each SIPE is presented in Table 3 and Appendix D Table A1, and the molar conductivity of select SIPEs is shown in Appendix D Figure A32. All other conductivity plots were standard (S/cm) and in terms of the nominal charge density, as the trends observed did not appear to change when presented in terms of molar conductivity. This is consistent with our observations with similar lithiated SIPEs [46]. It should be noted that the overall cation concentration for the PEGDMA-SS SIPEs was 2–3 times that of the PEGDMA-STFSI SIPEs when swelling volume was accounted for. While not changing the overall results, this observation reinforces the notion that greater degrees of solvent uptake correlate with higher ionic conductivity, a trend also observed in the study of Nafion-based SIPEs [6].
Figure 4 presents the conductivity of various SIPEs as a function of (nominal) charge density. In the case of the PEGDMA-SS polymers, the general trend in TEG/DEG for all three cations was that the conductivity decreased as the charge density increased. The Ca form showed an order of magnitude or greater difference in conductivity between each charge density. In TEG, there appeared to be a greater difference in conductivity between samples of different charge density than in DEG for K and Na.
For PTHFDA-STFSI polymers, this trend was reversed, where the higher the charge density the higher the conductivity, for both the DEG and TEG swelled condition
In EC:PC, the conductivity as a function of charge density varied less for the Na and K forms of the PEGDMA-SS polymers, and was generally reversed from the trend observed for DEG and TEG, i.e., the highest charge density polymers had the highest conductivity when swelled with EC:PC. For Ca, the trend was the same as in TEG/DEG: the higher charge density translated to lower conductivity. For the PTHFDA-STFSI polymers, higher charge density led to higher conductivity in EC:PC for the K and Ca case. The trend was unclear for the Na form.
In the dry case, the trends were mixed for both sets of SIPEs. Increasing charge density decreased the conductivity of PEGDMA-SSK, PEGDMA-SSCa, and PTHFDA-STFSICa. No clear trends over the full temperature range were observed for PEGMDA-SSNa, PTHFDA-STFSIK, and PTHFDA-STFSINa.
In reference to Equation (1), as the charge density is increased the maximum possible number of charge carriers is increased, which according to Equation (1) increases the conductivity. However, morphological changes induced in the polymer system as a function of increased charge density can lower the actual number of charge carriers as well as charge carrier mobility [44,45]. For the PEGDMA-SS systems and other sulfonated SIPEs, it has been shown that an increase in charge density leads to the formation of dense ionic aggregates, which reduce the number of ion pairs that are easily dissociable, as many ion pairs are trapped within the aggregate and inaccessible by solvent molecules [25,45]. Furthermore, ionic aggregation decreases the mobility of dissociated cations by significantly altering the network structure and reducing polymer segmental dynamics [52]. The degree of ion dissociation impacts the degree of ionic aggregation, so the differences in ion dissociation as a function of the cation identity were likely responsible for the slight variations on the general trends for the PEGDMA-SS polymers. This was especially evident comparing the monovalent SIPEs to the more-difficult-to-dissociate divalent SIPEs.
For systems in which the ion dissociation is more facile, such as the PTHFDA-STFSI SIPE, the charge density at which the ionic conductivity is maximized is increased. In other words, the point at which the enhanced benefit to ionic conductivity of having more charge carriers gets overtaken by the penalty to ion mobility occurs at higher charge densities. The factors that influence where this tradeoff occurs are numerous, including cation (valency), anion chemistry (dissociability, proclivity to aggregation), crosslinker chemistry (interaction with ionic domains), and solvent (dissociating power), to name a few.
The reversal of the general trend for the PEGDMA-SS polymers when swelled with EC:PC compared to the DEG or TEG is explained by the nature of EC:PC. As a high dielectric solvent compared to the ethers, EC:PC is capable of dissociating a greater number of ion pairs, even with the harder SS anion. This enhanced dissociation leads to a greater actual number of charge carriers and reduced ionic aggregation (enhanced mobility), shifting the maximum ionic conductivity case to a higher charge density. These trends are revisited in the SAXS section, as the presence of ionic aggregation is evident and noticeably impacted by many of the explored parameters.
The clearest conclusion in terms of general materials properties is that the effect of charge density on conductivity is specific to the conditions used and the polymer chemistry. For a given system, there likely exists a charge density that balances the components of Equation (1) to yield a maximum ionic conductivity. Reducing ion aggregation and enhancing ion dissociation appear to shift the maximum conductivity condition to higher charge densities.

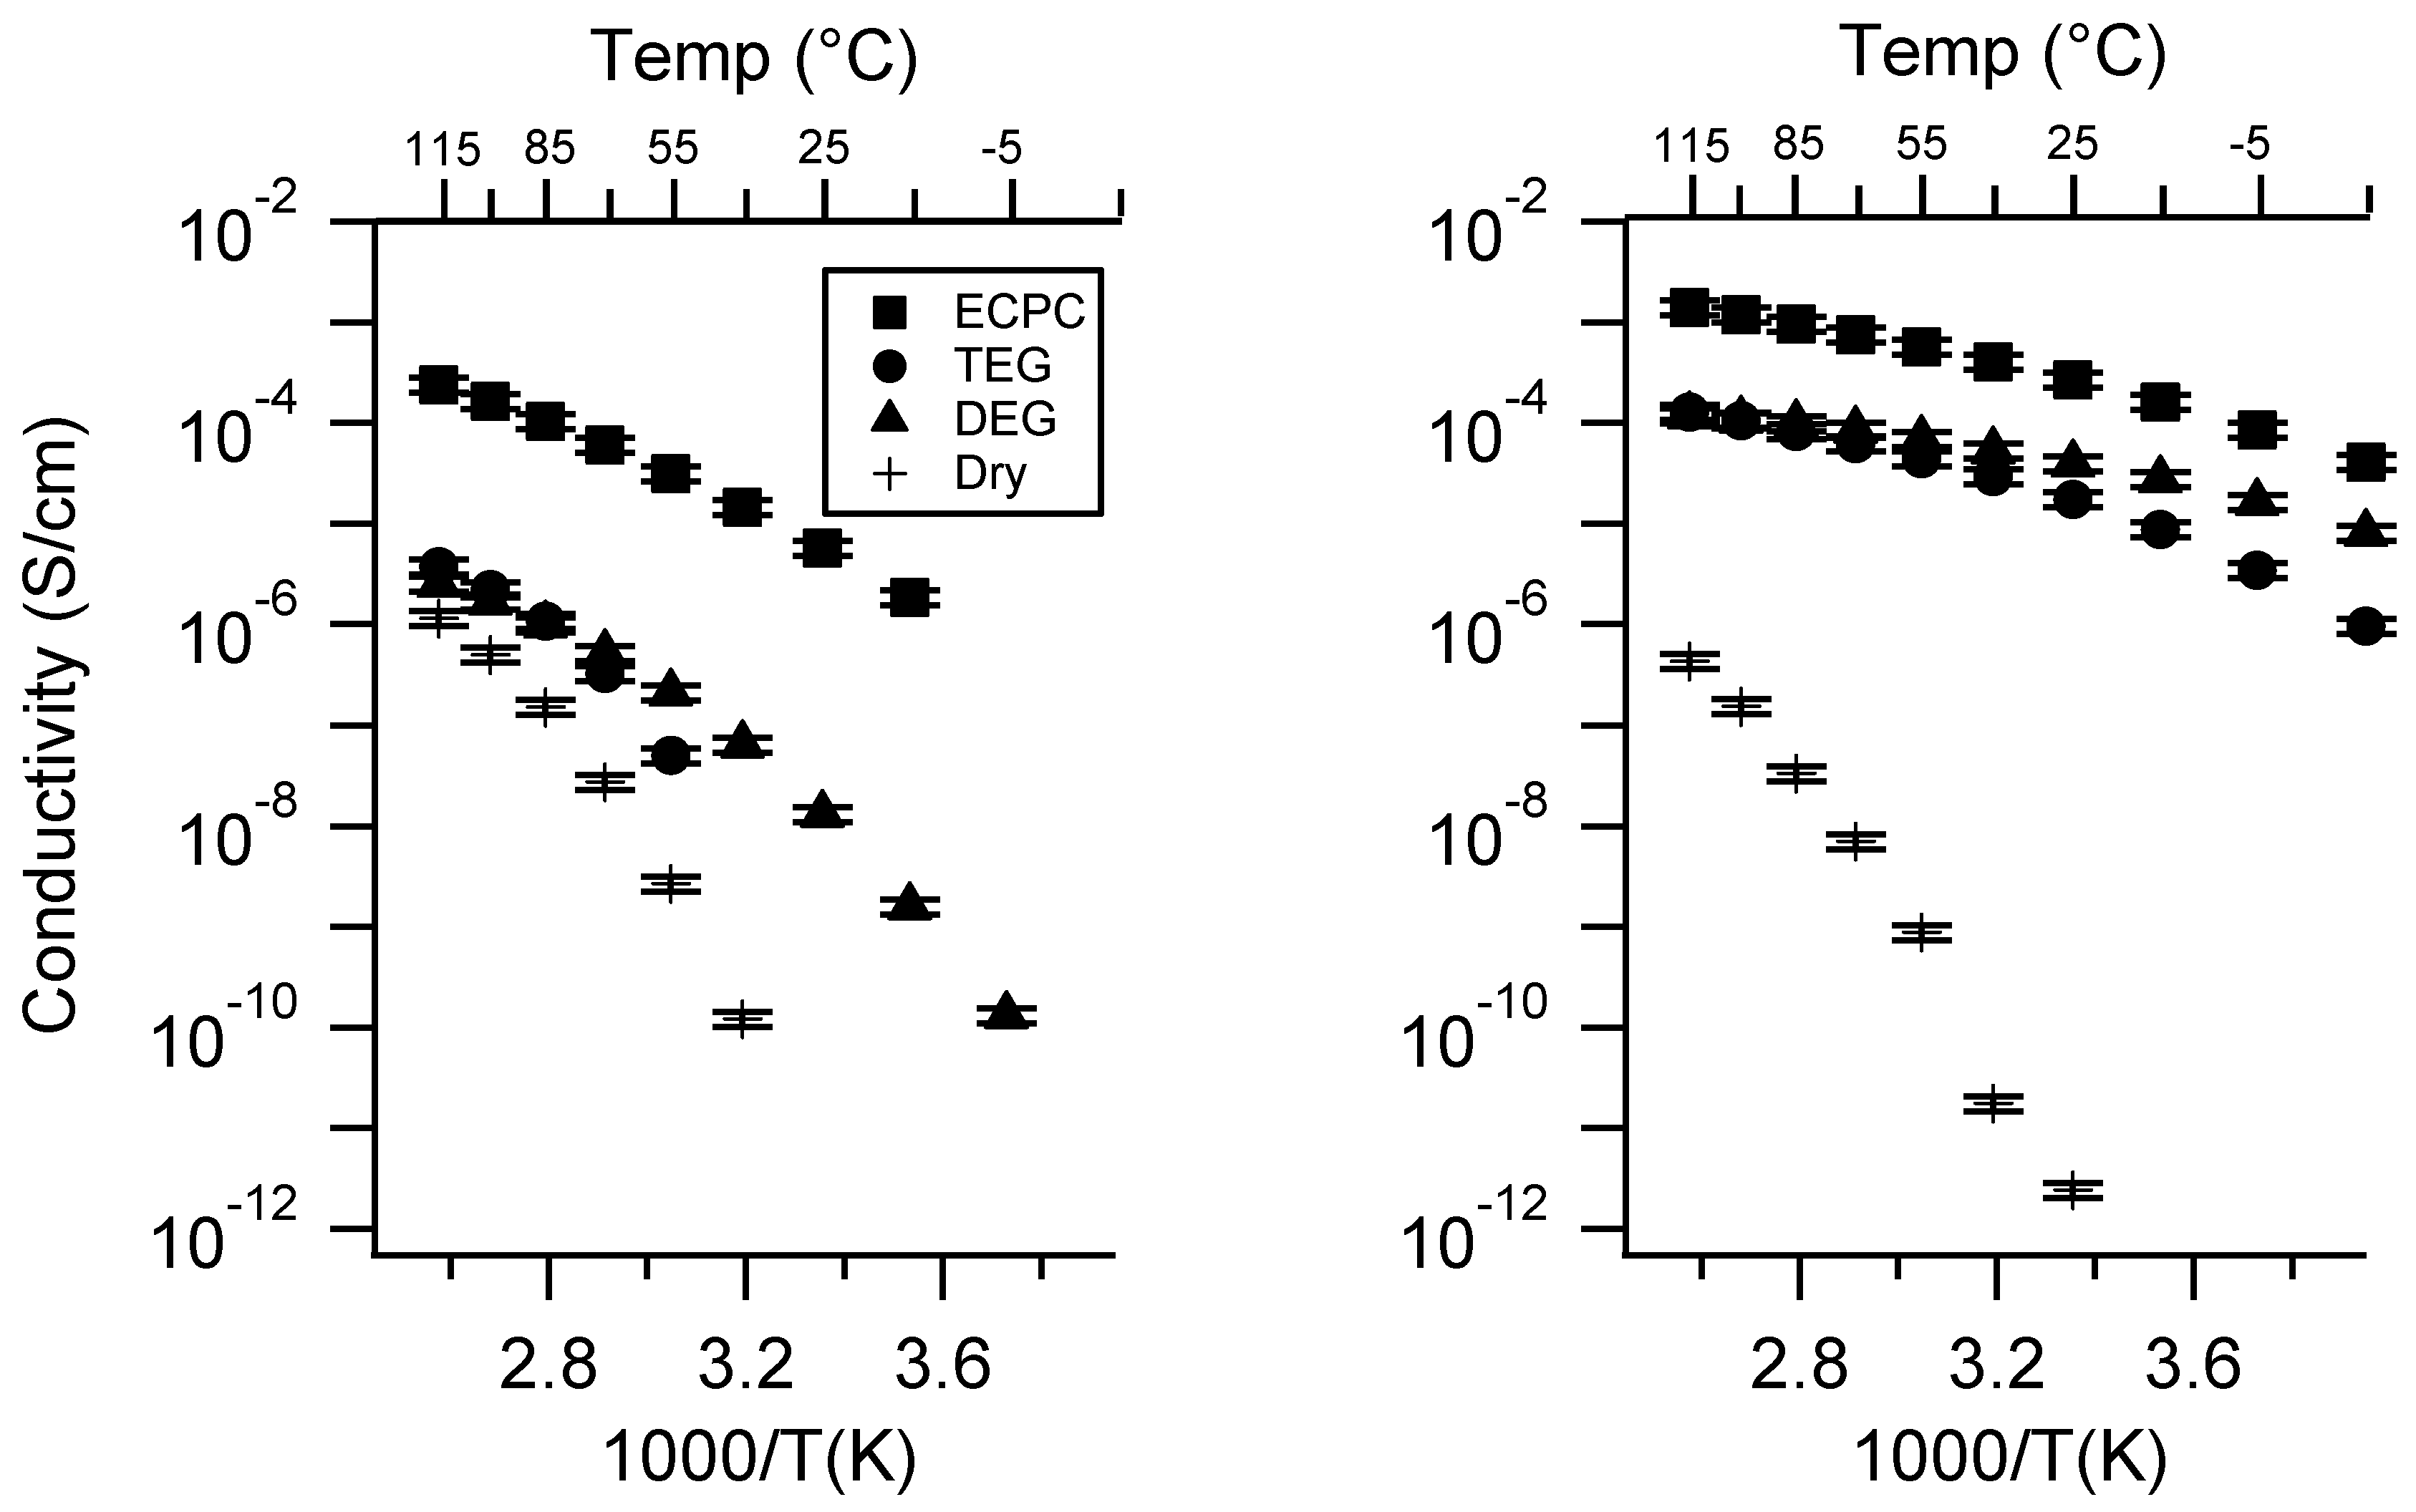
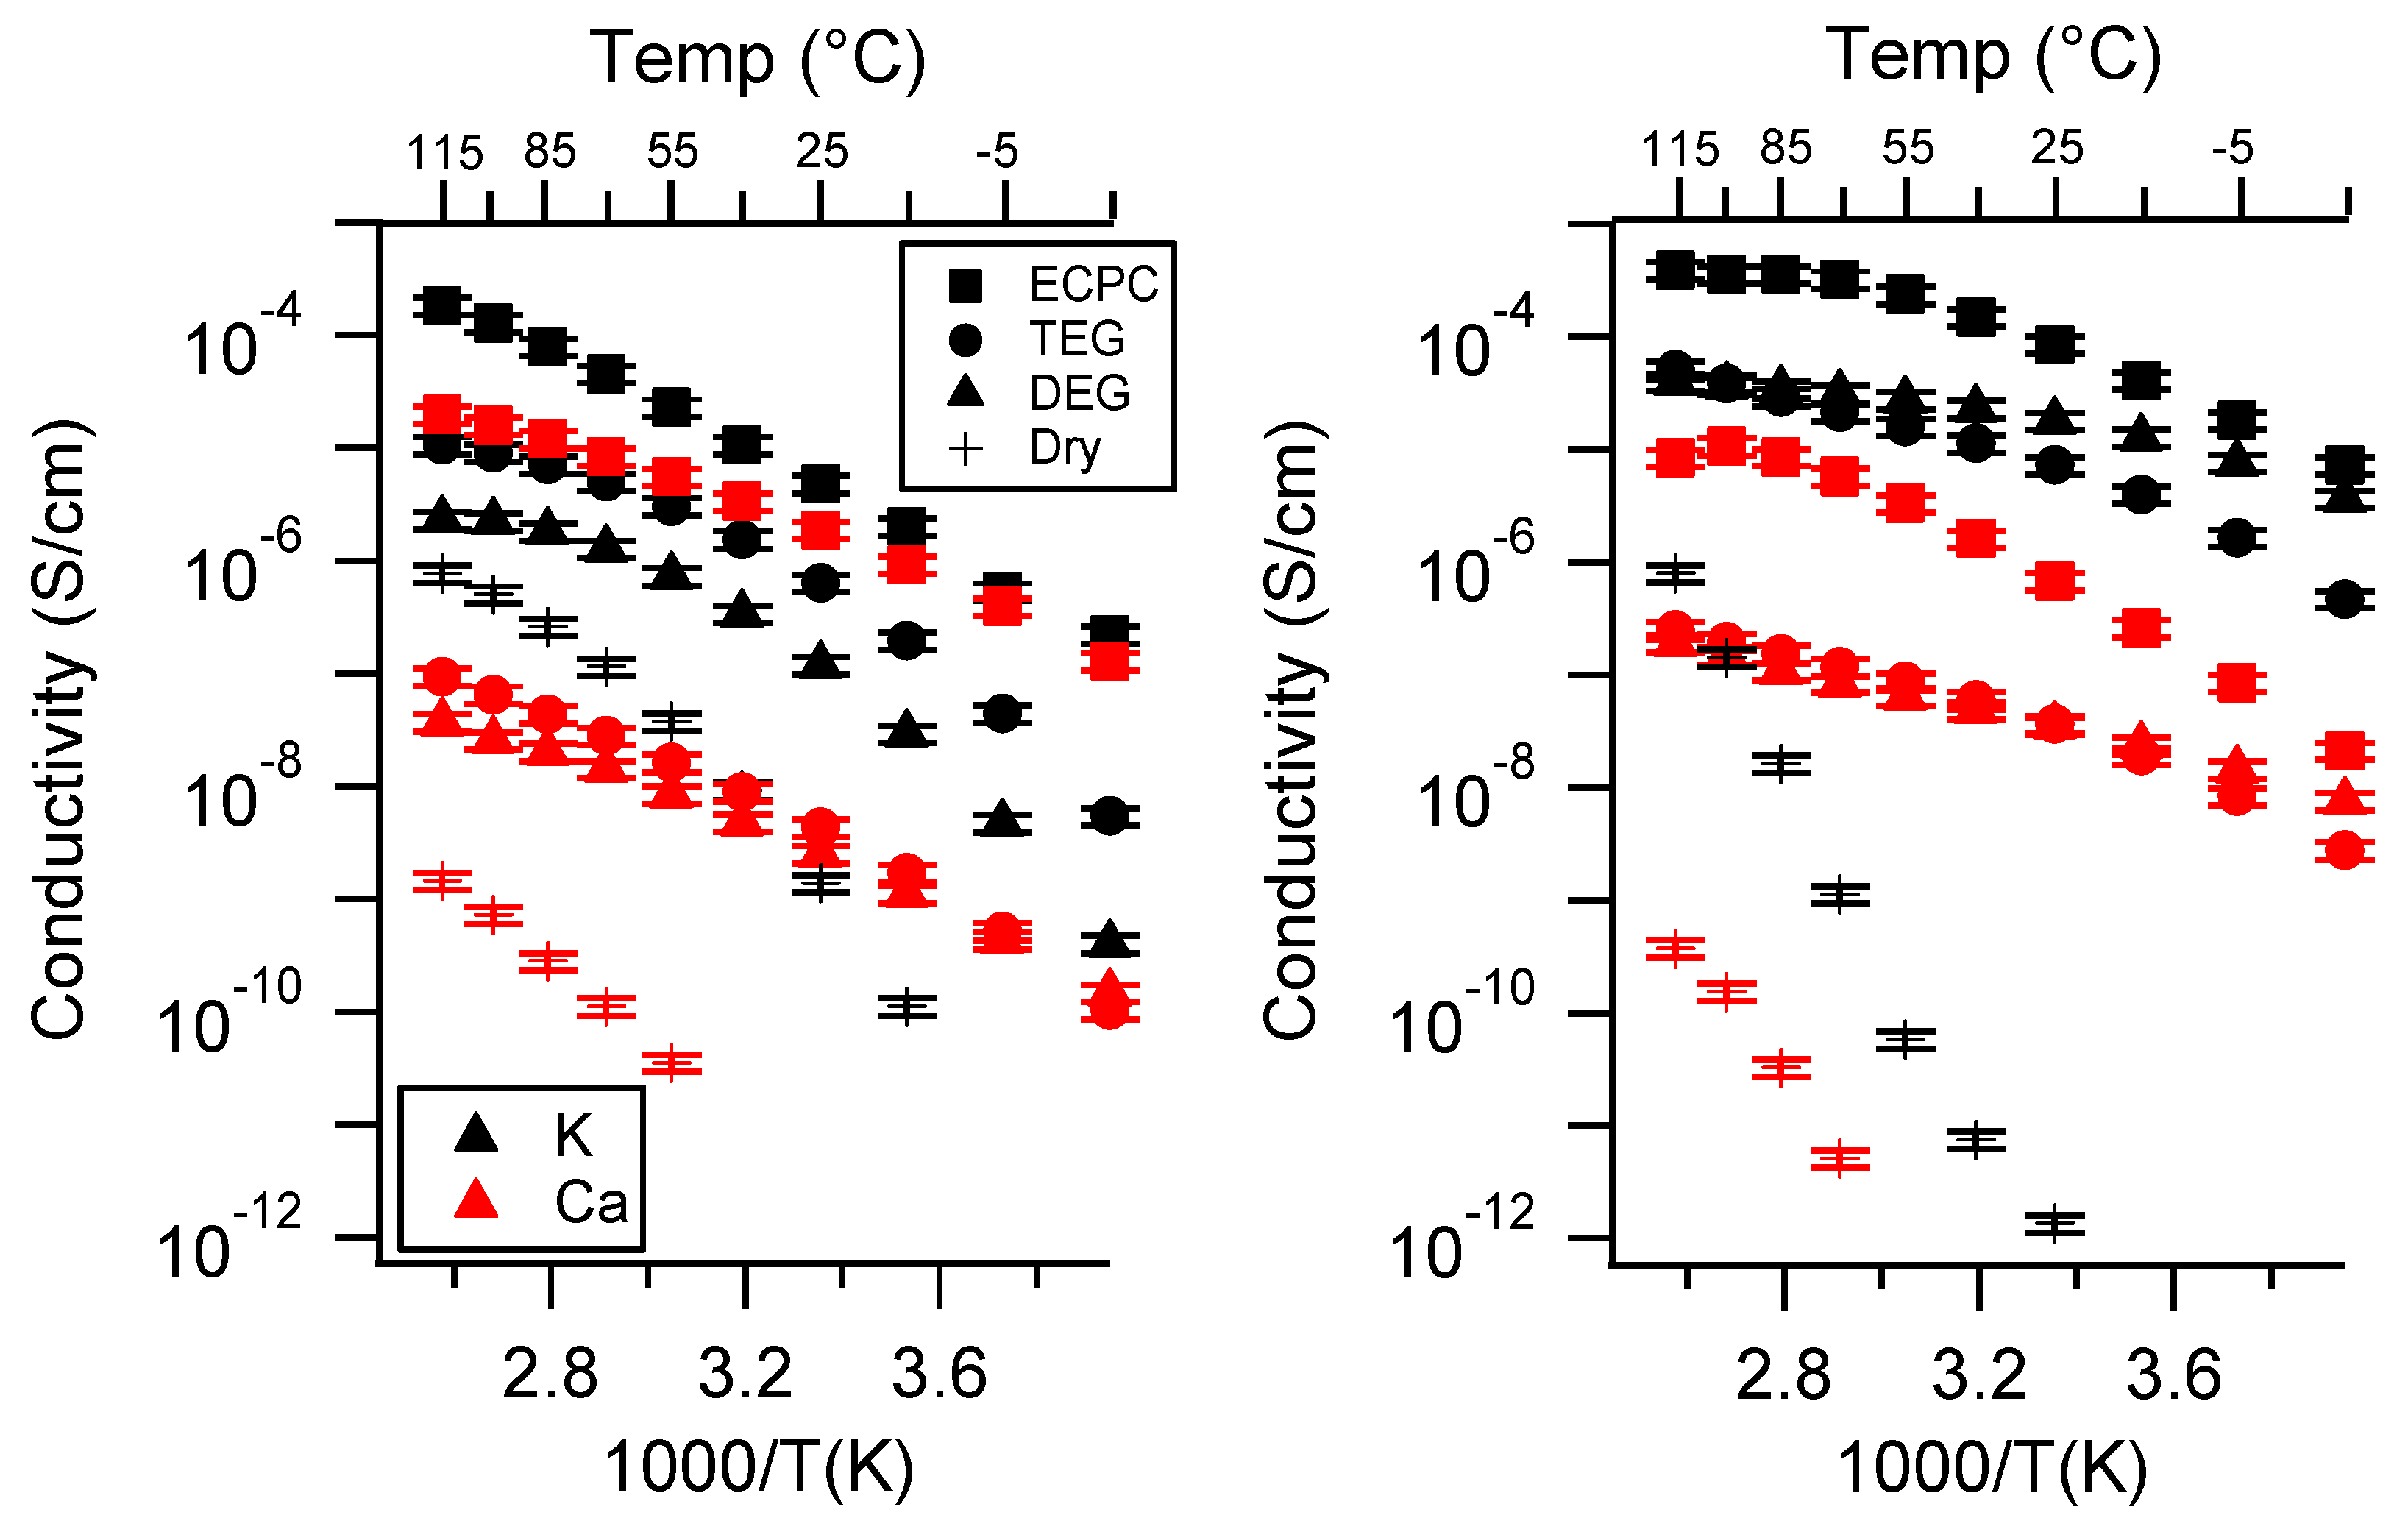
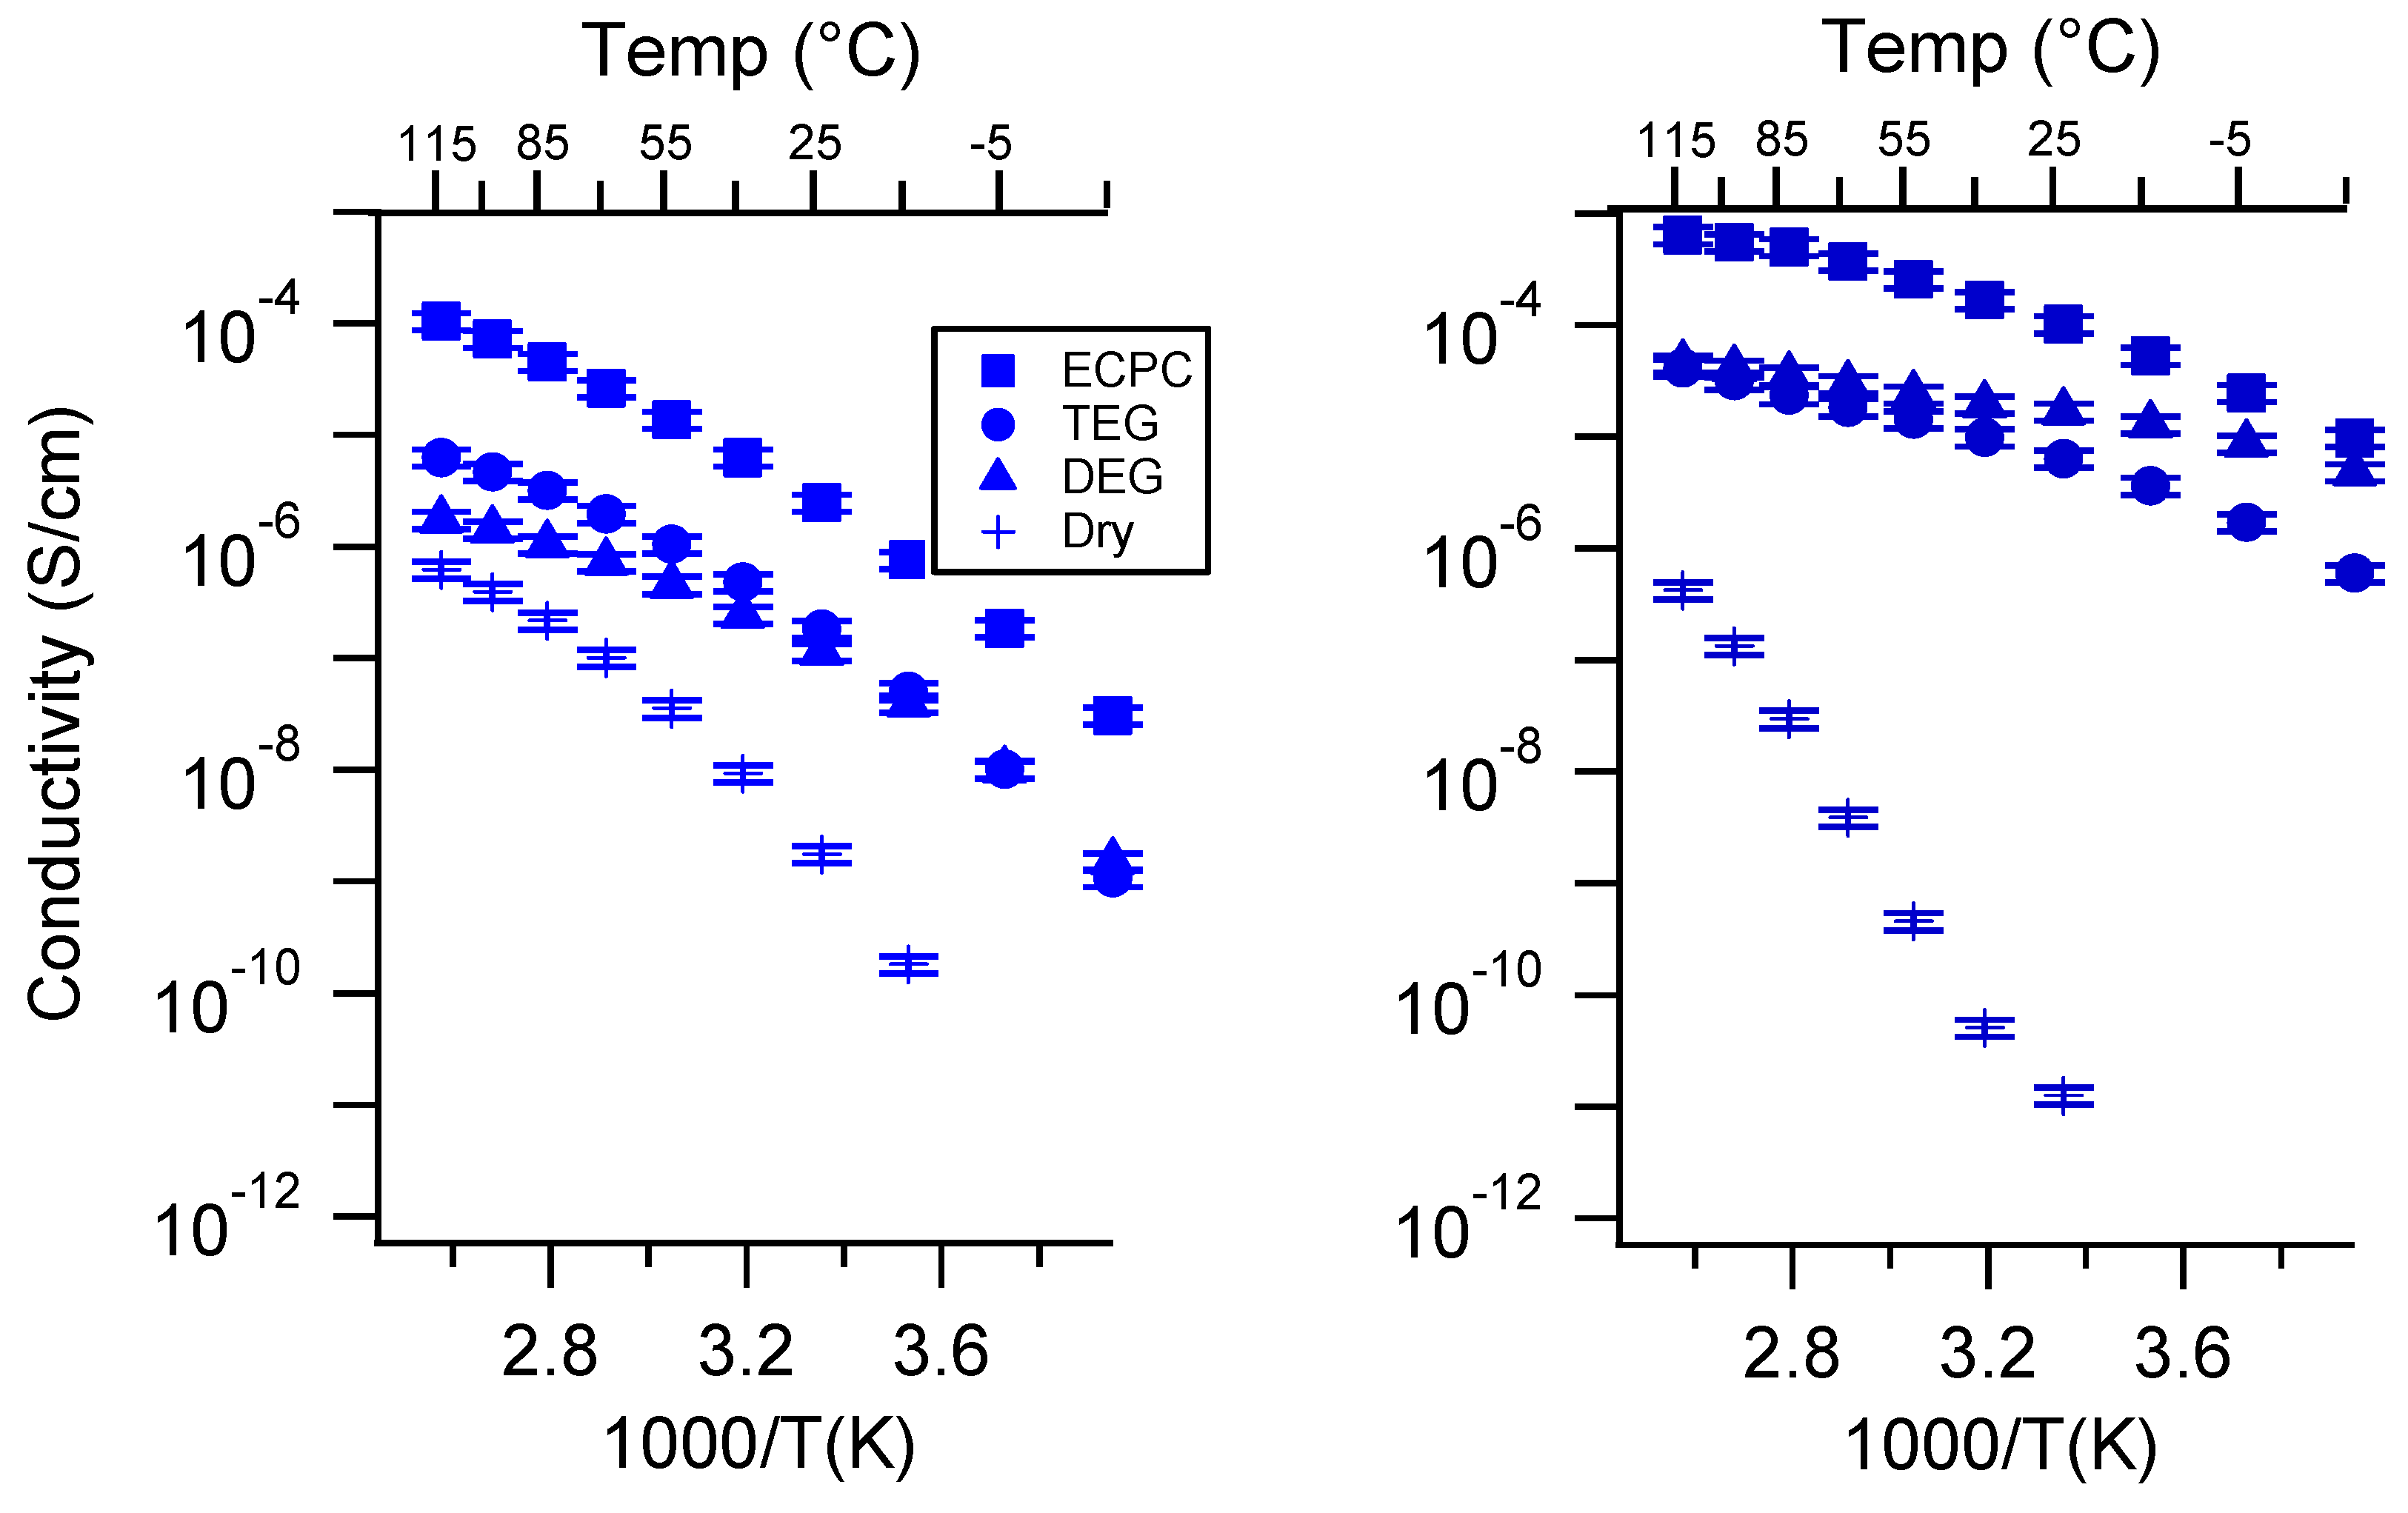
2.3. Effect of Swelling Condition

At this point, the reader can most likely predict the impact of the swelling condition on the conductivity of the SIPE. Figure 5 shows the conductivity as a function of solvent for selected SIPEs. In all compositions studied, swelling in EC:PC yielded the highest conductivity compared with swelling in ethereal solvents or the dry state. The higher dielectric constant of EC:PC means that it better facilitated dissociation of ionic groups (enhancing the number of charge carriers and ion mobility) and also shifted the bulk of dissociated cations to a solvent-coordinated state rather than a polymer-coordinated state (further enhancing mobility).
Similarly, the dry state always presented the lowest conductivity. Samples in the dry state had the lowest proportion of dissociated ionic groups, lowest ion mobility, and the highest degree of aggregation. The dry condition was the only condition in with the PEGDMA-SS system had a higher conductivity than the PTHFDA-STFSI SIPEs. This is because the higher oxygen density of the PEGMDA polymers facilitated ion dissociation and transport by providing a higher density of cation coordination sites compared to PTHFDA [46,53,54,55].
For the PTHFDA-STFSI SIPE, DEG yielded a higher conductivity than TEG for the Na and K exchanged polymers at low to moderate temperatures, with DEG and TEG becoming equivalent at high temperatures. In the Ca form, at the lowest charge density, DEG and TEG followed this same trend. At the highest charge density this trend was reversed. DEG and TEG produced very similar results for the intermediate charge density Ca polymer.
The trend between DEG and TEG was less clear for the PEGDMA-SS polymers. In some cases, DEG and TEG trended to the same conductivity with increasing temperature (PEGDMA1000_med_SSNa, PEGDMA1000_med_SSCa, PEGDMA1000_med_SSK, and PEGDMA1000_high_SSNa). Such as with the PTHFDA polymers, in this condition the DEG swelled SIPEs were more conductive than the TEG swelled samples at lower temperatures.
In all of the other cases, swelling with TEG yielded a more conductive SIPE, and the TEG and DEG did not trend to the same conductivity with increasing temperature (PEGDMA1000_low_SSK, PEGDMA1000_low_SSNa, PEGDMA1000_low_SSCa, PEGDMA1000_med_SSK, and PEGDMA1000_high_SSCa). If one discounts the PEGDMA1000_med_Ca and PEGDMA1000_high_Ca, which hardly swelled in TEG/DEG, it seems that the split between TEG and DEG trends occurred on the basis of charge density with a slight contribution from cation type. The low charge density polymers were most conductive in TEG, the high charge density polymers most conductive in DEG, and the intermediate charge density polymers were split on the basis of the cation.
DEG and TEG are chemically very similar. Their major difference is geometric in that TEG is longer than DEG, which we hypothesize leads to differences in ionic interactions. In the case of the lower charge density materials, the degree of ionic aggregation was lower. As the aggregates were less dense, the larger TEG molecule was apparently not prohibited from entering the aggregate and dissociating the ionic groups. Presumably the stronger chelation strength of TEG gave rise to a higher degree of dissociation and therefore higher conductivity than DEG in these cases. Once the aggregates became larger and denser, as in the higher charge density materials, the larger TEG molecule was now restricted from accessing the ionic groups. The DEG molecule, being smaller, could likely penetrate the aggregate more easily.
In cases where ion dissociation was not the controlling factor in the conductivity of the SIPE (i.e., when the ions dissociated easily, like in the PTHFDA-STFSI membranes) DEG outperformed TEG due to its reduced viscosity. The reduced viscosity translated to enhanced ion mobility. At higher temperatures, the DEG and TEG swelled SIPEs trended to the same conductivity, as the viscosity decreased as temperature increased.
Overall, the reported results largely followed expectations: Increasing the dielectric constant/donor number of the solvent increased the ionic conductivity. In cases where solvents had similar chemistry, the details of molecular geometry came into effect. These effects were more pronounced in systems that were constrained by the activation energy of ion dissociation, as opposed to those where the activation energies associated with ion transport were dominant.
Table 4 summarizes the conductivity of every sample in every condition at 25 °C and 85 °C. Compositions that reached 1 × 10‒5 S/cm are highlighted in bold, as these could be considered conductive enough SIPEs for practical implementation.

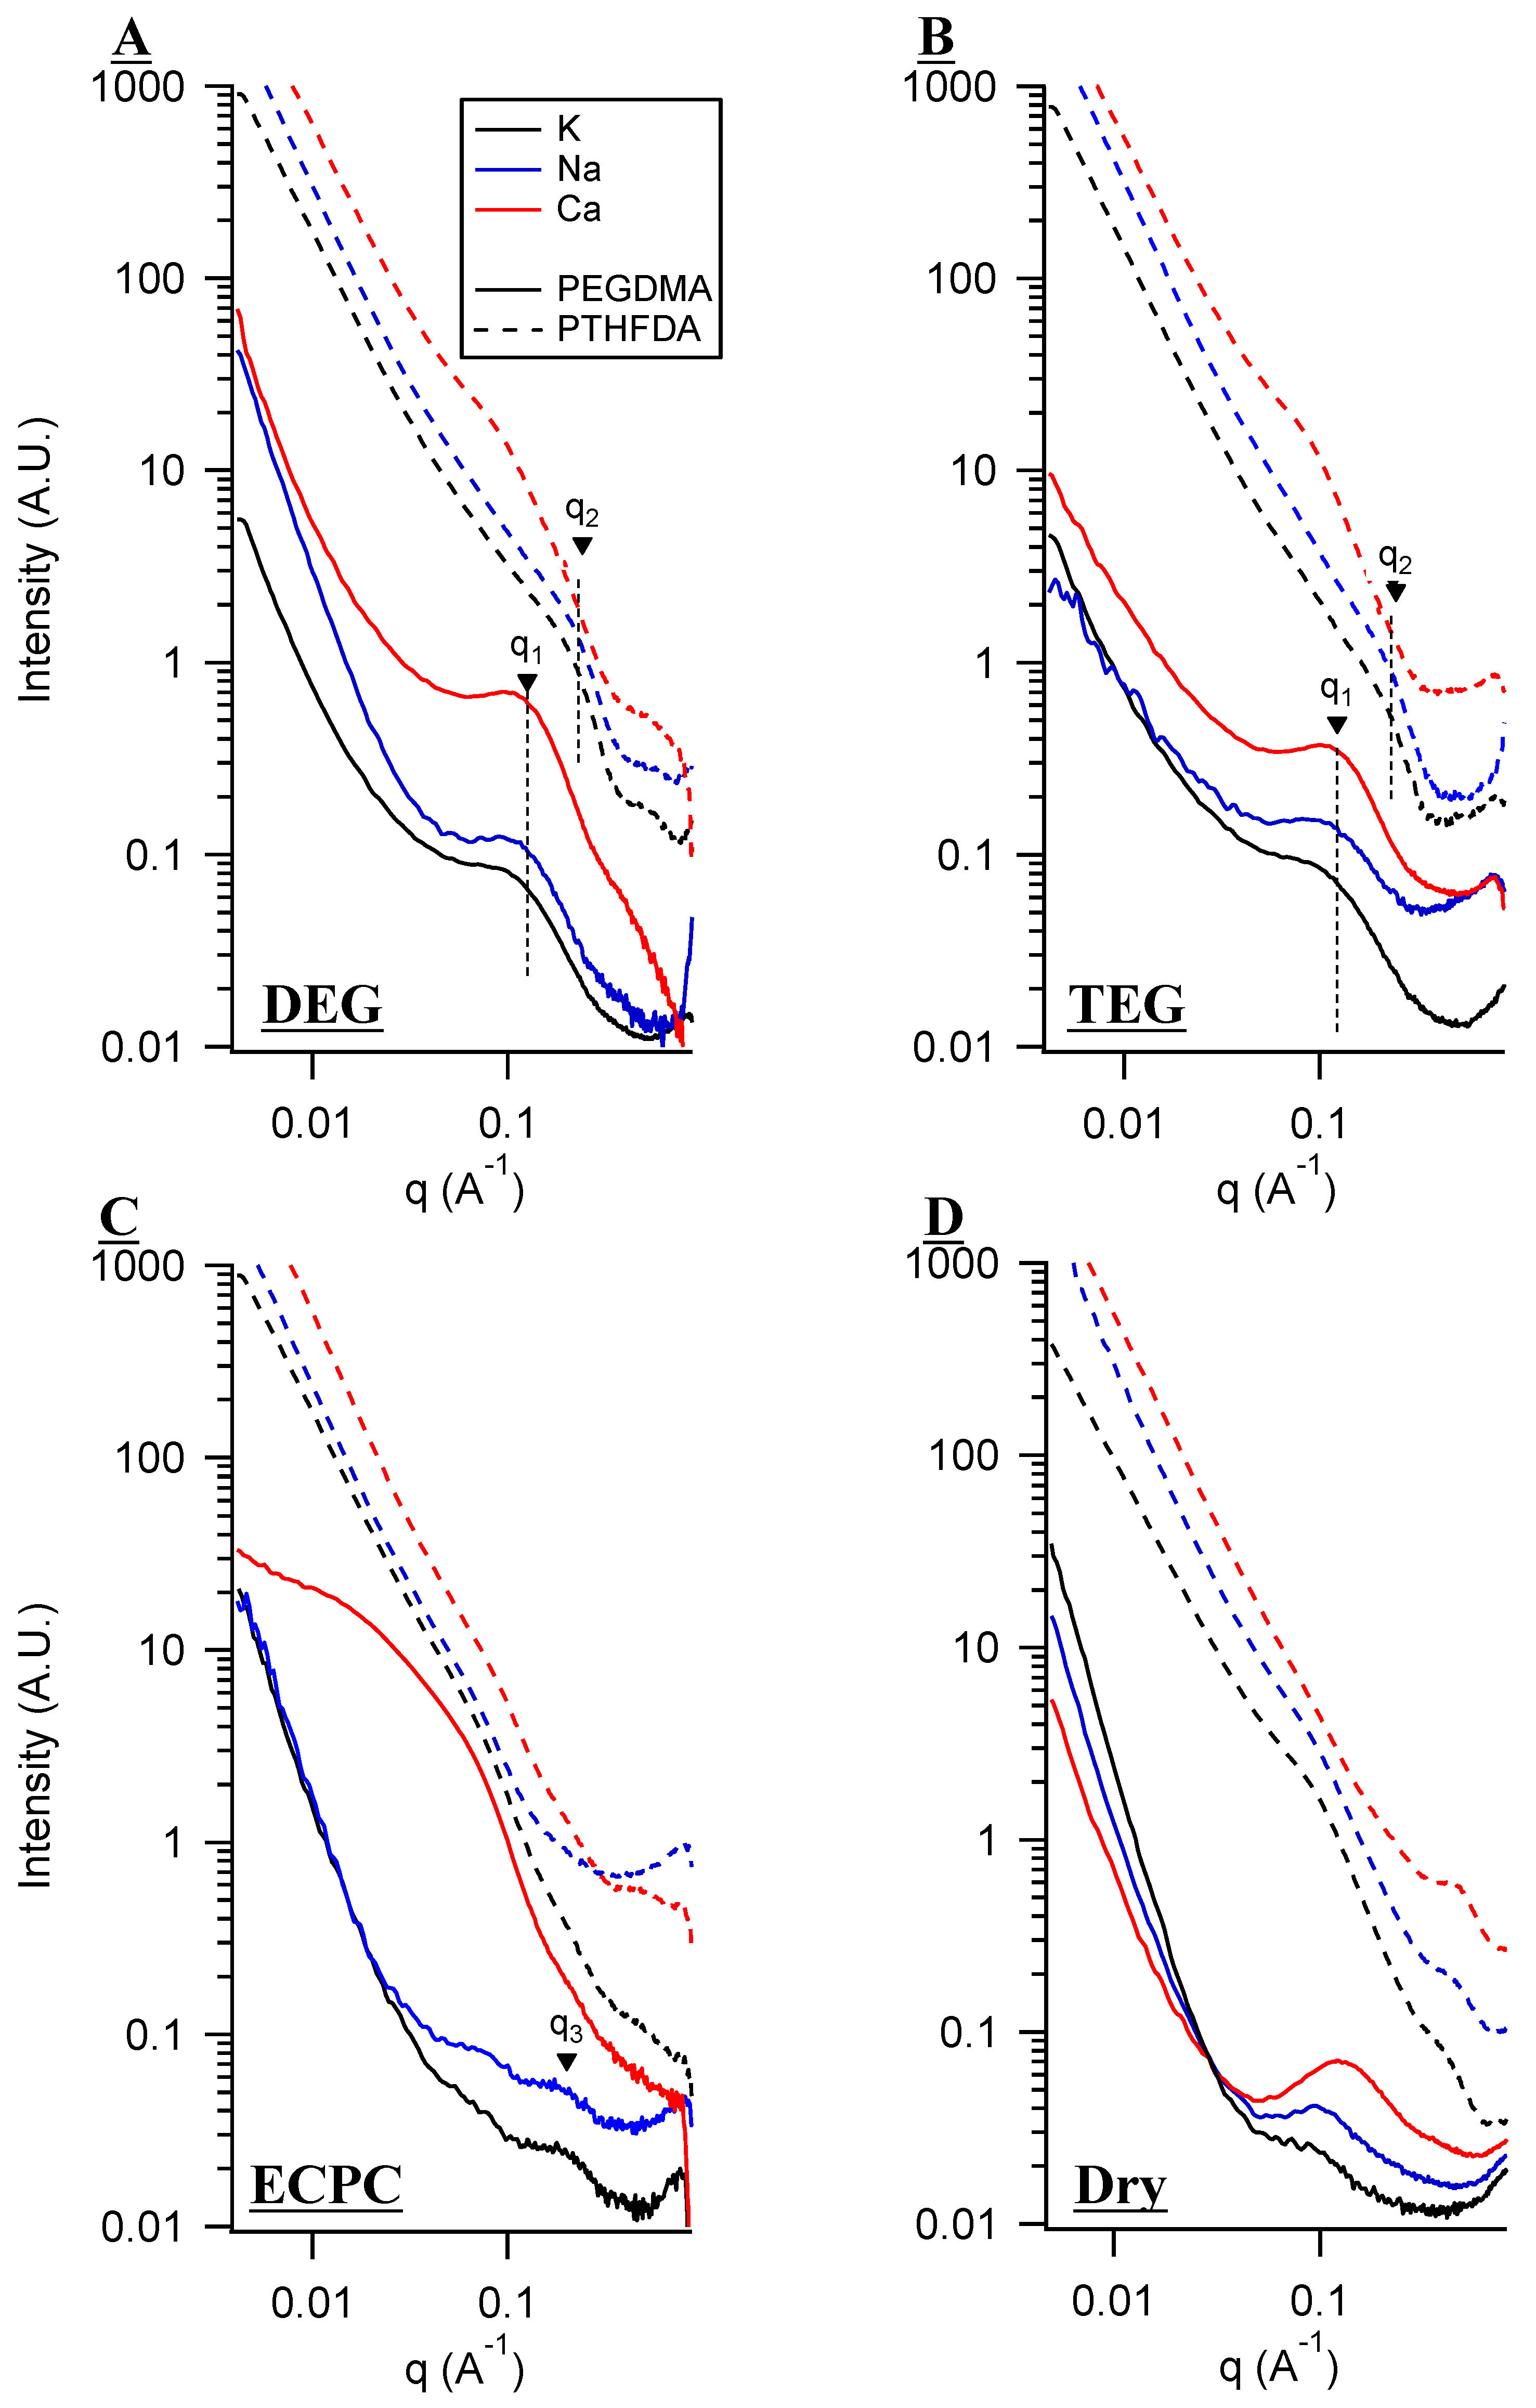
3. Small Angle X-Ray Scattering (SAXS) and Solvent Uptake

SAXS is a powerful tool for probing the morphology of soft materials. A select subset of the SIPEs studied above were examined with SAXS in an attempt to contextualize the observed conductivity trends within terms of the polymer structure. It has been previously demonstrated that these types of SIPEs display a characteristic “ionomer peak” that is indicative of ionic aggregation [18,44,45].
The ionic aggregates were spatially located with a high enough degree of order that they gave rise to constructive Bragg scattering of the incident X-rays, producing areas of local maxima in the intensity vs. q plot shown in Figure 6. These areas of local maxima/shoulders give information about the aggregate and polymer morphology. The q value of the maxima, q x , can be related to the distance separating the ionic aggregates via q x = 2 π / d x and the intensity can be related to the aggregate density and degree of aggregate order [25]. Furthermore the distance between aggregates calculated by dx is related to the degree of aggregation, wherein for these systems, larger dx correlates to a higher degree of aggregation [45]. Demonstrated previously is the trend of charge density on aggregation: a higher charge density (more ionic groups) leads to higher degrees of ionic aggregation [45].
Comparing the SIPEs swelled in DEG and TEG, there existed a significant difference on the basis of polymer chemistry. The PEGDMA-SS SIPEs presented intense maxima corresponding to ionic aggregation with d1 ≈ 6 nm in DEG and TEG. The spacing between aggregates was roughly half of that in the case of the PTHFDA-STFSI polymers, about d2 ≈ 3 nm for the Na and K exchanged polymers. The decreased inter-aggregate distance and lower scattering intensity means that even though the PTHFDA-STFSI polymers had a higher charge density, they were less aggregated than the PEGDMA-SS polymers. The decrease in aggregation likely came from at least two factors. The first was the significantly higher dissociability of the STFSI anion compared to the SS anion [18]. Higher dissociation leads to less ionic aggregation [45].
The second factor leading to the difference in aggregation between the SIPE types is more subtle, and concerns an inferred polymer chain arrangement. The polar STFSI anion does not like to be in close proximity to the low polarity PTHFDA main chain, instead preferring to interact with the more polar acrylate end groups. In fact, the use of dichloromethane is required in the polymerization protocol of the PTHFDA-STFSI as an emulsifier for achieving a mono-phasic polymer precursor solution (see experimental section for more details). The interaction of the polar SS and polar PEGDMA main chain is much more favorable. Of course, the SS monomer still must polymerize with the acrylate end group, but the chances of a main chain being in close proximity to the polymerization reaction is higher. We hypothesize that these differences in ionic monomer/crosslinker main chain interactions resulted in different polymer arrangements. In the case of low ionic monomer/main chain interaction, we theorize there is less polymer chain looping and that the ionic groups are located in a more linear bottlebrush-like configuration along the acrylate backbone. The opposite is true for the PEGDMA-SS polymer, which could have more chain looping and a more three-dimensional distribution of ionic groups.
With ionic groups located along more linear acrylate backbone segments as opposed to three dimensional structures, the collapse of ion groups into aggregates is less favorable; the likelihood of bending rigid polymer coils into aggregates is lower than the collapse of three-dimensional structures inwards, which would not require as much contortion of the acrylate backbone. The chain looping hinders the uptake of solvent, especially when the crosslinker chains are trapped in a polymer sheath around the ionic aggregate [56]. Lower solvent uptake results in lower ion dissociation and fewer solvent-coordinated cations. Table 5 shows the swelling data for PEGDMA-SS and PTHFDA-STFSI polymers, and indeed a large difference in solvent uptake was observed on the basis of polymer chemistry. The higher degree of aggregation in the PEGDMA-SS polymers, as a function of the anion dissociability and polymer arrangement, as well as the lower solvent uptake, means these systems had significantly lowered n and μ compared to the PTHFDA-STFSI, resulting in the difference in conductivity.
The low q upturn observed in these systems is very commonly observed in ionomers. The low q upturn is generally not well understood for ionomers, and is not appropriate to fit with classic low-q Guinier models [57]. For ionomers the upturn had been proposed to be related to the degree of inhomogeneity at larger length scales [57,58,59]. We propose that the q value at which this power-law relationship between I and q begins is indicative of the length scale at which inhomogeneity becomes important from a scattering perspective. In other words, the q value at which the upturn begins represents how far out a viewer would need to zoom to notice scattering length density inhomogeneity in the material, beyond the interface of a few scattering structures and surrounding media. Thin, randomly oriented rod-like segments would present inhomogeneity at higher q values (smaller length scales) than three dimensional structures. This may explain why the upturn happens at higher q values in the PTHFDA-STFSI polymers than the PEGDMA-SS polymers. The true nature of this upturn, however, requires additional investigation that lies outside the scope of this study.
In EC:PC, the local maximum of the ionic aggregate shifted to higher q for the PEGDMA-SS K and Na samples. The higher q corresponded to d3 ≈ 3 nm, meaning the samples were less aggregated. This should be expected considering the ability of high dielectric EC:PC to dissociate ionic groups, and the inverse relationship between the degree of aggregation and ion dissociation. Subtle shoulders at the same q value were observed for the PTHFDA-STFSI samples. The differences in conductivity between the two SIPE classes in EC:PC therefore appeared to stem from the differences in cation–polymer interactions, solvent–polymer interactions [46], and chain looping (which was unfortunately not directly visible with SAXS), as opposed to differences in ionic aggregation.
In the dry state, there was a substantial difference in aggregation between the SIPE types, and also the greatest difference observed between cation types for any swelling condition. The aggregation intensity increased as the dissociability of the cation–anion pair decreased.
A second shoulder at intermediate q for the K and Na exchanged forms in the dry state was observed corresponding to a length scale of about 6 nm, with a similar feature observed for the PTHFDA1000_med_STFSICa sample swelled in DEG and TEG. The nature of these shoulders is unknown, but they do not appear to be a related to the higher q structure in the sense that the q values do not conform to the ratios for highly ordered systems with defined spacing (lamellar, hexagonal, etc.) [60].
Of the features corresponding to known structural elements, it can be seen that the conductivity of the SIPE was inversely related to the degree of ionic aggregation. Decreasing ionic aggregation through polymer chemistry and plasticizing with solvents leads to enhanced conductivity.

4. Conclusions

A series of SIPEs were studied, consisting of different chemistries (PEGDMA-SS and PTHFDA-STFSI), different cations (K, Na, and Ca), different charge densities (low, med, high), and different swelling conditions (DEG, TEG, EC:PC, and dry). On the whole, the PTHFDA-STFSI SIPEs were more conductive than the PEGDMA-SS counterparts in the gel state, as the former had higher ion dissociation, lower ionic aggregation, and lower polymer–cation and polymer–solvent interactions. The effect of cations on conductivity was clear when comparing valency: divalent cation exchanged polymers were significantly less conductive than monovalent SIPEs. The difference in conductivity between K and Na exchanged polymers mattered most when ion dissociability was low and when dissociated cations interacted strongly with the polymer matrix. The effect of charge density was revealed to be dependent on polymer chemistry; when the additional ion content of high charge density polymers could be dissociated and did not contribute to reduced ion mobility via morphological changes induced in the polymer, the conductivity was improved. Finally, the effects of swelling condition largely followed intuition, in that high dielectric constant solvents enhanced conductivity. Solvent molecular geometry is important in cases where the polymer may have constrained dynamics, such as in ion aggregated samples. Finally, with the use of SAXS it was determined that the ionic arrangement within the two types of polymers were different. PEGDMA-SS samples had a notably higher degree of ionic aggregation than PTHFDA-STFSI samples, and the degree of ionic aggregation was inversely related to the conductivity.
A number of the materials studied reached or surpassed sufficiently high room temperature conductivity (1 × 10⁻⁵ S/cm for SIPEs) to be considered of practical merit. The lessons learned from the Li SIPE literature translate well to these beyond Li polymer electrolytes: enhancing ion dissociation and ion mobility through control of polymer chemistry and morphology leads to an enhancement of conductivity. The comparison of SIPE classes presented here gives insights into how to control these transport dictating polymer characteristics, which we hope will help guide the engineering of the future beyond Li ion polymer electrolytes.

5. Experimental

(1) Synthesis of PTHFDA and STFSI monomers.
PTHFDA was synthesized as recently reported [46]. In an argon filled glovebox (<10 ppm O2, <0.1 ppm water), poly(tetrahydrofuran) (PTHF, Sigma Aldrich) 1000 g/mol was dried under dynamic vacuum at 80 °C for 12 h. The dry hydroxyl-terminated PTHF monomer was acrylated using triethylamine (TEA, Sigma Aldrich, 99.9%) and acryloyl chloride (AC, Sigma Aldrich, 5 g ampules). A molar ratio of 1:4:5 PTHF:AC:TEA was used. The reaction was performed in oven dried glassware (120 °C) excluding light. Typical synthesis was performed on a 10 g scale with respect to the AC. To 100 mL of anhydrous dichloromethane (DCM, Aldrich) and the TEA, dry PTHF was added, then dissolved. Attached to an addition funnel containing 10 g of AC in 30 mL of DCM, the round bottom flask was transferred to a Schlenk line under N2 flow in an ice bath. The contents of the addition funnel were emptied into the round bottom flask dropwise over a period of four hours. The solution was stirred overnight, yielding an opaque orange mixture.
This mixture was filtered, and the clear brown liquid concentrated to a dark residue using rotary evaporation. An orange solid was precipitated by adding this residue to 700 mL of stirred hexane. This mixture was filtered, the clear solution was saved, and the solid was re-extracted with hexane. After re-filtering the solid, the two hexane solutions were combined and concentrated to a light yellow viscous residue with rotary evaporation, which was further dried under high vacuum for 24 h. For additional details refer to reference [46].
Potassium 4-styrenesulfonyl (trifluoromethylsulfonyl)imide (KSTFSI) was synthesized according to the literature [61].
(2) Synthesis of crosslinked SIPEs
The synthesis of the PEGDMA based SIPEs followed our previously documented procedure [45]. Likewise the synthesis of the PTHFDA-STFSI SIPEs followed our recently reported work [46]. All amounts used in making the monomer solutions, which were used to prepare the crosslinked SIPEs, are listed in Supplementary Materials Table S1. For the PTHFDA-STFSI polymers, TEG (Sigma Aldrich, distilled and kept on molecular sieves in glovebox) along with gentle heat was used to dissolve the KSTFSI monomer. The proper amount of PTHFDA was then added. PTHFDA-KSTFSI solutions tend to phase separate once dissolved in TEG. Dichloromethane (DCM) was added to these solutions to yield a single phase solution. Photoinitiator 2-hydroxy-4’-(2-hydroxyethoxy)-2-methyl propiophenone (Sigma-Aldrich) was dissolved in this solution, 4 wt % with respect to total monomer weight. The polymers were UV-crosslinked in a UVC-515 Ultraviolet Multilinker 254 nm UV oven while compressing the monomer solution between two ¼ in. thick borosilicate glass plates (McMaster Carr). The thickness of the polymer was controlled by 200 um thick glass microscope slides (VWR), which were used to separate the glass plates. The plates containing the sandwiched monomer solutions were flipped every 5 min for a total irradiation time of 90 min. The polymers were washed with methanol to remove unreacted monomers and initiator. Using a stirred ion exchange solution of 0.5 M metal chloride, the polymers were submerged and exchanged to the desired cation exchanged forms of the polymer. The ion exchange solvent was 1:1 by volume methanol and 18 MΩ deionized water. The ion exchange solution was changed twice daily for 48 h, after which any remaining salt was removed by employing the same process but with a salt-free exchange solution (i.e., pure 1:1 water:methanol). Once air-dried, the polymers were dried further at 80 °C under vacuum in an argon filled glovebox.
The ion exchange process was proved to be stoichiometric for PEGDMA based polymers, as established in our previous work [18,44,45]. For the PTHFDA polymers presented here, successful stoichiometric ion exchange was confirmed with the use of inductively coupled plasma-optical emission spectroscopy (ICP-OES) for PTHFDA1000_low_STFSIK, PTHFDA1000_med_STFSIK, PTHFDA1000_high_STFSIK, PTHFDA1000_low_STFSICa, and PTHFDA1000_med_STFSICa. The PTHFDA1000_high_STFSICa was found to contain 86% of the expected amount of Ca based on the starting monomer solution; no K was detected in this polymer, meaning the lower than expected number likely stemmed from unreacted ionic monomer. The sodium forms were assumed stoichiometric on the basis of the results for the K exchanged polymers.
(3) Solvent Drying
Three angstrom molecular sieves (Aldrich) were used to dry all solvents and solvent mixtures for at least four days prior to use in conductivity or swelling measurements. Solvents were stored inside an argon filled glovebox.
(4) Solvent Swelling Measurements
Polymer samples were cut into 1/4” diameter pieces, then weighed in the dry state. This was done in triplicate. The polymer samples were swelled for at least four hours in order to reach swelling equilibrium [44]. Solvent was removed from the surface of the swelled polymers with a tissue, then the thickness, diameter, and mass of the polymers were measured.
(5) Conductivity Measurements
Using a Novocontrol Turnkey Broadband Dielectric Spectrometer, conductivity was measured. This was done over the temperature range of −20 °C to 115 °C from lower to higher temperature. Dry/swelled polymers were placed between brass electrodes inside the conductivity cell within the glovebox. The σDC was extracted from the plateau in the σAC vs. frequency. Gaps in the presented σDC were a result of no clear plateau in the σAC vs. frequency response. A standard error of 16.9% was reported on all conductivity values, which was calculated by measuring the conductivity of six identically prepared samples. Therefore this RSD was representative of the error associated with polymer homogeneity, sample swelling, and sample cell assembly. The error reported on the molar conductivity plots (Appendix D Figure A32) was the standard conductivity RSD propagated with the error in measuring the sample volume.
(6) Small Angle X-ray Scattering
Selected SIPEs were loaded into glass capillary tubes (Charles Supper and Co.) within an argon glovebox and then sealed. At the Argonne APS Synchrotron beamline 12-ID-B, SAXS specctra were obtained. This system was operated by the Chemical and Materials Science group at Argonne National Laboratory. Beam parameters were as follows: X-ray beam wavelength = 0.9322 Å (energy of 13.3 keV); exposure time = 0.1 s.
(7) Electrochemical Stability Measurements
SIPEs were gelled with solvent, then sandwiched between a platinum reference/counter electrode and stainless steel working electrode and crimped within a 2032 type coin cell (MTI Corp). Linear scan voltammetry was used to scan up from open circuit potential until reaching a significant increase in current, the potential at which was then deemed the oxidative stability. The same was done scanning negative from the open circuit to determine the reductive stability. The stability of the pure solvents (absorbed into a glass fiber separator, GE Healthcare Whatman) were examined in the same way. These results are presented in Appendix E.

Supplementary Materials

The following are available online at https://www.mdpi.com/2313-0105/6/1/11/s1, Table S1 PTHF based SIPE compositions. Table S2. PEG based SIPE compositions. Table S3. Dry Ca exchanged polymers: Raw conductivity data. Table S4, Dry Na exchanged polymers Raw conductivity data. Table S5, Dry K exchanged polymers Raw conductivity data. Table S6, DEG Ca exchanged polymers Raw conductivity data. Table S7, DEG Na exchanged polymers Raw conductivity data. Table S8, DEG K exchanged polymers Raw conductivity data. Table S9, TEG Ca exchanged polymers Raw conductivity data. Table S10, TEG Na exchanged polymers Raw conductivity data. Table S11, TEG K exchanged polymers Raw conductivity data. Table S12, ECPC Ca exchanged polymers Raw conductivity data. Table S13, ECPC Na exchanged polymers Raw conductivity data. Table S14, ECPC K exchanged polymers Raw conductivity data. Table S15, Dry SAXS Data, background subtracted raw. Table S16, DEG SAXS Data, background subtracted raw. Table S17, TEG SAXS Data, background subtracted. Table S18, ECPC SAXS Data, background subtracted raw.

Author Contributions

Conceptualization, J.L.S.; methodology, H.O.F. and C.C.; software, H.O.F.; validation, H.O.F. and J.L.S.; formal analysis, H.O.F. and C.C.; investigation, H.O.F. and C.C.; resources, J.L.S.; data curation, H.O.F.; writing—Original draft preparation: H.O.F.; writing—Review and editing: H.O.F. and J.L.S.; visualization, H.O.F. and J.L.S.; supervision, J.L.S.; project administration, J.L.S.; funding acquisition, J.L.S. All authors have read and agreed to the published version of the manuscript.

Funding

This research was funded by the National Science Foundation (USA) through grant number CBET-1706370. H.O.F. gratefully acknowledges the Society Of Schmitt Fellows and the Notre Dame CEST Predoctoral Fellowship for additional financial support.

Acknowledgments

This research used resources of the Advanced Photon Source, a U.S. Department of Energy (DOE) Office of Science User Facility operated for the DOE Office of Science by Argonne National Laboratory under Contract No. DE-AC02-06CH11357. We thank Xiaobing Zuo from Argonne National Lab for assistance in collecting SAXS spectra and Jon Loftus and the Notre Dame Center for Environmental Science and Technology for ICP-OES instrumentation.

Conflicts of Interest

The authors declare no conflict of interest. The funders had no role in the design of the study; in the collection, analyses, or interpretation of data; in the writing of the manuscript; or in the decision to publish the results.

Appendix A. All SIPE Conductivity as a Function of Cation

Figure A1. (reproduced from main text) Conductivity as a function of cation for PEGDMA1000_low_SSM (left) and PTHFDA1000_low_STFSI (right) SIPEs swelled with DEG. Temperatures ranged from −20 °C to 115 °C.
Batteries 06 00011 g0a1
Figure A2. Conductivity as a function of cation for PEGDMA1000_med_SSM (left) and PTHFDA1000_med_STFSI (right) SIPEs swelled with DEG. Temperatures ranged from −20 °C to 115 °C.
Batteries 06 00011 g0a2
Figure A3. Conductivity as a function of cation for PEGDMA1000_high_SSM (left) and PTHFDA1000_high_STFSI (right) SIPEs swelled with DEG. Temperatures ranged from −20 °C to 115 °C.
Batteries 06 00011 g0a3
Figure A4. Conductivity as a function of cation for PEGDMA1000_low_SSM (left) and PTHFDA1000_low_STFSI (right) SIPEs swelled with TEG. Temperatures ranged from −20 °C to 115 °C.
Batteries 06 00011 g0a4
Figure A5. Conductivity as a function of cation for PEGDMA1000_med_SSM (left) and PTHFDA1000_med_STFSI (right) SIPEs swelled with TEG. Temperatures ranged from −20 °C to 115 °C.
Batteries 06 00011 g0a5
Figure A6. Conductivity as a function of cation for PEGDMA1000_high_SSM (left) and PTHFDA1000_high_STFSI (right) SIPEs swelled with TEG. Temperatures ranged from −20 °C to 115 °C.
Batteries 06 00011 g0a6
Figure A7. Conductivity as a function of cation for PEGDMA1000_low_SSM (left) and PTHFDA1000_low_STFSI (right) SIPEs swelled with ECPC. Temperatures ranged from −20 °C to 115 °C.
Batteries 06 00011 g0a7
Figure A8. Conductivity as a function of cation for PEGDMA1000_med_SSM (left) and PTHFDA1000_med_STFSI (right) SIPEs swelled with ECPC. Temperatures ranged from −20 °C to 115 °C.
Batteries 06 00011 g0a8
Figure A9. Conductivity as a function of cation for PEGDMA1000_high_SSM (left) and PTHFDA1000_high_STFSI (right) SIPEs swelled with ECPC. Temperatures ranged from −20 °C to 115 °C.
Batteries 06 00011 g0a9
Figure A10. Conductivity as a function of cation for PEGDMA1000_low_SSM (left) and PTHFDA1000_low_STFSI (right) SIPEs dry. Temperatures ranged from −20 °C to 115 °C. Note that there may be a non-negligible fraction of electronic conductivity in conditions where conductivity of less than 10−9 S/cm is reported.
Batteries 06 00011 g0a10
Figure A11. Conductivity as a function of cation for PEGDMA1000_med_SSM (left) and PTHFDA1000_med_STFSI (right) SIPEs dry. Temperatures ranged from −20 °C to 115 °C. Note that there may be a non-negligible fraction of electronic conductivity in conditions where conductivity of less than 10−9 S/cm is reported.
Batteries 06 00011 g0a11
Figure A12. Conductivity as a function of cation for PEGDMA1000_high_SSM (left) and PTHFDA1000_high_STFSI (right) SIPEs dry. Temperatures ranged from −20 °C to 115 °C. Note that there may be a non-negligible fraction of electronic conductivity in conditions where conductivity of less than 10−9 S/cm is reported.
Batteries 06 00011 g0a12

Appendix B. All SIPE Conductivity as a Function of Charge Density

Figure A13. (Reproduced from main text) Conductivity as a function of charge density for PEGDMA1000_SSM (left) and PTHFDA_STFSI1000 (right) SIPEs swelled with DEG. Temperatures ranged from −20 °C to 115 °C. Note that there may be a non-negligible fraction of electronic conductivity in conditions where conductivity of less than 10−9 S/cm is reported.
Batteries 06 00011 g0a13
Figure A14. Conductivity as a function of charge density for PEGDMA1000_SSNa (left) and PTHFDA1000_STFSINa (right) SIPEs swelled with DEG. Temperatures ranged from −20 °C to 115 °C.
Batteries 06 00011 g0a14
Figure A15. Conductivity as a function of charge density for PEGDMA1000_SSK (left) and PTHFDA1000_STFSIK (right) SIPEs swelled with TEG. Temperatures ranged from −20 °C to 115 °C. Note that there may be a non-negligible fraction of electronic conductivity in conditions where conductivity of less than 10−9 S/cm is reported.
Batteries 06 00011 g0a15
Figure A16. Conductivity as a function of charge density for PEGDMA1000_SSNa (left) and PTHFDA1000_STFSINa (right) SIPEs swelled with TEG. Temperatures ranged from −20 °C to 115 °C.
Batteries 06 00011 g0a16
Figure A17. Conductivity as a function of charge density for PEGDMA1000_SSCa (left) and PTHFDA1000_STFSICa (right) SIPEs swelled with TEG. Temperatures ranged from −20 °C to 115 °C. Note that there may be a non-negligible fraction of electronic conductivity in conditions where conductivity of less than 10−9 S/cm is reported.
Batteries 06 00011 g0a17
Figure A18. Conductivity as a function of charge density for PEGDMA1000_SSK (left) and PTHFDA1000_STFSIK (right) SIPEs swelled with ECPC. Temperatures ranged from −20 °C to 115 °C.
Batteries 06 00011 g0a18
Figure A19. Conductivity as a function of charge density for PEGDMA1000_SSNa (left) and PTHFDA1000_STFSINa (right) SIPEs swelled with ECPC. Temperatures ranged from −20 °C to 115 °C.
Batteries 06 00011 g0a19
Figure A20. Conductivity as a function of charge density for PEGDMA1000_SSCa (left) and PTHFDA1000_STFSICa (right) SIPEs swelled with ECPC. Temperatures ranged from −20 °C to 115 °C.
Batteries 06 00011 g0a20
Figure A21. Conductivity as a function of charge density for PEGDMA1000_SSK (left) and PTHFDA1000_STFSIK (right) SIPEs dry. Temperatures ranged from −20 °C to 115 °C. Note that there may be a non-negligible fraction of electronic conductivity in conditions where conductivity of less than 10−9 S/cm is reported.
Batteries 06 00011 g0a21
Figure A22. Conductivity as a function of charge density for PEGDMA1000_SSNa (left) and PTHFDA1000_STFSINa (right) SIPEs dry. Temperatures ranged from −20 °C to 115 °C. Note that there may be a non-negligible fraction of electronic conductivity in conditions where conductivity of less than 10−9 S/cm is reported.
Batteries 06 00011 g0a22
Figure A23. Conductivity as a function of charge density for PEGDMA1000_SSCa (left) and PTHFDA1000_STFSICa (right) SIPEs dry. Temperatures ranged from −20 °C to 115 °C. Note that there may be a non-negligible fraction of electronic conductivity in conditions where conductivity of less than 10−9 S/cm is reported.
Batteries 06 00011 g0a23

Appendix C. All SIPE Conductivity as a Function of Swelling State

Figure A24. (reproduced from main text) Conductivity as a function of swelling state for PEGDMA1000_low_SSM (left) and PTHFDA1000_low_STFSIM (right) SIPEs. Temperatures ranged from −20 °C to 115 °C. Note that there may be a non-negligible fraction of electronic conductivity in conditions where conductivity of less than 10−9 S/cm is reported.
Batteries 06 00011 g0a24
Figure A25. Conductivity as a function of solvent for PEGDMA1000_low_SSNa (left) and PTHFDA1000_low_STFSINa (right) SIPEs. Temperatures ranged from −20 °C to 115 °C. Note that there may be a non-negligible fraction of electronic conductivity in conditions where conductivity of less than 10−9 S/cm is reported.
Batteries 06 00011 g0a25
Figure A26. Conductivity as a function of solvent for PEGDMA1000_med_SSK (left) and PTHFDA1000_med_STFSIK (right) SIPEs. Temperatures ranged from −20 °C to 115 °C. Note that there may be a non-negligible fraction of electronic conductivity in conditions where conductivity of less than 10−9 S/cm is reported.
Batteries 06 00011 g0a26
Figure A27. Conductivity as a function of solvent for PEGDMA1000_med_SSNa (left) and PTHFDA1000_med_STFSINa (right) SIPEs. Temperatures ranged from −20 °C to 115 °C. Note that there may be a non-negligible fraction of electronic conductivity in conditions where conductivity of less than 10−9 S/cm is reported.
Batteries 06 00011 g0a27
Figure A28. Conductivity as a function of solvent for PEGDMA1000_med_SSCa (left) and PTHFDA1000_med_STFSICa (right) SIPEs. Temperatures ranged from −20 °C to 115 °C. Note that there may be a non-negligible fraction of electronic conductivity in conditions where conductivity of less than 10−9 S/cm is reported.
Batteries 06 00011 g0a28
Figure A29. Conductivity as a function of solvent for PEGDMA1000_high_SSK (left) and PTHFDA1000_high_STFSIK (right) SIPEs. Temperatures ranged from −20 °C to 115 °C. Note that there may be a non-negligible fraction of electronic conductivity in conditions where conductivity of less than 10−9 S/cm is reported.
Batteries 06 00011 g0a29
Figure A30. Conductivity as a function of solvent for PEGDMA1000_high_SSNa (left) and PTHFDA1000_high_STFSINa (right) SIPEs. Temperatures ranged from −20 °C to 115 °C. Note that there may be a non-negligible fraction of electronic conductivity in conditions where conductivity of less than 10−9 S/cm is reported.
Batteries 06 00011 g0a30
Figure A31. Conductivity as a function of solvent for PEGDMA1000_high_SSCa (left) and PTHFDA1000_high_STFSICa (right) SIPEs. Temperatures ranged from −20 °C to 115 °C. Note that there may be a non-negligible fraction of electronic conductivity in conditions where conductivity of less than 10−9 S/cm is reported.
Batteries 06 00011 g0a31

Appendix D. Volume Change with Swelling for all Other SIPEs and Select Molar Conductivity

Note, this volume change is calculated based on the change in thickness alone from swelling in a given solvent, then assuming isotropic expansion. RSD is calculated error associated from measuring the a dry sample thickness six times, a swelled sample thickness six times, assuming the error in the thickness dimension would be the same as the error in the other dimensions, then propagating all said errors. As the error in measurement, this RSD calculated from a single composition is assumed the error for all compositions, 5.7%.
Table A1. Volume change % for SIPEs in a given solvent. Calculated using swelled thickness and assuming isotropic expansion.
SampleSolventVolume Change %Estimated Cation Concentration (mol Charge/cm3 Polymer)
PEGDMA1000_low_SSKDEG5.8 ± 0.30.00093
TEG34.9 ± 2.00.00073
EC:PC90.7 ± 5.20.00052
PEGDMA1000_med_SSKDEG15.4 ± 0.90.00127
TEG28.1 ± 1.60.00114
EC:PC92.0 ± 5.20.00076
PEGDMA1000_high_SSKDEG12.2 ± 0.70.00173
TEG20.5 ± 1.20.00162
EC:PC93.4 ± 5.30.00101
PEGDMA1000_low_SSNaDEG37.9 ± 2.20.00071
TEG8.3 ± 0.50.00091
EC:PC109.7 ± 6.30.00047
PEGDMA1000_high_SSNaDEG4.6 ± 0.20.00186
TEG6.4 ± 0.40.00183
EC:PC99.6 ± 5.70.00098
PEGDMA1000_low_SSCaDEG0.0 0.00049
TEG0.0 0.00049
EC:PC16.1 ± 0.90.00042
PEGDMA1000_med_SSCaDEG0.0 0.00073
TEG0.0 0.00073
EC:PC61.0 ± 3.50.00045
PEGDMA1000_high_SSCaDEG0.0 0.00097
TEG8.3 ± 0.50.00090
EC:PC20.1 ± 1.10.00081
PTHFDA1000_low_STFSIKDEG99.1 ± 5.60.00042
TEG61.8 ± 3.50.00052
EC:PC38.2 ± 2.20.00061
PTHFDA1000_med_STFSIKDEG79.4 ± 4.50.00069
TEG50.5 ± 2.90.00082
EC:PC27.0 ± 1.50.00097
PTHFDA1000_high_STFSIKDEG86.5 ± 4.90.00084
TEG86.5 ± 4.90.00084
EC:PC111.7 ± 6.40.00074
PTHFDA1000_low_STFSINaDEG133.1 ± 7.60.00036
TEG99.1 ± 5.60.00042
EC:PC65.1 ± 3.70.00051
PTHFDA1000_high_STFSINaDEG109.7 ± 6.30.00075
TEG49.7 ± 2.80.00105
EC:PC165.1 ± 9.40.00059
PTHFDA1000_low_STFSICaDEG145.5 ± 8.30.00017
TEG141.1 ± 8.00.00017
EC:PC30.6 ± 1.70.00032
PTHFDA1000_med_STFSICaDEG107.8 ± 6.10.00030
TEG107.8 ± 6.10.00030
EC:PC48.8 ± 2.80.00042
PTHFDA1000_high_STFSICaDEG164.5 ± 9.40.00030
TEG117.7 ± 6.70.00036
EC:PC108.7 ± 6.20.00038
Figure A32. Molar Conductivity as a function of solvent for PEGDMA1000_med_SSM (left) and PTHFDA1000_med_STFSIM (right) SIPEs. Temperatures ranged from −20 °C to 115 °C. Compare to Figure A27.
Batteries 06 00011 g0a32

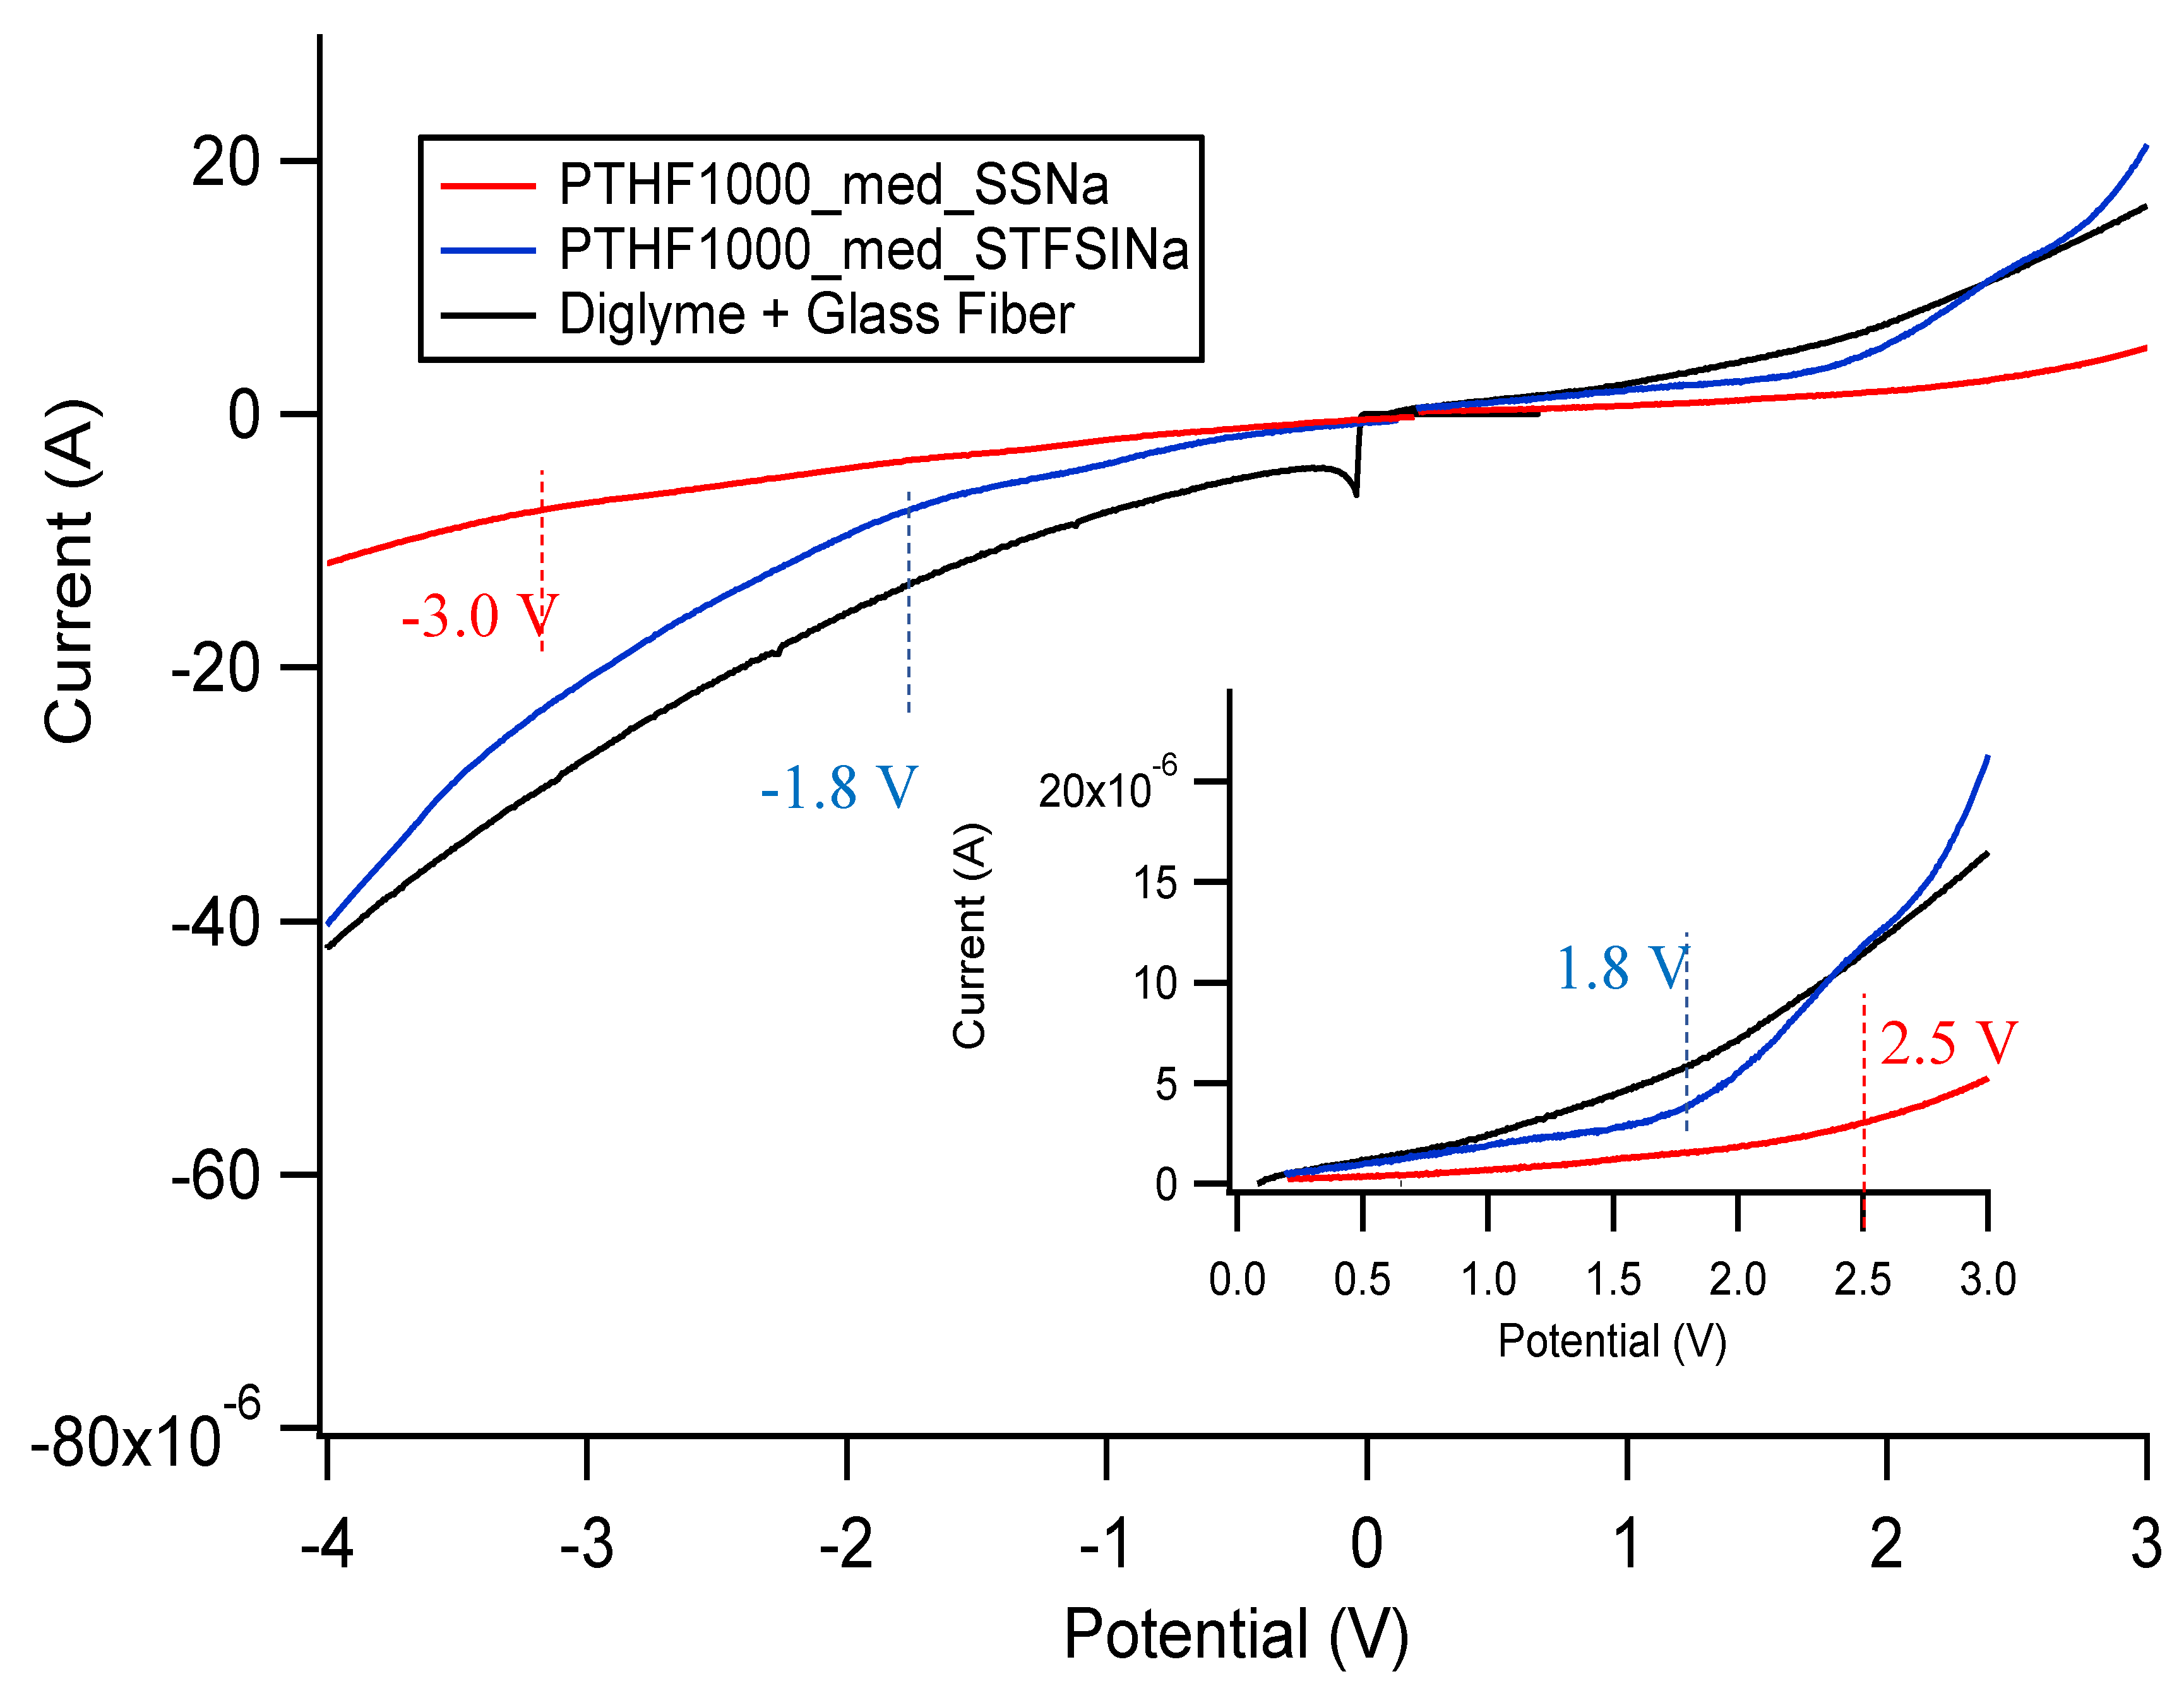
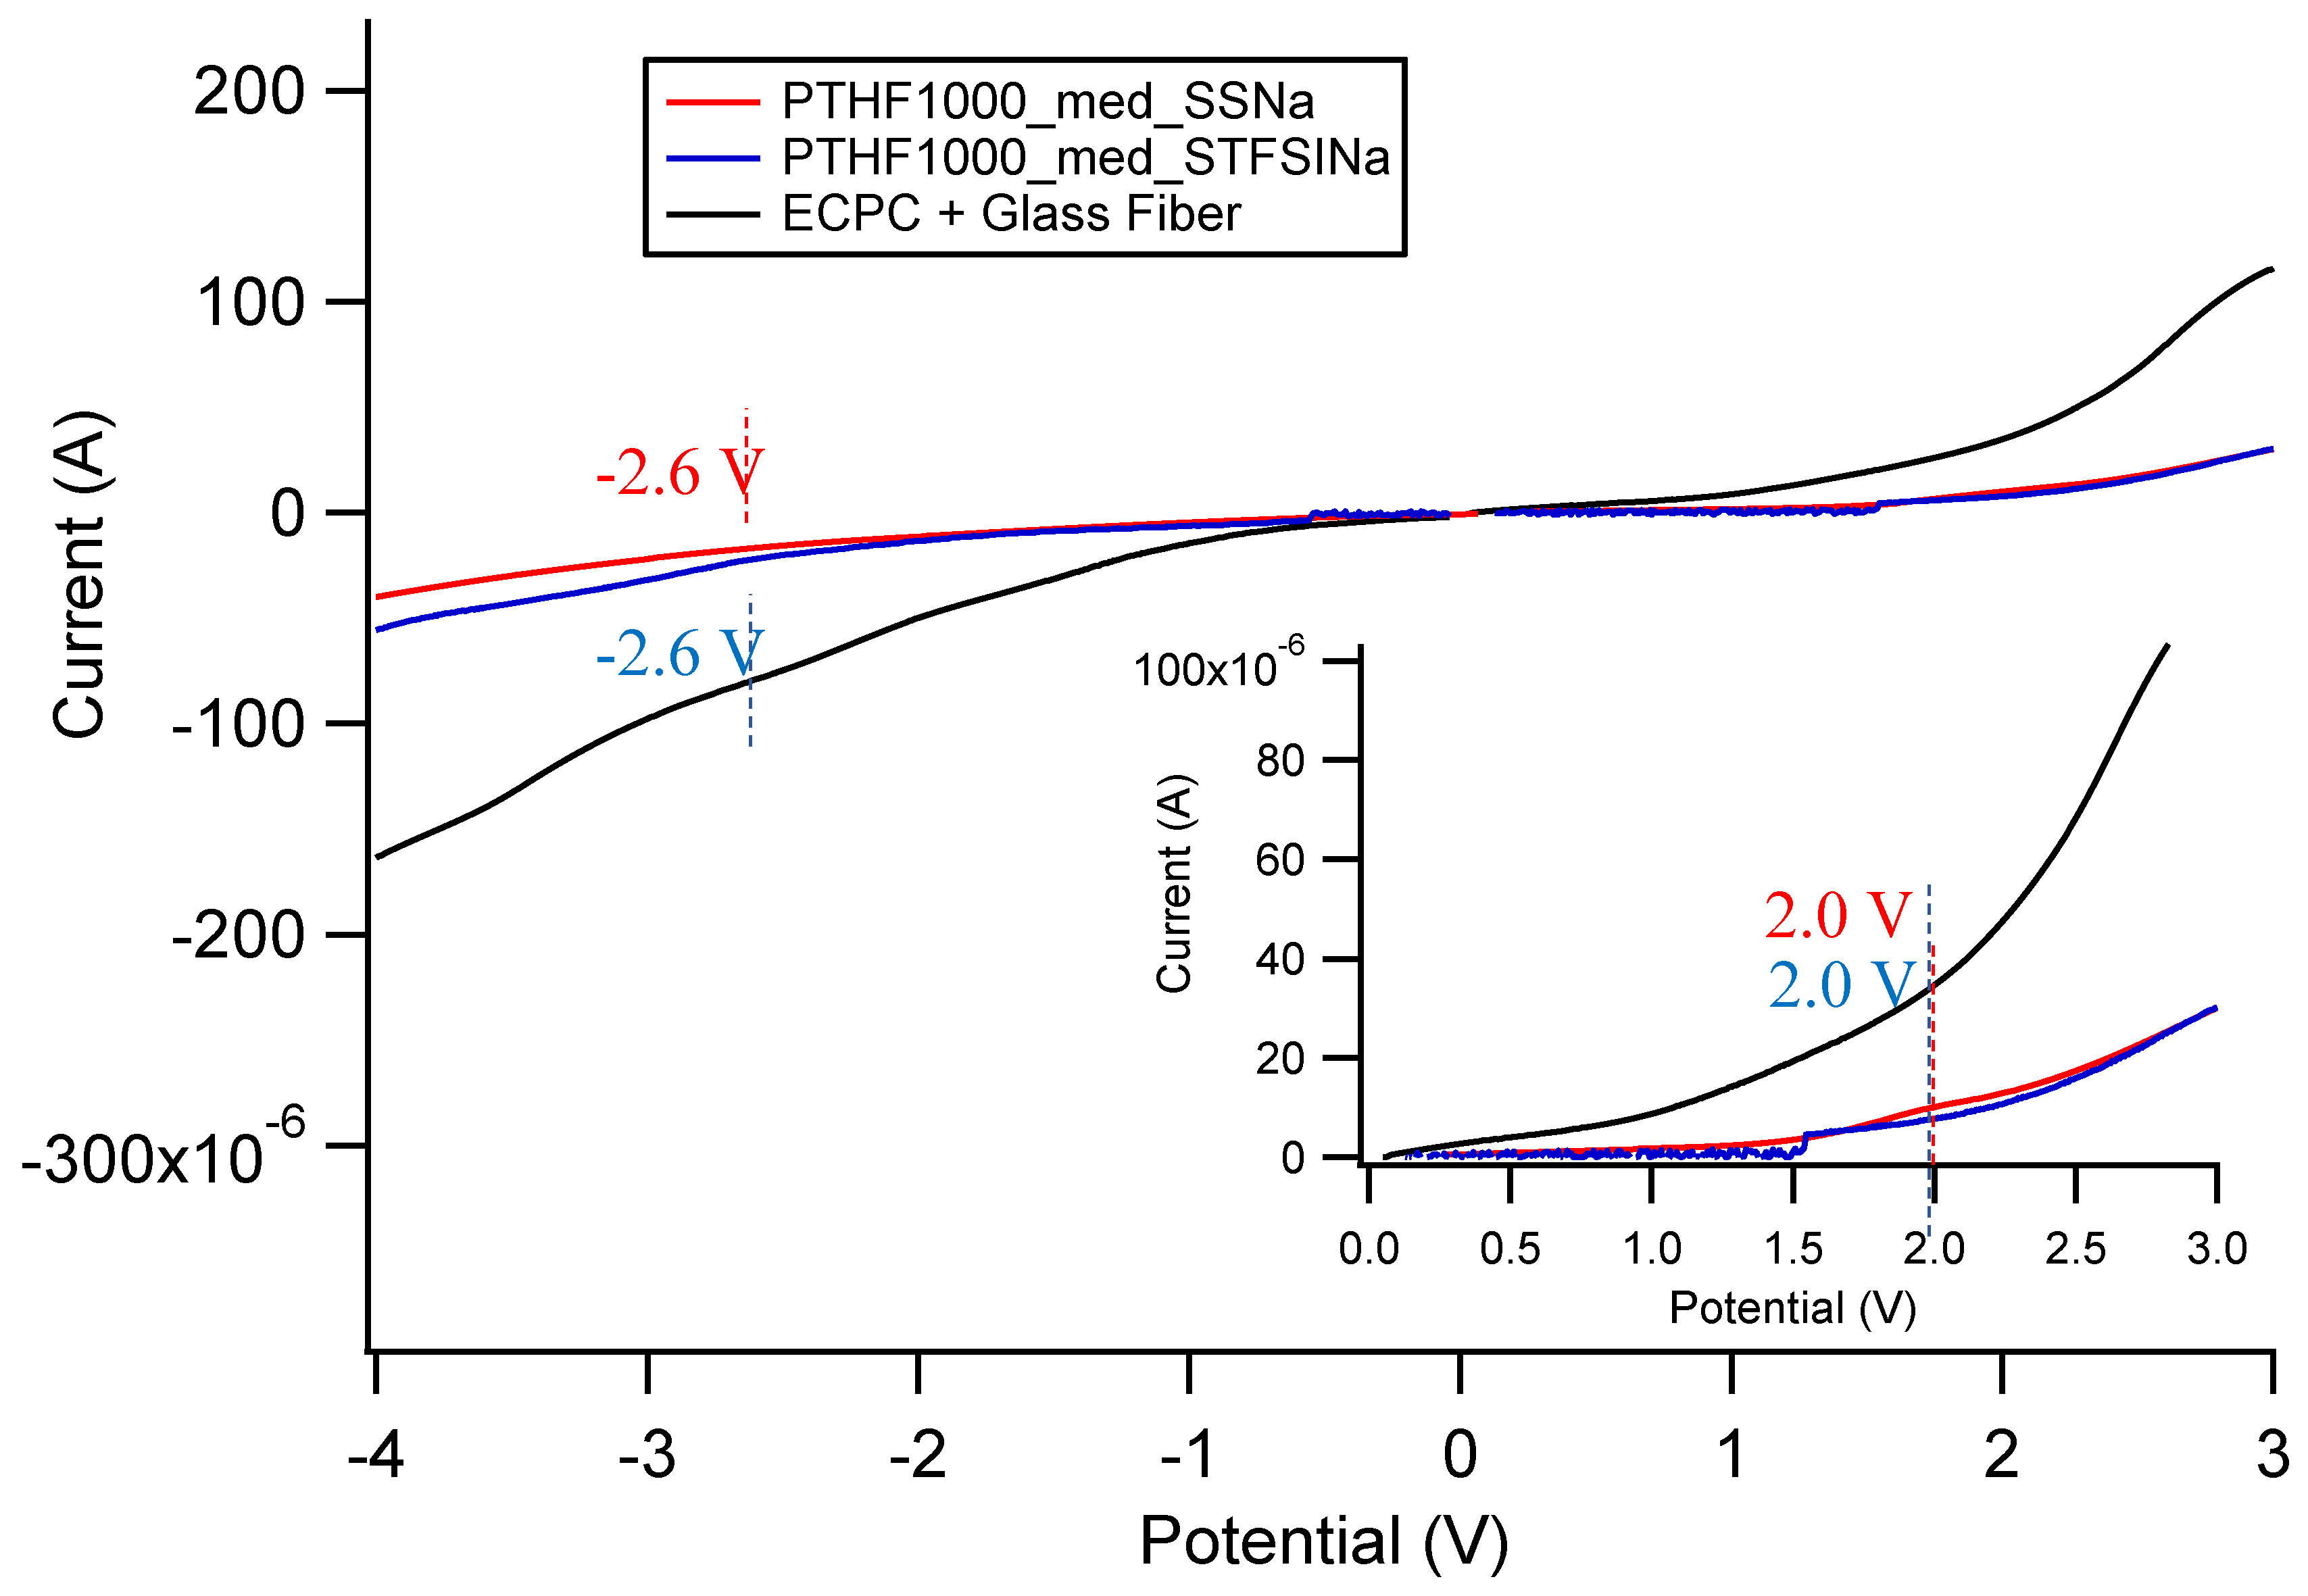
Appendix E. Electrochemical Stability Window of SIPEs
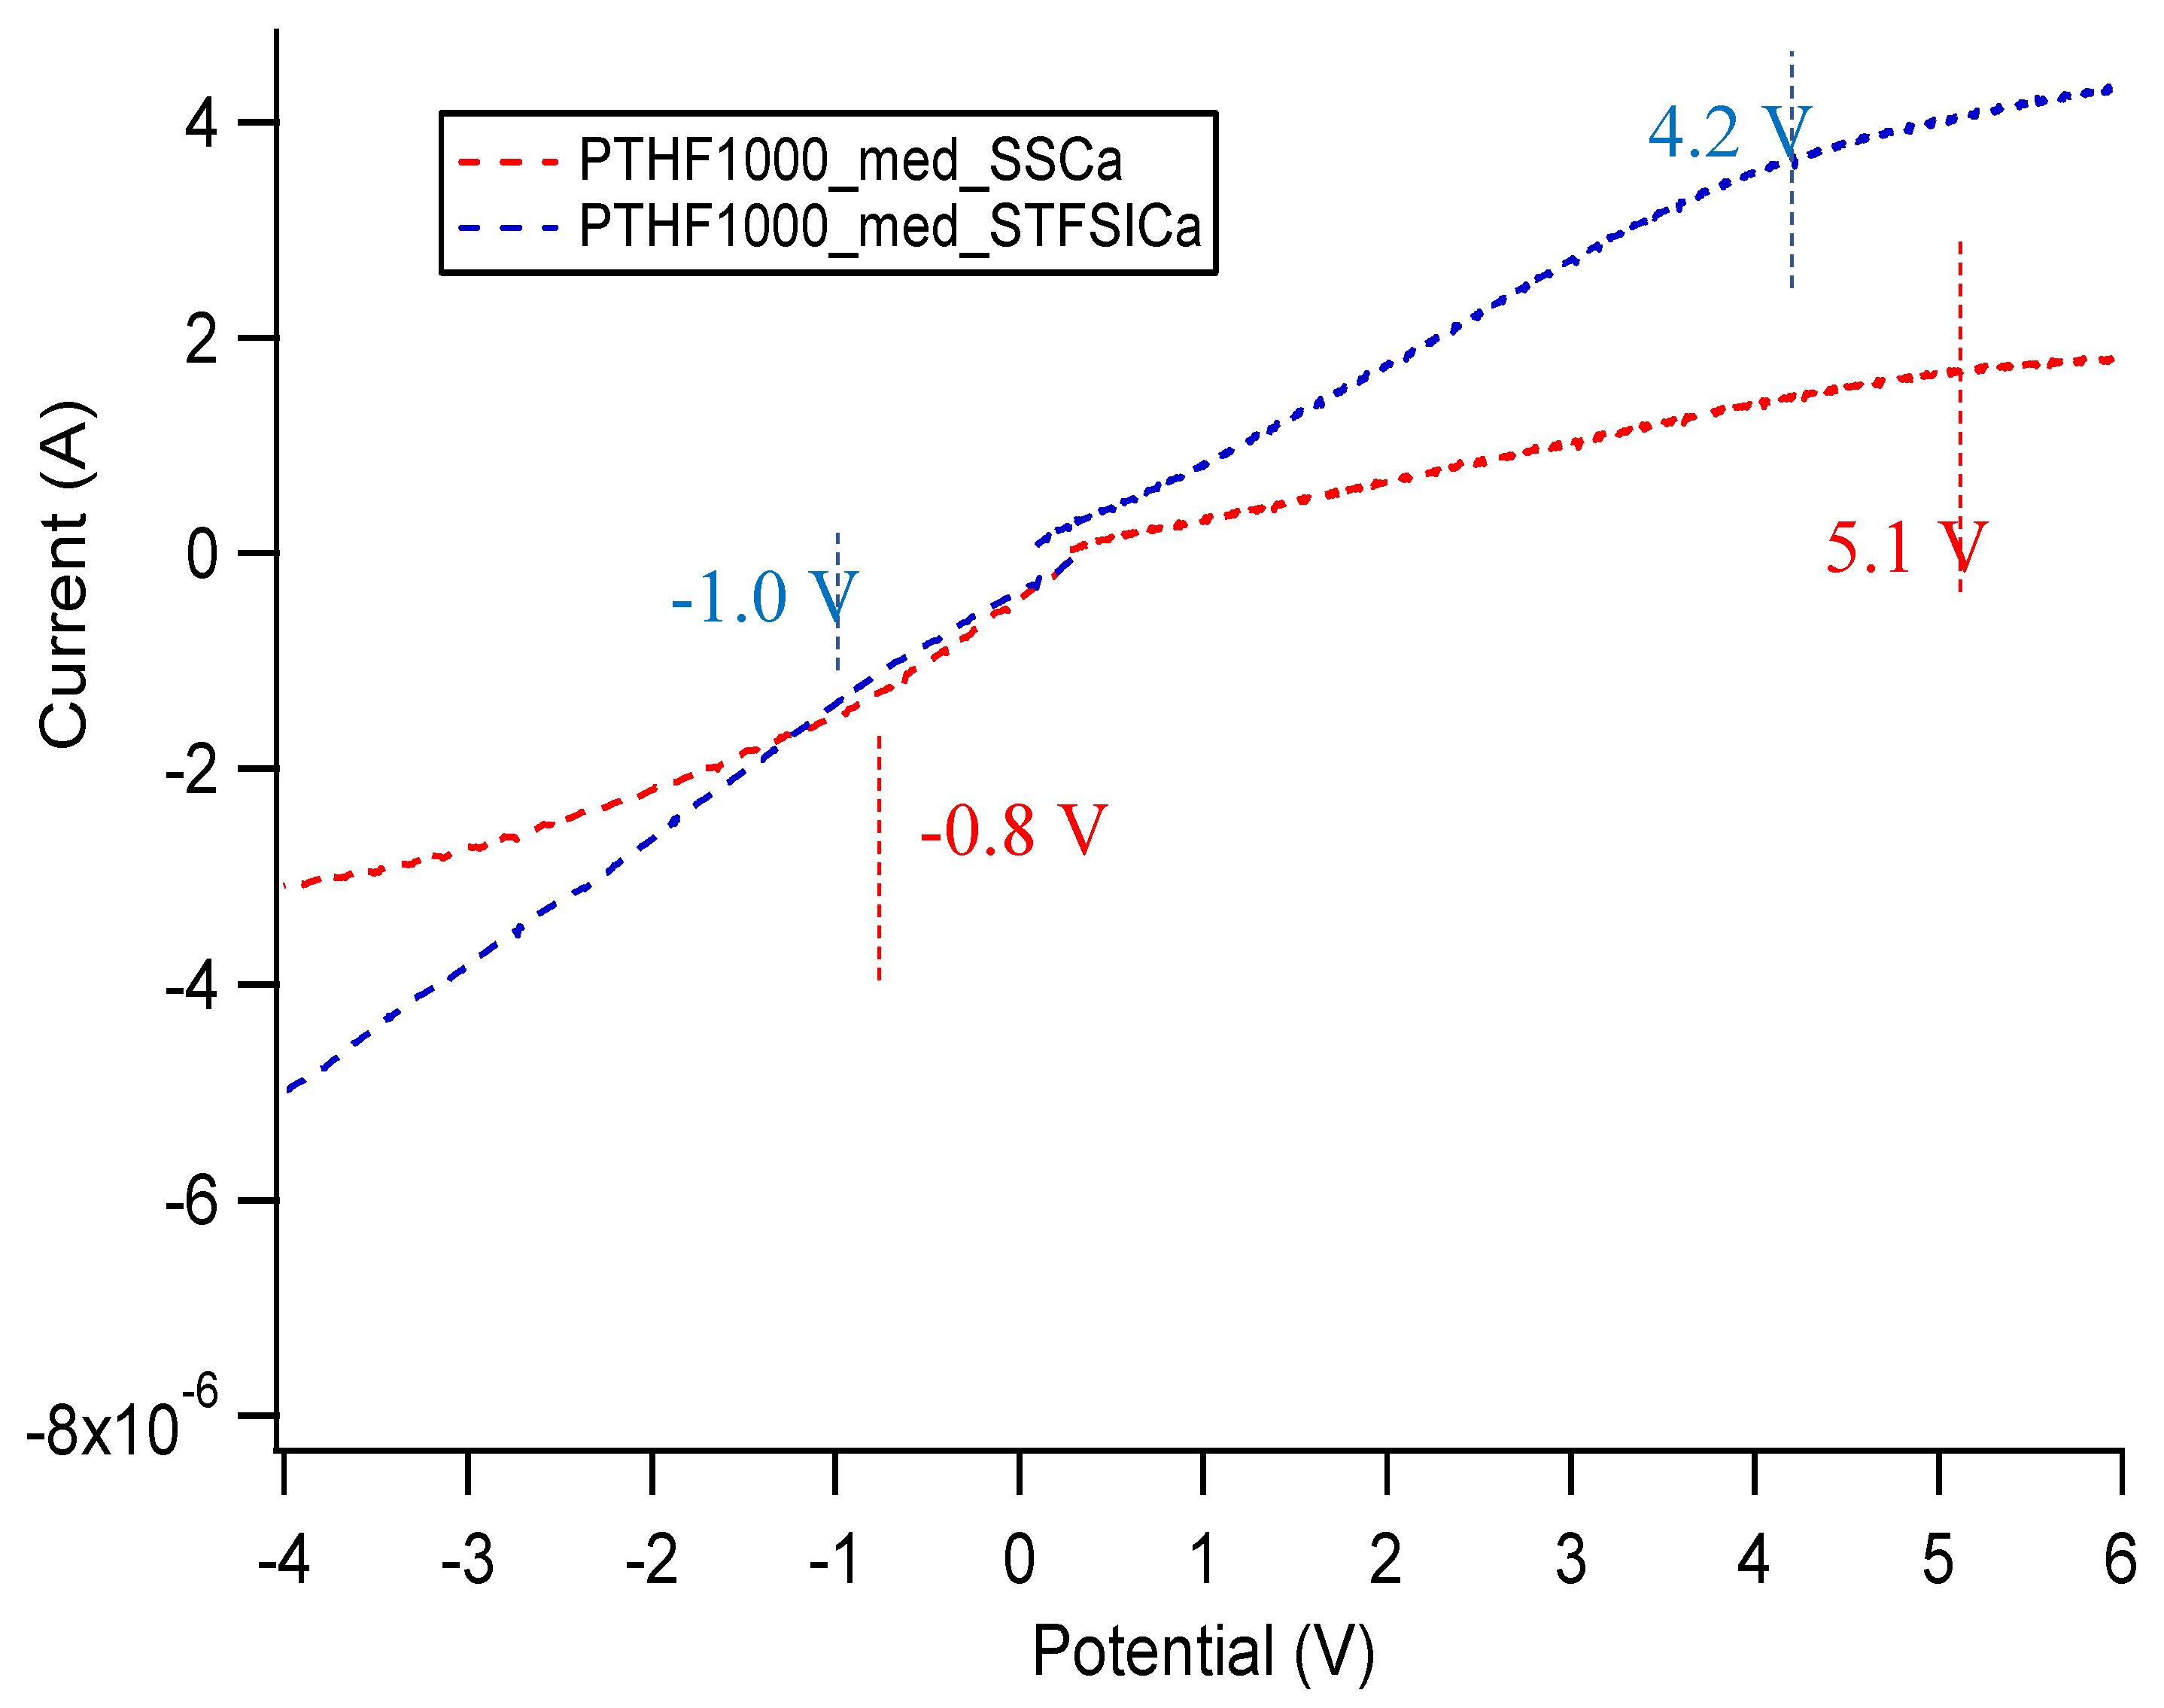
Figure A33 shows linear scan voltammetry data for Na exchanged SS and STFSI PTHF polymers swelled in diglyme, as well as the same measurement on pure diglyme, in a stainless steel/platinum two electrode configuration. Figure A34 shows the same as Figure A33 but for Ca exchanged SIPEs. Figure A35 shows the same as Figure A33 but for polymers swelled in EC/PC. Table A2 shows the total electrochemical stability window, as determined by where the current as a function of potential no longer follows an Ohmic response, i.e., where we observe a change in slope in the current vs. potential.
Figure A33. Oxidative and reductive stability of diglyme and diglyme gelled Na exchanged SIPEs. Configuration is stainless steel/Pt.
Batteries 06 00011 g0a33
Figure A34. Oxidative and reductive stability of diglyme and diglyme gelled Ca exchanged SIPEs. Configuration is stainless steel/Pt.
Batteries 06 00011 g0a34
Figure A35. Oxidative and reductive stability of EC/PC and EC/PC gelled Na exchanged SIPEs. Configuration is stainless steel/Pt.
Batteries 06 00011 g0a35
Table A2. Electrochemical stability window for tested SIPEs. Configuration is stainless steel/Pt.
SampleApproximate Stability Window (V)
PTHF1000_med_SSCa DEG5.2
PTHF1000_med_STFSICa DEG5.9
PTHF1000_med_SSNa DEG5.5
PTHF1000_med_STFSINa DEG3.6
PTHF1000_med_SSNa EC/PC4.6
PTHF1000_med_STFSINa EC/PC4.6
In general, there is less current passed in the gelled SIPE samples than the pure solvent, even though the electrode area is identical in all cases. The solvent seems to be the limiting factor in terms of redox stability. There does not seem to be a clear pattern in stability window in terms of cation, anion, or solvent; however, the current passed through the Ca exchanged films is about two orders of magnitude lower than all other samples. All samples have acceptable electrochemical stability, but the stability windows here do not take into account any chemical instability that might arise from using these SIPEs with highly reactive Na, Ca, or K metal. However, based on these measured voltage windows, these materials likely could be used in Na-ion, Ca-ion, or K-ion based batteries without further engineering.

References

  1. Haynes, W.M. Abundance Of Elements In The Earth’s Crust And In The Sea. In CRC Handbook of Chemistry and Physics, 97th ed.; CRC Press: Boca Raton, FL, USA, 2016; pp. 14–17. [Google Scholar]
  2. Duxbury, A.; Mackenzie, F.; Byrne, R. Seawater; Encyclopædia Britannica, Inc.: Chicago, IL, USA, 2017. [Google Scholar]
  3. Diederichsen, K.M.; McShane, E.J.; McCloskey, B.D. Promising Routes to a High Li+ Transference Number Electrolyte for Lithium Ion Batteries. ACS Energy Lett. 2017, 2, 2563–2575. [Google Scholar] [CrossRef]
  4. Doyle, M.; Fuller, T.F.; Newman, J. The Importance of the Lithium Ion Transference Number in Lithium/Polymer Cells. Electrochim. Acta 1994, 39, 2073–2081. [Google Scholar] [CrossRef]
  5. Every, H.; Forsyth, M.; MacFarlane, D.R. Plasticized Single Conductung Polyelectrolytes Based on Poly(AMPS). Ionics 1996, 2, 53–62. [Google Scholar] [CrossRef]
  6. Doyle, M.; Lewittes, M.E.; Roelofs, M.G.; Perusich, S.A.; Lowrey, R.E. Relationship between Conductivity of Perfluorinated Ionomeric Membranes and Nonaqueous Solvent Properties. J. Membr. Sci. 2001, 184, 257–273. [Google Scholar] [CrossRef]
  7. Kreuer, K.D.; Wohlfarth, A.; De Araujo, C.C.; Fuchs, A.; Maier, J. Single Alkaline-Ion (Li+, Na+) Conductors by Ion Exchange of Proton-Conducting Ionomers and Polyelectrolytes. Chem. Phys. Chem. 2011, 12, 2558–2560. [Google Scholar] [CrossRef]
  8. Pourcelly, G.; Oikonomou, A.; Gavach, C.; Hurwitz, H.D. Influence of the Water Content on the Kinetics of Counter-Ion Transport in Perfluorosulphonic Membranes. J. Electroanal. Chem. 1990, 287, 43–59. [Google Scholar] [CrossRef]
  9. Cao, C.; Wang, H.; Liu, W.; Liao, X.; Li, L. Nafion Membranes as Electrolyte and Separator for Sodium-Ion Battery. Int. J. Hydrog. Energy 2014, 39, 16110–16115. [Google Scholar] [CrossRef]
  10. Sanginov, E.A.; Kayumov, R.R.; Shmygleva, L.V.; Lesnichaya, V.A.; Karelin, A.I.; Dobrovolsky, Y.A. Study of the Transport of Alkali Metal Ions in a Nonaqueous Polymer Electrolyte Based on Nafion. Solid State Ion. 2017, 300, 26–31. [Google Scholar] [CrossRef]
  11. Cao, C.; Liu, W.; Tan, L.; Liao, X.; Li, L. Sodium-Ion Batteries Using Ion Exchange Membranes as Electrolytes and Separators. Chem. Commun. 2013, 49, 11740–11742. [Google Scholar] [CrossRef]
  12. Wang, P.; Zhang, H.; Chai, J.; Liu, T.; Hu, R.; Zhang, Z.; Li, G.; Cui, G. A Novel Single-Ion Conducting Gel Polymer Electrolyte Based on Polymeric Sodium Tartaric Acid Borate for Elevated-Temperature Sodium Metal Batteries. Solid State Ion. 2019, 337, 140–146. [Google Scholar] [CrossRef]
  13. Pan, Q.; Li, Z.; Zhang, W.; Zeng, D.; Sun, Y.; Cheng, H. Single Ion Conducting Sodium Ion Batteries Enabled by a Sodium Ion Exchanged Poly(Bis(4-Carbonyl Benzene Sulfonyl)Imide-Co-2,5-Diamino Benzesulfonic Acid) Polymer Electrolyte. Solid State Ion. 2017, 300, 60–66. [Google Scholar] [CrossRef]
  14. Villaluenga, I.; Bogle, X.; Greenbaum, S.; Gil De Muro, I.; Rojo, T.; Armand, M. Cation Only Conduction in New Polymer-SiO2 Nanohybrids: Na + Electrolytes. J. Mater. Chem. A 2013, 1, 8348–8352. [Google Scholar] [CrossRef]
  15. Dou, S.; Zhang, S.; Klein, R.J.; Runt, J.; Colby, R.H. Synthesis and Characterization of Poly(Ethylene Glycol)-Based Single-Ion Conductors. Chem. Mater. 2006, 18, 4288–4295. [Google Scholar] [CrossRef]
  16. Benrabah, D.; Sylla, S.; Alloin, F.; Sanchez, J.Y.; Armand, M. Perfluorosulfonate-Polyether Based Single Ion Conductors. Electrochim. Acta 1995, 40, 2259–2264. [Google Scholar] [CrossRef]
  17. Yamazaki, K.; Tomoo, S. Single-Ion Conduction in UV-Crosslinked Films of Poly(Urethane-Co- (Alkali-Metal Methacrylates)). Int. J. Syst. Bacteriol. 1995, 40, 565–571. [Google Scholar]
  18. Elmore, C.T.; Seidler, M.E.; Ford, H.O.; Merrill, L.C.; Upadhyay, S.P.; Schneider, W.F.; Schaefer, J.L. Ion Transport in Solvent-Free, Crosslinked, Single-Ion Conducting Polymer Electrolytes for Post-Lithium Ion Batteries. Batteries 2018, 4, 28. [Google Scholar] [CrossRef] [Green Version]
  19. Wang, S.W.; Colby, R.H. Linear Viscoelasticity and Cation Conduction in Polyurethane Sulfonate Ionomers with Ions in the Soft Segment-Single Phase Systems. Macromolecules 2018, 51, 2757–2766. [Google Scholar] [CrossRef]
  20. Sinha, K.; Maranas, J. Does Ion Aggregation Impact Polymer Dynamics and Conductivity in PEO-Based Single Ion Conductors? Macromolecules 2014, 47, 2718–2726. [Google Scholar] [CrossRef]
  21. Doan, K.E.; Ratner, M.A.; Shriver, D.F. Synthesis and Electrical Response of Single-Ion Conducting Network Polymers Based on Sodium Poly(Tetraalkoxyaluminates). Chem. Mater. 1991, 3, 418–423. [Google Scholar] [CrossRef]
  22. Tsuchida, E.; Kobayashi, N.; Ohno, H. Single-Ion Conduction in Poly[(Oligo(Oxyethylene) Methacrylate)-Co-(Alkali-Metal Methacrylates)]. Macromolecules 1988, 21, 96–100. [Google Scholar] [CrossRef]
  23. Kim, H.T.; Park, J.K. Effects of Cations on Ionic States of Poly(Oligo-Oxyethylene Methacrylate-Co-Alkali Metal Acrylamidocaproate) Single-Ion Conductor. Solid State Ion. 1997, 98, 237–244. [Google Scholar] [CrossRef]
  24. Fumkawa, T.; Yoneya, K.; Takahashi, Y.; Ito, K.; Ohno, H. Correlation between Ionic and Dipolar Motions in a Single-Ion Conducting Polymer P[MEO9-MAM]. Electrochim. Acta 2000, 45, 1443–1448. [Google Scholar]
  25. Wang, J.H.H.; Yang, C.H.C.; Masser, H.; Shiau, H.S.; O’Reilly, M.V.; Winey, K.I.; Runt, J.; Painter, P.C.; Colby, R.H. Ion States and Transport in Styrenesulfonate Methacrylic PEO9 Random Copolymer Ionomers. Macromolecules 2015, 48, 7273–7285. [Google Scholar] [CrossRef]
  26. Rank, C.; Yan, L.; Mecking, S.; Winey, K.I. Periodic Polyethylene Sulfonates from Polyesterification: Bulk and Nanoparticle Morphologies and Ionic Conductivities. Macromolecules 2019, 52, 8466–8475. [Google Scholar] [CrossRef]
  27. Yan, L.; Rank, C.; Mecking, S.; Winey, K.I. Gyroid and Other Ordered Morphologies in Single-Ion Conducting Polymers and Their Impact on Ion Conductivity. J. Am. Chem. Soc. 2019. [Google Scholar] [CrossRef]
  28. Li, J.; Zhu, H.; Wang, X.; Armand, M.; Macfarlane, D.R.; Forsyth, M. Synthesis of Sodium Poly[4-Styrenesulfonyl(Trifluoromethylsulfonyl)Imide]-Co-Ethylacrylate] Solid Polymer Electrolytes. Electrochim. Acta 2015, 175, 232–239. [Google Scholar] [CrossRef]
  29. Noor, S.A.M.; Sun, J.; Macfarlane, D.R.; Armand, M.; Gunzelmann, D.; Forsyth, M. Decoupled Ion Conduction in Poly(2-Acrylamido-2-Methyl-1-Propane-Sulfonic Acid) Homopolymers. J. Mater. Chem. A 2014, 2, 17934–17943. [Google Scholar] [CrossRef]
  30. Yue, X.; He, Q.; Lim, H.D.; Liu, P. Hierarchical Structural Designs of Ion Exchange Membranes for Flow Batteries. J. Mater. Chem. A 2019, 7, 5794–5802. [Google Scholar] [CrossRef]
  31. Guo, D.; Wang, J.; Lei, J. Synthesis and Characterization of an Acrylate-Copolymer-Based Antistatic Agent Composed of a Single-Ion Conductive Polymer Electrolyte. J. Appl. Polym. Sci. 2011, 119, 2674–2682. [Google Scholar] [CrossRef]
  32. Wang, Y.P.; Feng, H.Y.; Fu, Z.S.; Tsuchida, E.; Takeoka, S.; Ohta, T. Ion Dissociation and Conduction of Nafion/Modified Oligo(Oxyethylene) Composite Films. Polym. Adv. Technol. 1991, 2, 295–299. [Google Scholar] [CrossRef]
  33. Ren, X.; Lau, K.C.; Yu, M.; Bi, X.; Kreidler, E.; Curtiss, L.A.; Wu, Y. Understanding Side Reactions in K-O2 Batteries for Improved Cycle Life. ACS Appl. Mater. Interfaces 2014, 6, 19299–19307. [Google Scholar] [CrossRef] [PubMed]
  34. Genier, F.S.; Burdin, C.V.; Biria, S.; Hosein, I.D. A Novel Calcium-Ion Solid Polymer Electrolyte Based on Crosslinked Poly(Ethylene Glycol) Diacrylate. J. Power Sources 2019, 414, 302–307. [Google Scholar] [CrossRef]
  35. Wang, J.; Genier, F.S.; Li, H.; Biria, S.; Hosein, I.D. A Solid Polymer Electrolyte from Cross-Linked Polytetrahydrofuran for Calcium Ion Conduction. ACS Appl. Polym. Mater. 2019, 1, 1837–1844. [Google Scholar] [CrossRef]
  36. Bouchet, R.; Maria, S.; Meziane, R.; Aboulaich, A.; Lienafa, L.; Bonnet, J.P.; Phan, T.N.T.; Bertin, D.; Gigmes, D.; Devaux, D.; et al. Single-Ion BAB Triblock Copolymers as Highly Efficient Electrolytes for Lithium-Metal Batteries. Nat. Mater. 2013, 12, 452–457. [Google Scholar] [CrossRef]
  37. Ramanujapuram, A.; Gordon, D.; Magasinski, A.; Ward, B.; Nitta, N.; Huang, C.; Yushin, G. Degradation and Stabilization of Lithium Cobalt Oxide in Aqueous Electrolytes. Energy Environ. Sci. 2016, 9, 1841–1848. [Google Scholar] [CrossRef]
  38. Vaalma, C.; Buchholz, D.; Passerini, S. Non-Aqueous Potassium-Ion Batteries: A Review. Curr. Opin. Electrochem. 2018, 9, 41–48. [Google Scholar] [CrossRef]
  39. Arroyo-De Dompablo, M.E.; Ponrouch, A.; Johansson, P.; Palacín, M.R. Achievements, Challenges, and Prospects of Calcium Batteries. Chem. Rev. 2019. [Google Scholar] [CrossRef]
  40. Hwang, J.Y.; Myung, S.T.; Sun, Y.K. Recent Progress in Rechargeable Potassium Batteries. Adv. Funct. Mater. 2018, 28, 1802938. [Google Scholar] [CrossRef]
  41. Che, H.; Chen, S.; Xie, Y.; Wang, H.; Amine, K.; Liao, X.Z.; Ma, Z.F. Electrolyte Design Strategies and Research Progress for Room-Temperature Sodium-Ion Batteries. Energy Environ. Sci. 2017, 10, 1075–1101. [Google Scholar] [CrossRef]
  42. Bommier, C.; Ji, X. Electrolytes, SEI Formation, and Binders: A Review of Nonelectrode Factors for Sodium-Ion Battery Anodes. Small 2018, 14, 1703576. [Google Scholar] [CrossRef]
  43. Chen, L.; Fiore, M.; Wang, J.E.; Ruffo, R.; Kim, D.-K.; Longoni, G. Readiness Level of Sodium-Ion Battery Technology: A Materials Review. Adv. Sustain. Syst. 2018, 2, 1700153. [Google Scholar] [CrossRef]
  44. Merrill, L.C.; Ford, H.O.; Schaefer, J.L. Application of Single-Ion Conducting Gel Polymer Electrolytes in Magnesium Batteries. ACS Appl. Energy Mater. 2019, 2, 6355–6363. [Google Scholar] [CrossRef]
  45. Ford, H.O.; Merrill, L.C.; He, P.; Upadhyay, S.P.; Schaefer, J.L. Cross-Linked Ionomer Gel Separators for Polysulfide Shuttle Mitigation in Magnesium-Sulfur Batteries: Elucidation of Structure-Property Relationships. Macromolecules 2018, 51, 8629–8636. [Google Scholar] [CrossRef]
  46. Ford, H.O.; Park, B.; Jiang, J.; Seidler, M.E.; Schaefer, J.L. Enhanced Li + Conduction within Single-Ion Conducting Polymer Gel Electrolytes via Reduced Cation- Polymer Interaction. ACS Materials Lett. 2020. [Google Scholar] [CrossRef]
  47. Klein, R.J.; Zhang, S.; Dou, S.; Jones, B.H.; Colby, R.H.; Runt, J. Modeling Electrode Polarization in Dielectric Spectroscopy: Ion Mobility and Mobile Ion Concentration of Single-Ion Polymer Electrolytes. J. Chem. Phys. 2006, 124, 144903. [Google Scholar] [CrossRef]
  48. Seki, S.; Susan, M.A.B.H.; Kaneko, T.; Tokuda, H.; Noda, A.; Watanabe, M. Distinct Difference in Ionic Transport Behavior in Polymer Electrolytes Depending on the Matrix Polymers and Incorporated Salts. J. Phys. Chem. B 2005, 109, 3886–3892. [Google Scholar] [CrossRef]
  49. Petrowsky, M.; Frech, R. Temperature Dependence of Ion Transport: The Compensated Arrhenius Equation. J. Phys. Chem. B 2009, 113, 5996–6000. [Google Scholar] [CrossRef]
  50. Marcus, Y. Ionic Radii in Aqueous Solutions. Chem. Rev. 1988, 88, 1475–1498. [Google Scholar] [CrossRef]
  51. Mähler, J.; Persson, I. A Study of the Hydration of the Alkali Metal Ions in Aqueous Solution. Inorg. Chem. 2012, 51, 425–438. [Google Scholar] [CrossRef]
  52. Hall, L.M.; Seitz, M.E.; Winey, K.I.; Opper, K.L.; Wagener, K.B.; Stevens, M.J.; Frischknecht, A.L. Ionic Aggregate Structure in Ionomer Melts: Effect of Molecular Architecture on Aggregates and the Ionomer Peak. J. Am. Chem. Soc. 2012, 134, 574–587. [Google Scholar] [CrossRef]
  53. Zheng, Q.; Pesko, D.M.; Savoie, B.M.; Timachova, K.; Hasan, A.L.; Smith, M.C.; Miller, T.F.; Coates, G.W.; Balsara, N.P. Optimizing Ion Transport in Polyether-Based Electrolytes for Lithium Batteries. Macromolecules 2018, 51, 2847–2858. [Google Scholar] [CrossRef] [Green Version]
  54. Pesko, D.M.; Webb, M.A.; Jung, Y.; Zheng, Q.; Miller, T.F.; Coates, G.W.; Balsara, N.P. Universal Relationship between Conductivity and Solvation-Site Connectivity in Ether-Based Polymer Electrolytes. Macromolecules 2016, 49, 5244–5255. [Google Scholar] [CrossRef]
  55. Webb, M.A.; Jung, Y.; Pesko, D.M.; Savoie, B.M.; Yamamoto, U.; Coates, G.W.; Balsara, N.P.; Wang, Z.G.; Miller, T.F. Systematic Computational and Experimental Investigation of Lithium-Ion Transport Mechanisms in Polyester-Based Polymer Electrolytes. ACS Cent. Sci. 2015, 1, 198–205. [Google Scholar] [CrossRef] [PubMed] [Green Version]
  56. Yarusso, D.J.; Cooper, S.L. Microstructure of Ionomers: Interpretation of Small-Angle X-Ray Scattering Data. Macromolecules 1983, 16, 1871–1880. [Google Scholar] [CrossRef]
  57. Li, Y.; Peiffer, D.G.; Chu, B. Long-Range Inhomogeneities in Sulfonated Polystyrene Ionomers. Macromolecules 1993, 26, 4006–4012. [Google Scholar] [CrossRef]
  58. Elliott, J.A.; Hanna, S.; Elliott, A.M.S.; Cooley, G.E. Interpretation of the Small-Angle X-Ray Scattering from Swollen and Oriented Perfluorinated Ionomer Membranes. Macromolecules 2000, 33, 4161–4171. [Google Scholar] [CrossRef]
  59. Gebel, G.; Diat, O. Neutron and X-Ray Scattering: Suitable Tools for Studying Lonomer Membranes. Fuel Cells 2005, 5, 261–276. [Google Scholar] [CrossRef]
  60. Hamley, I.W.; Castelletto, V. Small-Angle Scattering of Block Copolymers in the Melt, Solution and Crystal States. Prog. Polym. Sci. 2004, 29, 909–948. [Google Scholar]
  61. Meziane, R.; Bonnet, J.P.; Courty, M.; Djellab, K.; Armand, M. Single-Ion Polymer Electrolytes Based on a Delocalized Polyanion for Lithium Batteries. Electrochim. Acta 2011, 57, 14–19. [Google Scholar] [CrossRef]
Figure 1. Abundance of rechargeable battery relevant Li, Na, Ca, and K metals in seawater and in the earth’s crust [1,2].
Batteries 06 00011 g001
Figure 2. (A) Photograph of dry transparent freestanding crosslinked SIPEs, PEGDMA1000_low_SSCa (left) and PEGDMA1000_low_STFSICa (right). (B) Poly(ethylene glycol) dimethacrylate (PEGDMA). (C) Styrene sulfonate (SS). (D) Poly(tetrahydrofuran) diacrylate (PTHFDA). (E) 4-styrenesulfonyl (trifluoromethylsulfonyl)imide (STFSI).
Batteries 06 00011 g002
Figure 3. Conductivity as a function of cation for PEGDMA1000_low_SSM (left) and PTHFDA1000_low_STFSIM (right) SIPEs swelled with DEG. Temperatures ranged from −20 °C to 115 °C.
Batteries 06 00011 g003
Figure 4. Conductivity as a function of charge density for PEGDMA1000_Ch_SSM (left) and PTHFDA1000_Ch_STFSIM (right) SIPEs swelled with DEG. Temperatures ranged from −20 °C to 115 °C.
Batteries 06 00011 g004
Figure 5. Conductivity as a function of swelling state for PEGDMA1000_low_SSM (left) and PTHFDA1000_low_STFSIM (right) SIPEs. Temperatures ranged from −20 °C to 115 °C.
Batteries 06 00011 g005
Figure 6. SAXS scattering for PEGDMA1000_low_SSM and PTHFDA1000_med_STFSIM polymers in (A) DEG, (B) TEG, (C) EC:PC, and (D) dry conditions. Spectra are offset vertically for clarity and are background subtracted.
Batteries 06 00011 g006
Table 1. Conductivity of sodium exchanged single-ion conducting polymers reported in the literature. * denotes value estimated by visual inspection of plot. Bolded font is for visual guidance, i.e. in the first entry the bold value 1.3 × 10⁻⁵ goes with the bolded solvent TEG.
ChemistryConductivity (S/cm)SolventRef
Poly(tetrahydrofuran) diacrylate-x-4-styrenesulfonyl (trifluoromethylsulfonyl) imide (PTHFDA-STFSI) sodium exchanged2.4 × 10−5 (25 °C)DEGThis work
1.3 × 10⁻⁵ (25 °C)TEG
3.9 × 10⁻⁴ (25 °C)EC:PC
5.9 × 10⁻¹² (25 °C)Dry
Poly(2-acrylamido-2-methyl-propane- 1-sulphonic acid) (PAMPS)10−2 (20 °C) *50H2O/SO3[5]
10−5 (20 °C) *Dimethyl Sulfoxide (DMSO)
PFSA (Nafion 117) sodium exchanged1.8 × 10−2 (23 °C)Water[6]
3.2 × 10⁻⁴ (23 °C)Triethyl phosphate
3.8 × 10⁻³ (23 °C)N-methyl Formamide
5.1 × 10⁻⁴ (23 °C)g-butyrolactone
5.0 ×10⁻⁴(23 °C)DMSO
Fully sulfonated poly phenylene-sulfone1 × 10−3 (25 °C) *DMSO[7]
2 × 10⁻³ (70 °C) *
PFSA (Nafion 117) sodium exchanged10−3 (RT) *14H2O/SO3[8]
10−6 (RT) *6H2O/SO3
PFSA (Nafion 115) sodium exchanged3.52 × 10−4 (RT)EC/PC 1:1[9]
1.52 × 10⁻³ (70 °C)
PFSA (Nafion 115) sodium exchanged3.5 × 10−4 (30 °C)DMSO[10]
Perfluorinated sulfonic sodium membrane (PFSA)
Nafion-sodium exchanged
2.5 × 10⁻⁴ (25 °C)EC/PC 1:1[11]
1.5 × 10⁻³ (70 °C)
1.5 × 10⁻⁴ (25 °C)
1.1 × 10⁻³ (70 °C)
Poly(sodium tartaric acid borate) blend poly(vinylene carbonate)1 × 10⁻⁴ (RT) *EC/DEC 1:1[12]
poly(bis(4-carbonyl benzene sulfonyl)imide-co-2.5-diamino benzesulfonic acid) (NaPA) + PVDF/HFP0.91 × 10−4 (20 °C)EC/DMC 1:1[13]
4.1 × 10⁻⁴ (80 °C)
SiO2 particles grafted with Poly(ethylene glycol) (PEG) and NaSTFSI dispersed in PEO10−5 (RT) *Poly(ethylene glycol) dimethyl ether (PEGDME) 250 g/mol[14]
10−4 (75 °C) *
PEG900 and dimethyl 5-sulfoisophthalate sodium salt1.07 × 10−6 (25 °C)Dry[15]
N,N-Diallyl-l-amido-tetrafluoroethanesulfonate (DaaRFSO3Na)4 × 10⁻⁷ (25 °C) *Dry[16]
Poly(ethylene glycol-co-2,4-tolyldiisocyanate-co-(alkali-metal methacrylates)) (PEG-PU-AMMA)3 × 10⁻⁷ (25 °C) *Dry[17]
9 × 10⁻⁶ (80 °C) *
Poly(ethylene glycol) diacrylate (PEGDA, 1500 g/mol)-co-STFSI Na2.0 × 10−7 (25 °C)Dry[18]
5.0 × 10⁻⁶ (85 °C)
Polyurethane sulfonate10−7 (25 °C) *Dry[19]
PEO-co-benzenesulfonate10−7 (25 °C) *Dry[20]
Network Polymers Based on Sodium Poly(tetraalkoxyaluminates) with Poly(ethylene oxide) (PEO) blend10−7 (50 °C) *Dry[21]
10−6 (80 °C) *
Poly[ (oligo(oxyethylene) methacrylate)-co-(alkali-metal methacrylates)]8 × 10⁻⁸ (25 °C) *Dry[22]
Poly(oligo-oxyethylenemethacrylate-co-alkali metal acrylamidocaproate)6.9 × 10⁻⁸ (RT)Dry[23]
Nona-oxyethylene Methacrylate-co-alkali-metal methacrylate10−8 (25 °C) *Dry[24]
Methacrylic PEO-co-sodium stytene sulfonate (PEO9M-r-NaSS)10−8 (RT) *Dry[25]
10−7 (80 °C)*
Polyethylene-like 48 carbon sodium dimethylsulfosuccinate (PES48Na) Precise ionomer10−10 (100 °C) *Dry[26]
10−6 (160 °C) *
Polyethylene-like sulfonated precise ionomer–gyroid phase10−11 (80 °C) *Dry[27]
10−7 (120 °C) *
Sodium Poly(4-styrenesulfonyl (trifluoromethylsulfonyl)imide) (NaPSTFSI)
NaPSTFSI Poly ethyl acrylate blends
10−14 to 10−11 (40 °C) *Dry[28]
10−12 to 10−9 (40 °C) *Dry
Poly(2-acrylamido-2-methyl-1-propane-sulfonic acid sodium salt) homopolymer10−11 (130 °C) *Dry[29]
Table 2. Conductivity of potassium exchanged single-ion conducting polymers reported in the literature. * denotes value was estimated by visual inspection of plot. Bolded font is for visual guidance.
ChemistryConductivity (S/cm)SolventRef
Poly(tetrahydrofuran) diacrylate-x-4-styrenesulfonyl (trifluoromethylsulfonyl) imide (PTHFDA-STFSI) potassium exchanged4.0 × 10−5 (25 °C)DEGThis work
1.8 × 10⁻⁵ (25 °C)TEG
2.7 × 10⁻⁴ (25 °C)EC:PC
2.4 × 10⁻¹² (25 °C)Dry
PFSA (Nafion 117) potassium exchanged1.4 × 10−2 (23 °C)Water[6]
1.4 × 10⁻⁴ (23 °C)Triethyl phosphate
4.1 × 10⁻³ (23 °C)N-methylFormamide
2.3 × 10⁻⁵ (23 °C)g-butyrolactone
8.0 × 10⁻⁴ (23 °C)DMSO
PFSA (Nafion 117) potassium exchanged8.0 × 103 (RT)Water, fully hydrated[30]
PFSA (Nafion 117) potassium exchanged10−3 (RT) *9H2O/SO3[8]
10−6 (RT) *6H2O/SO3
PFSA (Nafion 115) potassium exchanged3.3 × 104 (30 °C)DMSO[10]
Acrylic acid and methoxy poly(ethylene glycol)s coordinating K+6 × 10⁶ (30 °C) *10% RH[31]
N,N-Diallyl-l-amido-tetrafluoroethanesulfonate (DaaRFSO3K)3 × 10⁶ (25 °C) *Dry[16]
PFSA (Nafion) potassium exchanged106 (100 °C) *Dry[32]
Poly(ethylene glycol)-co-2,4-tolyl diisocyanate-co-(alkali-metal methacrylates))(PEG-PU-AMMA)6 × 10⁻⁷ (25 °C) *Dry[17]
1 × 10⁻⁵ (80 °C) *
Poly(oligo-oxyethylenemethacrylate-co-alkali metal acrylamidocaproate)2 × 10⁷ (RT) *Dry[23]
Poly(oligo(oxyethylene) methacrylate)-co-(alkali-metal methacrylates)2 × 10⁷ (25 °C) *Dry[22]
Nona-oxyethylene methacrylate and alkali-metal methacrylate-K107 (25 °C) *Dry[24]
PEGDA(1500 g/mol)-co-STFSI K9 × 10−8 (25 °C)Dry[18]
5 × 10⁻⁶ (85 °C)
PFSA (Nafion) 211 potassium exchangedUnreportedWater[33]
Table 3. Conductivity of calcium exchanged single-ion conducting polymers, along with select dual ion conductors, reported in the literature. * denotes value was estimated by visual inspection of plot. ‡ denotes dual-ion conductor. Bolded font is for visual guidance.
ChemistryConductivity (S/cm)SolventRef
Poly(tetrahydrofuran) diacrylate-x-4-styrenesulfonyl (trifluoromethylsulfonyl) imide (PTHFDA-STFSI) calcium exchanged6.2 × 10−7 (25 °C)DEGThis work
1.0 × 10⁻⁷ (25 °C)TEG
7.0 × 10⁻⁶ (25 °C)EC:PC
3.5 × 10⁻¹³ (85 °C)Dry
PFSA (Nafion 117) calcium exchanged9.1 × 10−3 (23 °C)Water[6]
1.0 × 10⁻⁶ (23 °C)Triethyl phosphate
2.7 × 10⁻³ (23 °C)N-methyl Formamide
1.1 × 10⁻⁵ (23 °C)g-butyrolactone
3.5 × 10⁻⁴(23 °C)DMSO
PFSA (Nafion 117) calcium exchanged10−3 (RT) *14H2O/SO3[8]
10−6 (RT) *8H2O/SO3
PEGDA 1500 g/mol -co-STFSI Ca2.0 × 10−9 (25 °C)Dry[18]
9.0 × 10⁻⁸ (85 °C)
PEGDA 575 g/mol + Ca(NO3)2 4H2O5 × 106 (25 °C) *Dry[34] ‡
Poly(tetrahydrofuran) (PTHF)-Epoxy + Ca(NO3)22 × 104 (25 °C) *Dry[35] ‡
Table 4. Conductivity of all SIPEs in all conditions at 25 °C and 85 °C.
SampleCationCharge Density × 104 (mol ch/g Monomer)SolventConductivity (S/cm) 25 °CConductivity (S/cm) 85 °C
PEGDMA1000-SSK8 (low)DEG1.2 × 10‒71.8 × 10‒6
TEG6.4 × 10‒77.1 × 10‒6
EC:PC4.8 × 10‒68.0 × 10‒5
Dry1.4 × 10‒92.6 × 10‒7
12 (med)DEG1.7 × 10‒88.2 × 10‒7
TEG1.5 × 10‒76.1 × 10‒6
EC:PC4.2 × 10‒68.1 × 10‒5
Dry2.4 × 10‒102.7 × 10‒7
16 (high)DEG1.3 × 10‒89.9 × 10‒7
TEG 1.1 × 10‒6
EC:PC5.7 × 10‒61.0 × 10‒4
Dry 1.5 × 10‒7
PEGDMA1000-SSNa8 (low)DEG1.1 × 10‒71.1 × 10‒7
TEG1.8 × 10‒73.2 × 10‒6
EC:PC2.5 × 10‒64.6 × 10‒5
Dry1.8 × 10‒92.2 × 10‒7
12 (med)DEG1.1 × 10‒71.1 × 10‒6
TEG7.9 × 10‒81.3 × 10‒6
EC:PC3.8 × 10‒65.8 × 10‒5
Dry2.7 × 10‒111.4 × 10‒8
16 (high)DEG4.4 × 10‒85.0 × 10‒7
TEG5.3 × 10‒92.9 × 10‒7
EC:PC4.7 × 10‒65.1 × 10‒5
Dry 4.4 × 10‒8
PEGDMA1000-SSCa8 (low)DEG2.5 × 10‒92.0 × 10‒8
TEG4.3 × 10‒94.4 × 10‒8
EC:PC1.9 × 10‒61.2 × 10⁻⁵
Dry 2.8 × 10⁻¹⁰
12 (med)DEG4.3 × 10‒119.2 × 10⁻¹⁰
TEG1.2 × 10‒111.2 × 10⁻⁹
EC:PC2.9 × 10‒72.1 × 10⁻⁶
Dry 2.0 × 10⁻¹¹
16 (high)DEG 1.3 × 10⁻¹¹
TEG8.5 × 10‒122.5 × 10⁻¹⁰
EC:PC6.7 × 10−86.5 × 10⁻⁷
Dry 2.8 × 10⁻¹³ (100 °C)
PTHFDA-STFSIK7 (low)DEG1.8 × 10−53.4 × 10⁻⁵
TEG7.3 × 10−62.9 × 10⁻⁵
EC:PC8.5 × 10−53.6 × 10⁻⁴
Dry1.4 × 10−121.6 × 10⁻⁸
10 (med)DEG1.6 × 10−53.4 × 10⁻⁵
TEG1.2 × 10−55.4 × 10⁻⁵
EC:PC1.2 × 10−44.7 × 10⁻⁴
Dry 1.1 × 10⁻⁸
13 (high)DEG4.0 × 10−59.8 × 10⁻⁵
TEG1.8 × 10−58.3 × 10⁻⁵
EC:PC2.7 × 10−49.7 × 10⁻⁴
Dry2.4 × 10−123.4 × 10⁻⁸
PTHFDA-STFSINa7 (low)DEG1.7 × 10−53.5 × 10⁻⁵
TEG6.4 × 10−62.4 × 10⁻⁶
EC:PC1.0 × 10−45.0 × 10⁻⁴
Dry1.3 × 10−113.0 × 10⁻⁸
10 (med)DEG2.8 × 10−56.3 × 10⁻⁵
TEG1.1 × 10−54.1 × 10⁻⁵
EC:PC9.8 × 10−53.6 × 10⁻⁴
Dry4.6 × 10−128.0 × 10⁻⁹
13 (high)DEG2.5 × 10−54.6 × 10⁻⁵
TEG1.3 × 10−56.0 × 10⁻⁵
EC:PC3.9 × 10−41.4 × 10⁻³
Dry5.9 × 10−123.6 × 10⁻⁸
PTHFDA-STFSICa7 (low)DEG3.5 × 10−81.1 × 10⁻⁷
TEG3.7 × 10−81.5 × 10⁻⁷
EC:PC6.8 × 10−78.5 × 10⁻⁶
Dry 3.3 × 10⁻¹¹
10 (med)DEG1.9 × 10−87.3 × 10⁻⁸
TEG2.3 × 10−81.2 × 10⁻⁷
EC:PC2.9 × 10−62.6 × 10⁻⁵
Dry 2.1 × 10⁻¹¹
13 (high)DEG6.2 × 10−83.1 × 10⁻⁷
TEG1.0 × 10−73.7 × 10⁻⁷
EC:PC7.0 × 10−65.1 × 10⁻⁵
Dry 3.5 × 10⁻¹³
Table 5. Swelling mass and volume % change for various SIPEs.
SampleSolventMass Change %Volume Change %Cation Conc. (mol Charge/cm3 Polymer)
PEGDMA1000_med_SSNaDEG24 ± 3.624 ± 2.60.00121
PTHFDA1000_med_STFSINaDEG164 ± 14175 ± 2.30.00043
PEGDMA1000_med_SSNaTEG21 ± 5.723 ± 4.30.00122
PTHFDA1000_med_STFSINaTEG142 ± 7.8157 ± 4.80.00048
PEGDMA1000_med_SSNaEC:PC97 ± 9.191 ± 4.90.00082
PTHFDA1000_med_STFSINaEC:PC169 ± 14.9135 ± 19.80.00057

