Article

In Situ Measurement of Orthotropic Thermal Conductivity on Commercial Pouch Lithium-Ion Batteries with Thermoelectric Device

1
VSI Institute, Inffeldgasse 23/I, 8010 Graz, Austria
2
AVL List GmbH, Hans-List Platz 1, 8020 Graz, Austria
*
Author to whom correspondence should be addressed.
Batteries 2020, 6(1), 10; https://doi.org/10.3390/batteries6010010
Submission received: 23 October 2019 / Revised: 24 January 2020 / Accepted: 1 February 2020 / Published: 10 February 2020
(This article belongs to the Special Issue Thermal and Safety Properties of Materials, Cells and Batteries 2019)

Abstract

:
In this paper, the direct measurement of the orthotropic thermal conductivity on a commercial Li-ion pouch battery is presented. The samples under analysis are state-of-the art batteries obtained from a fully electric vehicle commercialized in 2016. The proposed methodology does not require a laboratory equipped to manage hazardous chemical substances as the battery does not need to be disassembled. The principle of the measurement methodology consists of forcing a thermal gradient on the battery along the desired direction and measuring the heat flux and temperature after the steady state condition has been reached. A thermoelectric device has been built in order to force the thermal gradient and keep it stable over a long period of time in order to be able to observe the temperatures in steady state condition. Aligned with other measurement methodologies, the results revealed that the thermal conductivity in the thickness direction (0.77 Wm−1K−1) is lower with respect to the other two directions (25.55 Wm−1K−1 and 25.74 Wm−1K−1) to about a factor ×35.

1. Introduction

Nowadays, we are assisting in the migration of mobility technology from combustion engines to electric motors. The optimization of electric power trained vehicles is a fundamental key in achieving the optimum gravitational energy of a battery pack and developing this technology to make it more attractive for the market. The success of the optimization depends on the quality of the loop design simulation, and thus also on the accuracy of the physical thermal parameters used for simulations: an accurate temperature prediction leads to correct design modifications. As lithium-ion battery technology is rapidly evolving, the internal materials need to be constantly improved or face inevitable redesign in terms of thermal parameters, hence the need to develop a fast and accessible measurement methodology. The approach to the evaluation of the thermal parameters of a battery need careful consideration as it contains non-inert materials and hazardous substances. For safety reasons, the battery should not exceed certain temperature limits (usually indicated as around 50–60 °C by the manufacturers) and, furthermore, drawbacks on sample extraction should be considered. In fact, the thermal conductivity of a lithium-ion battery is strongly dependent on its electrolyte amount [1] and, because the electrolyte is a highly volatile liquid, when the battery is disassembled, it evaporates quickly [2,3,4,5,6,7,8]. However, it is possible to find methodologies in the literature for the measurement of the thermal conductivity of small samples of individual internal materials obtained by disassembling the battery [1,7]. Alternative methodologies avoid the post-mortem procedure, measuring temperature transients or heat flux through the sample using temperature sensors or thermal camera imaging [3,6,9]. The common working principle of the last group of methods is the forcing of a temperature gradient or heat flux across the sample and the measurement of the transversal temperature transient or heat flux. As the thermal conductivity can be observed in steady state condition, the application of a temperature drop would require a heater and a cooling device—possibly with high precision and stability. For this reason, a cooling device with Peltier elements and an integrated control system was built and presented in this paper. Thanks to this electro-thermal device and mat heater elements, a temperature gradient was forced on the battery across the three directions and the heat flux was measured for the thermal resistance evaluation. The developed procedure, presented in this paper, allows the orthotropic thermal conductivity to be measured without disassembling the battery, thus avoiding the loss of electrolyte and respecting the temperature limits of the battery. The method does not alter the property of the sample and the outcome is the homogeneous, orthotropic thermal conductivity of the battery sample.

2. Equipment Description

2.1. Thermoelectric Device

The objective of the temperature-guarded plate was to obtain a stable temperature lower than the ambient one (to get a higher temperature drop) even after hours of testing. The temperature-guarded plate consists of a milled 15 mm thick aluminum plate and 12 Peltier cells (Model: HP-127120) homogeneously distributed under it, obtaining a total peak thermal power of 1.3 kW. The heat subtracted from the aluminum plate during operation is exhausted through a group of extruded aluminum heat sinks. Nine digital temperature sensors DS1820B+ are placed inside the aluminum plate volume (drilled) close to the top surface in order to monitor/control its superficial temperature. The Peltier elements are connected with a 2s6p configuration and supplied by a regulatable AC/DC power supply. Investigations on the modeling and control of Peltier cells have been conducted [10]. A Raspberry microcontroller was programmed to read the temperature from the temperature sensors and set the voltage of the Peltier elements in order to get the desired temperature on the aluminum plate. The assembly of the device is shown in Figure 1.
The aim of this device was to set and maintain a constant and homogeneous temperature on the surface of the object. For this reason, during operation, it was desired that the plate temperature show a homogeneous temperature on the overall surface. Preliminary tests (Appendix A) were conducted in order to reveal the maximum temperature gradient during operation. The results show a gradient temperature in the center area of the plate (as large as the battery area) of less than 0.5 °C. Temperature plots and device details are reported in Appendix A.

2.2. Flat Heat Flux Sensors

The measurement of the heat flux was performed with foil heat flux sensors (model FHF02), produced by the company “Hukseflux Thermal Sensors” (Delft, Netherlands). The sensors have a thickness of 0.9 mm and the total surface area is 50 mm × 50 mm. The active sensing area at the center of the sensor surface is 30 mm × 30 mm, and the remaining part is composed of a plastic material (Kapton polyimide film) as the thermal spreader. The technical specifications as reported by the manufacturer are listed as follows:
  • Calibration uncertainty ±5%;
  • Sensitivity range (4 to 8) × 10−6 V/(W/m2);
  • Sensitivity nominal 5.5 × 10⁻⁶ V/(W/m2);
  • Expected voltage output (−80 to +80) mV;
  • Sensor thermal conductivity 0.29 W/(mK);
  • Temperature sensor Type T incorporated;
  • Accuracy ±1.0 °C or ±0.4% (whichever is greater).
The sensor has two differential output voltages, the primer is the heat flux output and the former is the integrated thermocouple signal. As the sample object (battery) had a bigger surface than the sensor’s surface area, which was 50 mm × 50 mm, in order to compensate for the sensor thickness and provide homogeneous contact between parts under test, an additional 1 mm of Pertinax foil was used to fill the gap around the sensor. Pertinax foil has a thermal conductivity of 0.2 W/mK, similar to that of the sensor as declared by the manufacturer. Furthermore, the thickness difference between the sensor and Pertinax foil (0.1 mm) was compensated for with thermal paste in order to guarantee thermal contact.

2.3. Battery Sample Used for Tests

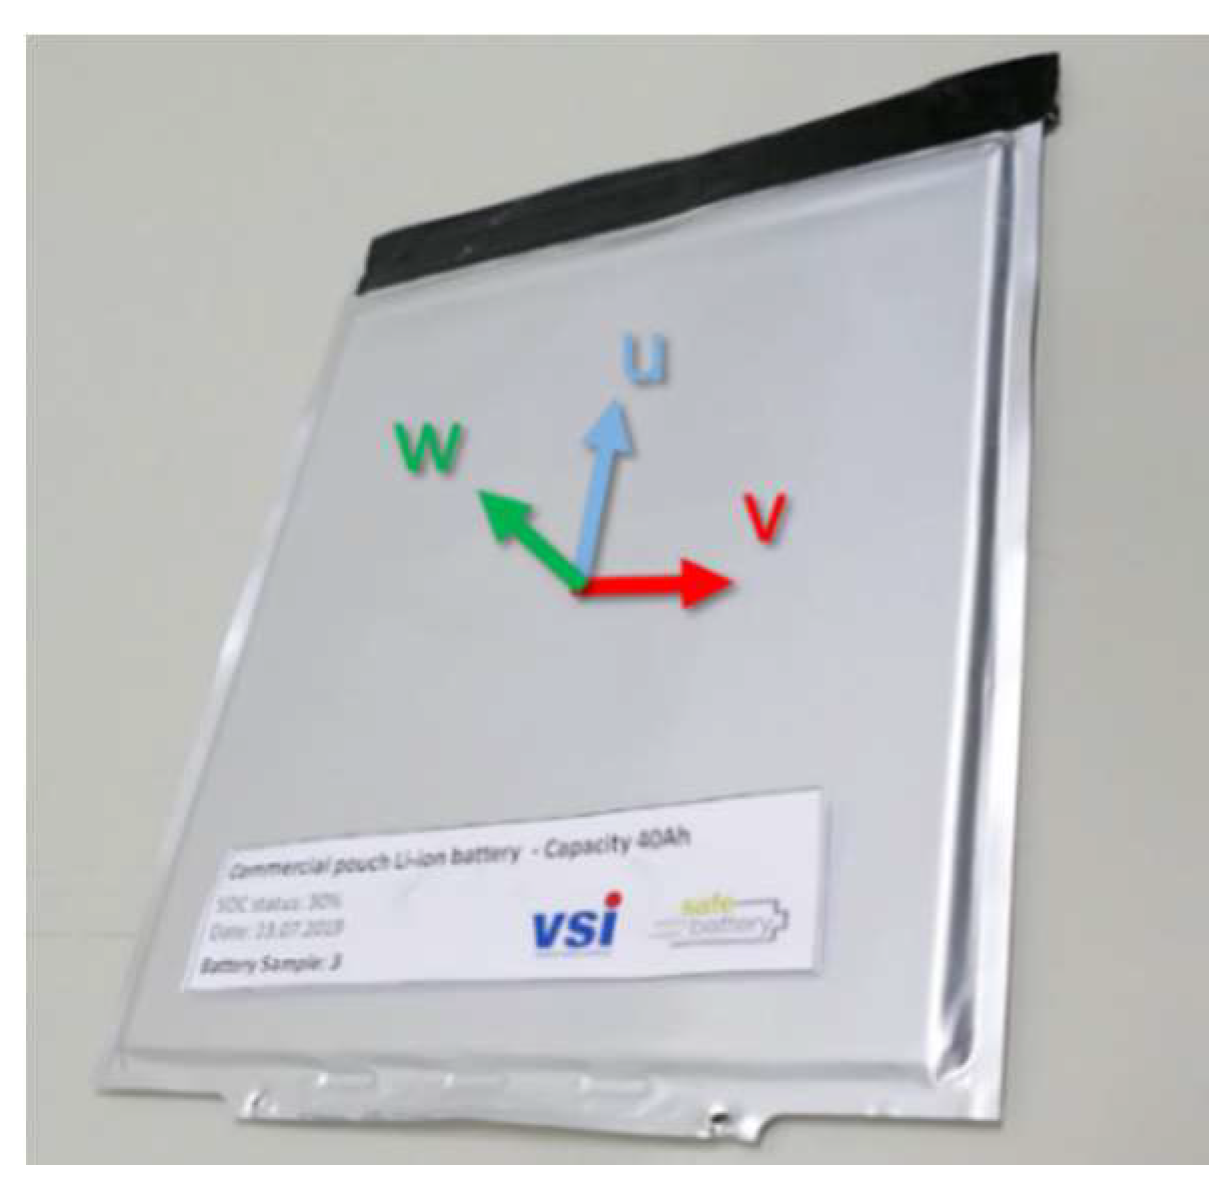
The battery under analysis is a laminate pouch-type cell, obtained from a commercially available electric vehicle, with a rated capacity of 41 Ah and a nominal voltage of 3.7 V. The energy density for one cell is defined by the manufacturer to be 174 Wh/kg. The nominal dimensions of one battery are 290 mm × 216 mm × 8 mm with a total weight of about 800 g. Regarding the chemistry, graphite is used as an anode material, whereas the choice for the cathode material is a spinel of NMC and LMO. More details about the battery type under test can be found in the work of [11]. In Figure 2, the reference system used as reference for each measurement direction is shown.

3. Method

The determination of the orthotropic thermal conductivity requires three measurements for its determination along the three spatial directions. The measurements along the two longitudinal directions (“u” and “v” directions) are based on the same measurement principle and will be described once in this methodology chapter. In general, a temperature gradient is forced along the direction of the thermal conductivity measurement and the thermal insulation is designed in order to avoid temperature gradients in the other directions. For safety reasons, the battery temperature should not exceed 50 °C, as this is a limit indicated by the manufacturer. For this reason, in order to provide a wider temperature drop on the battery, the temperature-guarded plate was set to a temperature lower than the ambient one. For each case, the heat flux is measured on both sides (cold and hot) and averaged in order to minimize the error due to heat flux “leakage” of the system.

3.1. Measurement along the “w” Direction

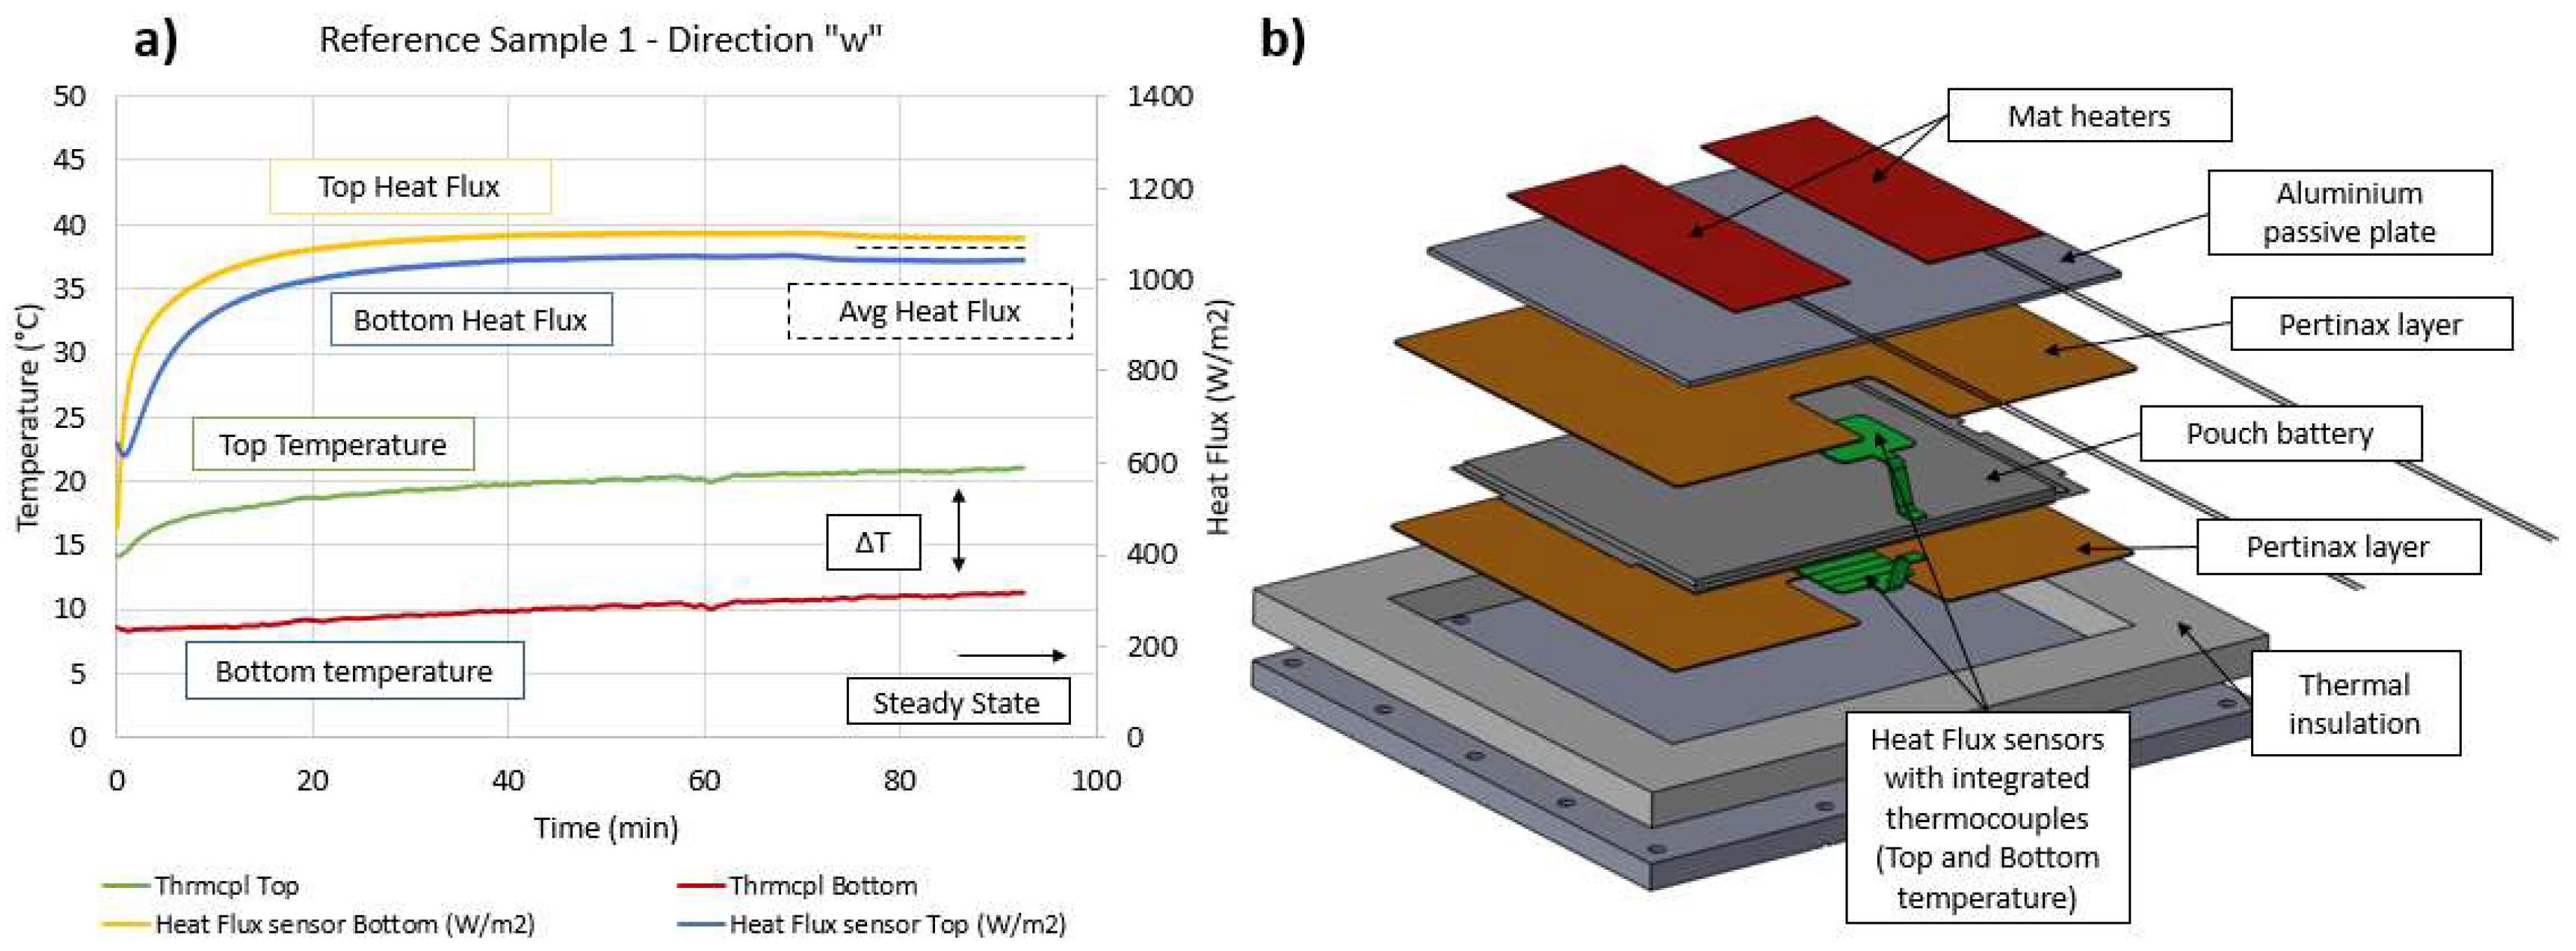
For this case, the temperature gradient is forced along the thickness direction; the temperature-guarded plate provides a constant temperature of about 10 °C lower than the ambient one and the mat heaters placed on top of the object provide a constant heat generation until an equilibrium point is reached (steady state condition) without exceeding the maximum temperature limit of 50 °C. A schematic of the test bench and measurement example is reported in Figure 3.
The pertinax foil, added to fill the gap due to the heat flux sensor thickness, provides a homogeneous thermal resistance between the temperature-guarded plate and the sample battery, avoiding the generation of temperature gradient along the longitudinal directions. This last statement is confirmed by the plot in Figure 3; in fact, if there were a consistent temperature gradient along the longitudinal directions, with consequent heat flux dispersion, the heat fluxes on the top and bottom of the object would not be similar. With this condition, it is possible to consider the battery as an infinite plane object applying Equation (1).
σ = S u r f a c e   H e a t   F l u x   ( W m 2 ) · T h i c k n e s s   ( m ) Δ T e m p e r a t u r e   ( K )
The heat flux used in Equation (1) is the average between the top and bottom sensor measurements. The delta temperature can be obtained by the difference of the temperatures on top and bottom of the object, in this case, measured by the thermocouples integrated into the heat flux sensors.

3.2. Measurement along the “u” and “v” Directions

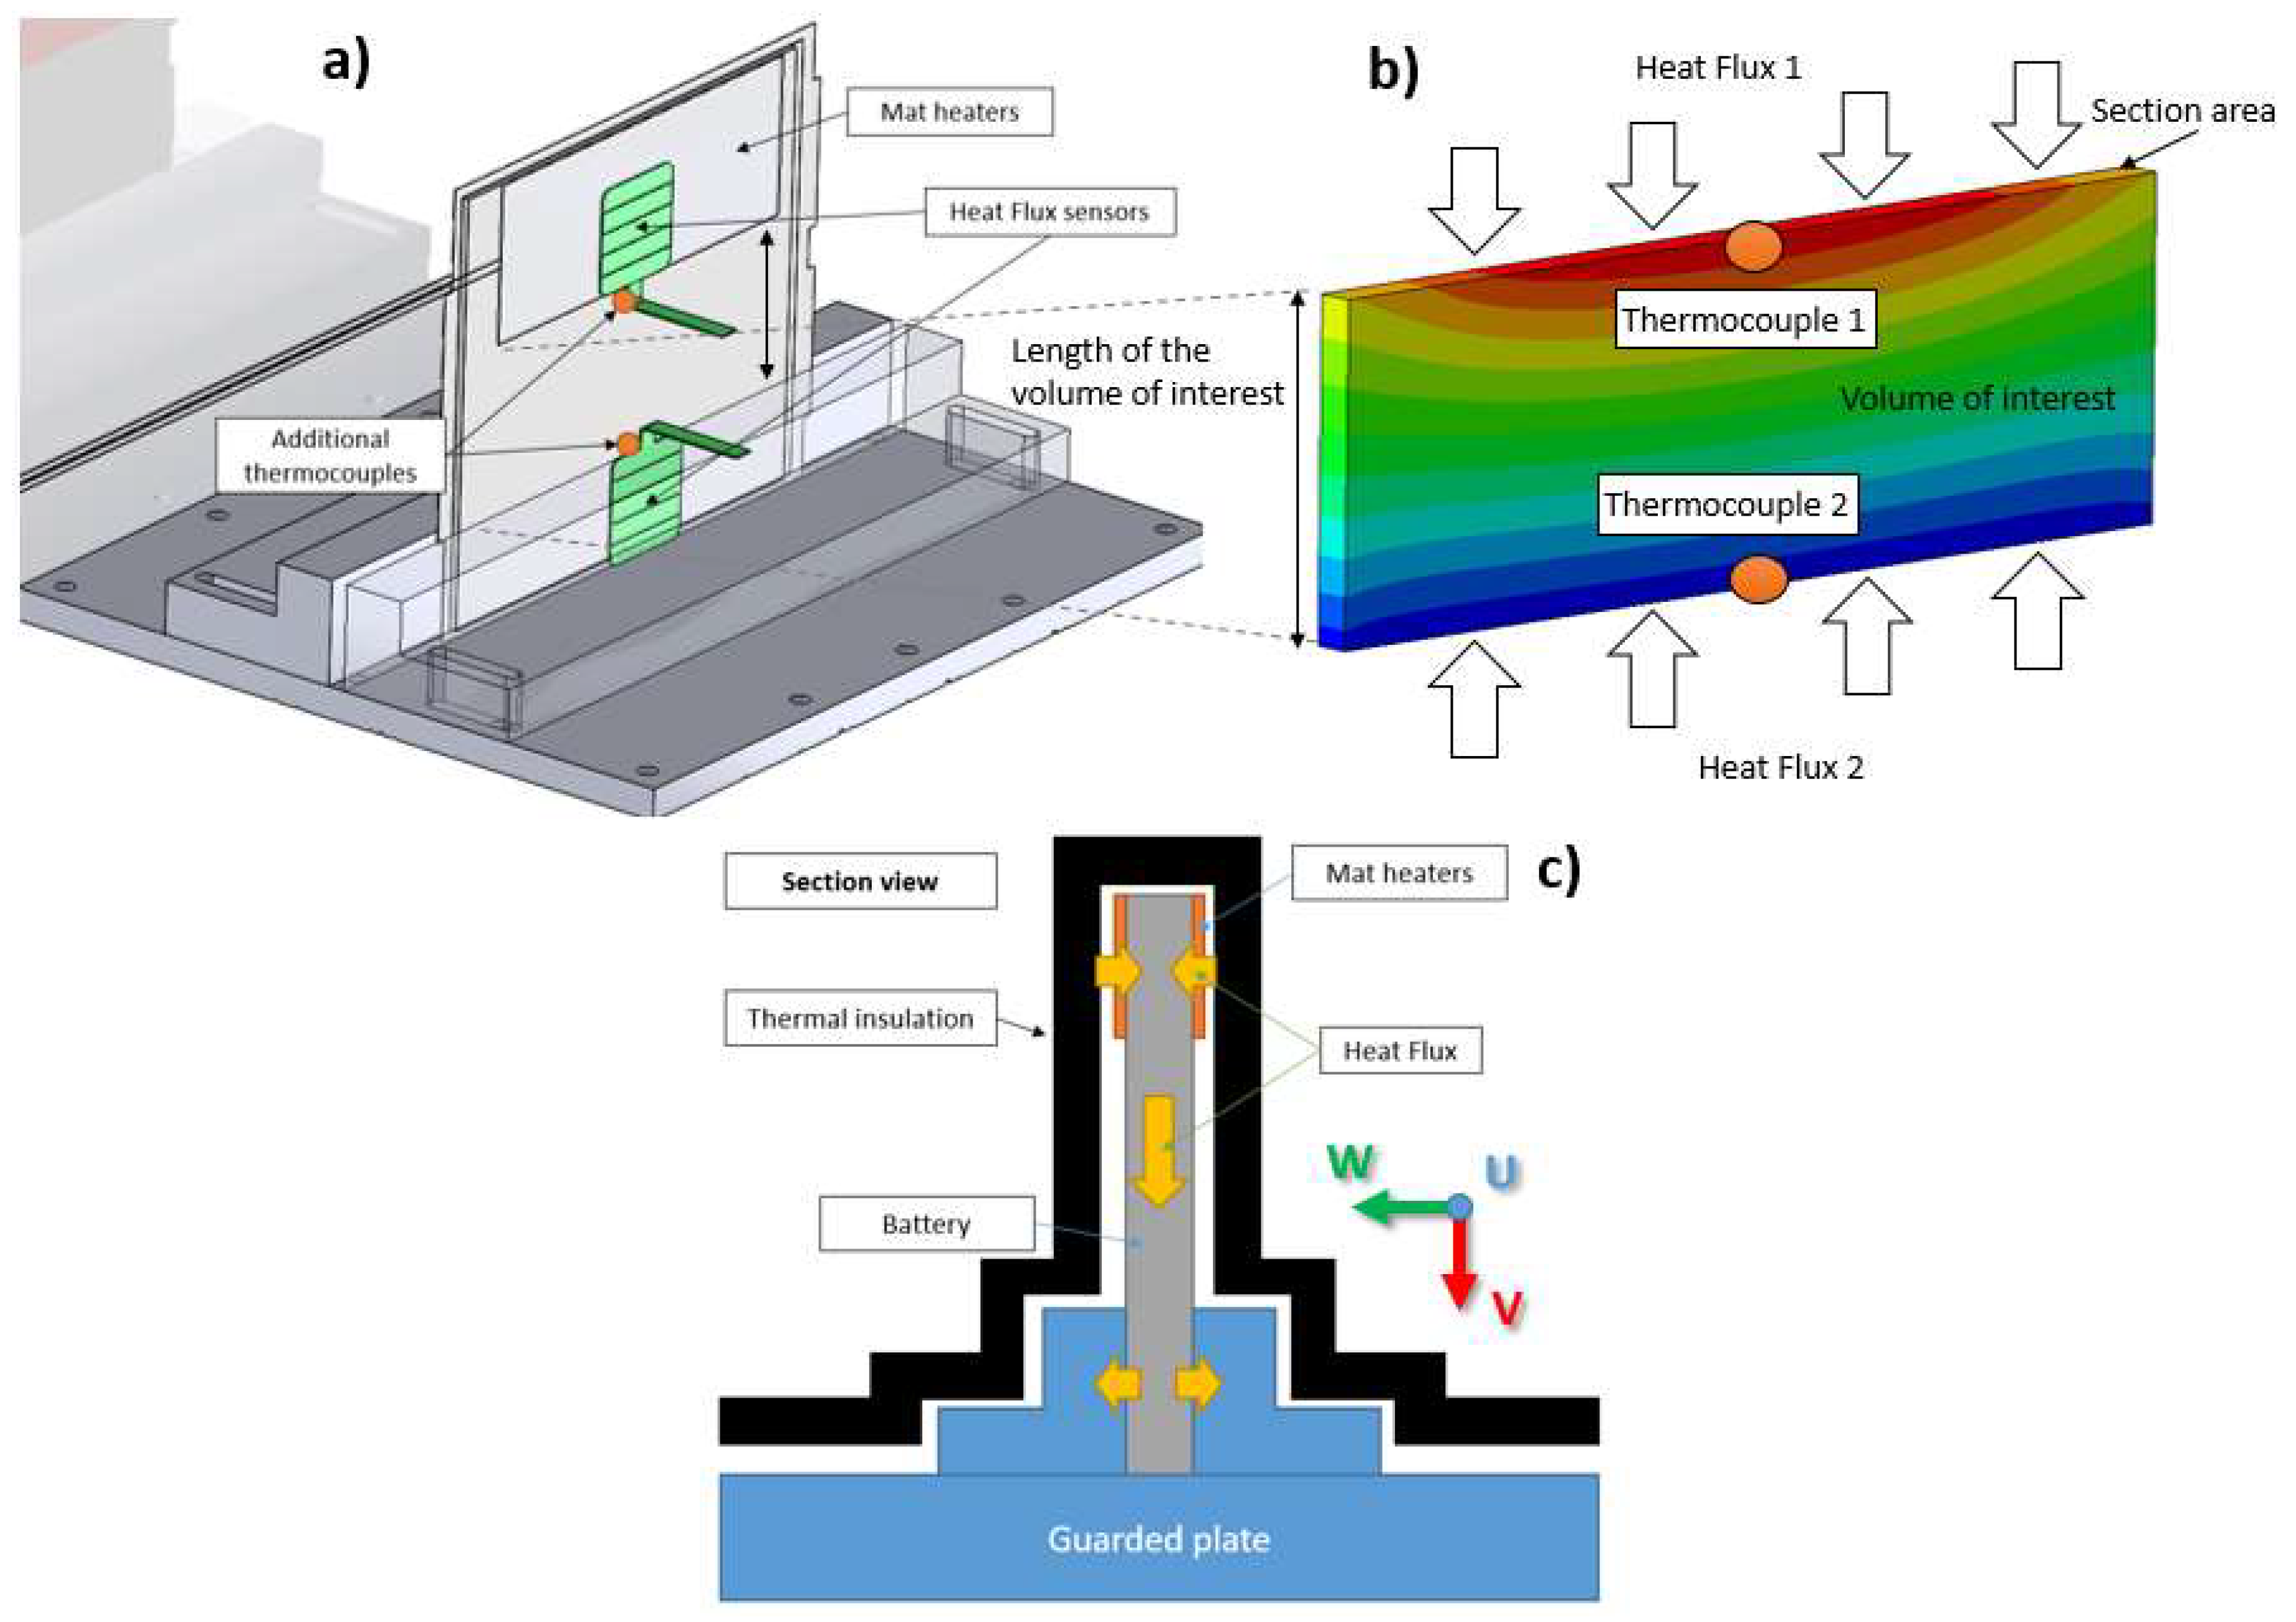
For the longitudinal thermal conductivity measurements (“u” and “v” directions), the test bench was slightly modified. Two additional L-shaped aluminum blocks were mounted on the Peltier plate to allow the vertical mounting of the battery, shown in Figure 4a. The reason for these additional parts stands to the need of applying a temperature gradient across the longitudinal directions. The two L-shaped aluminum blocks were thermally connected (by contact) to the Peltier plate. The sample, on the lower side, was clamped between the two L-shaped blocks and thermally connected to it, while the top side, it was equipped with mat heaters as described in the schematic of Figure 4a. It is possible to notice that the system is symmetric with respect to the “w” direction, which is the reason that a temperature gradient along the “w” direction is not expected. For the thermal conductivity calculation, the volume of interest is the one between the lower edge of the mat heaters and the upper edge of the L-shaped connectors, as indicated in Figure 4b. The indicated “Heat Flux 1” and “Heat Flux 2” cannot be directly measured, but they can be derived considering the schematic diagram of Figure 4c. “Heat Flux 1” can be computed as the sum of the absolute heat fluxes coming from the mat heaters (left and right sides), while “Heat Flux 2” can be computed from the heat fluxes generated by the L-shaped connectors. For this purpose, the heat flux sensors were positioned between the sample and the mat heaters, as well as between the sample and the L-shaped connectors, as indicated in Figure 4a. Additional thermocouples were positioned for the sensing of the temperature at the edges of the volume of interest.
Once the geometry of the volume of interest is defined, it is possible to determine “Heat Flux 1” and “Heat Flux 2” from Equations (2) and (3), and then the averaged heat flux can be computed and used in Equation (4).
H e a t F l u x 1 ( W ) = S e n s o r H F ( W m 2 ) · H e a t e r S u r f ( m 2 ) · 2
H e a t F l u x 2 ( W ) = S e n s o r H F ( W m 2 ) · C o o l S u r f ( m 2 ) · 2
σ   ( W mK ) = A v e r a g e d H e a t F l u x   ( W ) · L e n V o l . I n t ( m ) Δ T e m p e r a t u r e ( K ) · S a m p l e S e c t i o n ( m 2 )
The ∆Temperature indicated in Equation (4) is measured by the additional thermocouples indicated in Figure 3b. The “Length of the volume of interest” indicated in Figure 4 was renamed to LenVol.Int for brevity.

3.3. Measurement Uncertainty Propagation

The uncertainty propagation from the thermal conductivity computation was evaluated. As mentioned earlier, the applied temperature gradient should be set up so that the maximum temperature should not exceed the maximum allowed temperature for the battery (for safety reasons). Usually, battery manufacturers suggest not exceeding 50 °C. From the measurement uncertainty perspective, the temperature drop across the object should be as high as possible, because the uncertainty propagation through the thermal conductivity equation leads to a final value that is inversely proportional to the temperature drop, as indicated in Equation (5) [12].
δ k = Δ Q ˙ | Q | + 2 · Δ T | T 1 T 2 |
In Equation (5), “k” is the thermal conductivity, “Q” indicates the heat flux, and “∆” indicates the differential value of the confidence interval. The first term of the right-hand side of the equation indicates the uncertainty of the measured heat flux, and it is an absolute value as the heat flux sensors used for the tests have an uncertainty of 5% (declared by the manufacturer). The second term includes the temperature measurement and, because it is dependent on the temperature difference, it is a relative value. The temperature sensors used for the tests are Type-T thermocouples with accuracy ±1.0 °C or ±0.4% (whichever is greater). It has been assumed that the geometric measurements are carried out with negligible measurement uncertainty.

3.4. Reference Test

For the validation of the methodology and test bench, a sample of Pyrex (or borosilicate glass) was used as reference material. The measurement methodologies were tested and the obtained results were compared with the known properties of the sample. The material can stand high thermal shocks thanks to a very low thermal expansion coefficient of 3.3 × 10⁻⁶ (1/K). The ordered crystalline structure of the material confers an isotropic thermal conductivity of 1.22 W/mK at 100 °C with ±1% of uncertainty. Its chemical composition (from producer) is reported in Table 1.
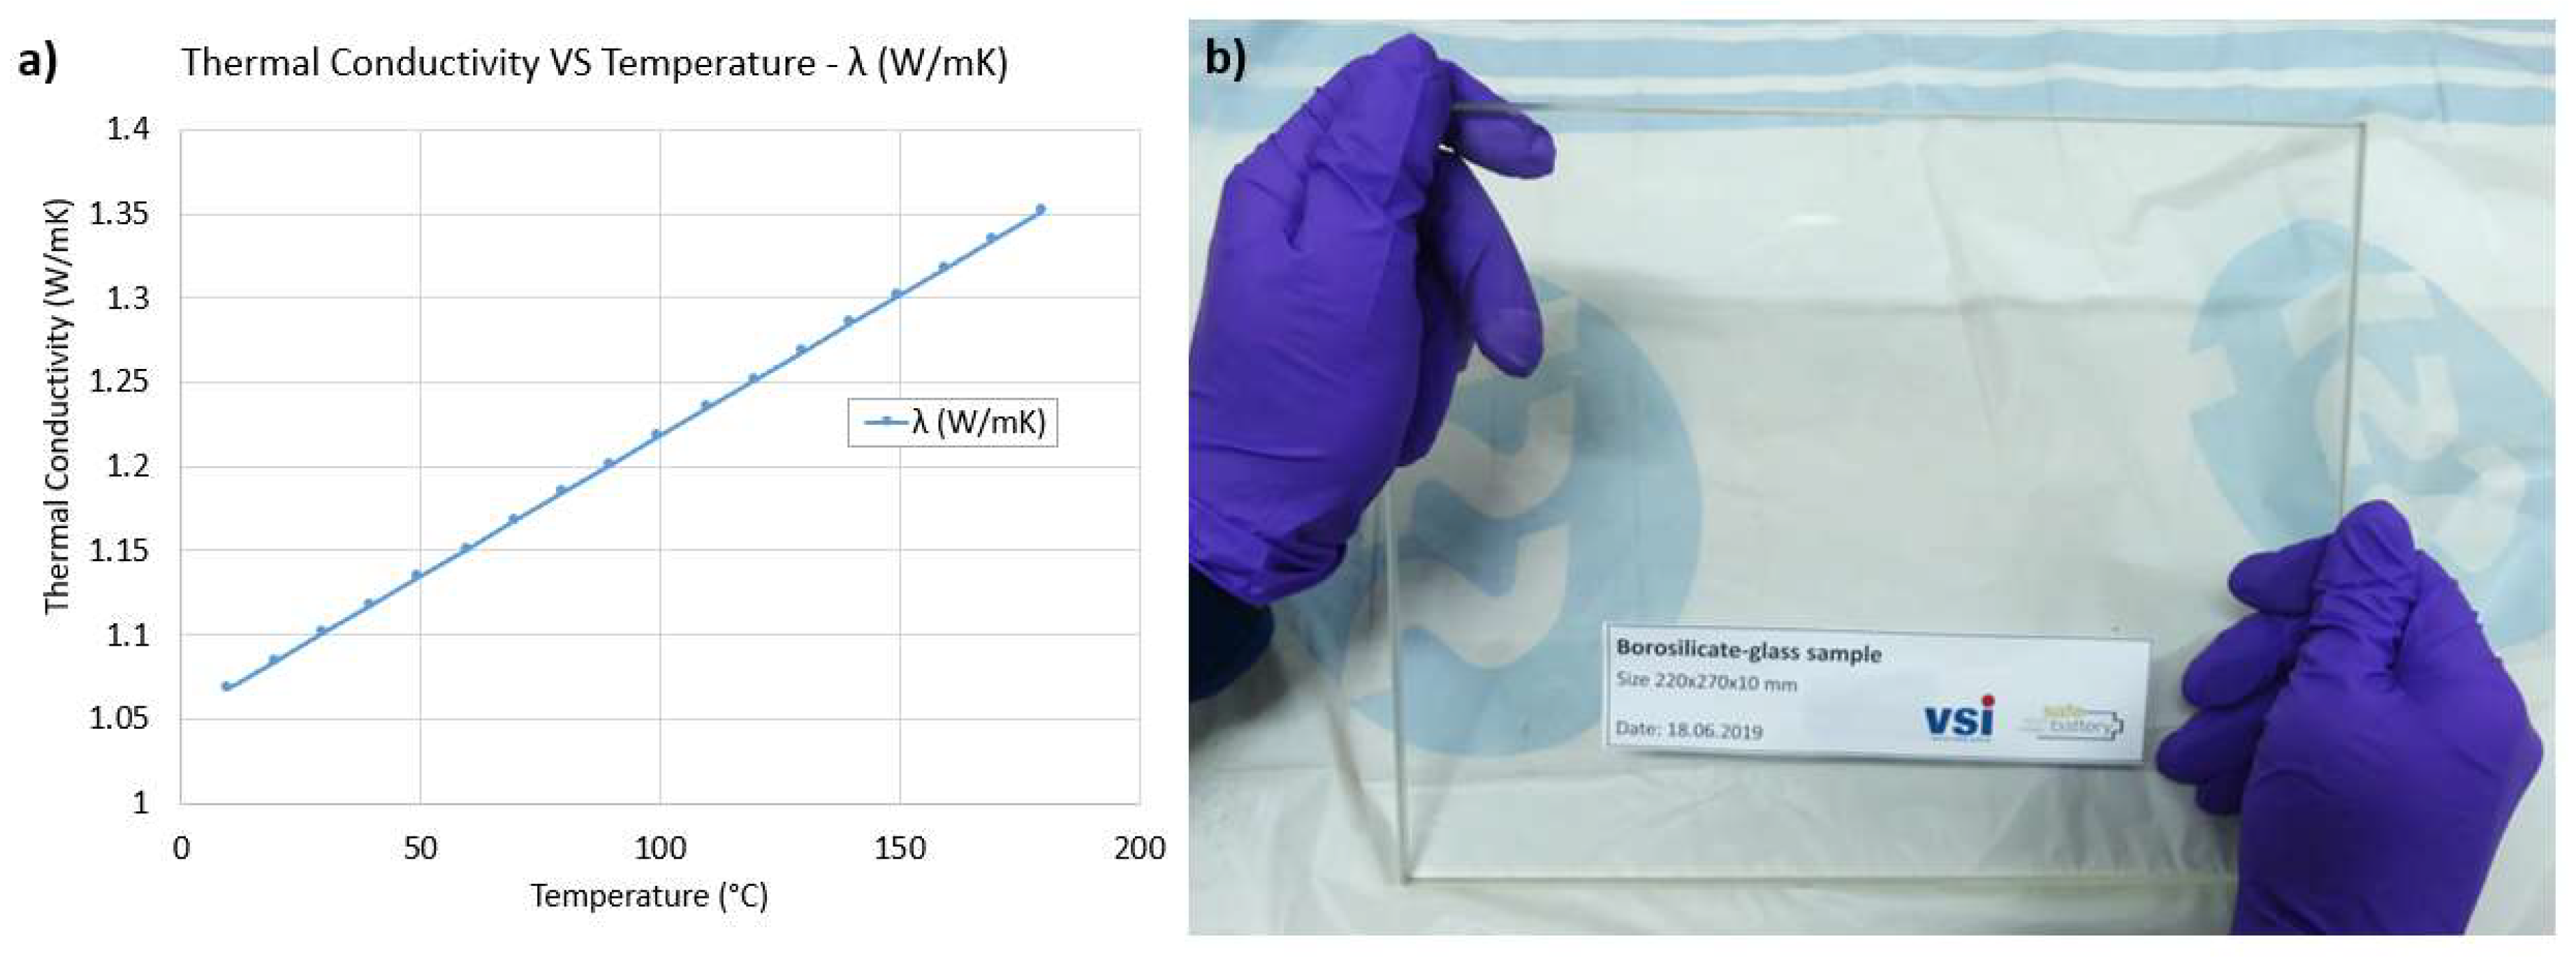
It is possible to find thermal data about Pyrex material from the literature, for example, in the work of [13], the thermal conductivity versus temperature of the same material composition (from Table 1) and a picture of the sample under test are shown in Figure 5.
The size of the Pyrex sample used for the transversal and longitudinal thermal conductivity measurement validation was 220 mm × 270 mm × 10 mm, similar to the size of the investigated battery. The computation of the transversal thermal conductivity was performed as described in Section 3.1. The results of temperature drops and heat fluxes in the steady state condition, as well as geometrical information, are reported in Table 2.
The nominal result value shows a deviation of 1.63% (Sample 2) from the nominal value of the reference material reported by the datasheet. The material temperature during the test was spread over a range of ≈ 10 °C and, for this reason, in order to compare the results with the material datasheet—where, for each value of temperature, there is a unique thermal conductivity value (Figure 5)—the test average temperature was considered. Just one of the two longitudinal cases (“u” and “v”) was evaluated owing to their similar measurement concept. In Table 3, the reference test results along the longitudinal direction are reported. As shown in Section 3.2, it is possible to compute the final values.
The longitudinal direction measurement shows a deviation from the expected datasheet value of ≈7.7%. Also, for this case, the datasheet value was chosen to take into account the average temperature value of the sample during the test (Figure 5). The Pyrex material was assumed to have perfect isotropic thermal conductivity.

4. Results

4.1. Preparation and Inspection of Samples

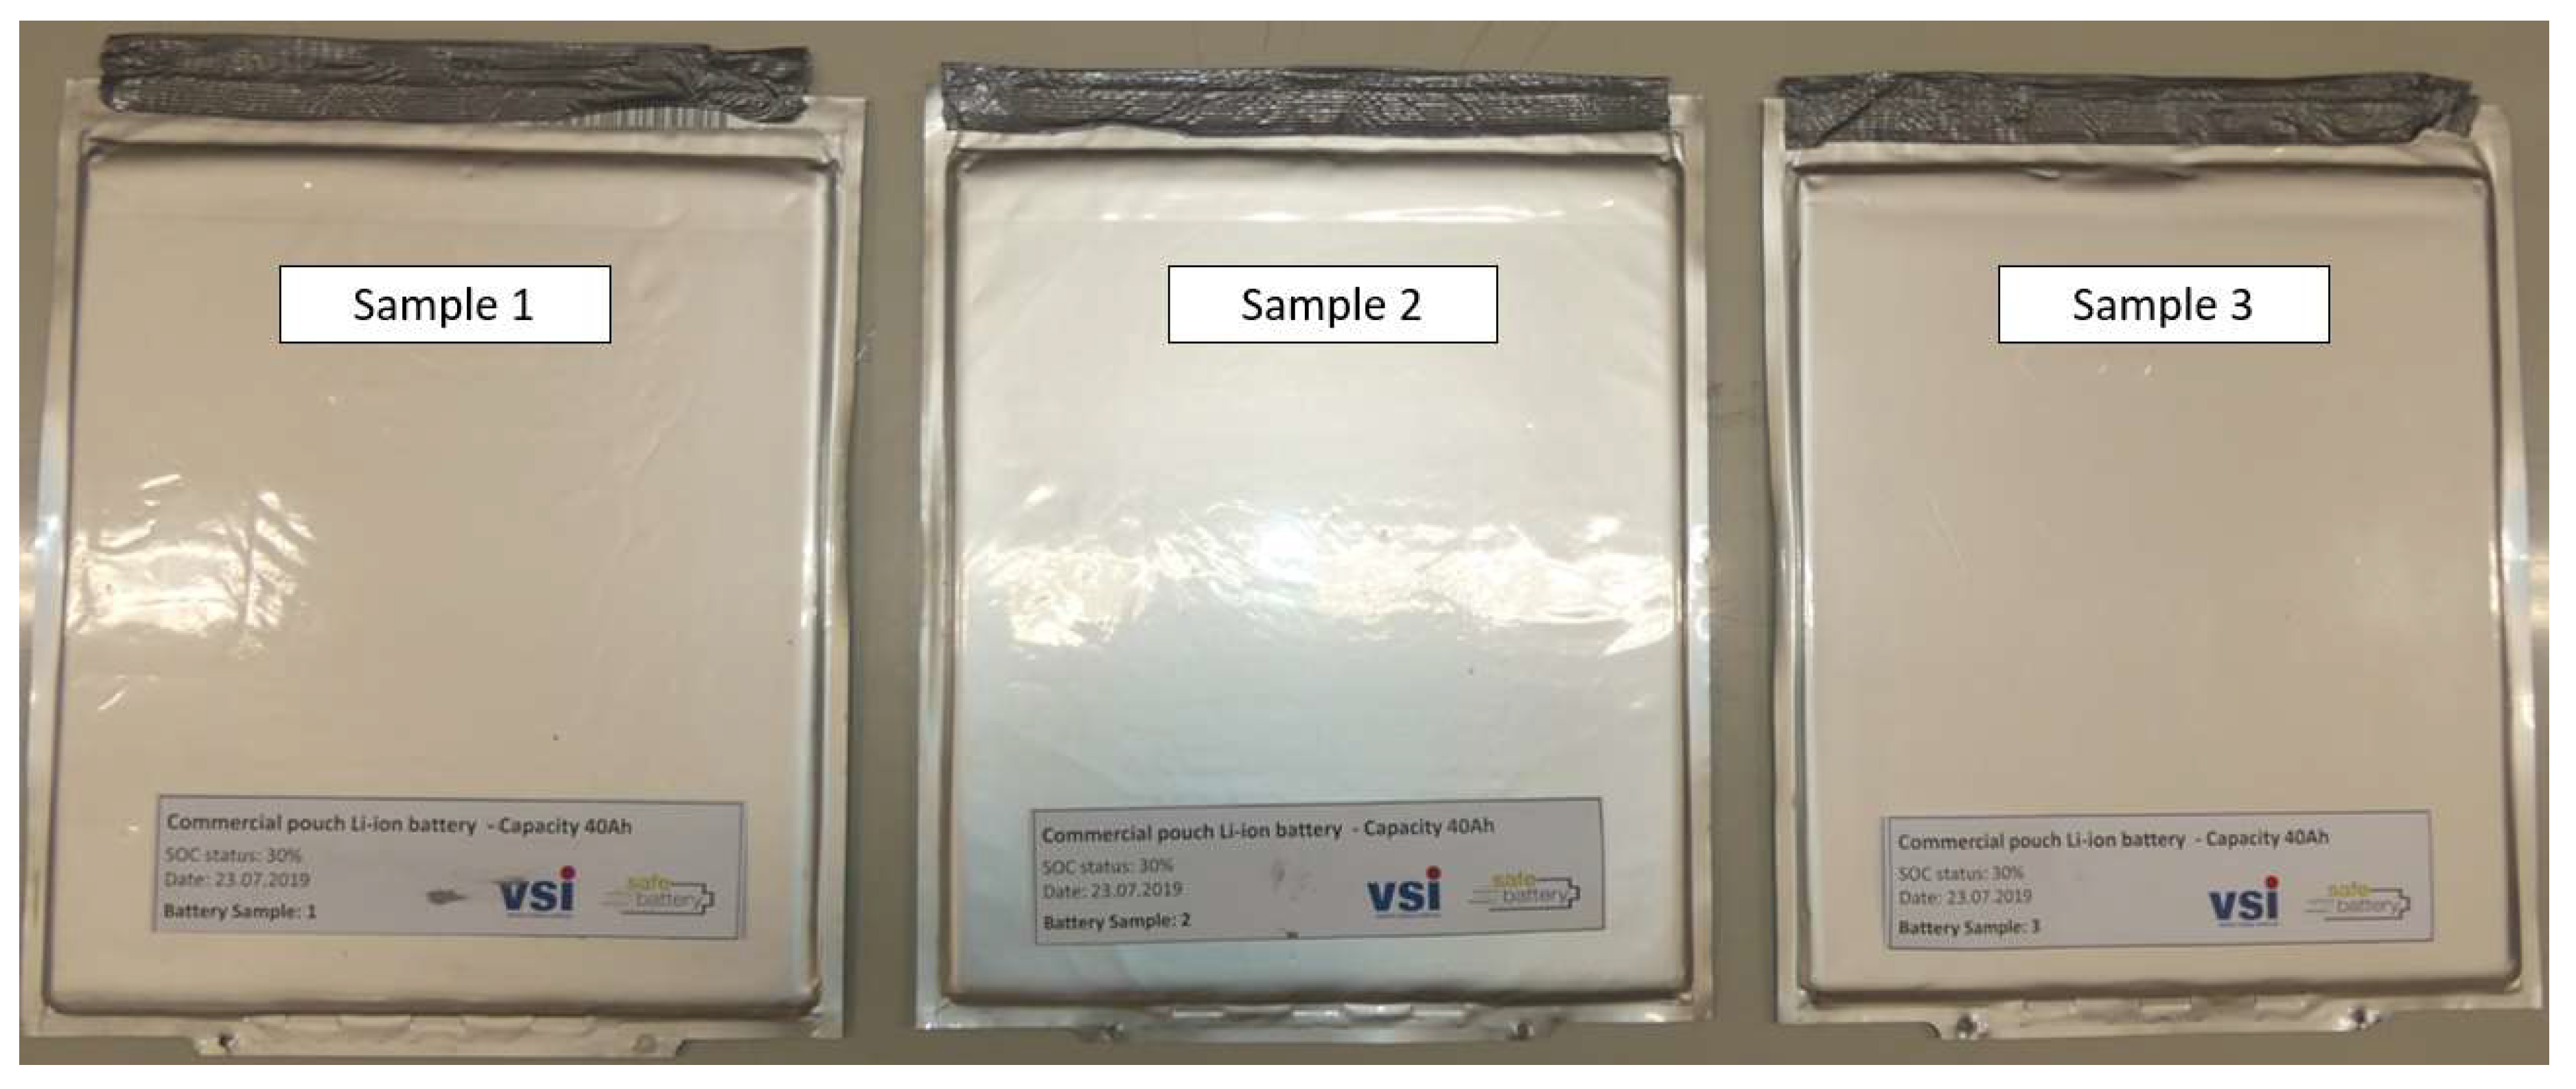
For the measurements, three battery samples were used. The battery samples were obtained from disassembling a complete battery pack; the complete procedure can be found in the work of [11]. The samples were all fresh (none with electrical ageing) and from the same battery pack. The electric tabs were covered with tape during testing to prevent accidental short circuits. A picture of the samples is shown in Figure 6.
As a dependency between the thermal conductivity and the state-of-charge (SOC) of lithium-ion batteries has been reported in the literature [1], the samples were all set with a state-of-charge of 30%. As the first step, the batteries were discharged to 0% SOC, lowering the voltage to 2.5 V, and then, with a coulomb counter, the corresponding amount of charge–calculated as 41 Ah × 0.30 - was provided by 1C-rate in current controlled mode. The value of 2.5 V was obtained from the battery chemistry because a spinel NMC LMO lithium-ions battery exhibits a voltage range between 2.5 and 4.2 V. Because all battery samples were fresh, the capacity was assumed as the one declared by the manufacturer of 41 Ah.
Initial inspection showed, despite the equal state-of-charge and same ageing conditions, that sample no. 3 looked stiffer; it was later revealed to have a lower thickness and higher transversal thermal conductivity. This observed difference has been commented on in Section 5 and Section 6.

4.2. Thermal Conductivity along the “w” Direction

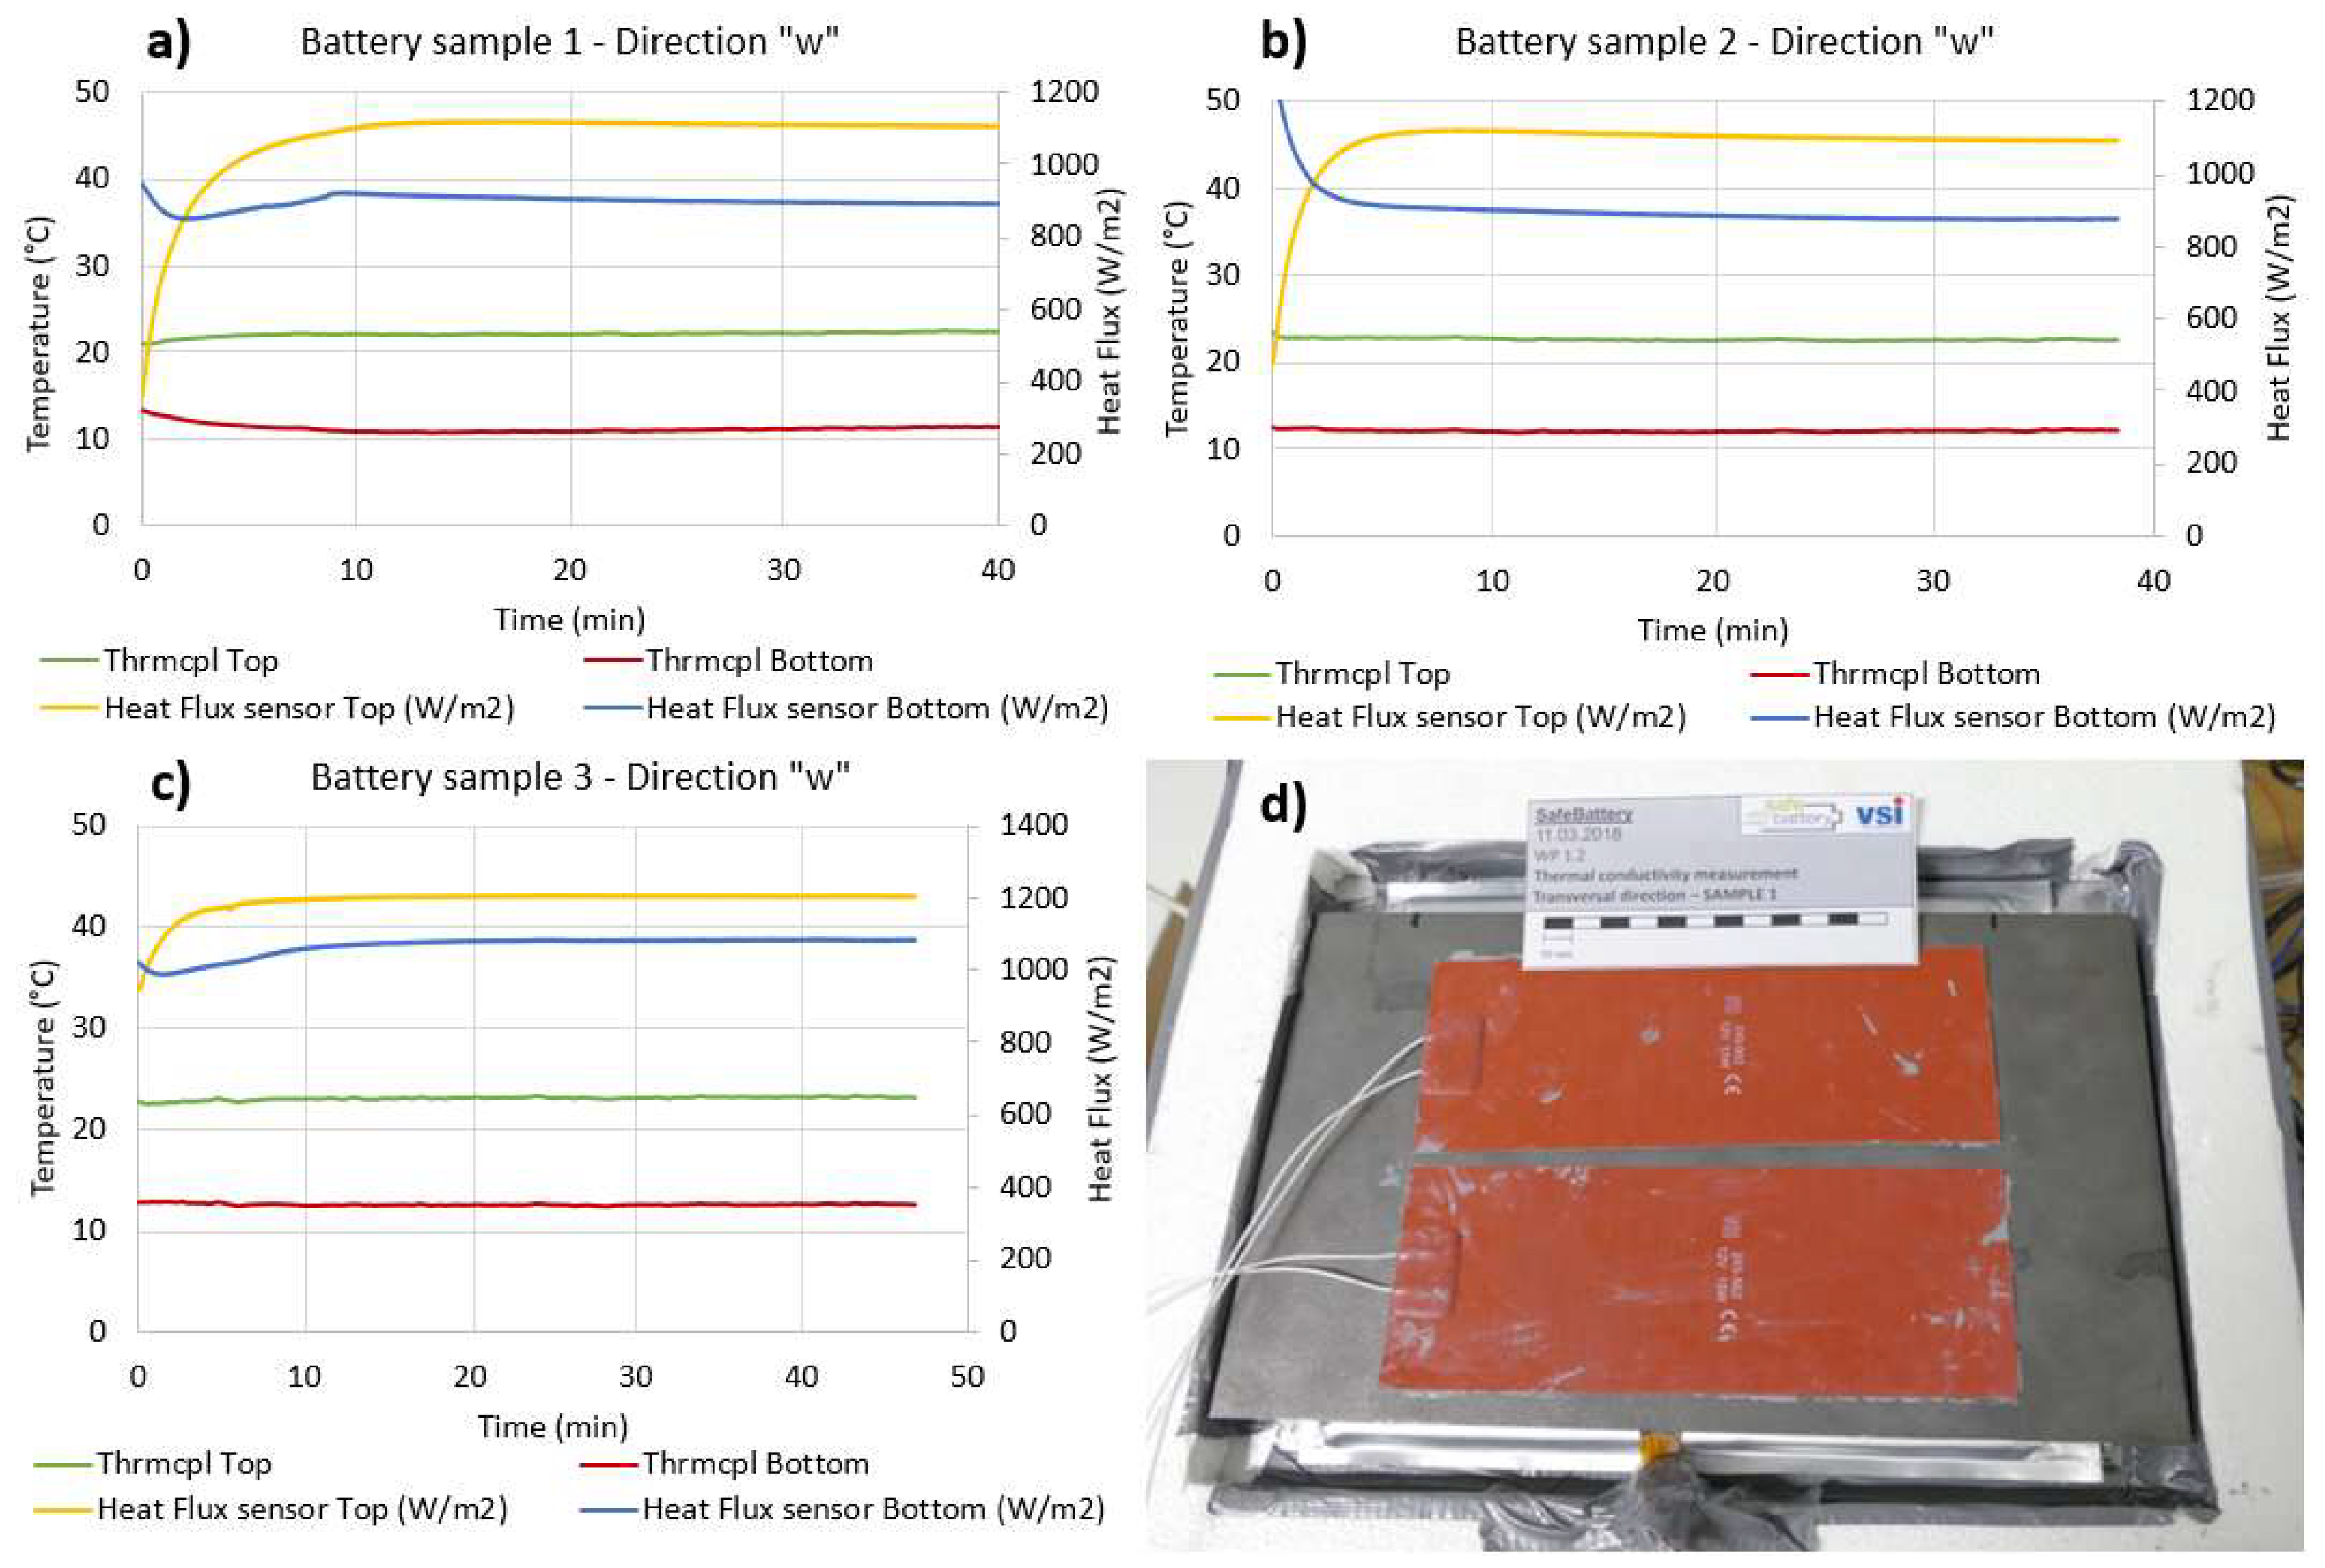
Referring to the orientation system indicated in Figure 2 and following the methodology described in Section 3.1, thermal conductivity measurements were performed on the three battery samples along the thickness direction (“w”). Figure 7 shows the plots of the measured temperature and heat flux curves for the three samples considered. It can be noted that the steady state condition is reached after approximately 30 min of testing.
The data of interest for the thermal conductivity computation are just the steady state values of the curves shown in Figure 6. The steady state temperature and heat flux values as well as the geometry parameters are needed for the thermal conductivity computation for each of the three samples. All the necessary values for the computation of thermal conductivity are reported in Table 4. Thermal conductivity can be computed from Equation (1). The propagated uncertainty of the final value was computed for each sample from Equation (5) and indicated as absolute and relative values.

4.3. Thermal Conductivity along the “u” Direction

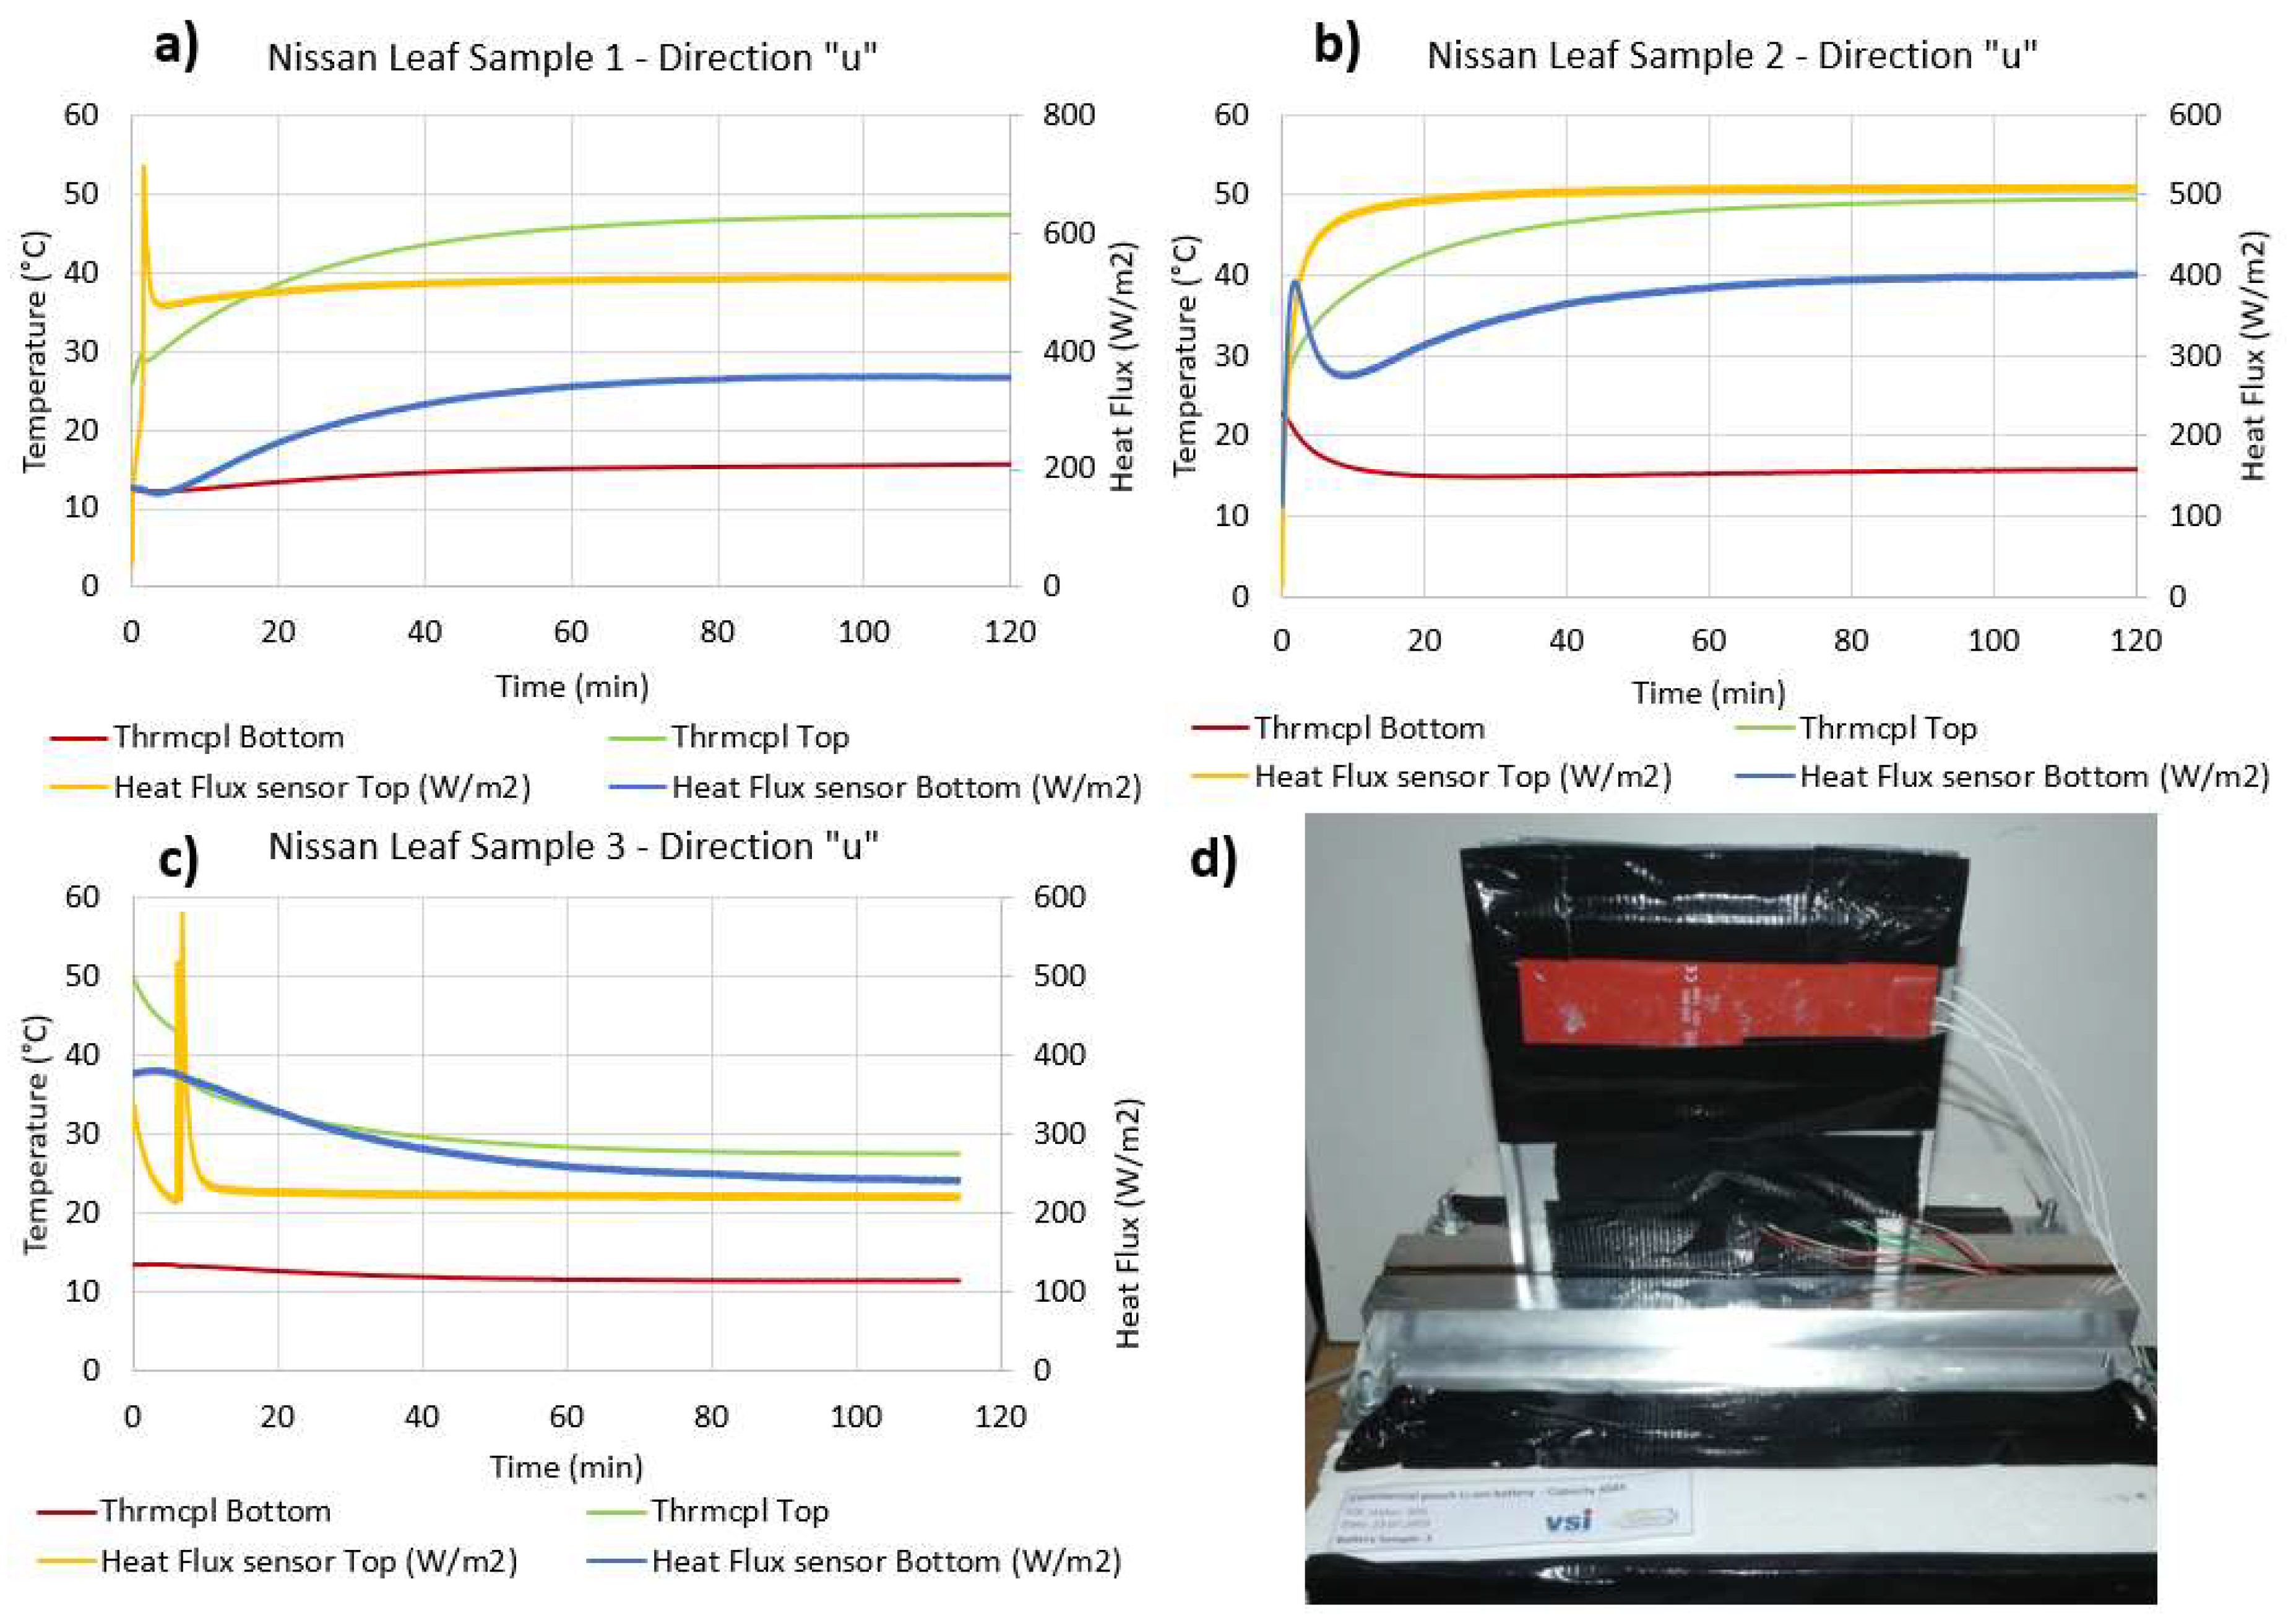
According to the methodology described in Section 3.2, the thermal conductivity of the three battery samples was measured along the “u” direction. The L-shaped connectors were clamped onto the battery sample before being tied to the temperature-guarded plate (in order to guarantee good contact pressure between all the parts). Figure 8 shows a picture of the test bench and the plot of the temperature and heat flux; the tabs of the battery are on top of the picture (covered with insulation tape).
The numerical values obtained in the steady state condition of temperature and heat flux as well as the final results are reported in Table 5. The computation of the thermal conductivity can be performed using the geometrical parameters (also reported in Table 5) and using Equations (2)–(4). The length of the “Volume of Interest” indicated in Figure 4a,b was abbreviated with “LenVol.Int.”.

4.4. Thermal Conductivity along the “v” Direction

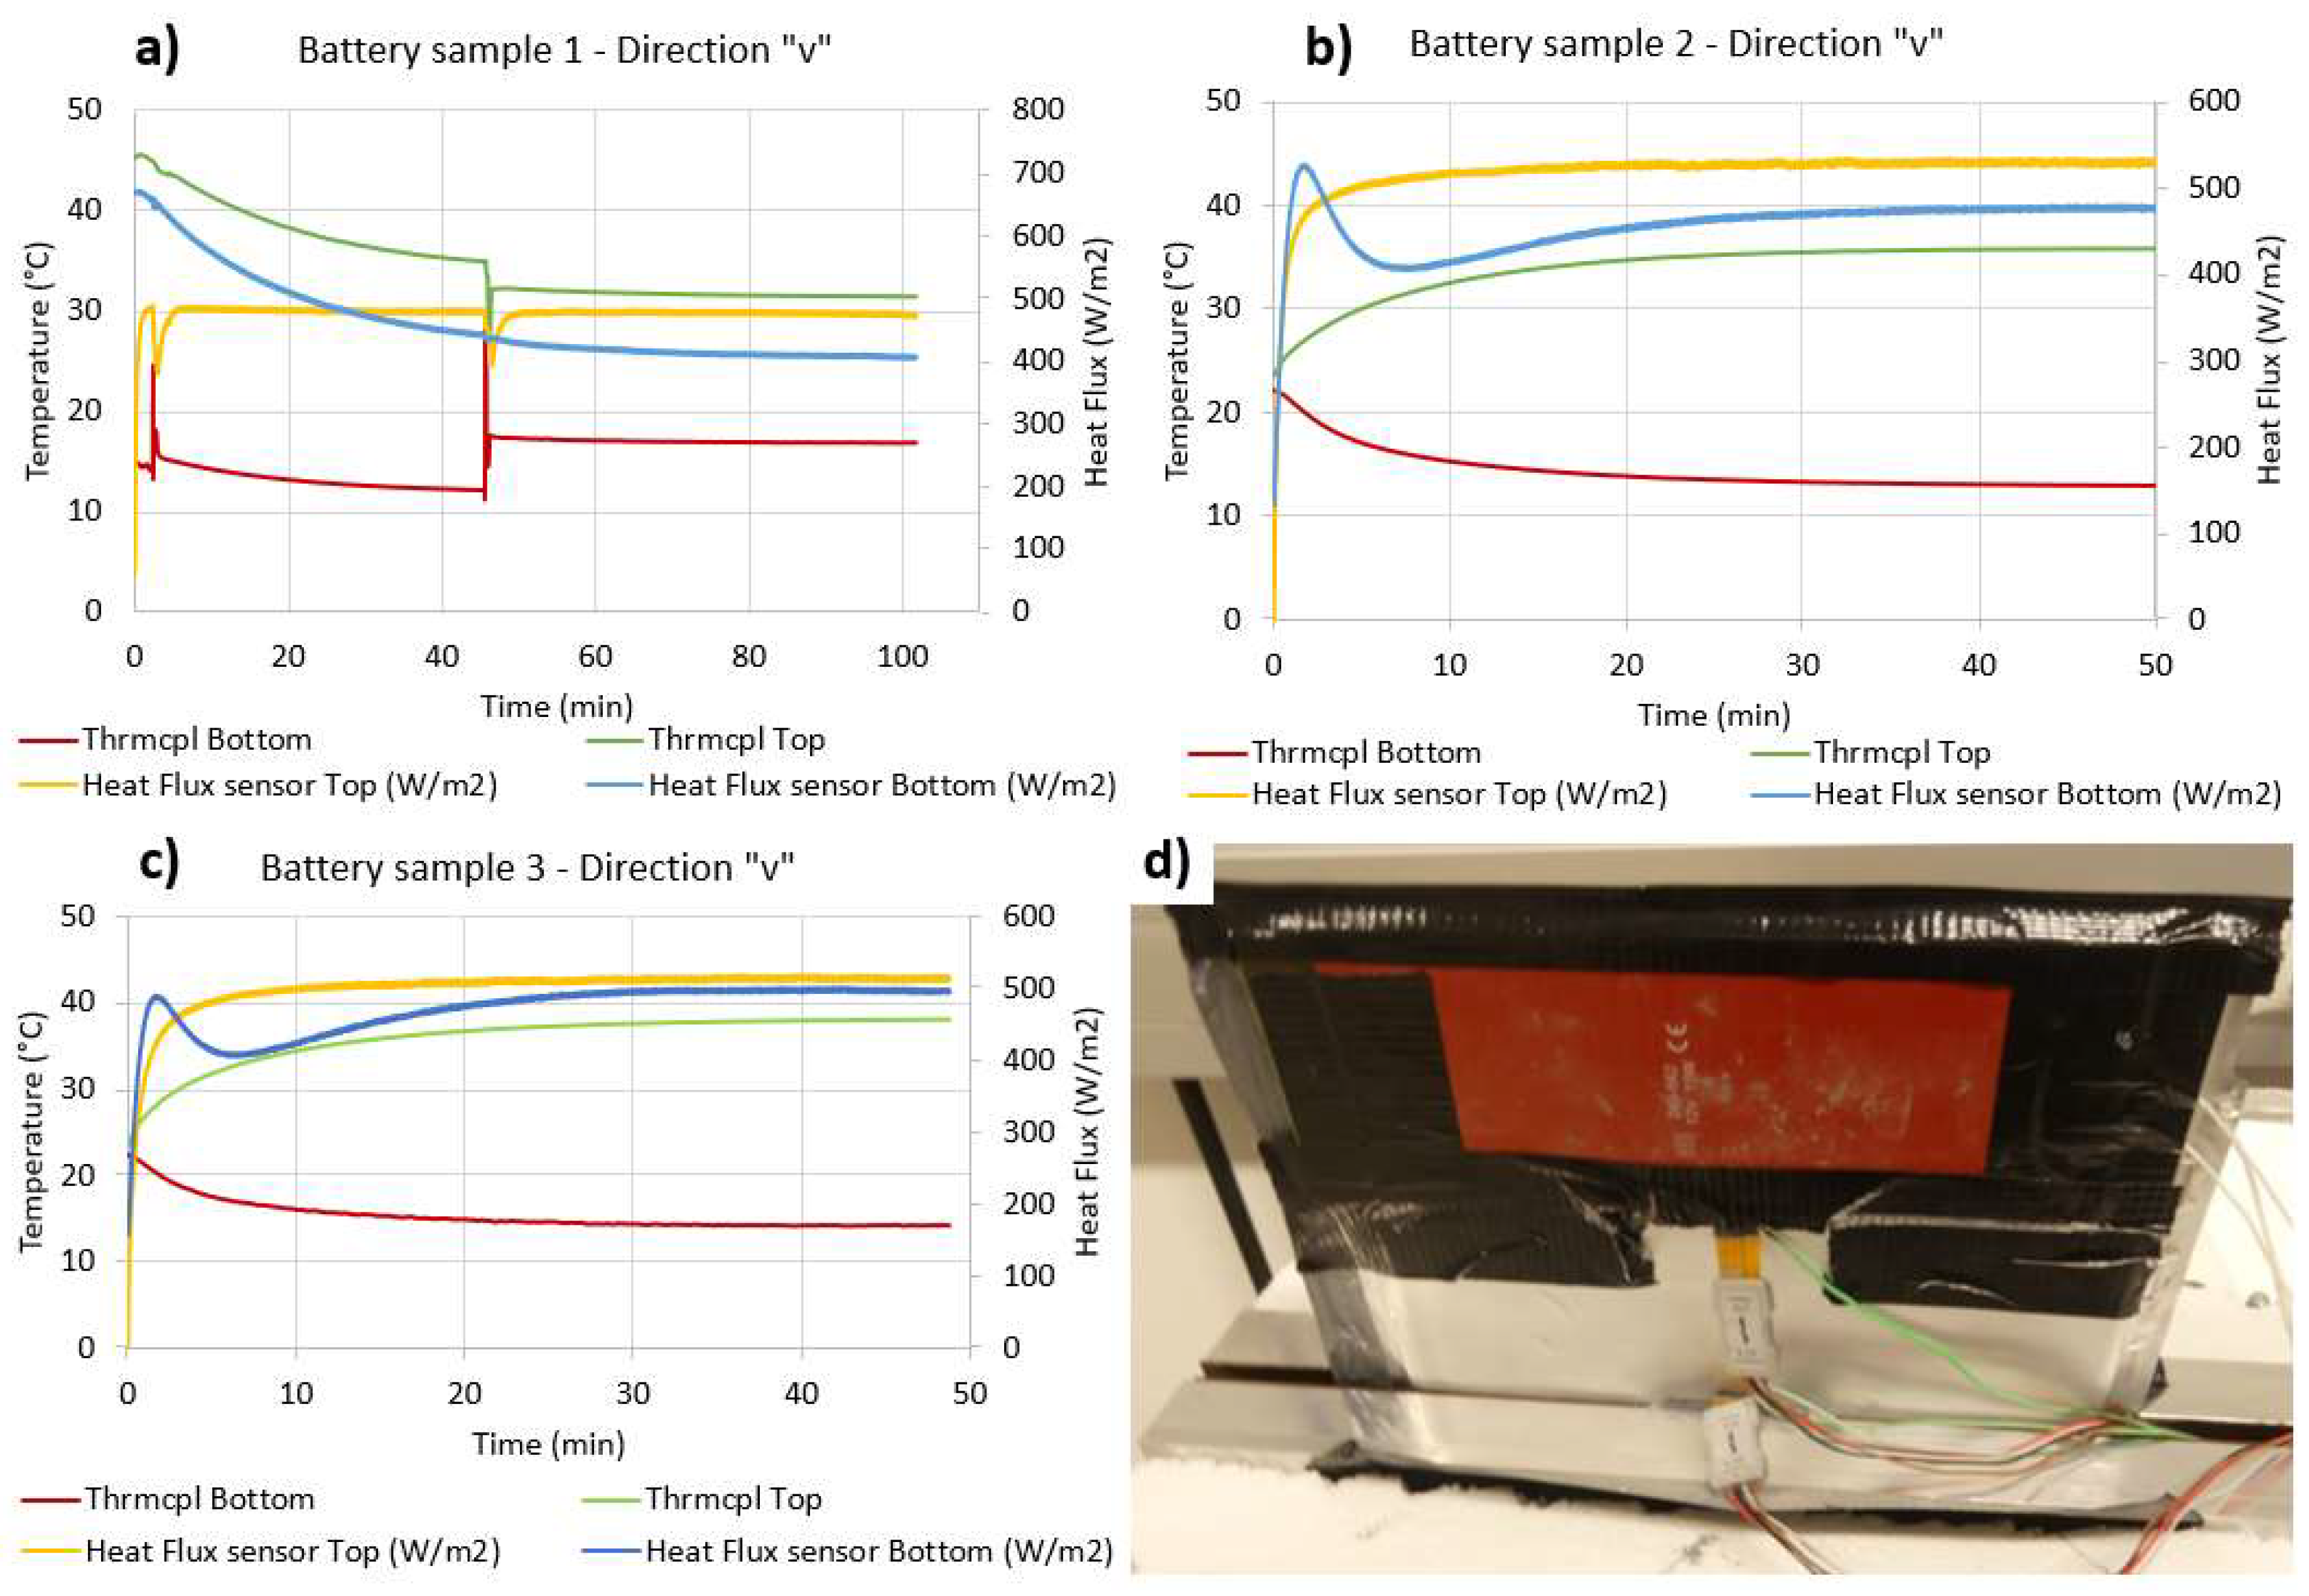
Similar to the measurement in the “u” direction, the battery was placed with L-shaped connectors on the temperature-guarded plate, with a 90° rotation around the “w” axis. Plots of the temperatures and heat fluxes are reported in Figure 9.
The numerical results are reported in Table 6 and the computation of the final values can be performed following the methodology of Section 3.2 and using Equations (2)–(4). The length of the “Volume of Interest” indicated in Figure 4a,b was abbreviated with “LenVol.Int”.

5. Results Discussion

The obtained values of thermal conductivity reported in Table 4, Table 5 and Table 6 are aligned with values found in the literature [6,7,9]. The thermal conductivity along the parallel directions “u” and “v” (average value: 25.64 Wm−1K−1) is higher than the one in the “w” direction (average value: 0.77 Wm−1K−1) to a factor of about ×35, this difference is clearly the result of the material properties of the layers and their orientation. An influence was expected owing to the cell tab connections (between current collectors) on the orthotropic thermal conductivity, but this influence is minimal, as can be observed in the nominal results obtained from the measurements along the “u” (average value: 25.55 Wm−1K−1) and “v” (average value: 25.74 Wm−1K−1) directions. An overview of the obtained results is reported in Table 7.
It is interesting to observe the difference between battery Sample 3 and Sample 1 and Sample 2, which shows a minor thickness and higher thermal conductivity along the thickness direction. From a first inspection, this sample (i.e., Sample 3) felt stiffer to the touch. A possible explanation for the difference in this sample could be a difference in the vacuum condition, which was stronger in the stiffer battery, thus increasing the rigidity and compacting the internal layers with an increase of thermal conductivity along the thickness direction. This geometrical difference is also visible in Table 5 and Table 6 as the difference in the battery section for the thermal conductivity computation. The amplitude of the temperature gap has a strong influence on the measurement uncertainty, as can be observed in Table 5: the temperature gradient applied to the Sample 3 is about half with respect to the other two samples, raising the measurement uncertainty from ≈11% to ≈17.5%. This last statement finds mathematical application in Equation (5).

6. Conclusions

An experimental, non-destructive methodology for the measurement of orthotropic thermal conductivity of pouch Li-ion batteries was discussed. The presented methodology introduces the possibility to measure the thermal conductivity in every direction directly on the sample. The outcome of this paper could be subdivided into two parts: a temperature-guarded plate device description (suitable for thermal conductivity measurement) and thermal data of a commercial lithium-ion pouch battery. The presented measurement methodology does not need a laboratory equipped to manage hazardous or chemical substances because it is not necessary to disassemble the battery. This makes this measurement methodology affordable, easy to implement, and relatively fast as one test requires approximately 30 min. Furthermore, because the analyzed samples are commercial Li-ion pouch batteries with state-of-the-art chemical composition, the provided thermal conductivity data are meant to be a useful input for simulation purposes. As already mentioned in the previous chapter, one battery sample was stiffer than the others, presumably owing to a difference in its vacuum condition. As the batteries were all fresh and obtained from the same battery pack, a hypothesis to explain this difference could be that the manufacturer assembled the battery pack using batteries from different batches.
The effectiveness of the test-bench was proven with a preceding reference material test along the thickness and longitudinal directions, obtaining results with deviations from the datasheet values of 1.63% and 7.69%, respectively. Therefore, thermal conductivity measurements were carried out on a set of three samples of commercial Li-ion pouch batteries for a total of nine measurements. Regarding the accuracy of the measurements, a comparison with other non-destructive methods [6,9] has been performed. In “Murashko et al.” [6], a measurement method, which uses transient analysis, is described, evaluating thermal conductivity only on the thickness direction. However, in “Murashko et al.”, the uncertainty relative to a single measurement is indicated as higher than 5% (the exact number is not explicitly specified). In “Jianbo Zhang et al.” [9], accuracy is evaluated comparing experimental tests with simulation output and no exact values are mentioned regarding the propagated uncertainty of the thermal conductivity measurements.
For future investigations, a higher temperature range would improve the accuracy of the results because the measurement uncertainty of the presented method is strictly dependent on the amplitude of the temperature gradient applied to the battery, as indicated by Equation (5). Furthermore, the integration of more accurate temperature sensors can improve the final measurement accuracy. The presented measurement methodology also finds possible application in the new frontier of batteries, such as “solid state batteries”, where the operative temperature range is even higher than the batteries with liquid electrolyte [14,15], allowing to improve the accuracy of the measurement. In general, the presented measurement method can be applied to any material wherever it is possible to force a temperature gradient on it to obtain the steady state condition.

Author Contributions

Conceptualization, L.A.; methodology, L.A.; investigation, L.A.; writing—original draft preparation, L.A.; writing—review and editing, G.K., B.B., M.S. and G.G.; review and supervision, W.S.; project administration, C.E. All authors have read and agreed to the published version of the manuscript.

Funding

This work originates from the research project SafeBattery. The K-project SafeBattery is funded by the Federal Ministry for Transport, Innovation, and Technology (BMVIT); Federal Ministry of Digital and Economic Affairs (BMDW), Austria; and the State of Styria within the program COMET—Competence Centers for Excellent Technologies. The COMET program is administered by the FFG.

Acknowledgments

I would like to thank all of my colleagues for the good team work and the final effort to achieve the objectives. I want to thank Alexander Hödl for being an indispensable guide in the laboratory and also my PhD supervisor Wolfgang Sinz. The author would like to thank the consortium members of the SafeBattery project for their valuable input in this work.

Conflicts of Interest

The authors declare no conflict of interest.

Appendix A

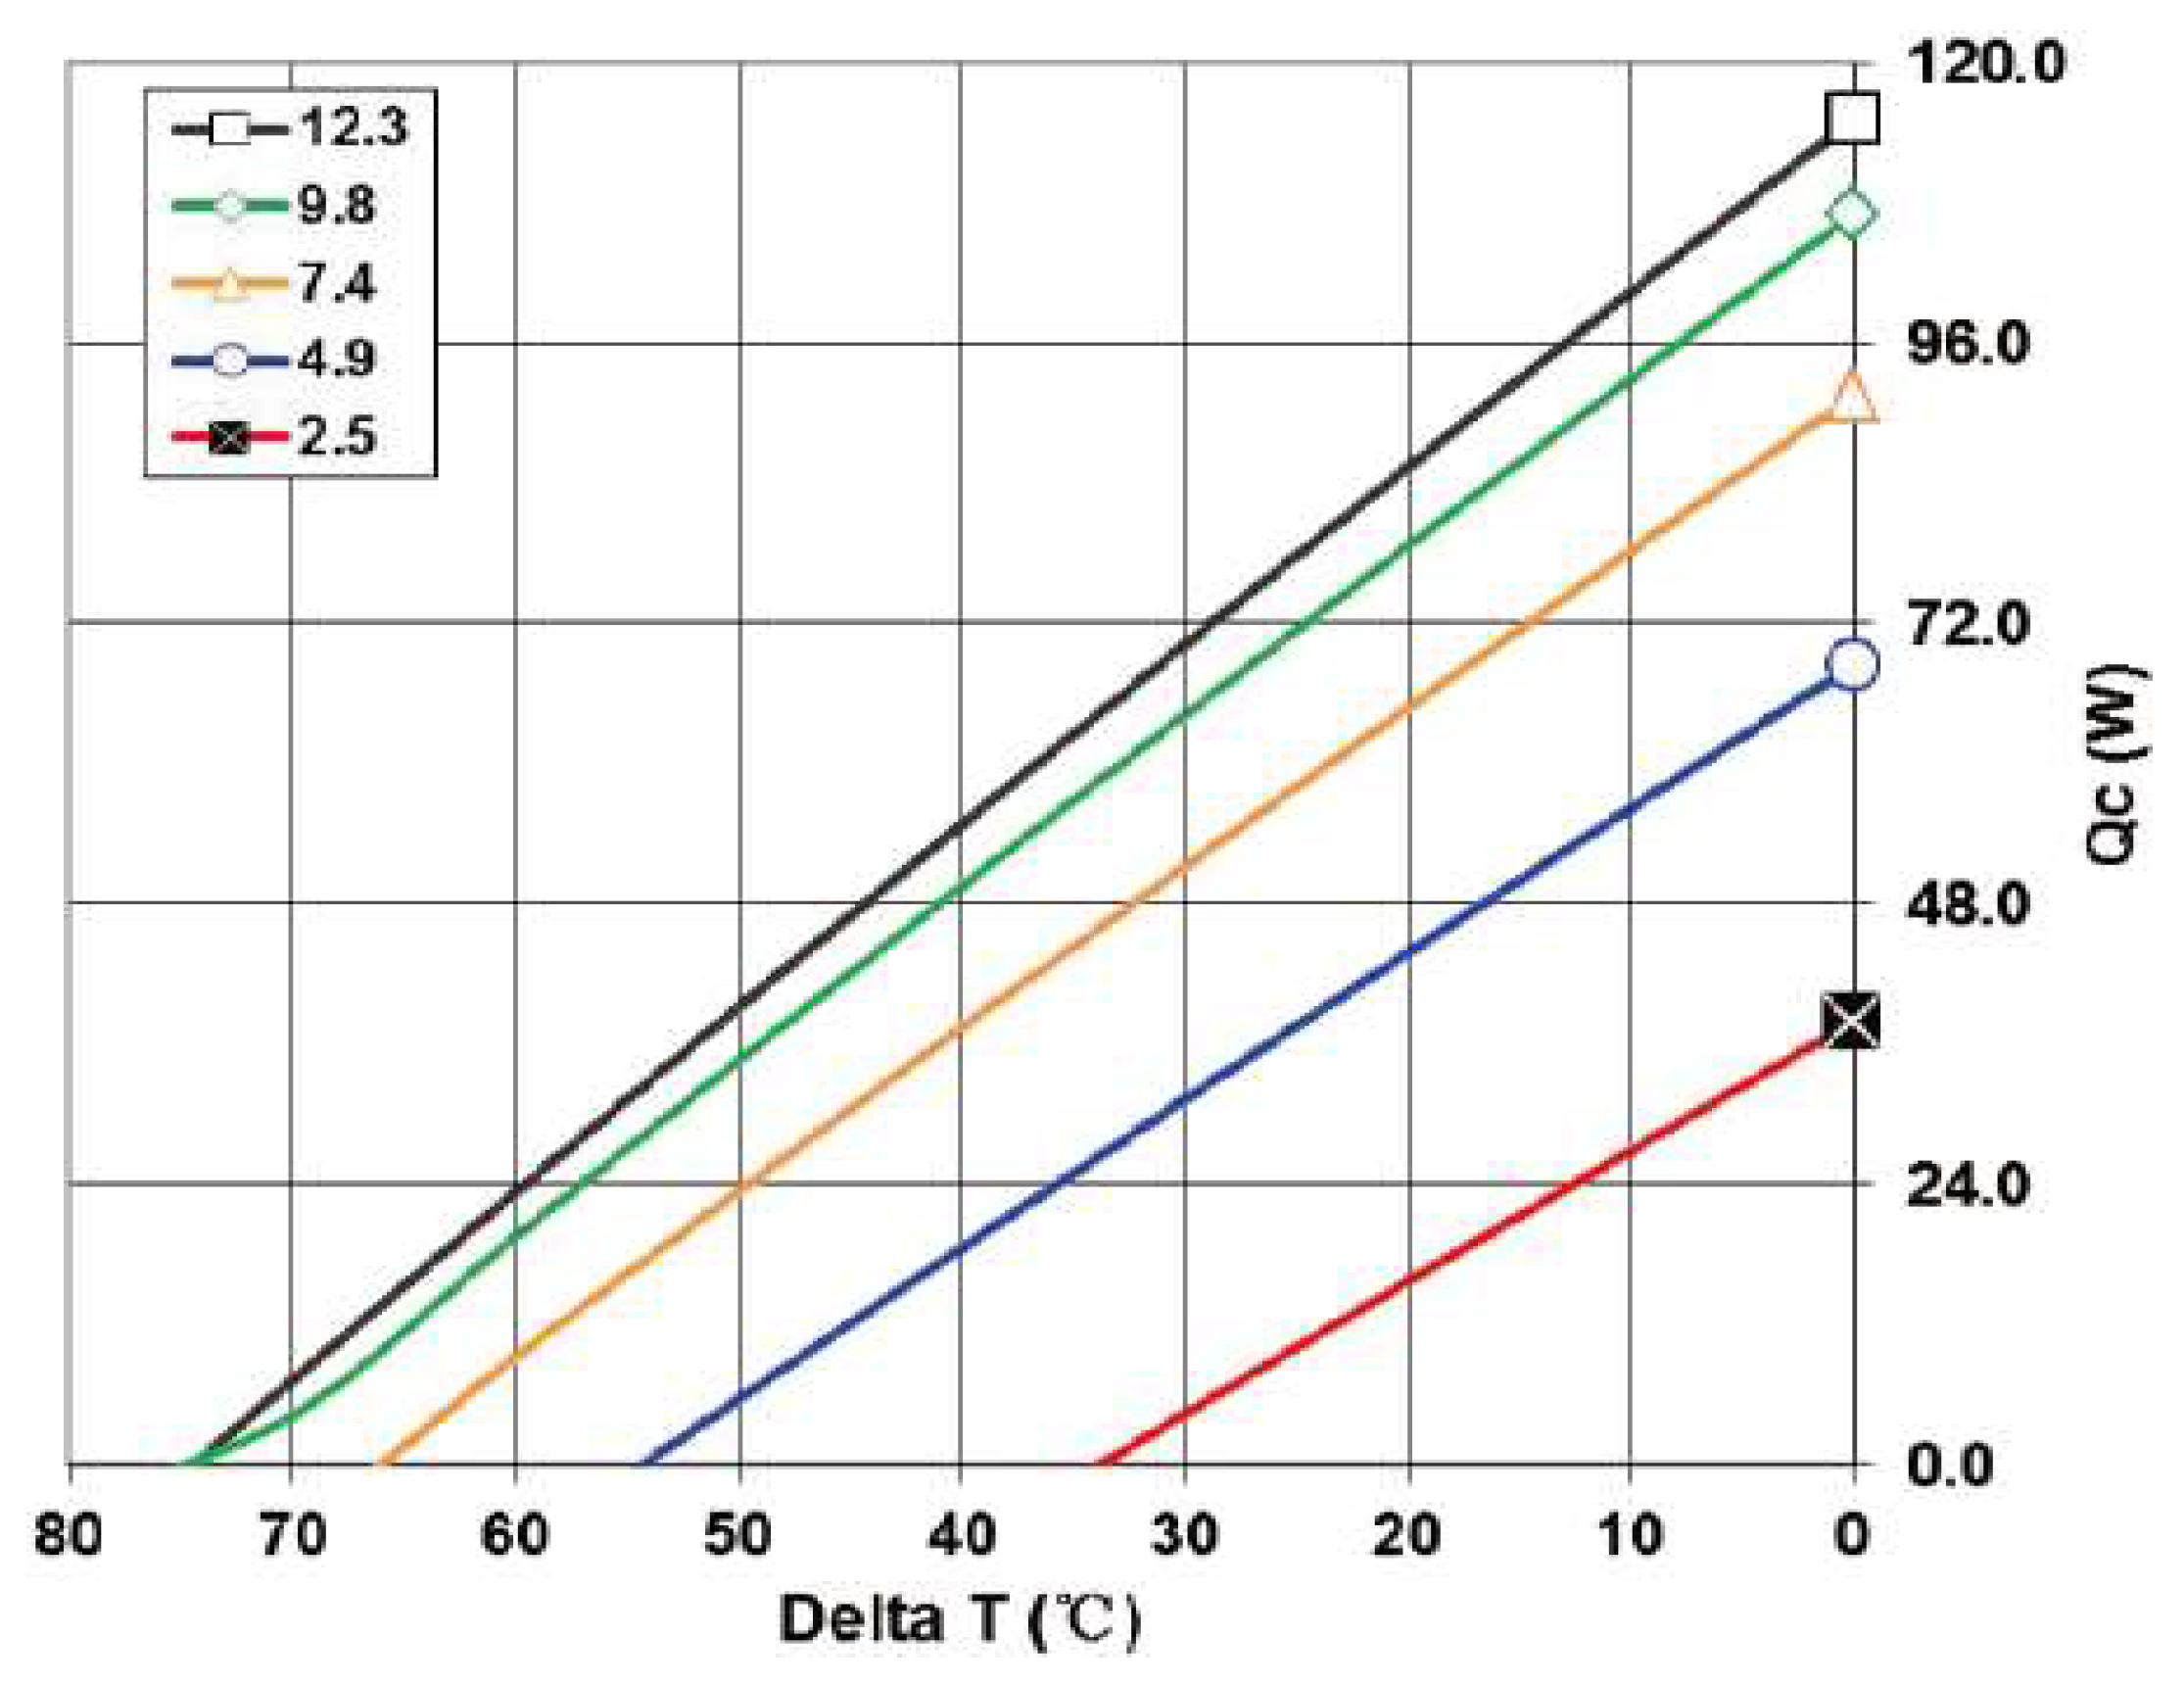
The Peltier plate assembly is shown in Figure 1 in Section 2.1. The main components of the device are the Peltier elements, the aluminum plate, and a set of heat sinks. The Peltier elements are spatially homogeneously distributed and attached to the aluminum plate by means of suitable sockets milled in it. Electrically, the 12 Peltier elements are connected with a 2p6s configuration and supplied by an AC/DC controllable power supply. Digital temperature sensors “DS18B20” with an accuracy of ±0.5 °C are placed under the aluminum plate (on the same side of the Peltier elements) in order to monitor the aluminum plate temperature (in suitable holes drilled in it). Another set of six temperature sensors were also placed in the heat sinks as the control system algorithm is based on the measurement of the temperature difference across the Peltier elements. The datasheet of the Peltier elements provided by the manufacturer reports the dependency of the generated heat flux on the electrical voltage applied and the actual temperature drop on the thermoelectric elements. This is expressed in Figure A1.
Figure A1. Graphs describing the behavior of the heat flux generated by the Peltier cells and its dependency on the electrical voltage and the actual temperature gradient across the active element. The heat flux in Watts is reported on the y-axis, the temperature drop on the Peltier element is shown on the x-axis, and each curve represents one voltage working point condition.
Batteries 06 00010 g0a1
It can be noticed in Figure A1 that the slope of the different curves is quite similar. On the basis of this observation, it was assumed that the heat losses are mainly the result of the temperature gradient across the Peltier element, because, for natural conduction, a “reverse” heat flux flows against the active direction. From this assumption, it was possible to formulate a heat balance equation where the losses are proportional to the temperature drop across the Peltier cell (Equation (A1)). The balance equation for the implemented control loop is reported in Equation (A1).
Q n e t = Q c m a x ( V ) Q l o s t ( T h o t T c o l d ) Q O t h e r L o s s e s
Qcmax represents the heat flux values for Delta T equal to zero (y-axis in Figure A1), Qlost represents the heat losses for natural conduction, QOtherLosses represents other losses modeled as a constant offset value (for manual calibration), and Qnet is the net heat flux reaching the aluminum plate. For example, looking at Figure A1, for an applied voltage of 2.5 V (red curve), the heat flux losses are equal to the heat flux generation (or Qcmax) for Delta T = 33 °C (working point on the x-axis). This means that, when the device is turned on (so Delta T is equal to zero), Qlosses are minimal and the electrical power provided to the Peltier cells is considered equal to the heating (cooling) power. Going on with the experiment, the DeltaT increases, as do the losses, thus reducing the effective heat flux that reaches the target object (aluminum plate). On the basis of this pre-calculation of the heat flux (feedforward), the feedback loop was implemented.
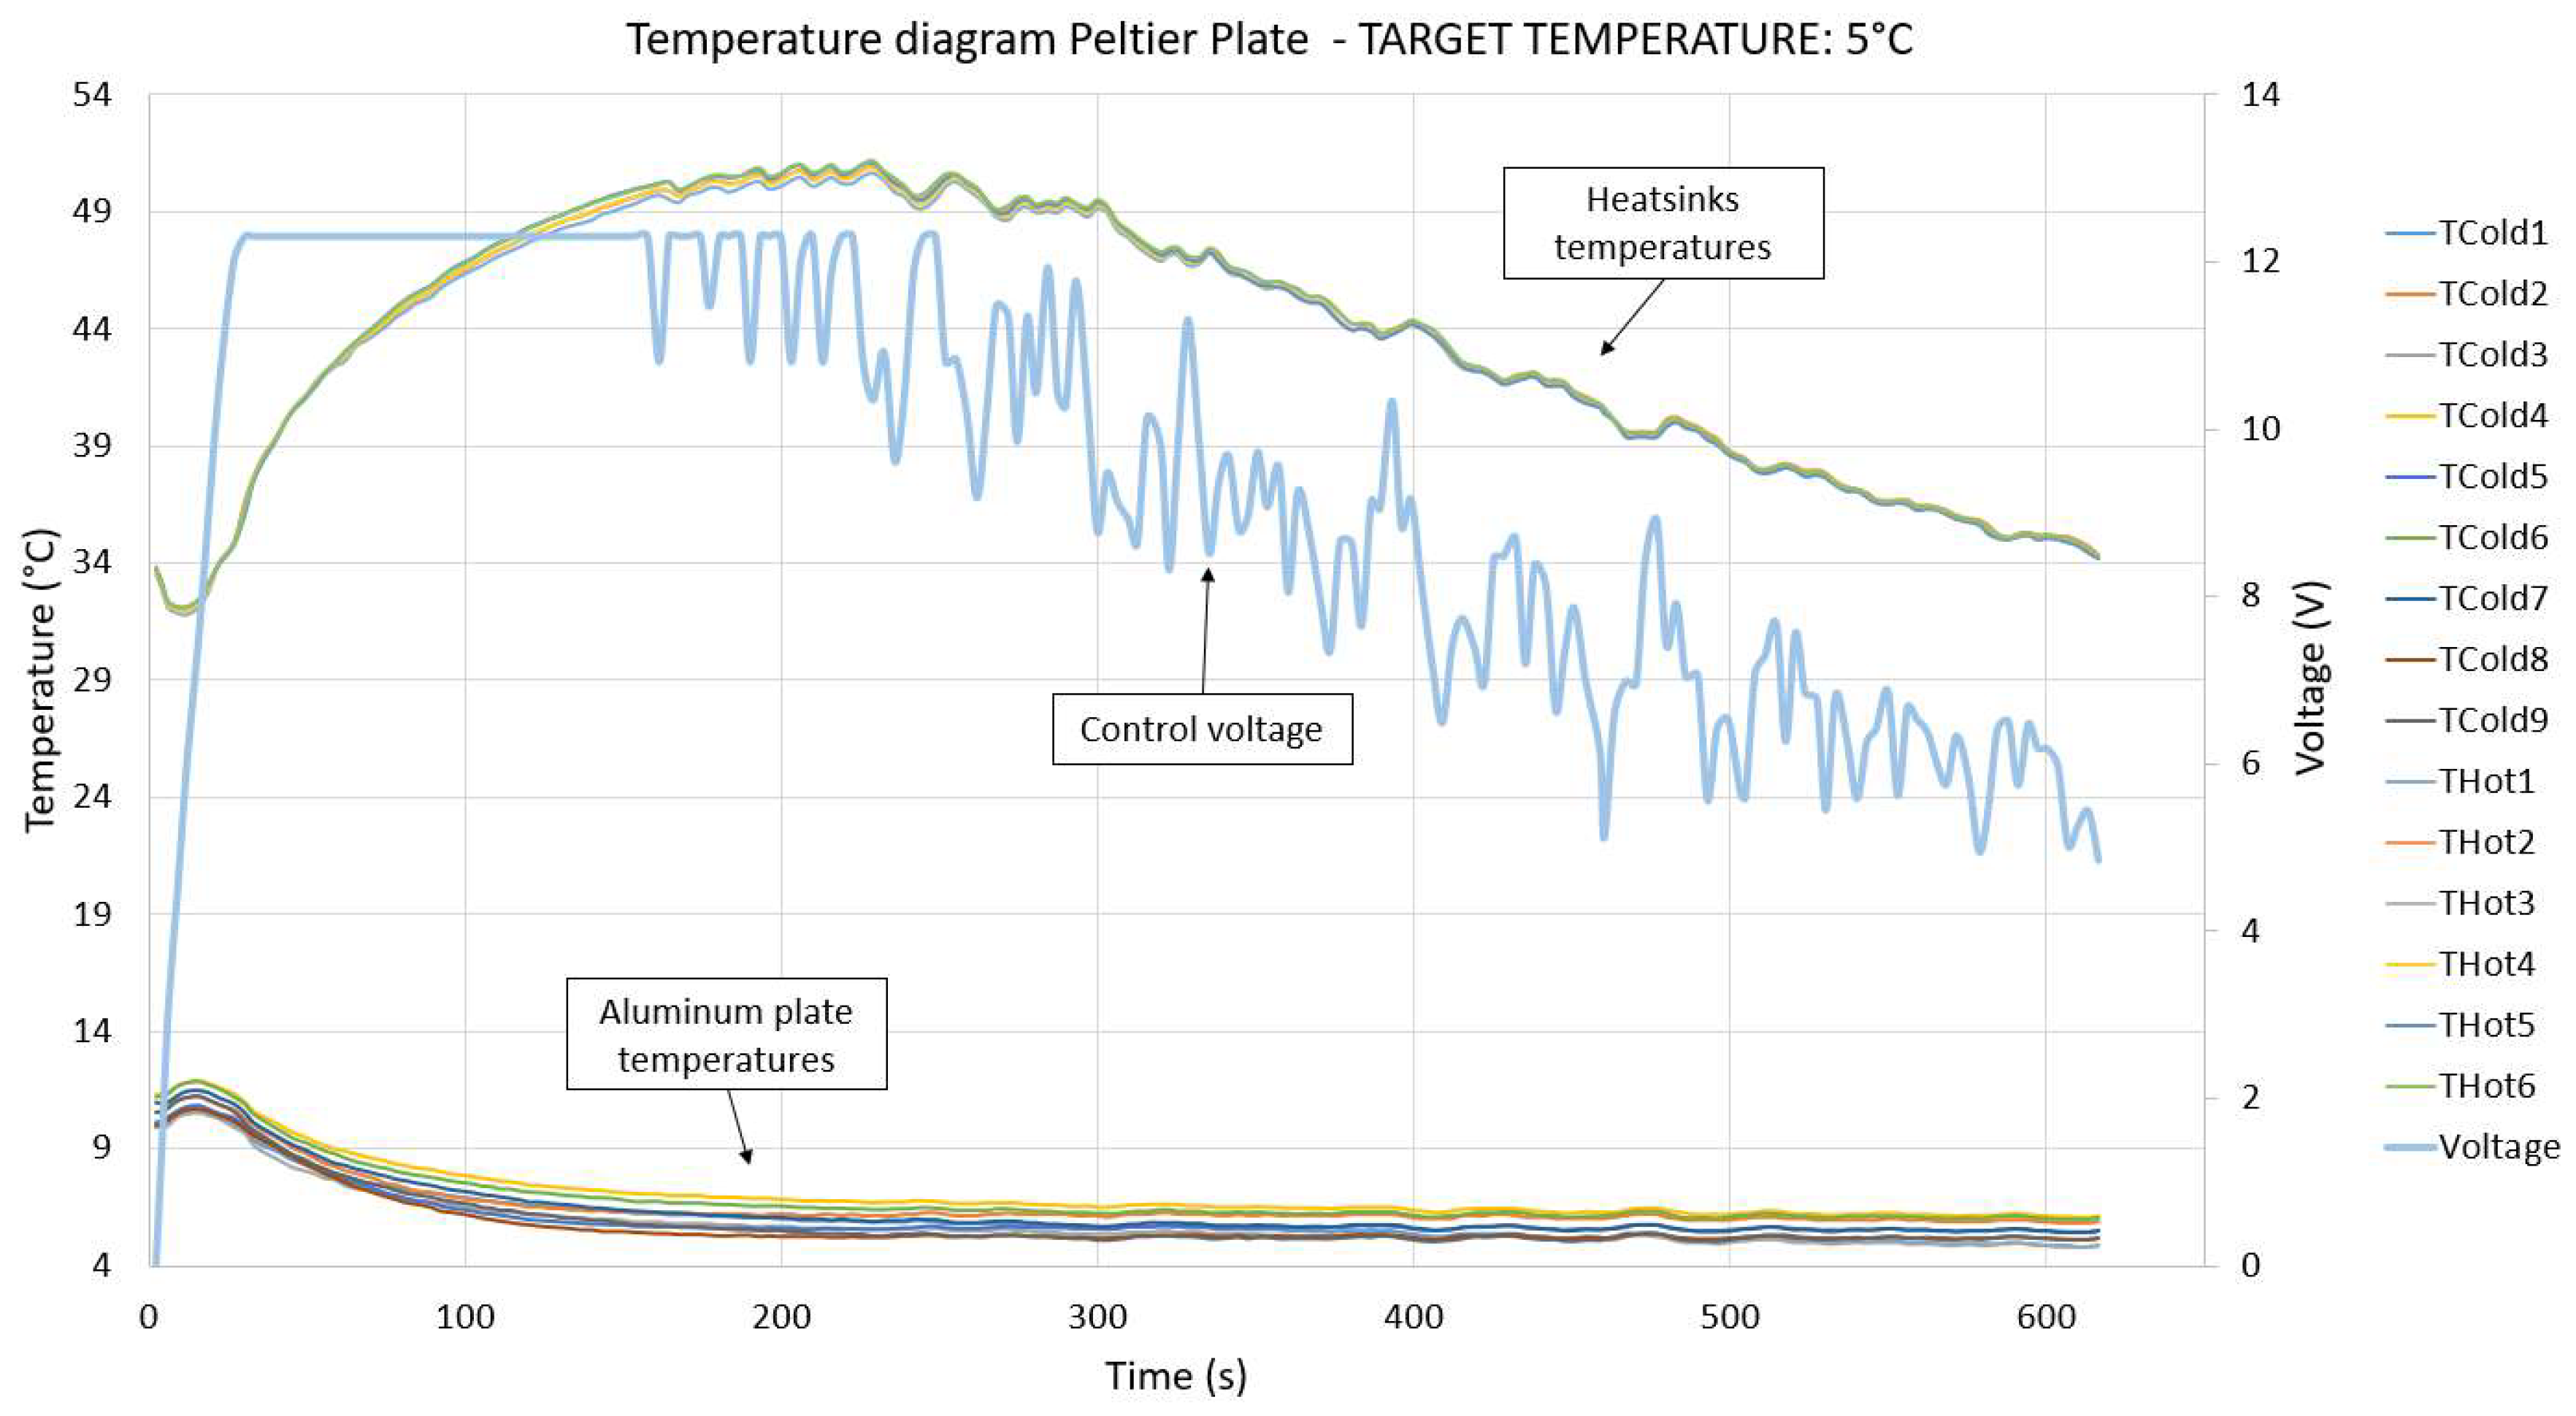
During operative conditions, the Peltier elements cool down the aluminum plate and warm up the heat sinks, hence the heat produced is exhausted (through the heatsinks), keeping the temperature on the cold side of the Peltier elements stable. Inverting the voltage on the Peltier elements would allow the process to be inverted and warm up the plate while keeping the same assembly; however, this case is not needed for this study. For the test in question, it was required that the aluminum plate be at a temperature lower than the room temperature. Regarding the temperature gradient on the plate surface, a preliminary test for calibration of the control system was conducted. Tests results are provided in Figure A2.
Figure A2. Transient of temperature and voltage of the Peltier plate sensors during the calibration test. The control system regulates the voltage on the Peltier elements in order to reach the temperature of 5 °C on the plate. The room temperature was stable and approximately 20 °C.
Batteries 06 00010 g0a2
The initial temperature, as shown in Figure A2, already presents a temperature drop on the Peltier elements, and this is because of previous attempts and tests for calibration (waiting time was not sufficient for transient evolution and return to homogeneous temperature distribution). However, the acting of the control system is visible because, at the beginning (first 150 s), the applied voltage is at the maximum of ≈12 V per Peltier cell, and after the first ramp-up, the temperature becomes stable and around the target temperature.
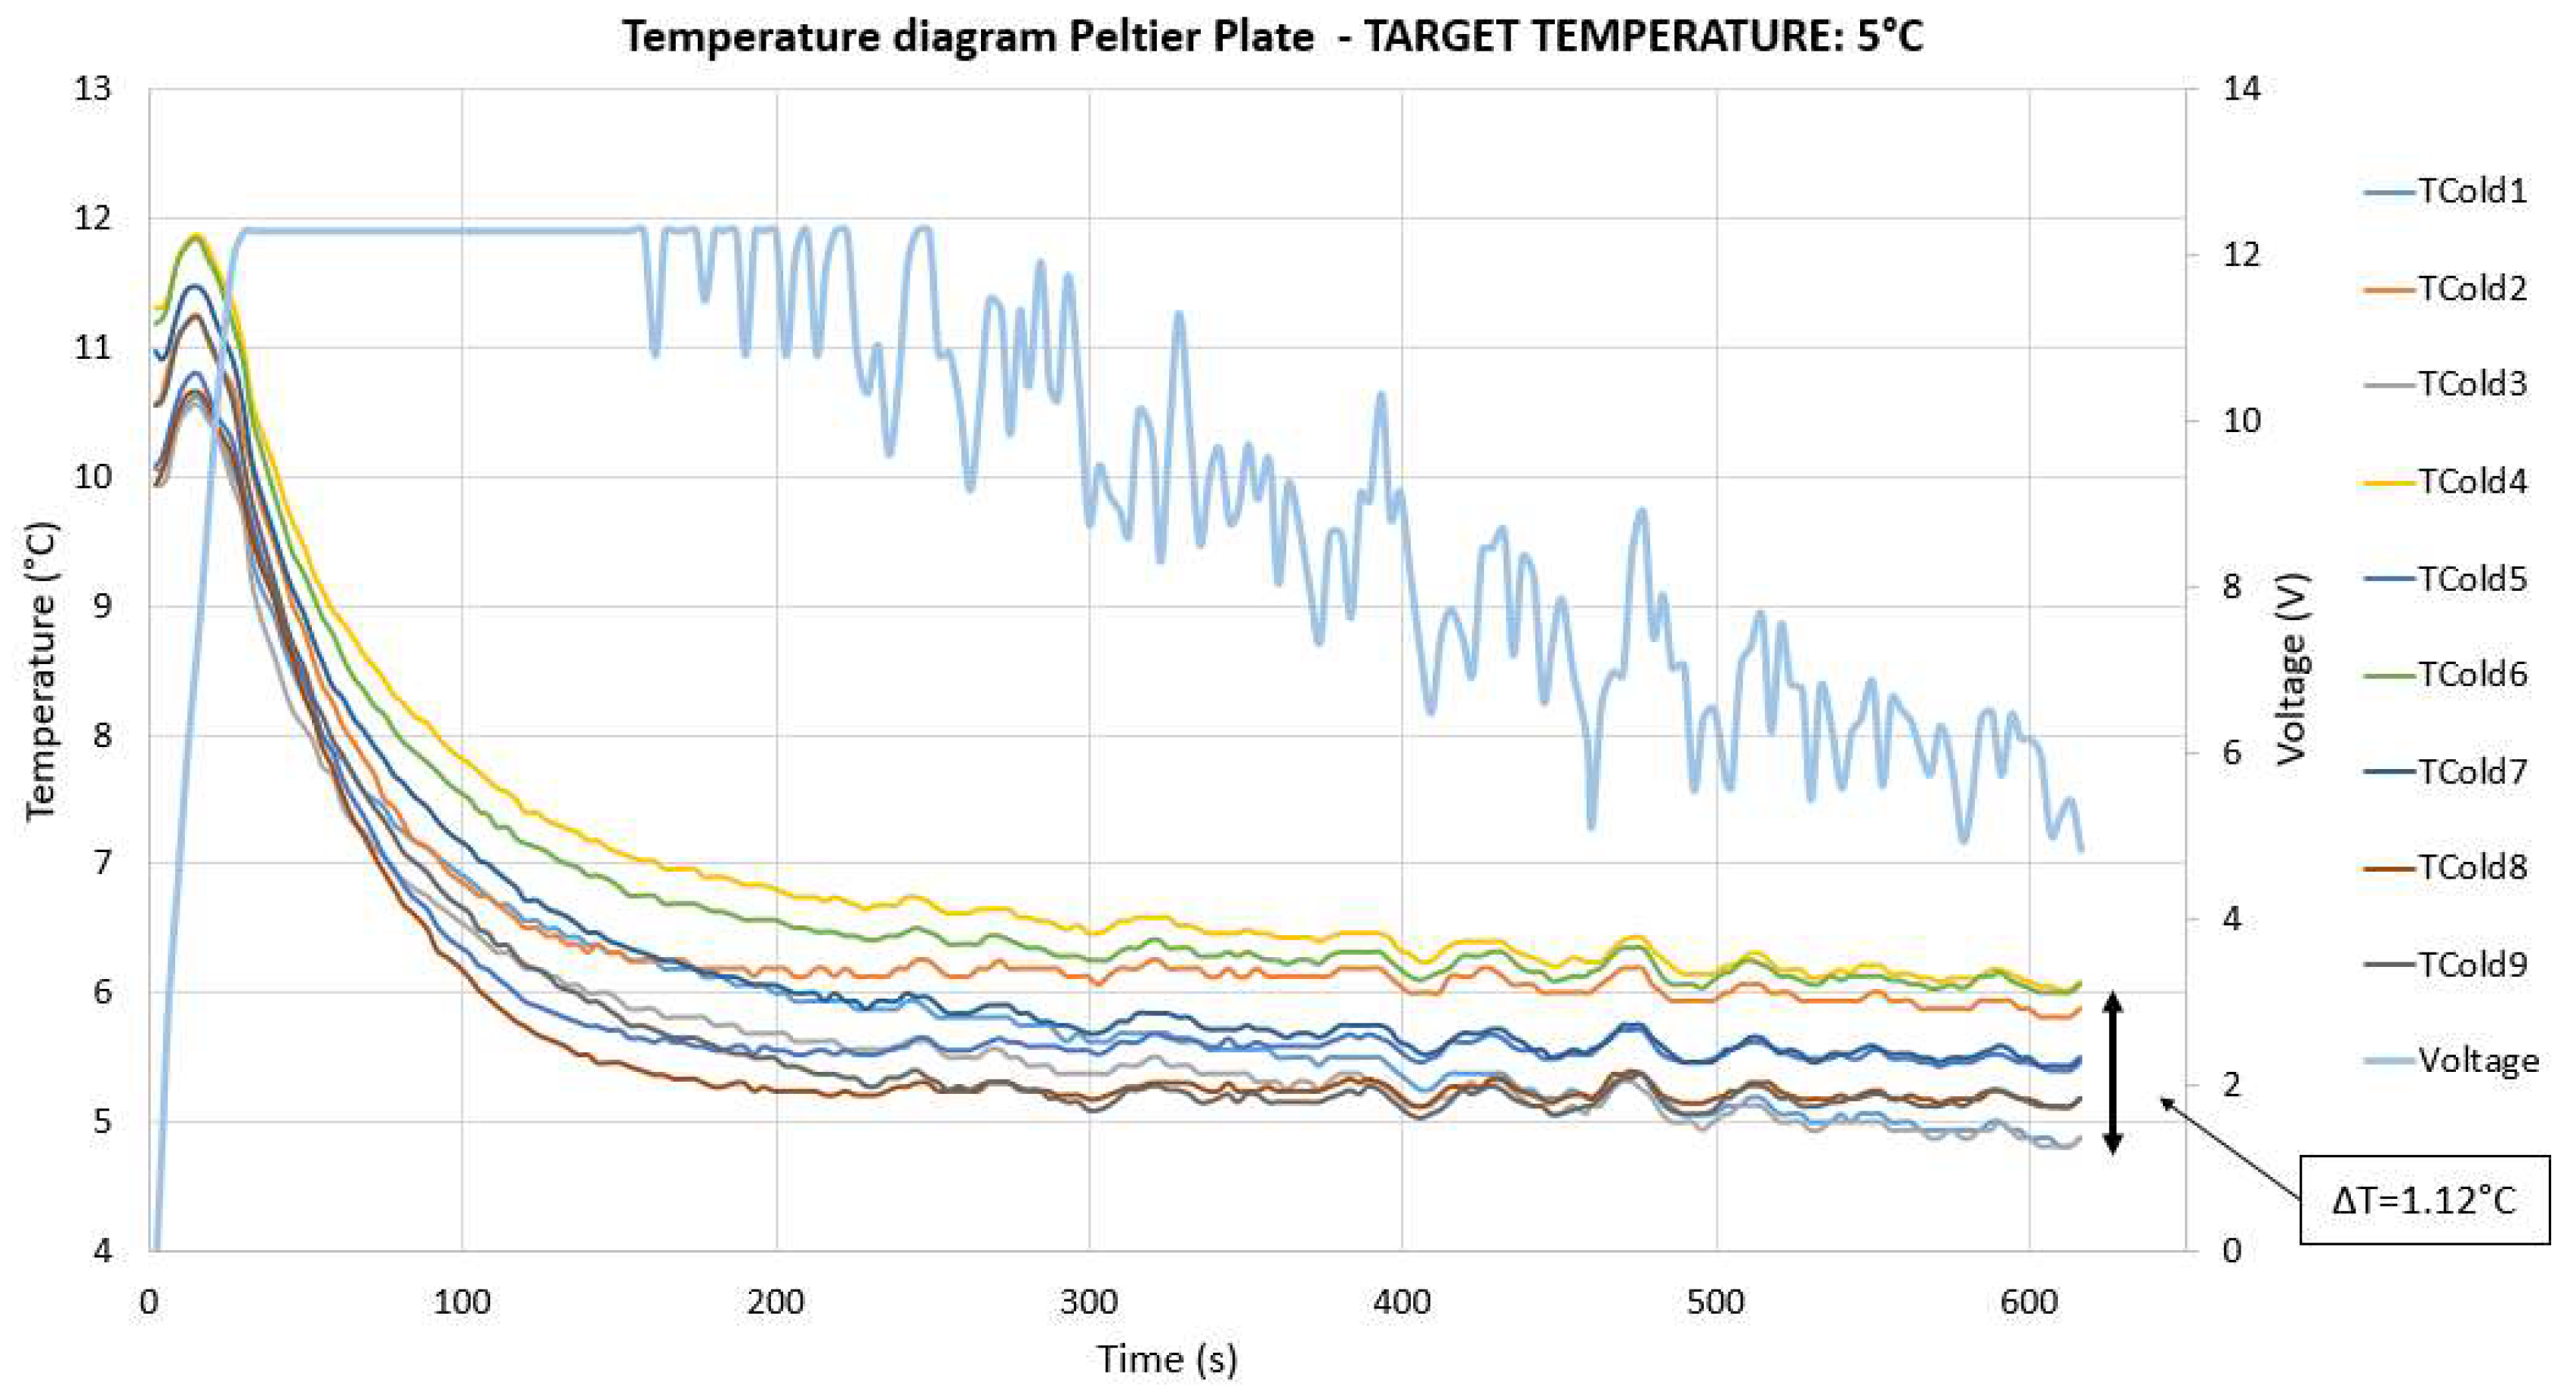
Figure A3 shows a particular characteristic of the temperature behavior sensed on the cold plate—that the observed temperature gradient is lower than 1.2 °C. What is of interest for the thermal conductivity measurements is not the exact target value reached, but the stability of the temperature of the Peltier plate. The target was to obtain a stable temperature drop on the battery, and the result in the plot of Figure A3 satisfies this purpose.
Figure A3. Zoomed view of the plot in Figure A2 for sensors on the aluminum plate. Delta temperature reveals a gradient of 1.12 °C on the aluminum plate.
Batteries 06 00010 g0a3

References

  1. Bazinski, S.J.; Wang, X. Experimental study on the influence of temperature and state-of-charge on the thermophysical properties of an lfp pouch cell. J. Power Sources 2015, 293, 283–291. [Google Scholar] [CrossRef]
  2. Lidbeck, A.; Syed, K.R. Experimental Characterization of Li-ion Battery Cells for Thermal Management in Heavy Duty Hybrid Applications. Master’s Thesis, Chalmers University of Technology, Gothenburg, Sweden, 2017. [Google Scholar]
  3. Arzberger, A.; Sauer, U.D. The change of thermal conductivity of lithium-ion pouch cells with operating point and what this means for battery thermal management. In Proceedings of the AABC—Advanced Automotive Battery Conference, AABTAM Symposium—Advanced Automotive Battery Technology, Application and Market, Atlanta, GA, USA, 2–7 February 2014. [Google Scholar]
  4. Song, L.; Evans, J.W. Measurements of the Thermal Conductivity of Lithium Polymer Battery Composite Cathodes. J. Electrochem. Soc. 1999, 146, 869. [Google Scholar] [CrossRef]
  5. Maleki, H. Thermal properties of lithium-ion battery and components. J. Electrochem. Soc. 1999, 146, 947. [Google Scholar] [CrossRef]
  6. Murashko, K.A.; Mityakov, A.V.; Pyrhönen, J.; Mityakov, V.Y.; Sapozhnikov, S.S. Thermal parameters determination of battery cells by local heat flux measurements. J. Power Sources 2014, 271, 48–54. [Google Scholar] [CrossRef] [Green Version]
  7. Richter, F.; Vie, P.J.; Kjelstrup, S.; Burheim, O.S. Measurements of ageing and thermal conductivity in a secondary nmc-hard carbon li-ion battery and the impact on internal temperature profiles. Electrochim. Acta 2017, 250, 228–237. [Google Scholar] [CrossRef]
  8. Werner, D.; Loges, A.; Becker, D.J.; Wetzel, T. Thermal conductivity of Li-ion batteries and their electrode configurations–A novel combination of modelling and experimental approach. J. Power Sources 2017, 364, 72–83. [Google Scholar] [CrossRef]
  9. Zhang, J.; Wu, B.; Li, Z.; Huang, J. Simultaneous estimation of thermal parameters for large-format laminated lithium-ion batteries. J. Power Sources 2014, 259, 106–116. [Google Scholar] [CrossRef]
  10. Zhang, Y.; Jahns, T.M. Power electronics loss measurement using new heat flux sensor based on thermoelectric device with active control. IEEE Trans. Ind. Appl. 2014, 50, 4098–4106. [Google Scholar] [CrossRef]
  11. Kovachev, G.; Schröttner, H.; Gstrein, G.; Aiello, L.; Hanzu, I.; Wilkening, H.M.R.; Foitzik, A.; Wellm, M.; Sinz; Ellersdorfer, C.; et al. Analytical Dissection of an Automotive Li-Ion Pouch Cell. Batteries 2019, 5, 67. [Google Scholar] [CrossRef] [Green Version]
  12. Taylor, J.R. The Study of Uncertainties in Physical Measurements, Introduction to error analysis 2nd ed.; Chapter 3—Propagation of Uncertainties; University Science Books: Sausalito, CA, USA, 1997; pp. 45–79. [Google Scholar]
  13. Tokunaga, T.; Tranchant, L.; Takama, N.; Volz, S.; Kim, B. Experimental Study of Heat Transfer in Micro Glass Tubes Mediated by Surface Phonon Polaritons. J. Physics: Conf. Ser. 2012, 395, 012108. [Google Scholar] [CrossRef]
  14. Lago, N.; Garcia-Calvo, O.; Lopez del Amo, J.M.; Rojo, T.; Armand, M. All-Solid-State Lithium-Ion Batteries with Grafted Ceramic Nanoparticles Dispersed in Solid Polymer Electrolytes. ChemSusChem 2015, 8, 3039–3043. [Google Scholar] [CrossRef] [PubMed]
  15. Barpanda, P.; Chotard, J.-N.; Delacourt, C.; Reynaud, M.; Filinchuk, Y.; Armand, M.; Deschamps, M.; Tarascon, J.-M. LiZnSO4F made in an ionic liquid: A ceramic electrolyte composite for solid-state lithium batteries. Angew. Chem. Int. Ed. 2011, 50, 2526–2531. [Google Scholar] [CrossRef] [PubMed]
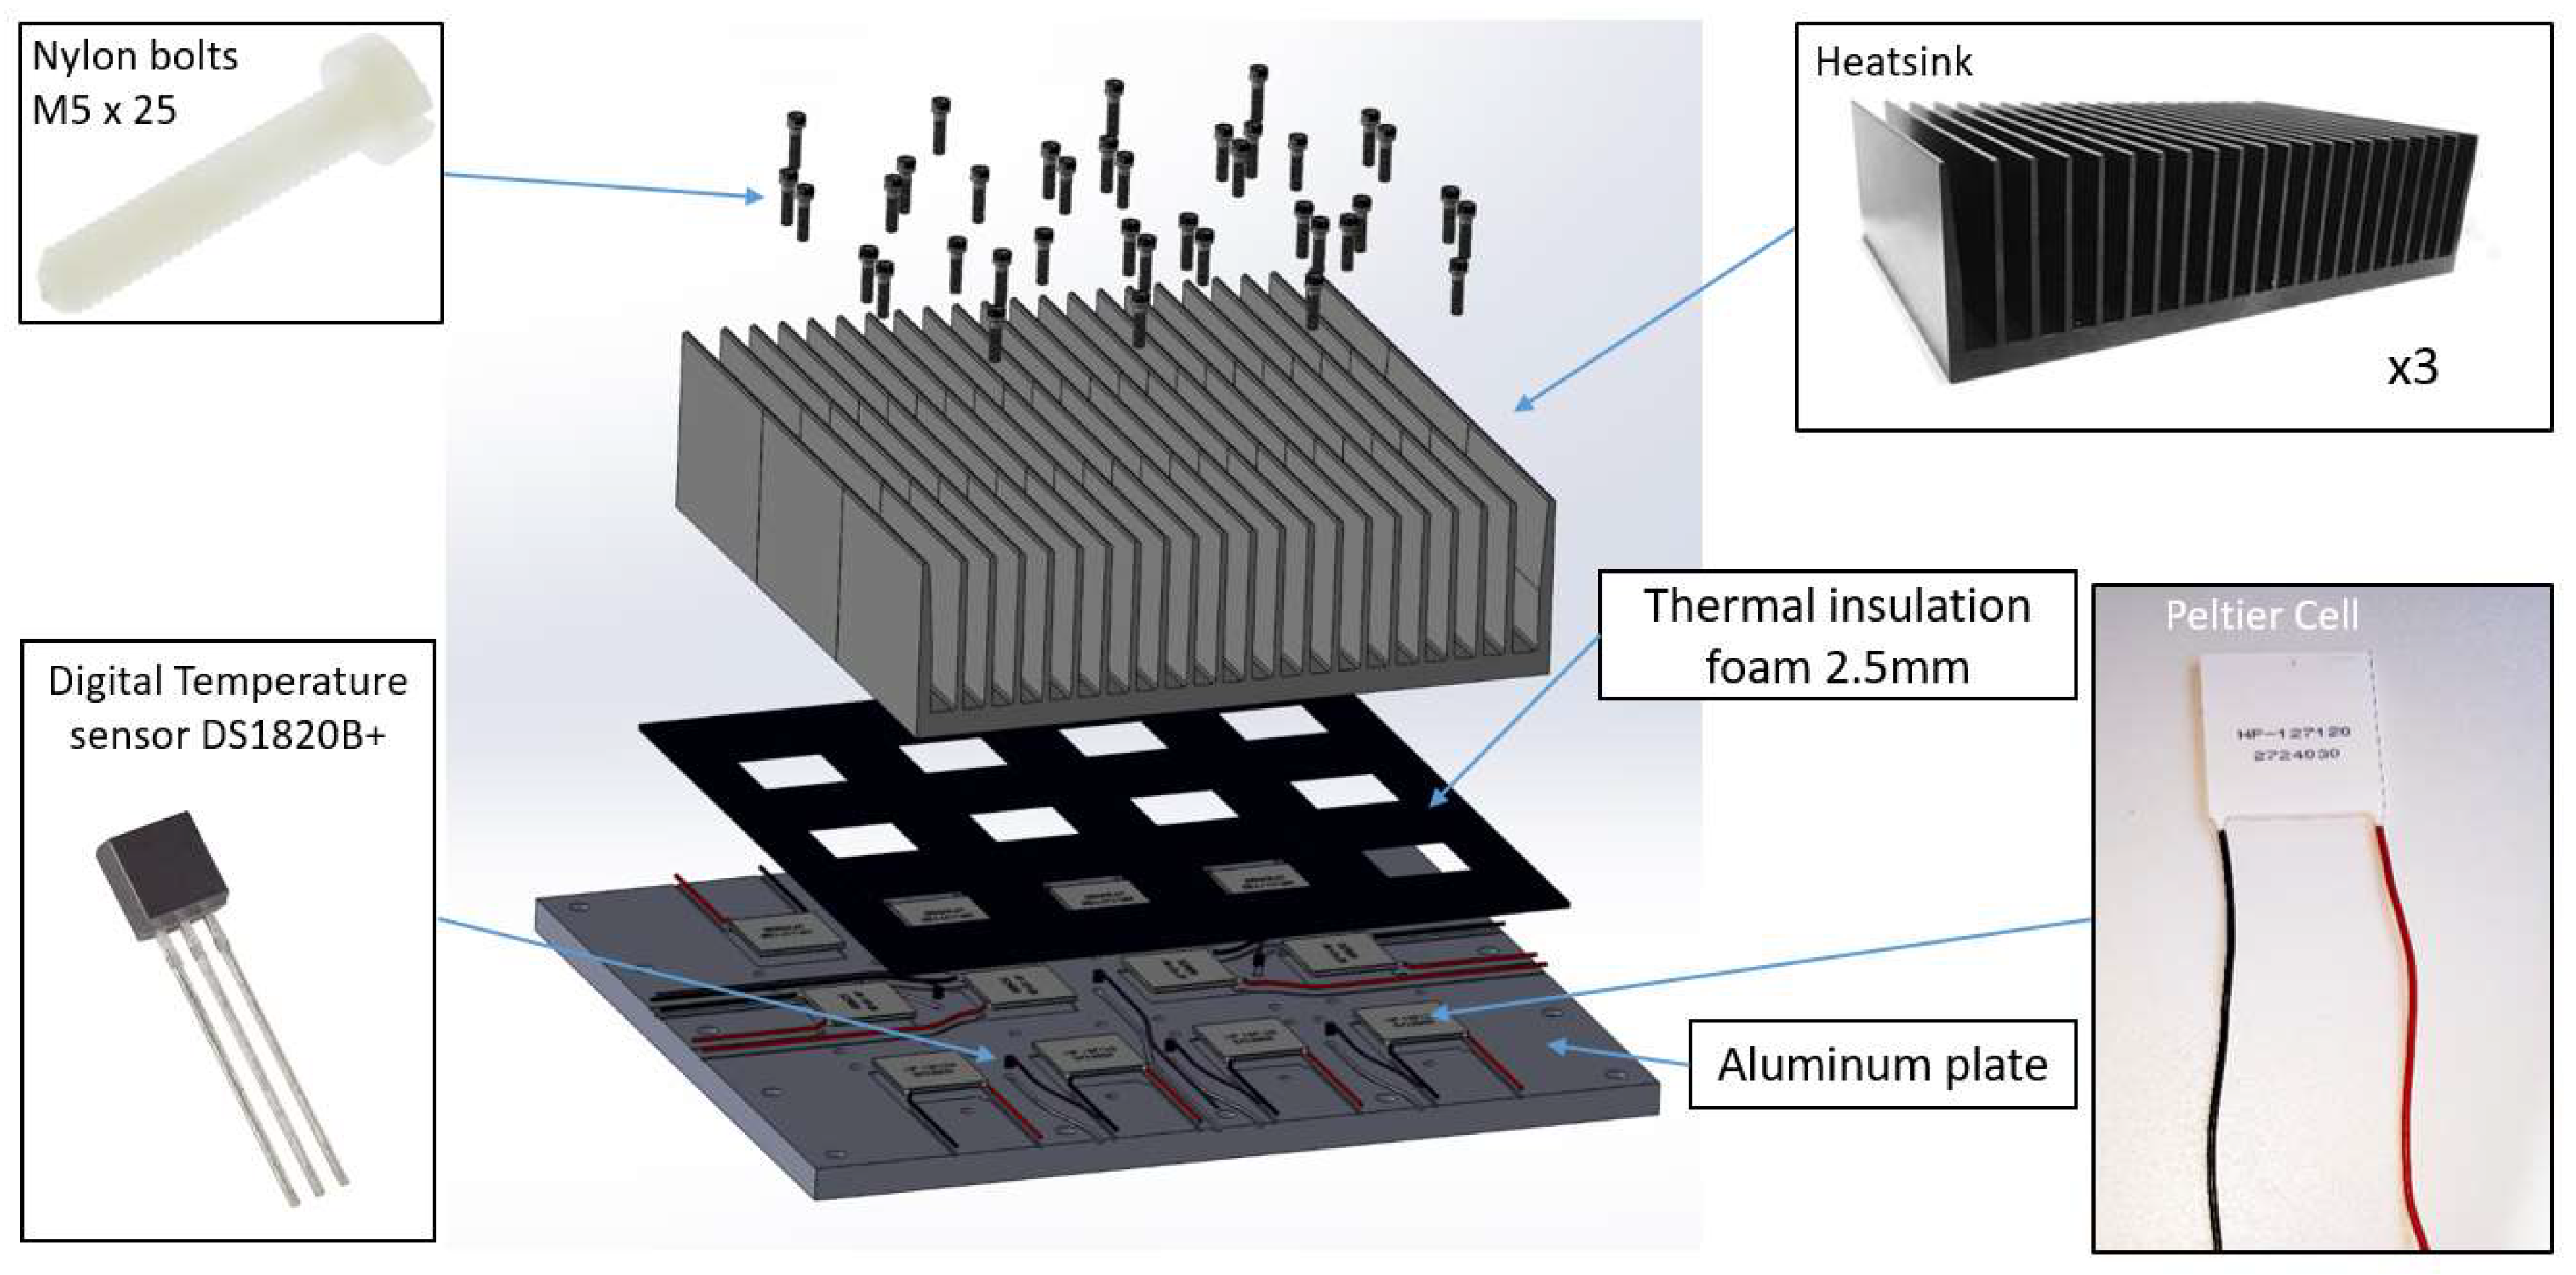
Figure 1. General assembly of the temperature-guarded plate (Peltier plate). The heat sinks were fixed to the aluminum plate with nylon bolts in order to increase the efficiency of the system. Digital temperature sensors DS1820B+ with ±0.5 °C uncertainty were placed inside the aluminum plate volume.
Batteries 06 00010 g001
Figure 2. Reference system used for the orientation of the orthotropic thermal conductivity measurements. The “w” vector is on the battery thickness direction, “v” vector is parallel to the tabs direction, and “u” vector is perpendicular to them.
Batteries 06 00010 g002
Figure 3. (a) From the plot it is possible to notice when the steady state condition is reached: the heat flux curve is flat and the temperature difference between top and bottom sensors remains constant. Configuration and positioning of the sensors on the test bench for transversal thermal conductivity measurement (b). The heat flux is measured on the top and bottom of the object and then averaged, and the temperature sensors integrated in the heat flux sensors provide the temperature gradient drop.
Batteries 06 00010 g003
Figure 4. Schematic diagram showing the expected heat flux for the measurement of the thermal conductivity along the longitudinal directions. (a) Assembly description for the longitudinal thermal conductivity measurements; (b) volume of interest for the calculation of the thermal conductivity from the sensors data; (c) section view of the system with arrows indicating the expected path of the heat flux.
Batteries 06 00010 g004
Figure 5. (a) Relationship between thermal conductivity and temperature for borosilicate glass. At 15 °C, thermal conductivity is 1.08 W/mK [9]. (b) A picture of the borosilicate glass sample under test.
Batteries 06 00010 g005
Figure 6. Batteries samples used for the thermal conductivity measurements. The numbering of the samples is provided to keep tracking of the specific sample. The tabs were covered with tape in order to prevent electrical short circuit during the thermal measurements.
Batteries 06 00010 g006
Figure 7. Test data curves of the heat flux and temperature for the three battery samples along the “w” direction. Plots relative to sample 1, 2 and 3 are shown–respectively - in (a), (b) and (c). Furthermore, a picture of the real test bench (from the top of the stack) is shown (d). In the legend of the plots, “Thrmcpl” stands for “Thermocouple”.
Batteries 06 00010 g007
Figure 8. Test data curves of the heat flux and temperature for the three battery samples along the “u” direction. Plots relative to sample 1, 2 and 3 are shown–respectively - in (a), (b) and (c). Furthermore, a picture of the real test bench is shown (d). In the legend of the plots, “Thrmcpl” stands for “Thermocouple”.
Batteries 06 00010 g008
Figure 9. Test data curves of the heat flux and temperature for the three battery samples along the “v” direction. Plots relative to sample 1, 2 and 3 are shown–respectively - in (a), (b) and (c). Furthermore, a picture of the real test bench (from the top of the stack) is shown (d). In the legend of the plots, “Thrmcpl” stands for “Thermocouple”.
Batteries 06 00010 g009
Table 1. Main components in approximate weight percentage for borosilicate glass.
Chemical Composition
SiO2B2O3Na2O+K2OAl2O3
81%13%4%2%
Table 2. Resuming of the measured data in the steady state condition for borosilicate glass—methodology validation test—direction “w”.
Measurement direction “w”—Borosilicate Glass Sample
Top Heat Flux
(W/m2)
Bottom Heat Flux
(W/m2)
∆Temperature
(°C)
Sample Thickness
(m)
1042.911093.449.730.01
Computed thermal conductivity
(W/mK)
Datasheet value
(W/mK)
Deviation
(%)
1.0971.08 at 15°C1.63
Table 3. Resuming of the measured data (steady state condition) on borosilicate glass for methodology validation—direction “v”.
Measurement direction “v”—Borosilicate Glass Sample
Abs. Top HF
(W)
Abs. Bottom HF
(W)
∆Temp
(°C)
LenVol.Int
(m)
Sample Section
(m2)
1.310.2822.590.090.0027
Computed thermal conductivity
(W/mK)
Datasheet value
(W/mK)
Deviation
(%)
1.171.08 at 15°C7.69
Table 4. Resuming of the measured data in the steady state condition on commercial pouch lithium-ion battery—direction “w”.
Measurement direction “w”—Commercial pouch Lithium ions battery/Sample 1
Top Heat Flux
(W/m2)
Bottom Heat Flux
(W/m2)
∆Temp.
(°C)
Sample Thickness
(m)
889.561105.7011.030.008
Computed thermal conductivity
(W/mK)
Abs. uncertaintyUncertainty
(%)
0.720.16723.13
Measurement direction “w”—Commercial pouch Lithium ions battery/Sample 2
Top Heat Flux
(W/m2)
Bottom Heat Flux
(W/m2)
∆Temp.
(°C)
Sample Thickness
(m)
876.491093.8610.370.008
Computed thermal conductivity
(W/mK)
Abs. uncertaintyUncertainty
(%)
0.760.18424.28
Measurement direction “w”—Commercial pouch Lithium ions battery/Sample 3
Top Heat Flux
(W/m2)
Bottom Heat Flux
(W/m2)
∆Temp.
(°C)
Sample Thickness
(m)
1041.261084.309.520.0077
Computed thermal conductivity
(W/mK)
Abs. uncertaintyUncertainty
(%)
0.840.223.97
Table 5. Resuming of the measured data in the steady state condition on commercial pouch lithium-ion battery—direction “u”.
Measurement direction “u”—Commercial pouch Lithium ions battery/Sample 1
Abs. Top HF
(W)
Abs. Bottom HF
(W)
∆Temp
(°C)
LenVol.Int
(m)
Sample Section
(m2)
15.767.1231.810.1150.0016
Computed thermal conductivity
(W/mK)
Abs. uncertaintyUncertainty
(%)
25.842.9211.29
Measurement direction “u”—Commercial pouch Lithium ions battery/Sample 2
Abs. Top HF
(W)
Abs. Bottom HF
(W)
∆Temp
(°C)
LenVol.Int
(m)
Sample Section
(m2)
15.278.0333.750.1150.0016
Computed thermal conductivity
(W/mK)
Abs. uncertaintyUncertainty
(%)
24.802.7110.93
Measurement direction “u”—Commercial pouch Lithium ions battery/Sample 3
Abs. Top HF
(W)
Abs. Bottom HF
(W)
∆Temp
(°C)
LenVol.Int
(m)
Sample Section
(m2)
6.614.8316.060.1150.00154
Computed thermal conductivity
(W/mK)
Abs. uncertaintyUncertainty
(%)
26.584.6417.45
Table 6. Resuming of the measured data in the steady state condition on commercial pouch lithium-ion battery—direction “v”.
Measurement direction “v”—Commercial pouch Lithium ions battery/Sample 1
Abs. Top HF
(W)
Abs. Bottom HF
(W)
∆Temp
(°C)
LenVol.Int
(m)
Sample Section
(m2)
14.199.1220.540.0850.00192
Computed thermal conductivity
(W/mK)
Abs. uncertaintyUncertainty
(%)
25.183.7114.74
Measurement direction “v”—Commercial pouch Lithium ions battery/Sample 2
Abs. Top HF
(W)
Abs. Bottom HF
(W)
∆Temp
(°C)
LenVol.Int
(m)
Sample Section
(m2)
15.8510.7722.870.0850.00192
Computed thermal conductivity
(W/mK)
Abs. uncertaintyUncertainty
(%)
25.773.5413.75
Measurement direction “v”—Commercial pouch Lithium ions battery/Sample 3
Abs. Top HF
(W)
Abs. Bottom HF
(W)
∆Temp
(°C)
LenVol.Int
(m)
Sample Section
(m2)
15.3811.2023.800.0850.001848
Computed thermal conductivity
(W/mK)
Abs. uncertaintyUncertainty
(%)
25.693.4413.40
Table 7. Resuming of the thermal conductivity measurements along the three directions.
Measurement DirectionSample n.Th. Cond. (W m−1K−1)Avg. Th. Cond. (W m−1K−1)
“w”10.720.77
20.76
30.84
“u”125.8425.74
224.80
326.58
“v”125.1825.55
225.77
325.69