Abstract
Temperature has a significant influence on the behavior of batteries and their lifetime. There are several studies in literature that investigate the aging behavior under electrical load, but are limited to homogeneous, constant temperatures. This article presents an approach to quantifying cyclic aging of lithium-ion cells that takes into account complex thermal boundary conditions. It not only considers different temperature levels but also spatial and transient temperature gradients that can occur despite-or even due to-the use of thermal management systems. Capacity fade and impedance rise are used as measured quantities for degradation and correlated with the temperature boundary conditions during the aging process. The concept and definition of an equivalent aging temperature (EAT) is introduced to relate the degradation caused by spatial and temporal temperature inhomogeneities to similar degradation caused by a homogeneous steady temperature during electrical cycling. The results show an increased degradation at both lower and higher temperatures, which can be very well described by two superimposed exponential functions. These correlations also apply to cells that are cycled under the influence of spatial temperature gradients, both steady and transient. Only cells that are exposed to transient, but spatially homogeneous temperature conditions show a significantly different aging behavior. The concluding result is a correlation between temperature and aging rate, which is expressed as degradation per equivalent full cycle (EFC). This enables both temperature-dependent modeling of the aging behavior and its prediction.
1. Introduction
Temperature is commonly known to be one of the most important factors that influence the performance and aging behavior of lithium-ion cells during cycling. This work is based on the results of the experimental investigation presented in Part 1 of this article [1], which addresses effects of complex thermal boundary conditions on the cyclic aging of lithium-ion (LiCoO2/LiNixCoyAlzO2-Graphite) pouch cells and also explains the conceptual design of the experiments and the experimental setup in detail.
The boundary conditions under investigation included spatially inhomogeneous and transient setups. The results of the impedance and capacity measurements introduced there are further evaluated in order to find common patterns and mathematical descriptions thereof, which hold equally for different thermal boundary conditions.
In order to utilize the various results for modeling the temperature-dependent aging behavior or to forecast the aging progress, however, directly applicable functions and correlations are beneficial. Yet, to the best of our knowledge, there exists no correlation between aging rate and temperature that also includes the effect of transient and spatially inhomogeneous temperatures or thermal boundary conditions. Numerous studies focus on homogeneous and steady thermal boundary conditions for the investigation of temperature dependent degradation [2,3,4,5,6], whereas the additional effects of transient [7] or inhomogeneous [8,9] thermal boundary conditions are rarely investigated. Most of the temperature dependency studies focus elevated temperatures from 25 °C to above 50 °C [2,4,5,6], while only a few analyze temperatures below 25 °C [3,10].
Therefore, in this article the following issues will be addressed:
- Evaluation of the electrochemical impedance spectra and the individual contributions to the overall impedance for complex thermal boundary conditions.
- Introduction of an equivalent aging temperature (EAT) as a characteristic value, unifying most of the investigated complex thermal boundary conditions to a single temperature value.
- Development of aging correlations for different evaluated impedance quantities, relating them to the EAT.
- Identification of different aging mechanisms at low and high temperatures.
2. Experimental Setup
2.1. Boundary Condition and Testing Procedure
The electrical and thermal boundary conditions as well as the testing procedure are only briefly outlined here. For a detailed description of the boundary conditions, experimental setup, and underlying considerations please refer to Part 1 of this article [1].
All cells (SLPB 8043140H5, Kokam Co., Ltd., Suwon, Republic of Korea) were cycled with a constant current of 3C (9 A) between the cut off voltages 4.2 V and 2.7 V for charge and discharge, respectively. As thermal boundary conditions, four different configurations were tested representing characteristic influences of spatial temperature gradients and temporal temperature changes. Figure 1a–d depicts these setups. The temperature was controlled directly at both planar surfaces and tabs of each pouch cell using individually designed temperature control plates comprising liquid cooling and heating channels.
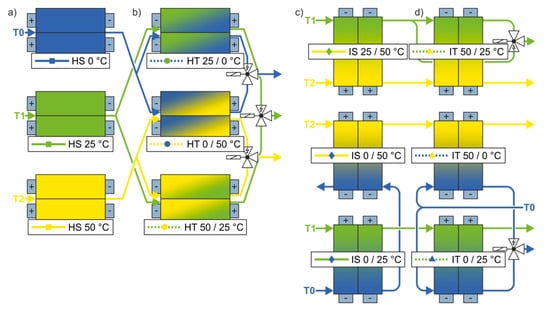
Figure 1.
Flow diagrams of the homogeneous (a) steady (HS) and (b) transient (HT) setups as well as inhomogeneous (c) steady (IS) and (d) transient (IT) setups [1].
Three temperature levels (0 °C, 25 °C, and 50 °C) were chosen as reference values, between which the gradients and transients are generated. The reference setups, in which the cells were cycled under homogenous and steady (HS) temperature are shown in Figure 1a. The setups shown in Figure 1c are characterized by an imposed temperature gradient over the length of the cells’ electrode stack that was kept constant during electric cycling (inhomogeneous, steady setup (IS)). The transient setups in which the temperatures change during the charge and discharge processes are shown in Figure 1b,d. In those cases, either the temperature that was applied to the entire cell surface changed with time (homogeneous, transient setup (HT)) or a temperature gradient developed and declined, caused by a time dependent change in temperature at the side of the cells’ anode tabs (inhomogeneous, transient setup (IT)). Thermal and electrical cycles were superimposed and synchronized.
After the cells had been adjusted to a defined begin of life (BoL) state by a preliminary cycling procedure, the aging cycling itself was started. Intermediate characterization measurements were carried out repeatedly at 25 °C for all tested cells and included the measurement of the actual discharge capacity and the quasi-open circuit voltage (OCV) at C/20 current as well as both current pulse [11] and electrochemical impedance spectroscopy (EIS) measurements at different state of charge (SoC), see [1] for details. In this work, we consider only the measurements at 50% SoC for further evaluation.
2.2. Evaluation Procedure
An equivalent circuit model (ECM) is used to analyze the electrochemical impedance spectra at BoL and at each intermediate examination during cell aging. The ECM in this study is depicted in Figure 2 and composes a serial connection of an ohmic resistance R, two RQ elements, a Finite Length Warburg (FLW) element, an inductance L, and capacitor C. The sum of the resistances of the RQ elements is further referred to as the polarization resistance while L, FLW, and C are auxiliary elements for a meaningful ECM fit to the measurements but are not quantitatively evaluated. It allows the quantification of the individual contributions to the overall impedance change during the cell aging. The equivalent circuit elements are introduced by Jacobsen et al. [12] and by Barsoukov et al. [13] and their serial connection as well as the parameter interpretation follows the results of the investigation on a similar high power pouch cell from Kokam Co., Ltd. [14]. The equation proposed for the description of the operating voltage (Vop) there is reduced here according to the requirements of the present study by considering the combined overvoltages (η) due to ohmic, polarization, and diffusion losses in anode (A), cathode (C), and electrolyte (E). Thus, it reads:
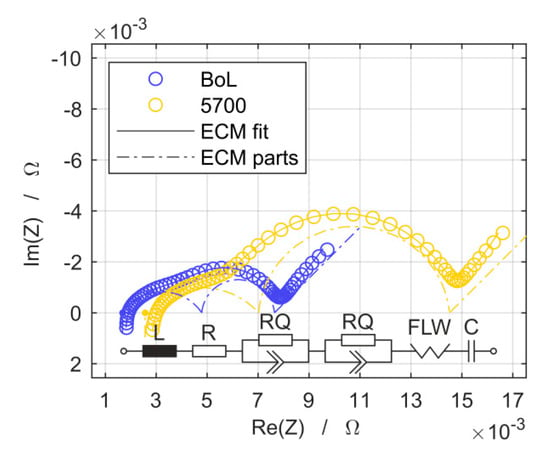
Figure 2.
Electrochemical impedance measurement results for both, the begin of life (BoL) state and after 5700 theoretical cycles, as well as the graphs of the equivalent circuit model (ECM) fit and its individual elements for both cases.
Two exemplary results of the ECM fitted to the measurement data as well as the individual contributions of each element in the frequency domain are shown in Figure 2 for measurements at BoL as well as after 5700 theoretical cycles.
A further simplified ECM is used to evaluate the voltage response of the excitation with a discharge current pulse of 1C over 18 s at 50% SoC. In comparison to the electrochemical impedance spectroscopy, especially to the ohmic resistance component of the ECM, the current pulse activates slower processes in the cell. The according simplified ECM consists of only one resistance that is assumed to represent the summed real parts of all loss processes in time domain after 18 s excitation. The equation for the description of the operating voltage (Vop) then reads:
3. Results and Discussion
For each point shown in the following diagrams, two cells have been operated in parallel and the resulting slightly deviating values were averaged according to the procedure explained in the Appendix A. The curves of the individual cells can be found in Part 1 of this article [1] as well as a description and comparison of the capacity fade. The error bars in the diagrams indicate that deviation. When there is no error bar provided, the measurements are in very good agreement so the deviations are too small for being depicted with the markers in the diagrams. For details on the averaging and deviation values for all cases refer to the Appendix A.
The following discussion is based on the evolution of four quantities throughout the aging process, namely the remaining discharge capacity ΔCC/20, the ohmic ΔRohm, and polarization ΔRpol resistances derived from the above mentioned ECM and an ohmic resistance from the discharge current pulse measurement ΔR18s. These quantities in percent are related to the values at begin of life (BoL) state and then plotted over the number of equivalent full cycles (EFC). The EFC of each cell is calculated by the integration of the charge throughput divided by the individual discharge capacity at the BoL state at 25 °C.
Table 1 gives the arithmetically averaged initial values of these quantities for the BoL state as absolute numbers with corresponding standard deviations.

Table 1.
Averaged cell parameters and their deviation at begin of life.
3.1. Capacity Measurements
Figure 3 shows the capacity fade for the different setups. The designations in Figure 3a–d correspond to those of the flow diagrams in Figure 1.
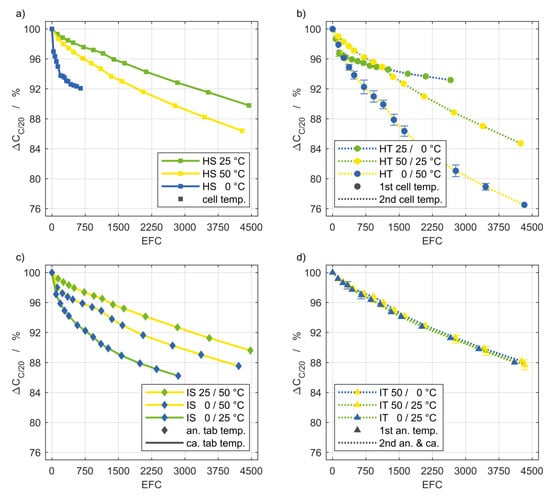
Figure 3.
Discharge capacity fade of the setups (a–d) shown in Figure 1. The markers indicate the averaged values obtained by the intermediate cell characterizations and their color represents the anode tab temperature of inhomogeneous setups (c,d). The color of the lines represents the cathode tab temperature of inhomogeneous setups as well as the second temperatures for transient boundary conditions that cycle between their 1st and 2nd temperature level (b). Based on the initial values in Table 1, a capacity fade of 4% corresponds to a loss of approximately 121 mAh.
One remarkable result from the steady experiments is that the magnitude of a temperature gradient seems less important for the capacity loss during cyclic aging, than the overall temperature level. For example, a comparison between Figure 3a,c shows that cells exposed to a gradient of 50 K in case of the IS 0/50 °C setup showed similar degradation as the cells exposed to homogeneous 50 °C. With applied temperature gradients, a higher overall temperature level resulted in a lower capacity fade. That is not valid for the homogeneous transient setups in Figure 3b. Thereby, a high temperature difference resulted in pronounced degradation, while a low temperature level seems to be preferable. The HT 25/0 °C setup is the only one with a homogeneous transient boundary condition that exhibited a lower capacity fade than the inhomogeneous steady configuration. Interestingly, the inhomogeneous transient setups in Figure 3d suffered almost the same loss of capacity and thus can hardly be distinguished.
3.2. Impedance Measurements
Figure 4 and Figure 5 show the development of different impedance values over EFC. The coloring and line style are the same as for the discharge capacity shown in Figure 3.
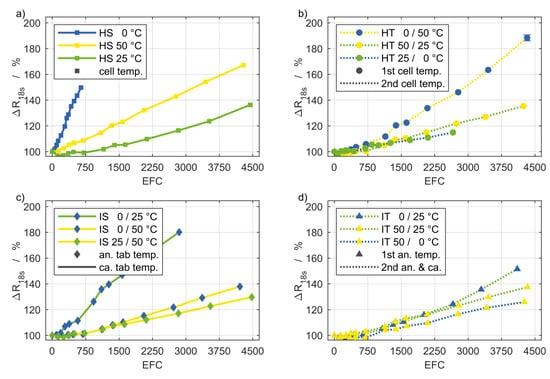
Figure 4.
Current pulse resistance degradation of the setups (a–d) shown in Figure 1. The coloring and line style are the same as for the discharge capacity shown in Figure 3. Based on the initial values in Table 1, a current pulse resistance degradation of 20% corresponds to an increase of approximately 2.6 mΩ.
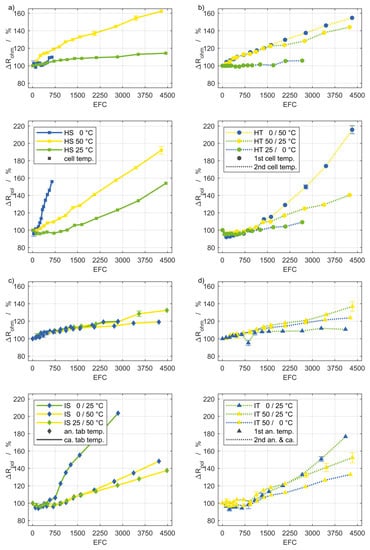
Figure 5.
Degradation of ECM parameters based on EIS measurements of the setups (a–d) shown in Figure 1. The coloring and line style are the same as for the discharge capacity shown in Figure 3. Based on the initial values in Table 1, a resistance degradation of 20% corresponds to an increase of approximately 0.31 mΩ for the ohmic and 1.3 mΩ for the polarization resistance.
Generally, the degradation of ΔR18s and ΔRpol show a similar progression and a similar order of the percentage values at different setups relative to each other. The percentage values for ΔR18s are consistently somewhat lower with the exception of the setups HT 25/0 °C and IT 50/0 °C. However, the absolute magnitude is higher for the ΔR18s degradation. Based on the values in Table 1, an increase of 100% of ΔR18s is almost twice the increase of ΔRpol by 100%. A general statement is not feasible about Rohm on the basis of the experimental findings. The ohmic resistance depends mainly on the current collectors and the electrolyte. Their aging appears to be less intense during cycling and, additionally these aging processes are less affected by temperature and thermal boundary conditions. Presumably the increased change of the ohmic resistance at high temperatures can be attributed primarily to the decomposition of the electrolyte.
The subfigures (a) in Figure 4 and Figure 5 depicting the homogeneous steady (HS) setups show, as expected, the lowest impedance rise for 25 °C, while the degradation for 50 °C occurs significantly stronger. For 0 °C, the increase of ΔR18s and ΔRpol is even more pronounced, despite less EFC, which is in agreement with the capacity fade. The ohmic resistance in contrast, is not as severely affected by the low temperature condition. Remarkably, the curves of ΔR18s and ΔRpol for HS 25 °C are below 100% through the first 1000 EFC, which indicates that these values decreased in the early stages of cycling. This applies, though less pronounced, to other setups as well and has already been noted by Liu et al. [15].
The influence of steady temperature gradients (IS) on ΔR18s and ΔRpol is illustrated in the subfigures (c). Again, the temperature inhomogeneities seem to have no stronger degradation effects than the involved temperature levels with a homogeneous distribution. For example, the cells exposed to gradients between 50 °C and 25 °C, respectively, 0 °C do not exhibit a substantially different increase in impedance compared to the cells at a homogeneous temperature of 25 °C. The increase for the setup IS 0/25 °C is more pronounced. That might be attributed to the low temperature level, which is also reflected in the according values for the setup HS 0 °C. Remarkably, the ohmic resistance from the impedance spectra exhibits a completely different behavior, as the graphs for the different gradients can hardly be distinguished.
Effects of temperature changes over time are represented in the subfigures (b,d) of Figure 4 and Figure 5 (HT) and (IT). The repeated temperature transients between 0 °C and 50 °C with spatially homogeneous distribution (HT) resulted in the highest polarization and current pulse resistance increase among all setups. Despite the low temperature level of the setup HT 25/0 °C, the according rise of all resistance quantities is surprisingly small. The homogeneous transient boundary conditions are the only circumstance in which the curves of ΔRohm follow the same order relative to one another as in ΔR18s and ΔRpol. These results provide a first indication on a different aging behavior at severe temperature changes and becomes even more apparent in Section 3.4.
3.3. Impedance Versus Capacity Degradation
The end of life (EoL) state of high power cells is usually defined as 80% remaining capacity [16] and 100% increase of impedance [17]. In this case, the current pulse resistance is used as impedance quantity since it is regarded to comprise the ohmic and polarization resistance contributions and its time range is most relevant for power applications. The aging results of this study are depicted in Figure 6a as percentage values. The square dashed in red defines the EoL state boundaries while the BoL state appears in the lower right corner. Within this study, the EoL criterion was only exceeded by the setup HT 0/50 °C after 3100 EFC. The individual curves are very densely grouped, so that no significant influence of the different boundary conditions can be seen in this diagram. The capacity fade of the cells of all experimental setups is slightly more pronounced than resistance increase during the first intermediate cell characterizations, while in later cycles the resistance increase dominates. In addition to HT 0/50 °C, the setups HS 0 °C and IS 0/25 °C also differ to some extent from this behavior and show a stronger aging of the resistance compared to the capacity. In Figure 6b the values are normalized to both, EFC and threshold value, which is the difference between the BoL values and the defined EoL and indicated by the index Begin to End of Life (BtEoL). The normalization of both quantities by the threshold values leads to a clear separation of the setups HS 0 °C, IS 0/25 °C, and HT 0/50 °C from the remaining ones, characterizing them as the most harmful thermal boundary conditions. In the overall view of all setups except HS 0 °C and IS 0/25 °C, and the designated EoL criterion, the investigated pouch cell exhibits a slightly pronounced capacitive degradation which is favorable for high power applications.
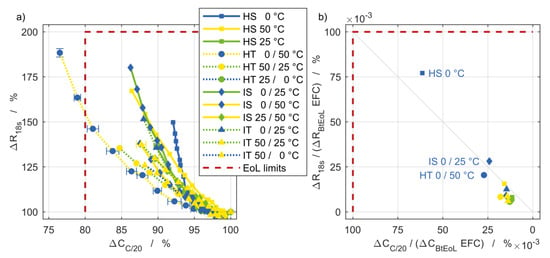
Figure 6.
(a) Power fade in terms of current pulse resistance degradation versus capacity fade and (b) normalized to the threshold values indicated in red and in relation to the number of EFC.
3.4. Equivalent Aging Temperature
The previously shown results exhibit a high degree of diversity, which requires a systematic comparison and evaluation of the effects of the different thermal boundary conditions. In general, simulations with an accurately parametrized and validated model can provide an insight into the processes inside a battery. However, the complex boundary conditions in this study and the overlapping effects require a high-resolution model in which electrical, electrochemical, thermal and mechanical processes are coupled. In addition, for parameterization, all material data must be implemented depending on the electrochemical state [18,19], temperature [20,21,22] and mechanical stress [23,24] of the cell. In the literature the difficulty of such a parameterization is known and frequently addressed [25,26,27] and it will not be the subject of this article. However, the results can be used to validate ageing models, for example. The aim at this point cannot be to reflect and explain the complex interactions taking place within the cell. The intention is rather to describe the experimental results with approaches that are as simple and as generally valid as possible.
To cope with this challenge, this chapter introduces the concept and definition of an equivalent aging temperature (EAT). The main idea of this EAT is to bring the damage caused by spatial and temporal temperature inhomogeneities in relation to similar damage caused by a homogeneous steady temperature distribution during cell cycling. This raises the question whether a correlation can actually be found between the EAT of all setups and aging rate. The latter is thereby expressed as the degradation of the above shown quantities, which are the remaining discharge capacity and the three resistance quantities from current pulse and EIS measurements.
The proposed definition of the equivalent aging temperature is determined by spatial and temporal integration of the temperatures undergone within one thermal cycle tcyc,th according to Equation (3).
Furthermore, an evolving linear spatial temperature gradient between the two temperature levels is assumed for inhomogeneous steady (IS) and transient (IT) setups. The temporal integration takes into account the uniform shape of both the cool down and heat up periods. The distance L is equal to the length of the electrode stack [1]. The homogeneous transient (HT) setups only exhibit a temporal dependency.
The temperature dependency of aging rates or kinetics in general is often described by applying Arrhenius law [28] to calendric [29,30] and cyclic [31] degradation measurements. For this reason, the measurement data points are at first fitted with two superimposed Arrhenius functions. The equation used for the least square fit based on Arrhenius functions with an adapted positive exponential dependency in the first summand, representing the low temperature dependency as proposed by Waldmann et al. [3], is given as Equation (4) and the corresponding coefficients are listed in Table 2.

Table 2.
Arrhenius fit coefficients.
The result of Equation (4) is Y as an arbitrary parameter that represents the quantity of interest with which aging is described, i.e., capacity or impedance. The same applies to Equation (5).
The Arrhenius coefficients EA representing the activation energy are consistent with the range of values obtained by Waldmann et al. [3]. They determined a low temperature activation energy of EA1 = 0.57 eV and a high temperature activation energy of EA2 = 0.38 eV for the 1C discharge capacity degradation of NMC/LMO blend cells. The homogeneous transient setups are excluded from the least square fit of all quantities, which is discussed later on.
Arrhenius has developed the equation named after him for a particular type of reaction process. It can be assumed that in the course of aging, firstly, there are not only two but a considerable amount of processes and chemical reactions taking place for which, secondly, this law does not apply or applies only to a limited extent. Furthermore, it strictly applies only to temperature dependent rates as mentioned by Waldmann et al. [3].
For these reasons, an empirical approach consisting of two superimposed exponential functions is additionally used for fitting hereafter. The equation used for the least square fit based on exponential functions is written as follows and the corresponding coefficients are listed in Table 3.

Table 3.
Exponential fit coefficients.
Indeed, the obtained fit results based on the exponential functions exhibit an overall improved fit quality that is quantified by a lower least square sums (LSS) and a higher determination coefficient (RSQ).
For the further proceeding we decided to use the two exponential functions as the significantly improved fit quality is favorable for the concept development of the EAT.
To quantify and relate the degradation to temperature, the following graphs refer the aging quantities to the number of EFC. It is important to consider that for this reason only the final values are decisive and the shape of the curve is disregarded. Figure 7 and Figure 8 show on the left side the aging rate of the respective quantity for each setup, sorted by the degree of degradation. On the right side the temperature dependence is shown using the same vertical axis. The temperatures of the horizontal axis represent the EAT following Equation (3). The superimposed exponential functions given by Equation (5) are colored blue and red and together result in the black curve with the 95% confidence intervals in grey.
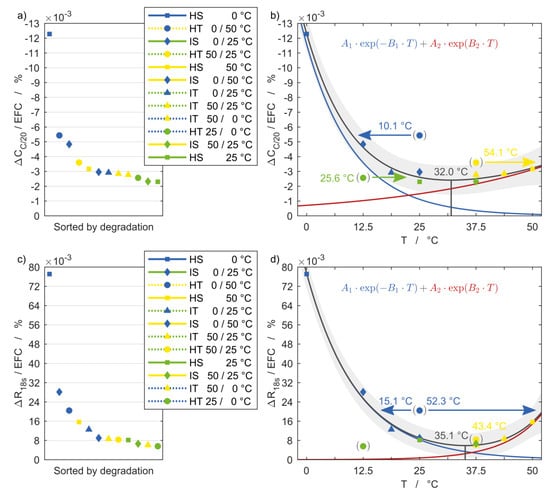
Figure 7.
(a,b) Discharge capacity fade and (c,d) current pulse resistance degradation with reference to equivalent full cycles and in relation to the corresponding equivalent aging temperature of each setup including 95% confidence intervals.
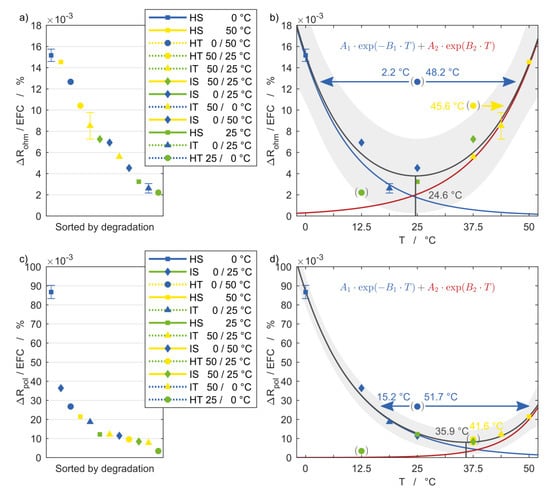
Figure 8.
Electrochemical impedance degradation of (a,b) the ohmic and (c,d) the polarization resistance with reference to equivalent full cycles and in relation to the corresponding equivalent aging temperature of each setup including 95% confidence intervals.
The resulting fit functions follow the measurement points in good agreement, indicating two dominant temperature dependencies, leading to intensified aging with both increasing and decreasing temperature. The descending branch, which describes aging at low temperatures, is more prominent in all diagrams. The ohmic resistance is the only exception, with both the high-temperature and low-temperature branches being highly temperature-dependent. The exact processes and reactions taking place inside the cells are not evident and will not be speculated on at this point. For reliable conclusions on this matter a post mortem analysis is necessary.
The minimum of the correlations indicates the optimum temperature, which differs for the considered degradation quantities and ranges from 24.6 °C for the ohmic resistance to 35.1 °C for the polarization resistance. This suggests that the ideal operating temperature for this cell is slightly above the common assumption of 25 °C used as reference condition.
One remarkable result is that the data points for the homogeneous transient setups (round markers) are clearly not in line with the fit functions, for none of the four quantities. One possible explanation is the temperature dependence of the voltage curves during cycling. As shown in Part 1 of the publication, the voltage instantaneously changed with the temperature transition. For HT 25/0 °C each charge and discharge began at 25 °C. With the temperature change to 0 °C, the overvoltage increased significantly and thus the cut-off voltages were reached earlier. This leads to a comparatively low charge throughput, which is primarily attained at the moderate temperature of 25 °C and therefore leads to reduced aging than one would expect from the calculated EAT. For HT 0/50 °C, in contrast, the high and low state of charge (SoC) at the end of the charge and discharge process occured at the high temperature level of 50 °C, resulting in a high charge throughput equivalent to the setups HS 25 °C and HS 50 °C. Consequently, the increased aging rate can be related to the repeated temperature changes. The same applies to HT 50/25 °C although the aging is close to the range of the aging functions for the corresponding EAT.
The arrows emanating from the markers for the HT setups indicate the potential assignment of the respective aging state to a new EAT, that cannot be directly calculated with Equation (3). Instead, it is achieved by a horizontal displacement of the measured data in either direction until it intersects with the aging function, as will be detailed in the following. The unambiguous assignment of homogeneous transient setups to an EAT for the results of the time domain quantities discharge capacity and pulse resistance as shown in Figure 7 is only possible for the discharge capacity in (b). The capacity loss of the setup HT 0/50 °C is high enough to allow a reasonable intersect with the low temperature branch to lie within the temperature range under consideration, resulting in an EAT of 10.1 °C. In contrast, for the setup HT 50/25 °C only a shift towards the right onto the high temperature branch is feasible, since there is no temperature below 25 °C possible within the cells of this setup. Since the capacity fade of the setup HT 25/0 °C is located below the aging function, there is again only one option for assigning it to the curve. Following this approach, the measurement points of the homogeneous transient boundary conditions are also allocated to their new EATs in the subsequent diagrams and indicated by the corresponding arrows.
The setup HT 25/0 °C shows the lowest degradation for all resistance quantities, with values even below the minimum of the aging functions. Appropriately, the value of the minimum is assigned to this setup, which lies within the boundaries of the 95% confidence interval. The values for the setup HT 0/50 °C lie significantly above the aging functions, meaning with this boundary condition the cells aged considerably stronger than their calculated EAT would suggest. In Figure 7d and Figure 8b,d, this impedance value may be assigned to a new EAT on both the high temperature and low temperature branch of the aging function. This means that the degradation of the cell that underwent the temperature changes is equal to a cell that is cycled either at a lower or higher homogeneous steady temperature.
The results above are valid for the investigated cells under the considered boundary conditions. Whether and to what extent the findings can be transferred to other currents or cell chemistries is still unclear. It can be assumed that the aging functions are shifted for different current rates and that other lithium-ion cells exhibit a qualitatively similar aging behavior. Regardless of this, the approach to determine an equivalent aging temperature and to identify temperature-dependent aging functions provide substantial additional value.
4. Conclusions
In this work, experimental aging results for capacity loss, current pulse resistance, and ohmic as well as polarization resistance for lithium-ion cells exposed to different complex thermal boundary conditions varying both in time and space are discussed.
It has been shown that both temperature gradients and temperature changes influence the aging behavior, but have different effects on the quantities considered. While a high temperature level is particularly harmful for the ohmic resistance, temperature gradients have a comparatively small effect. In contrast, such gradients strongly negatively influence the capacity and the polarization resistance. Especially a low temperature level has a negative effect. In particular, temperature changes show a clear degradation for all quantities, most notably if they occur over a wide temperature range and a large volume fraction of the cell.
In order to systematically evaluate the influence of the various boundary conditions and to identify a practical approach for characterizing their damaging effect, the concept of an equivalent aging temperature (EAT) is proposed and elaborated. This single representative temperature value for each setup takes into account spatial temperature gradients and temporal temperature changes. The EAT dependencies of capacity loss, current pulse resistance, and ohmic as well as polarization resistance, which are presumably caused by a variety of complex aging mechanisms inside the cell, can indeed be described by superimposed exponential functions for inhomogeneous transient (IT), inhomogeneous steady (IS), and the reference cases with homogeneous steady (HS) conditions. The only exceptions are the measurement results of the homogeneous transient (HT) boundary conditions. This suggests an additional or fundamentally different aging mechanism associated with cyclic or repeated (homogenous) temperature changes. Before having further results, e.g., of post mortem analyses, it can only be speculated, if e.g., thermal expansion during temperature changes leads to increased mechanical degradation of the active material coating.
Apart from the ohmic resistance, the identified aging functions reveal a more pronounced temperature dependence for lower temperatures. The degradation also becomes more extensive as the temperature rises, only to a lesser degree.
Author Contributions
Conceptualization, D.W., A.W., and T.W.; methodology, D.W. and A.W.; software, D.W.; validation, D.W. and S.P.; formal analysis, D.W.; investigation, D.W.; writing—original draft preparation, D.W. and S.P.; writing—review and editing, D.W., S.P., and T.W.; visualization, D.W. and S.P.; supervision, A.W. and T.W.; project administration, A.W. and T.W.; funding acquisition, A.W. and T.W. All authors have read and agreed to the published version of the manuscript.
Funding
This research was funded by MAHLE International GmbH and the federal state of Baden-Württemberg as part of the graduate school ‘Projekthaus e-drive’. The APC was funded by the Institute of Thermal Process Engineering (TVT), Karlsruhe Institute of Technology (KIT).
Acknowledgments
The authors would like to thank Michael Weiss (Institute for Applied Materials - Materials for Electrical and Electronic Engineering (IAM-WET), Karlsruhe Institute of Technology (KIT)) for the scientific discussions.
Conflicts of Interest
The authors declare no conflict of interest.
Appendix A. Averaging and Reproducibility
The capacity loss of each cell of the cell pairs with identical boundary conditions shown in the first part of the article [1] has been very similar, so that averaging and using one single value for each condition is considered to be useful for a clear presentation and further interpretation of the data. For this purpose, the specified value for the current of 9 A (3C) is used as weighting criterion for the experimentally obtained values. They were in some cases limited by the charging power of the cell test device to slightly lower values close to the maximum cell potential. The calculation of the respective weighting factor is then done linearly, adhering to the closing condition. This allows the capacity and the number of equivalent full cycles (EFC) of each intermediate characterization to be calculated as the target values. The error bars of the capacity in Figure 3 represent the differences between the averaged target value and the originally measured values.
The same has been done with the values for the current pulse resistance, the ECM parameters, and their visualization in Figure 4 and Figure 5.
The differences (δ) of the capacity fade, current pulse resistance, and impedance degradation (µY) in relation to EFC in Figure 7 and Figure 8 contain positive and negative error values. They are calculated using the following universal equation:
The summed up EFC and deviation between the intermediate characterizations are listed in Table A1 for each setup. The deviations however, have not been shown as error bars in the diagrams, as they are very small and would therefore not be visible.

Table A1.
Equivalent full cycles and corresponding deviation of each setup.
Table A1.
Equivalent full cycles and corresponding deviation of each setup.
| Setup | ∑NEFC | ∑σEFC |
|---|---|---|
| HS 0 °C | 645.2 | 5.9 |
| HS 25 °C | 4441.5 | 7.6 |
| HS 50 °C | 4289.5 | 16.1 |
| HT 25/0 °C | 2659.6 | 4.3 |
| HT 0/50 °C | 4323.6 | 13.8 |
| HT 50/25 °C | 4240.9 | 8.5 |
| IS 25/50 °C | 4476.5 | 11.6 |
| IS 0/50 °C | 4210.8 | 26.9 |
| IS 0/25 °C | 2847.8 | - |
| IT 50/0 °C | 4262.3 | 6.8 |
| IT 50/25 °C | 4333.1 | 6.6 |
| IT 0/25 °C | 4103.0 | 11.3 |
References
- Werner, D.; Paarmann, S.; Wiebelt, A.; Wetzel, T. Inhomogeneous Temperature Distribution Affecting the Cyclic Aging of Li-ion Cells. Part I: Experimental Investigation. Batteries 2020, 6, 13. [Google Scholar] [CrossRef]
- Baghdadi, I.; Briat, O.; Delétage, J.-Y.; Gyan, P.; Vinassa, J.-M. Lithium battery aging model based on Dakin’s degradation approach. J. Power Sources 2016, 325, 273–285. [Google Scholar] [CrossRef]
- Waldmann, T.; Wilka, M.; Kasper, M.; Fleischhammer, M.; Wohlfahrt-Mehrens, M. Temperature dependent ageing mechanisms in Lithium-ion batteries—A Post-Mortem study. J. Power Sources 2014, 262, 129–135. [Google Scholar] [CrossRef]
- Schuster, S.F.; Bach, T.; Fleder, E.; Müller, J.; Brand, M.; Sextl, G.; Jossen, A. Nonlinear aging characteristics of lithium-ion cells under different operational conditions. J. Energy Storage 2015, 1, 44–53. [Google Scholar] [CrossRef]
- Käbitz, S.; Gerschler, J.B.; Ecker, M.; Yurdagel, Y.; Emmermacher, B.; André, D.; Mitsch, T.; Sauer, D.U. Cycle and calendar life study of a graphite|LiNi1/3Mn1/3Co1/3O2 Li-ion high energy system. Part A: Full cell characterization. J. Power Sources 2013, 239, 572–583. [Google Scholar] [CrossRef]
- Jalkanen, K.; Karppinen, J.; Skogström, L.; Laurila, T.; Nisula, M.; Vuorilehto, K. Cycle aging of commercial NMC/graphite pouch cells at different temperatures. Appl. Energy 2015, 154, 160–172. [Google Scholar] [CrossRef]
- Gering, K.L.; Sazhin, S.V.; Jamison, D.K.; Michelbacher, C.J.; Liaw, B.Y.; Dubarry, M.; Cugnet, M. Investigation of path dependence in commercial lithium-ion cells chosen for plug-in hybrid vehicle duty cycle protocols. J. Power Sources 2011, 196, 3395–3403. [Google Scholar] [CrossRef]
- Hunt, I.A.; Zhao, Y.; Patel, Y.; Offer, J. Surface Cooling Causes Accelerated Degradation Compared to Tab Cooling for Lithium-Ion Pouch Cells. J. Electrochem. Soc. 2016, 163, A1846–A1852. [Google Scholar] [CrossRef]
- Carter, R.; Love, C.T. Modulation of Lithium Plating in Li-Ion Batteries with External Thermal Gradient. ACS Appl. Mater. Interfaces 2018, 10, 26328–26334. [Google Scholar] [CrossRef]
- Jaguemont, J.; Boulon, L.; Venet, P.; Dube, Y.; Sari, A. Lithium-Ion Battery Aging Experiments at Subzero Temperatures and Model Development for Capacity Fade Estimation. IEEE Trans. Veh. Technol. 2016, 65, 4328–4343. [Google Scholar] [CrossRef]
- International Organization for Standardization (ISO). Electrically Propelled Road Vehicles—Test Specification for Lithium-ion Traction Battery Packs and Systems—Part 1: High-Power Applications; International Organization for Standardization: Geneva, Switzerland, 2011. [Google Scholar]
- Jacobsen, T.; West, K. Diffusion impedance in planar, cylindrical and spherical symmetry. Electrochim. Acta 1995, 40, 255–262. [Google Scholar] [CrossRef]
- Barsoukov, E.; Macdonald, J.R. Impedance Spectroscopy, 2nd ed.; John Wiley Sons, Inc.: Hoboken, NJ, USA, 2005; ISBN 9780471716242. [Google Scholar]
- Gantenbein, S.; Weiss, M.; Ivers-Tiffée, E. Impedance based time-domain modeling of lithium-ion batteries: Part I. J. Power Sources 2018, 379, 317–327. [Google Scholar] [CrossRef]
- Liu, W.; Delacourt, C.; Forgez, C.; Pelissier, S. Study of graphite/NCA Li-ion cell degradation during accelerated aging tests—Data analysis of the SIMSTOCK project. In Proceedings of the 2011 IEEE Vehicle Power and Propulsion Conference, Chicago, IL, USA, 6–9 September 2011; pp. 1–6. [Google Scholar]
- Spotnitz, R. Simulation of capacity fade in lithium-ion batteries. J. Power Sources 2003, 113, 72–80. [Google Scholar] [CrossRef]
- Sarasketa-Zabala, E.; Gandiaga, I.; Rodriguez-Martinez, L.M.; Villarreal, I. Calendar ageing analysis of a LiFePO4/graphite cell with dynamic model validations: Towards realistic lifetime predictions. J. Power Sources 2014, 272, 45–57. [Google Scholar] [CrossRef]
- Viswanathan, V.V.V.; Choi, D.; Wang, D.; Xu, W.; Towne, S.; Williford, R.E.; Zhang, J.-G.; Liu, J.; Yang, Z. Effect of entropy change of lithium intercalation in cathodes and anodes on Li-ion battery thermal management. J. Power Sources 2010, 195, 3720–3729. [Google Scholar] [CrossRef]
- Park, M.; Zhang, X.; Chung, M.; Less, G.B.; Sastry, A.M. A review of conduction phenomena in Li-ion batteries. J. Power Sources 2010, 195, 7904–7929. [Google Scholar] [CrossRef]
- Loges, A.; Herberger, S.; Werner, D.; Wetzel, T. Thermal characterization of Li-ion cell electrodes by photothermal deflection spectroscopy. J. Power Sources 2016, 325, 104–115. [Google Scholar] [CrossRef]
- Loges, A.; Herberger, S.; Seegert, P.; Wetzel, T. A study on specific heat capacities of Li-ion cell components and their influence on thermal management. J. Power Sources 2016, 336, 341–350. [Google Scholar] [CrossRef]
- Werner, D.; Loges, A.; Becker, D.J.; Wetzel, T. Thermal conductivity of Li-ion batteries and their electrode configurations—A novel combination of modelling and experimental approach. J. Power Sources 2017, 364, 72–83. [Google Scholar] [CrossRef]
- Wang, J.; Purewal, J.; Liu, P.; Hicks-Garner, J.; Soukazian, S.; Sherman, E.; Sorenson, A.; Vu, L.; Tataria, H.; Verbrugge, M.W. Degradation of lithium ion batteries employing graphite negatives and nickel-cobalt-manganese oxide + spinel manganese oxide positives: Part 1, aging mechanisms and life estimation. J. Power Sources 2014, 269, 937–948. [Google Scholar] [CrossRef]
- Purewal, J.; Wang, J.; Graetz, J.; Soukiazian, S.; Tataria, H.; Verbrugge, M.W. Degradation of lithium ion batteries employing graphite negatives and nickel-cobalt-manganese oxide + spinel manganese oxide positives: Part 2, chemical-mechanical degradation model. J. Power Sources 2014, 272, 1154–1161. [Google Scholar] [CrossRef]
- Ecker, M.; Tran, T.K.D.; Dechent, P.; Käbitz, S.; Warnecke, A.; Sauer, D.U. Parameterization of a Physico-Chemical Model of a Lithium-Ion Battery I. Determination of Parameters. J. Electrochem. Soc. 2015, 162, A1836–A1848. [Google Scholar] [CrossRef]
- Ecker, M.; Käbitz, S.; Laresgoiti, I.; Sauer, D.U. Parameterization of a Physico-Chemical Model of a Lithium-Ion Battery II. Model Validation. J. Electrochem. Soc. 2015, 162, A1849–A1857. [Google Scholar] [CrossRef]
- Von Srbik, M.-T.; Marinescu, M.; Martinez-Botas, R.F.; Offer, G.J. A physically meaningful equivalent circuit network model of a lithium-ion battery accounting for local electrochemical and thermal behaviour, variable double layer capacitance and degradation. J. Power Sources 2016, 325, 171–184. [Google Scholar] [CrossRef]
- Arrhenius, S. Über die Reaktionsgeschwindigkeit bei der Inversion von Rohrzucker durch Säuren. Z. Phys. Chem. 1889, 4, 226–248. [Google Scholar] [CrossRef]
- Schmalstieg, J.; Käbitz, S.; Ecker, M.; Sauer, D.U. A holistic aging model for Li(NiMnCo)O2 based 18650 lithium-ion batteries. J. Power Sources 2014, 257, 325–334. [Google Scholar] [CrossRef]
- Liaw, B.Y.; Roth, E.P.; Jungst, R.G.; Nagasubramanian, G.; Case, H.L.; Doughty, D.H. Correlation of Arrhenius behaviors in power and capacity fades with cell impedance and heat generation in cylindrical lithium-ion cells. J. Power Sources 2003, 119–121, 874–886. [Google Scholar] [CrossRef]
- Zhang, Y.; Wang, C.-Y. Cycle-Life Characterization of Automotive Lithium-Ion Batteries with LiNiO2 Cathode. J. Electrochem. Soc. 2009, 156, A527. [Google Scholar] [CrossRef]
© 2020 by the authors. Licensee MDPI, Basel, Switzerland. This article is an open access article distributed under the terms and conditions of the Creative Commons Attribution (CC BY) license (http://creativecommons.org/licenses/by/4.0/).