1. Introduction
Batteries and supercapacitors [
1,
2,
3] have conquered compact electronic systems for portable applications. As reversible short-time power sources, supercapacitors are used for light emitting diode torches (LED), computer memory backup, actuators and fire protection drive units. Current lithium-ion batteries already reach specific energies above 140 Wh/kg. Integrated electronic systems require life-cycle monitoring of these energy storage devices.
The definition of the state-of-charge (SoC) is based either on the momentary value of open-circuit voltage U(t) or the available electric charge Q; for capacitors, the capacitance value C is employed as well.
Alternatively, SoC measurements [
4] use
The relative voltage until ‘zero’ or the end-point voltage
Ue is reached:
Ampere-hour counting of the consumed electric charge
Q due to the load current
I(
t), starting from the known initial charge or nominal capacity
Q0, whereby a coulombic efficiency
η ≈ 1 is estimated:
The change of resistance or impedance, which does not yield absolute SoC values.
Model-based estimation methods using electrochemical theories, equivalent-circuits, Kalman filters, machine learning applications and so on.
Unfortunately, electric charge and voltage correlate in a different way depending on the cell chemistry. SoC values based on voltage or capacity are hardly comparable. The widely used reference tables connect the momentary open-circuit voltage and actual SoC measured by different methods. External charge/discharge currents, temperature changes, aging, voltage drift, and hysteresis disturb SoC measurements. Therefore, a simple measuring method is required for the determination of the actual residual charge of the storage device.
This work addresses the design of a simple SoC control technique for electrochemical storage devices such as supercapacitors and batteries. As a first step towards a more general application, we investigated time-dependent self-discharge of capacitive interfaces because this process excludes faradaic reactions related to external charging and discharging.
2. State-of-the-Art
The more recent literature reflects the growing interest in SoC estimation of energy storage devices. Research gaps exist with respect to SoC prediction, which is essential to safe application, optimizing energy management, extending the life cycle, and reducing the cost of battery systems [
5,
6,
7]. Near-future electric vehicles require some comprehensive model-based battery health and lifetime monitoring applications including predictive functions [
8,
9,
10]. As a matter of fact, batteries suffer from nonlinear characteristics and are further influenced by operational conditions, driving loads, and further random factors of the application. Appropriate models for accurate SoC estimation of lithium-ion batteries are still being researched. No general approach for the best equivalent circuit model has yet been found even for the same cell chemistry [
11] The first- and second-order RC models seem to be sufficiently accurate and reliable, whereas the higher-order RC model provide better robustness with variation in model parameters (R resistance, C capacitance). Considerable research has been focusing on universal modeling tools for rechargeable batteries [
12,
13] as well as the real-time evaluation of impedance data along the charge-discharge characteristics [
14]. This evaluation is generally difficult in the area of diffusion impedance due to the relatively long measurement duration at low frequencies.
This work mainly considers commercial supercapacitors and hybrid capacitors and does not focus on the many interactions between the electrode structure and charge capacity [
15]. Therefore, we refer to promising new materials such a carbon dots and similar nanostructures [
16,
17], as well as composites using conducting polymers [
18] which might give future insights into the molecular dimensions of self-discharge.
2.1. Self-Discharge of Supercapacitors
According to the literature, little is known about the mechanisms that cause the gradual loss of voltage in charged double-layer capacitors stored at open-circuit for several months. The origin of self-discharge is believed to be caused by different processes in different time scales (Conway [
19]).
The rapid redox reactions at the phase boundary between electrode and electrolyte (charge transfer reaction), especially with overcharging and electrolyte decomposition, change in time according to a logarithmic relation: U ∼ ln t (voltage U, time t).
The diffusion limited voltage relaxation in the porous electrodes in the course of several hours, especially in the presence of traces of water, seems to obey a square root law:
U ∼
t1/2. The diffusion current density by excess ions
i from the electrolyte, which cause the self-discharge, follows Fick’s 2nd law (d
c/d
t =
D d
2c/d
x2; molar concentration
c, layer thickness
x ≈ 60 µm, diffusion coefficient
D ≈ 4 × 10
−13·m
2·s
−1) at given temperature and starting voltage
U0 > 1 V [
20]:
The genuine self-discharge in the electric field between the microporous electrodes within some days follows an exponential law:
The leakage current by self-discharge, in the range of microamperes depending on the ambient temperature, can roughly be estimated with the assistance of the rated capacitance
C of the supercapacitor, and the gradual drop of the momentary open-circuit voltage in time [
21]:
The mechanisms of self-discharge are speculative. The ions, which adsorb at polar groups in the carbon material (C–O, C=O, COOH), seem to lose their mobility so that consequently the ionic conductivity of the electrode/electrolyte interface drops [
22]. A concentration-driven reorganization of the multilayer adsorbed ions into the deeper pores of the electrodes might be possible. The thicker the blocking layer for the charge-transfer reaction, the greater the leakage resistance. Tevi’s model [
23] treats self-discharge with the assistance of the Butler-Volmer equation at given rate constant
k(
E,
d) = −(d
E/d
t)/
E, electrode potential
E, and barrier layer thickness
d. The empirical coefficients
α,
β, and
m are found by a comparison of electrodes both with and without additional polymer layer.
The long-term trend of self-discharge after months and years is largely unknown [
24]. It was reported that the leakage resistance
RL continuously increases. However, it slows in time, until a maximum is reached [
25]. The
RL(
t) curve was described to show three slopes: after 24 h, after some weeks, and after some months; then it drops again.
The voltage-time curve of a supercapacitor, starting from different states-of-charge, is not simply an exponential function; rather it follows a fifth-order polynomial [
26]. There is no clear equivalent circuit that completely displays the self-discharge processes. The
C∥
RL parallel network with the leakage resistance
RL appears to be insufficient. In a further alternative, ladder networks comprising three and more R–C elements might be fruitful.
2.2. Frequency Response of Capacitance
We propose to utilize capacitance as a measure of the SoC. The definition of capacitance, C = Q/U, suggests a practical correlation between electric charge Q and voltage window ΔU. The capacitive voltage drop in time is useful for constant-current discharge measurements. In addition, a given scan rate v allows capacitance determination by cyclic voltammetry, thus, evaluating both charge and discharge currents.
For capacitance determination using impedance spectroscopy, we employ the frequency-dependent quantity
C(
ω) [
27].
Equation (10) might be interpreted as the parallel combination of a frequency-dependent capacitor and a resistor, although no specific model is required, and can, therefore, be used for in-depth evaluation of complex impedance without any previous knowledge on reaction kinetics [
28]. A perfect capacitor does not show any self-discharge or leakage current. A real capacitor, however, tends to discharge during several weeks when stored at open terminals. Therefore, the equivalent circuit provides a leakage resistance in parallel to the capacitance (
Figure 1). Under the assumption that this leakage resistance is infinitely large, Equation (10) becomes Equation (11).
At frequencies above 1 kHz, the phase boundary capacitance between electrode and electrolyte turns towards the geometric double-layer capacitance of the active surface. At low frequencies, ions from the electrolyte penetrate the porous electrode material, and battery-like faradaic reactions play a role. The resulting pseudo capacitance,
C(
ω,
T,
U), depends on frequency, temperature, and voltage, and cannot be modeled by intuitive and simply plausible equivalent-circuits [
29].
2.3. State-of-Charge of Batteries
At present, there is a need for a reliable impedance method for the SoC determination for automotive applications. Earlier approaches [
30,
31] concentrated on the cell resistance. The internal resistance
R of a lithium-ion battery was reported to reach an unclear minimum around SoC ≈ 50%. The curvature of the U-shaped
R(SoC) characteristics [
32] was found to grow with the age of the battery and corresponds to the gradually increasing slope of the line of
R/SoC against SoC, which might be used as a measure of the battery state-of-health (SoH).
The charge transfer resistance (first arc in the impedance spectrum) drops with increasing C-rate (discharge current), according to Ohm’s law:
R ∼
I−1. Depending on the cell chemistry, the resistance at frequencies above 100 Hz is usually reduced with recharging the battery. Unfortunately, the relative change of cell resistance strongly depends on temperature [
33]. The passivation and charge-transfer resistance of cobalt-manganese and nickel-cobalt-aluminum batteries are significantly determined by the graphite anode [
34]. Lithium iron phosphate (LFP) provides a small internal resistance although the diffusion resistance in the solid phase is large.
The diffusion resistance (second arc in the impedance spectrum) gets slightly smaller at high C-rates. With repeated charging the battery, the slope of diffusion impedance (third section in the complex plane) appears less steep.
Deep discharge dramatically alters both the charge transfer and the diffusion impedance. The growing imaginary parts in the diffusion arc at low frequencies (0.01 Hz) indicate that the battery has been damaged by deep discharge, for example, SoC < 27% of a Ni-Mn-Co oxide/graphite system [
31]. The minimum frequency
f2 of the complex plane plot, and, less significantly, the transition frequency
f23 near the real axis between charge transfer and diffusion arc, trend towards small values (SoC < 40%). Cell resistance seems to reflect the SoC in an unreliable way. Hitherto, the value of capacitance has not been considered in detail with respect to SoC measurements in batteries.
3. Results and Discussion
3.1. Self-Discharge of Supercapacitors
The goal of this study was to find a correlation between the capacitance and the SoC. We tried to avoid the impact of electrochemical aging by not applying any current to the supercapacitor, i.e., we observed the self-discharge at open terminals. Our previous experience has shown that fully charged supercapacitors can be stored for several years without showing significant changes of the impedance spectra. Aging does require either thermal stress or overvoltage [
29].
We charged carbon-based supercapacitors at rated voltage, U0, for at least 1 h until the leakage current dropped below 2 mA. The devices were stored with open terminals at room temperature and 80 °C for 600 days. The cell voltage was measured every day for some seconds using a high-impedance voltmeter. Impedance spectra were recorded in the frequency range between 10 kHz to 0.1 Hz using a sinusoidal voltage (amplitude: 50 mV) superimposed on the momentary open-circuit voltage. Several tens of repeated impedance measurements of fully charged capacitors did not show any significant impact on the SoC, because of the bias control during the measurement.
The influence of the impedance measurement on the discharge of the capacitor can be neglected because the duration of measurement (approximately 4 min) is much less than the characteristic time constants as determined in
Table 1. The total connection time of the impedance spectrometer is also less than these time constants and the uncertainty arising from the fitting procedure. Compared with the nearly 600 days of the self-discharge experiment, the total duration of all impedance measurements (that were recorded once a week or less) is negligible. The tiny AC currents during the impedance measurements may be neglected as well, because, they periodically charge and discharge the capacitor for a couple of minutes without changing the current SoC.
3.1.1. Impedance Spectra
In the long-term trend, the complex plane plots in
Figure 2 show qualitatively the same shape. With increasing self-discharge, the Nyquist plot gets narrower,
R(
t) is proportional to
U(
t). The cell resistance, corrected by the electrolyte resistance,
R −
Re, drops rather than increases in time. Arbitrary shifts on the real axis in the milliohm range are caused by the contact leads. The electrolyte resistance,
Re = Re
Z(
ω → ∞), i.e., the zero passage in the complex plane at about 200 Hz, does not change on the average during self-discharge within the measuring accuracy. In addition, the nearly constant equivalent series resistance (ESR) at 1 kHz and 1 Hz have little meaning for SoC determination, even if the cable resistance
R(
ω → ∞) is properly subtracted.
The resistance at low frequencies, R(≤1 Hz), does not significantly change with self-discharge. The quarter circle at high frequencies is caused by the grain-boundary resistance of the active carbon particles in the electrolyte solution, which is superimposed by the charge transfer reaction. The more or less linear section at medium frequencies reflects the diffusion of charge carriers between the wet carbon particles. With aged capacitors especially, the resistance at high frequencies is determined by the adhesive that holds together the powder composite on the aluminum current collector.
Capacitance, in contrast to resistance, shows a clear logarithmic correlation with storage time. In general, capacitance at medium frequencies is determined by the charge transfer of electrons at the electrode-electrolyte interface.
where
α =
U/
U0 denotes the SoC. At low frequencies, the frozen mass transport of charge carriers in the porous electrodes leads to a more or less constant capacitance. According to Equation (11), the value
C = [
ω Im
Z]
−1, at any given frequency, changes roughly linearly with the state-of-charge (SoC,
α), as shown in
Figure 2.
3.1.2. Self-Discharge Characteristics
In the course of self-discharge, the open-circuit voltage drops exponentially in time according to −log
U ∼
t, as shown in
Figure 3. One might expect a first-order kinetics, whereby
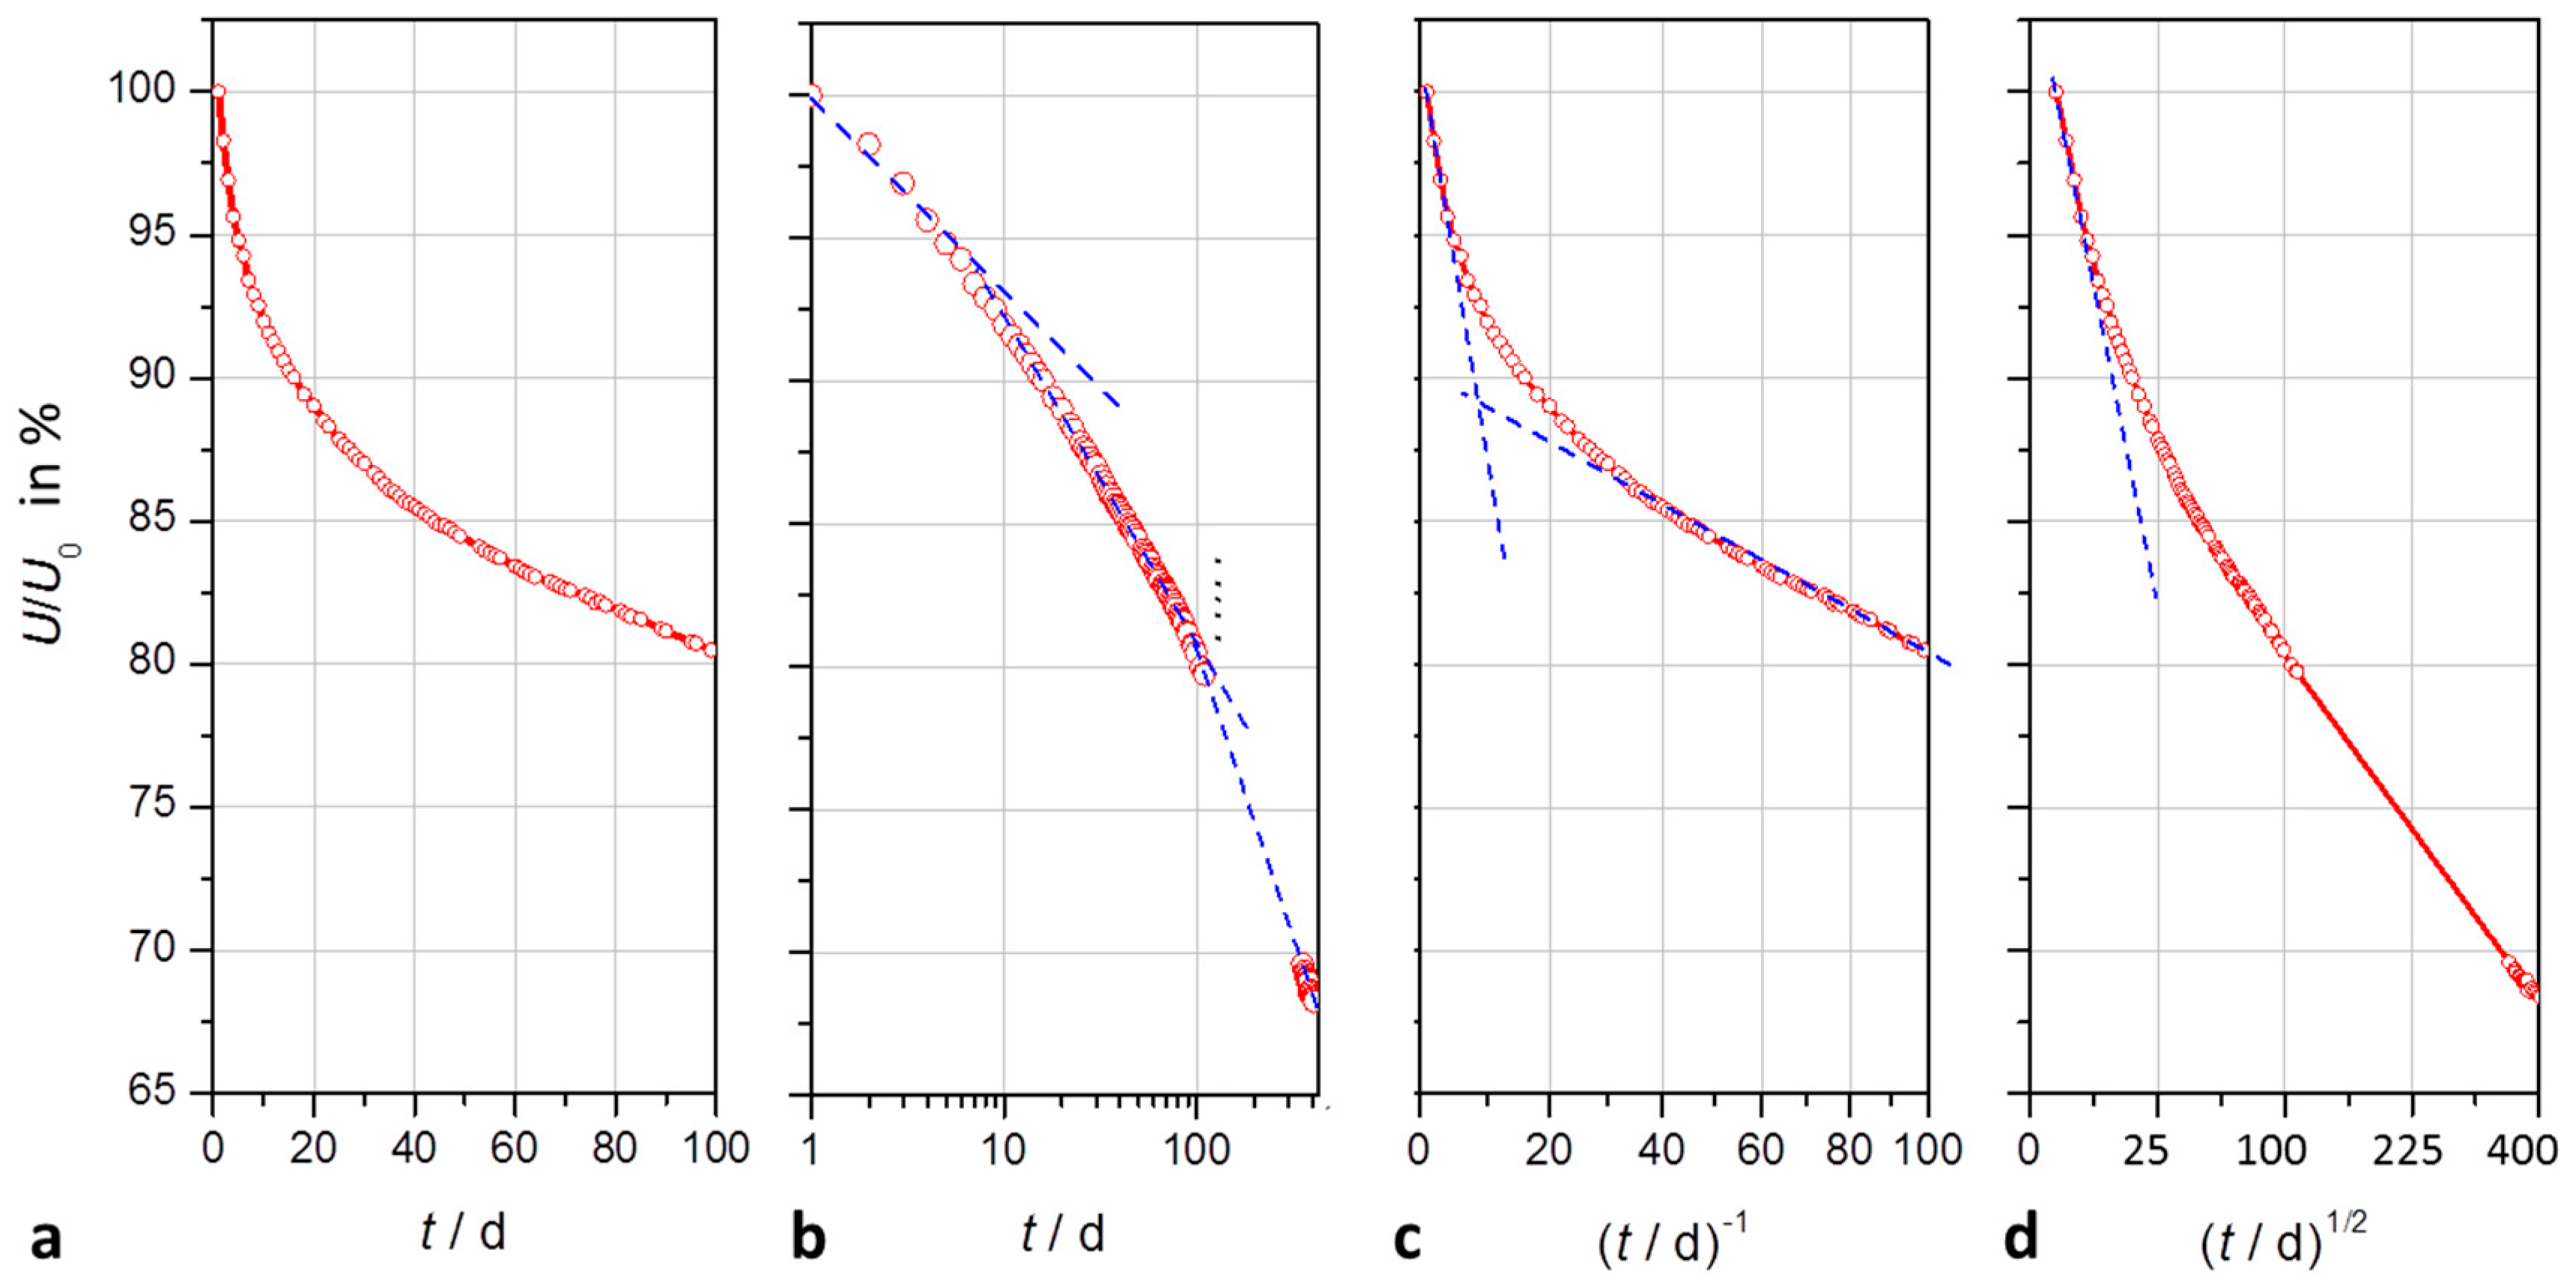
a0 ≈ 0 is the limiting value of the ‘empty’ capacitor after several years of self-discharge.
The time constant T1 lies in the range of two weeks for the first 100 days of self-discharge. However, after two months a second time constant T2 becomes obvious.
For the first 400 days, fit quality reaches more than 99.9%. However, different supercapacitors of the same type show some divergence of the parameters, so that no universal values valid for all devices can be given.
Table 1 compiles the self-discharge after nearly 600 days.
With respect to the approximation that e
−t ≈ 1 +
t−1, we can explain the reciprocal relationship between cell voltage and time,
U ∼
t−1, which is obvious by the asymptote in the first hours of self-discharge, and as well after some weeks (
t ≫ 20 d) in
Figure 3c.
Nonlinear least squares fitting does not generally exclude a square root law, U ∼ t1/2, which explains diffusion processes. However, fit quality is worse than with exponential functions.
In the transition time between 10 and 100 days, cell voltage follows U ∼ −log t, which suggests a self-discharge reaction determined by faradaic charge transfer.
The slope roughly equals B ≈ 0.04 for supercapacitors of different manufacturers.
We conclude that the self-discharge of supercapacitors is described best by an exponential function comprising two time constants in the range of several days and weeks, respectively. A third time constant affects self-discharge not earlier than after about ten months. A fourth time constant in the range of five years is not important (
Table 1).
3.1.3. Temperature Dependence
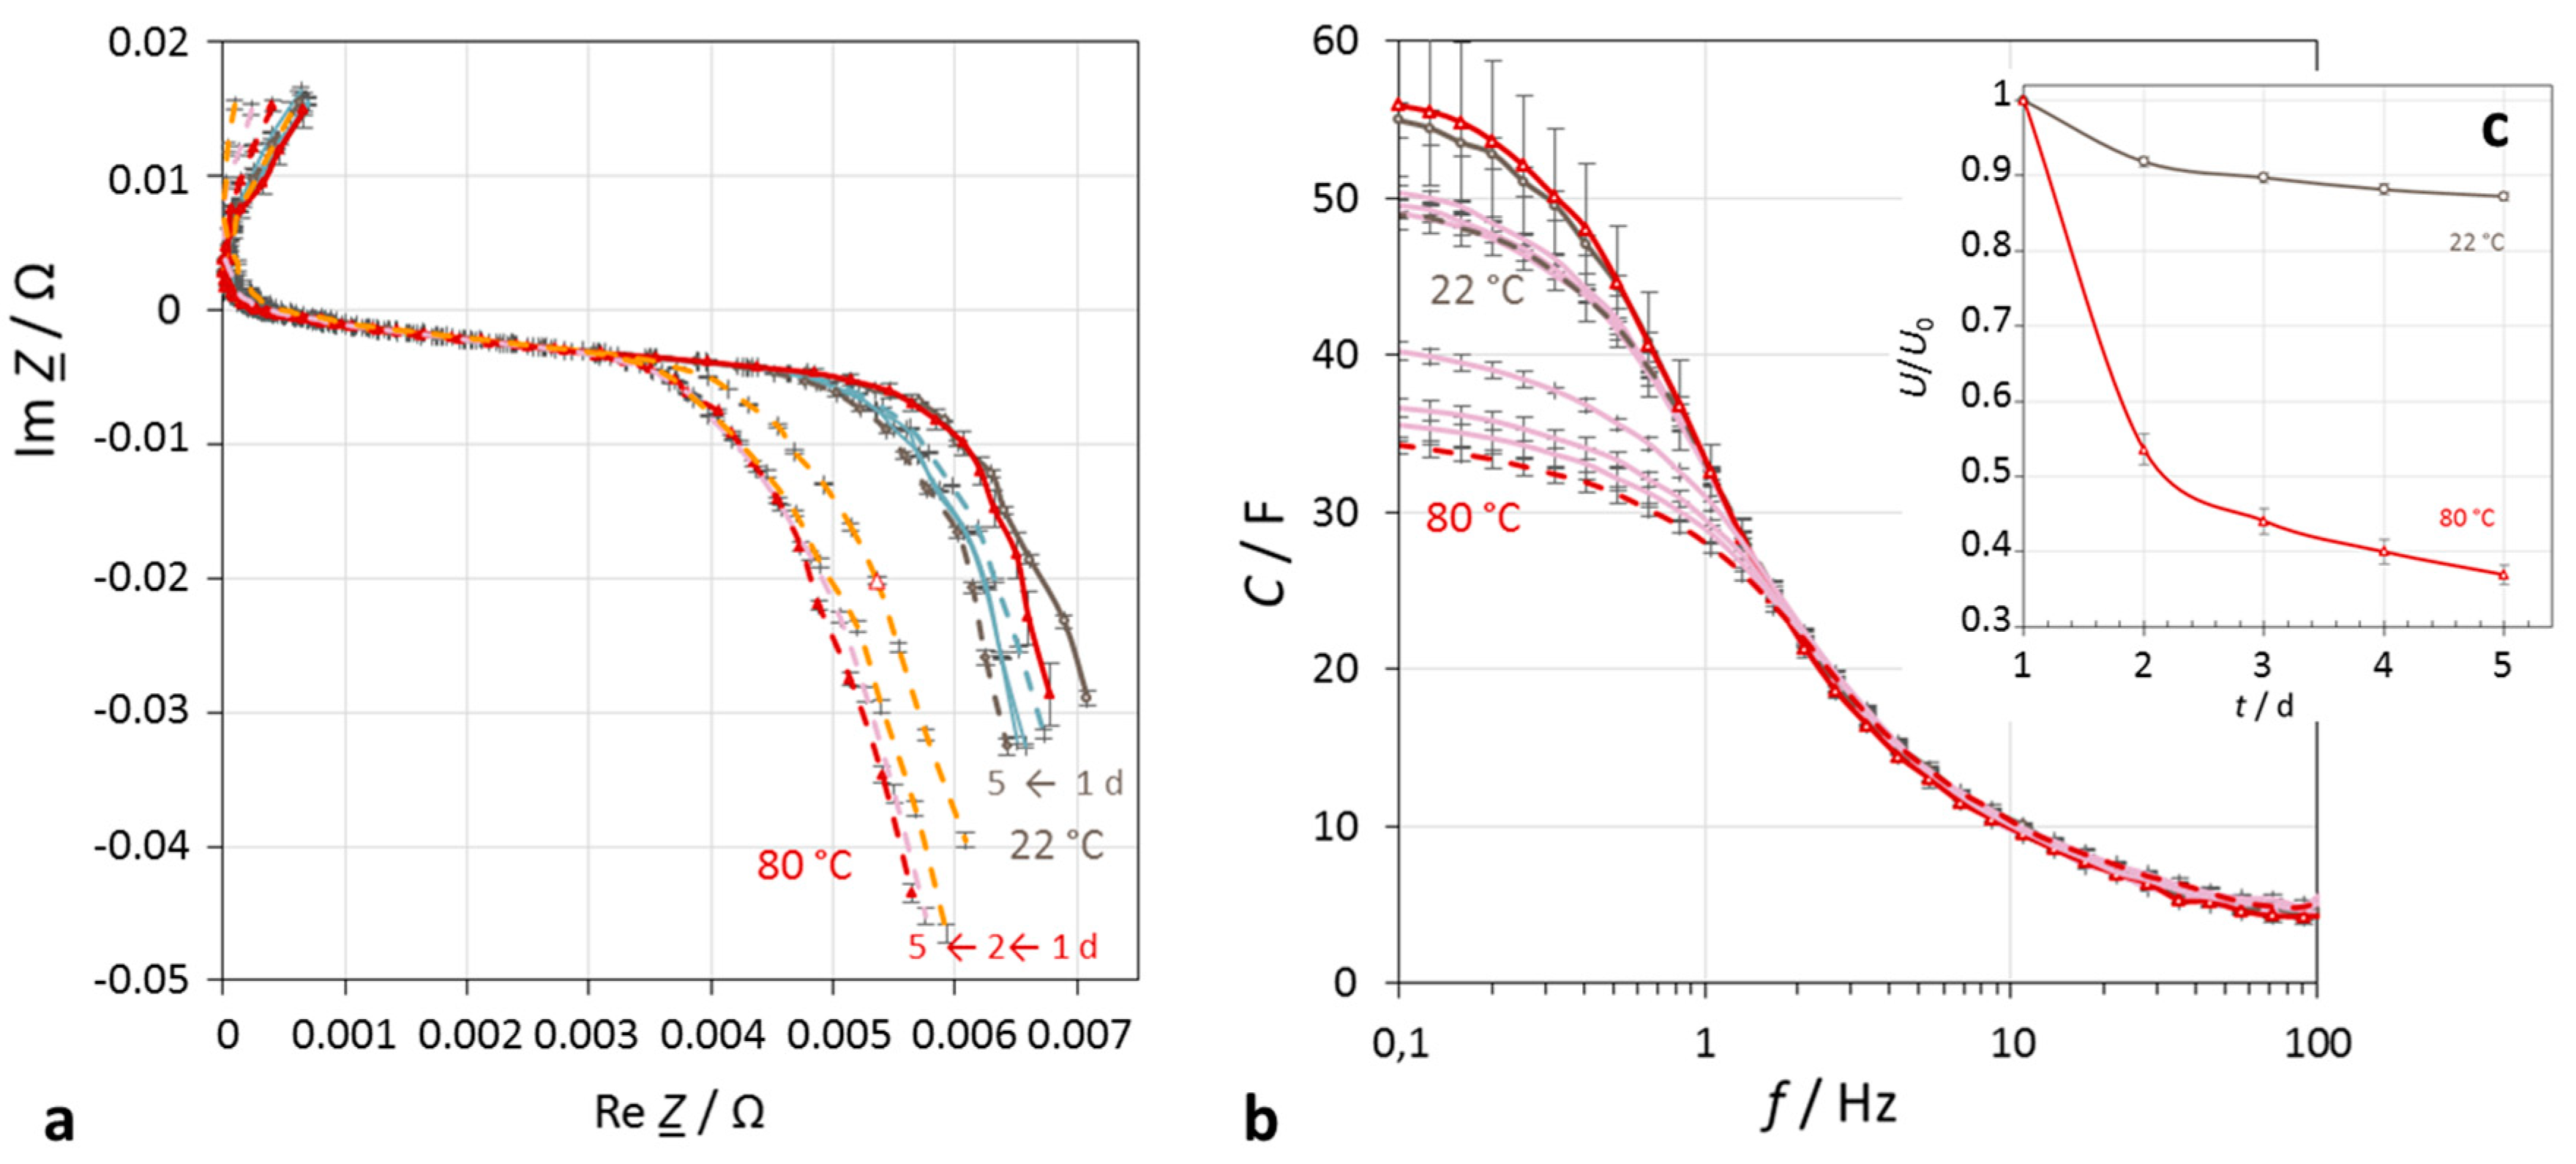
At elevated temperatures, the pseudo-exponential self-discharge characteristics (
Figure 4) drop markedly steeper than in the cold. For example: 2.7 V → 2.36 V (13% change) at 20 °C, but 2.7 V → 1.0 V (63%) at 80 °C within four days.
Self-discharge depends moderately on the initial voltage (SoC). With fully charged supercapacitors, the voltage drops more strongly than at incomplete charge. For example, at 50 °C: 2.4 V → 2.25 V (6% change), in contrast to 1.8 V → 1.75 V (3%).
In addition, our earlier investigations [
35] indicated that self-discharge increases with rising temperature, following first-order kinetics according to Arrhenius’s law.
The activation energy in activated carbon supercapacitors amounts to about EA = 50 Kj·mol−1, which is typical for sorption processes in heterogeneous catalysis. Hence, slow electrochemical reactions drive a small leakage current across the double-layer at the electrode-electrolyte interface. The mechanisms of self-discharge are speculative at the moment. Redox reactions by impurities and dissolved gases might play a role, as well as the relaxation of overcharged states to a lower potential.
3.2. State-of-Charge of Lithium-Ion Batteries
According to our measurements, the self-discharge of lithium-ion batteries stored at open terminals proceeds substantially slower than with supercapacitors. For comparison purposes, a hybrid supercapacitor was measured, too.
The impedance spectra show two regions (
Figure 5):
Electrolyte resistance Re and the subsequent vague quarter-circle, which is related to the lithium-ion conducting passive layer on the electrode (solid-electrolyte interphase, <1000 Hz), semicircle of the double-layer and charge transfer reaction (<100 Hz),
Diffusion impedance of the porous electrodes (<2 Hz).
In this study, the quantity
U/
U0 appeared to be a good and simple measure of the SoC, because we aimed to find a general correlation with capacitance. In practical systems, OCV-SoC reference tables are most useful for the estimation of the real SoC and further SoH statements (Zou et al. [
8,
9]).
3.3. Capacitice Charge Status
Fully charged lithium-ion batteries were discharged with the help of an external load by defined partial charged dQ until predefined SoC states were reached.
The impedance spectra in
Figure 6 get the narrower, the higher is the SoC. This means that the charge transfer and diffusion resistance increase with the depth-of-discharge of the battery. The electrolyte resistance is more or less constant during charging and discharging.
With lithium-ion batteries, electric charge and SoC correlate excellently:
Capacitance appears to be a roughly linear measure of the cell voltage: U ∼ C. Overcharge and deep discharge cause deviations, so that rather a sigmoidal relation is assumed. Using double-logarithmic axes, a sufficient linearity of capacitance and cell voltage is observed.
Table 2 compiles resistances and capacitances of a lithium-ion battery at different SoC values. Capacitance at 0.1 Hz multiplied by the cell voltage yields the approximate actually available electric charge,
Q =
CU. This means that DC capacitance reflects the true SoC. The capacitance at 100 Hz directly indicates the SoC:
α = (
C + 1.27)/2.59, in the example in
Figure 6. However, a useful scaling has yet to be found to provide absolute charge values, when AC capacitance is measured at high frequencies. Moreover, it becomes obvious that the state-of-voltage values
U/
U0 differ from the real SoC
Q/
Q0.
Curve Fitting
The Nyquist plot of a lithium-ion battery can be modeled by a capacitance (constant phase element, CPE) in parallel to the solid-electrolyte interphase (SEI) and charge-transfer resistance. The diffusion arc obeys a Warburg impedance W, supplemented by a serial capacitance
C0, which considers the periodic intercalation of lithium ions during the impedance measurement. In additional, an inductance L shifts the impedance spectrum towards positive imaginary parts (Huang et al. [
31]).
where − denotes a series combination,
a parallel combination. The frequency at the minimum of the semicircle (most negative imaginary part in mathematical convention) reflects the reciprocal of the time constant of the charge-transfer process,
τ = (2
π·
f)
−1 =
RC.
The Warburg coefficient roughly equals
α ≈ 0.9 for the SEI and
α ≈ 0.6 for the charge transfer process of a 15 Ah-NCM/graphite battery (Huang et al. [
31]).
In recent approaches, the impedance spectrum is transformed to the time domain to find out the statistical distribution of the time constants of a hypothetical transmission line model consisting of a ladder network of incremental d
R∥d
C elements [
34,
36].
As far as the curve fitting efforts are concerned, we conclude that the simple correlation of capacitance and SoC fits for the purpose of practical use.
4. Conclusions
To summarize, the cell resistance appears to be an inappropriate measure of the available electric charge in a storage device. The capacitance value determined at a frequency of about 100 Hz allows a straightforward SoC control of supercapacitors and lithium-ion batteries. There is no need for any model descriptions or equivalent circuits, which are often unclear and complicate the system analysis during operation.
For lithium-ion batteries, capacitance extracted from impedance spectra reliably indicates the available electric charge in the working range between full charge (without overload) and cut-off voltage (without deep discharge). An approximately linear correlation was found between capacitance at medium SoC values:
Log denotes the decadic logarithm. This relation is obstructed by external charge/discharge currents so that a sigmoidal function is more reasonable in the regimes of overcharge and deep discharge. A correlation that directly yields absolute SoC values from impedance spectra is still missing.
Author Contributions
Writing—Original Draft Preparation, both authors; Writing—Review & Editing, both authors.
Funding
This work was by financially supported by the Federal State of Bavaria, Germany, in the framework of internal cluster funding (OTH Amberg-Weiden and OTH Regensburg).
Acknowledgments
We thank our students Anton Udalzow and Thierry Assopguimya for some experimental contributions according to our instructions.
Conflicts of Interest
The authors declare no conflict of interest. The funders had no role in the design of the study; in the collection, analyses, or interpretation of data; in the writing of the manuscript, and in the decision to publish the results.
References
- Conway, B.E. Electrochemical Supercapacitors: Scientific Fundamentals and Technological Applications; Kluwer Academic/Plenum Publishers: New York, NY, USA, 1999. [Google Scholar]
- Beguin, F.; Frackowiak, E. Supercapacitors: Materials, Systems, and Applications; Wiley-VCH: Weinheim, Germany, 2013. [Google Scholar]
- Kurzweil, P. Electrochemical Double Layer Capacitors. In Electrochemical Energy Storage for Renewable Sources and Grid Balancing; Moseley, P.T., Garche, J., Eds.; Elsevier: Amsterdam, The Netherlands, 2015; Chapter 19; pp. 346–407. [Google Scholar]
- Xiong, R.; Cao, J.; Yu, Q.; He, H.; Sun, F. Critical Review on the Battery State of Charge Estimation Methods for Electric Vehicles. IEEE Access 2017, 6, 1832–1843. [Google Scholar] [CrossRef]
- Barre, A.; Deguilhem, B.; Grolleau, S.; Gerard, M.; Suard, F.; Riu, D. A review on lithium-ion battery ageing mechanisms and estimations for automotive applications. J. Power Sources 2013, 241, 680–689. [Google Scholar] [CrossRef]
- Weigert, T.; Tian, Q.; Lian, K. State-of-charge prediction of batteries and battery-supercapacitor hybrids using artificial neural networks. J. Power Sources 2011, 196, 4061–4066. [Google Scholar] [CrossRef]
- Yang, H. Estimation of Supercapacitor Charge Capacity Bounds Considering Charge Redistribution. IEEE Trans. Power Electron. 2018, 33, 6980–6993. [Google Scholar] [CrossRef]
- Zou, C.; Manzie, C.; Nesic, D.; Kallapur, A.G. Multi-time-scale observer design for state-of-charge and state-of-health of a lithium-ion battery. J. Power Sources 2016, 335, 121–139. [Google Scholar] [CrossRef]
- Zou, C.; Hu, X.; Wei, Z.; Tang, X. Electrothermal dynamics-conscious lithium-ion battery cell-level charging management via state-monitored predictive control. Energy 2017, 141, 250–259. [Google Scholar] [CrossRef]
- Zou, C.; Zhang, L.; Hu, X.; Wang, Z.; Wik, T.; Pecht, M. A review of fractional-order techniques applied to lithium-ion batteries, lead-acid batteries, and supercapacitors. J. Power Sources 2018, 390, 286–296. [Google Scholar] [CrossRef]
- Lai, X.; Zheng, Y.; Sun, T. A comparative study of different equivalent circuit models for estimating state-of-charge of lithium-ion batteries. Electrochim. Acta 2018, 259, 566–577. [Google Scholar] [CrossRef]
- Dubarry, M.; Liaw, B.Y. Development of a universal modeling tool for rechargeable lithium batteries. J. Power Sources 2007, 174, 856–860. [Google Scholar] [CrossRef]
- Dubarry, M.; Truchot, C.; Liaw, B.Y. Synthesize battery degradation modes via a diagnostic and prognostic model. J. Power Sources 2012, 219, 204–216. [Google Scholar] [CrossRef]
- Cui, Y.; Zuo, P.; Du, C.; Gao, Y.; Yang, J.; Cheng, X.; Ma, Y.; Yin, G. State of health diagnosis model for lithium ion batteries based on real-time impedance and open circuit voltage parameters identification method. Energy 2018, 144, 647–656. [Google Scholar] [CrossRef]
- Yang, H. Effects of supercapacitor physics on its charge capacity. IEEE Trans. Power Electron. 2018. [CrossRef]
- Genc, R.; Alas, M.O.; Harputlu, E.; Repp, S.; Kremer, N.; Castellano, M.; Colak, S.G.; Ocakoglu, K.; Erdem, E. High-Capacitance Hybrid Supercapacitor Based on Multi-Colored Fluorescent Carbon-Dots. Sci. Rep. 2017, 7, 11222. [Google Scholar] [CrossRef] [PubMed]
- Repp, S.; Harputlu, E.; Gurgen, S.; Castellan, M.; Kremer, N.; Pompe, N.; Wörner, J.; Hoffmann, A.; Thomann, R.; Emen, F.M.; et al. Synergetic effects of Fe3+ doped spinel Li4Ti5O12 nanoparticles on reduced graphene oxide for high surface electrode hybrid supercapacitors. Nanoscale 2018, 10, 1877–1884. [Google Scholar] [CrossRef] [PubMed]
- Lehtimäki, S.; Suominen, M.; Damlin, P.; Tuukkanen, T.; Kvarnström, C.; Lupo, D. Preparation of Supercapacitors on Flexible Substrates with Electrodeposited PEDOT/Graphene Composites. ACS Appl. Mater. Interfaces 2015, 7, 22137–22147. [Google Scholar] [CrossRef] [PubMed]
- Conway, B.E.; Pell, W.G.; Liu, T.C. Diagnostic analyses for mechanisms of self-discharge of electrochemical capacitors and batteries. J. Power Sources 1997, 65, 53–59. [Google Scholar] [CrossRef]
- Ricketts, B.W.; Ton-That, C. Self-discharge of carbon-based supercapacitors with organic electrolytes. J. Power Sources 2000, 89, 64–69. [Google Scholar] [CrossRef]
- Bohlen, O.; Kowal, J.; Sauer, D.U. Ageing behaviour of electrochemical double layer capacitors, Part II. Lifetime simulation model for dynamic applications. J. Power Sources 2007, 173, 626–632. [Google Scholar]
- Zhang, Q.; Cai, C.; Qin, J.; Wei, B. Tunable self-discharge process of carbon nanotube based supercapacitors. Nano Energy 2014, 4, 14–22. [Google Scholar] [CrossRef]
- Tevi, T.; Takshi, A. Modeling and simulation study of the self-discharge in supercapacitors in presence of a blocking layer. J. Power Sources 2015, 273, 857–862. [Google Scholar] [CrossRef]
- Yang, H.; Zhang, Y. Self-discharge analysis and characterization of supercapacitors for environmentally powered wireless sensor network applications. J. Power Sources 2011, 196, 8866–8873. [Google Scholar] [CrossRef]
- Kowal, J.; Avaroglu, E.; Chamekh, F.; Senfelds, A.; Thien, T.; Wijaya, D.; Sauer, D.U. Detailed analysis of the self-discharge of supercapacitors. J. Power Sources 2011, 196, 573–579. [Google Scholar] [CrossRef]
- Shen, J.F.; He, Y.J.; Ma, Z.F. A systematical evaluation of polynomial based equivalent circuit model for charge redistribution dominated self-discharge process in supercapacitors. J. Power Sources 2016, 303, 294–304. [Google Scholar] [CrossRef]
- Kurzweil, P.; Ober, J.; Wabner, D.W. Method for Correction and Analysis of Impedance Spectra. Electrochim. Acta 1989, 34, 1179–1185. [Google Scholar] [CrossRef]
- Kurzweil, P.; Fischle, H.J. A new monitoring method for electrochemical aggregates by impedance spectroscopy. J. Power Sources 2004, 127, 331–340. [Google Scholar] [CrossRef]
- Kurzweil, P.; Frenzel, B.; Hildebrand, A. Voltage-dependent capacitance, aging effects, and failure indicators of double-layer capacitors during lifetime testing. ChemElectroChem 2015, 2, 6–13. [Google Scholar] [CrossRef]
- Fernández Pulido, Y.; Blanco, C.; Ansean, D.; García, V.M.; Ferrero, F.; Valledor, M. Determination of suitable parameters for battery analysis by Electrochemical Impedance Spectroscopy. Measurement 2017, 106, 1–11. [Google Scholar] [CrossRef]
- Huang, Q.A.; Shen, Y.; Huang, Y.; Zhang, L.; Zhang, J. Impedance Characteristics and Diagnoses of Automotive Lithium-Ion Batteries at 7.5% to 93.0% State of Charge. Electrochim. Acta 2016, 219, 751–765. [Google Scholar] [CrossRef]
- Hung, M.H.; Lin, C.H.; Lee, L.C.; Wang, C.M. State-of-charge and state-of-health estimation for lithium-ion batteries based on dynamic impedance technique. J. Power Sources 2014, 268, 861–873. [Google Scholar] [CrossRef]
- Skoog, S.; David, S. Parameterization of linear equivalent circuit models over wide temperature and SOC spans for automotive lithium-ion cells using electrochemical impedance spectroscopy. J. Energy Storage 2017, 14, 39–48. [Google Scholar] [CrossRef]
- Manikandan, B.; Ramar, V.; Yap, C.; Balaya, P. Investigation of physico-chemical processes in lithium-ion batteries. J. Power Sources 2017, 361, 300–309. [Google Scholar] [CrossRef]
- Kurzweil, P.; Hildebrand, A.; Weiß, M. Accelerated Life Testing of Double-Layer Capacitors: Reliability and Safety under Excess Voltage and Temperature. ChemElectroChem 2015, 2, 150–159. [Google Scholar] [CrossRef]
- Itagaki, M.; Ueno, M.; Hoshi, Y.; Shitanda, I. Simultaneous Determination of Electrochemical Impedance of Lithium-ion Rechargeable Batteries with Measurement of Charge-discharge Curves by Wavelet Transformation. Electrochim. Acta 2017, 235, 384–389. [Google Scholar] [CrossRef]
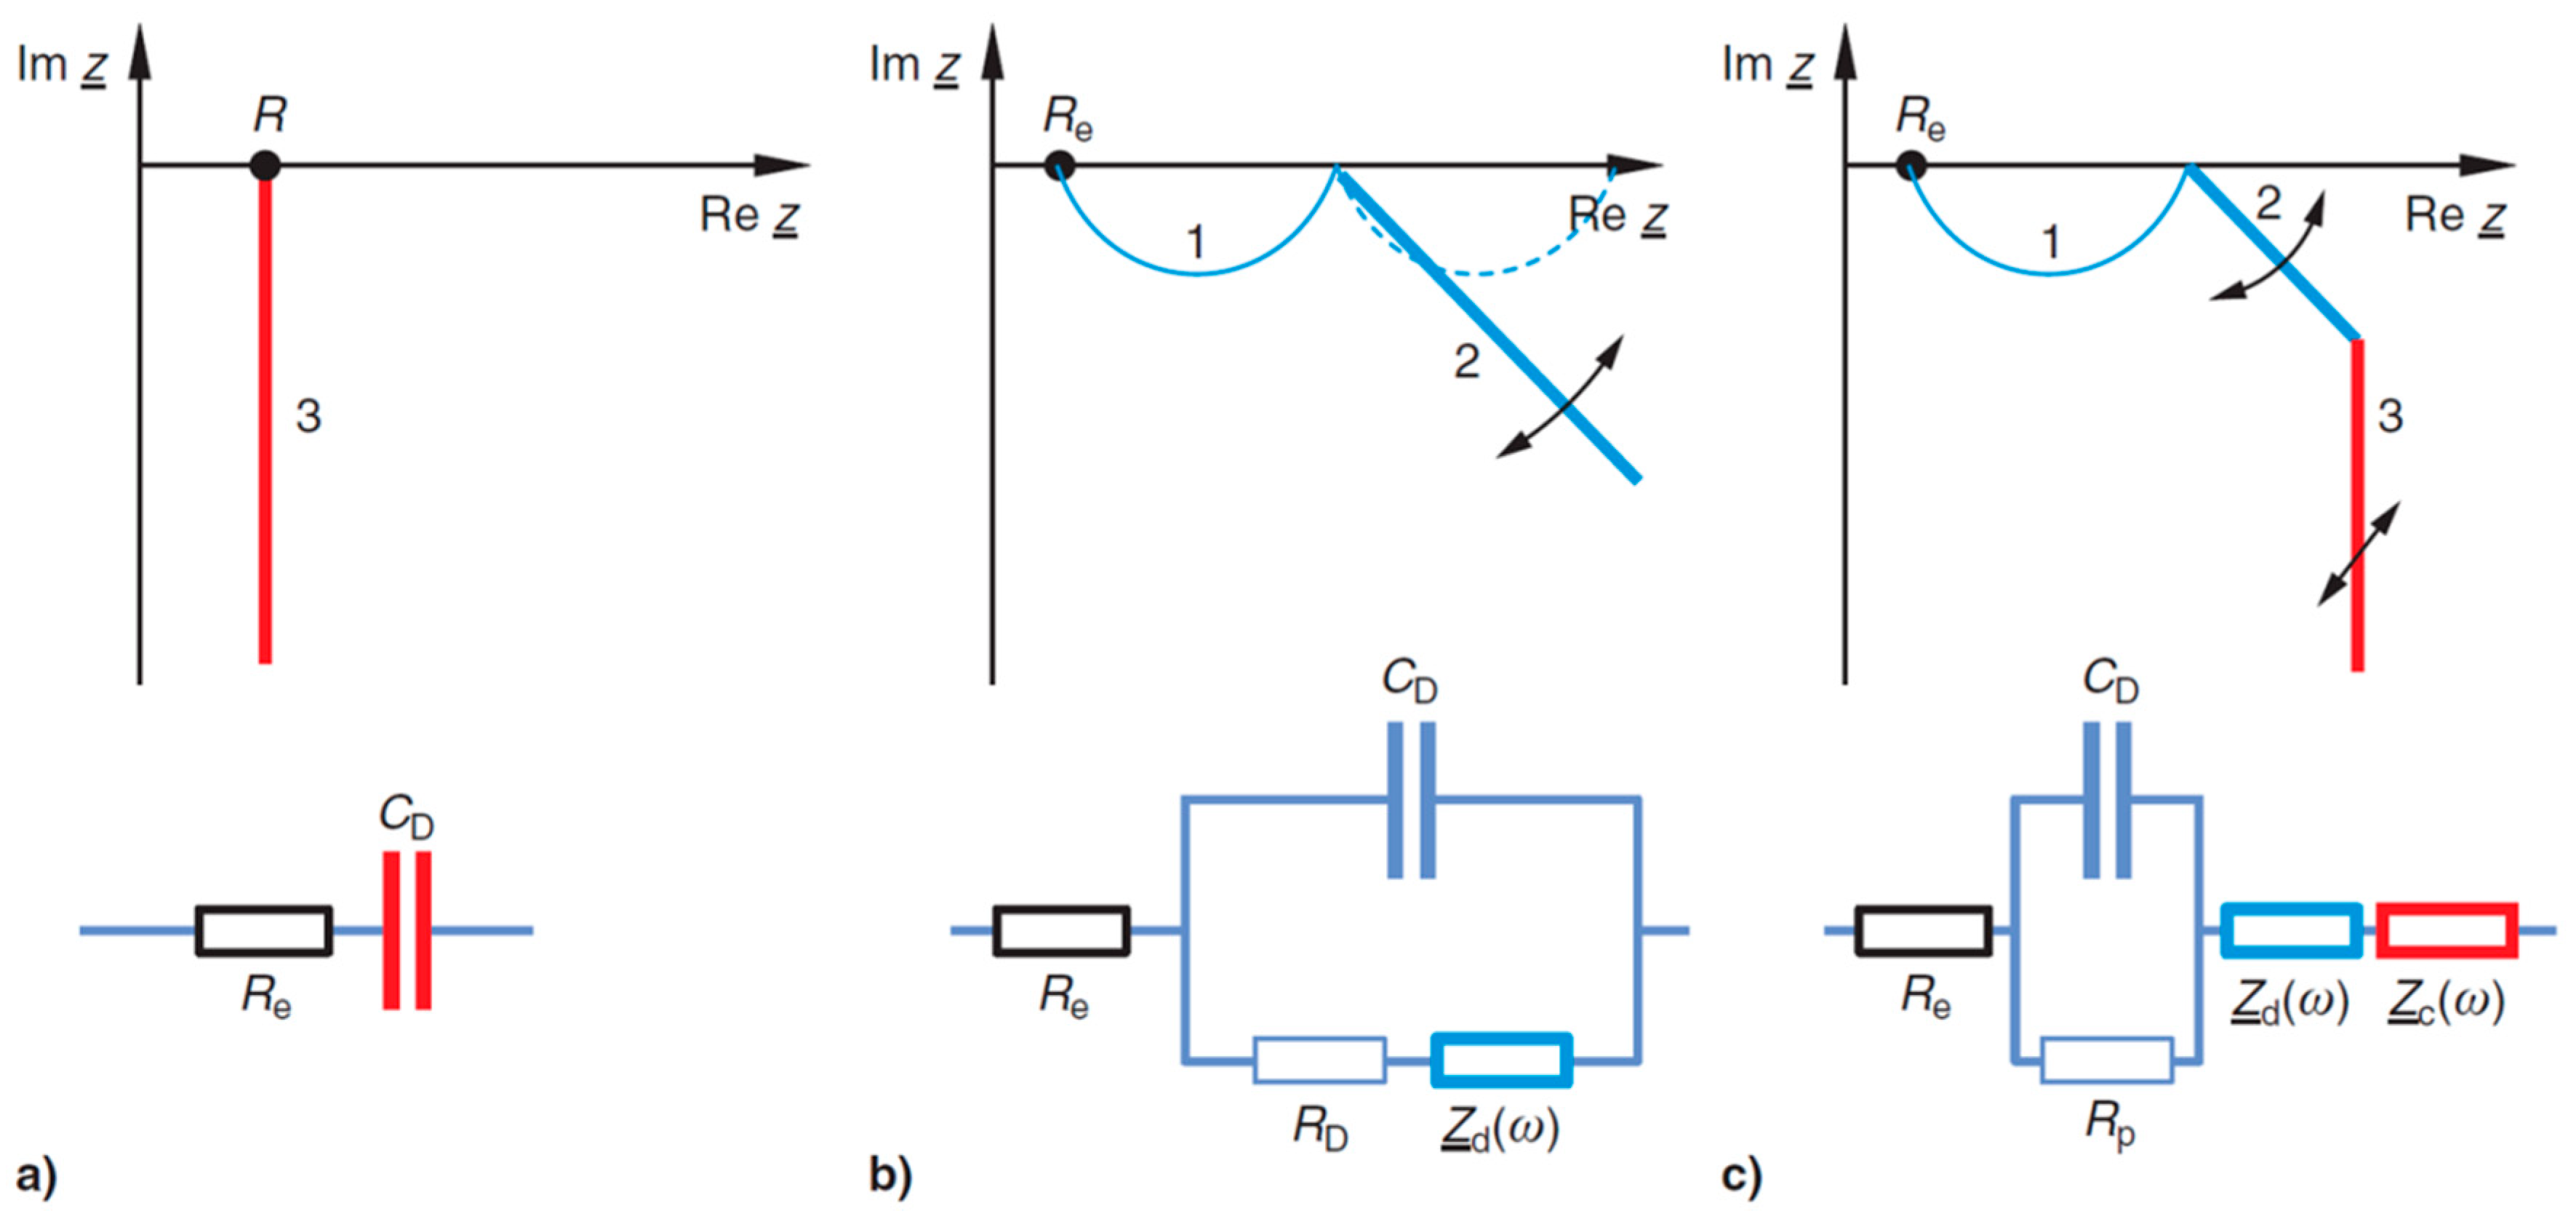
Figure 1.
General equivalent circuits and impedance spectra of electrochemical storage devices (mathematical convention): (a) charge-transfer, (b) diffusion in mesopores and micropores (grain boundaries), (c) diffusion impedance in macro pores at a blocking interface.
Figure 1.
General equivalent circuits and impedance spectra of electrochemical storage devices (mathematical convention): (a) charge-transfer, (b) diffusion in mesopores and micropores (grain boundaries), (c) diffusion impedance in macro pores at a blocking interface.
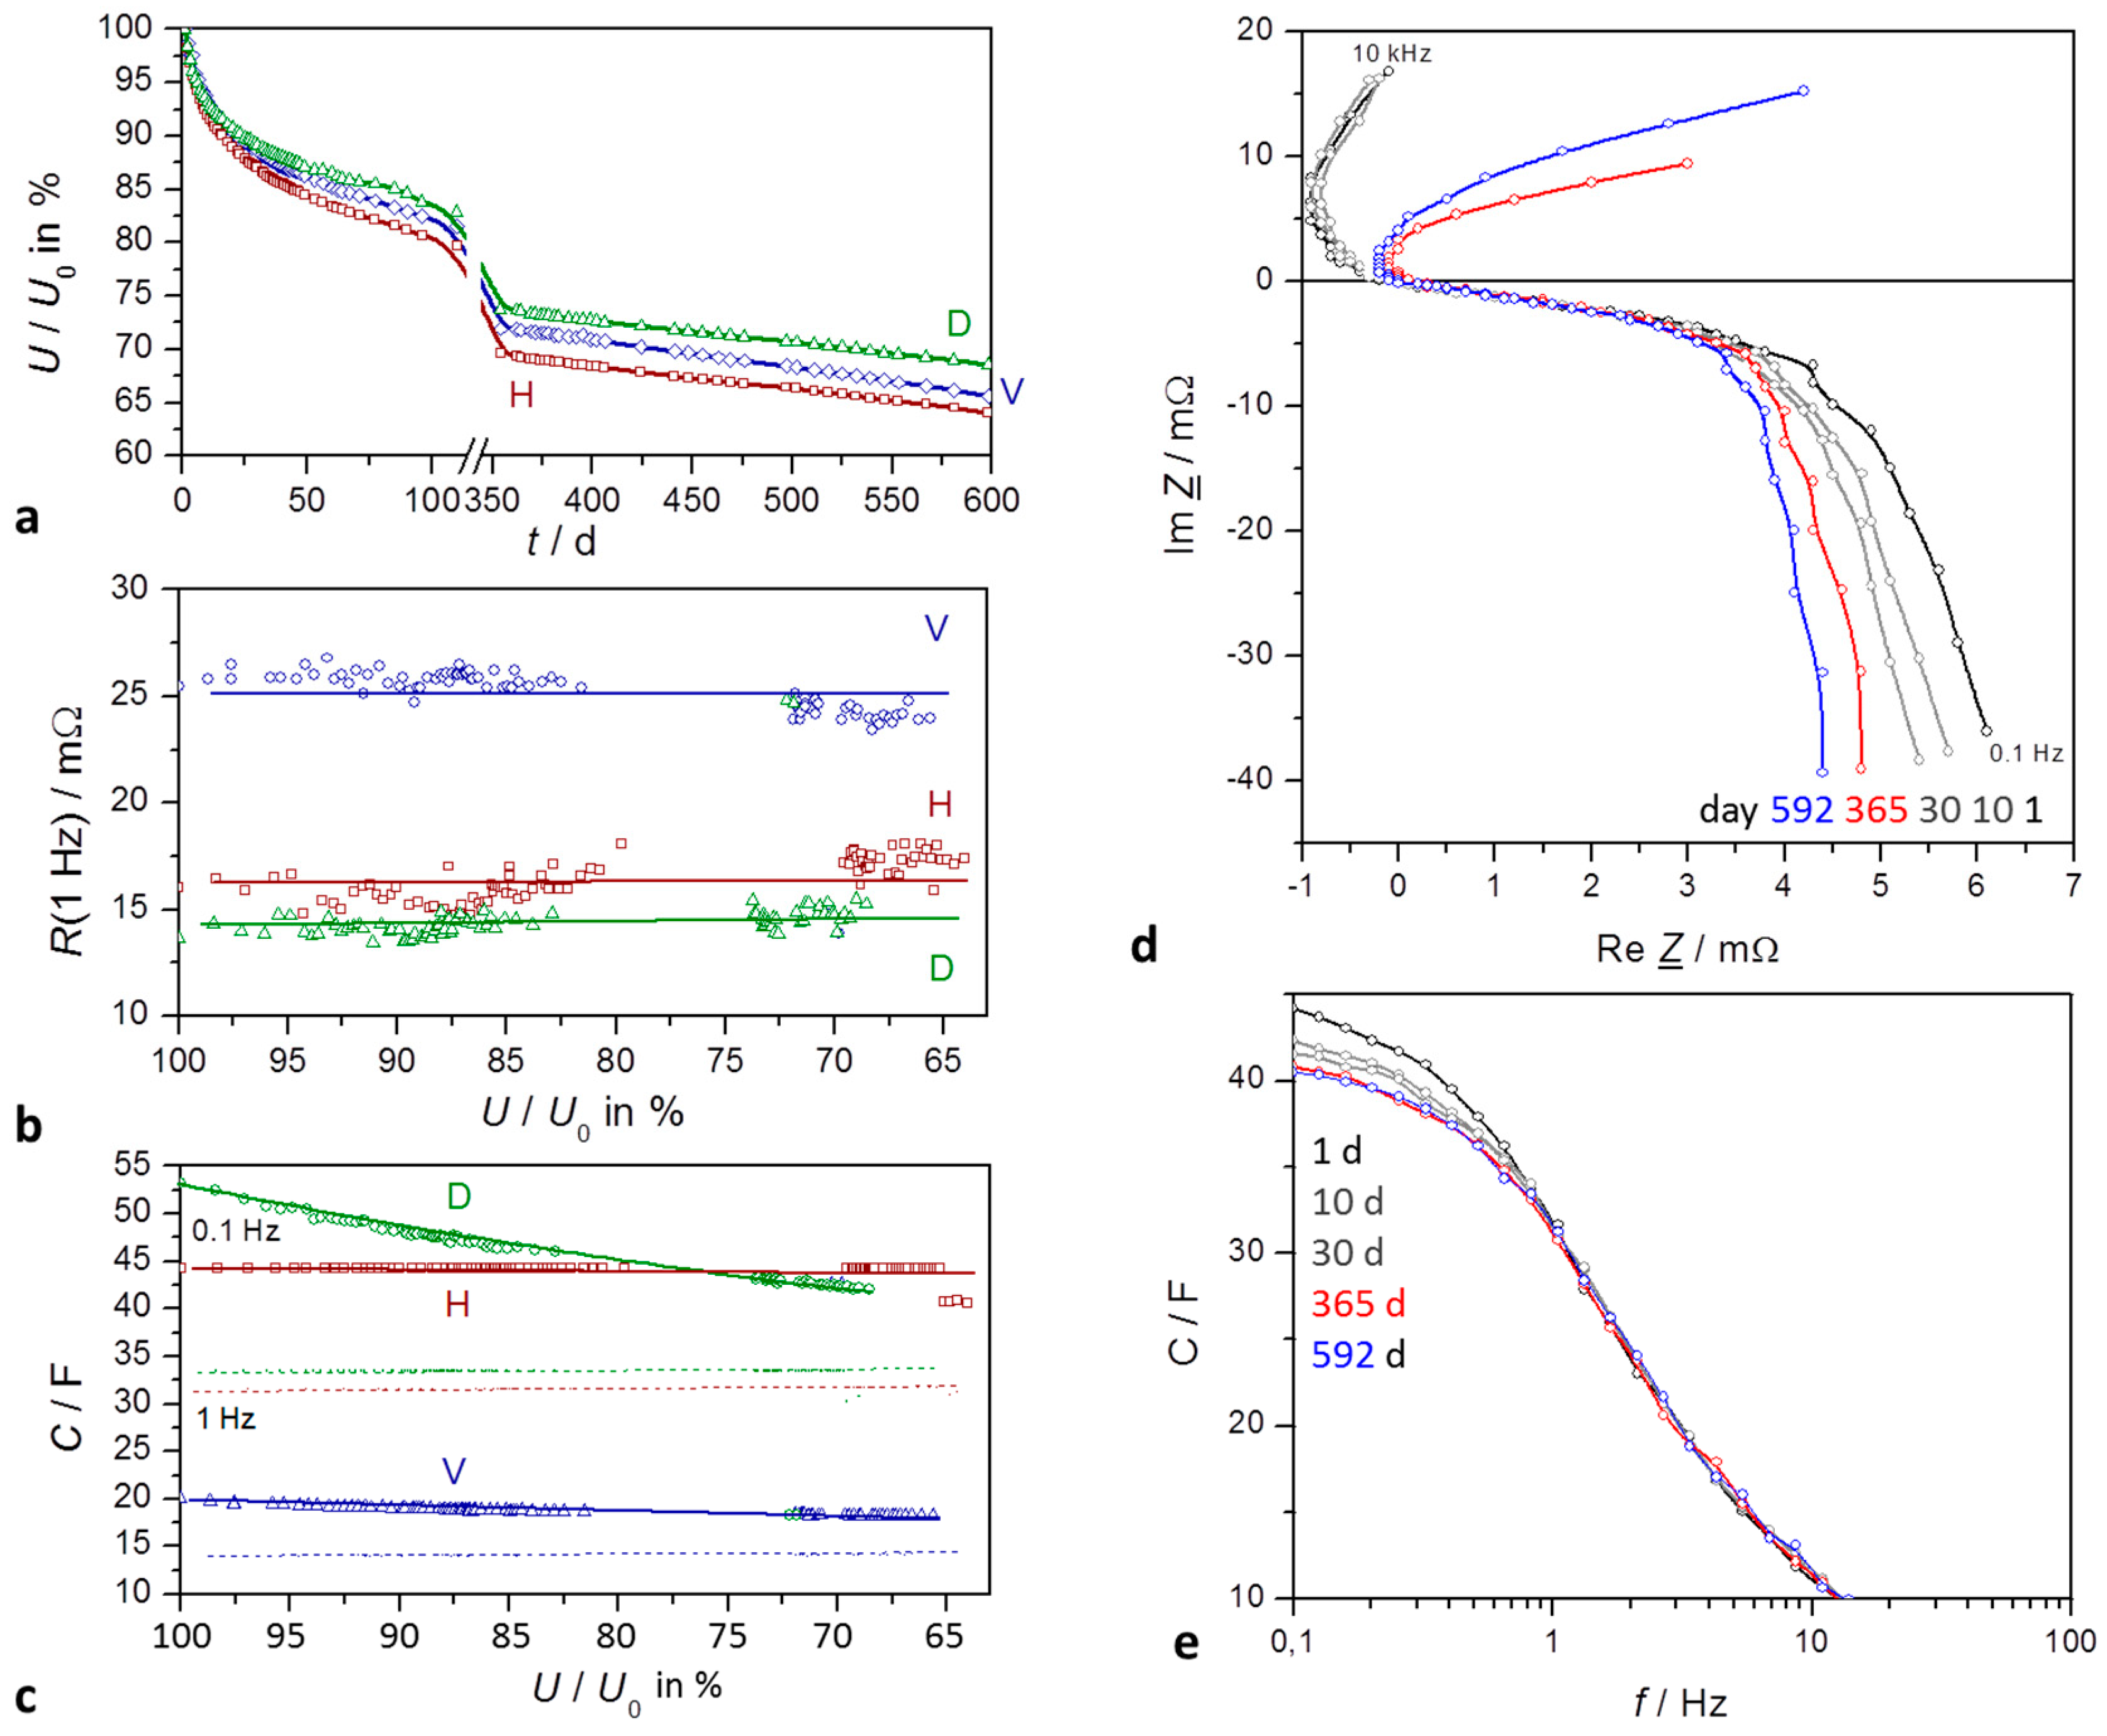
Figure 2.
Self-discharge of supercapacitors for a time period of about 600 days: H VINA Hy-Cap, 2.7 V, 50 F; D VINA Hy-Cap, 3 V, 50 V; V Vitzrocell 2.7 F, 25 F. (a) State-of-charge (SoC) versus time (in days) emphaszising the early exponential decay and the late linear behavior; (b) Internal resistance at 1 Hz as measured, without correction of cable resistances; (c) Capacitance at 0.1 Hz (solid) and 1 Hz (dashed); (d) Impedance spectra in the complex plane, corrected by the contact and electrolyte resistance Re; mathematical convention; (e) frequency response of capacitance during self-discharge.
Figure 3.
Modeling of the self-discharge of a supercapacitor (2.7 V, 50 F) within 100 days and 400 days, respectively: (a) quasi-exponential decay of open-circuit voltage versus time on a linear scale; (b) logarithmic scale showing three time domains; (c) voltage versus the reciprocal of time with asymptotes for short and long times; (d) voltage versus the square root of time; a linear relation holds for diffusion processes.
Figure 4.
Impact of temperature on the self-discharge of a supercapacitor (Vina Hy-Cap 3 V, 50 F) in the course of five days. (a) Impedance spectra in the complex plane at 22 °C and 80 °C ambient temperature, mathematical convention; (b) frequency response of capacitance; (c) self-discharge.
Figure 4.
Impact of temperature on the self-discharge of a supercapacitor (Vina Hy-Cap 3 V, 50 F) in the course of five days. (a) Impedance spectra in the complex plane at 22 °C and 80 °C ambient temperature, mathematical convention; (b) frequency response of capacitance; (c) self-discharge.
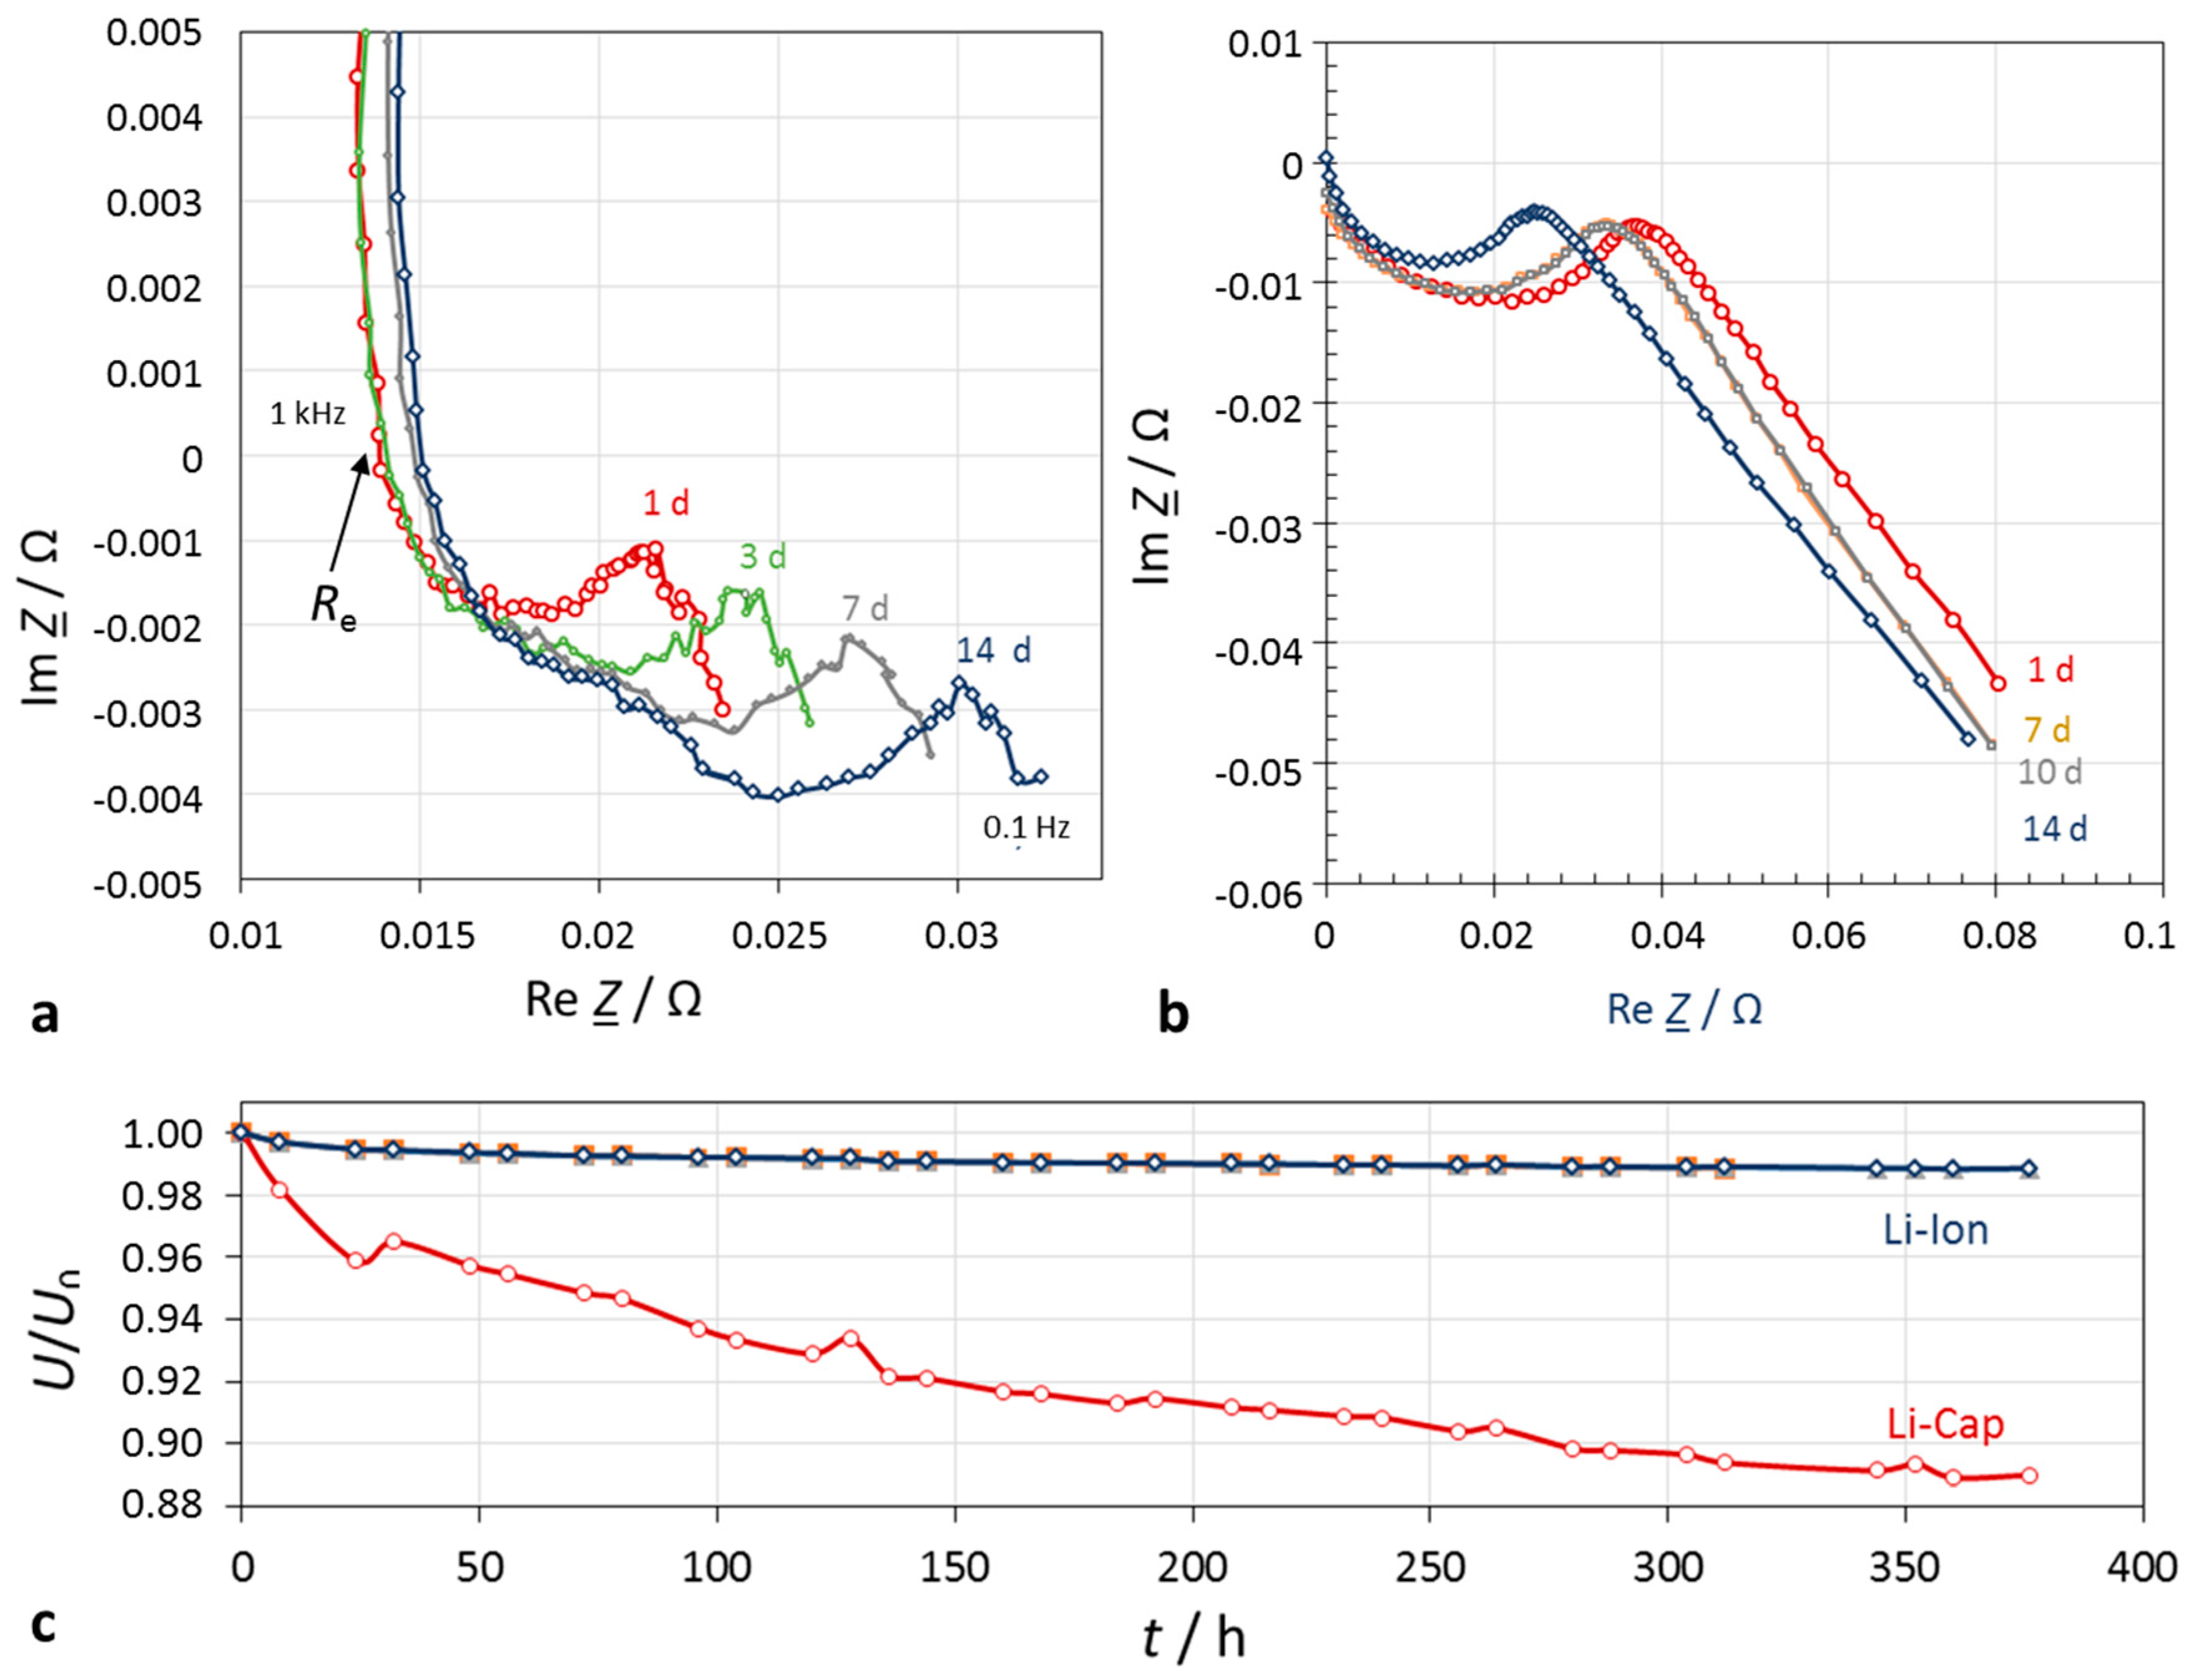
Figure 5.
Self-discharge within 14 days. (a) Lithium-ion battery (Samsung INR18650-25R, 1.5 Ah, 3.6 V); (b) lithium-ion hybrid capacitor (Taiyo Yuden 3.8 V, 100 F). The electrolyte resistance was corrected; (c) SoC characteristics.
Figure 5.
Self-discharge within 14 days. (a) Lithium-ion battery (Samsung INR18650-25R, 1.5 Ah, 3.6 V); (b) lithium-ion hybrid capacitor (Taiyo Yuden 3.8 V, 100 F). The electrolyte resistance was corrected; (c) SoC characteristics.
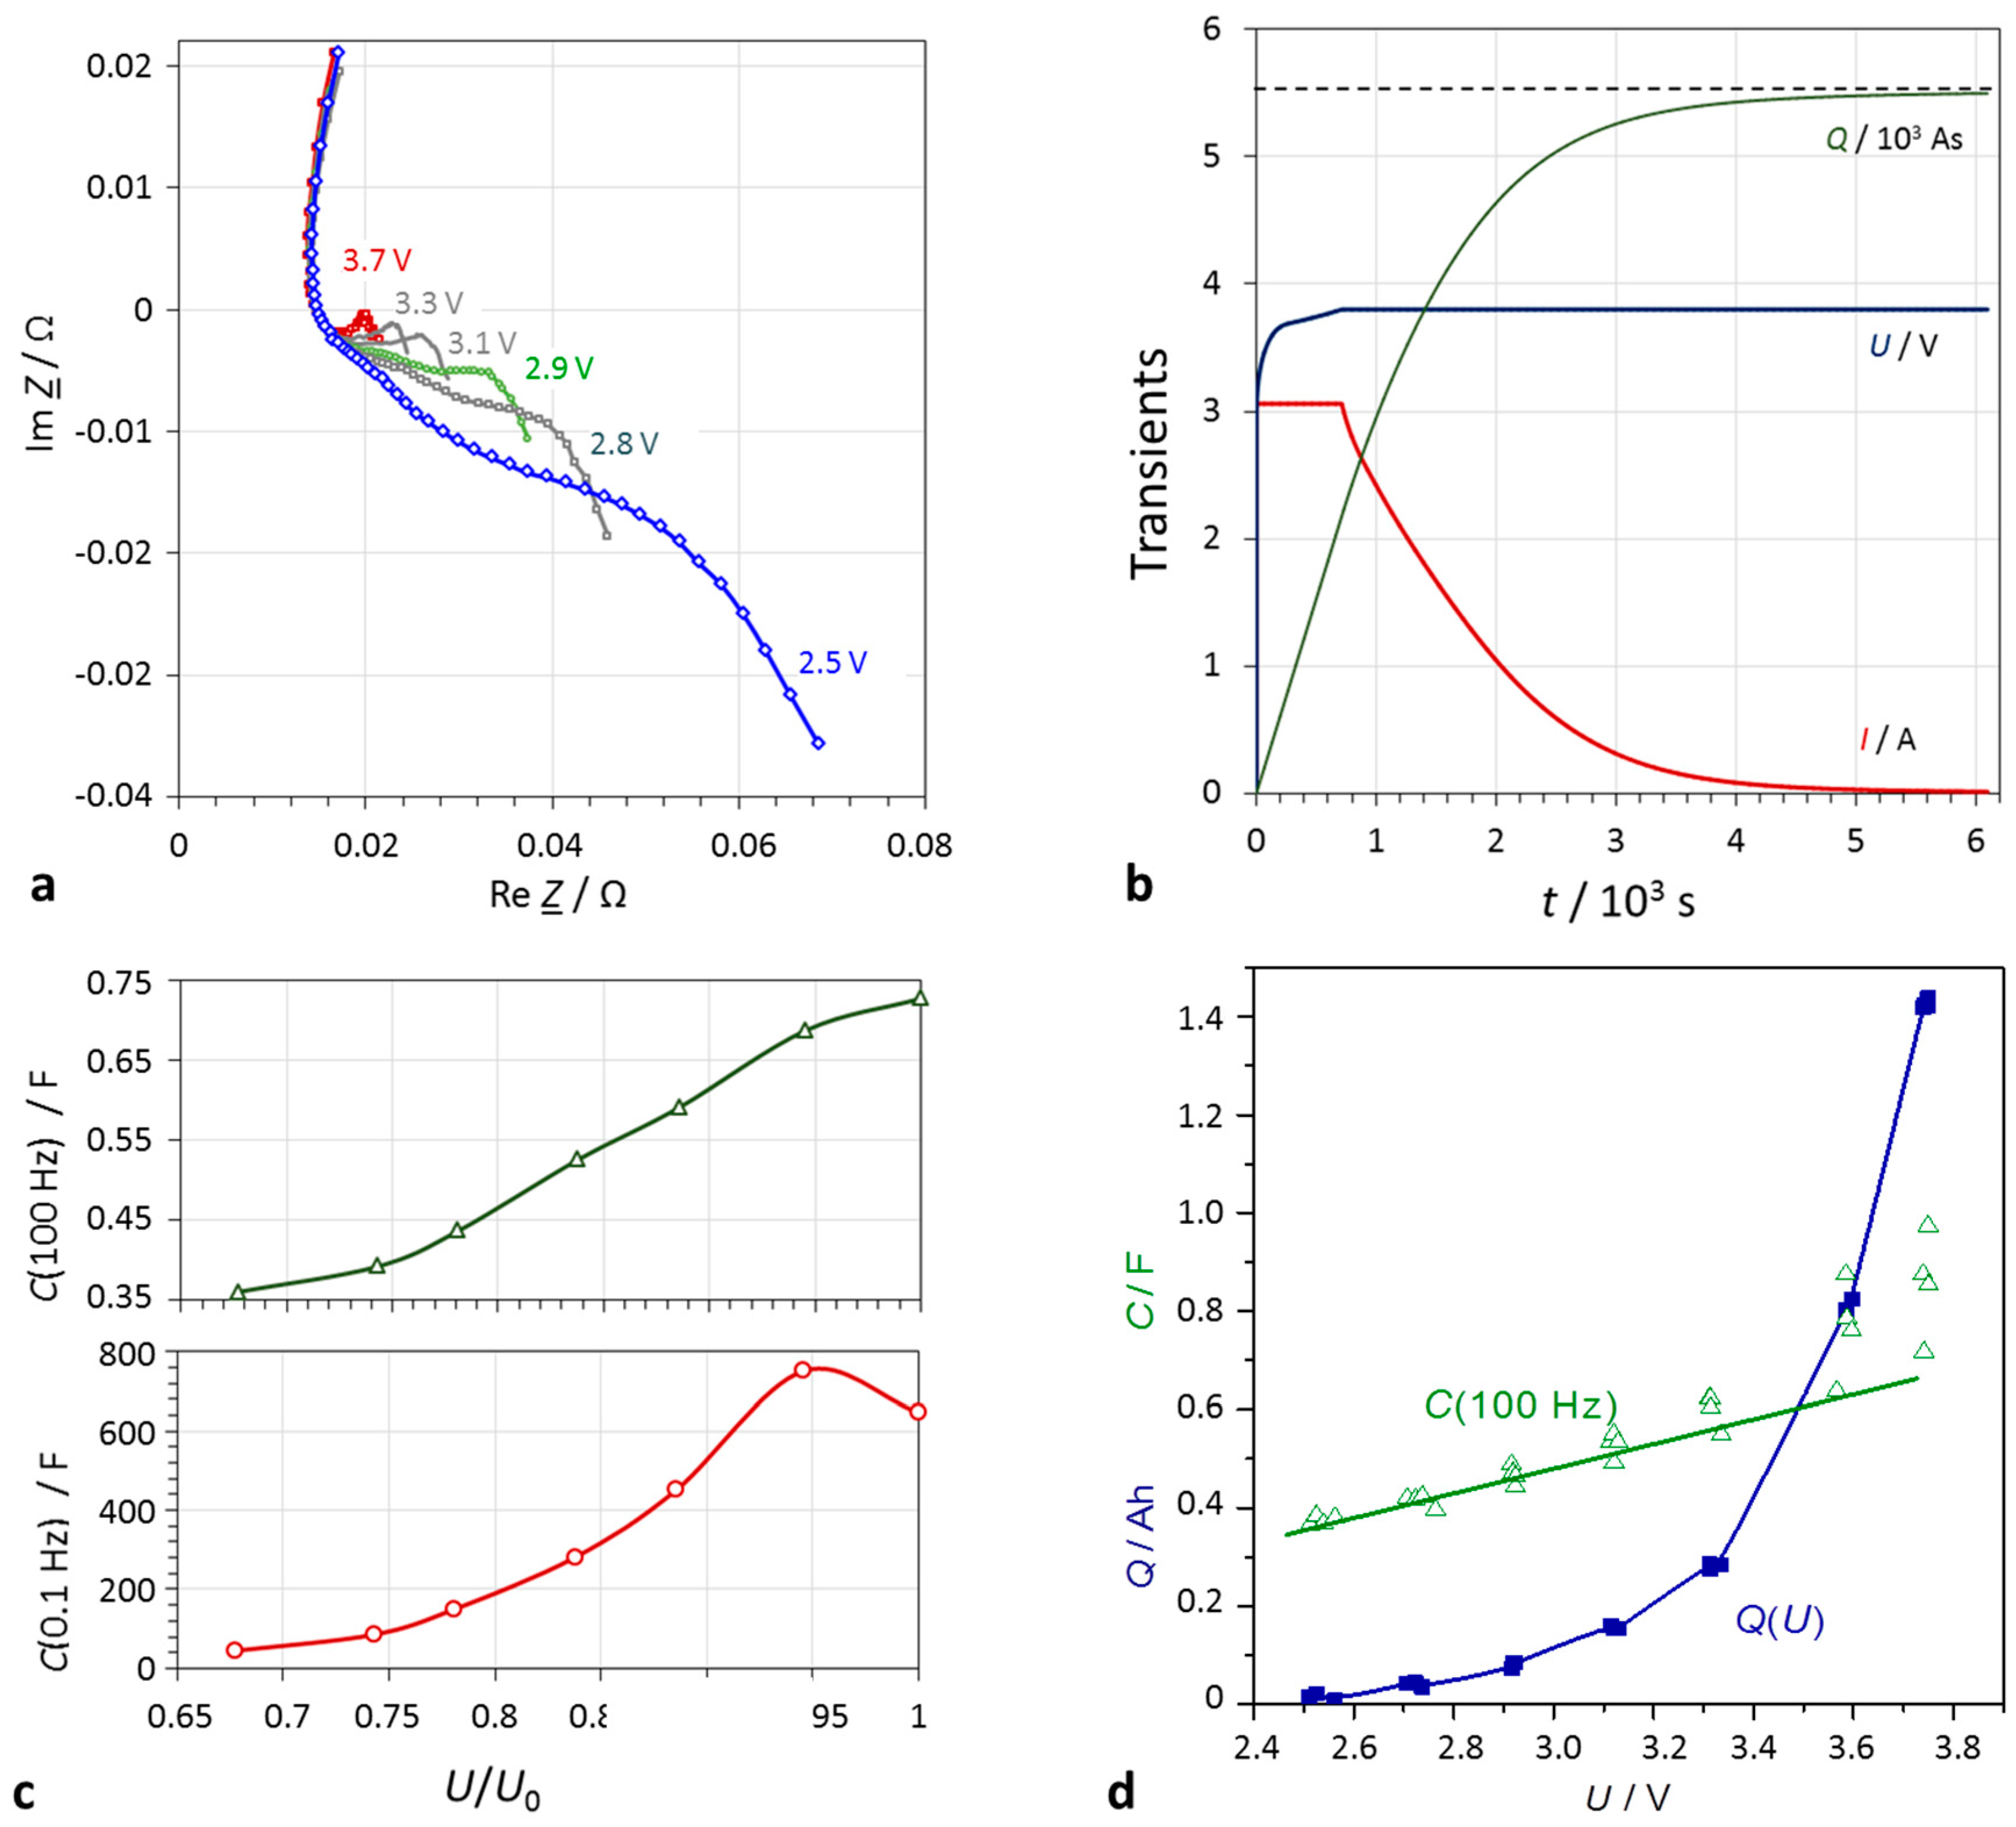
Figure 6.
Lithium-ion battery (Samsung INR18650-25R, 1.5 Ah, 3.6 V) at defined SoC states. (a) Impedance spectra in the complex plane (mathematical convention): The cell resistance drops with increasing terminal voltage; (b) charge characteristics: applied current I, and voltage U, stored charge Q; (c) capacitance at a given frequency (e.g., 100 Hz, and 0.1 Hz) indicates the SoC; (d) quasi-linear correlation of capacitance and quasi-exponential correlation of electric charge with cell voltage.
Table 1.
Fitting of the time-dependent self-discharge U/U0 of different supercapacitors by Prony series after approximately 600 days: Coefficients ai are dimensionless (V/V), time constants Ti in days (1 d = 24 h). Important time constants are printed in bold.
Table 1.
Fitting of the time-dependent self-discharge U/U0 of different supercapacitors by Prony series after approximately 600 days: Coefficients ai are dimensionless (V/V), time constants Ti in days (1 d = 24 h). Important time constants are printed in bold.
| Capa-Citor | Number of Time Constants | | + | + | + | + | Residuum |
|---|
| Hy-Cap 50 F, 2.7 V | 1 | 0.66 | − | − | − | 0.28 | 129 | − | 0.019 |
| 2 | 0.61 | − | − | 0.11 | 12 | 0.27 | 302 | − | 0.00069 |
| 3 | 0.59 | 0.064 | 3.2 | 0.085 | 20 | 0.28 | 356 | − | 0.000091 |
| 4 | 0.55 | 0.099 | 2.9 | 0.085 | 19 | 0.062 | 299 | 0.22 | 1195 | 0.000083 |
| 1 | 0 | − | | − | − | 0.89 | 1591 | 0.084 |
| 2 | 0 | − | | 0.13 | 22 | − | 0.85 | 1965 | 0.0048 |
| 3 | 0 | 0.14 | 8.2 | 0.14 | 59 | − | 0.76 | 3510 | 0.00028 |
| 4 | 0 | 0.14 | 8.2 | 0.10 | 54 | 0.02 | (2332) | 0.78 | 3469 | 0.00028 |
| Hy-Cap 50 F, 3 V | 1 | 0.70 | − | − | − | − | − | − | 0.24 | 146 | 0.01292 |
| 2 | 0.65 | − | − | − | − | 0.09 | 11 | 0.25 | 315 | 0.00064 |
| 3 | 0.63 | 0.062 | 3.1 | − | − | 0.061 | 22 | 0.26 | 389 | 0.0000840 |
| 4 | 0.63 | 0.060 | 3.0 | (0.002) | (5.14) | 0.063 | 22 | 0.26 | 386 | 0.0000838 |
| 1 | 0 | − | − | − | − | 0.91 | 1880 | 0.054 |
| 2 | 0 | 0.11 | 23 | | − | − | 0.87 | 2278 | 0.0039 |
| 3 | 0 | 0.12 | 6.8 | 0.09 | 77 | − | − | 0.80 | 3798 | 0.00019 |
| 4 | 0 | 0.08 | 6.8 | 0.12 | 118 | <0.01 | (1666) | 0.82 | 3724 | 0.00019 |
| Vitzrocell 25 F, 2.7 V | 1 | 0.66 | − | − | − | − | 0.28 | 129 | − | − | 0.019 |
| 2 | 0.61 | 0.11 | 12 | − | − | 0.27 | 300 | − | − | 0.00069 |
| 3 | 0.46 | 0.10 | 8.1 | 0.11 | 107 | − | 0.33 | 1030 | 0.00028 |
| 4 | 0.33 | 0.10 | 7.7 | 0.08 | 77 | 0.25 | 508 | 0.25 | 1077 | 0.00027 |
| 1 | 0 | − | − | − | 0.90 | 1690 | 0.00252 |
| 2 | 0 | 0.12 | 22 | − | − | 0.87 | 2064 | 0.00252 |
| 3 | 0 | 0.087 | 8.0 | 0.10 | 84 | − | 0.82 | 2717 | 0.00016 |
| 4 | 0 | 0.087 | 8.0 | 0.10 | 84 | <0.001 | (1400) | 0.82 | 2705 | 0.00016 |
Table 2.
Correlation between state-of-charge (SoC) and capacitance for a lithium-ion battery (Samsung NR18650-25R).
Table 2.
Correlation between state-of-charge (SoC) and capacitance for a lithium-ion battery (Samsung NR18650-25R).
| SoC | | 68% | 74% | 81% | 88% | 94% | 100% |
|---|
| U→input | (V) | 2.522 | 2.747 | 2.992 | 3.245 | 3.488 | 3.703 |
| Re→measured | (mΩ) | 14.8 | 14.9 | 14.9 | 14.7 | 14.5 | 14.5 |
| R (0.1 Hz)–Re | (mΩ) | 99 | 82 | 61 | 37 | 7.7 | 5.5 |
| C100→measured | (F) | 0.540 | 0.609 | 0.784 | 0.993 | 1.23 | 1.30 |
| C0.1→measured | (F) | 18.3 | 25.2 | 46.8 | 119 | 593 | 674 |
| Q→measured | (As) | – | 27.6 | 95.9 | 265 | 1366 | 2889 |
| CU→calculated | (As) | 46.2 | 69.2 | 137 | 3878 | 1883 | 2497 |
© 2018 by the authors. Licensee MDPI, Basel, Switzerland. This article is an open access article distributed under the terms and conditions of the Creative Commons Attribution (CC BY) license (http://creativecommons.org/licenses/by/4.0/).


