Article

Binding Energy Referencing for XPS in Alkali Metal-Based Battery Materials Research (II): Application to Complex Composite Electrodes

1
Leibniz Institute for Solid State and Materials Research (IFW) Dresden, Institute for Complex Materials, Helmholtzstr. 20, D-01069 Dresden, Germany
2
Fraunhofer Institute for Ceramic Technologies and Systems (IKTS), Winterbergstr. 28, D-01277 Dresden, Germany
3
Karlsruhe Institute of Technology (KIT), Institute for Applied Materials (IAM), Hermann-von-Helmholtz-Platz 1, D-76344 Eggenstein-Leopoldshafen, Germany
4
Fraunhofer Institute for Material and Beam Technology (IWS), Winterbergstr. 28, D-01277 Dresden, Germany
*
Author to whom correspondence should be addressed.
Batteries 2018, 4(3), 36; https://doi.org/10.3390/batteries4030036
Submission received: 14 March 2018 / Revised: 31 May 2018 / Accepted: 6 July 2018 / Published: 1 August 2018

Abstract

:
X-ray photoelectron spectroscopy (XPS) is a key method for studying (electro-)chemical changes in metal-ion battery electrode materials. In a recent publication, we pointed out a conflict in binding energy (BE) scale referencing at alkali metal samples, which is manifested in systematic deviations of the BEs up to several eV due to a specific interaction between the highly reactive alkali metal in contact with non-conducting surrounding species. The consequences of this phenomenon for XPS data interpretation are discussed in the present manuscript. Investigations of phenomena at surface-electrolyte interphase regions for a wide range of materials for both lithium and sodium-based applications are explained, ranging from oxide-based cathode materials via alloys and carbon-based anodes including appropriate reference chemicals. Depending on material class and alkaline content, specific solutions are proposed for choosing the correct reference BE to accurately define the BE scale. In conclusion, the different approaches for the use of reference elements, such as aliphatic carbon, implanted noble gas or surface metals, partially lack practicability and can lead to misinterpretation for application in battery materials. Thus, this manuscript provides exemplary alternative solutions.

1. Introduction

Lithium ion batteries (LIB) are already a classic power source for portable electronic devices. They have also been successfully introduced into the automotive market by application in electric and hybrid vehicles, where enhanced energy density is a major challenge. For buffer storage of electric power from renewable sources, alternative concepts are economically interesting which may prove more beneficial than the more cost-intensive lithium system or are suitable replacements if discussed in the sense of the components’ natural abundance. Therefore, new materials and working principles are extensively studied, also including other alkaline metals (sodium, potassium) or other reduction pairs (sulfur) [1,2].
Nevertheless, independent of the related working principle, all batteries consist of two electrodes (cathode and anode) coupled by an ionically conductive electrolyte medium. In order to clarify and to optimize the complex chemical processes in alkaline-ion battery electrode systems, sophisticated chemical analysis is necessary. Reliability and reproducibility of the analysis procedure is the most important task for both anode and cathode reactions.
X-ray photoelectron spectroscopy (XPS) is a well-accepted method to study the solid-electrolyte interphases (SEI) on materials such as graphite, silicon, metallic Li and Na, or Li and Na-alloys [2,3,4,5,6,7,8], and the cathode-electrolyte interface (CEI) on e.g., layered oxides, spinels, olivines or phosphates as active materials [8,9,10,11,12,13,14]. Generally, solid-electrolyte interphases on anodic and cathodic sides and often the cathode itself are electrically non-conducting. For that reason, surface charging occurs during XPS analysis due to a change in the surface potential by not replaced but depleted electrons. Despite of the use of charge compensation/minimization methods mostly residual energy shifts in the measured spectra remain. Thus, methods for referencing the binding energy (BE) scale are essential for reliable chemical information.
Adventitious (hydro)-carbon contamination is commonly used as an easy-to-use “internal” energy reference since almost each sample is carbon-contaminated which has not been prepared under ultra-high vacuum (UHV) conditions. This is also accepted in the Li-ion battery community since several years [8,15], especially for the investigation of the SEI on an electrode surface. Routinely, the C1s core level peak is used as energy reference located between 284.6 and 285 eV and in our case 284.8 eV is selected.
Sometimes groups dealing with electrode materials also use LiF or Li2CO3 as references. These substances are commonly found in the SEI of anode materials [4,16]. Some authors also abandon using any corrections [17,18].
In the recent years reasonable doubts arose that this attempt is valid for investigations at alkaline element containing material. We presented some model experiments for Li and Na metal in different surroundings [19] and depth-profiling investigations at SEI on graphite anodes [20], which pointed to the occurrence of additional energy shifts. These shifts were not caused simply by surface charging and depend on the surface concentration of the alkaline (Li, Na) elements in their elemental form. Similar results were found by Maibach et al. [21] at HAXPES investigations on differently charged (lithiated) graphite anodes. They observed shifts of the SEI components depending on the charging state and Li concentration, respectively. In both cases, specific surface potential gradients were accounted for these observations.
Even though, this effect, later called “alkaline effect”, still awaits a suitable theoretical explanation, it influences the interpretation of chemical states in the field of battery investigations in general. Therefore, we discuss the consequences of this effect for a selection of battery materials. Of course, this choice does not represent a complete overview of all compounds possible. On one hand examples for certain classes of materials are demonstrated where attention has to be paid to measurement and interpretation and on the other hand also such where the previously described shifting effects are not significant. Procedures of sample preparation and specific results from electrochemical characterizations, X-ray diffraction, etc., were discussed for each material and summarized in several specific publications mentioned in following chapters. This manuscript is mainly focused on the appropriate energy referencing in XPS measurements and its explanation for every single example. Thus, in the experimental section only the XPS measuring conditions are described in detail and a short summary of the preparation conditions for the several samples are collected in the supplementary. The chapter on the results and discussion of the presented examples are not arranged by the materials’ classes. Instead, we sorted the sample type by the XPS point-of-view in reaction layers without and with surface charging and reference powders (with charging).

2. Experiments

Samples were prepared in a glove box in a monitored Ar atmosphere (O2 < 0.1 ppm, H2O < 0.1 ppm). Further details about the sample preparation can be found in the supplementary information. To avoid any contact of the samples with air and moisture, a PHI 04-110 vessel (Physical Electronics, Chanhassen, MN, USA) was used for transferring the samples between glove box and spectrometer.
The XPS measurements were carried out on a PHI 5600 CI (Physical Electronics, Chanhassen, MN, USA) spectrometer which is equipped with a hemispherical analyzer operated at typical pass energy of 29 eV and 800 µm diameter analysis area. Monochromatic Al Kα excitation (350 W, ca. 2 mm spot size) was used. The energy resolution reached results in a full-width-at-half-maximum (FWHM) measured with 29 eV pass energy at Ag3d5/2 of 0.9 eV (±0.03 eV). The binding energy scale of the spectrometer is calibrated using Au4f7/2 at 84.0 eV and Cu2p3/2 at 932.7 eV. Sputter cleaning was performed using Ar+ ions at 3.5 keV and an erosion rate of around 3 nm/min standardized to SiO2. More details on the experimental procedures can be found in previous works [4,5]. Significant alteration of the spectra due to X-ray radiation was never observed.
In case of surface charging, the BE shifts were minimized using a low energy electron flood gun (5 eV, large area, typically 50–200 nA). This neutralizer was also used for testing possible residual charging effects for samples with adequate electrical conductivity (Section 3.1).

3. Results and Discussion

In this section, the XP spectra of a large variety of sample states are presented. Minor variations in chemistry leading to small peak shifts are not the focus of this work and are therefore neglected. The decisive variations that are related to the alkaline effect are in a range of several eV. To provide a clear and comparable presentation of the spectra, we decided to normalize them in intensity and to present the spectra shifted in intensity scale by constant values to avoid their overlap in the waterfall plots. Thus, the intensity information is omitted in favor of a fast and descriptive comparison of the spectra.
We believe that the presentation of peak fits in all results can distract the reader from focusing on the main message of our paper and the main reasons for this procedure are as follows:
(i)
Our work is as mentioned already not focused to study the detailed changes in chemical states in the samples, but should be a practical guide for the experimentalist to find the right way for BE referencing in such battery materials. Thus, we are not focusing on a quantification of amounts of chemical species in the samples.
(ii)
Many of the investigated surfaces are covered with mixtures of several species, which makes their identification really complex.
(iii)
As also discussed in previous works [19,21], the absolute values of the BE shift from the “alkaline effect” obviously depend on the near-surface Li-concentration and -distribution, which varies in our examples from case to case. In addition, the exact determination of the shifts is not really beneficial.
To consider all these facets in more detail, more specialized and systematic investigations would be necessary in the future.
However, for identification of the peak positions in samples with several well separated species of interest we used peak fitting as demonstrated in the supplementary material for the Li1s peaks in case of the investigations on Li metal foil (see Figure 1 and Figure 2, and Figures S1 and S2). In the case of peak overlap of interest, as for the example of Os-staining (Figure 3), we present fitting results in the figure.
To guide the eyes easily to the occurring shifts, we added vertical lines in the position of the main identified species into the waterfall plots. Here, the solid lines stand for positions where the measured values agree with the positions when referencing with adventitious carbon is used. The dashed lines mark the peak positions shifted by the “alkaline effect”.
The observed charging effects for Li-based battery materials often make typical databases less helpful. Thus, we used the peak energy values of typical Li-species from several references summarized in our former work [19] and for the additional elements mostly the “handbook” data [22] and the references therein.

3.1. Reaction Layers—Without Surface Charging

For all examples shown in this section, no BE shift was observed related to natural charging. This charging absence was routinely checked by activating the electron flood gun during the measurement to stimulate peak shifts or peak shape changes. Similar effect was emulated by application of the non-monochromatic Mg Kα source, which also induces changes in the surface electron balance.

3.1.1. Li-Metal Foil

Due to the increasing demand for higher energy density in LIB, lithium metal is the holy anode grail, offering the highest possible specific capacity at lowest potential and weight. Although considered impossible for implementation in rechargeable lithium batteries due to safety issues and dendrite growth for a long time, fast progress and motivating results have been demonstrated recently [5,23,24]. These achievements on lithium metal as potential anode revive the attention on the analysis of elemental Li [25].
Firstly, we observed a different behavior of surface contaminants on pristine Li foils and demonstrated different shifts for artificial Au deposition on top [19]. Figure 1 demonstrates that the same effect is observed for Cu metal, which was deposited from the Cu end-cap of the X-ray source by sputtering with the ion gun normally used for depth profiling. In the pristine state, the Li foil is covered by carbonate and carbonaceous contamination (Figure 1a), both found at higher than usual C1s BE positions (293 eV and 288 eV). The peak position of the deposited Cu after 1 min of sputtering is also shifted by about 2.5 eV to a higher BE of 936 eV for Cu2p3/2 (Figure 1e) on top on the layer-like carbonate-contamination and, thus, it is at this time not in contact with the metallic Li below. The shift of the Cu peak to 936 eV is too large to be explained with the occurrence of CuO. The absence of shake-up events at higher BE due to the electronic structure of CuO also points to this observation. The implanted Ar (Figure 1d) is also found at high BE (245.5 eV), obviously shifted in the same way as the carbonate and oxide by the “alkaline effect”. After sputter cleaning (removal of about 100 nm) the situation changes: The Cu signal shifts back to its metal position (Figure 1e), whereas the Ar2p peak remains at the high-energy position (Figure 1d). During sputtering Li-carbonate is simultaneously converted to Li-oxide (1 min sputtering) which is further removed leading to the detection of Li-metal at 55 eV (Figure 1b—30 min sputtering). Exact peak position determination by peak fit (Figure S1 in the supplementary) determined 57.7 and 56.3 eV for the Li1s positions of carbonate and oxide, resulting in a shift of 2.2/2.3 eV with respect to the C-referenced positions [19]. Same observation was made for Au deposited on Li-metal samples [19]. Additionally, as in some following figures, the O1s spectra (Figure 1c) are plotted but not explicitly discussed—they represent typical mixed often not well-defined surface species and show similar BE shifts as the peaks of their corresponding alkaline metal binding partners.
To check and spread the probability of occurrence and the reliability of the effect described above, the battery system was changed from Li-ion to Li-sulfur where an insulating or passivating layer formation on the metallic Li anode is well documented due to irreversible polysulfide reduction and electrolyte decomposition [26,27]. To obtain a sample with a well-established layer, coin cells were disassembled after the first discharging and charging cycle and the Li-metal anode was carefully examined (Figure 2). The surface is covered with carbonate and sulfate (Figure 2a,d), which is converted to oxide and sulfide-like species during sputtering (Figure 2c,d). The intermediate Li peak at 56.3 eV after 3/15 min sputtering (Figure 2b) is mainly attributed to Li-oxide, because the sulfur content here is below 2 at%. Similar to Figure S1 in the supplementary material, from a curve fit for Li1s shown in Figure S2, a shift of 2.3 eV can be followed for carbonate and oxide. The implanted Ar is unvaryingly located at high BE (245.5 eV) (Figure 2e) and deposited Au is shifted stepwise from the higher BE position to the metal-like state at around 84 eV (Figure 2f). After 15 min sputtering Li-metal is partially reached (Figure 2b), where even the carbon contamination shifts to the almost normal C1s BE position at around 285 eV (Figure 2a). This example clearly highlights how important understanding of this BE shift caused by electrostatic interaction, which may be the origin of the “alkaline effect”, really is. Comparing this third C1s spectrum with the first spectrum before sputtering, two different species would be intuitively described. However, in reality it is only one chemical compound of carbon contamination located at two different positions and differentiated only by just an electrostatic interaction. Without critical scrutinizing, this observation therefore leads to a false conclusion which could furthermore hamper progress in the development of rechargeable batteries with its wrong results. Similar conclusions could also be drawn in Figure 1a for the carbon on the pure Li foil.
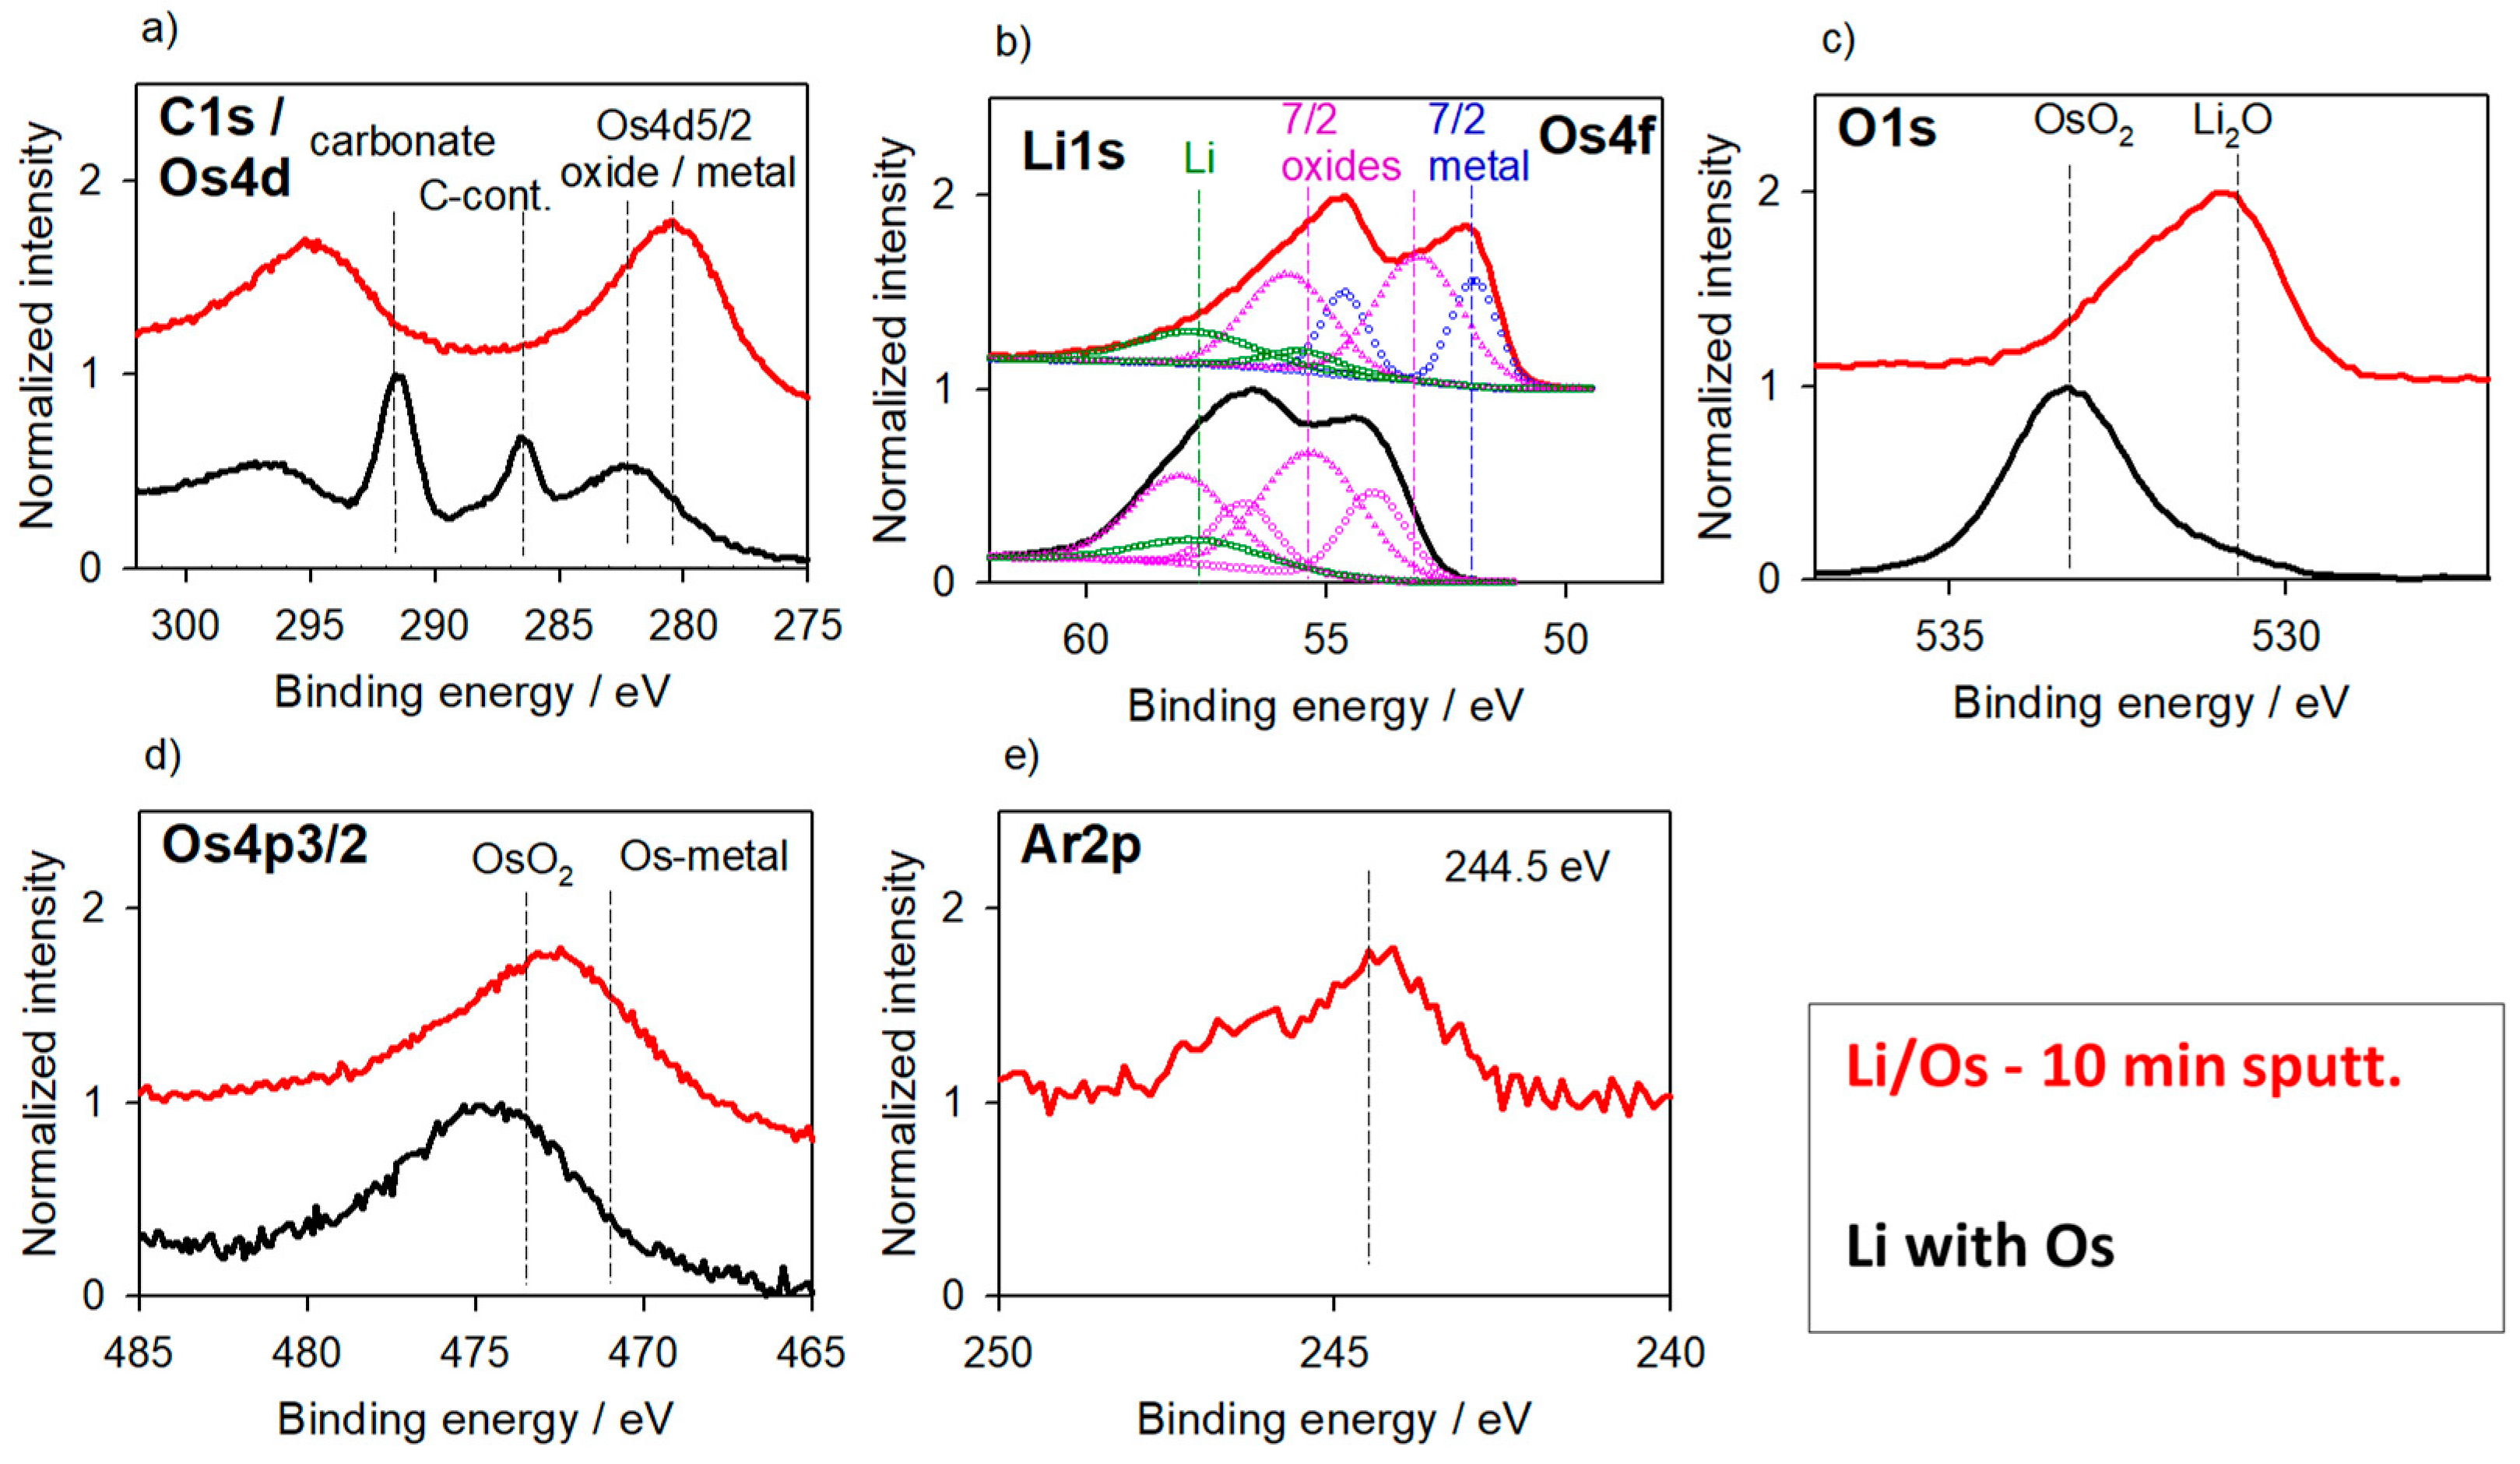
Osmium staining is a classic method to allow experimentalists to work on highly electron beam sensitive samples of biological origin [28]. A similar stabilization behavior is found for investigating Li of lithium ion batteries with scanning electron microscopy [29]. Metallic Li can react during Os staining, and Os is afterwards detected in the electron microscope to indirectly monitor Li occurrence, e.g., in the habit of dendrites, while Li itself cannot be easily found because of its low mass contrast and high mobility. We herein use Os staining as a third possibility to form a layer on the Li foil, similar to Au and Cu layers as mentioned before, to reproduce the alkaline effect. We investigated a Li foil, which was treated as model sample with OsO4 vapor. The results of the measurements of an as-treated (i) and sputter-cleaned (ii) (about 40 nm in depth) Li foil are shown in Figure 3. Interpretation of the C1s region is challenging due to overlaps with the Os4d and of the Li1s region with Os4f peaks (Figure 3a). Despite a low total Os content at the surface (about 2 at% calculated from Os4p) a complex peak shape is found for the Os4f/Li1s region in both the as-prepared and sputtered state (Figure 3b). A peak fit needs two Os4f doublets and at least two Li components for reconstruction of the peak shape. We assume two Os-oxide doublets for the as-prepared states as well as one Os-oxide and one Os-metal doublet after sputtering. A part of the signal contribution is assigned to metal-like Li (55 eV) after sputtering for the Li1s region. The shift between the metal-like Os (52 eV) and the high-BE oxide peak (56 eV) is larger than 2 eV as described in literature [22,30], which points to an additional peak shift phenomenon at the as-prepared sample. Also, the C-H contamination, the carbonate (Figure 3a) and the Ar2p peak position (Figure 3e) are found at higher BE as described before. These characteristic shifts point to the fact that the metallic Os found here is not yet in direct contact with the Li substrate, but formed during the sputter cleaning in the Os-oxide.

3.1.2. Carbon-Based Anode Materials

Graphite-based anode materials are used for the commercial production of LIB as the state-of-the-art, since no real alternative has been routinely applied up-to-now. In the Li-case, the formation of the SEI is of particular interest, because it significantly determines the overall battery performance [31]. For sodium, no comparable intercalation reaction for graphite is reported [32] without accessing solvated Na+ ions [33,34], but carbons with partially disordered structure, namely hard carbons [35], are able to function as anode in sodium-ion batteries [6,36].
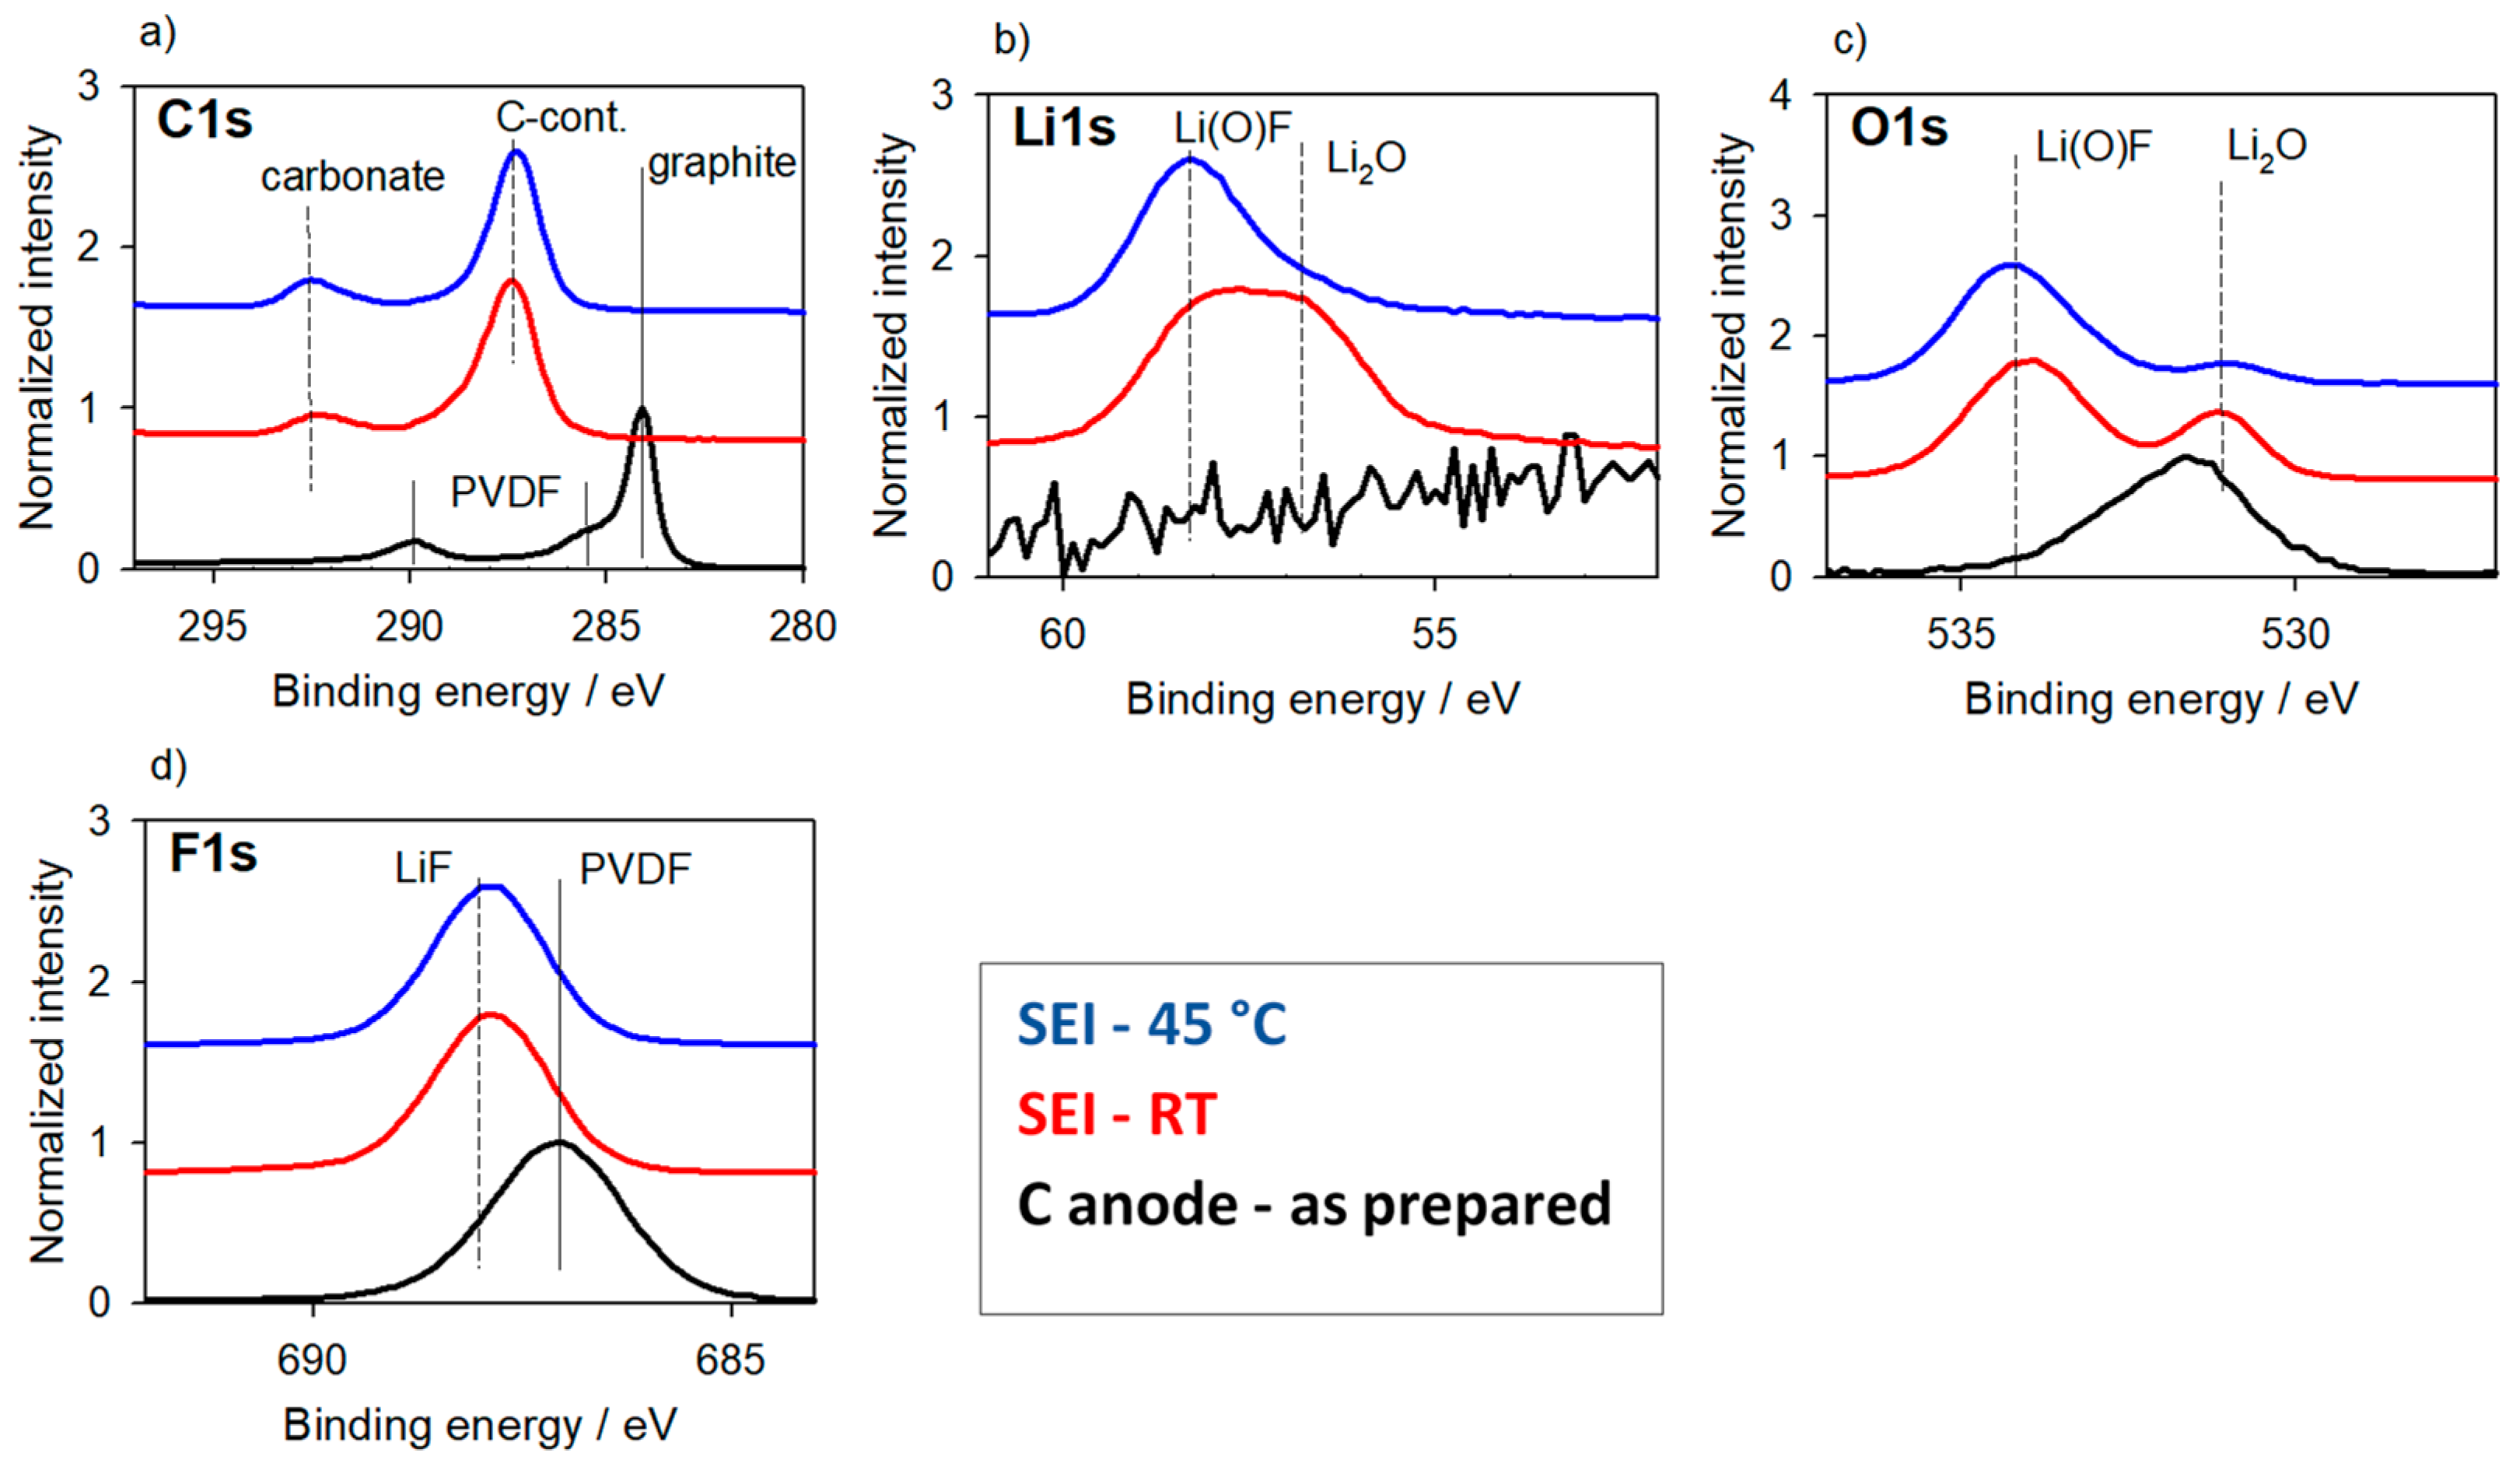
A detailed investigation on the behavior of the XPS signal together with the depth-profiling analysis of graphite was reported recently [20]. In conclusion, the BE position of the typical SEI species depend on the lithiation state of the graphite. In the delithiated state the species are found on a BE position usually referenced to C1s at 285 eV. In the lithiated state with participation of Li(0), these positions, including that of implanted Ar, are shifted 2–3 eV to higher BE positions. Figure 4 represents a comparison of two SEI layers formed on graphite after lithiation at different temperatures [37] and the as-prepared non-charged anode material consisting of carbon black and PVDF as binder. As expected from our earlier investigations [20,29] the peak positions of all the characteristic SEI species forming a layer on the graphite, with species such as carbonate, C-contamination, oxide and fluoride, are at higher BE than described usually expected when using the BE referencing with C-contamination at C1s of 285 eV. The possibility of this observation strongly depends on the lithium content because the underlying graphite is fully lithiated to LiC6. Additionally, as denoted by the signals of the individual temperatures, the alkaline effect in its impact seems to be independent of slightly increased temperature.
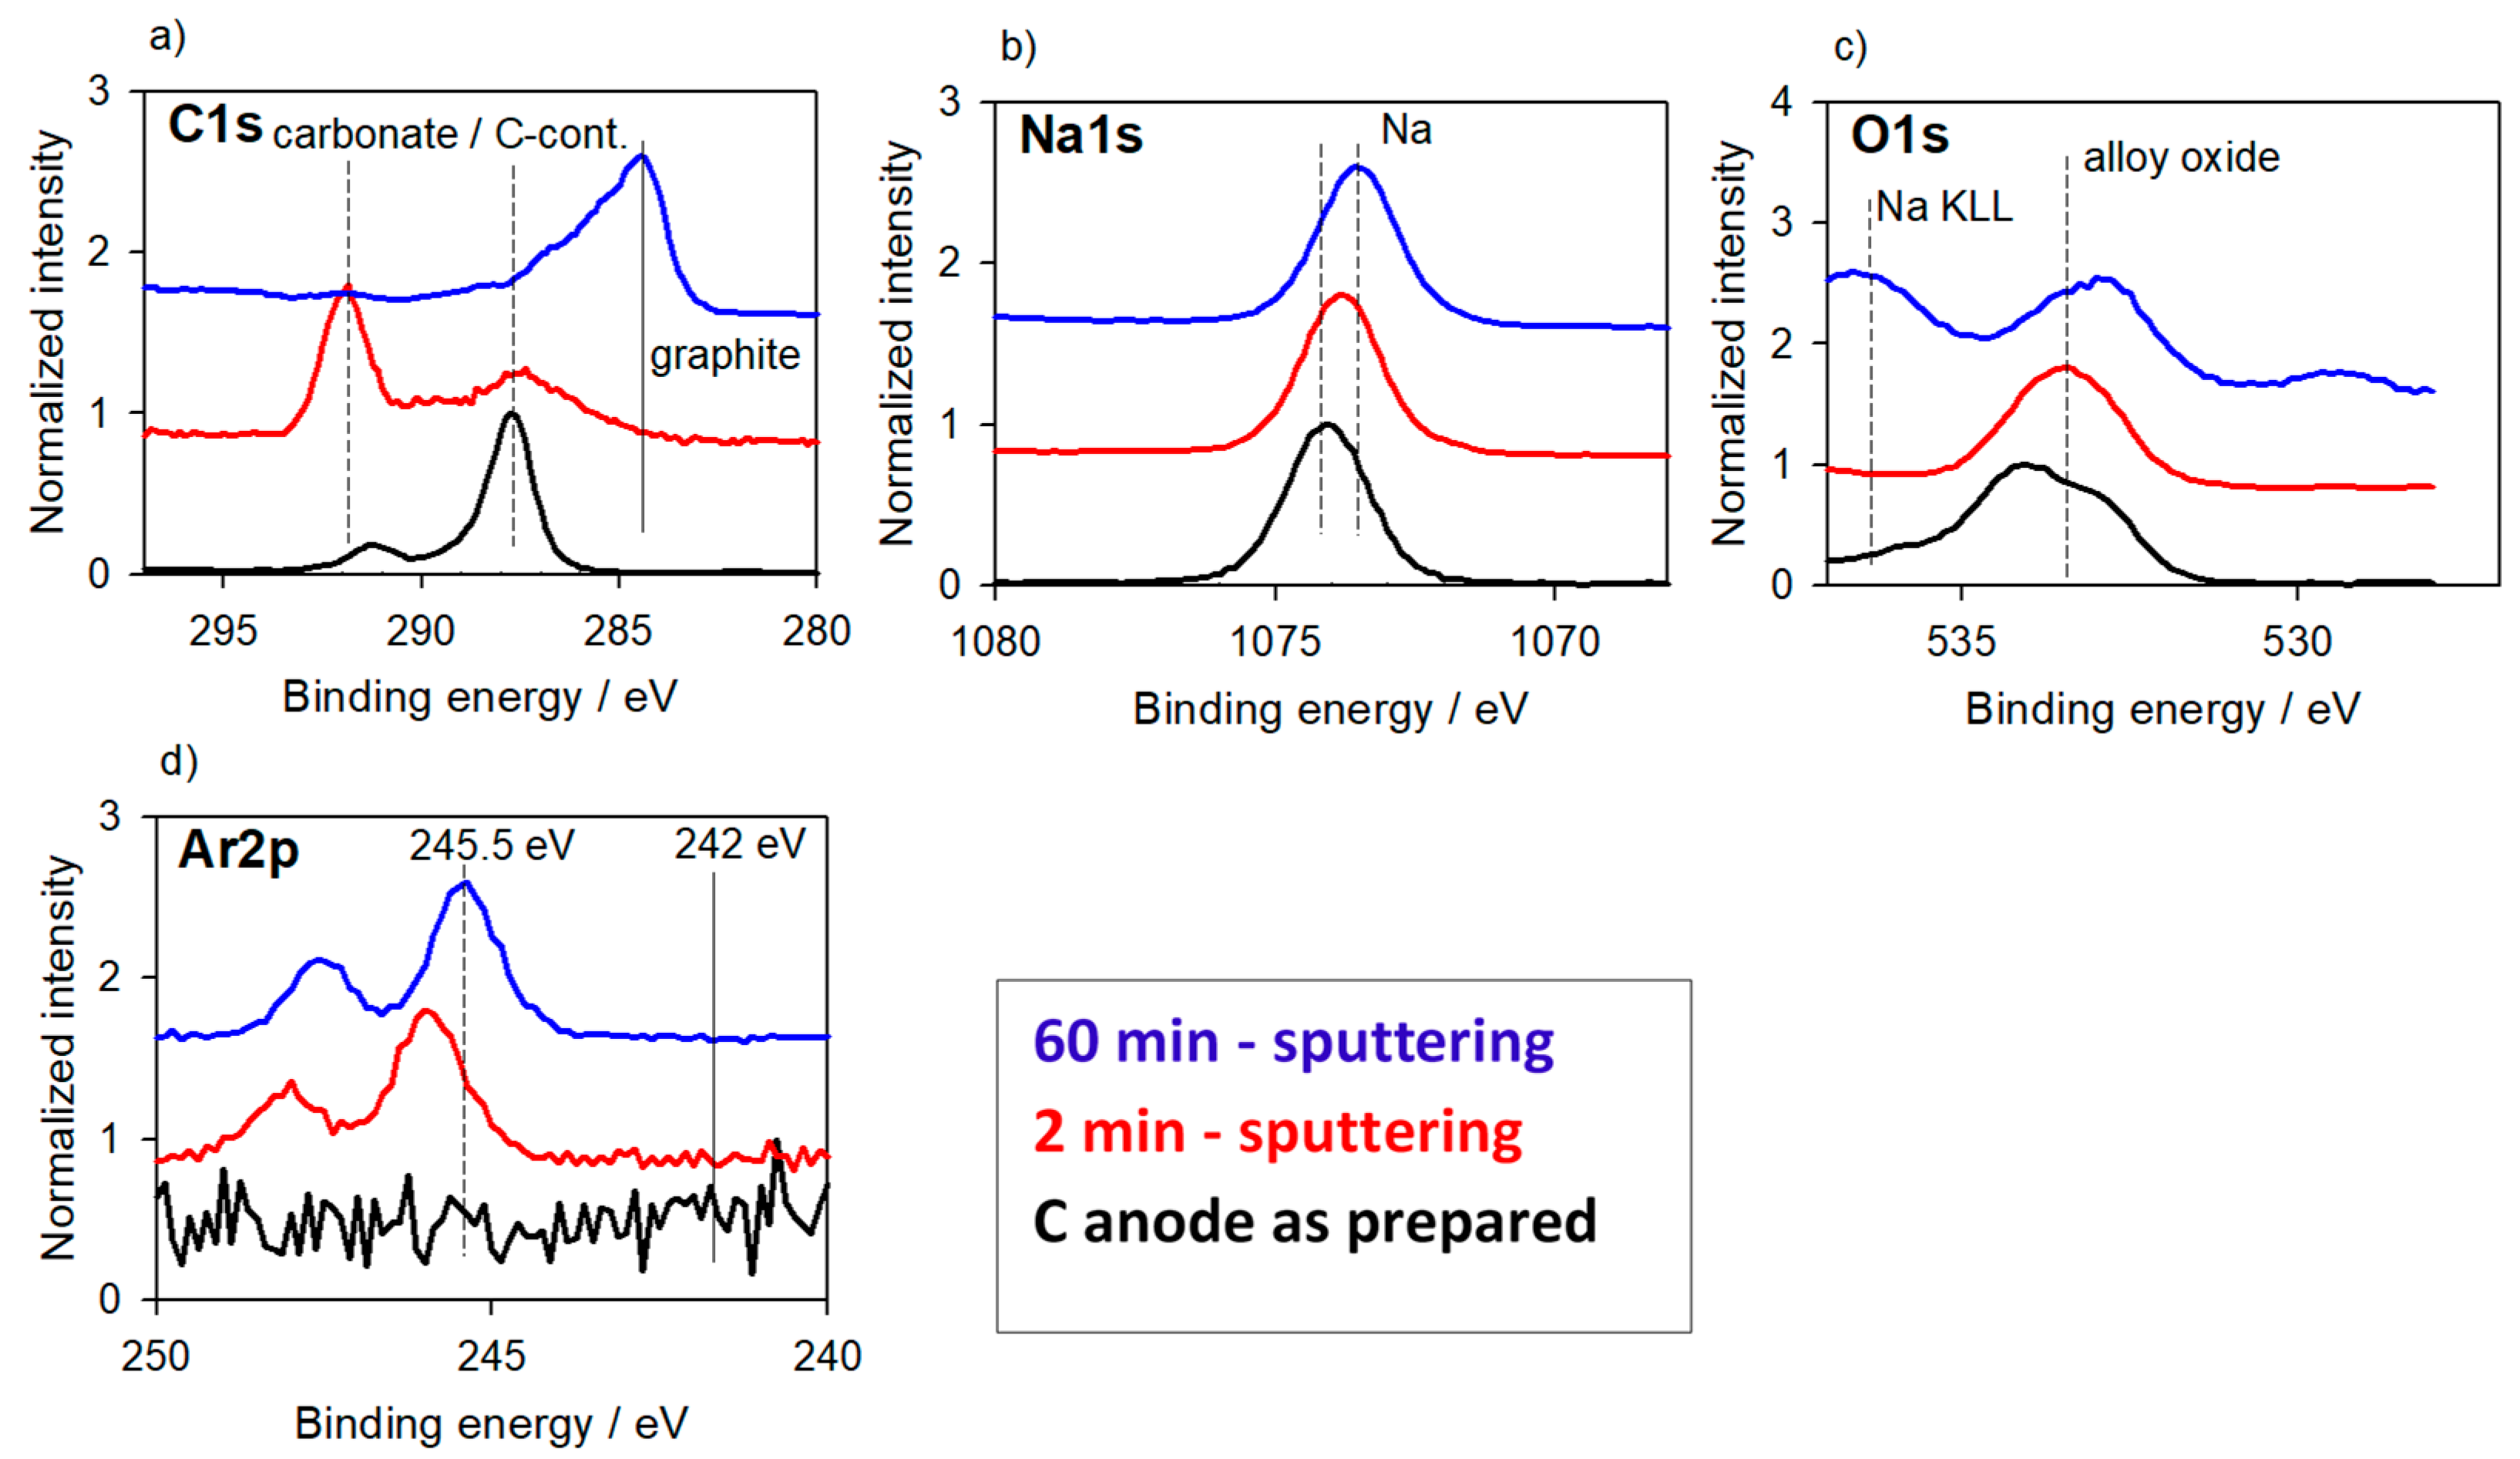
Figure 5 shows results for a sodiated hard carbon anode material to allow a more generalized view. On top of the surface an SEI layer assumed in thickness below 100 nm was formed during sodiation by discharging a hard carbon/Na-metal half-cell setup by short-circuiting the electrodes (see Supplement and [38]). This surface layer consists of Na-carbonate and the typical carbon contamination both characterized by high C1s positions of 292 eV and 288 eV, respectively (Figure 5a). After short sputtering the contamination decreases while the carbonate becomes the main component. The C1s BE in expected standard position is only found after long time sputtering (60 min) removing the SEI layer. The signal for Ar, implanted during sputtering, is located at a high BE position of 245.5 eV very similar as reported above for Li-metal foil (Figure 5d vs. Figure 2e). The Na1s peak (Figure 5b) is found as reported in [39] at an unexpected high BE and is only slightly changed with sputter cleaning. It should represent the infiltrated Na state.

3.1.3. Cathode Material

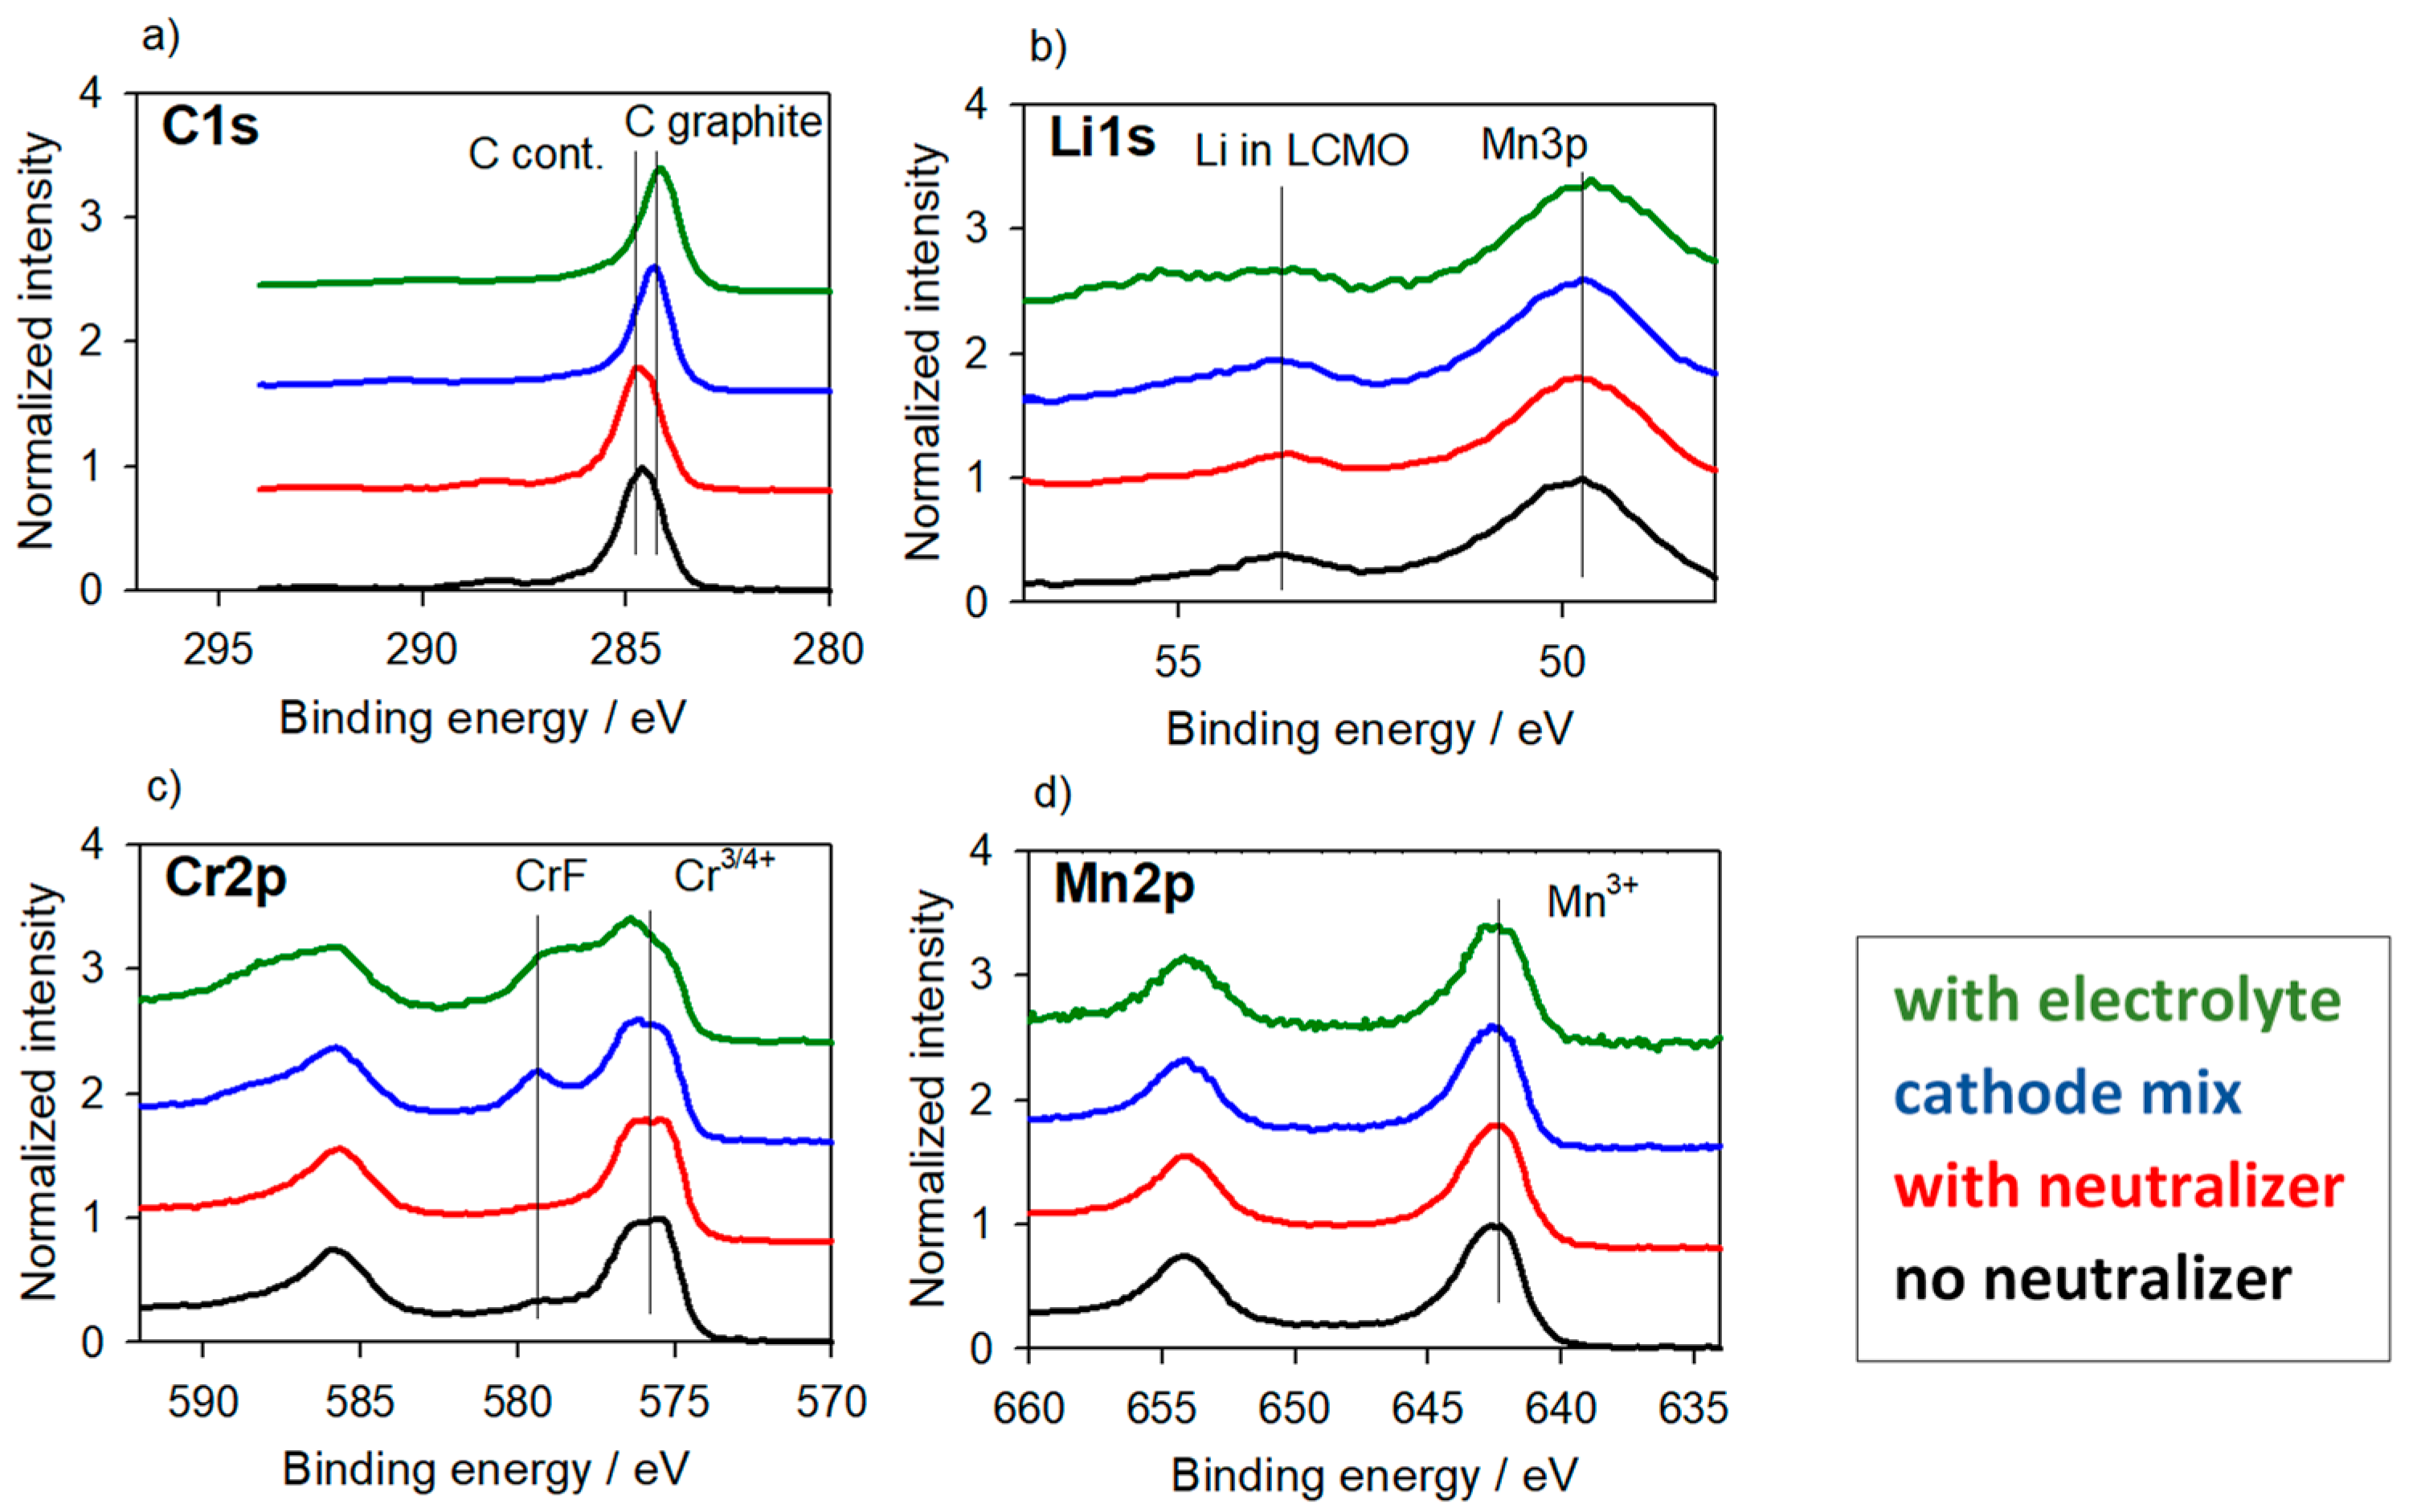
One example for a cathode material with no charging during XPS measurement belongs to earlier investigations of new materials for higher cell voltage—starting with LiCoO2 and evaluating LiCrMnO4. For these materials we also observed nearly no charging when prepared for cathode application as composite with carbon black and PVDF binder. During that work [40,41] no BE correction was made to follow the valence changes for Cr (Cr3+/4+) during the intercalation process. For higher charging voltages up to 5.2 V [41], the irreversible formation of Cr6+ species led to a fast capacity fading during cycling. The intercalated Li was detected at the Li1s position of 54 eV as described for thin film and powder LiCoO2 [42,43]. Because Li is chemically bonded in the complex oxide matrix no Li-induced shift is found—all the BE positions are in the region well known from other investigations. Figure 6 displays XP spectra of LiCrMnO4 samples at different conditions: (i) the pristine powder measured with and without charge neutralization, (ii) a cathode mix of the powder with carbon black and PVDF, and (iii) the cathode mix after contact with the LP30 electrolyte. Aim was to study possible side reactions of binder and/or electrolyte with the LiCrMnO4 powder already before electrochemical cycling. No changes occured during applying the charge neutralizer. Obviously, the material offers enough residual electrical conductivity for the applied measuring procedure. As expected, the Mn and Cr peaks (Figure 6c,d) are positioned on typical BEs of the oxides. The chemical environment of Cr is slightly changed by the binder of the cathode mixture forming some CrFx. Further treatment with the electrolyte resulted in a partial oxidation of Cr3+ to Cr4+ (Figure 6d). The C1s signal is only slightly changed in the position for the pure oxide powder at 284.8 eV for the C-contaminants while it exactly reaches the graphite standard position at 284.4 eV for the cathode mix (Figure 6a). Thus, a BE normalization to the C1s peak would artificially transfer this difference to the oxide material.
For these results, BE correction is normally redundant as no significant charging is observed. Otherwise, as demonstrated, depending on the alkaline metal concentration, the chemical species can be shifted artificially, if the “standard” BE correction, e.g., with respect to C1s for C-H or carbonate, are used to reach the “handbook position” for the Li-containing reaction products as oxide, fluoride or carbonate. In this case, however, the positions of the alkali metal components are highly erroneous and may lead to misinterpretations. These doubts can be dispelled here with a check of the energy position of implanted Ar originating from sputtering.

3.2. Reaction Layers—With Surface Charging

3.2.1. Alloys for Anodes

One main topic in actual battery research is the search for alternative anode materials as replacement for the commonly used graphite. Alloys are a class of materials for such potential applications as new Li-ion batteries anodes. Our attempt was the use of amorphous prelithiated Li-Al phases with the background that the volume change in such phases might play a less important role than in the crystalline state [44].
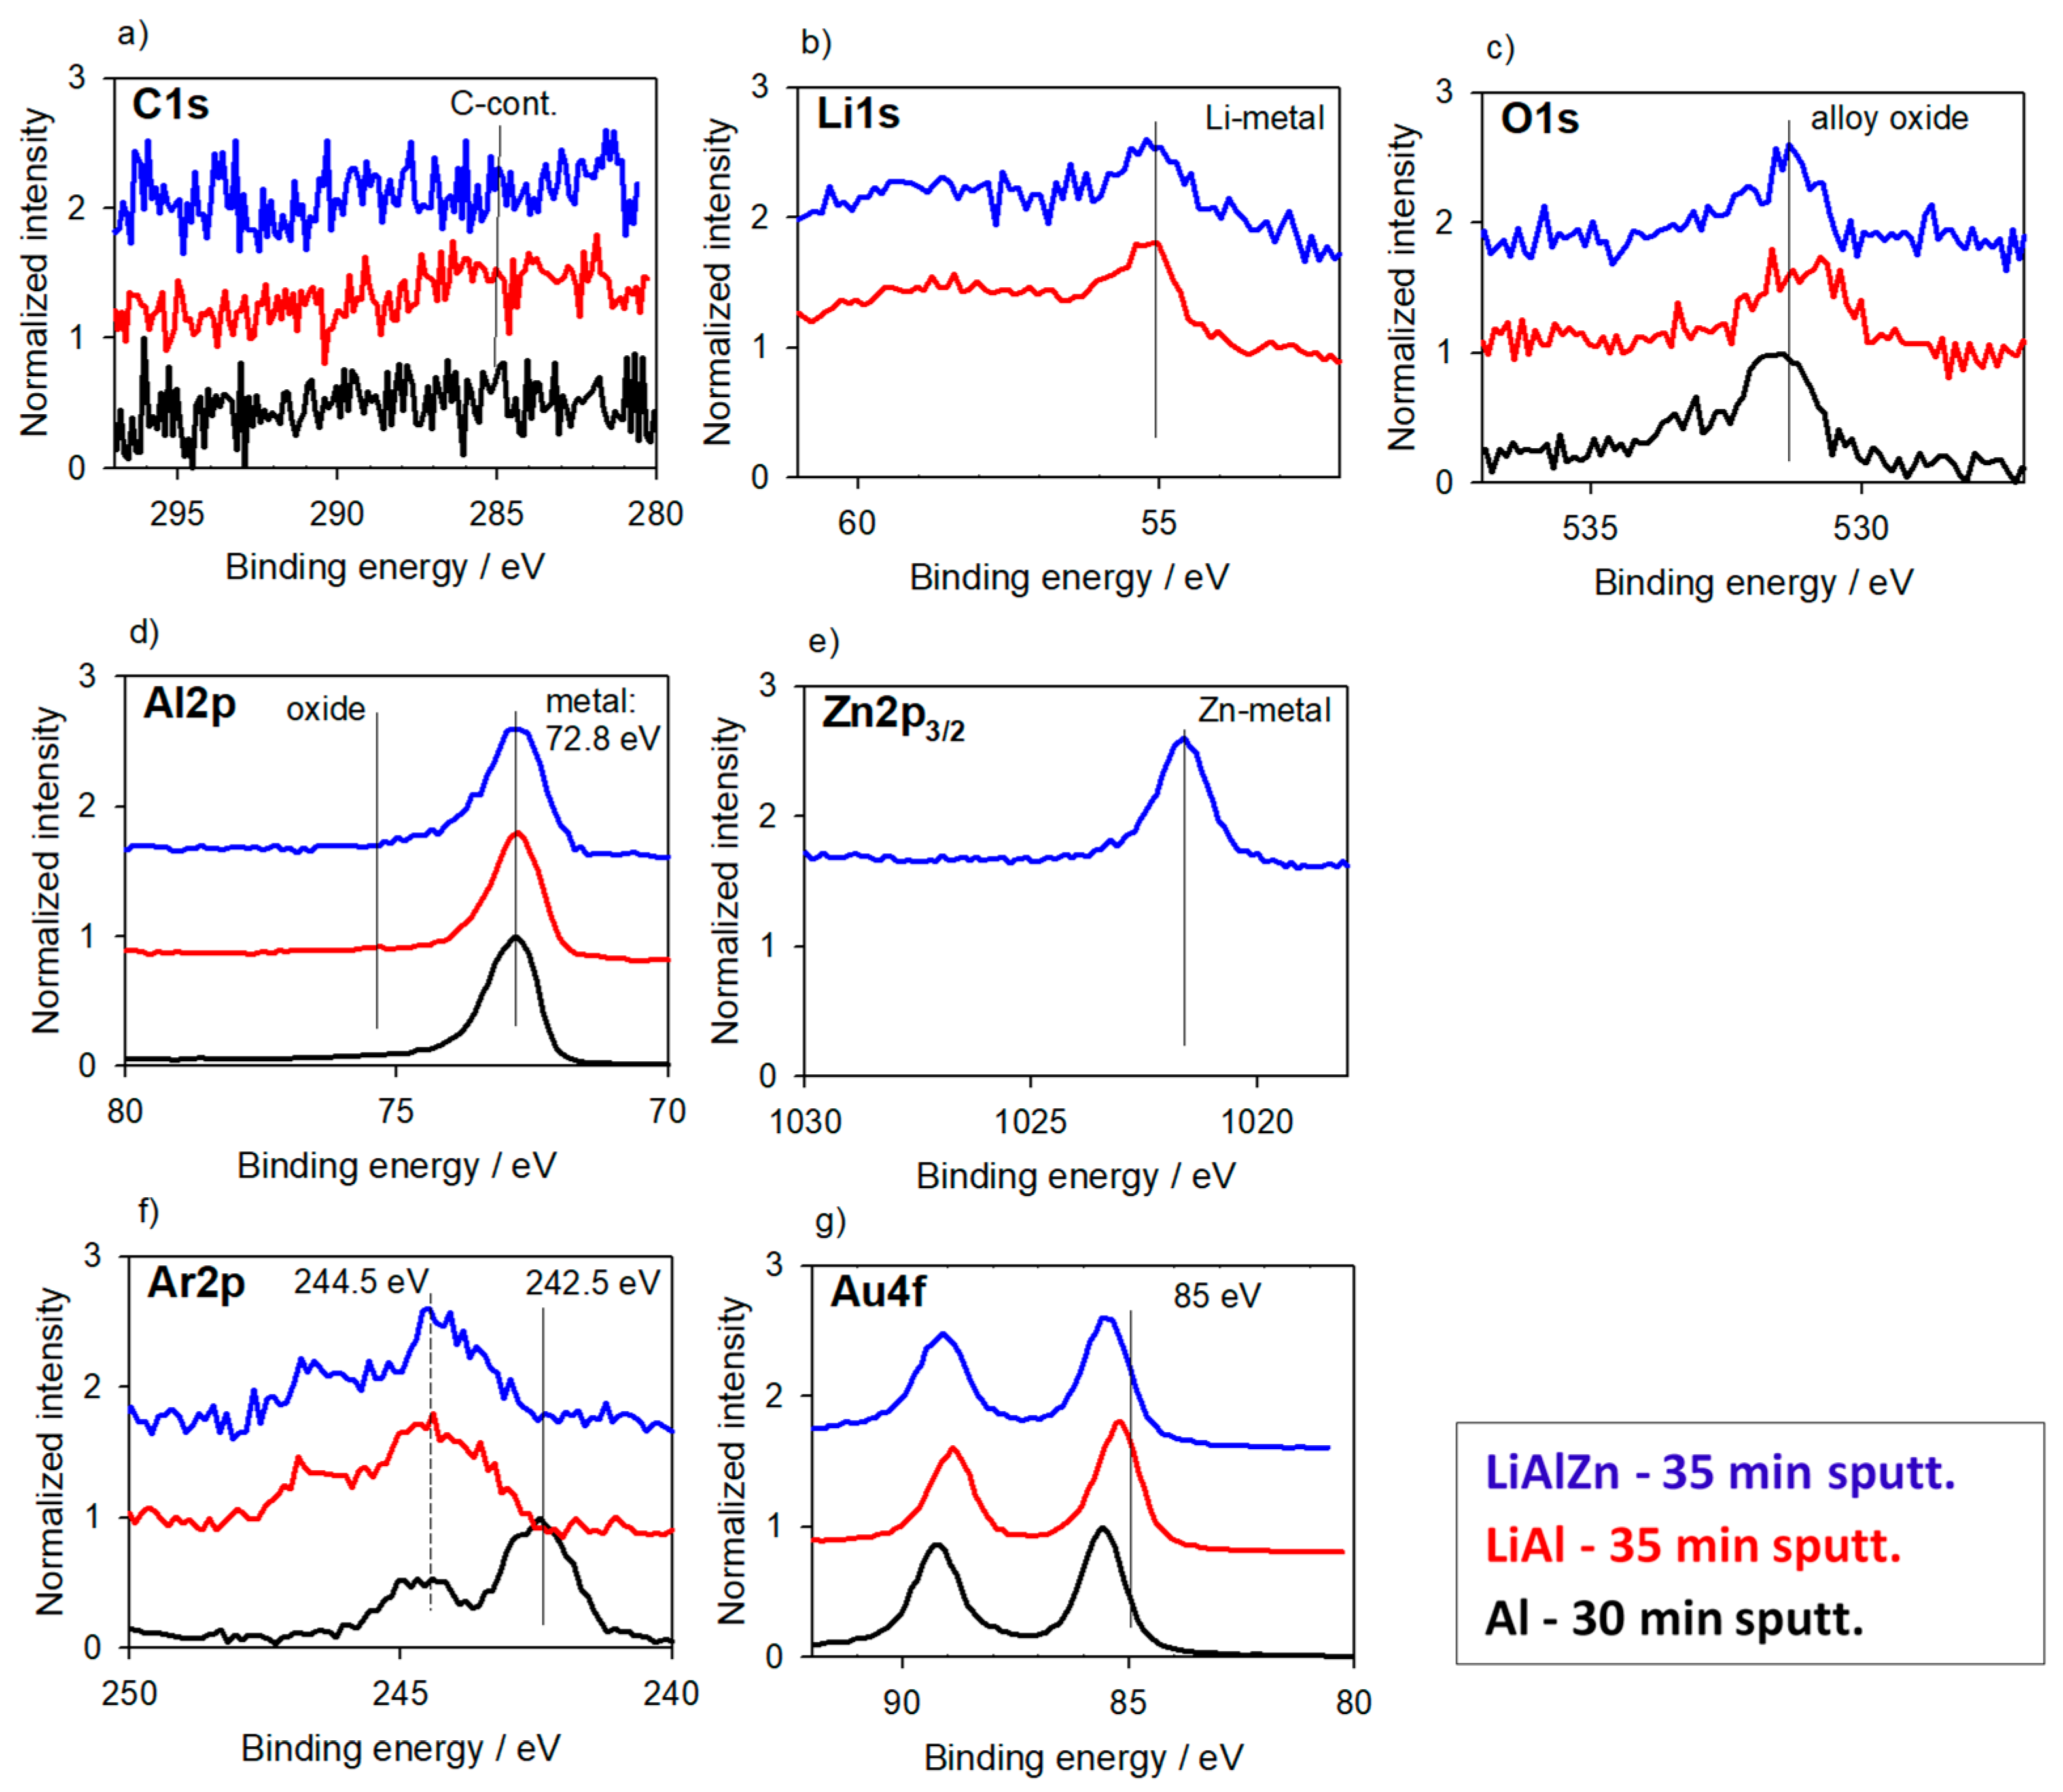
In Figure 7 results for melt-processed, crystalline LiAl- and LiAlZn-materials are shown [45]. The high reactivity of the materials led to thick oxide layers with significant peak shifts due to charging effects. To remove the oxides completely, long-time sputtering 35 min and an abrasion depth ~100 nm were needed. Unfortunately, carbon was also removed and cannot be used for referencing (Figure 7a). As no Al-oxide was available anymore (Figure 7d), a sputter-cleaned Al metal foil and its Al2p peak at 72.8 eV was used as reference. According to this procedure, Li (Figure 7b) and Zn peaks (Figure 7e) are recorded at the expected metal binding energy positions. Au, sputtered onto the surface as additional reference (Figure 7g), was found in all three samples at the same energy of 85.5 eV. It is noted that this BE position is shifted by 1.5 eV from standard metal energy (84.0 eV) due to small size effect of island formation or alloying with Al. The implanted Ar from sputtering (Figure 7f), however, showed a shift of 2 eV for the lithiated Al samples with respect to the Al metal foil.
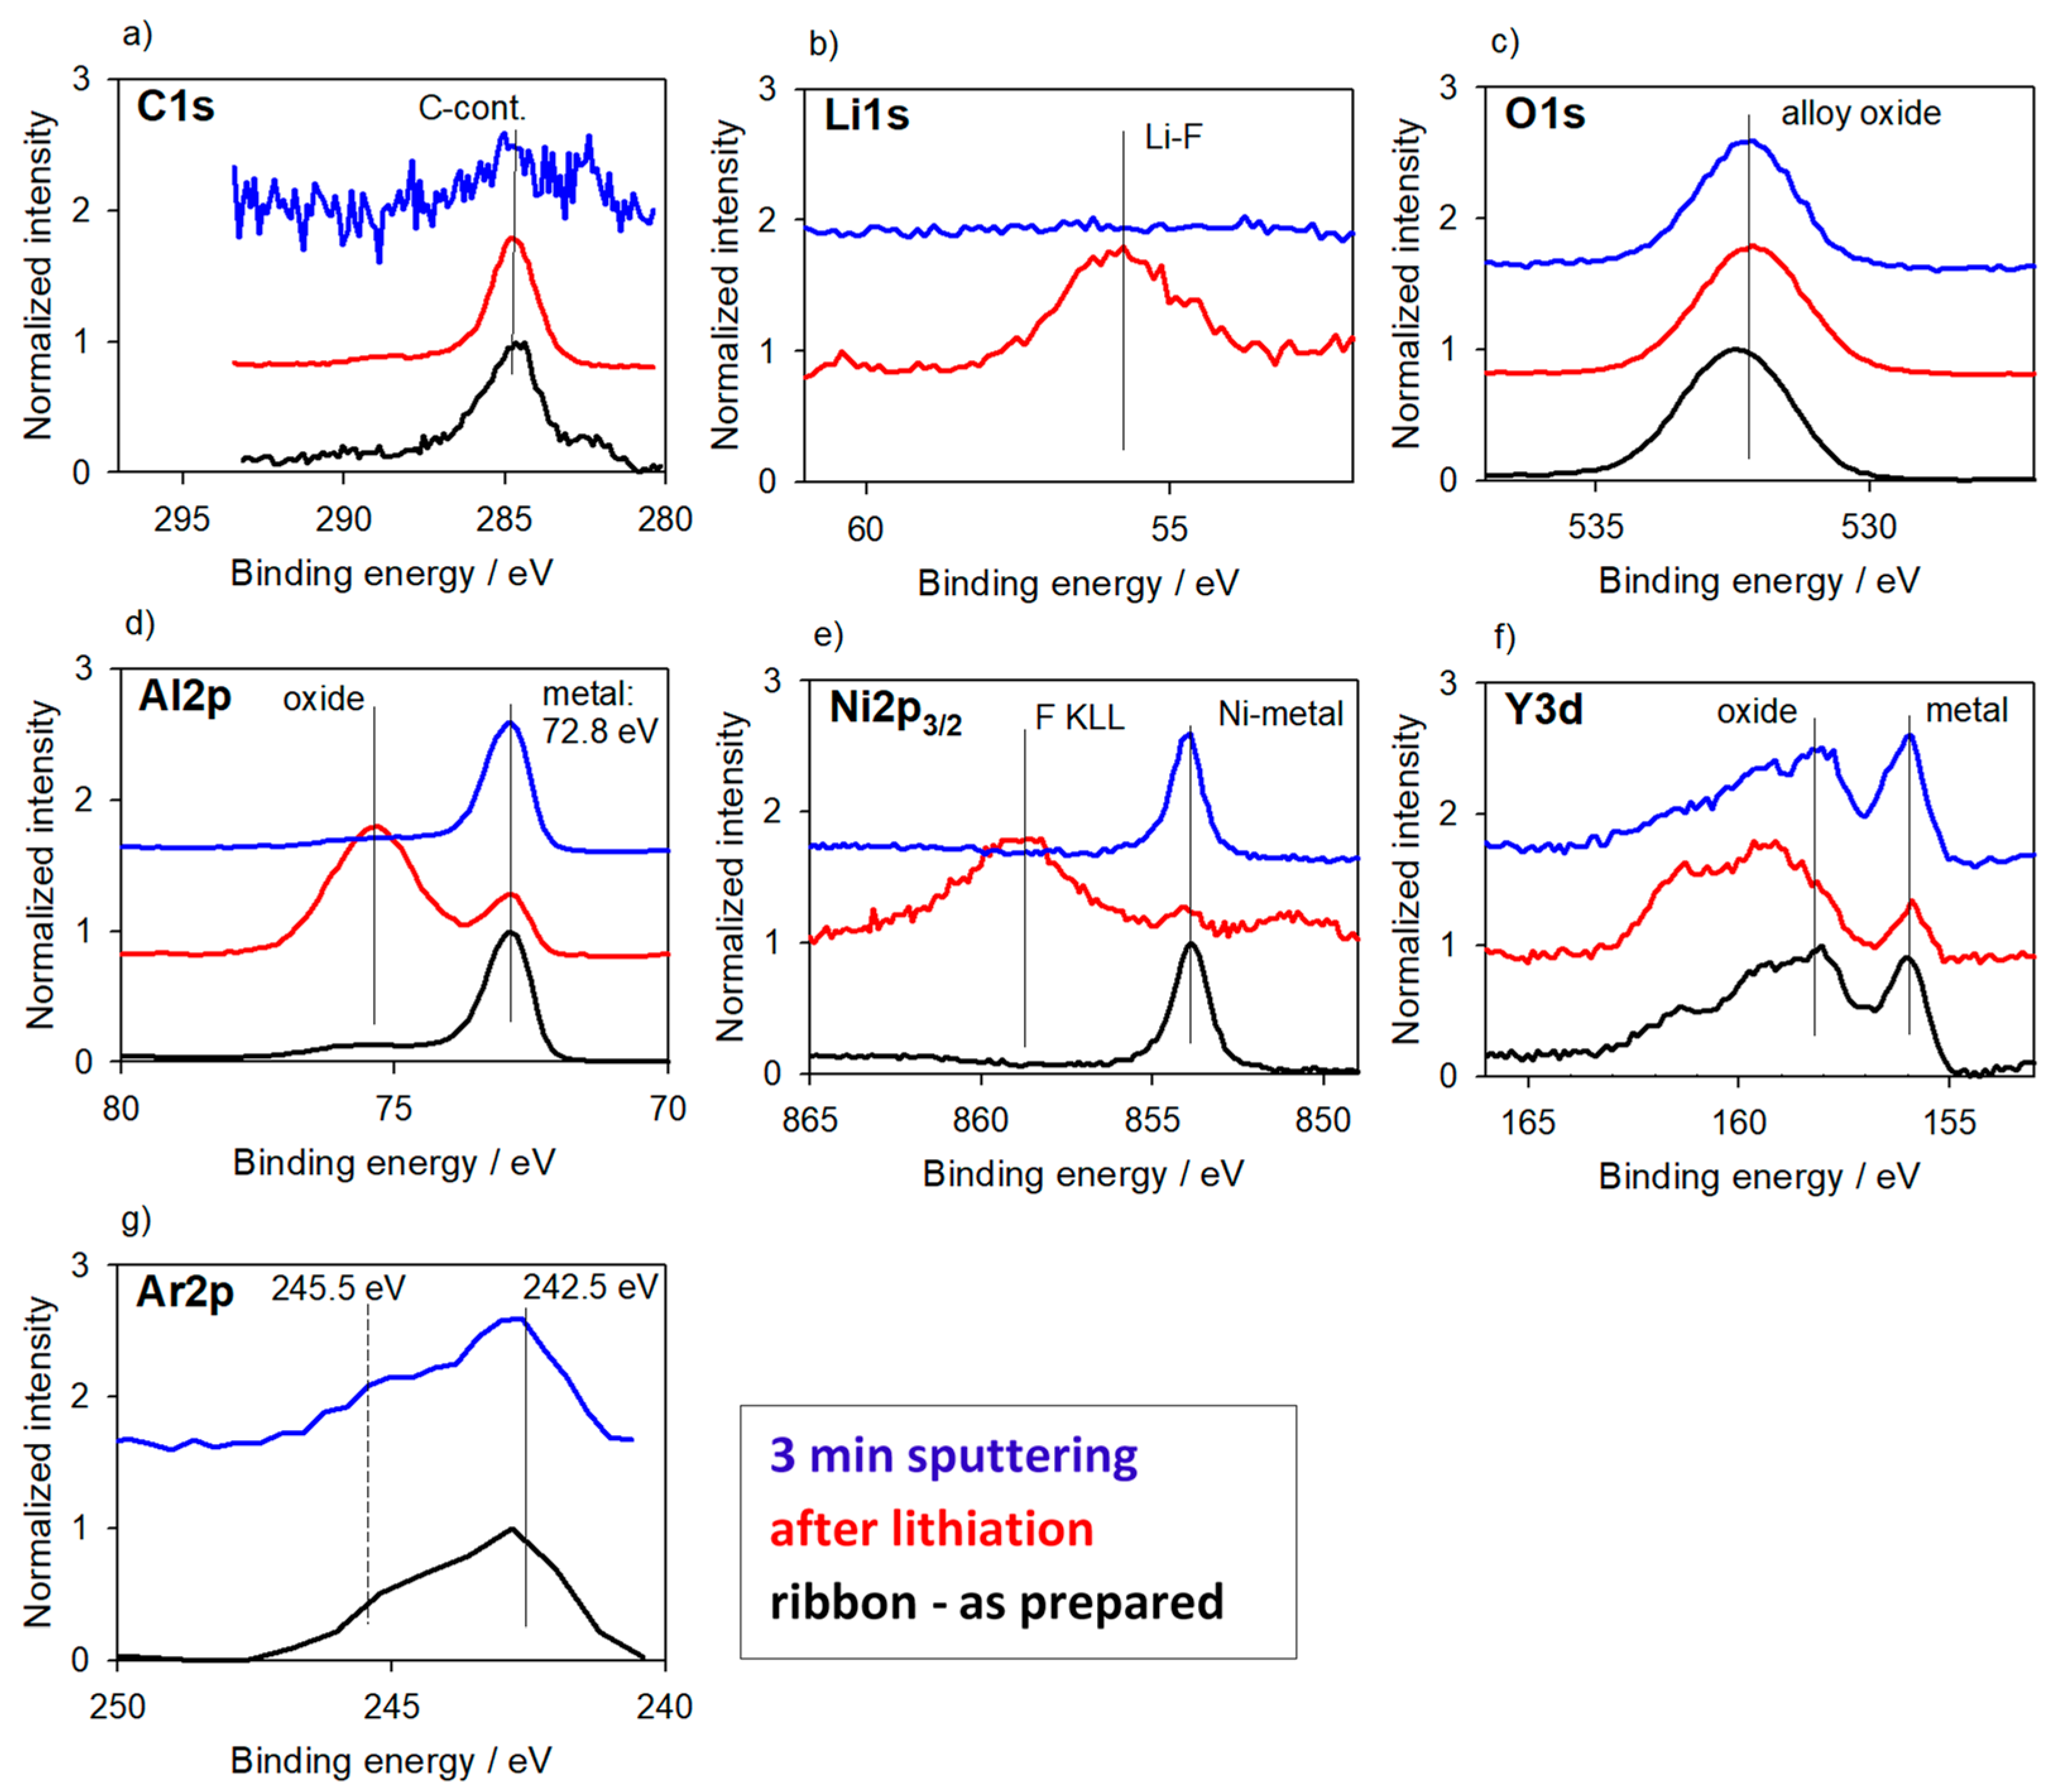
To avoid changes of the chemical environment of the investigated elements, e.g., induced by phase transitions, amorphous Al-based materials, here Al-Ni-Y (and Al-Ni-La) alloys, were prepared by melt-spinning and were directly used as electrodes to check their lithiation behavior [44,46]. In Figure 8 the comparison of (i) an as-spun, (ii) a lithiated and (iii) a lithiated and sputtered Al-Ni-Y ribbon is presented. As for Figure 7 the BE correction was undertaken by using the Al2p metal peak at 72.8 eV (Figure 8d). After lithiation, the surface was dominated by Li-(O)-F species but already after short sputtering of 3 min resulting in almost 10 nm abrasion, no more Li was observed (Figure 8b). Interestingly, the C-contamination and Li(O)F peaks are not shifted at the surface after lithiation (Figure 8b,c, F not shown), but found at the “normal” binding energies, confirming that C1s referencing is appropriate here. This behavior points to the fact that no lithiation of the ribbon occurred and just lithium was plated onto the surface of the ribbon. The deposited lithium was highly reactive, leading to the formation of the Li-(O)-F species during the electrochemical treatment. This observation is well-supported by the absence of any Li species after a short sputtering period. Additionally, the implanted Ar (Figure 8g) was detected at the normal standard BE as seen for the sputtered as-prepared ribbon. No shift to higher BEs, as observed for Li-Al-Zn alloys in Figure 7, underlines these findings and prove the absence of Li.
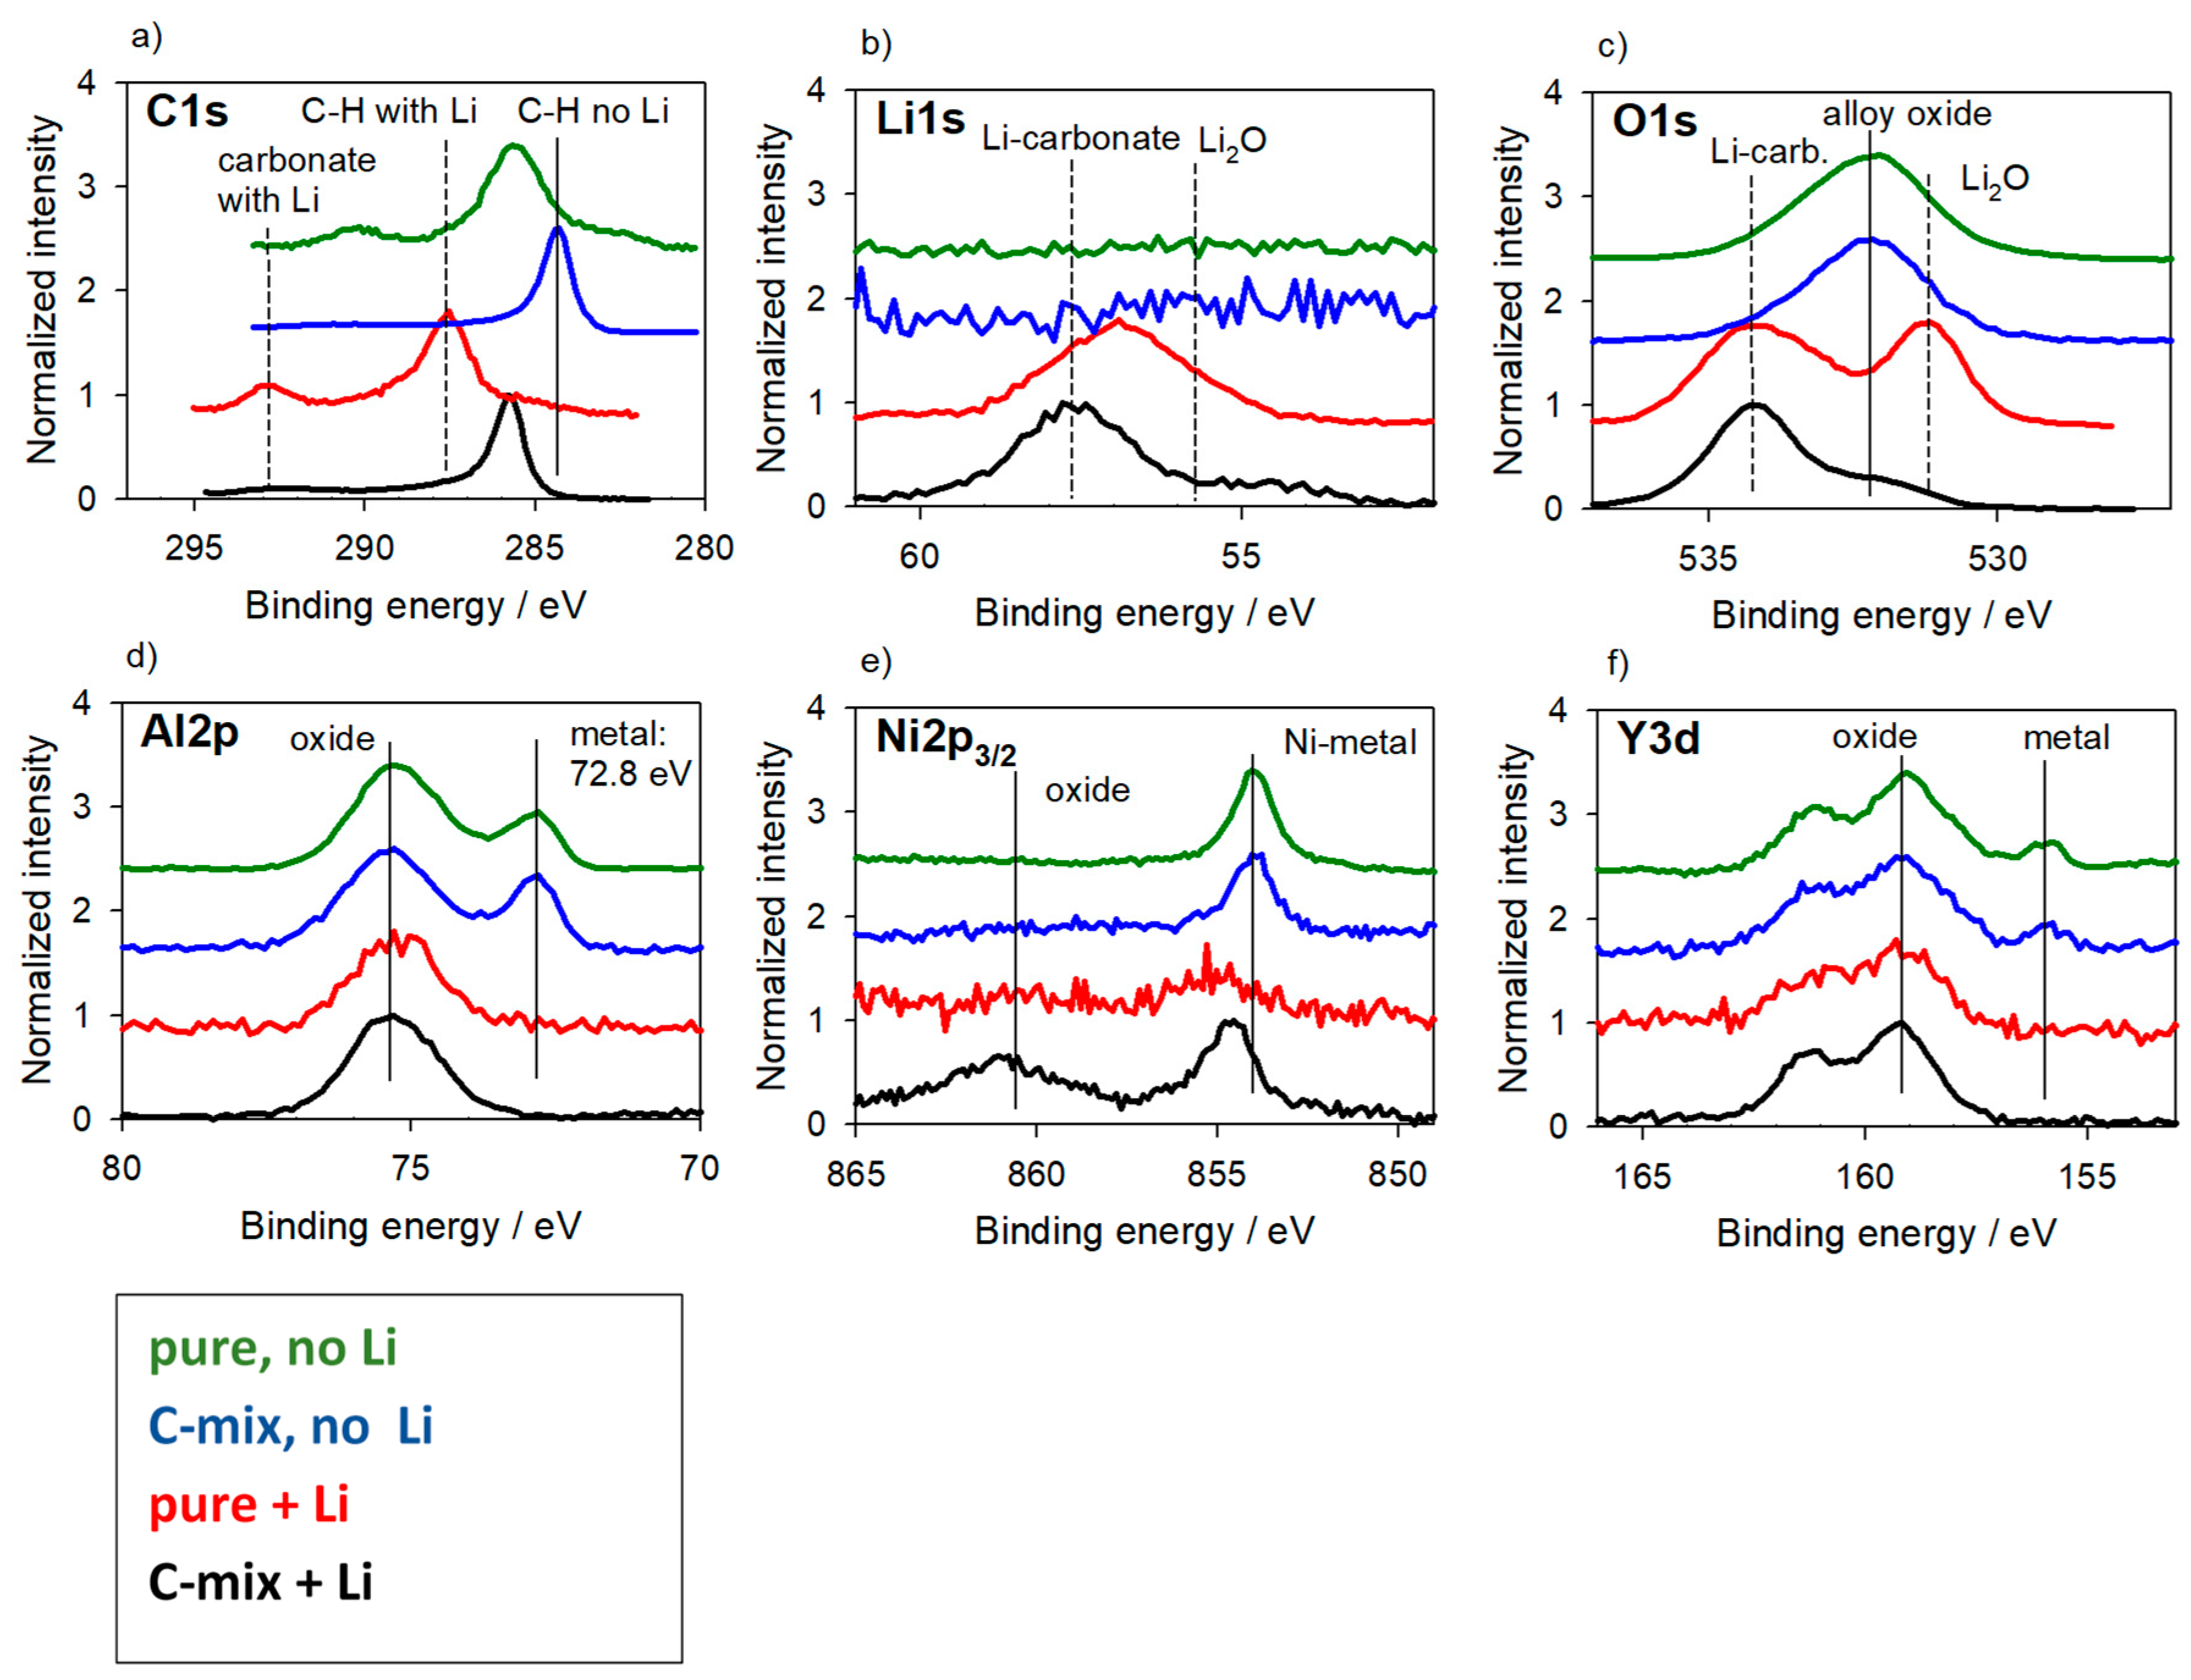
This behavior is completely inverted if a similar amorphous alloy composition was selected, but Li was already introduced into the alloy during preparation [47]. AlNiY powder undoped and doped with Li and prepared by ball milling [44,46,47] were measured as pure powder and mixed with carbon black with the aim to minimize/remove the charging effects. Figure 9 shows the spectra. The C1s peak (Figure 9a) was not suitable as reference because there was obviously not enough electrical contact between the carbon powder and the oxide material (see also more detailed discussion at Figure 10). Thus, similarly to the other alloys, as presented in Figure 7 and Figure 8, Al2p (Figure 9d) was used as reference peak. For the Li-containing material, no more Al metal peak was detected, and a two-step procedure was used to allow for suitable referencing: At first, for the two Li-free samples, a BE was corrected to the Al2p metal peak at 72.8 eV with the help of an external standard, an additional Al metal foil. At second, the corresponding Al-oxide peak visible also for the metal foil at 75.3 eV was referenced and the resulting BE was transferred to the Li-containing samples. After this correction, a clear picture of the oxidation state was derived. For the Li-doped samples, Li compounds in a mixture of carbonate and oxide are formed on top (Figure 9b,c) and the underlying material is characterized only by oxides even for Al, Ni and Y (Figure 9d–f). This high oxide content results from the high affinity of Li to the residual reactive gases during milling of the powder. For the Li-doped material also the characteristic peaks of carbonate contamination (Figure 9a) and the Li1s and O1s peaks (Figure 9b,c) were shifted to higher BE due to the influence of the underlying Li-doped alloy. In the undoped material, Ni is present in the metallic state (Figure 9e) and for both, Al and Y (Figure 9d,f), metal-like components were observed. As also discussed later in more detail for the results presented in Figure 10, the difference in the positions of the C1s graphite peaks for the powders mixed with carbon black (Figure 9a) points to differential charging and confirms that a C-referencing was not possible and therefore not recommended. Thus, the internal reference peaks have to be selected carefully, best procedure is to search for an element with a well-defined chemical state and to specify the absence of a differential charging shift there.

3.2.2. Cathode Material

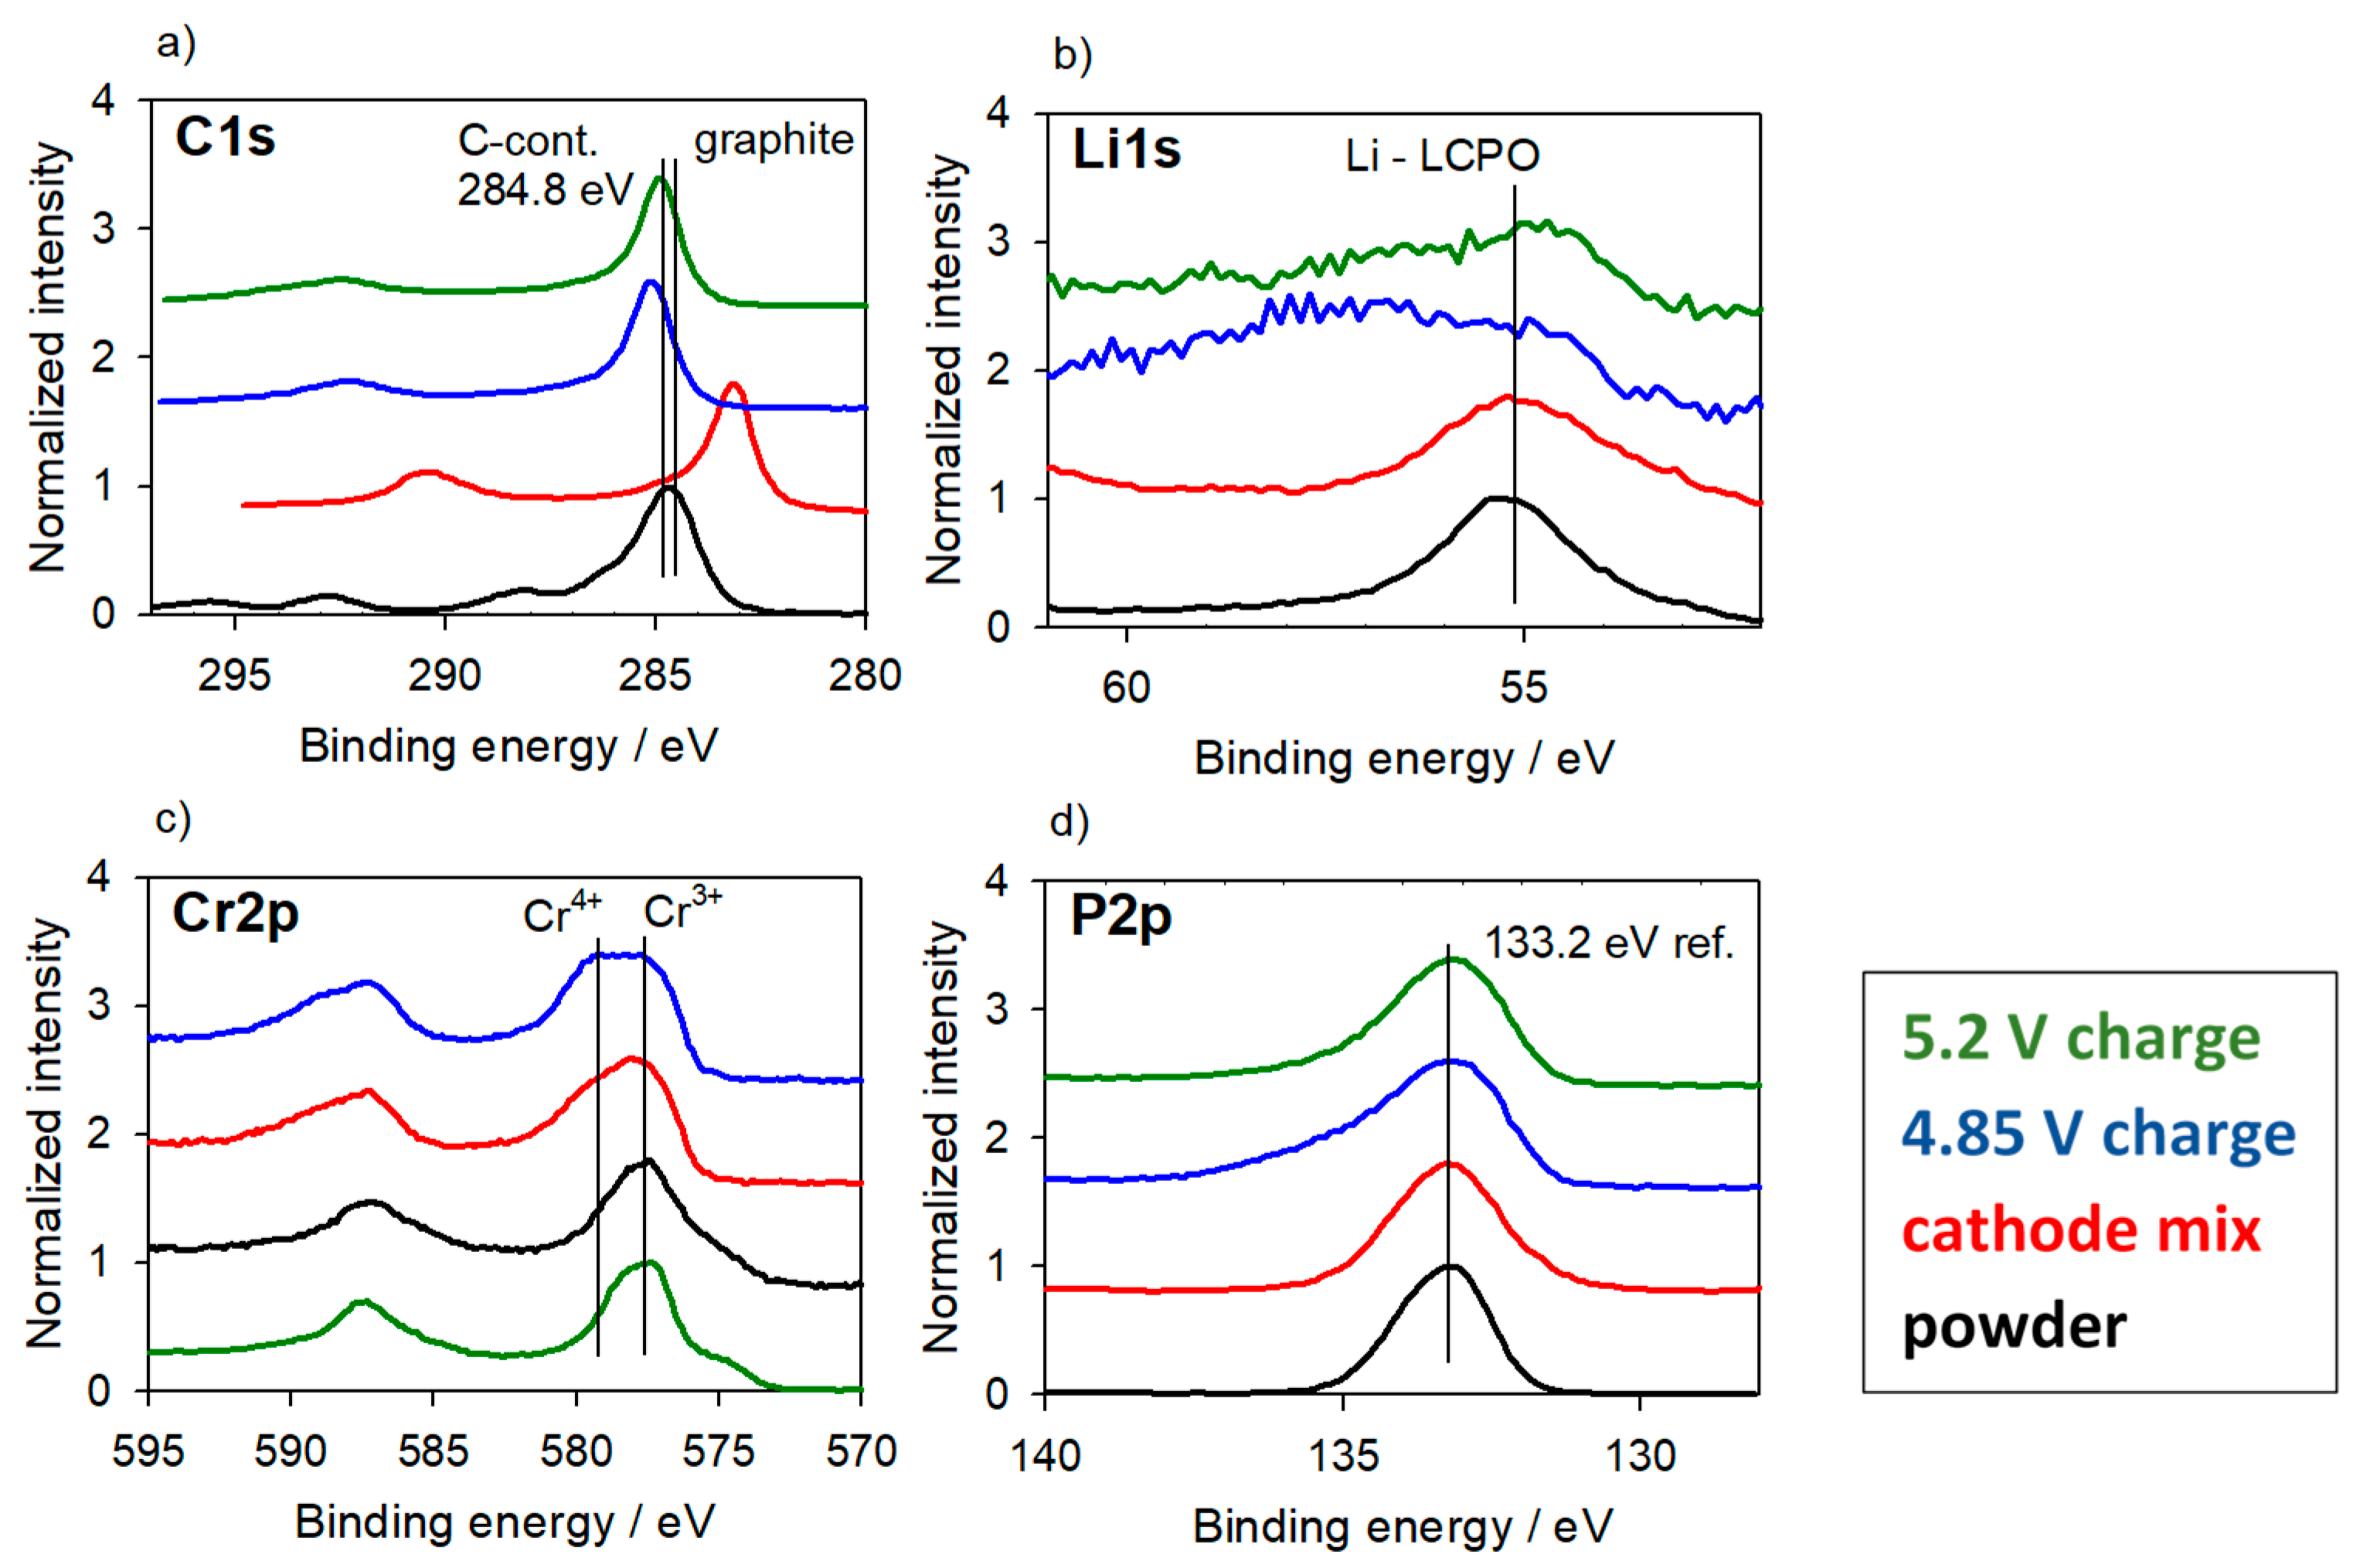
As an example for a cathode material with charging effects, Li3Cr2(PO4)3 of the LISICON structure family is used [48]. In Figure 10, a comparison of (i) the pristine powder, (ii) the powder as cathode mix with carbon black and PVDF, (iii) the cathode mix charged (delithiated) to 4.85 V and iv) delithiated to 5.2 V are compiled. Sample preparation is quite similar to the investigations for LiCrMnO4 as discussed for Figure 6. We first decided to use the C1s position from the C-contamination at 284.8 eV for calibration only for the pure powder sample (Figure 10a) and correct the other three samples to the P2p peak at 133.2 eV afterwards (Figure 10d). A negligible chemical change in the metal-PO bonds was assumed to justify this procedure. After the correction, the three samples investigated as cathode mix significantly varied in the C1s BE positions (Figure 10a) and were shifted to higher and even lower BEs compared to the expectable dominating graphite position at 284.4 eV. Remembering the results of the LiCrMnO4 sample series shown in Figure 6 where the carbon peak is clearly characterizing a graphite/contamination mixture, the measuring results presented here for the Li3Cr2(PO4)3 show a situation far away from the real chemical state of the carbon species in the electrode mixture. Obviously, there is not enough electrical contact between the active material and the carbon black particles to allow enough conductivity, which may result from the particulate heterogeneity of the mixture. Therefore, the heterogeneity leads to differential charging between these individual particles and the shifts in the spectra. Therefore, C1s is not suitable for charge referencing. In the Cr2p spectra (Figure 10c), however, a broadening to higher BE with charging is still found, while a valence change is expected with the ongoing delithiation process.
It becomes clear that in the case of charging, the correction of the BE scale is unavoidable for suitable identification of chemical states. Often the standard procedure by choosing the C1s peak from C-H contamination at around 284.8 eV is helpful. In some cases, this method cannot be used, e.g., after sputter-cleaning, when the C1s peak disappears or, such as for heterogeneous electrode mixtures, differential charging occurs. C1s referencing by the C-contamination and/or graphite is obviously no option for BE calibration there and may lead to an improper BE shift. The better choice in this case is to make use of peaks, which can act as “internal standards”, that means elements in the sample with well-known chemical state and environment. For that reason, the P2p signal was selected here for referencing but comparing measurements of standard samples with similar well-known chemical environments and states as found in the samples are additionally recommended.

3.3. Reference Samples—With Charging

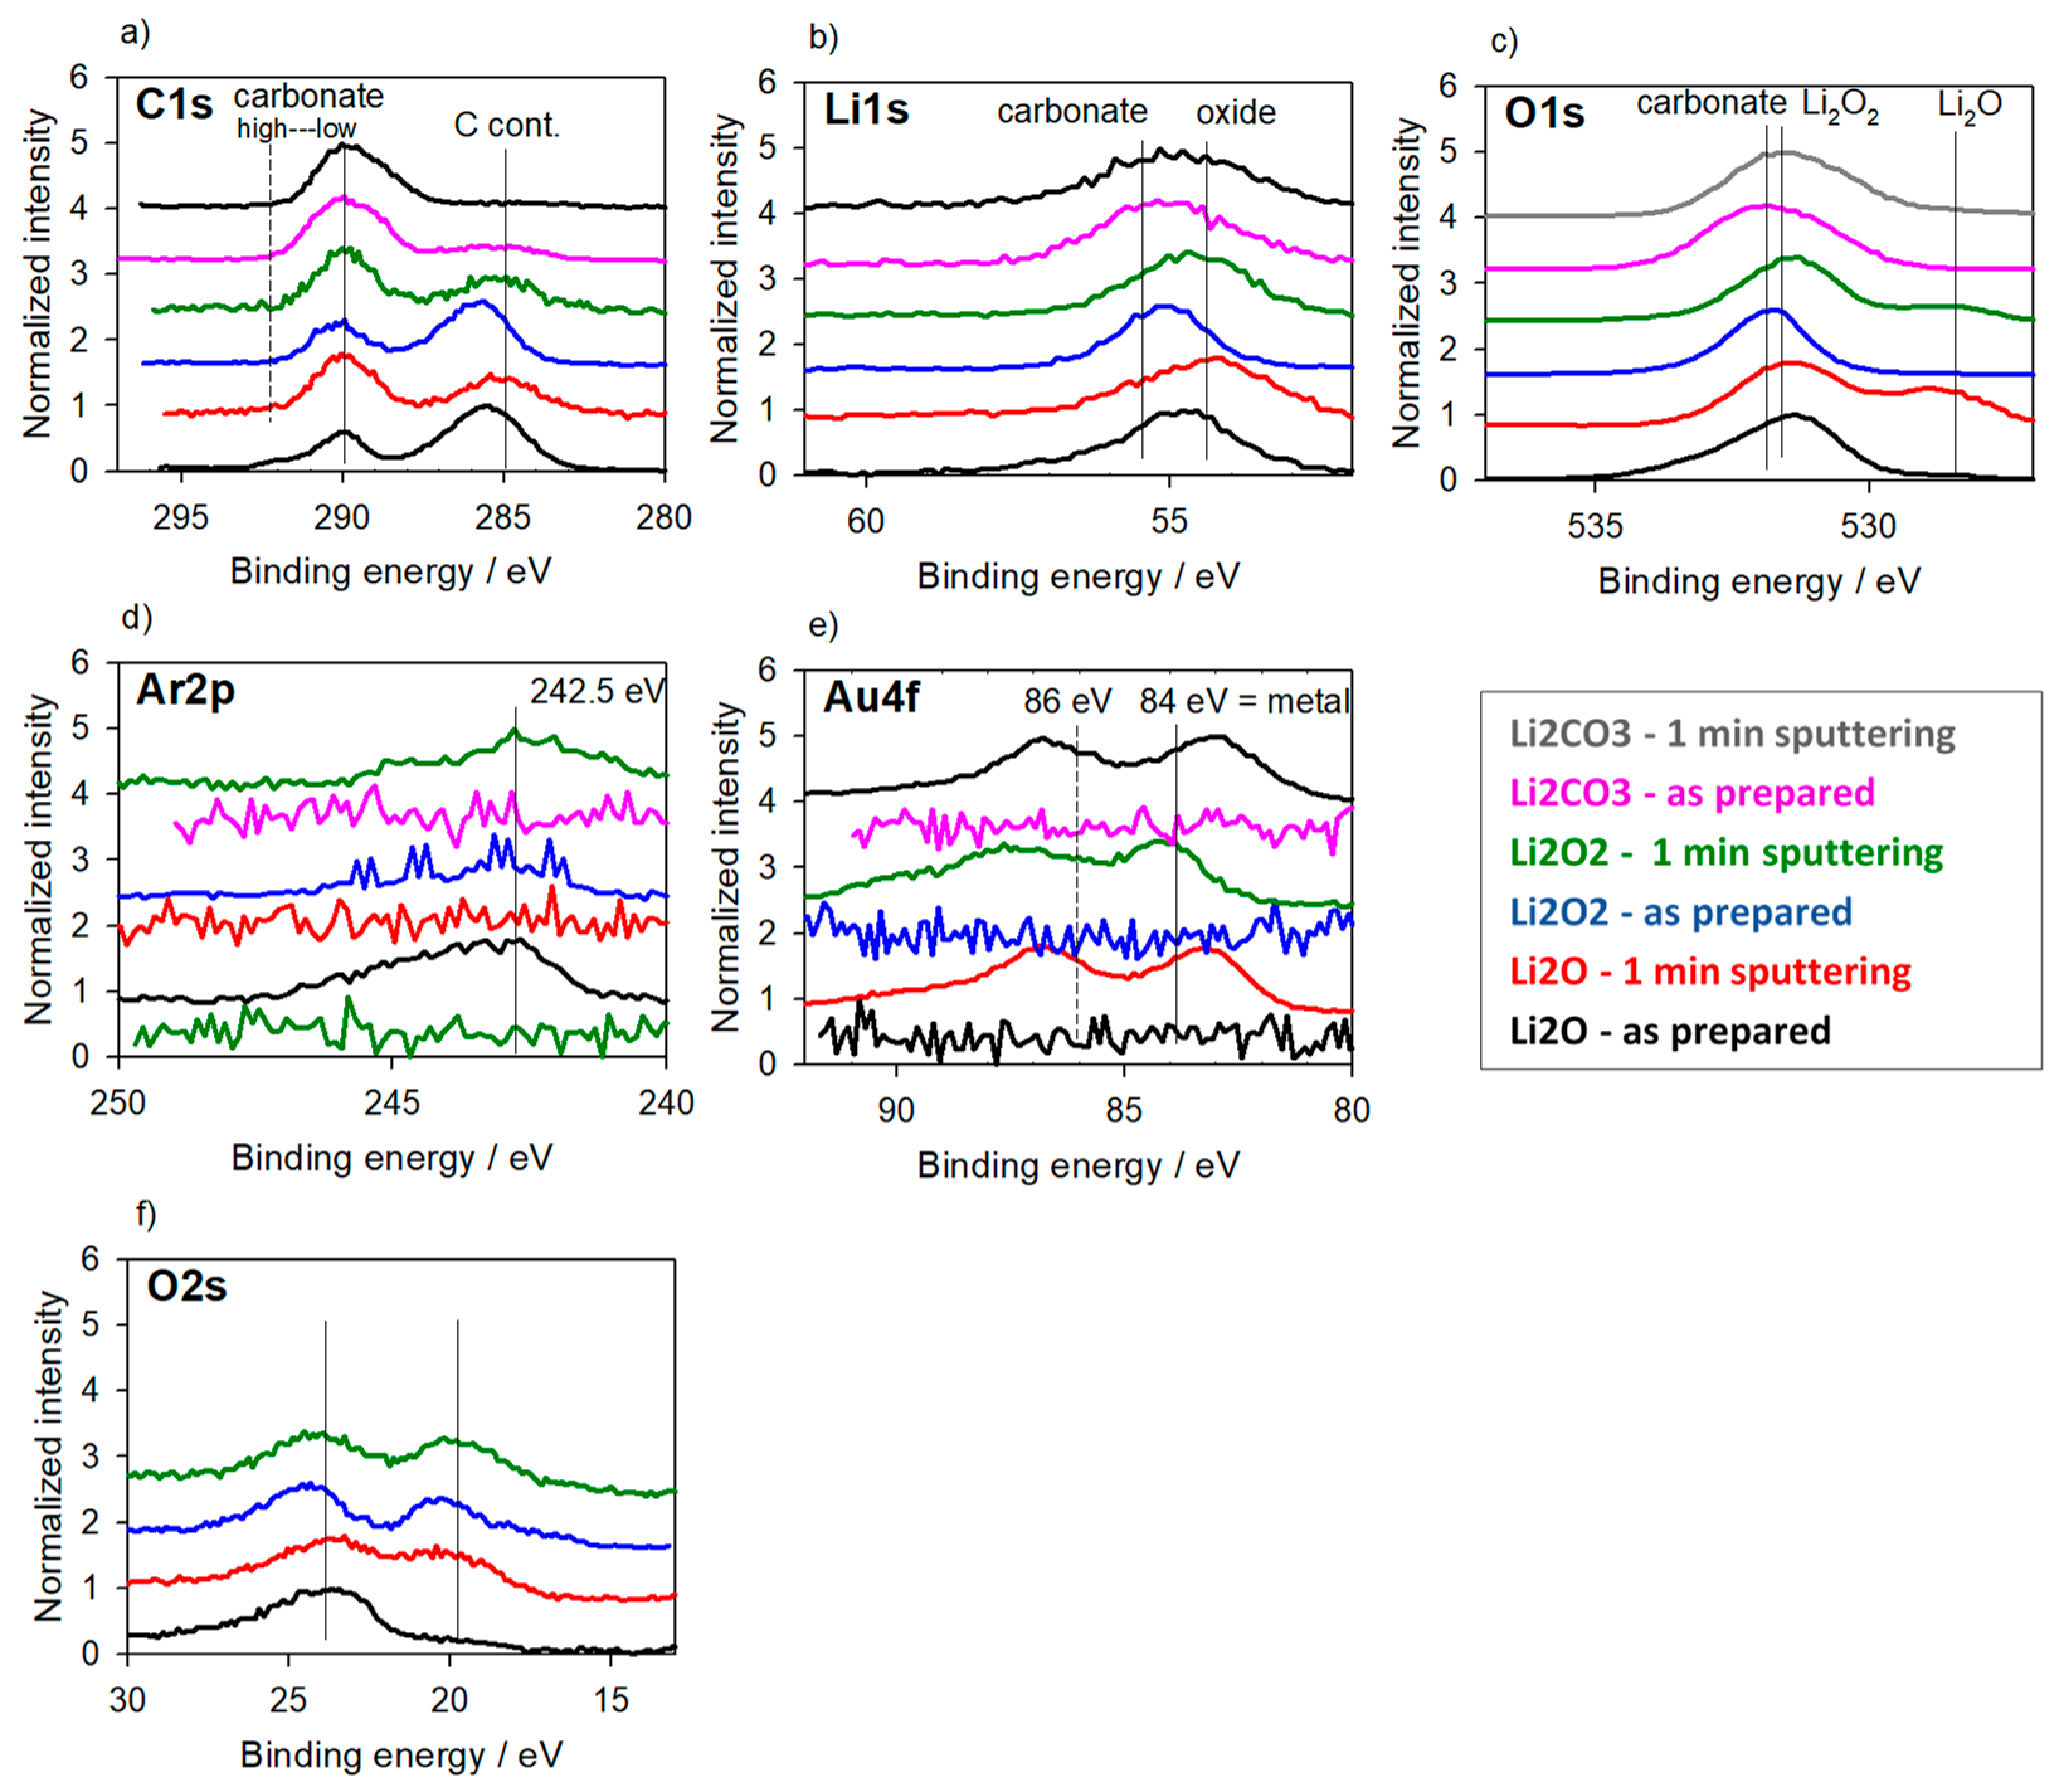
Occurring reaction products in the LIBs often consist of a number of chemical species which are mainly non-conducting oxides. For identification and characterization purposes, the measurement of reference materials is important. In Figure 11, we present a comparison of Li2CO3, Li2O2 and Li2O reference powders delivered as pure standard chemicals purchased from Fluka, Buchs/Switzerland (p.p.a.), ABCR, Karlsruhe/Germany (95%) and Sigma-Aldrich, Darmstadt/Germany (97%), respectively. The spectra are presented for the powders as-delivered transferred from the glove box and also after short sputter cleaning of 1 min equivalent with about 3 nm in depth. Traces of Au were deposited onto the sputter-cleaned samples by a sputtering process. In the C1s spectra (Figure 11a), all powders show significant Li2CO3 residuals whereas the C-H contamination vary strongly in intensity. Thus, we originally decided to use the C1s carbonate peak at 290 eV as BE reference. When applying such shift, the Ar2p (Figure 11d) and Au4f (Figure 11e) peaks are close to the expected elemental “handbook” positions at 242.5 eV and around 84 eV, respectively. Astonishingly, the O1s spectra (Figure 11c), and also the nominal Li:O ratio, for Li2O and Li2O2 are nearly identical, which was also confirmed in other measurement series. Only in the O2s spectra (Figure 11f), a characteristic difference is observed. After sputtering, however, this difference in the O2s signal disappears and in the O1s spectra, an emerging peak points to the beginning of Li2O formation in both cases (see also discussion for Figure 12).
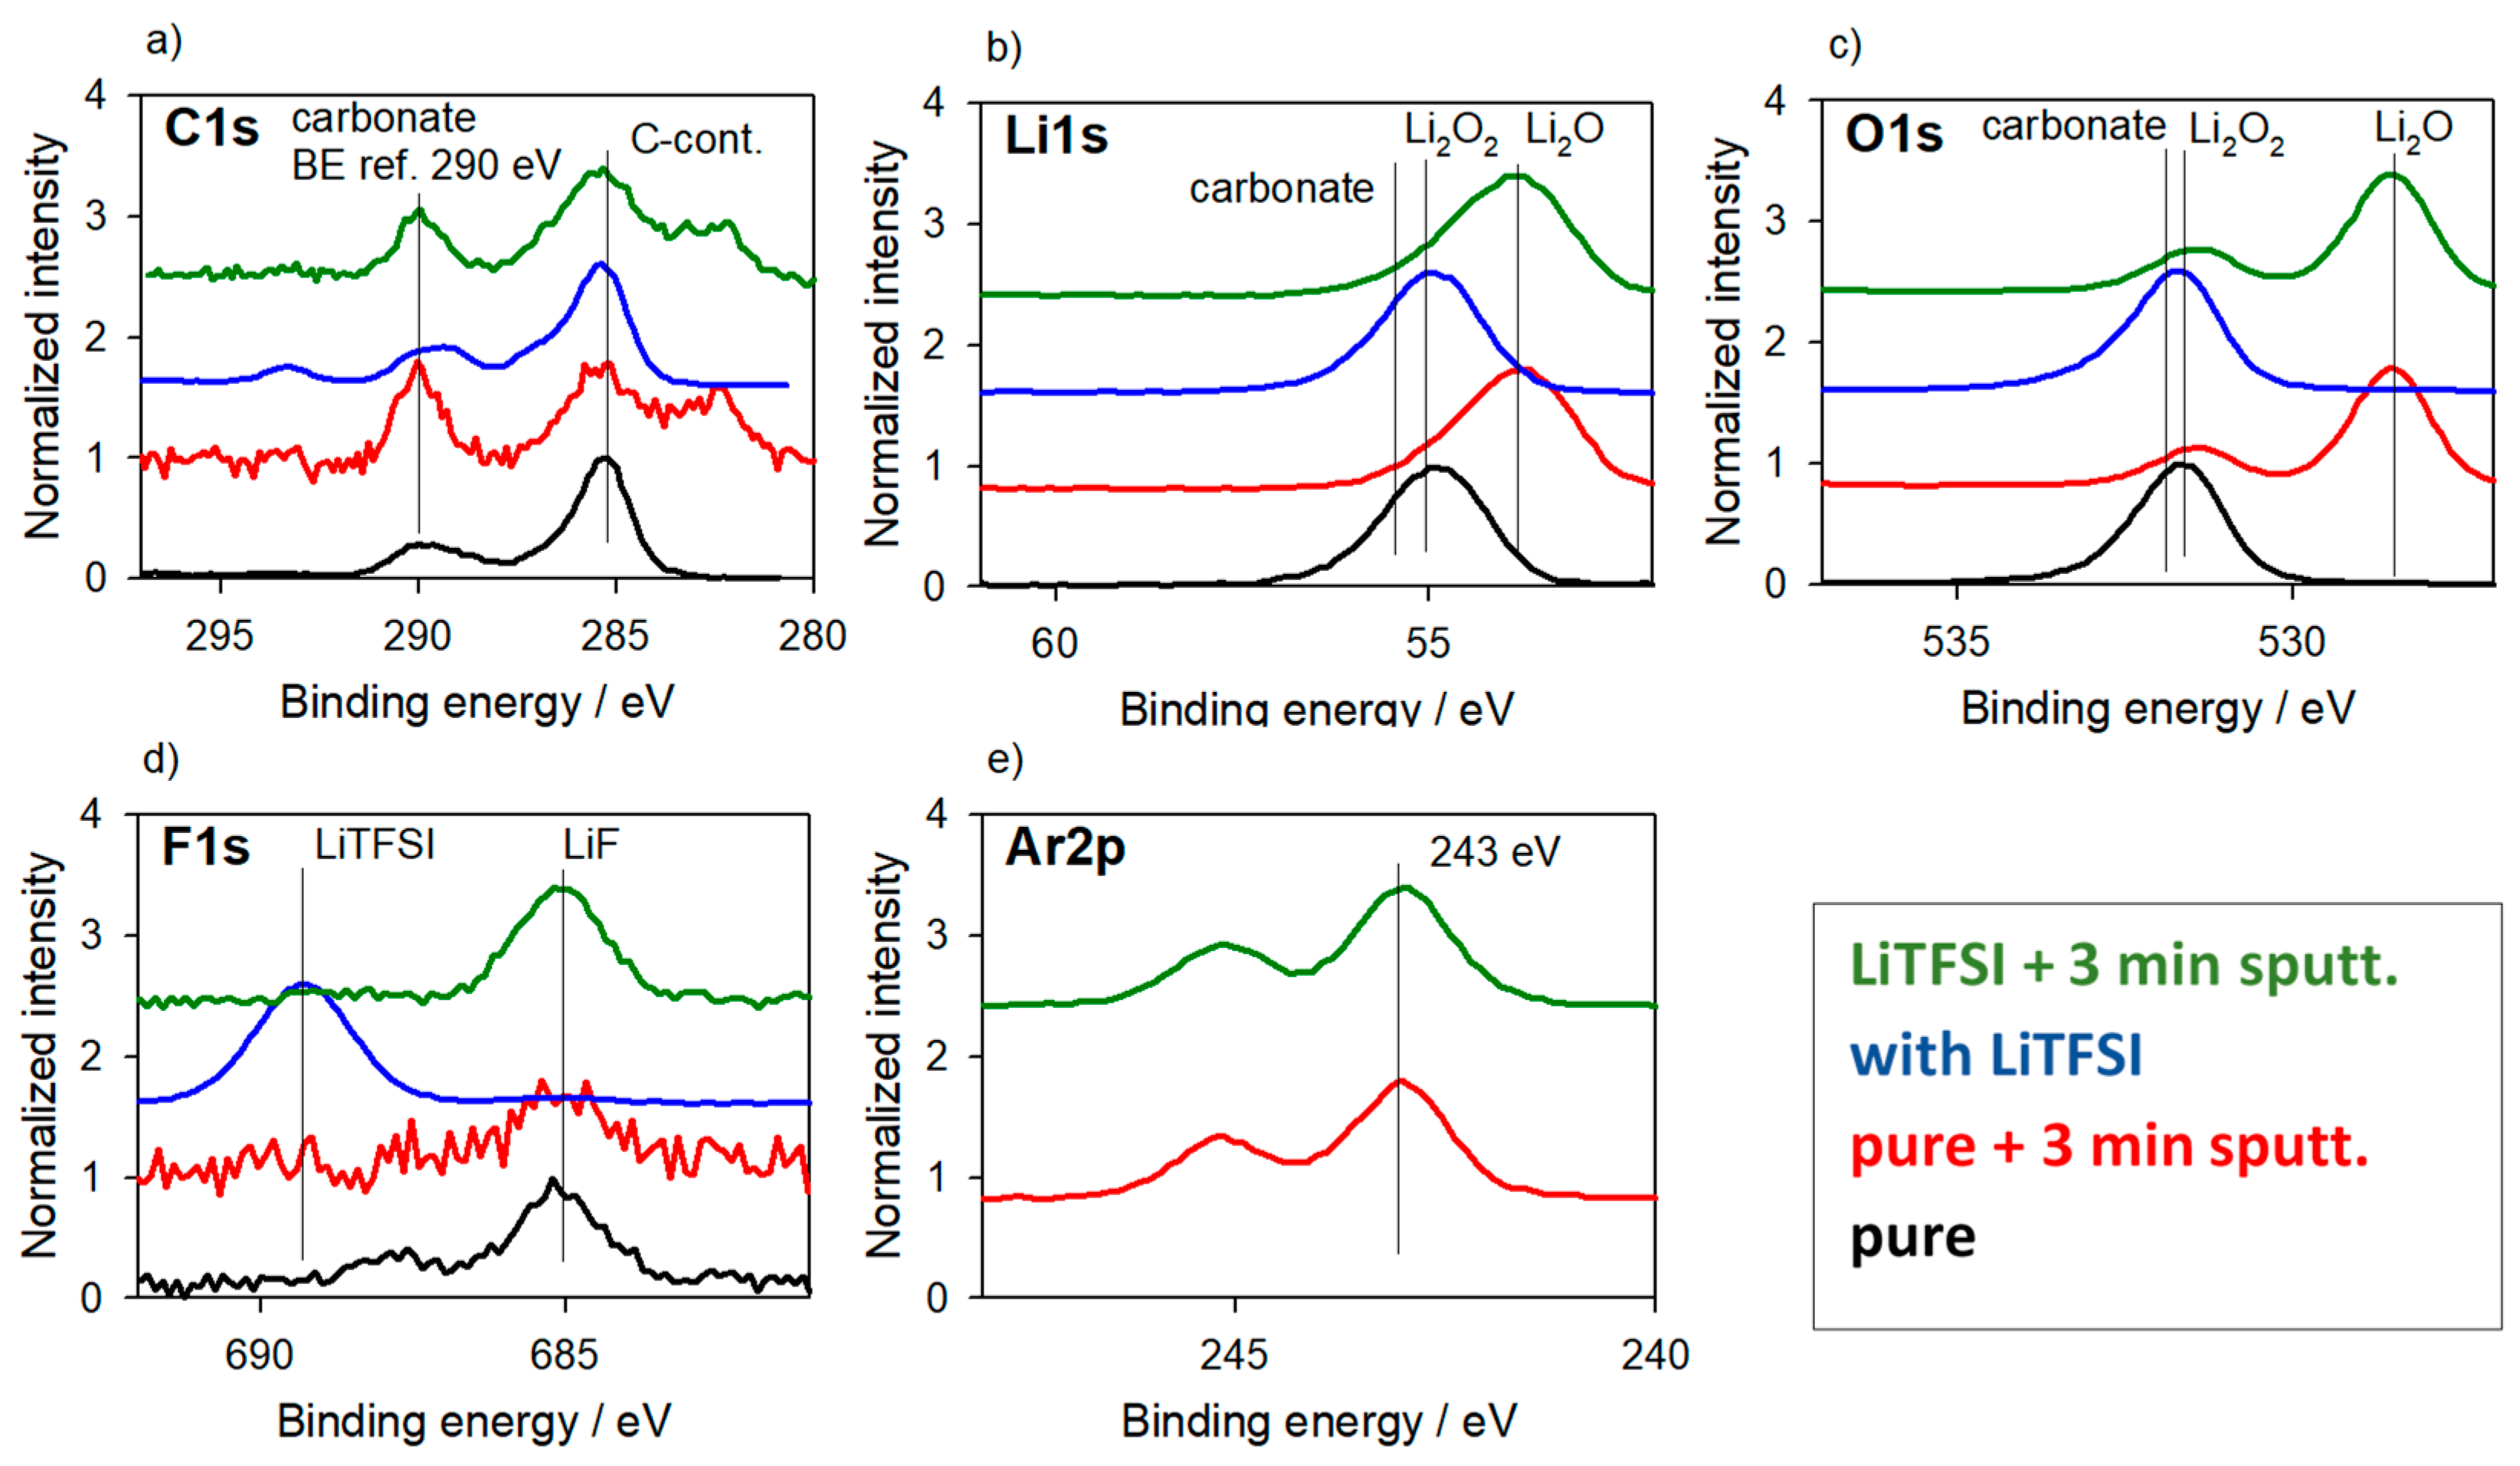
The identification of Li2O2 is of interest for investigations on Li air batteries since it is the reaction product during discharging and the educt for charging [49]. Figure 12 shows results for the Li2O2 powder without and after a 20 h treatment with an electrolyte containing LiTFSI as the conducting salt, which tested the stability of Li2O2 in the presence of LiTFSI. Similar investigations on Li2O2 were also performed in contact with other electrolytes [50]. Additionally, both untreated and treated powder samples were sputtered for 5 min reaching a depth of around 15 nm. BE correction by the carbonate C1s peak at 290 eV, as used for the example in Figure 11, was similarly applied here (Figure 12a) and gave a consistent result in referencing. However, performing the BE correction with respect to the C-H contamination peak is also possible here. As recognized from the F1s spectra (Figure 12d), LiTFSI is contaminating the surface and LiF is formed after sputtering, although no changes are observed in the Li1s and O1s spectra (Figure 12b,c). Sputtering as a possible cleaning option fails for Li2O2 due to its ion beam sensitivity and subsequent transformation into Li2O.
From the results presented here it can be concluded that the classical referencing strategy is suitable for such pure oxide powder materials. Both the C1s signals of the carbonate and the C-contamination (Figure 11a and Figure 12a) are in “handbook” BE positions and allow to follow suitable and correct results for the other elements. This holds also for the Ar2p position (Figure 11d and Figure 12e) and with some uncertainty for Au4f (Figure 11e). Unfortunately, this possibility may not be taken as a general issue or may even not be expected for XPS investigations on battery composite materials, as demonstrated in the previous sections.

4. Summary and Conclusions

It was shown that BE referencing of alkaline battery materials requires specific diligence, depending on the presence of alkaline metals and the specific surface response to additional charges. The peaks in the XP spectra, used as references for BE scale correction, have to be selected carefully. The use of the default C1s C(-H)-contamination peak at around 284.8 eV may cause significant errors on the derived binding energies and their chemical assignment. As most electrodes in application are multi-component systems consisting from mixtures of carbon powder, binder and other additives, differential charging due to composite heterogeneity can significantly influence the BE shifts. In such cases, peaks of other elements in the active material that have well-defined chemical states should be used to obtain accurate results.
Another challenge arises when the alkaline element is present in the analyzed surface region in its elemental, as-metallic state, as found e.g., in carbon-based or metal electrodes. In this case, additional BE shifts are detected which are not related to typical surface charging or changes in the chemical state. In our opinion, this effect is the result of an electrostatic interaction of the alkaline element in its metallic state with a polarizable surrounding. Knowing that, the state of intercalation of e.g., Li and Na has to be taken into account exceedingly, as the shift is dependent on the alkaline element concentration. To detect, estimate and prevent errors from this alkaline effect, the use of additional artificial reference elements is recommended. Non-oxidizing, (noble) metals, such as Au or Cu, are able to directly couple electrostatically to Li with no additional shifts. Other typical referencing elements such as implanted noble gas atoms as Ar from sputter-cleaning, show similar BE shifts as the reactive surface species (potential barrier). If this alkaline effect is not considered and corrected for data analysis, implausible energy values for the Li1s or Na1s peaks of the metal or the intercalated states will be reported. Any reliable conclusions about battery materials and their underlying working mechanisms can only be derived from XPS data after careful and appropriate referencing of the binding energies.

Supplementary Materials

The following are available online at https://www.mdpi.com/2313-0105/4/3/36/s1: More detailed information on the conditions of sample preparation and special treatments as well as some peak fit results.

Author Contributions

S.O., L.G., H.E. wrote and edited the main parts of the manuscript, F.T., M.Z., M.H. (Martin Hoffmann), T.J., M.H. (Markus Herklotz), K.N., F.S., M.K., D.M., L.G. and S.O. designed and conducted the experiments, analyzed data. All authors contributed to intense scientific discussions.

Acknowledgments

We are indebted to S. Kaschube for technical assistance. Part of the work is financed by: German Federal Ministry of Education and Research BMBF—Excellent battery: WING Center—BamoSa—Battery mobile in Saxony, grant no. 03X4637; German Federal Ministry of Economic Affairs and Energy BMWi within the joint collaborative project “Basta—Batteries stationary in Saxony”, grant no. 0325563; the European Union (European Regional Development Fund, ERDF) and the Free State of Saxony in the NaSBattSy project, SAB grant no. 100234960; and by the PAKT project “Nano-scaled structures for electrochemical energy storage in autonomous microsystems”, grant no. 49003301.

Conflicts of Interest

The authors declare no conflict of interest.

References

  1. Daniel, C.; Besenhard, J.O. (Eds.) Handbook of Battery Materials, 2nd ed.; Wiley-VCH: Weinheim, Germany, 2011; ISBN 978-3-527-32695-2. [Google Scholar]
  2. Yabuuchi, N.; Kubota, K.; Dahbi, M.; Komaba, S. Research development on sodium-ion batteries. Chem. Rev. 2014, 114, 11636–11682. [Google Scholar] [CrossRef] [PubMed]
  3. Verma, P.; Maire, P.; Novák, P. A review of the features and analyses of the solid electrolyte interphase in Li-ion batteries. Electrochim. Acta 2010, 55, 6332–6341. [Google Scholar] [CrossRef]
  4. Peled, E.; Menkin, S. Review—SEI: Past, present and future. J. Electrochem. Soc. 2017, 164, A1703–A1719. [Google Scholar] [CrossRef]
  5. Zhang, J.-G.; Xu, W.; Henderson, W.A. Lithium Metal Anodes and Rechargeable Lithium Metal Batteries; Springer: Cham, Switzerland, 2017; ISBN 978-3-319-44054-5. [Google Scholar]
  6. Sawicki, M.; Shaw, L.L. Advances and challenges of sodium ion batteries as post lithium ion batteries. RSC Adv. 2015, 5, 53129–53154. [Google Scholar] [CrossRef]
  7. Iermakova, D.I.; Dugas, R.; Palacín, M.R.; Ponrouch, A. On the comparative stability of Li and Na metal anode interfaces. J. Electrochem. Soc. 2015, 162, A706–A7066. [Google Scholar] [CrossRef]
  8. Malmgren, S.; Ciosek, K.; Hahlin, M.; Gustafsson, T.; Gorgoi, M.; Rensmo, H.; Edström, K. Comparing anode and cathode electrode/electrolyte interface composition and morphology using soft and hard X-ray photoelectron spectroscopy. Electrochim. Acta 2013, 97, 23–32. [Google Scholar] [CrossRef]
  9. Gauthier, M.; Carney, T.J.; Grimaud, A.; Giordano, L.; Pour, N.; Chang, H.-H.; Fenning, D.P.; Lux, S.F.; Paschos, O.; Bauer, C.; et al. Electrode-electrolyte interface in Li-ion batteries: Current understanding and new insights. J. Phys. Chem. Lett. 2015, 6, 4653–4672. [Google Scholar] [CrossRef] [PubMed]
  10. Li, W.; Dolocan, A.; Oh, P.; Celio, H.; Park, S.; Cho, J.; Manthiram, A. Dynamic behaviour of interphases and its implication on high-energy-density cathode materials in lithium-ion batteries. Nat. Commun. 2017, 8, 14589. [Google Scholar] [CrossRef] [PubMed] [Green Version]
  11. Krueger, S.; Kloepsch, R.; Li, J.; Nowak, S.; Passerini, S.; Winter, M. How do reactions at the anode/electrolyte interface determine the cathode performance in lithium-ion batteries? J. Electrochem. Soc. 2013, 160, A542–A548. [Google Scholar] [CrossRef]
  12. Edström, K.; Gustafsson, T.; Thomas, J.O. The cathode–electrolyte interface in the Li-ion battery. Electrochim. Acta 2004, 50, 397–403. [Google Scholar] [CrossRef]
  13. Dupré, N.; Cuisinier, M.; Martin, J.F.; Guyomard, D. Interphase evolution at two promising electrode materials for Li-ion batteries: LiFePO4 and LiNi1/2Mn1/2O2. Chem. Phys. Chem. 2014, 15, 1922–1938. [Google Scholar] [CrossRef] [PubMed]
  14. Eriksson, T.; Andersson, A.M.; Bishop, A.G.; Gejke, C.; Gustafsson, T.; Thomas, J.O. Surface analysis of LiMn2O4 electrodes. J. Electrochem. Soc. 2002, 149, A69–A78. [Google Scholar] [CrossRef]
  15. Balbuena, P.B.; Wang, Y. Lithium-Ion Batteries—Solid-Electrolyte Interphase; Imperial College: London, UK, 2004; ISBN 978-1-86094-362-1. [Google Scholar]
  16. Nakai, H.; Kubota, T.; Kita, A.; Kawashima, A. Investigation of the Solid Electrolyte Interphase Formed by Fluoroethylene Carbonate on Si Electrodes. J. Electrochem. Soc. 2011, 158, A798–A801. [Google Scholar] [CrossRef]
  17. Xiong, S.; Xie, K.; Diao, Y.; Hong, X. Properties of surface film on lithium anode with LiNO3 as lithium salt in electrolyte solution for lithium–sulfur batteries. Electrochim. Acta 2012, 83, 78–86. [Google Scholar] [CrossRef]
  18. Zhang, Q.; Xiao, X.; Zhou, W.; Cheng, Y.-T.; Verbrugge, M.W. Toward High Cycle Efficiency of Silicon-Based Negative Electrodes by Designing the Solid Electrolyte Interphase. Adv. Energy Mater. 2015, 5, 1401398. [Google Scholar] [CrossRef]
  19. Oswald, S. Binding energy referencing for XPS in alkali metal-based battery materials research (I): Basic model investigations. Appl. Surf. Sci. 2015, 351, 492–503. [Google Scholar] [CrossRef]
  20. Oswald, S.; Hoffmann, M.; Zier, M. Peak position differences observed during XPS sputter depth profiling of the SEI on lithiated and delithiated carbon-based anode material for Li-ion batteries. Appl. Surf. Sci. 2017, 401, 408–413. [Google Scholar] [CrossRef]
  21. Maibach, J.; Lindgren, F.; Eriksson, H.; Edström, K.; Hahlin, M. Electric Potential Gradient at the Buried Interface between Lithium-Ion Battery Electrodes and the SEI Observed Using Photoelectron Spectroscopy. J. Phys. Chem. Lett. 2016, 7, 1775–1780. [Google Scholar] [CrossRef] [PubMed]
  22. Moulder, J.F.; Stickle, W.F.; Sobol, P.E.; Bomben, K.D. Handbook of X-Ray Photoelectron Spectroscopy; Physical Electronics Inc.: Chanhassen, MN, USA, 1995; ISBN 978-0-96481-241-3. [Google Scholar]
  23. Lin, D.; Liu, Y.; Cui, Y. Reviving the lithium metal anode for high-energy batteries. Nat. Nanotechnol. 2017, 12, 194–206. [Google Scholar] [CrossRef]
  24. Cheng, X.-B.; Zhang, R.; Zhao, C.-Z.; Zhang, Q. Toward safe lithium metal anode in rechargeable batteries: A review. Chem. Rev. 2017, 117, 10403–10473. [Google Scholar] [CrossRef] [PubMed]
  25. Zhang, K.; Lee, G.-H.; Park, M.; Li, W.; Kang, Y.-M. Recent Developments of the Lithium Metal Anode for Rechargeable Non-Aqueous Batteries. Adv. Energy Mater. 2016, 6, 1600811. [Google Scholar] [CrossRef]
  26. Manthiram, A.; Fu, Y.; Chung, S.-H.; Zu, C.; Su, Y.-S. Rechargeable lithium-sulfur batteries. Chem. Rev. 2014, 114, 11751–11787. [Google Scholar] [CrossRef] [PubMed]
  27. Rosenman, A.; Markevich, E.; Salitra, G.; Aurbach, D.; Garsuch, A.; Chesneau, F.F. Review on Li-sulfur battery systems: An integral perspective. Adv. Energy Mater. 2015, 5, 1500212. [Google Scholar] [CrossRef]
  28. Bozzola, J.J.; Russell, L.D. Electron Microscopy: Principles and Techniques for Biologists, 2nd ed.; Jones & Bartlett Learning: Sudbury, MA, USA, 1998; ISBN 978-0-76370-192-5. [Google Scholar]
  29. Zier, M.; Scheiba, F.; Oswald, S.; Thomas, J.; Goers, D.; Scherer, T.; Klose, M.; Ehrenberg, H.; Eckert, J. Lithium dendrite and solid electrolyte interphase investigation using OsO4. J. Power Sources 2004, 266, 198–207. [Google Scholar] [CrossRef]
  30. Li, C.; Leong, W.K.; Zhong, Z. Metallic osmium and ruthenium nanoparticles for CO oxidation. J. Organomet. Chem. 2009, 694, 2315–2318. [Google Scholar] [CrossRef]
  31. Verma, P.; Novák, P. Formation of artificial solid electrolyte interphase by grafting for improving Li-ion intercalation and preventing exfoliation of graphite. Carbon 2012, 50, 2599–2614. [Google Scholar] [CrossRef]
  32. Moriwake, H.; Kuwabara, A.; Fisher, C.A.J.; Ikuhara, Y. Why is sodium-intercalated graphite unstable? RSC Adv. 2017, 7, 36550–36554. [Google Scholar] [CrossRef] [Green Version]
  33. Jache, B.; Adelhelm, P. Use of graphite as a highly reversible electrode with superior cycle life for sodium-ion batteries by making use of co-intercalation phenomena. Angew. Chem. Int. Ed. 2014, 53, 10169–10173. [Google Scholar] [CrossRef] [PubMed]
  34. Kim, H.; Hong, J.; Yoon, G.; Kim, H.; Park, K.-Y.; Park, M.-S.; Yoon, W.-S.; Kang, K. Sodium intercalation chemistry in graphite. Energy Environ. Sci. 2015, 8, 2963–2969. [Google Scholar] [CrossRef]
  35. Irisarri, E.; Ponrouch, A.; Palacín, M.R. Review—Hard carbon negative electrode materials for sodium-ion batteries. J. Electrochem. Soc. 2015, 162, A2476–A2482. [Google Scholar] [CrossRef]
  36. Dahn, J.R.; Zheng, T.; Liu, Y.; Xue, J.S. Mechanisms of lithium insertion in carbonaceous materials. Science 1995, 270, 590–593. [Google Scholar] [CrossRef]
  37. German, F.; Hintennach, A.; LaCroix, A.; Thiemig, D.; Oswald, S.; Scheiba, F.; Hoffmann, M.J.; Ehrenberg, H. Influence of temperature and upper cut-off voltage on the formation of lithium-ion cells. J. Power Sources 2014, 264, 100–107. [Google Scholar] [CrossRef]
  38. Kohl, M. Neue Materialien und Konzepte für Lithium- und Natrium-Schwefel Batterien. Ph.D. Thesis, TU Dresden, Dresden, Germany, 2018. submitted. [Google Scholar]
  39. Lukaszewicz, J.P. X-ray photoelectron spectroscopy studies of sodium modified carbon films suitable for use in humidity sensors. J. Mater. Sci. 1997, 32, 6063–6068. [Google Scholar] [CrossRef]
  40. Oswald, S.; Nikolowski, K.; Ehrenberg, H. Quasi in situ XPS investigations on intercalation mechanisms in Li-ion battery materials. Anal. Bioanal. Chem. 2009, 393, 1871–1877. [Google Scholar] [CrossRef] [PubMed]
  41. Oswald, S.; Nikolowski, K.; Ehrenberg, H. XPS investigations of valence changes during cycling of LiCrMnO4-based cathodes in Li-ion batteries. Surf. Interface Anal. 2010, 42, 916–921. [Google Scholar] [CrossRef]
  42. Ensling, D.; Thissen, A.; Gassenbauer, Y.; Klein, A.; Jaegermann, W. In-situ preparation and analysis of functional oxides. Adv. Eng. Mater. 2005, 7, 945–949. [Google Scholar] [CrossRef]
  43. Verdier, S.; El Ouatani, L.; Dedryvère, R.; Bonhomme, F.; Biensan, P.; Gonbeau, D. XPS Study on Al2O3- and AlPO4-coated LiCoO2 cathode material for high-capacity Li ion batteries. J. Electrochem. Soc. 2007, 154, A1088–A1099. [Google Scholar] [CrossRef]
  44. Thoss, F.; Giebeler, L.; Oswald, S.; Ehrenberg, H.; Eckert, J. Study on the reversible Li-insertion of amorphous and partially crystalline Al86Ni8La6 and Al86Ni8Y6 alloys as anode materials for Li-ion batteries. Electrochim. Acta 2012, 60, 85–94. [Google Scholar] [CrossRef]
  45. Chumak, I.; Dmytriv, G.; Pavlyuk, V.; Oswald, S.; Eckert, J.; Trill, H.; Eckert, H.; Pauly, H.; Ehrenberg, H. Li(Al1-zZnz) alloys as anode materials for rechargeable Li-ion batteries. J. Mater. Res. 2010, 25, 1492–1499. [Google Scholar] [CrossRef]
  46. Thoss, F. Amorphe, Al-basierte Anodenmaterialien für Li-Ionen-Batterien. Ph.D. Thesis, TU Dresden, Dresden, Germany, 2013. [Google Scholar]
  47. Thoss, F.; Giebeler, L.; Thomas, J.; Oswald, S.; Potzger, K.; Reuther, H.; Ehrenberg, H.; Eckert, J. Amorphous Li-Al-based compounds: A novel approach for designing high performance electrode materials for Li-Ion batteries. Inorganics 2013, 1, 14–31. [Google Scholar] [CrossRef]
  48. Herklotz, M.; Scheiba, F.; Glaum, R.; Mosymow, E.; Oswald, S.; Eckert, J.; Ehrenberg, H. Electrochemical oxidation of trivalent chromium in a phosphate matrix: Li3Cr2(PO4)3 as cathode material for lithium ion batteries. Electrochim. Acta 2014, 139, 356–364. [Google Scholar] [CrossRef]
  49. Yamamoto, O. Introduction. In The Lithium Air Battery: Fundamentals; Imanishi, N., Luntz, A.C., Bruce, P.G., Eds.; Springer Science + Business Media: New York, NY, USA, 2014; pp. 1–22. ISBN 978-1-4899-8061-8. [Google Scholar]
  50. Oswald, S.; Mikhailova, D.; Scheiba, F.; Reichel, P.; Fiedler, A.; Ehrenberg, H. XPS investigations of electrolyte/electrode interactions for various Li-ion battery materials. Anal. Bioanal. Chem. 2011, 400, 691–696. [Google Scholar] [CrossRef] [PubMed]
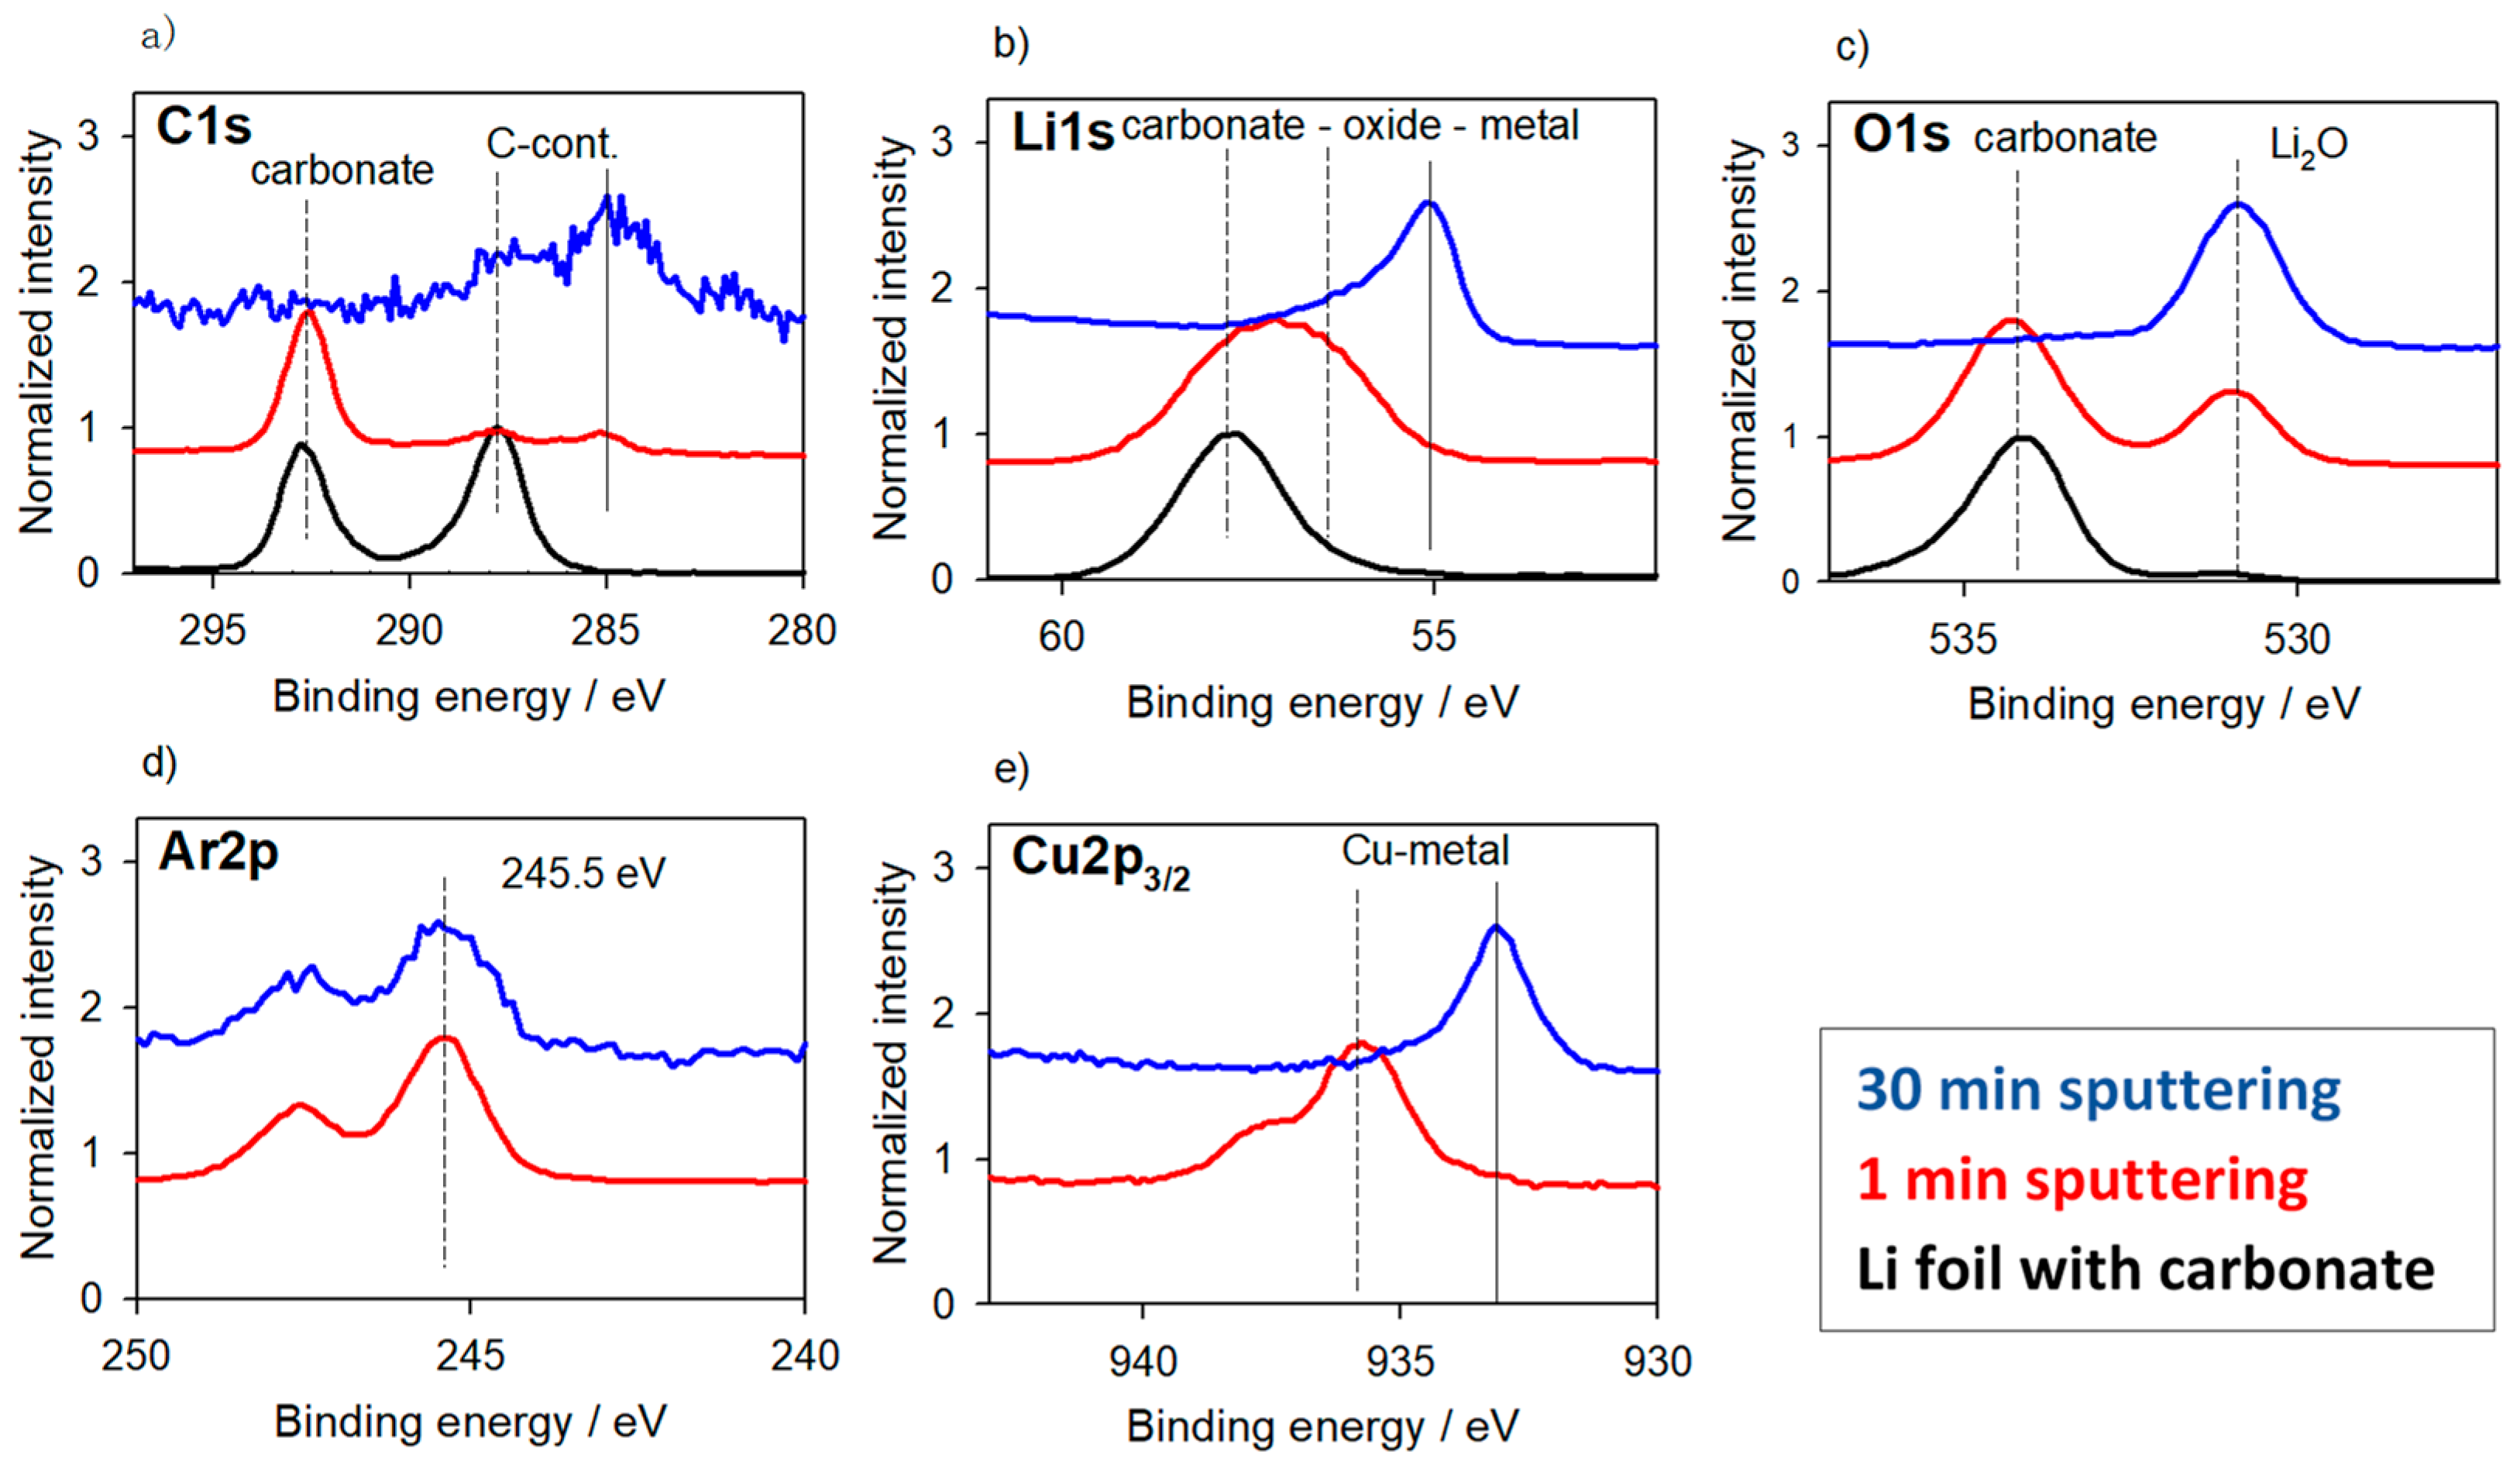
Figure 1. XP spectra normalized in intensity of a native Li foil from the glove box and after short and long-time sputtering (bottom to top). No charging is observed. Cu metal is deposited as additional reference material. The foil is covered with Li-carbonate. All characteristic spectra are shifted to high binding energy (BE). Only after long time sputtering Li is found in metal position (Li1s 55 eV) and Cu (Cu2p3/2 933 eV); Ar2p remains in high BE position (245.5 eV). As in all following figures, too, the solid vertical lines mark peak positions in agreement with the conventional C-H-referencing; dashed vertical lines mark the positions shifted by the “alkaline effect” to higher BEs. (a) C1s; (b) Li1s; (c) O1s; (d) Ar2p; (e) Cu2p3/2 transition.
Batteries 04 00036 g001
Figure 2. XP spectra normalized in intensity of a Li foil used as anode in a Li-sulfur cell: after electrochemical cycling, shortly sputtered (with Au reference) and long-time (50 nm) sputter cleaned (bottom to top). No charging; no charge compensation. All the characteristic peaks of the surface compounds (carbonate, fluoride, sulfate, a.o.) are shifted 2–3 eV towards higher BE; Ar2p is also at high BE of 245.5 eV. Au4f is from the beginning mainly in its metal position lower 85 eV. After long-time sputtering the surface is dominated by Li-metal and Li-oxide, however, also with the high oxide BE position always observed on top of Li-metal. (a) C1s; (b) Li1s; (c) O1s; (d) S2p; (e) Ar2p; (f) Au4f transition.
Batteries 04 00036 g002
Figure 3. XP spectra normalized in intensity of a Li foil treated with OsO4 vapor before and after 10 min sputter cleaning (bottom to top). No charging; no charge compensation. Interpretation is disturbed because C1s and Li1s peaks are overlaid with Os4d and Os4f, resp. Osmium is found as an oxide at the surface and mainly as metal after sputtering (see fit in Figure 3b). All characteristic peaks are shifted by around 2 eV to higher BE; Ar2p is also at high BE of 244.5 eV. (a) C1s/Os4d; (b) Li1s; (c) O1s; (d) Os4p3/2; (e) Ar2p transition.
Batteries 04 00036 g003
Figure 4. XP spectra normalized in intensity of graphite-based anode material; as prepared, with SEI formed during charging (lithiation) at room temperature and 45 °C (bottom to top). Here, no charging was observed and no BE correction was necessary. After charging (lithiation) all characteristic peaks are shifted around 2–3 eV with respect to the standard C1s (284.8 eV) BE calibration. At higher temperature a higher amount of Li-fluoride is observed. (a) C1s; (b) Li1s; (c) O1s; (d) F1s transition.
Batteries 04 00036 g004
Figure 5. XP spectra normalized in intensity for a hard carbon sample electrochemically infiltrated with Na after 0, 2 and 60 min sputter cleaning (bottom to top). No charging; no charge compensation. At the beginning C1s for carbonate and C-H contamination is at high BE (288 eV/292 eV); in large depth the C position for hard carbon is reached (284.4 eV). Ar2p is always situated at a remarkably high BE of 245.5 eV. (a) C1s; (b) Na1s; (c) O1s; (d) Ar2p transition.
Batteries 04 00036 g005
Figure 6. XP spectra normalized in intensity of pure LiCrMnO4 powder measured without and with neutralizer, and cathode mix (LiCrMnO4, carbon black, binder) without and with contact to electrolyte (bottom to top). Here no charging was observed and no BE correction was necessary. C1s shows the peak shift between contamination and carbon black. Cr is found in the mixed state Cr3+/4+ and reacts with binder and electrolyte; Mn is not taking part in reaction. (a) C1s; (b) Li1s; (c) Cr2p; (d) Mn2p transition.
Batteries 04 00036 g006
Figure 7. XP spectra normalized in intensity of an Al-foil and melt-processed LiAl- and LiAlZn-material after intense sputter cleaning (bottom to top). BE was calibrated with Al2p (72.8 eV—metal). Whereas the Au4f metal peak of the Au sputter reference remains unchanged (around 85 eV), the Ar2p peak from implanted Ar is clearly shifted for the Li containing samples to high BE. Li1s is mainly found at its metallic position (55 eV). (a) C1s; (b) Li1s; (c) O1s; (d) Al2p; (e) Zn2p3/2; (f) Ar2p; (g) Au4f transition.
Batteries 04 00036 g007
Figure 8. XP spectra normalized in intensity of AlYNi-based amorphous ribbons: as prepared (shortly sputter cleaned), after electrochemical lithiation without and with sputter cleaning (bottom to top). BE calibration was done as for Figure 7 with Al2p (72.8 eV—metal). No intercalation but only plating of Li(O)F is observed. Ni is at fewest and Y at most oxidized. All peaks are in the positions expected for standard C1s BE calibration, too. Ar2p also at low BE position (242.5 eV—measured separately with lower energy resolution). (a) C1s; (b) Li1s; (c) O1s; (d) Al2p; (e) Ni2p3/2; (f) Y3d; (g) Ar2p transition.
Batteries 04 00036 g008
Figure 9. XP spectra normalized in intensity of AlYNi-based powder material: doped with Li and mixed with carbon black, only doped with with Li, undoped powder mixed with carbon black, undoped pure powder (bottom to top). BE calibration was done with Al2p (72.8 eV—metal, than 75.3 eV oxide). C1s is obviously not suitable for BE calibration. In the Li containing samples Al, Y and the residuals of Ni are like oxide. These states are covered with a mixture of Li-oxide and Li-carbonate. Without Li all the Ni and parts of Al and Y are still (partly) metallic. (a) C1s; (b) Li1s; (c) O1s; (d) Al2p; (e) Ni2p3/2; (f) Y3d transition.
Batteries 04 00036 g009
Figure 10. XP spectra normalized in intensity of pure Li3Cr2(PO4)3 active material and as cathode mix (Li3Cr2(PO4)3, carbon black, binder) and charged (delithiated) up to 4.85 and 5.2 V (bottom to top). C1s from contamination was utilized for BE correction (284.8 eV) for the pure Li3Cr2(PO4)3 material; afterwards the P2p peak was used for a second calibration at the resulting BE of 133.2 eV. C1s mainly from carbon black cannot be used as reference because of differential charging. For the Cr peak a change to the higher valence state Cr4+ is observed at delithiation. (a) C1s; (b) Li1s; (c) Cr2p; (d) P2p transition
Batteries 04 00036 g010
Figure 11. XP spectra normalized in intensity of pure and shortly sputtered powders of Li2O, Li2O2 and Li2CO3 (bottom to top) normalized in BE to carbonate C1s at 290 eV. Ar2p and Au4f are found at standard low energies (242.5 and 84 eV). (a) C1s; (b) Li1s; (c) O1s; (d) Ar2p; (e) Au4f; (f) O2s transition.
Batteries 04 00036 g011
Figure 12. XP spectra normalized in intensity of pure and 20 h LiTFSI treated Li2O2 powder without and with long-time sputter cleaning (bottom to top). Similar to Figure 11 the BE was corrected to carbonate residuals for C1s at 290 eV. A decomposition of Li2O2 to Li2O is observed. (a) C1s; (b) Li1s; (c) O1s; (d) F1s; (e) Ar2p transition.
Batteries 04 00036 g012