Article

Degradation of a Lithium-Ion Battery Cell for Enhanced First and Second Life: Effects of Temperature, Orientation, C-Rate and State of Charge


1
Department of Energy and Process Engineering, Norwegian University of Science and Technology, 7491 Trondheim, Norway
2
Department of Materials, University of Oxford, Oxford OX1 3PH, UK
3
Department of Engineering Science, University of Oxford, Oxford OX1 3PJ, UK
4
Institute for Energy Technology, 2027 Kjeller, Norway
5
Norwegian Defence Research Establishment (FFI), 2027 Kjeller, Norway
*
Author to whom correspondence should be addressed.
Batteries 2026, 12(4), 121; https://doi.org/10.3390/batteries12040121
Submission received: 19 February 2026 / Revised: 18 March 2026 / Accepted: 26 March 2026 / Published: 30 March 2026
(This article belongs to the Special Issue Thermal Management System for Lithium-Ion Batteries: 2nd Edition)

Abstract

Lithium-ion batteries (LIBs) can considerably improve their lifespan by optimising operating conditions. This may entail ensuring optimal operating temperature, limiting the state-of-charge (SoC) window, reducing cycling current, and changing the physical orientation of the uncompressed LIB cell. In this study, we examine how these four conditions and some of their combinations impact degradation in both 1st life as well as in second life. The cell analysed in this investigation was the Xalt 31 HE cell, an energy-optimised Li-ion pouch cell with a capacity of 31 Ah and an NMC433-graphite chemistry. As a follow-up study of previously reported results, a total of 18 cells were investigated. We report results focusing on improving cycle life and ensuring safety before second life. The optimal conditions for first-life cycling in the full SoC window were found at room temperature, when cycled with a lower current and the cells oriented horizontally. We observed that under the same cycling conditions, a vertical alignment of cells resulted in an increased degradation rate compared to horizontal alignment. The best second-life capacity retention was found for cells initially cycled at room temperature, then later cycled with a reduced SoC window, at a lower current and in a horizontal orientation. If the cells were cycled at an elevated temperature in first life, the second-life compatibility was reduced considerably. An incremental capacity analysis (ICA) of the first-life ageing data revealed a possible indicator for ensuring safety and cycleability into second-life use.

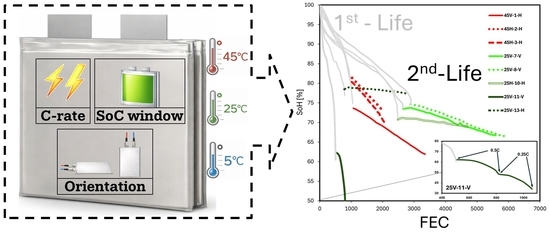
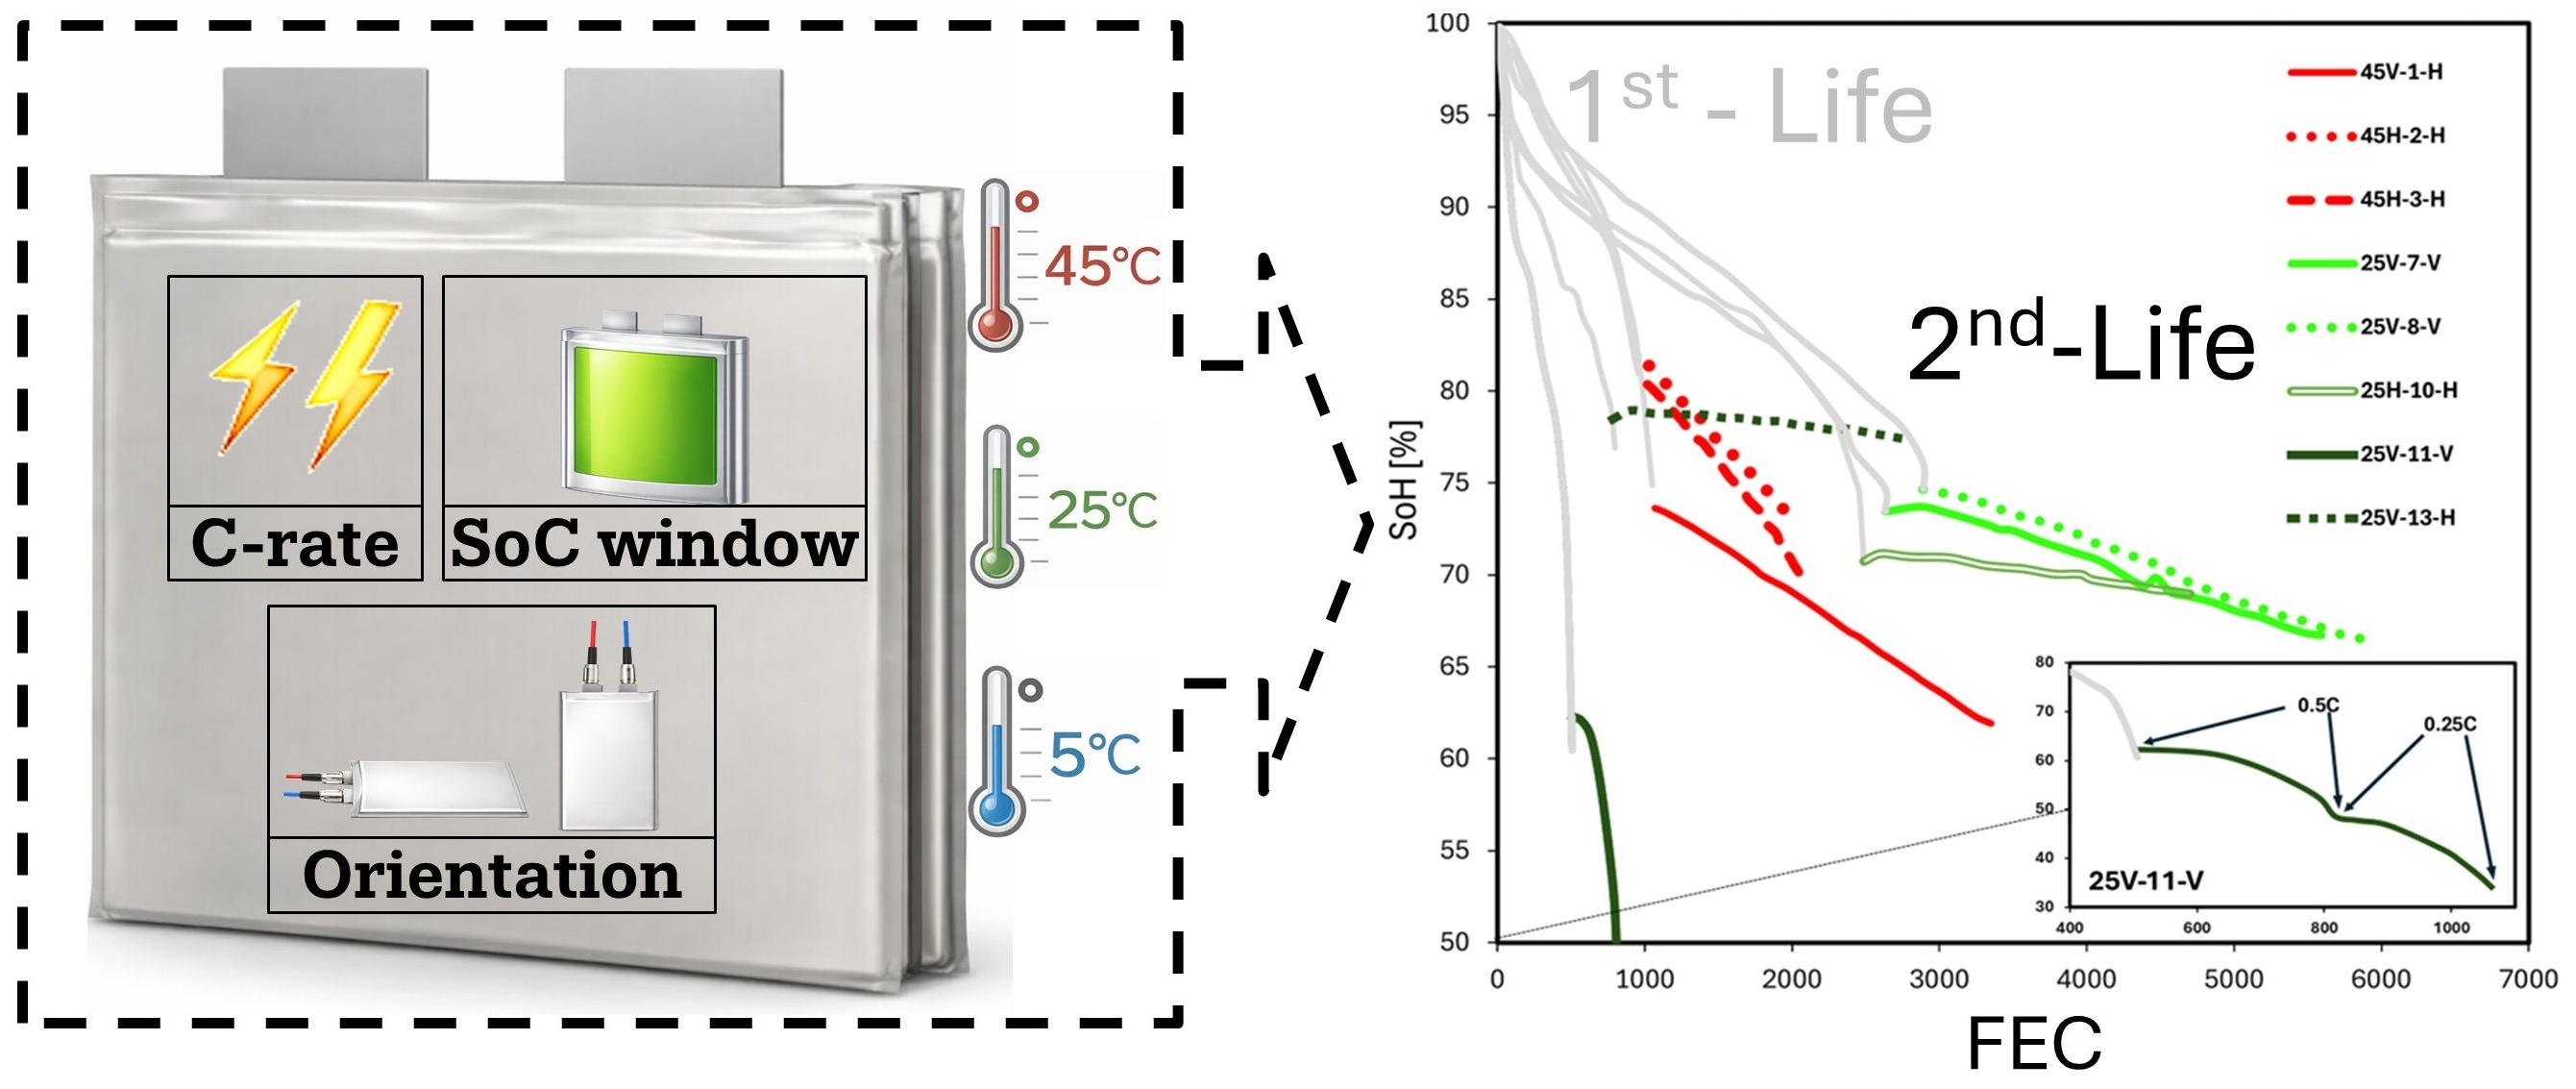
Graphical Abstract

1. Introduction

The demand for lithium-ion batteries (LIBs) has been increasing significantly, driven by the global transition towards more sustainable energy systems. As an example, the International Energy Agency (IEA) reported that the total volume of batteries reached over 2000 gigawatt-hours (GWh) in 2023, four times the amount reported in 2020 [1]. Out of this, electric vehicles (EVs) are expected to demand a significant share of LIBs, and their sustained rapid growth is projected to exceed forecasts for 2030 [1]. The increasing demand for and utilisation of EVs will lead to the availability of retired batteries with terawatt-hour (TWh) capacities in the coming decades. These batteries will no longer meet the performance criteria required within most EV applications, as their output will have declined to below 80% of their nominal capacity [2,3]. However, these batteries can potentially still serve sectors other than the EV sector, for example within the Battery Energy Storage System (BESS) sector. When considering the repurposing of batteries, it is essential to improve understanding of both lifetime expectancy and safety.
For LIBs, there are several traditional safety aspects readily studied (e.g., material-related fire hazards and environmental and operational aspects [3,4,5,6]). Batteries taken out of service in their original applications can have their life extended by being put into service within other less-demanding applications (second life), thereby providing a potential solution for environmental, economic, and sustainability issues [3,6,7,8,9,10,11,12,13,14,15,16]. From these examples, the environmentally benign effects are unequivocal. They further indicate that the transition toward a renewable-energy-based society must deepen in order to achieve substantial economic profitability. Moreover, they highlight the need for additional experimental data concerning degradation mechanisms associated with second-life applications. To determine a battery’s potential second-life applicability, the evaluation of the battery’s performance and safety is essential. A state-of-health (SoH) threshold of 80% is commonly cited as the criterion marking the end of first-life applications [14,17,18]. While this holds for some segments, many daily examples have shown other user practices where, for example, cars and consumer electronics are used up to a point where operation is no longer feasible. Despite this, some studies do target measurement campaigns for second life. Martinez-Laserna et al. reported on the degradation of 20 Ah NMC-carbon cells and degradation under both first- and second-life conditions. Their study includes different temperatures above 25 °C, currents ranging 0.5–2 C, and first-life capacity ending above 90% capacity [19]. Wang et al. studied 5.2 Ah LFP-graphite cylindrical cells at different SOC windows at 25 °C [20]. Timke et al. cycled 5 Ah NMC(622)-graphite pouch cells at 20 °C for the purpose of second-life application [21]. Beyond this, several recent reviews target the use of batteries in light of technical and economic feasibility [22,23,24,25,26,27,28], and most recently Nazim and Elavarasan published a review with special attention around machine learning and predicting the second-life use of batteries [29]. As such, experimental battery degradation studies targetting second-life use and degradation of larger cell sizes, as well as colder temperatures, are required.
In terms of batteries, degradation is the loss of capacity as a battery ages. Batteries can degrade or age both at rest (calendar ageing) and during cycling (cyclic ageing) [30,31,32,33]. One of the most common ways to describe battery degradation is to track the evolution of the battery’s state of health (SoH) as a function of time or the summarized capacity a battery has delivered (normalized cycles) [34]. The SoH is typically defined as the remaining capacity (Ah) relative to the initial capacity of a pristine battery at a given temperature and cycling rate (e.g., 0.05 C). Note that the SoH can be reported relative to the cell’s rated (nominal) capacity or its measured initial capacity. Typical factors influencing cyclic ageing are the deployed cycling rates and temperature. The rate deployed is most commonly reported as the C-rate, which corresponds to current divided by the nominal cell capacity or the change in SOC divided by time in hours, (e.g., a current giving a discharge time of 20 h between 100 and 0%SOC would correspond to a C-rate of C/20 or 0.05 C) [35]. Another factor that is of importance for cyclic ageing is the upper and lower state-of-charge (SoC) limits. When a battery cell is cycled within a limited SoC window, it effectively goes through partial cycles. As such, cyclic degradation studies typically report SoH versus full equivalent cycles (FEC), sometimes also referred to as equivalent full cycles (EFC). As an example, if a cell is cycled within a SoC window of 25–75%, this equates to 0.5 FEC. In reporting degradation, performance loss can also be examined using other electrochemical methods, such as self-discharge, impedance rise, differential voltage analysis (DVA), incremental capacity analysis (ICA), voltage change, and capacity fade [36,37,38,39,40,41].
In an LIB, many internal reactions within the battery can lead to performance loss and thereby loss in (available) capacity [34]. Moreover, depending on storage conditions and operational patterns, different parasitic reactions occur that can contribute separately or in combination with its degradation. However, identifying and analysing the individual prevalent degradation mechanisms is challenging due to their highly complex dependencies on not only the specific battery chemistry (including not only active materials but also additives, electrolyte composition, and impurities), electrode (e.g., thicknesses, porosity, tortuosity) and cell designs [38] but also the operational conditions like temperature, heat management systems, cell pretension, SoC window, and C-rate.
A degradation mode represents changes to a battery’s capacity based on degradation mechanisms causing similar changes to measurable quantities in the battery [42]. This can be illustrated by the two very different degradation mechanisms: SEI growth and Li-metal plating. Both mechanisms cause a loss of cycleable lithium deposited on the anode and are both represented by the degradation mode called loss of lithium inventory (LLI). The other two degradation modes are conductivity loss (CL) and loss of active material (LAM) [38,43,44].
Research indicates that most temperature-related effects are linked to the chemical reactions occurring within the batteries, following the relationship described by the Arrhenius equation [45,46]. Furthermore, temperature significantly affects the materials used in batteries and the ionic conductivities of both the electrodes and electrolytes [47].
At low operating temperatures, the viscosity of the electrolyte increases, resulting in reduced ionic conductivity and higher internal resistance due to increased impedance of ion movement [47]. Advances in additives and electrolytes with low freezing points have been explored to mitigate these effects [48,49,50]. Additional challenges in low-temperature operation include higher charge-transfer resistance at the electrode–electrolyte interface and slower lithium-ion diffusion within the electrodes [51,52]. Lithium plating can occur at low temperatures, where metallic lithium deposits on the anode surface. This process leads to a significant loss of active lithium, resulting in capacity fade. Additionally, plating is associated with an increased risk of internal short circuits, thereby raising safety concerns [53,54]. At elevated temperatures, chemical and structural changes within the battery accelerate, resulting in higher degradation rates. Enhanced growth of the solid electrolyte interphase (SEI) at the anode primarily contributes to loss of lithium inventory (LLI). At the same time, changes in the structure and morphology of the active material result in loss of active material (LAM). Together, LLI and LAM increase internal resistance and reduce battery capacity [55]. Additionally, electrolyte decomposition can lead to gas release and battery volume expansion [56].
Several methodologies have been deployed in the literature to identify and quantify various degradation modes for batteries operated under different conditions. Sun et al. [57] conducted a quantitative study on degradation modes at 25 °C and 45 °C, and analysed the effects of charging current rates using electrochemical impedance spectroscopy (EIS). As ageing progressed, they identified three degradation modes, with LLI and LAM being more pronounced than CL at elevated temperatures. LLI was attributed to SEI growth on the anode, while LAM was attributed to mechanical stress from cycling across a wide SoC range. CL was influenced by the interfacial processes at the current-collector–electrolyte interface. However, charging current within the tested range (0.5 C–1 C) did not significantly affect these modes. More specifically, no differences in LLI were observed, as the applied currents were insufficient to accelerate electrolyte reduction reactions responsible for SEI growth. A study by Alcaide et al. [55] investigated the degradation of commercial cylindrical graphite-SiOx/NCA cells subjected to different cycling temperatures of 10 °C, 25 °C and 45 °C. The lowest degradation rate was observed for cells cycled at 25 °C. LAM and an increase in cell resistance were factors attributed to degradation at 45 °C, and lithium plating was observed to be accelerated at 10 °C.
Zhu et al. [58] analysed the degradation mechanisms of 18650-type cells comprised of 42 wt.% NMC and 58 wt% NCA as cathode and graphite as anode. Using AC impedance and differential voltage analysis (dV/dQ) under various operating conditions, they identified LLI and loss of active cathode material as the dominant factors of battery degradation. Additionally, varying degradation rates were observed at 0 °C and 25 °C. Wittman et al. [59] reported that LLI was the dominant degradation mode for both NMC and NCA chemistries. In the NMC cell, lithium plating occurred at 15 °C, transitioning to SEI growth at 35 °C, along with significant LAM on the cathode. The NMC cells exhibited a stronger temperature dependence compared to NCA in their cyclic ageing and material degradation.
As summarised so far, advancements in research consist of extensive investigation of the degradation mechanisms of LIBs using advanced electrochemical and material characterisation techniques under specific operating conditions. This study broadens the scope to examine how first-life operating conditions, particularly temperature dependency, affect the batteries’ performance during second-life usage. The batteries were experimentally analysed under various cycling conditions, and the resulting data were compared to identify the optimal conditions for their second-life operation. This work studies degradation modes and evaluates their impact on battery performance and safety. Results from incremental capacity analysis (ICA) and complementary diagnostic techniques offer valuable insights into the viability and limitations of LIBs for extended second-life applications, particularly under temperature-dependent conditions. Moreover, this paper presents post-mortem studies, including SEM (Scanning Electron Microscopy) inspections supported by material ARC (accelerated rate calorimetry) testing, XCT (X-ray Computer aided Tomography) and FIB (Focused Ion Beam), EDX/EDS (Energy Dispersive X-ray Spectroscopy) and SIMS (Secondary Ion Mass Spectroscopy).

2. Experimental

This section gives the experimental and methodological procedures for the applied investigation of first-life, second-life, and post-mortem studies.

2.1. Cell and Testing Infrastructure

The cell used in this study was the XALT 31 HE pouch cell, with a nominal capacity of 31 Ah and a specific energy of 160 Wh/kg. The cell’s active electrode materials were NMC433 on the cathode (16 double-sided and 2 single-sided electrode sheets) and graphite on the anode (17 double-sided electrode sheets). These LIB cells were purchased in 2015 and were classified as an energy optimised cell at the time. Results from this cell have previously been published [60,61,62,63].
A total of 18 cells were used in this study. Fourteen of these cells were cycled as part of a large cycle life study in the period from 2015 to 2017 and later stored at 50% SoC and ∼5 °C until used in the second-life cycling from 2016, 2019 or 2022. The remaining 4 cells were “pristine”, meaning they had been stored at a low temperature (∼5 °C) and never been charged or discharged until used in 2022. Table 1 offers detailed information about the cycling conditions applied during the cells first- and second-life cycling and when they were tested. The cells are labelled with specific identifiers, indicating each cell as well as the temperature for first-life cycling and their orientation (H = horizontal, V = vertical) during both first- and second-life testing. The cycling of the first 14 cells was conducted from 2015 to 2017 using testers from PEC (SBT-0550 or ACT-0550), while the remaining 4 cells were tested with an Arbin LBT21084 battery tester. All second-life cycling tests and measurements were conducted with the same battery tester used for the first-life measurement, expect for cells 45V-1-H, 25H-10-H and 25V-13-H, which were cycled using the Arbin LBT21084 battery tester for the second-life testing. All cycling was done in temperature-controlled chambers. Note that all cells were tested without any mechanical constraints, allowing the cells to swell and contract during cycling.

2.2. Cycle Life Testing and Characterisation

All cells in this study were cycled in their first life within a SoC window from 0 to 100% at different temperatures (5, 25 and 45 °C), C-rates and orientations, as presented in Table 1. Second-life cycling was performed at 25 °C, with reduced C-rate or in combination with a reduced SoC window. All charge and discharge steps were finished with an OCV period of a minimum of 5 min. The OCV period was prolonged if necessary to enable the cell to cool down to at least 1 °C above the set cycle temperature. All charging of the cells was finished with a constant voltage (CV) hold at the specified SoC levels of 100% or 70% SoC after the constant current charge (CC) until the current dropped below either 0.1 C (2015–2017) or 0.05 C (>2019).
All cells were characterised at 25 °C by measuring the remaining capacities at three different currents (1 C, 0.5 C, 0.1 C) in addition to a high-pulse-power characteristic (HPPC) test to assess changes in the internal resistance. For the cells tested after 2017, an additional 0.05 C cycle was included in the characterisation test. Characterisation tests were performed every 200 cycles, every 1 month, or if the capacity decreased by more than 5%, depending on which condition occurred first. The capacity evaluation was based on the charge capacity measured during the 0.05 C cycle (0.1 C for cells tested before 2017). In the HPPC test, the applied current pulses and their corresponding responses on the cell voltage were analysed. Especially for this paper, the voltage relaxation after the current pulses was analysed to find the DC resistance 50 ms after the current pulse was finished. This DC resistance is denoted as “internal resistance”. Typically, we report the evolution of how this resistance changes at 50% SoC.
Note that the Arbin LBT21084 battery tester has a maximum charge and discharge current of 30 A, which corresponds to 0.97 C. For simplicity, we will still refer to this rate as 1 C to facilitate easier comparisons with the older studies performed at 31 A, despite this being a 3% deviation from the nominal 1 C current.
Further details on the experimental setup, as well as cell characteristics, are provided in Appendix A.

2.3. Diagnostics

Incremental capacity (IC) (dQ/dV) curves were calculated from the 0.05 C charge and discharge cycles (0.1 C before 2017). A smoothing algorithm was applied to the voltage and capacity data as described previously [60]. Feature peaks of interest on the IC curves (FOIs) were identified by extracting the values and locations of two local maxima during charging. The voltage shift was calculated by subtracting the actual potential of the maxima from the potential of the maxima at 100% SoH. In combination with the peak height, changes in features were studied and compared under different cycling conditions. The data analysis of the IC curves was conducted using a set of simulated degradation maps established in our previous work [60].

2.4. Post-Mortem Analysis

Several tests were performed on selected cells and their parts when the testing of cells in first life and second life was finished. Two aged cells at 5 °C were opened and scrutinised for electrode morphology, material safety of the anode, and remaining lithium metal in the anode. As a reference, one uncycled cell was also opened. Before dismantling a cell, it was discharged to the lower voltage limit of 2.7 V (0% SoC) at a low C-rate (0.05 C) and left overnight at rest. The cells were then disassembled in an argon-filled glove box (H2O ≤ 0.1 ppm, O2 ≤ 0.1 ppm) and separated into cathode, anode, and separator sheets.
The material safety of the anode material was studied in an accelerated rate calorimetry (ARC) test of the material, as ARC testing for the full cell was not possible due to the lack of an appropriate setup. The material was obtained by scraping the surface of one side of a double-coated anode sheet aged at 5 °C using a scalpel. The material was tested with a heat–wait–seek (HWS) stepwise procedure of 5 °C steps using the ES-ARC instrument from THT. A stainless-steel bomb/tube (ARC-ES-1750), 5.5 cm long with 0.15 mm wall thickness and one side welded shut, was filled with 0.7 g of anode material and 0.27 mL 1.0 M LiPF6 in EC/DMC ( ϕ -factor of 3). The sensitivity of the selected method was 0.02 °C/min.
The morphology, as well as chemical composition of samples from an anode sheet from the cell cycled at 5 °C, was examined using SEM (scanning electron microscopy), EDX (energy Dispersive X-ray), and SIMS (Secondary Ion Mass Spectroscopy), supported by FIB (Focused Ion Beam) for making cross sections. The setup is as described in great detail by Sun et al. [64]. The samples investigated were mounted in a glove box and subsequently put into an air tight transfer chamber so that the sample would not be exposed to air (neither oxygen nor humidity) before subjected to the investigation methods described in this paragraph.
To extend the investigation beyond the capabilities of the extended SEM analysis, a piece of the same anode was subjected to investigation by X-ray computed tomography (XCT). The XCT was performed using a Zeiss Versa 630 machine and with focuses providing voxels with cubical pixels of approximately 1.67 μm and 0.33 μm. The apparatus and procedure are described further in [65] and the references therein.
Two samples for analysing the remaining lithium content in the electrodes were prepared by soaking selected anode sheets in deionised water. A full electrode sheet was taken from a pristine cell, whereas the the other sheet was taken from cell 5H-14 cycled to 65% SOH at 5 °C. After soaking in water, the solutions were filtered. Reference potential curves were established using standard solutions with varying lithium concentrations, prepared by weighing lithium metal (0.01–0.4 g) and adding it to 100 mL of distilled water. Additionally, 0.1 g of lithium chloride was added to both the sample and standard solutions to improve conductivity and enhance the sensitivity of the ion-selective electrode. The potentials were measured using a DX207-Li ISE half-cell (Mettler Toledo) with an Ag/AgCl reference electrode preconditioned in a potassium chloride solution.

3. Results and Discussion

This section presents the results of the experiments described in Section 2, along with discussions and important considerations for their interpretation. The development of the capacity loss for the Xalt 31HE cell was assessed under different cycling conditions. In this paper, we begin our investigation by examining the general trends in capacity loss over the cells’ two separate ageing conditions in first and second lives.

3.1. Capacity Development

In this section, the effect of how different operating conditions affected capacity loss in both the first life and second life is presented for the Xalt 31HE cell. The different operating conditions are presented in Table 1. The different cycle life outcomes are presented in Figure 1, shown as how the remaining capacity (SoH) changes with the number of full equivalent cycles (FEC) for the tested cells. In Figure 1a, the evolution of SoH in first-life cycling is presented. Cells operated at 25 °C showed the lowest loss in capacity, with longer usable life and slower degradation. Cells cycled at 45 °C demonstrated a reduced total cycle life, with a short period of slower capacity loss up to ∼500 FEC. For the cells cycled at 5 °C, an almost instantaneous loss in capacity was observed, with a maximum cycle life of only 25 FEC (see inset in Figure 1a). This was most likely caused by considerable lithium metal plating on the anode and will be further discussed later. An improved effect on cycle life was also observed by reducing the cycle current from 1.5 C to 1 C during first-life cycling.
In addition to the effects of temperature and current, we studied the effect of cell orientation (i.e., vertical vs horizontal) on cycle life. In general, vertical orientation during cycling led to an increased capacity loss. This effect was most pronounced in the cells cycled at 25 °C and 1.5 C, where a vertical orientation reduced the cycle life by more than 50% compared to a horizontal orientation. The effect of orientation was less apparent at 45 °C, with a reduced cycle life of approx 30% for the vertical cells. A vertical orientation has been found to promote non-uniform cell ageing in EV battery packs [66]. This effect is also documented and recently reported for cylindrical cells [67]. The effect of orientation observed here is for cells cycled without any mechanical compression. Also, a significant difference between cylindrical cells and poach cells is the volume in the core of the cylindrical cells, where there is space for residual electrolyte to flow in and out depending on the SOC. Note that some capacity loss variability between cells cycled in different orientations reported herein may also be attributed to manufacturing differences for individual cells.
The ageing trajectory of the cells cycled into second life is illustrated in Figure 1b, with the colours representing the first-life temperatures the same as those presented in Figure 1a, while the first-life part is now grey. Most second-life cells were cycled at 25 °C with a reduced SoC window and at a reduced C-rate (see Table 1 for detailed conditions). We observe a prolonged cycle life for all cells, with an improved ageing slope, even if the cell’s second-life cycling was started after the cell had reached the “knee-point” in the ageing curve [68,69]. The cycle life extension due to the second-life cycling resulted in more than a doubling of the total FEC for the majority of the investigated cells, with, on average, only 5–10 percentage points additional drop in the SoH.
The ageing behaviour during second-life cycling may depend both on the history and conditions for cycling in the first life, as well as for the new cycling conditions used in the second life. The main factor improving cycle life in the second-life is the reduction of the SoC window. This is apparent when comparing the ageing trajectory of the only cell that was not cycled in a limited SoC window (25V-11-V). This cell experienced a continued rapid drop in cycle life, with only a minor improvement in cycle life when using the stepwise reduction of the cycling current (see insert in Figure 1b). This behaviour can possibly be attributed to a shift in electrode balance and local higher electrode voltages. In particular, when the cathode is at high SoC and the anode at low SoC, local elevated electrode potentials that are thermodynamically and kinetically unfavourable can be reached. At high SoC, the cathode may operate at higher potentials than at BoL, potentially facilitating parasitic reactions, such as electrolyte oxidation, transition metal dissolution, and lattice structural degradation, that compromise the integrity of the cathode–electrolyte interface [70]. At low SoC, the anode is subjected to highly reducing potentials that can potentially cause instability of the SEI [71]. These parasitic reactions could have contributed to the intensified degradation observed for the cell in 25V-11-V.
The second important factor affecting the second-life cycle life is the temperature that the cells were exposed to in the first life. Cells previously cycled at 25 °C exhibited a slower second-life decline in SoH compared to the cells that were originally cycled at 45 °C. In general, more demanding first-life cycling led to faster capacity loss during second life. This indicates that ageing at higher temperatures triggers ageing mechanisms that possibly cannot be reversed by changing cycling conditions in the second life.
As for the effects of C-rate and cell orientation in the first life, there was no clear trend on how they affected the ageing trajectory into the second life. The capacity loss of 45V-1-H, which was initially cycled vertically and then horizontally for the second life is lower per FEC than the two cells that were originally cycled horizontally at the same temperature. For 25 °C, the opposite is observed. The cells cycled horizontally in the second life, 25H-10-H and 25V-13-H, degraded more slowly than the two cells cycled vertically, despite also being cycled at 1.5 C in the first life.

3.2. Resistance Development

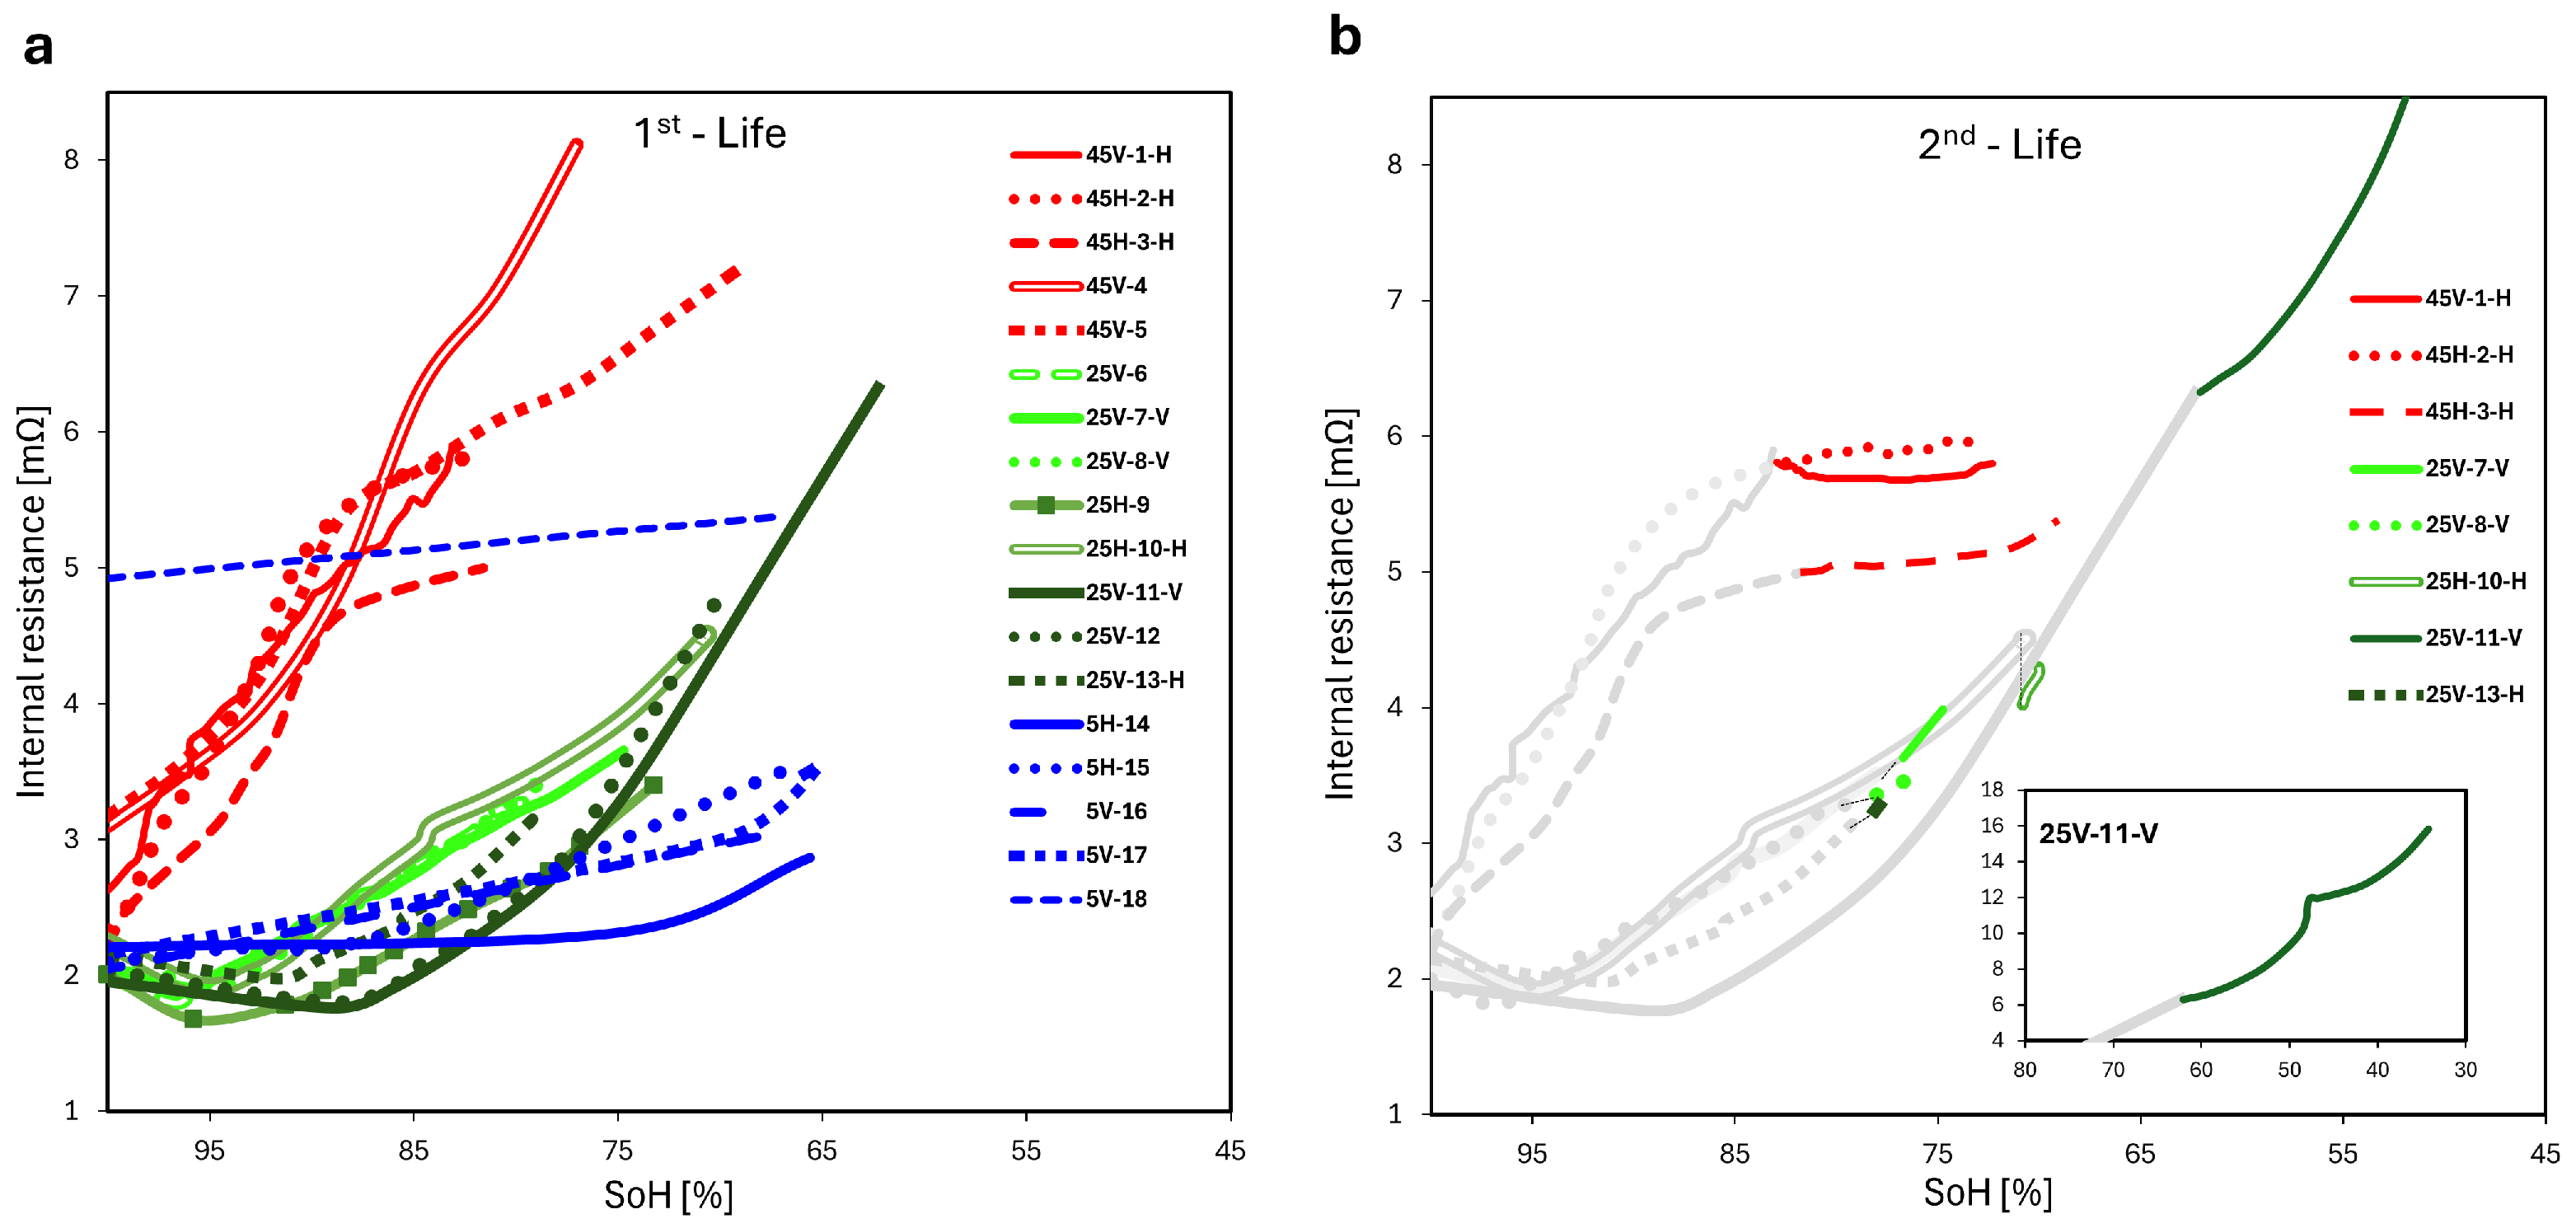
During ageing, the cell’s DC resistance increased considerably depending on its ageing conditions. The DC resistance was derived from the HPPC current pulses. The changes in DC resistance at 50% SoC are presented in Figure 2. For the first-life cycling illustrated in Figure 2a, all cells exhibited an overall increase in resistance as the SoH declined, which is consistent with typical LIB degradation characteristics for older-generation LIB cells. The cells cycled at 45 °C displayed a steeper increase in resistance as the SoH is lowered. In contrast, the 25 °C cells displayed a small initial drop in resistance accompanied by a more moderate, steadier increase in resistance with decreasing SoH. The 5 °C cells maintained a near-flat slope, reflecting minimal resistance growth for the very few cycles that the cells achieved.
Notably, cell 5V-18, cycled at 1.5 C, has a higher initial absolute resistance value compared to all other cells, but still has the same near-flat slope in its resistance curve as the other cells cycled at 5 °C. The authors believe the discrepancy of the initial resistance value was due to an inconvenient location for a voltage sensor/connector and that the resistance difference (3 mΩ) is merely an additional contact resistance. The slightly improved cycle life for cell 5V-18 can potentially be attributable to additional internal heat generation at the higher C-rate for this cell, which has slightly mitigated some low-temperature degradation mechanisms, e.g., lithium plating. From the superimposed graphics in Figure 1a, cell 5V-18 has a slightly lower degradation rate than the other cells cycled at 5 °C. This cell was cycled at a 50% higher C-rate than the other cells at this temperature. It is worth noting that when we look at the difference between the cell surface temperature and the chamber temperature, Δ T C A , the 5 °C cells at 1 C had an end of cycle Δ T C A of around 8 °C and the cell cycled at 1.5 C had a Δ T C A of around 16 °C. In the light of the other SoH (FEC) curves at different temperatures, this is a probable reason for the slightly lowered degradation rate for cell 5V-18 versus the other cells cycled at 5 °C. Much of its cycling was thus above the low temperatures that initiate and drive the capacity loss in the rest of the 5 °C cells.
In the second-life cycling (Figure 2b), the rate of increase in resistance with respect to the SoH within the cells is significantly reduced for the cells tested at 45 °C cells in the first life, but not in the same manner for the 25 °C cells. The cells tested at 45 °C in the first life retain relatively high resistance values but display a reduced slope. In contrast, the cells tested at 25 °C begin their second lives with a lower resistance value but gradually increase in resistance again as their SoH declines. However, the number of additional cycles achieved is much larger for all cells aged at 25 °C in their second life compared to those aged at 45 °C.
The inset of (Figure 2b) highlights that the resistance behaviour of cell 25V-11-V exhibited a notably steeper increase in resistance with declining SoH, indicative of the onset of accelerated degradation processes. This behaviour is consistent with the corresponding capacity data, which showed rapid capacity deterioration under full SoC cycling during second-life cycling. Additionally, it reinforces the statement already made that operating across the full SoC range, even at moderate temperatures and C-rates, accelerates resistance growth. This highlights the critical role of reducing the SoC window in mitigating degradation and preserving capacity and resistance characteristics into second-life cycling.

3.3. Changes in Incremental Capacity Curves

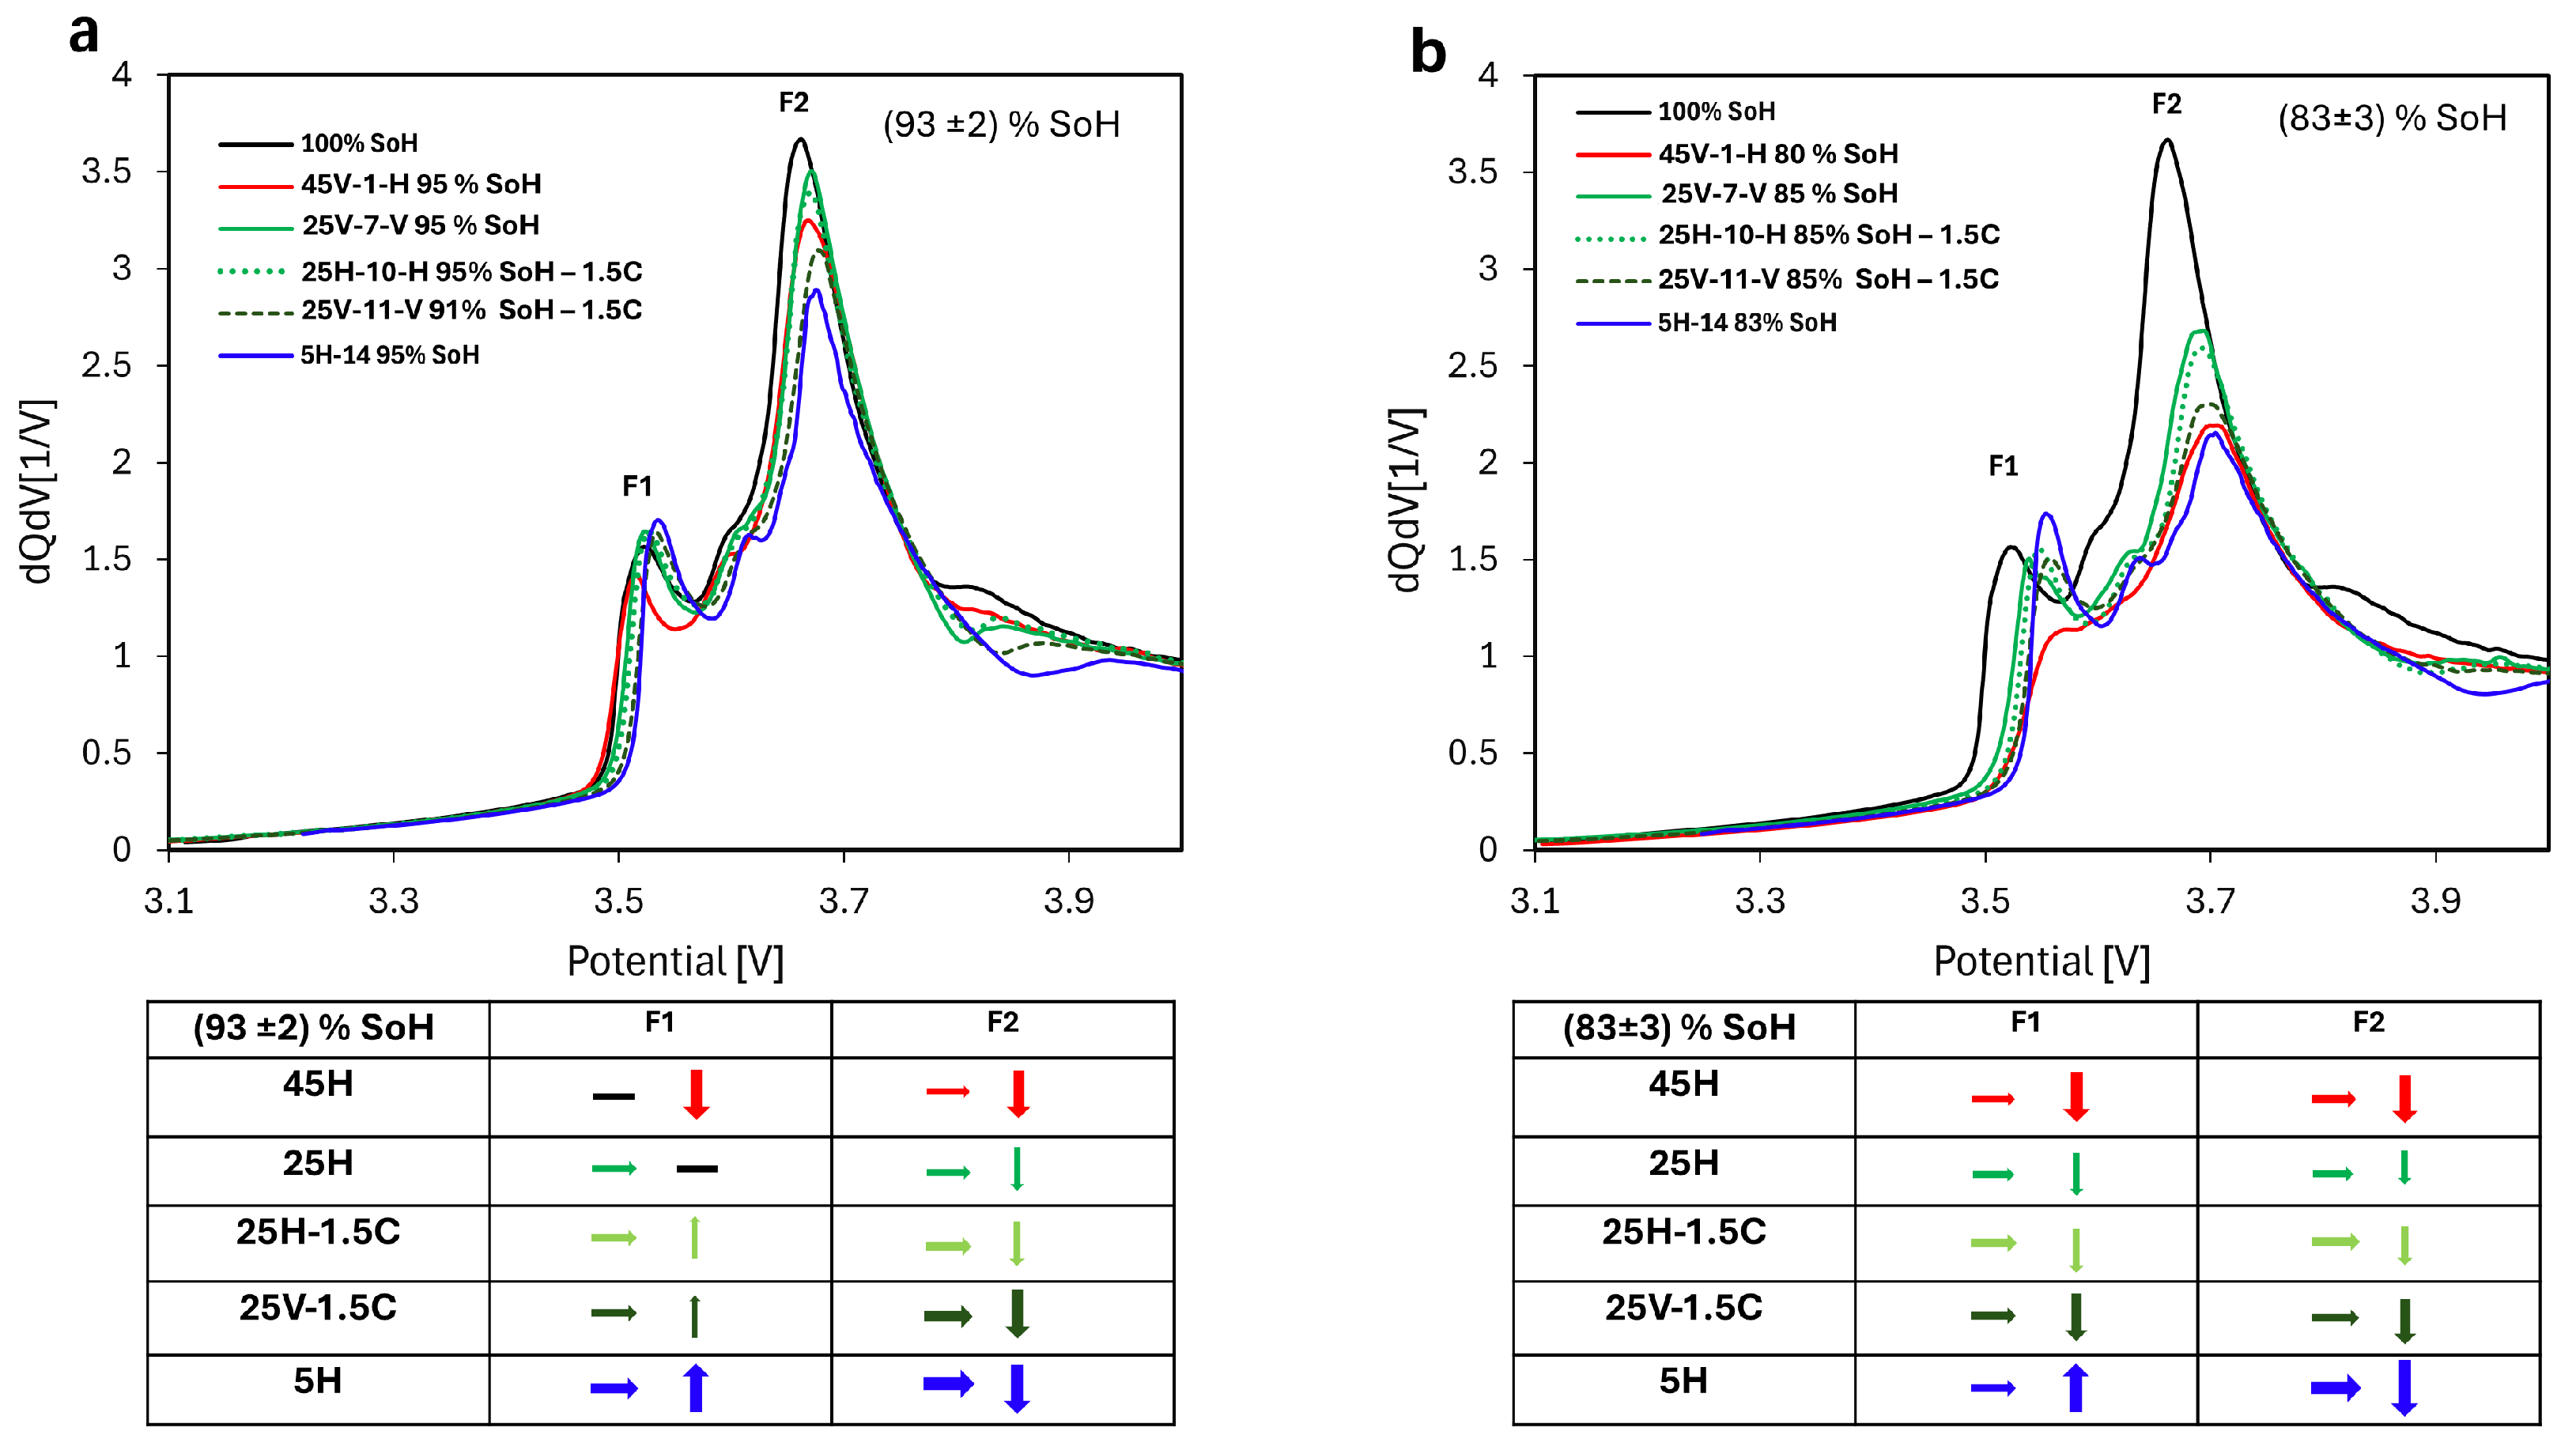
Beyond reporting SoH and electric resistance as a function of FEC, we investigate how the incremental capacity (IC) curves change as the batteries experience capacity loss at the different operating conditions. The incremental capacity (IC) curves for selected cells at different temperatures during their the first-life cycling are presented by plotting them as functions of the cell potential in Figure 3. In this study, we focused the analysis on two feature peaks in relation to SoH, indicated as reference points labelled F1 and F2 for the IC signal at 100% SoH and shown by the black solid baseline in Figure 3a,b.
In Figure 3a, the dQ/dV plots from cells at a SoH ranging between 91 and 95% depict several trends related to the cycling conditions. The cells cycled at higher temperature exhibited little voltage shift in the F1 peak position, while the F2 shifted to a higher potential value. Additionally, a reduction in intensity was observed for both peaks. For the cell cycled horizontally at 25 °C, the F1 peak shifted to a higher potential while maintaining its intensity, whereas F2 shifted to a higher potential with reduced intensity. A different behaviour was observed for cells cycled at 25 °C but at a higher C-rate and different orientation. The F1 peak shifted to a higher potential with an increase in intensity, while F2 also shifted to a higher potential but with a reduction in intensity. The cell cycled at low temperature had the largest shift to higher potential and the highest increase in intensity for F1 and a shift to lower potential and the lowest intensity for F2.
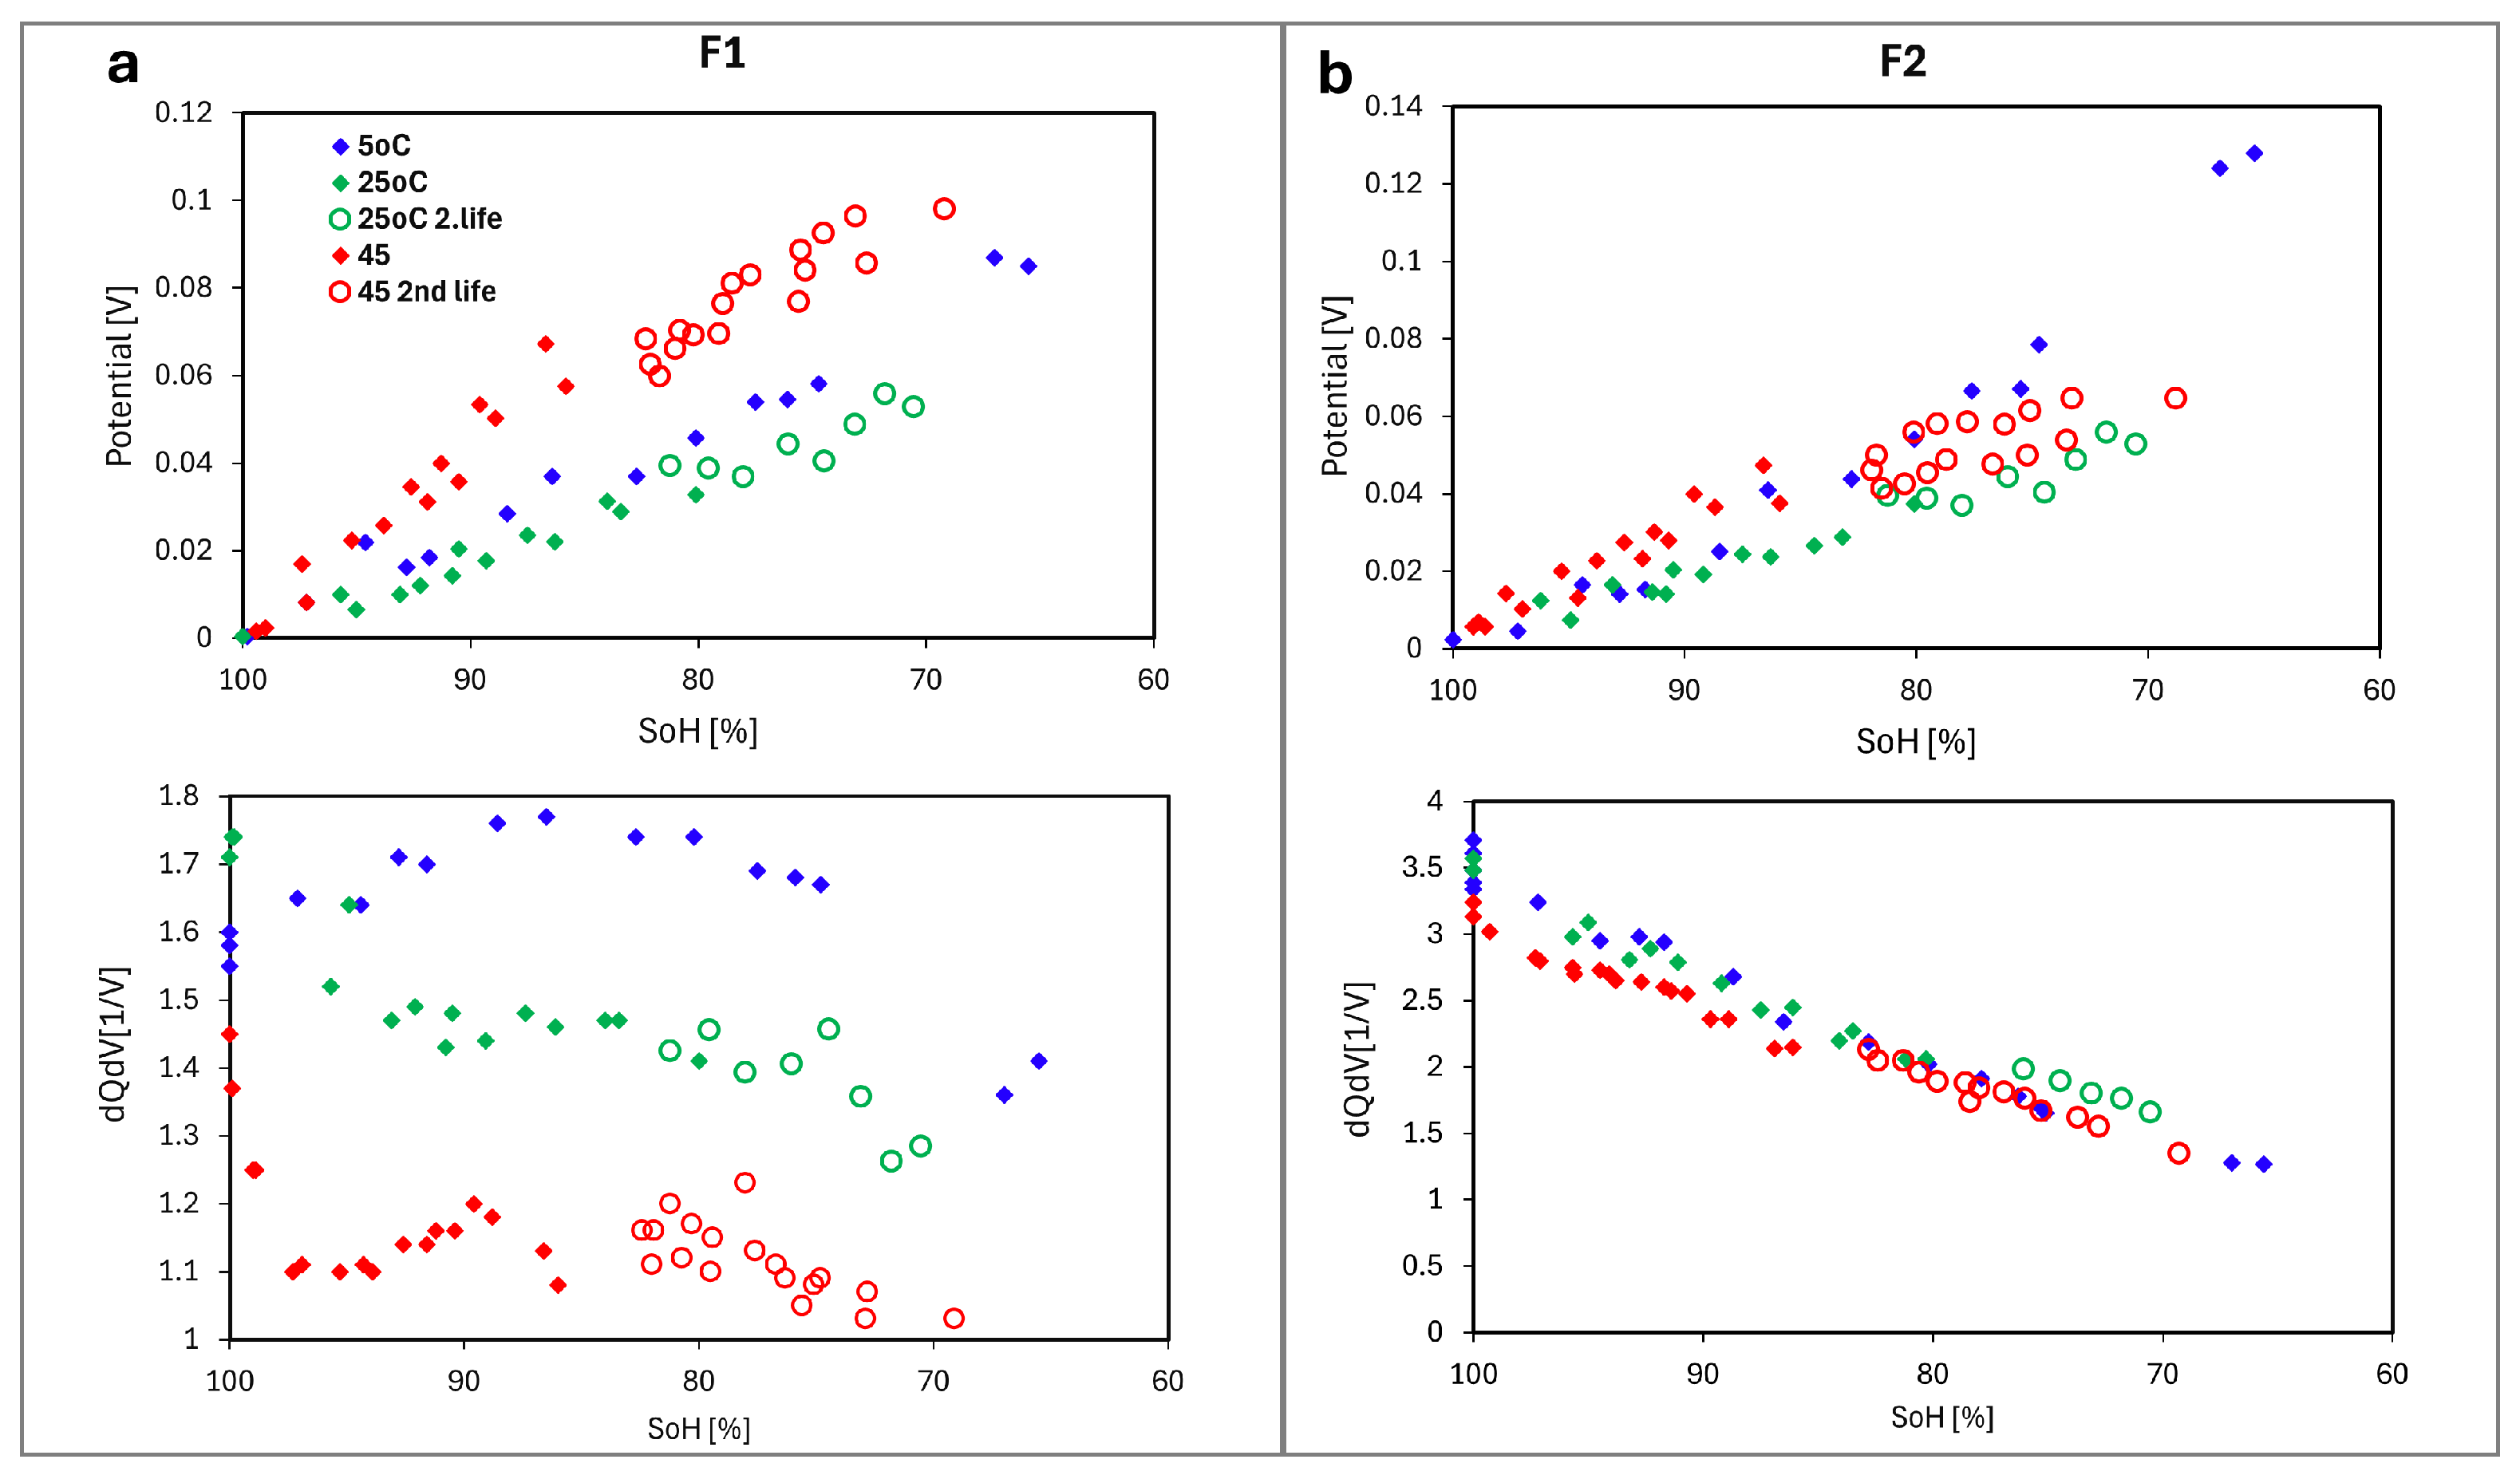
The SoH levels shown in Figure 3b represent the data after the last cycle in the first-life cycling procedure. To understand the trends in greater detail, we analyse the variation of the F1 and F2 peak positions (potential) and intensities (dQ/dV) as functions of SoH. The potential shift and peak intensity of the two features, F1 and F2, as a function of the SoH of the cells cycled at different temperatures at first- and second-life cycling is shown in Figure 4.
In Figure 3b, we show the dQ/dV plots at SoH values ranging between 80 and 86%. Due to the measurement procedure, where the cells go through 100 cycles or whenever the SoH decreased by 5%—depending on which condition occurred first—and ICA measurements are taken in between, the cells subject to ICA naturally reach slightly different SoHs. For peak F1, all cycled cells displayed a shift towards higher potentials. Notably, the low-temperature-cycled cell exhibited higher peak intensity, while the 45 °C cell had a significantly diminished peak, nearly collapsing in amplitude. For the F2 peak, all cycling conditions result in a shift to higher potential, accompanied by an apparent reduction in peak intensity. Notably, the F1 peak exhibits the most significant drop in intensity for the high-temperature-cycled (45 °C) cell.
The shift in the voltage (potential) of F1 for all the cells (see Figure 4a) shows a clear correlation with SoH, increasing progressively as the SoH declines. This behaviour is observed across all temperatures, with the most significant shift observed for cells cycled at 45 °C, while the shift at 25 °C is smaller. A similar relationship is observed during the second-life phase. The F1-intensity for the 25 °C cells decreases with a slight initial drop followed by a gradual flattening (see Figure 4a). However, this behaviour is not observed in cells cycled at 45 °C and 5 °C. For the 45 °C cells, the F1 intensity initially drops significantly before being more or less stable from SOHs of around 97% and lower. The 5 °C cells show a distinctly different behaviour, the F1 intensity remains higher than in cells aged at other temperatures and initially increases as the SoH decreases. After the SoH drops below 80%, the intensity begins to decline, followed by a significant drop at lower SoH levels. Upon second-life cycling, all cells demonstrated a proportional decline in intensity for the F1 peak with a decrease in SoH.
The shifts in potential and intensity of the F2 peak for all cells (see Figure 4b) correlate with the SoH. The F2 potential increases consistently as the SoH decreases in all temperature conditions, with the most considerable shift observed in cells cycled at 5 °C. The F2 intensity decreases as the SoH decreases, showing slight variation among the different temperature conditions. This indicates that the intensity of F2 decreases linearly with capacity loss, irrespective of the cycling temperature. The second-life data exhibit similar trends, following the same relationship between SoH and both the potential and intensity shifts of F2, as observed during first-life cycling. Compared to the resistance measurements in Figure 2, observing the shift to higher potentials of F2 for the cells cycled at low temperatures indicates that losing capacity does not necessarily lead to increased resistance in the same manner.
Analysis of the F1 and F2 feature peaks at different temperatures provides insight into the dominant degradation mode. For high-temperature cells (45 °C), the potential shift and intensity drops in F1 are indicators of LAM at both electrodes (LAMdePE and LAMdeNE) and accelerated SEI formation [60]. The thickening of the SEI layer consumes cyclable lithium, leading to LLI and a rise in internal resistance [38]. For low-temperature cells (5 °C), there is little change in the F1 intensity, but F2 intensity drops strongly, suggesting LLI as the primary degradation mode, potentially due to irreversible lithium plating [60].
To this point, we have examined the impact of temperature, SoC, C-rate, and orientation on degradation behaviour in first-life and second-life cycling. Next, we will focus on post-mortem analyses to further elucidate temperature-specific degradation. In particular, we will investigate cells aged at 5 °C using material ARC, SEM, EDX, SIMS, and lithium leaching. These methods provide insight into thermal offset changes, morphological changes in the anode material, and the potential presence of lithium plating.

3.4. (Material) ARC Testing

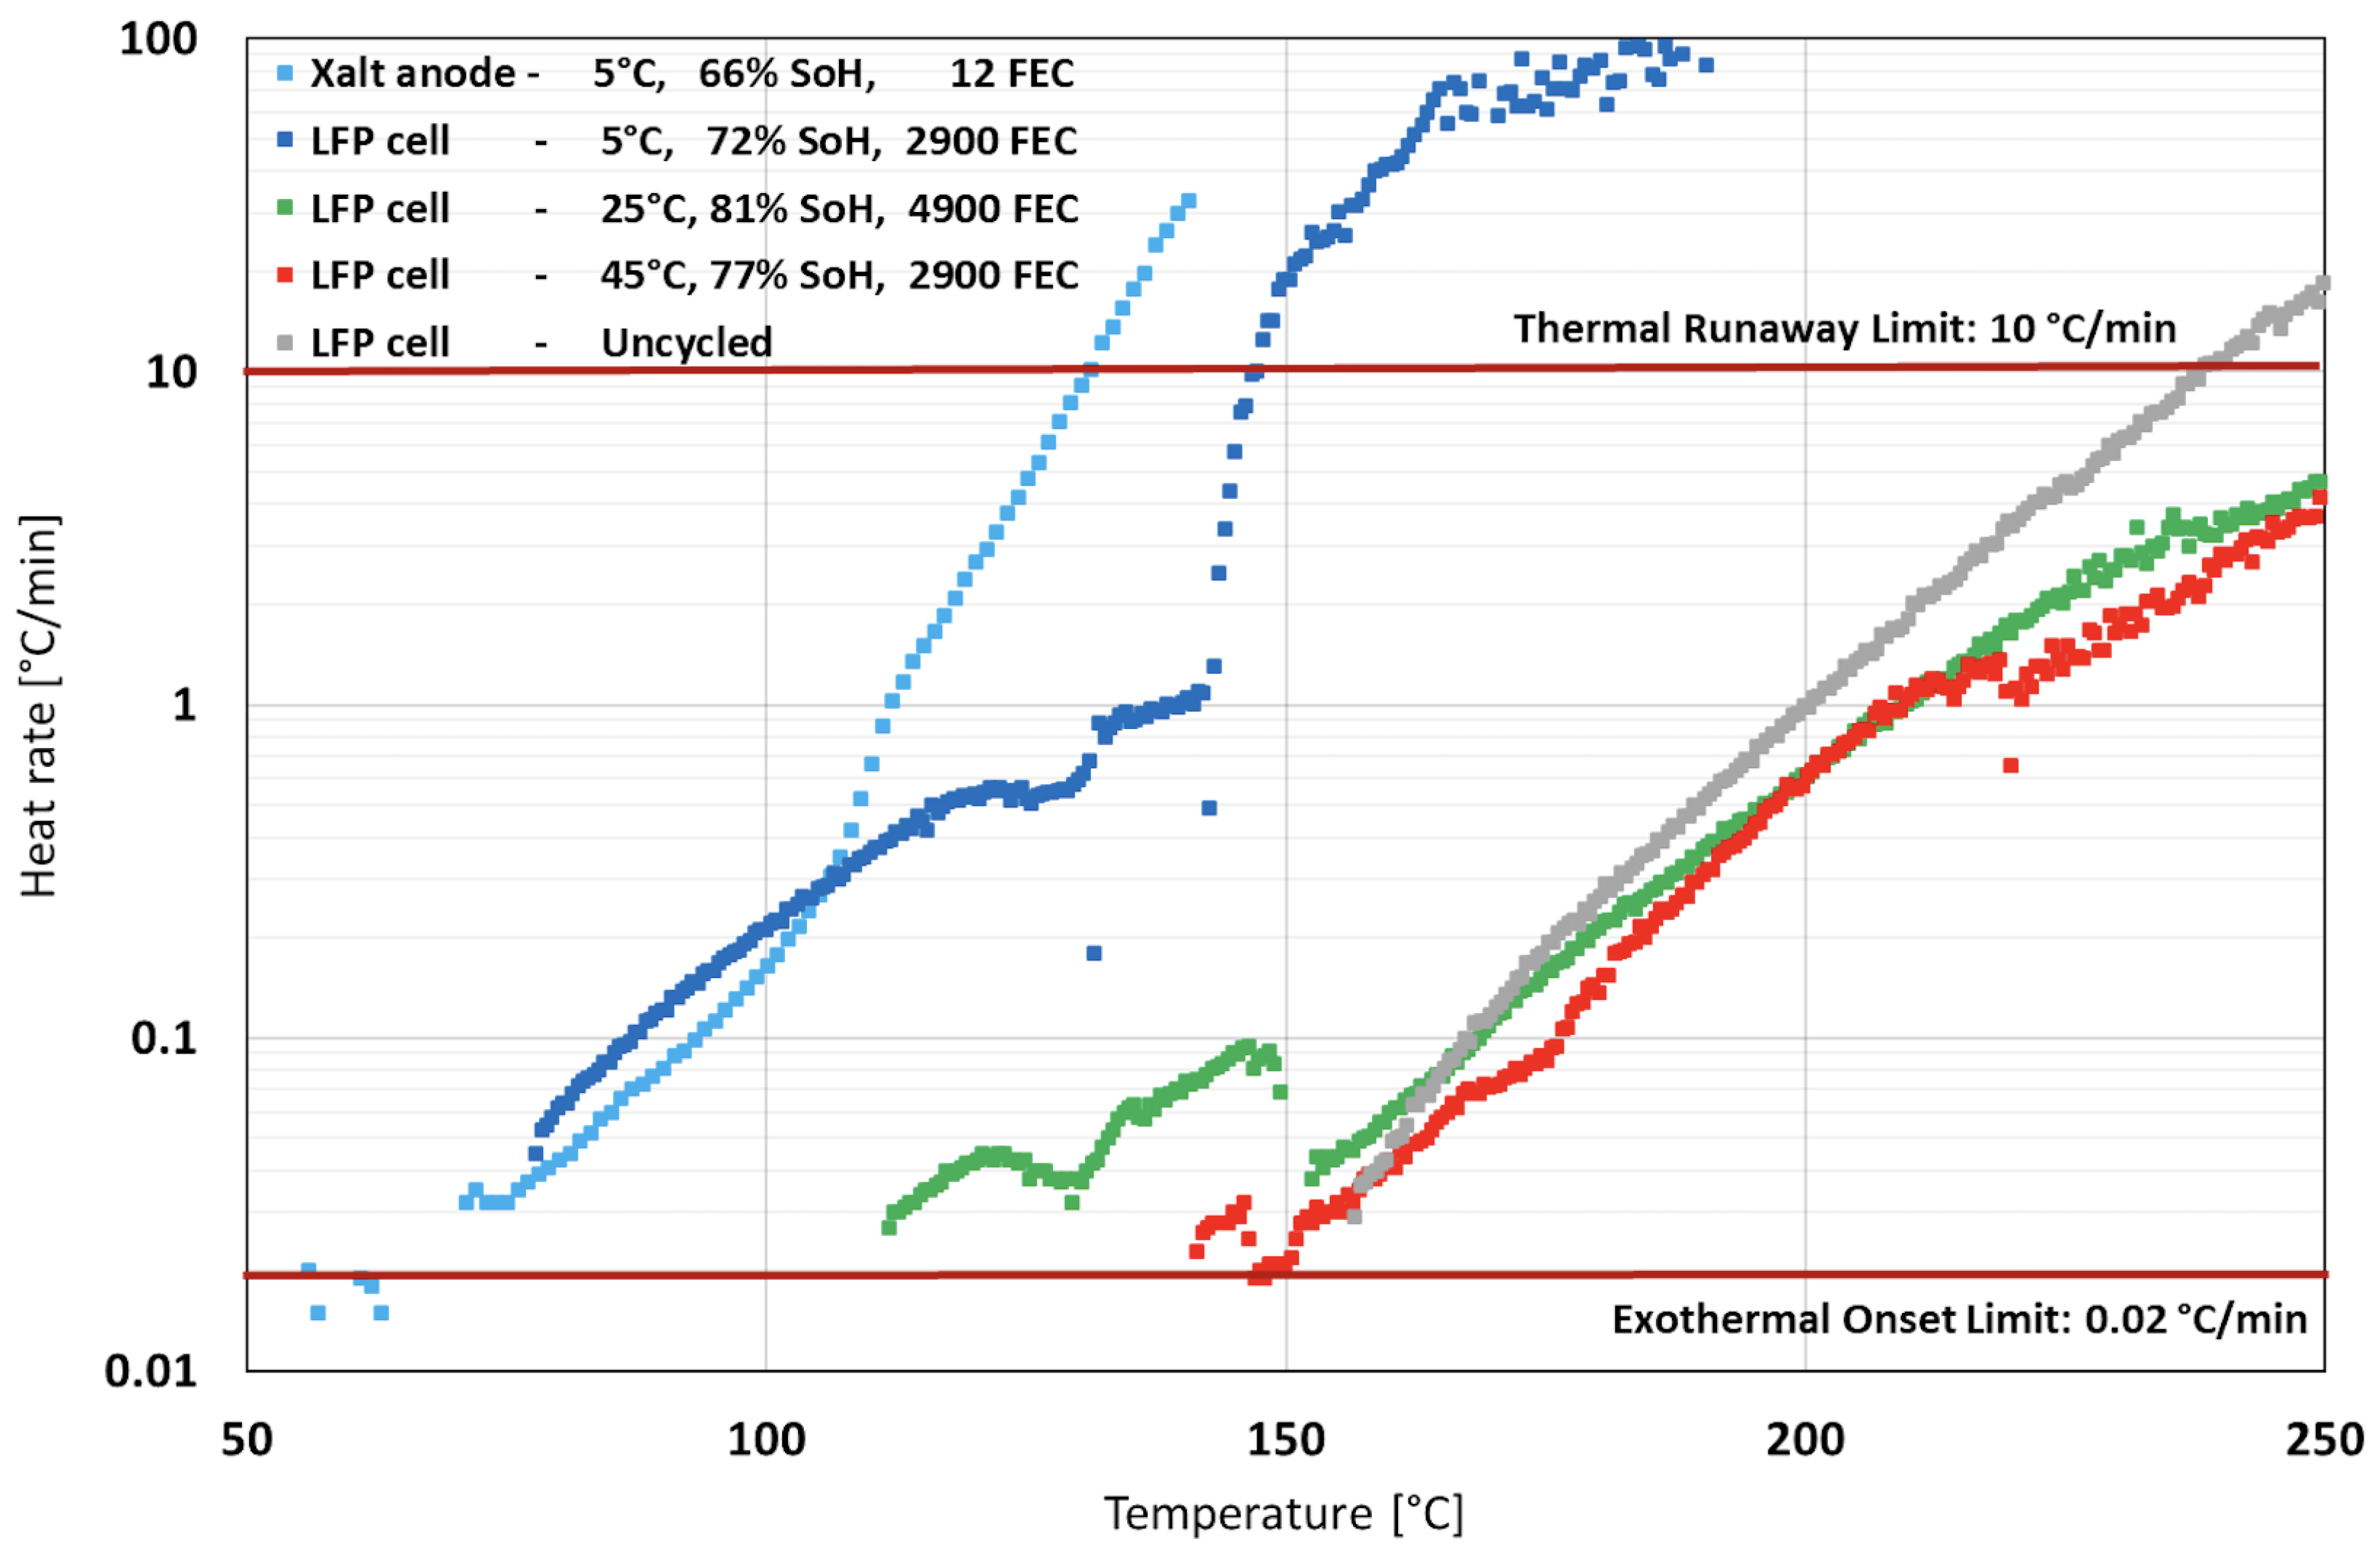
Accelerated rate calorimetry (ARC) is a valuable tool for understanding the safety of batteries, as it indicates the temperature at which LIB cells or materials extracted from them become unstable and prone to initiating a thermal runaway. ARC used in degradation studies can also indicate the degree of suitability for second-life applications, as in this case, where the interest lies in understanding whether first-life cycling conditions have an impact on second-life high-temperature thermal stability. Note that ARC is a destructive method, so once an LIB is investigated after first life using ARC it is no longer available for second-life testing. As the cells in this study were mostly subjected to second-life testing, except for the cells cycled at 5 °C, we have also presented relevant ARC results for a different cell type (LFP cells) that underwent only first-life cycling. These results are shown to give a comparison to the 5 °C cycled cells of the present study that were subject to the material ARC testing.
Material ARC was conducted to qualitatively assess the thermal behaviour of the anode material extracted from the 5 °C cell by measuring its self-heating rate as a function of temperature. While the comparison is limited compared to full-cell ARC results, this analysis aims to provide supporting context for interpreting changes in thermal stability associated with low-temperature cycling. Figure 5 illustrates the measured heating rate as a function of temperature. The provided results are for the anode material (material ARC) of the cell cycled at 5 °C (light blue), along with experimental data from [72] for a commercial LFP cell (full-cell ARC) cycled at 5 °C (dark blue), 25 °C (green) and 45 °C (red), as well as for an uncycled cell (grey). The cycled LFP cells had SoHs ranging from 72% to 81% when subjected to the ARC test. The anode material cycled at 5 °C exhibits a self-heating onset at 74 °C, and the reaction rate accelerates rapidly between 130 °C and 144 °C, ultimately reaching thermal runaway at 144 °C. The result of the material ARC test is similar to the reported data for the commercial LFP cell cycled at 5 °C in [72], corroborating the understanding that low-temperature cycling lowers the thermal runaway temperatures for both thermal onset and thermal runaway, increasing reactivity, and that this hazardous effect is related to anode degradation processes during cycling at low temperatures.

3.5. Investigation of Anodes Cycled at Low Temperatures (5 °C)

As so far seen in this article, the cells cycled at 5 °C had an extremely rapid loss in capacity during cycling. It is also observed that this relates to the anode, considering the results of the material ARC testing. As such, it is interesting to look at what happened to the anodes during cycling.
The anodes from the low-temperature cycling were dissected and subjected to various tests after the reported cycling. The details of this investigation are reported in the Appendix B, Appendix C, Appendix D, Appendix E and Appendix F, and only the highlights are presented here.
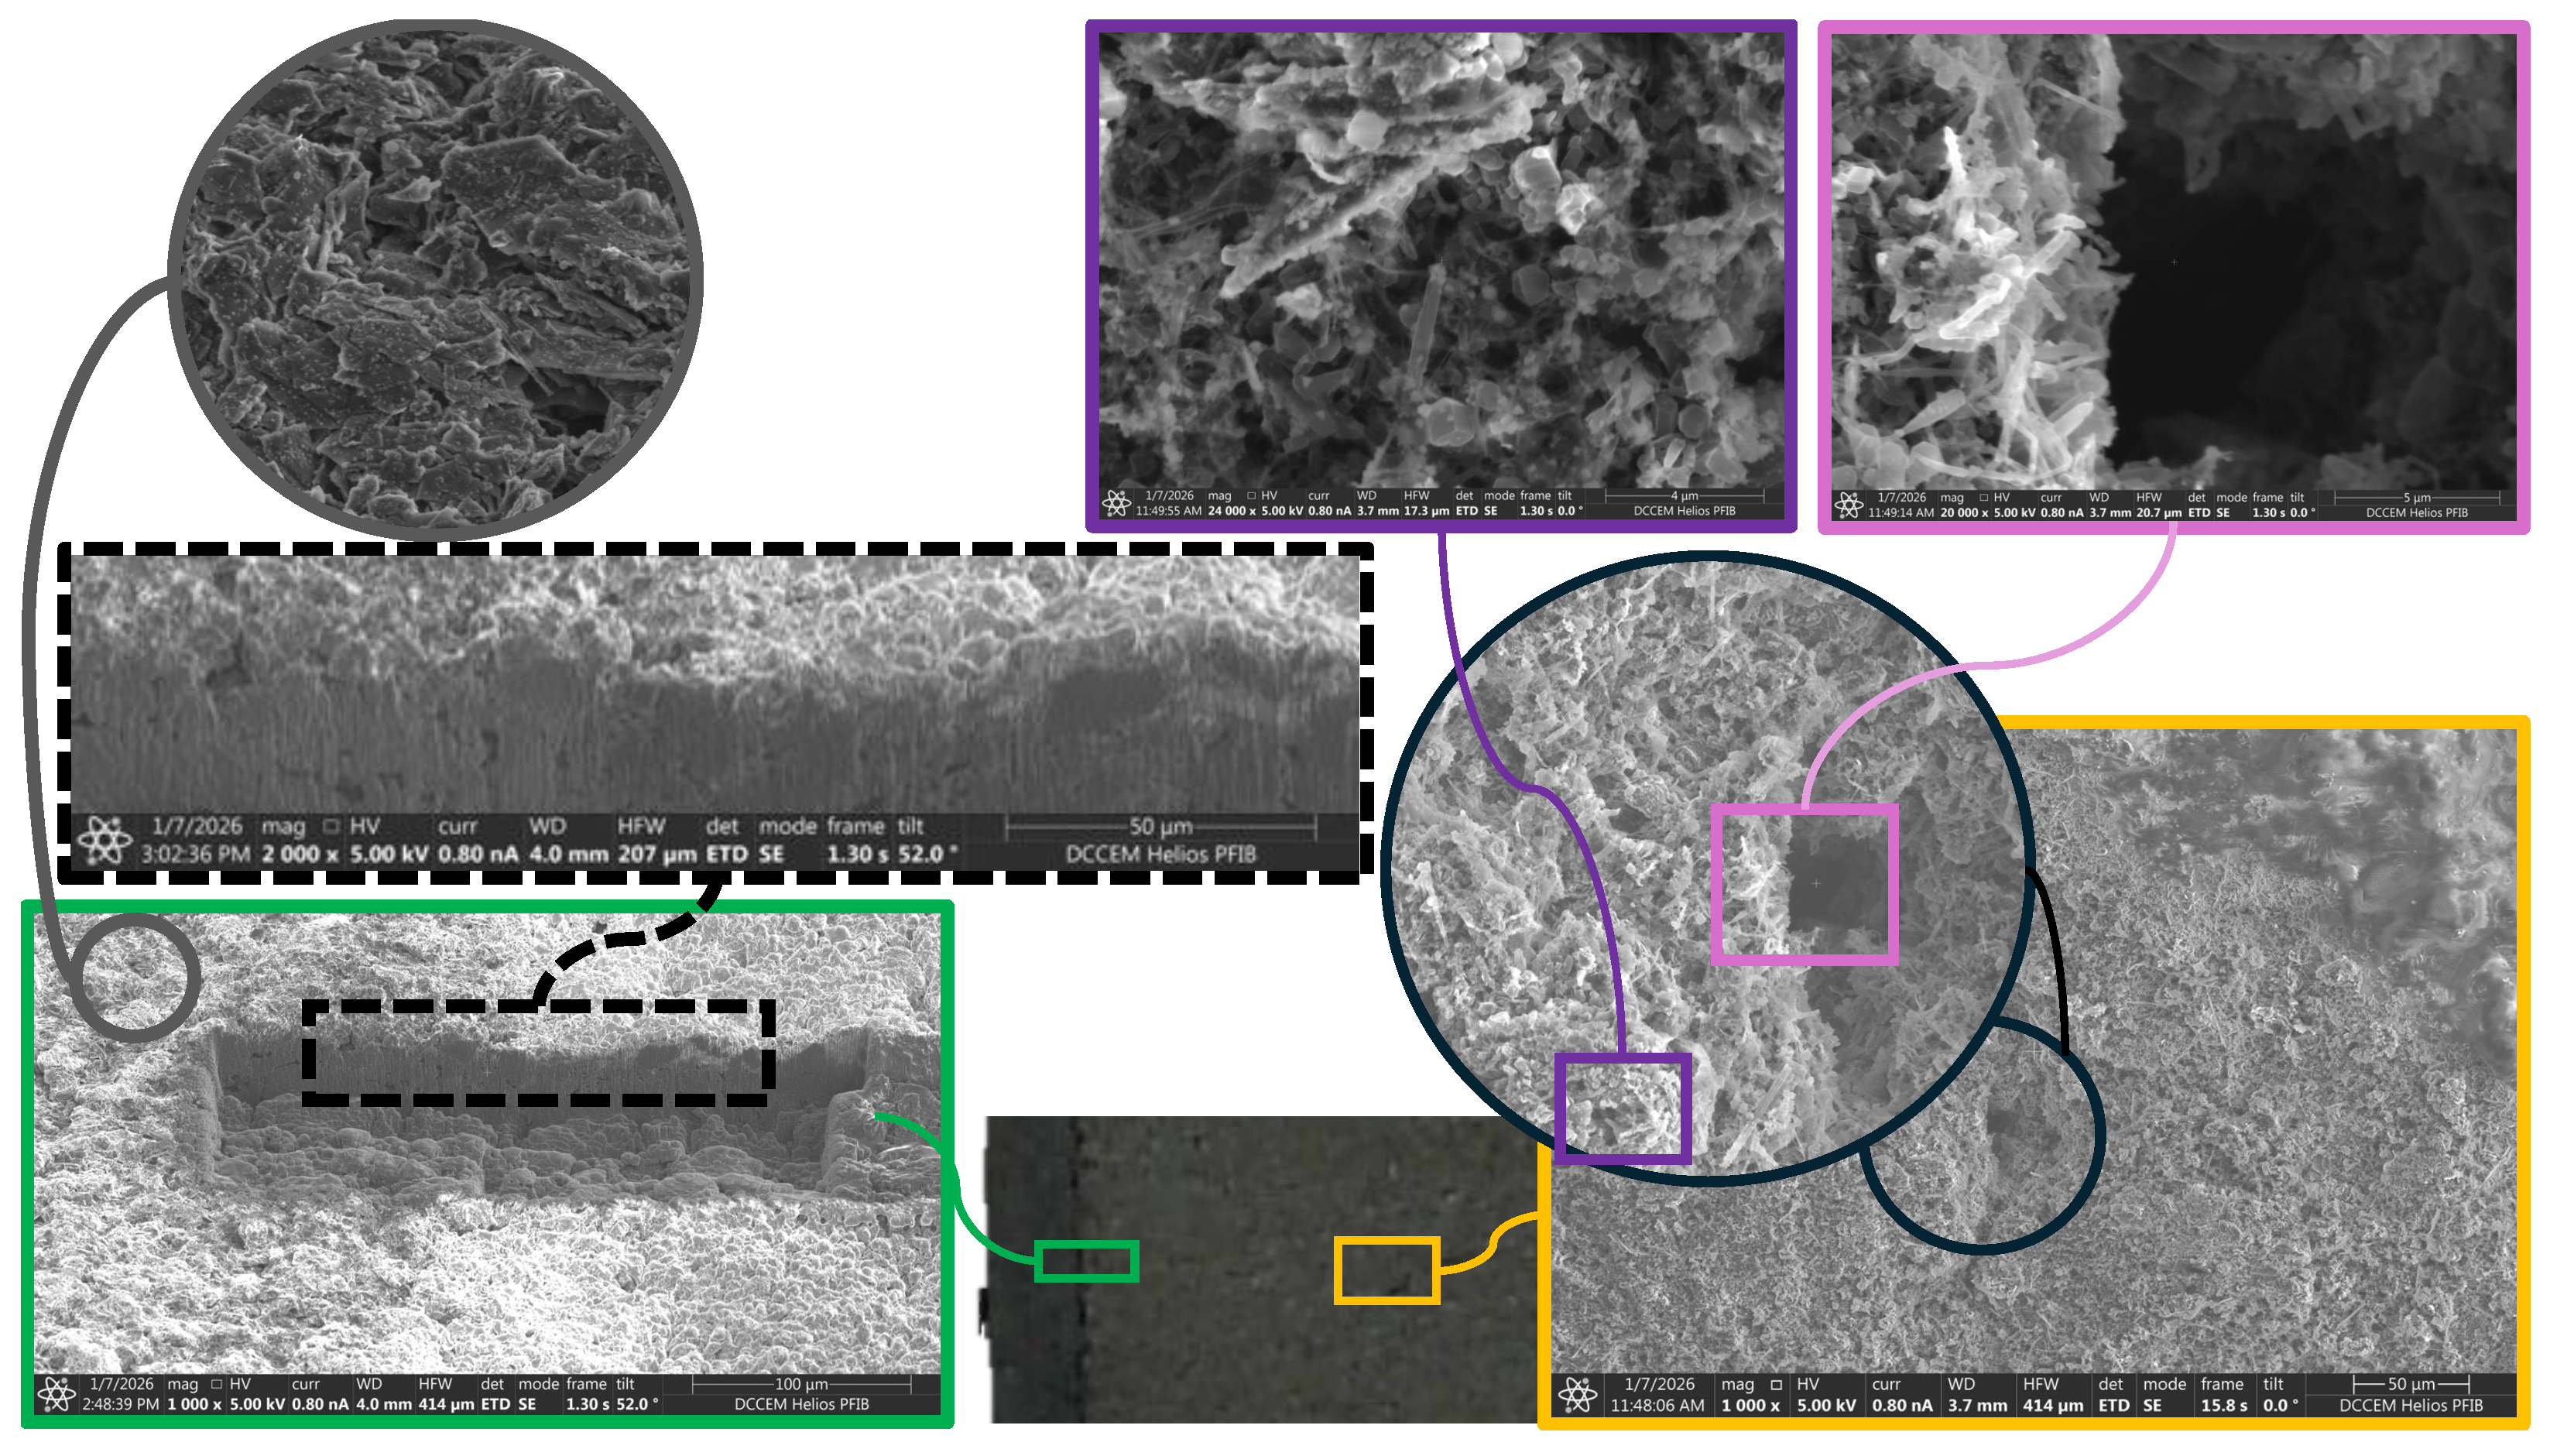
The first significant observation is from visual inspection of these anodes. The anodes were slightly larger than the cathodes, so that in the cell stacking, the anodes’ edges would always be around 2 mm outside the cathodes. This is commonly referred to as an overhang and is common in many battery stacks to avoid local overcharge at the edges. An edge strip is shown using digital imaging in Figure 6 (lower centre). From this, one can see that the overhang has a distinctly different colour to the part of the anode that was underlying the cathode. Whereas the overhang part was black and looked like a pristine anode, the underlying area was beige or silver-like. When exposed to air, the underlying area reacted and changed in colour and topography, and the changes were clearly visible to the eye. These changes are documented further in the supporting materials.
The anode sample was then examined using SEM, FIB-SIMS, and EDX. From SEM micrographs, one can see that the anode had three different characteristic surface appearances: type (i), the overhang that appeared like uncycled anodes; type (ii), crystals on the surface; and type (iii), a smooth layer that partly covered the second characteristic surface. For the overhang, it can be seen in the upper left corner of Figure 6. The transition zone between the overhang and the underlying area is shown in the lower left of Figure 6. By deploying FIB etching, one can see how the crystal-based surface layer is present in larger pores and more open areas near the surface, as well as just in the surface layer on top of the anode. At the top surface, one can see the characteristics of type (ii) and (iii) surface coatings via the yellow-framed SEM micrograph. In that micrograph, type (iii) is recognised in the upper right corner and type (ii) is seen in the remaining area. Using EDX, the type (iii) characteristic areas were found to contain very large portions of phosphorous and fluorine, in molar proportions of one to six, indicating residual PF 6 . Here, carbon and lithium (by SIMS) were also detected. This suggests this layer being composed of residual electrolyte that was not sufficiently cleaned from the electrodes. Similarly, materials with same composition were also found deeper in the anode pores, further supporting the type (iii) layer being residual electrolyte. Type (ii) coatings were found to be very rich in lithium (SIMS indications), as well as having large portions of oxygen, indicating that this could have been lithium metal oxidized by trace levels of oxygen in the glove box (which is never truly zero). Looking further at the type (ii) coating, it appears as a highly porous structure constituted of crystals. These crystals were seen to be needle-like in deeper pores and more cubic, hexagonoids, or dendritic together-grown lumps on the top surface. This is a strong indication of lithium electro-deposited structures grown under diffusion-limited concentration gradients.
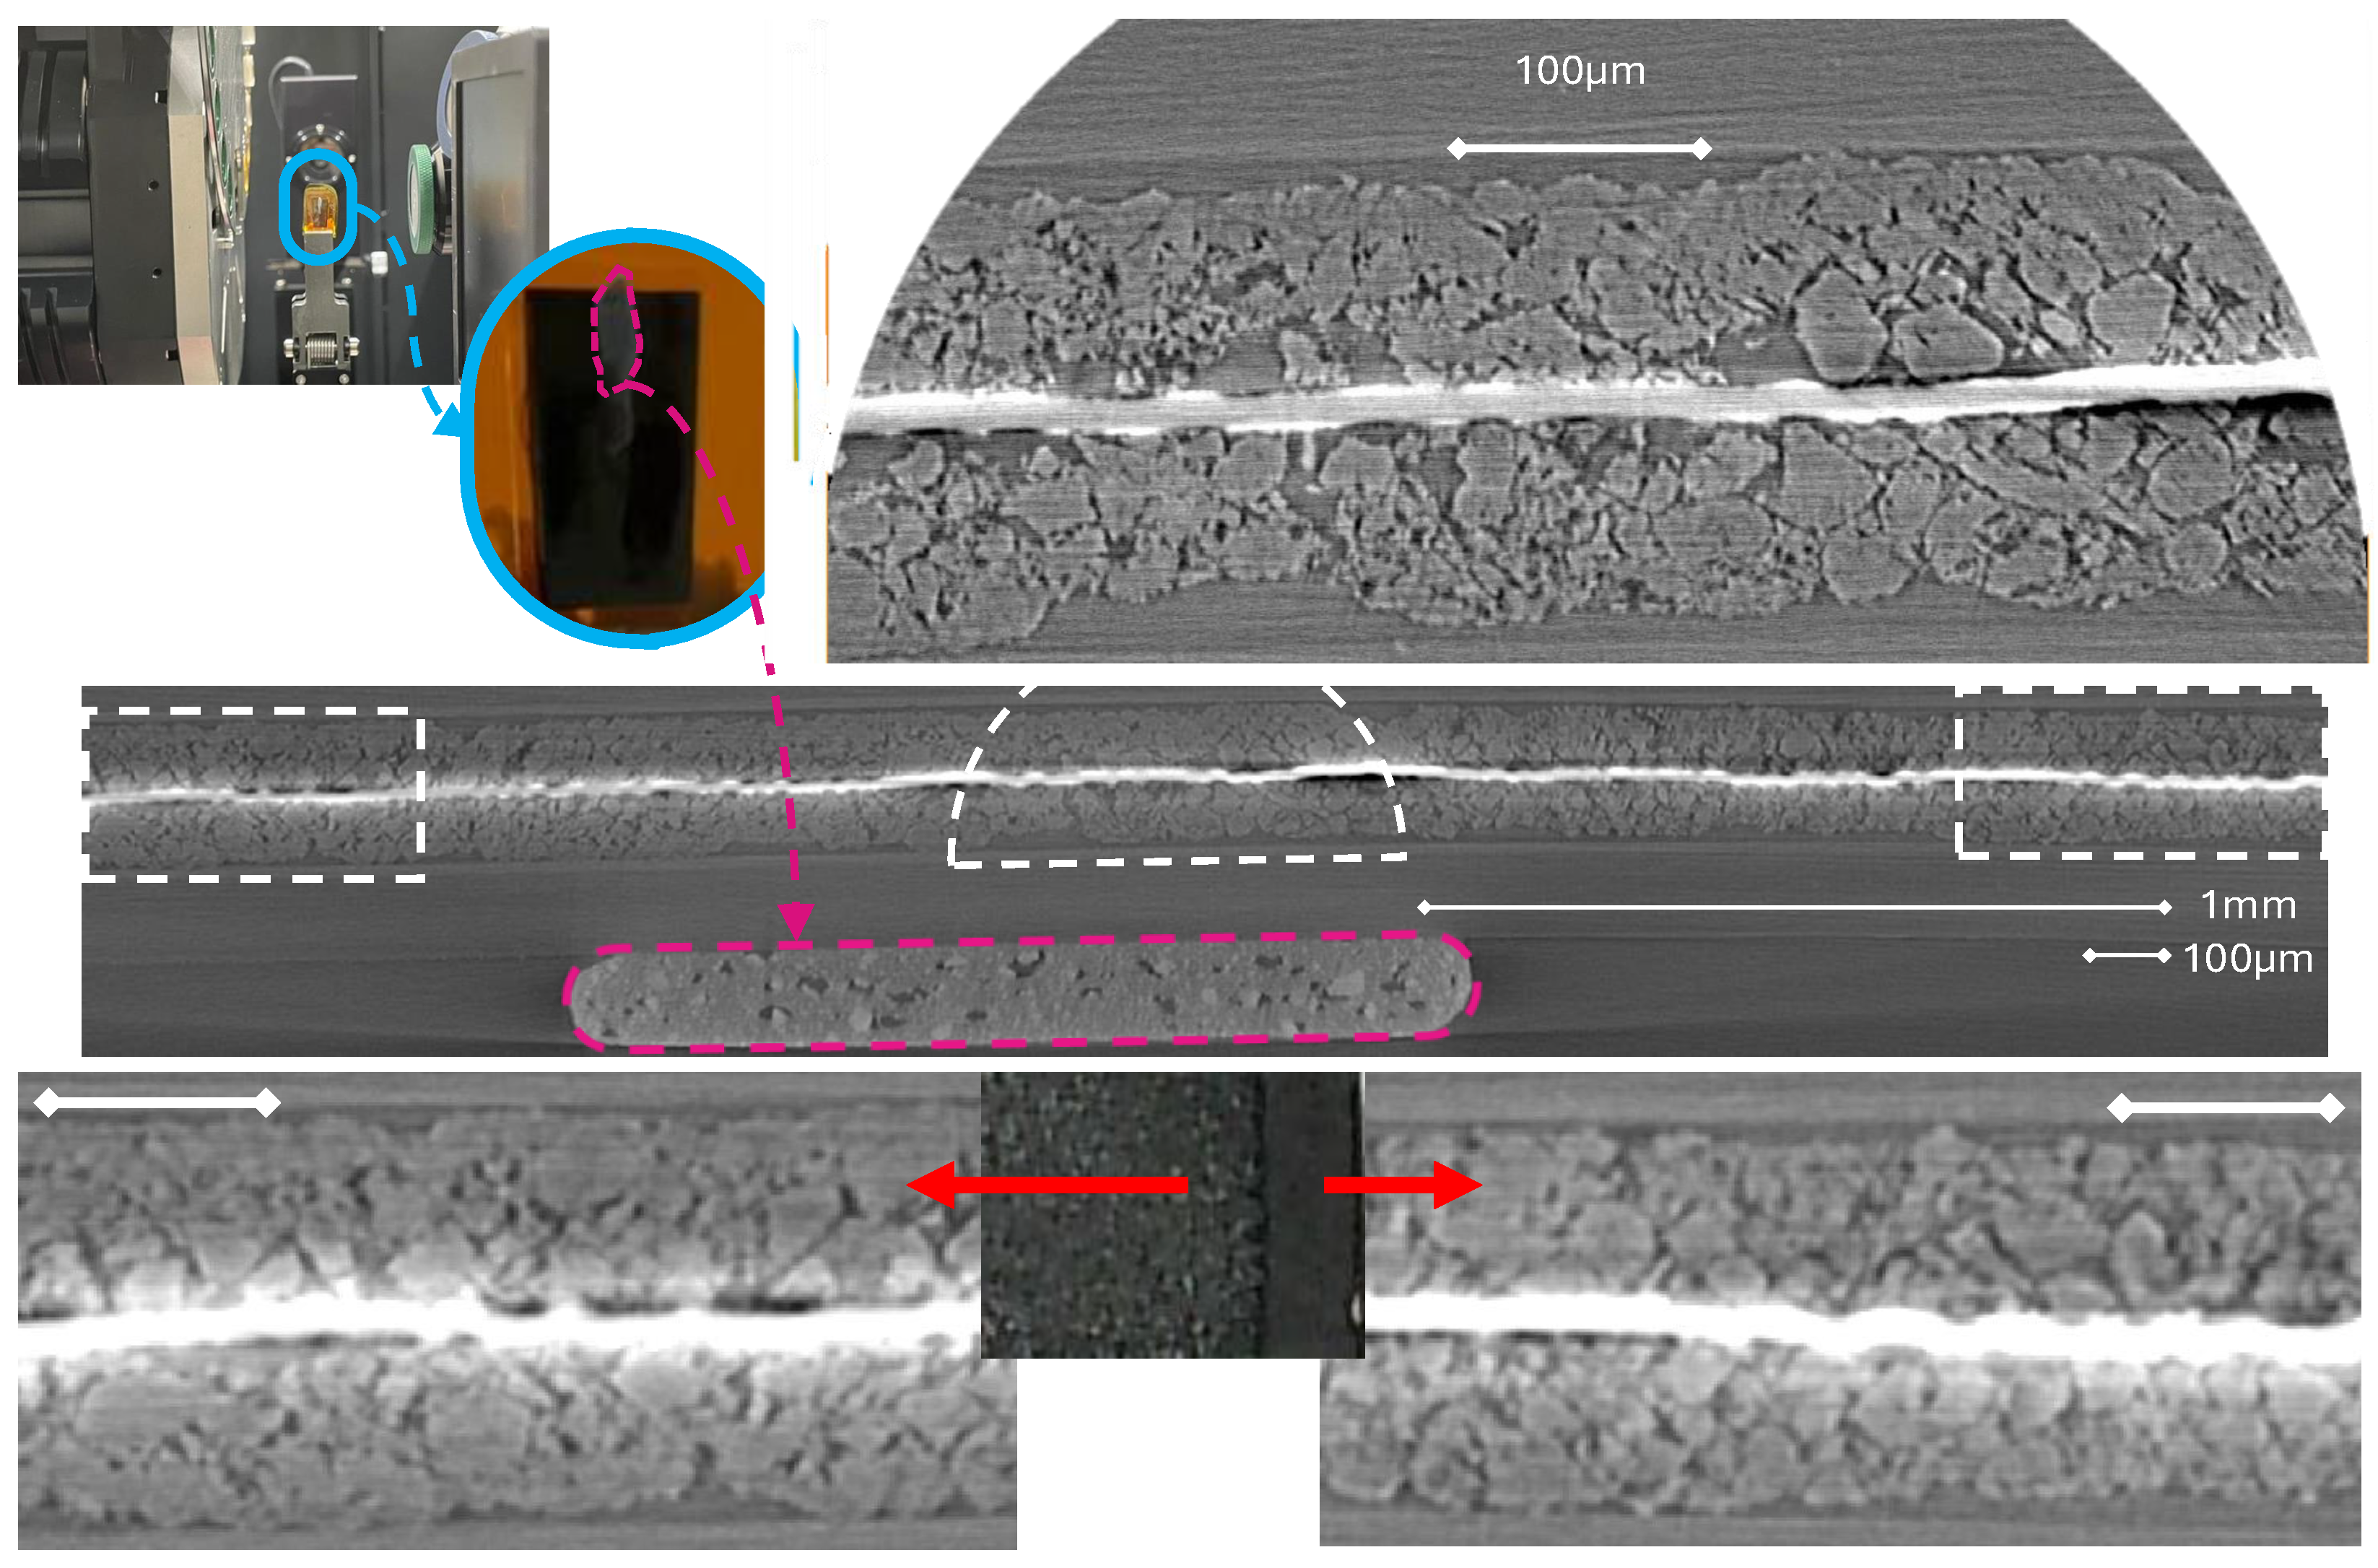
X-ray computed tomography (XCT) was also included in this study. A summary of the visualisations is provided in Figure 7. In contrast to the SEM approaches, it was not possible to document any differences between the three typical surface layers: type (i), (ii), and (iii). What can be observed instead is that the carbon in the anode region, typically coated by layers of type (ii) and (iii), appears swollen compared to the carbon at the overhang (under surface layer type (i)). From the semicircle focus, where the pixels are 5 times smaller than the other XCT images and where the zone between the cathode overlay region (left) and the anode overhang (right) is shown, one can see this difference in carbon swelling particularly well, as well as the gradual change.
Despite not directly documenting the type (ii) or (iii) surface layers by studying Figure 7, one can see that the top layer of the cathode underlay region has a distinct reduced porosity in comparison to the overhang region. The region at the part of the anode that has been facing the cathode and the electrolyte is more dense. In light of the SEM investigation, this layer can thus be interpreted as layer (ii) or (iii), but it is difficult to argue this independently of the SEM investigation. Moreover, from the XCT analysis and particularly regarding the bulk part of the anode, this densification is at least partly due to the anode active graphite particles being more swollen.
The observations shown here via SEM, FIB, SIMS, EDX, and XCT are representative of what was typically seen by investigating several different sites on an anode. Further details and additional documentation are provided in the supporting materials.
As much as lithium in combination with various elements, either oxygen or PF 6 , is recorded and documented, even in very metallic like structures, this does not prove that the deposit is actually metallic lithium. Since lithium metal is indeed very difficult to record and report, the samples were subject to testing for the purpose of developing a leaching test. This can be viewed as a novel approach to detecting lithium. The main conclusion is that only a small percentage of the lost capacity could be detected in this manner. It also remains unclear why the deposited material would not leach, but two possibilities remain: either metallic lithium reacted with air into lithium oxide that would not dissolve in water, or the surface layer is an organic lithium or carbide compound that will not dissolve in the chosen water solution.

4. Conclusions

In this study, we cycled 18 NMC(433)-graphite 31Ah LIB cells to understand the prospects for a second life, focusing on their remaining life potential and safety. The cells underwent various first-life cycling conditions by changing the temperature, SoC window, C-rate, and orientation. This was followed by standardised second-life cycling at fixed temperature, with further variation in the SoC window, C-rate, and cell orientation. From the experimental results, we draw the following conclusions:
  • By changing cycling conditions at a SoH of around 75%, the amount of added full equivalent cycles can double before reaching 70% SOH.
  • Cycling cells at room temperature provides lower degradation rates than cycling cells at 5 and 45 °C.
  • Increasing the ambient operation temperature in first life from 25 to 45 °C will increase the degradation rate of second-life cycling, despite the second-life operation temperature being lowered back to 25 °C.
  • For second-life cycling, reducing the SoC window (by 40%) is more important than lowering the C-rate (by 1/3) (for the selected cells).
  • First-life cycling in room-temperature air (25 °C) gives lower degradation rates as well as lower cell resistance compared to elevated air temperatures (45 °C). These two effects positively contribute to the lower degradation rate in second-life cycling.
  • Vertically oriented cells (standing) experienced higher degradation than horizontally oriented (lying) cells when not under pretension. Vertically oriented cells at 1C degrade at similar rates to horizontal cells at 1.5 C, for the selected cells in the first life in this study.
  • Cycling cells at excessively high C-rates and low temperatures (1 C and 5 °C) leads to the most extreme degradation rates (tenfold higher than other temperatures) in this study.
  • In the ICA analysis, and for the two selected features (most distinct positive peaks at 100% SOH), feature 1 (F1, lower cell potential) was the one peak that most strongly indicated compatibility with a second life, considering both safety and lowered degradation rates.

Author Contributions

Conceptualization, O.S.B. and P.J.S.V.; methodology, All Authors; validation, G.M.H., W.D., S.B.B.S., O.S.B. and P.J.S.V.; investigation, E.R.E., O.S.B., P.J.S.V., S.B.B.S., W.D., G.M.H., J.W., T.L., S.A.W. and L.T.B.E.; data curation, E.R.E., O.S.B., S.A.W., L.T.B.E. and T.L.; writing—original draft preparation, E.R.E., S.B.B.S., J.W., P.J.S.V. and O.S.B.; writing—review and editing, All Authors; visualisation, E.R.E., S.B.B.S., W.D., T.L., G.M.H. and O.S.B.; supervision, E.R.E., P.J.S.V. and O.S.B.; project administration, O.S.B., P.J.S.V. and J.W.; funding acquisition, O.S.B., P.J.S.V. and J.W. All authors have read and agreed to the published version of the manuscript.

Funding

The authors would like to acknowledge funding under the Research Council of Norway, grant numbers: 320760, 281005, 228739, and 350373. W.D. and P.R.S. acknowledge financial support from the Oxford Martin School (for Circular Battery Economies).

Data Availability Statement

The data presented in this study are available on request from the corresponding author.

Acknowledgments

Arnstein Røskar Nisja is acknowledged for contributions to the measurements in the Appendix B regarding ICA, cycling, and the confidence therein.

Conflicts of Interest

The authors declare no conflicts of interest.

Appendix A. Experimental Details of the Battery and First-Life Testing Conditions

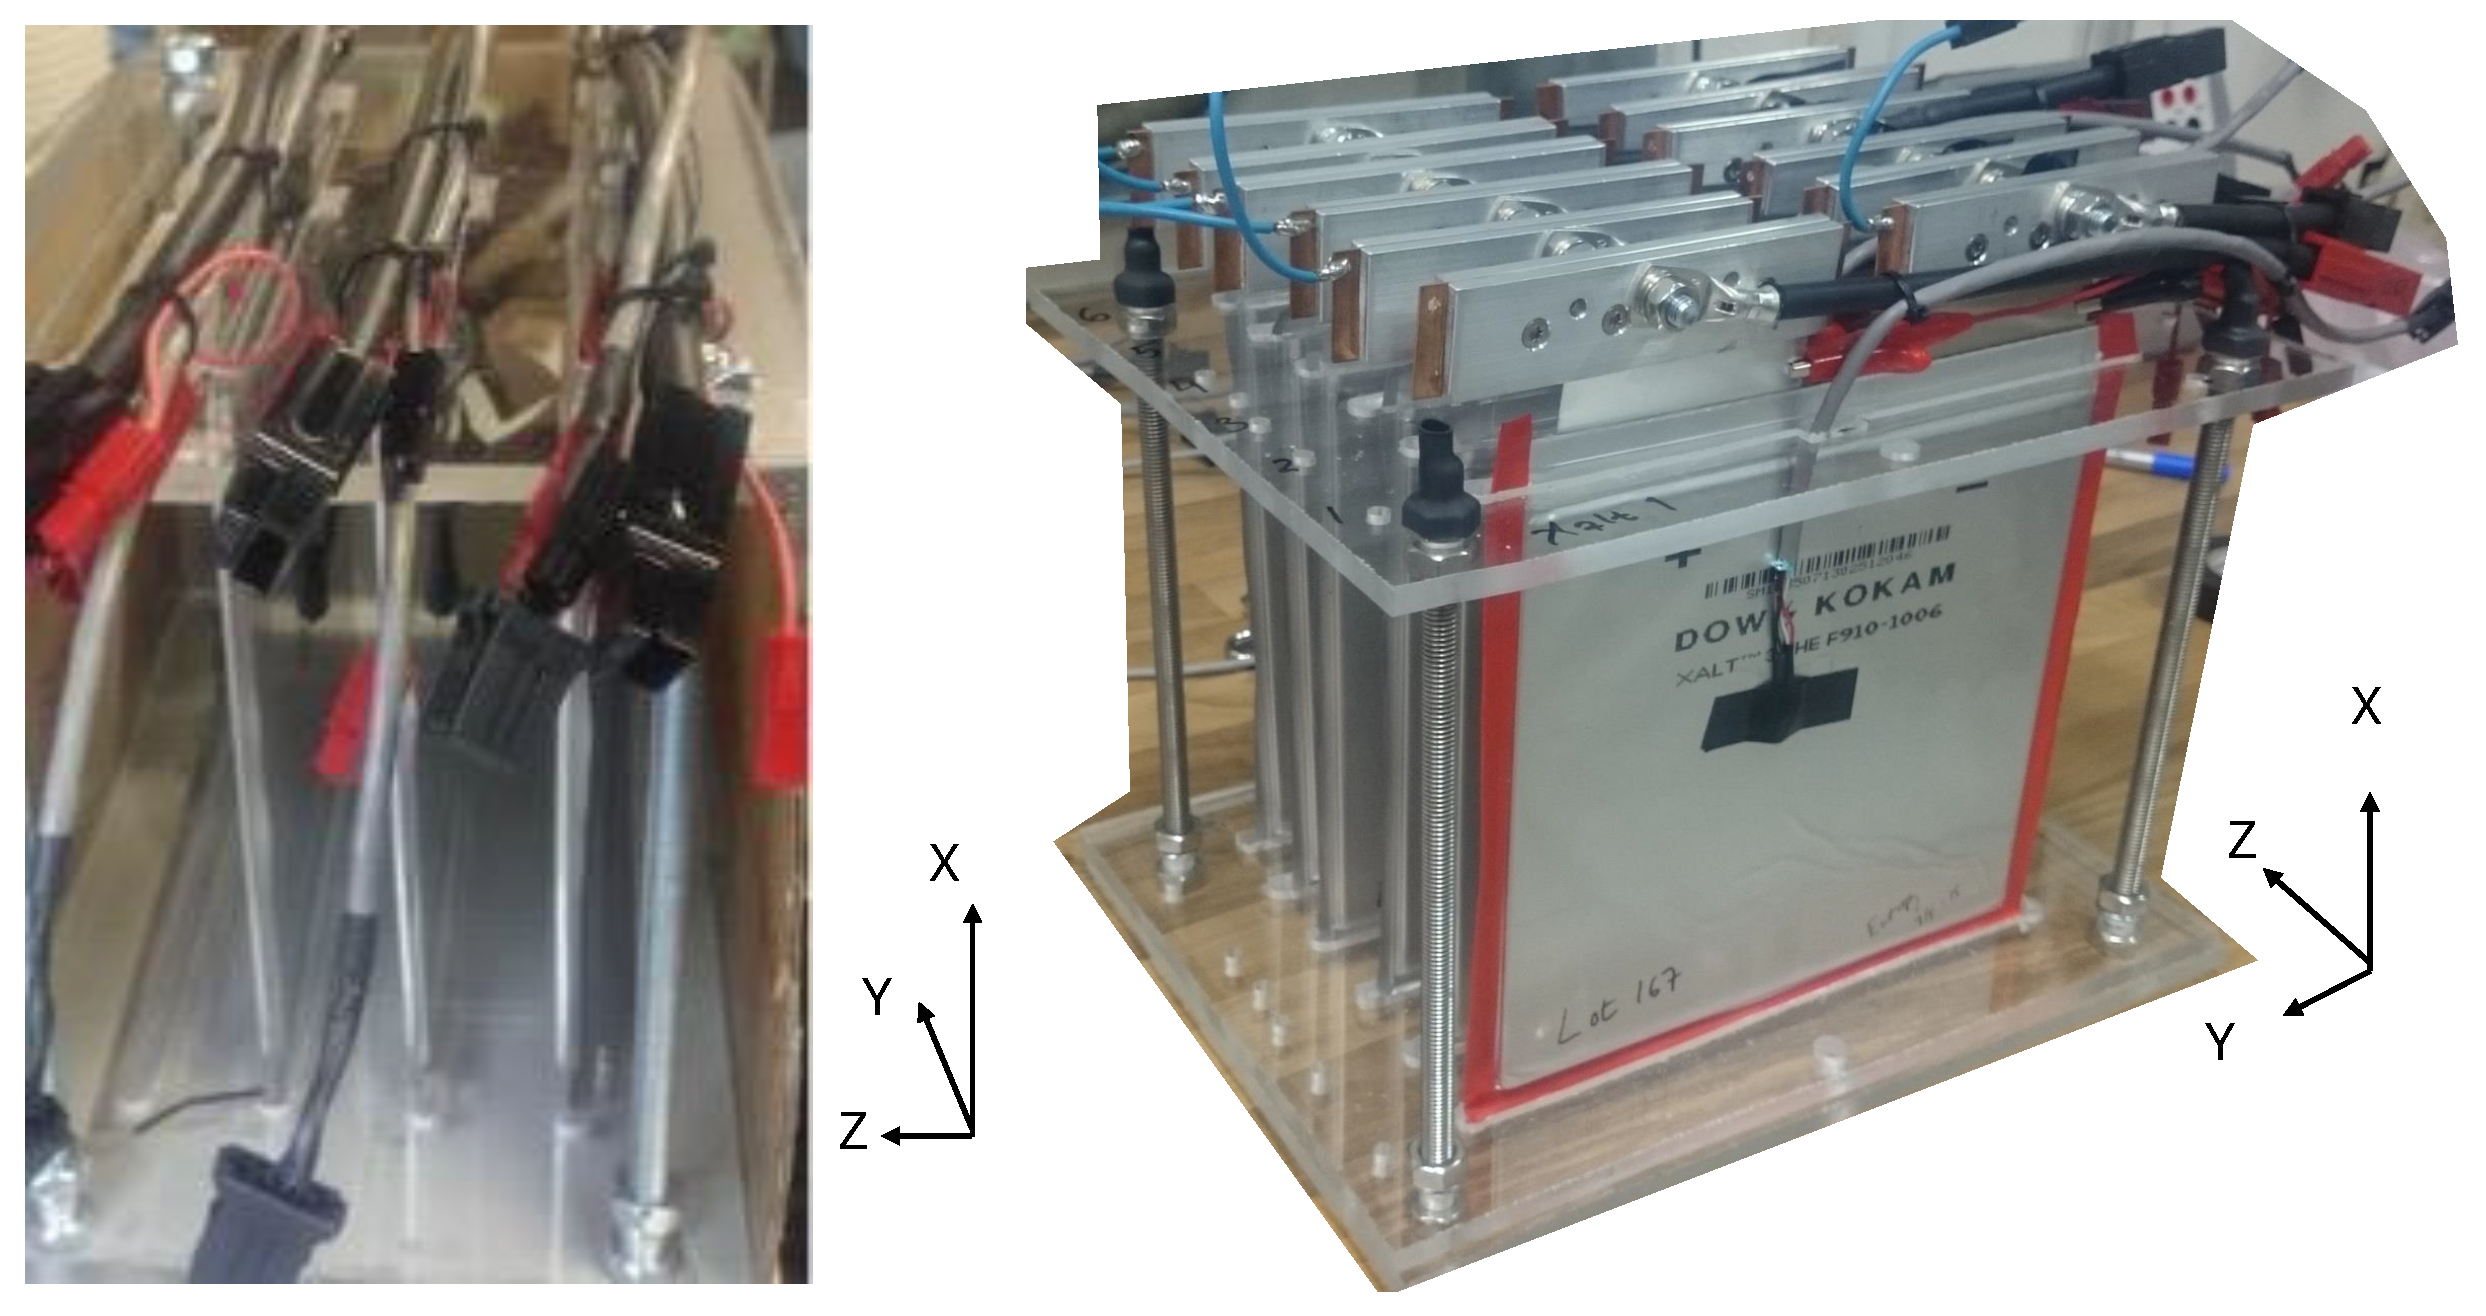
The Xalt battery underwent all tests in standard thermal chambers with fan-circulated air. During the first life, some of the cells were lying down (horizontal), whereas others were in an upright position (vertical). The upright position was achieved by standing the cells on their lower end towards a plexiglass (polycarbonate) sheet, with the tabs (clamped to leads and sensing wires) on the top, while leaning gently on a line support. In detail, a plexiglass sheet with large rectangular end-rounded holes, at least twice the thickness of the cells, were supporting the cells so that they would stand up. The setup is illustrated in Figure A1. The details of the cell specifications are given in Table A1.
Figure A1. The battery cell holder for the standing (vertical) cells. Three cells are displayed, with lead connections at the top.
Batteries 12 00121 g0a1
Table A1. Factory specification sheets of the Xsalt cell.
SpecificationsRange
Capacity (C/2)31 Ah
Voltage range (nominal voltage)2.7–4.2 V (3.7 V)
Continuos max charge and disch.2 C and 5 C
Temperature window, charge and disch.0–45 °C and −20–60 °C

Appendix B. ICA First Life Comparison and Confidence Considerations

In this study, we have presented a large variation of cycling conditions for an NMC-graphite 31 Ah cell. This large variation also means that replicas of specific cycling conditions are scarce and that the confidence level towards conclusions appears low. One of the main discussion points relates to how we can separate, particularly the feature height (dQ/dV-value) of F1, in relation to the cycling temperature in the first life and consequently relate these to safety concerns regarding the battery cells in their second lives.
In Figure 4, there are not that many cells that provide information about the first- and second-life ICA feature peaks for the three first-life cycling temperatures. Our discussion revolves around the signature of feature F1 and the dQ/dV value, organised by temperature groups. To somehow improve the validity of these temperature groupings is therefore essential. Here (Appendix B), we attempt this by two means. For all the temperatures we have added ICA recorded at C/10, and for the short-lived low-temperature measurements we have also cycled an extra cell, recording the ICA after each cycle under the same conditions as those for cells 5H-14 and 5H-15.
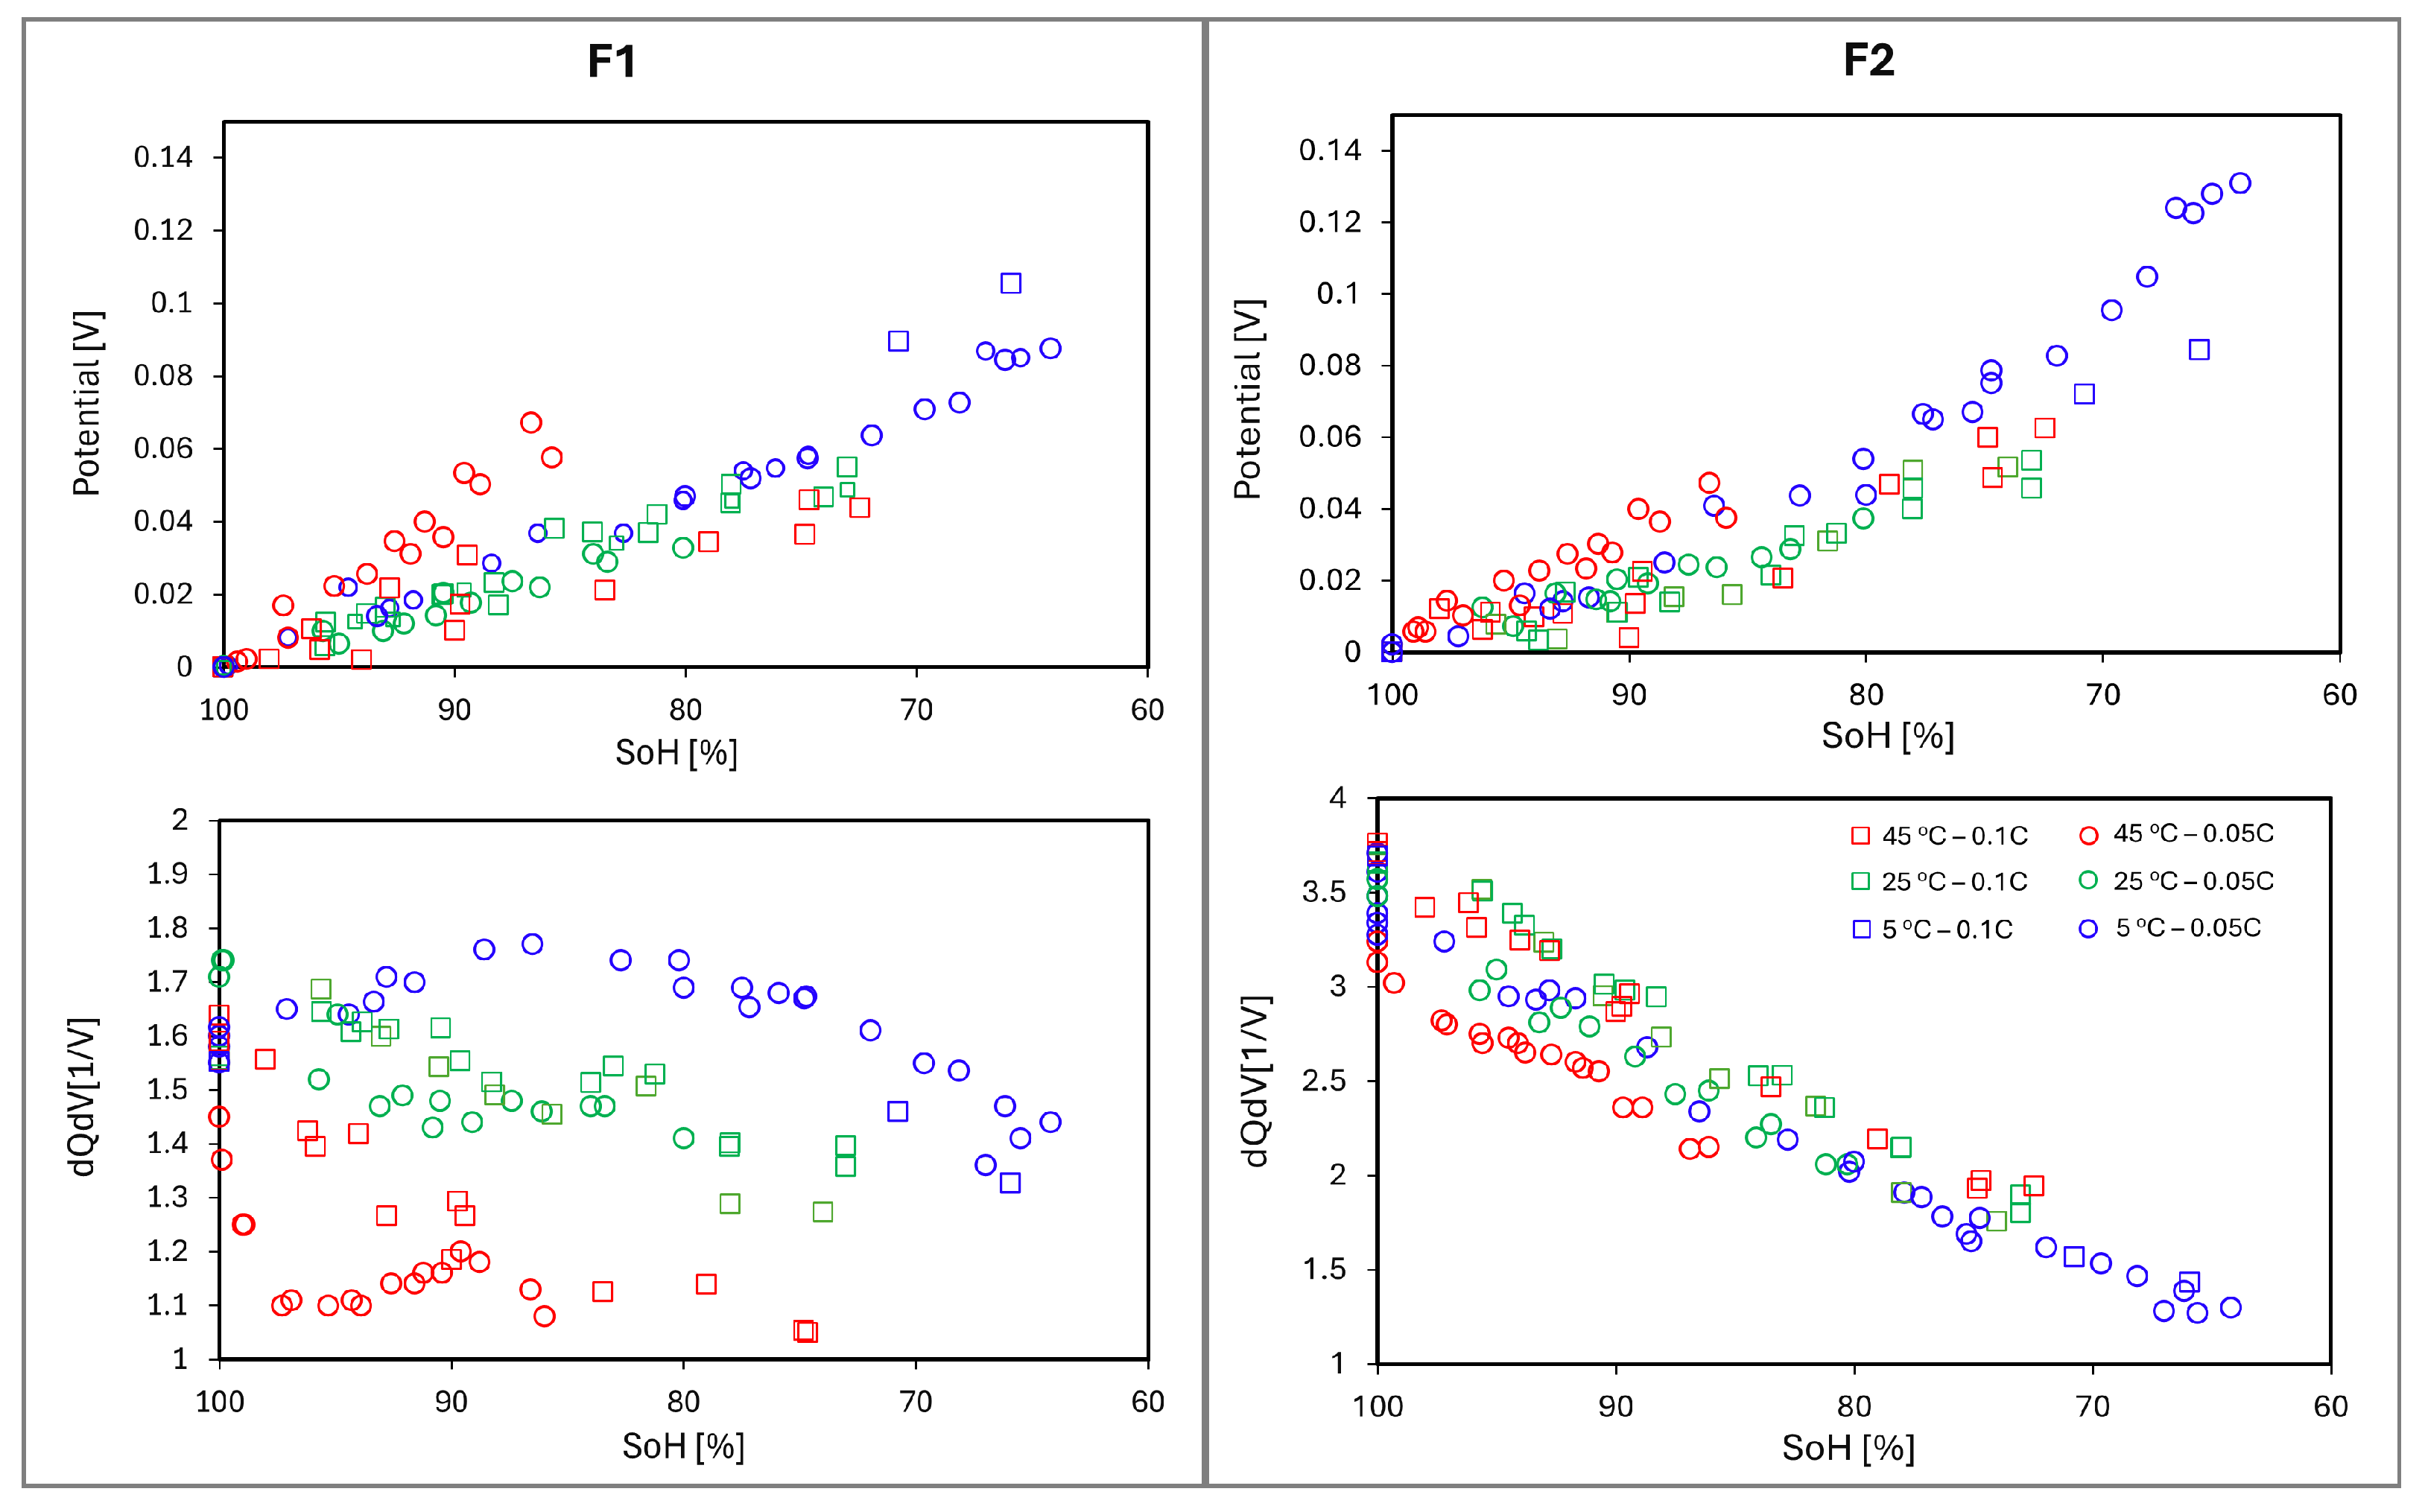
The data sets used to improve the validity of the results discussed in the main manuscript were collected over an extended period. It is worth noting that some earlier-recorded ICA curves were obtained at C/10 rather than C/20. In Figure A2, one can see first-life cycling data for cells where the ICA feature peaks are gathered at 25 °C at C/20 (circles) and C/10 (squares) and where the first-life ambient-air cycling temperatures were 5 °C (blue), 25 °C (green), and 45 °C (red).
Figure A2. Overview of 1st-life ICA and feature peaks (F1 and F2) obtained at C/20 (circle) and C/10 (square). In comparison to Figure 4, we have added ICA data recorded at C/10 as well as C/20 ICA data for a cell cycled at 5 °C.
Batteries 12 00121 g0a2
Generally, one can see that for feature F2, there is no significant difference in the dQ/dV or the potential (V) as functions of state of health (SOH) when examining the cycling temperature dependency. This also goes for the V value as a function of SOH for feature F1. It is for feature F1 and when looking at the dQ/dV value as a function of SOH that the results tend to group distinctly differently for the three different cycling temperatures, thus demonstrating an interesting feature for considering second-life usefulness.
Looking more carefully at feature F1 dQ/dV as a function of SOH, the higher cycling temperature (45 °C) leads to a more rapid drop for F1 dQ/dV data, the medium temperature (25 °C) leads to a slower drop in F1 dQ/dV values over time, and the lower cycling temperature (5 °C) leads to an initial slight increase and later lowering in F1 dQ/dV as a function of SOH.
In comparing the results in Figure 4 to Figure A2, we can see that the first-life feature peak coordinates as a function of SOH remain similar with respect to cycling temperature. However, this comparison is challenging because the ICA cycling rates (C/10 and C/20) lead to an adjusted voltage change due to the ohmic potential drop being slightly larger at C/10 compared to C/20. For the dQ/dV, this is even more complicated; however, generally and theoretically, the dQ/dV peak should have lower values when recorded at faster C-rates. The expected shifts in voltage and dQ/dV values when comparing C/20 to C/10 in this study appear random at best. Thus, it is not considered valid to discuss this point further here, other than stating that the temperature trends observed in Figure 4 are not significantly different from those seen in Figure A2, thereby increasing the conformity of knowledge drawn from Figure 4. The information with most importance for improving validity that is presented in Figure A2 compared to Figure 4 is the extra cell cycled at low temperature where the dQ/dV(SOH) trend is further verified.

Appendix C. Visual Inspection in Air

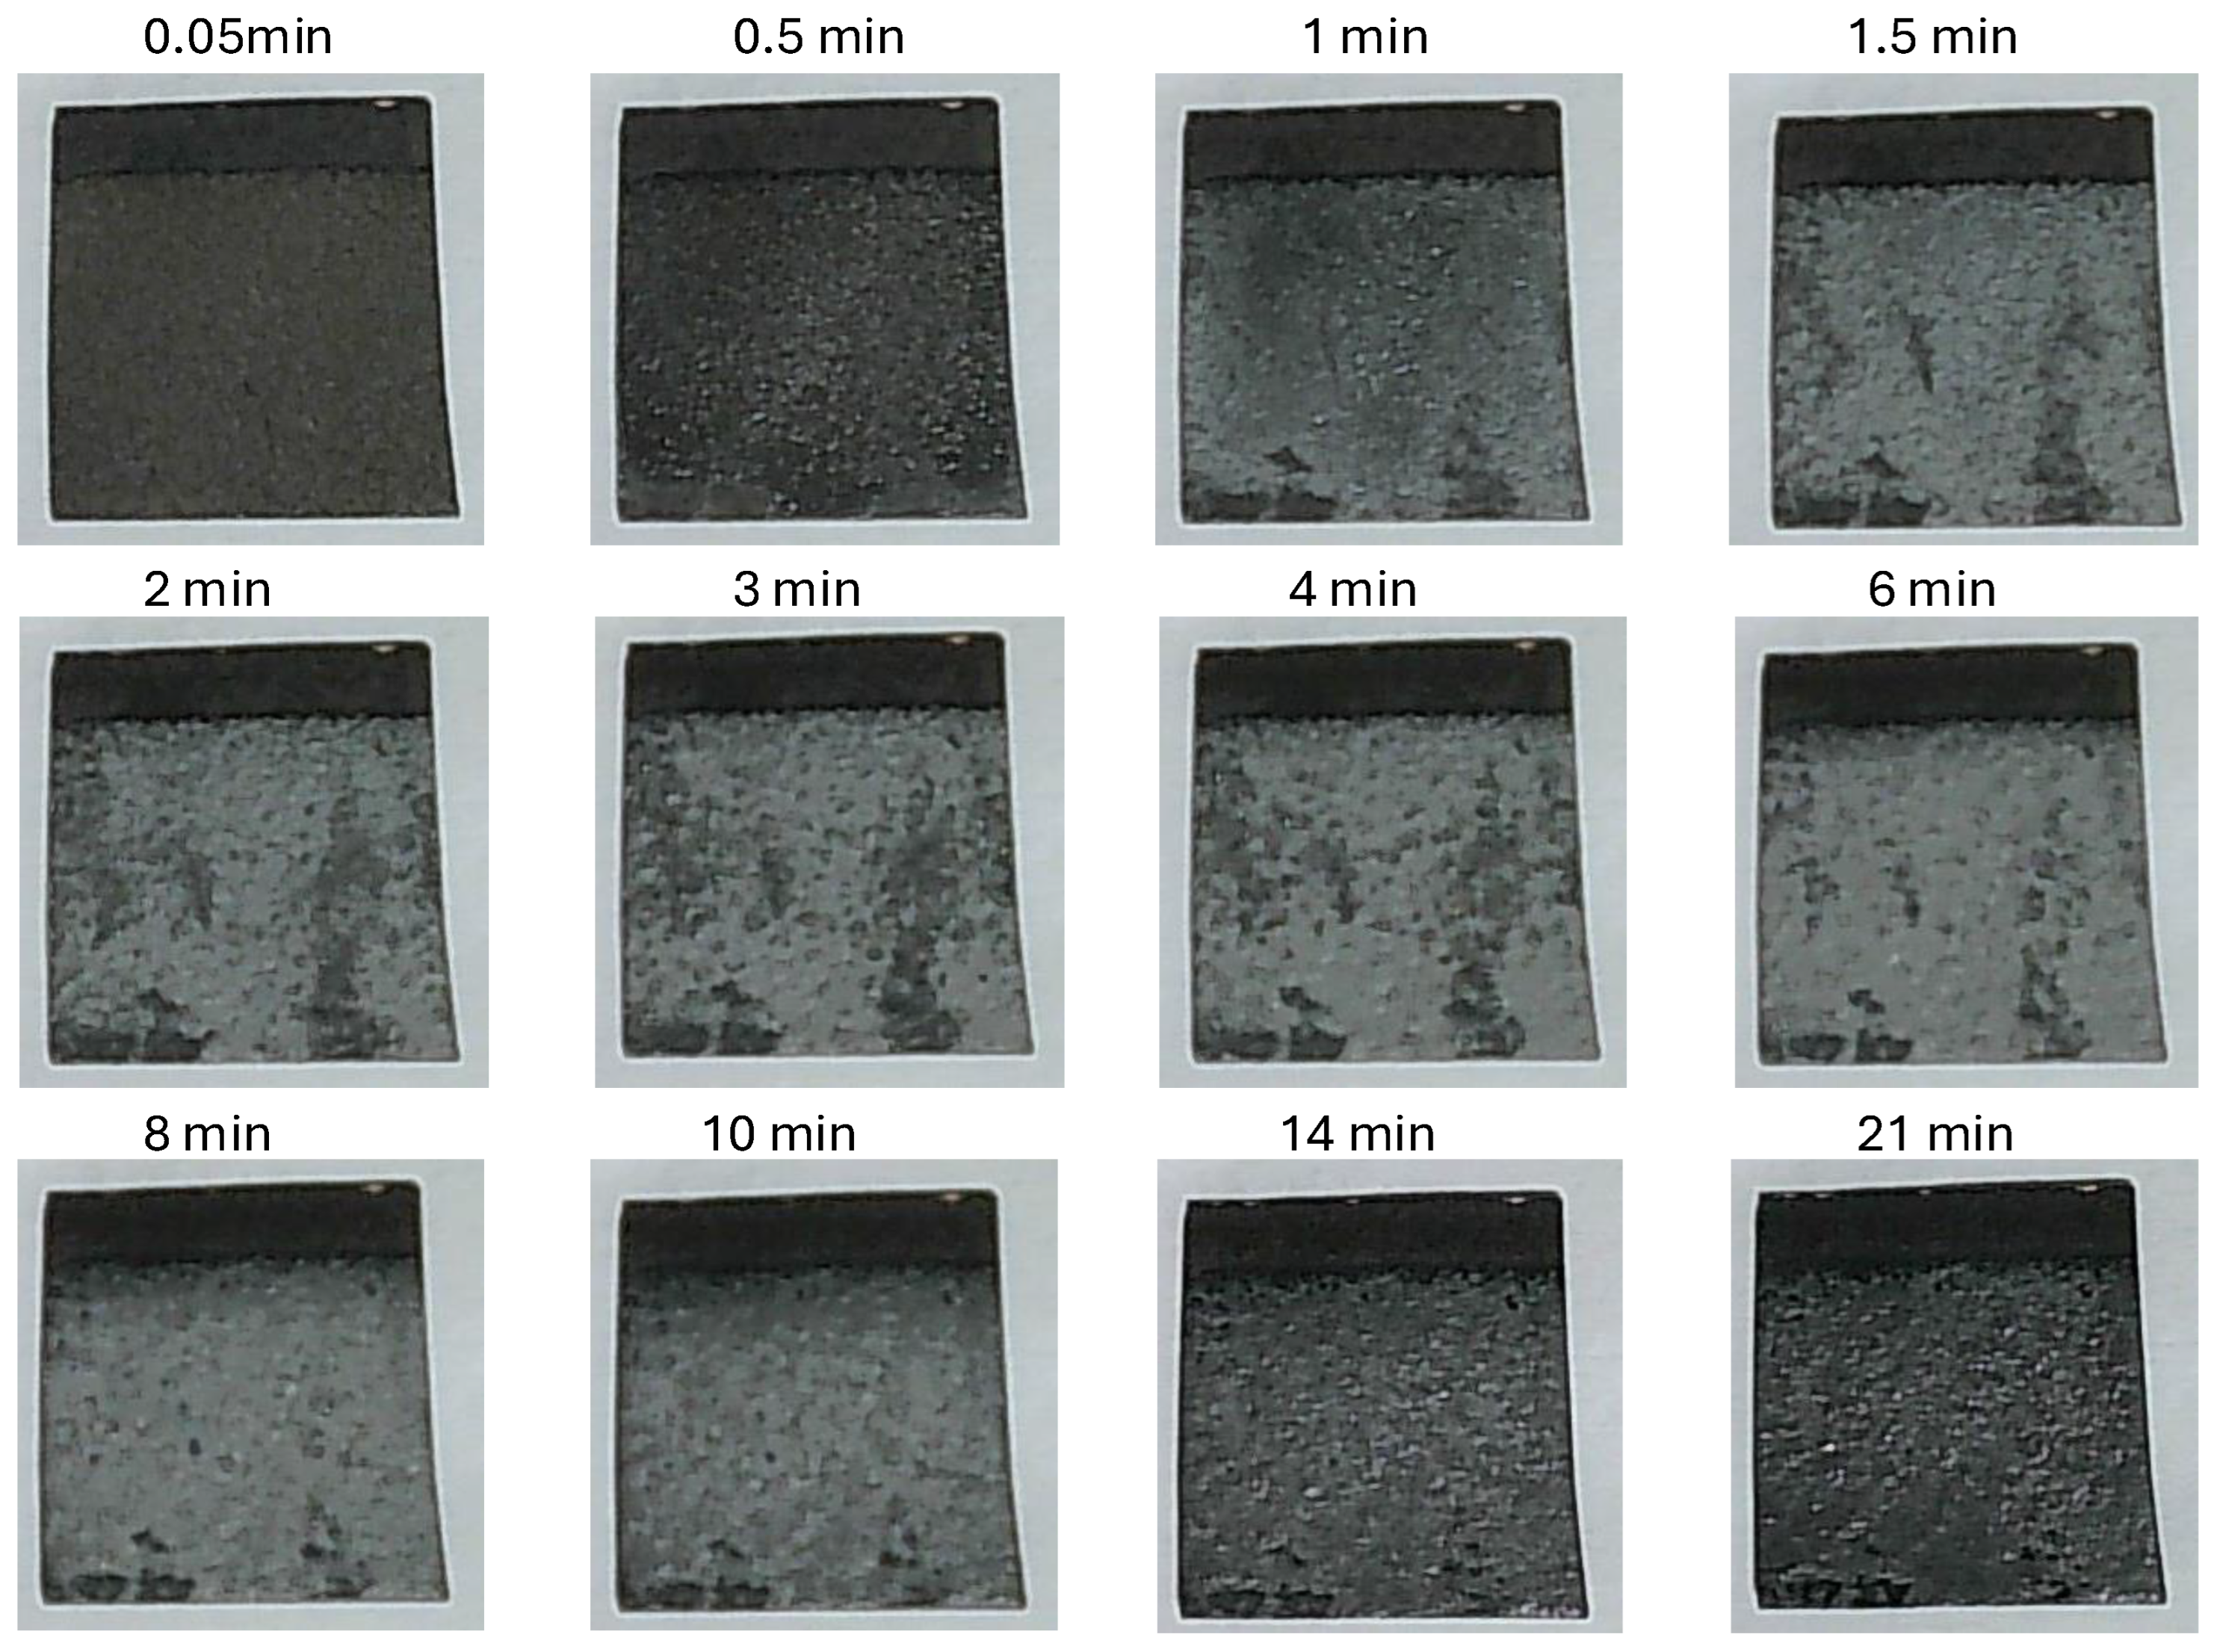
The anode of the cells cycled at 5 °C turned out to be very sensitive to air exposure. Depending on the air in the room, the time response differed a lot. In Figure A3, one can see the visual changes of the electrode at different air exposure times. The air in the room location where these images were captured was relatively still, and it is worth noting that under other air flow conditions around the sample the visual response was sometimes observed to be almost ten times faster.
Figure A3. Figure showing photographs of a piece of an anode exposed to air for different lengths of time. The electrodes are pieces of an anode (ca 15 mm by 15 mm) cycled at 5 °C, and the time stamps indicate air exposure times.
Batteries 12 00121 g0a3
Looking at the anodes taken from the 5 °C cycled cells, when in a glove box, one can clearly see the overhang of the anodes, i.e., the area that would not have been aligned within or covered by the cathode. This area was black, similar in appearance to an uncycled anode or an anode cycled at higher temperatures. The area covered by the cathode had a lighter colour, beige or light brown, and this colour changed a lot during air exposure, first turning light grey and then turning dark or almost black again. This rather reactive layer was included in the anode material ARC tests described in the main manuscript, although it was collected and placed in a sealed test holder using glove boxes.
The reactive layer described in this study caught the attention of the researchers participating in the study, and several attempts were made to understand or document the nature of this material. One experiment was to leave the electrodes in water and measure a lithium response electrochemically, see Appendix F. Other experiments involved transferring electrodes in argon from a glove box into an SEM-FIB-SIMS-EDX instrument, Appendix D, as well as an X-ray computer tomography (XCT) device.

Appendix D. SEM, FIB, EDX, and SIMS Example Investigations
In the main part of the manuscript (Section 3.5) a brief description of the electrode extended SEM investigation is provided, which was a result of a broader investigation. Here, a more detailed SEM investigation is described, whereby SEM is supported by the use of EDX, SIMS and/or FIB sectioning.
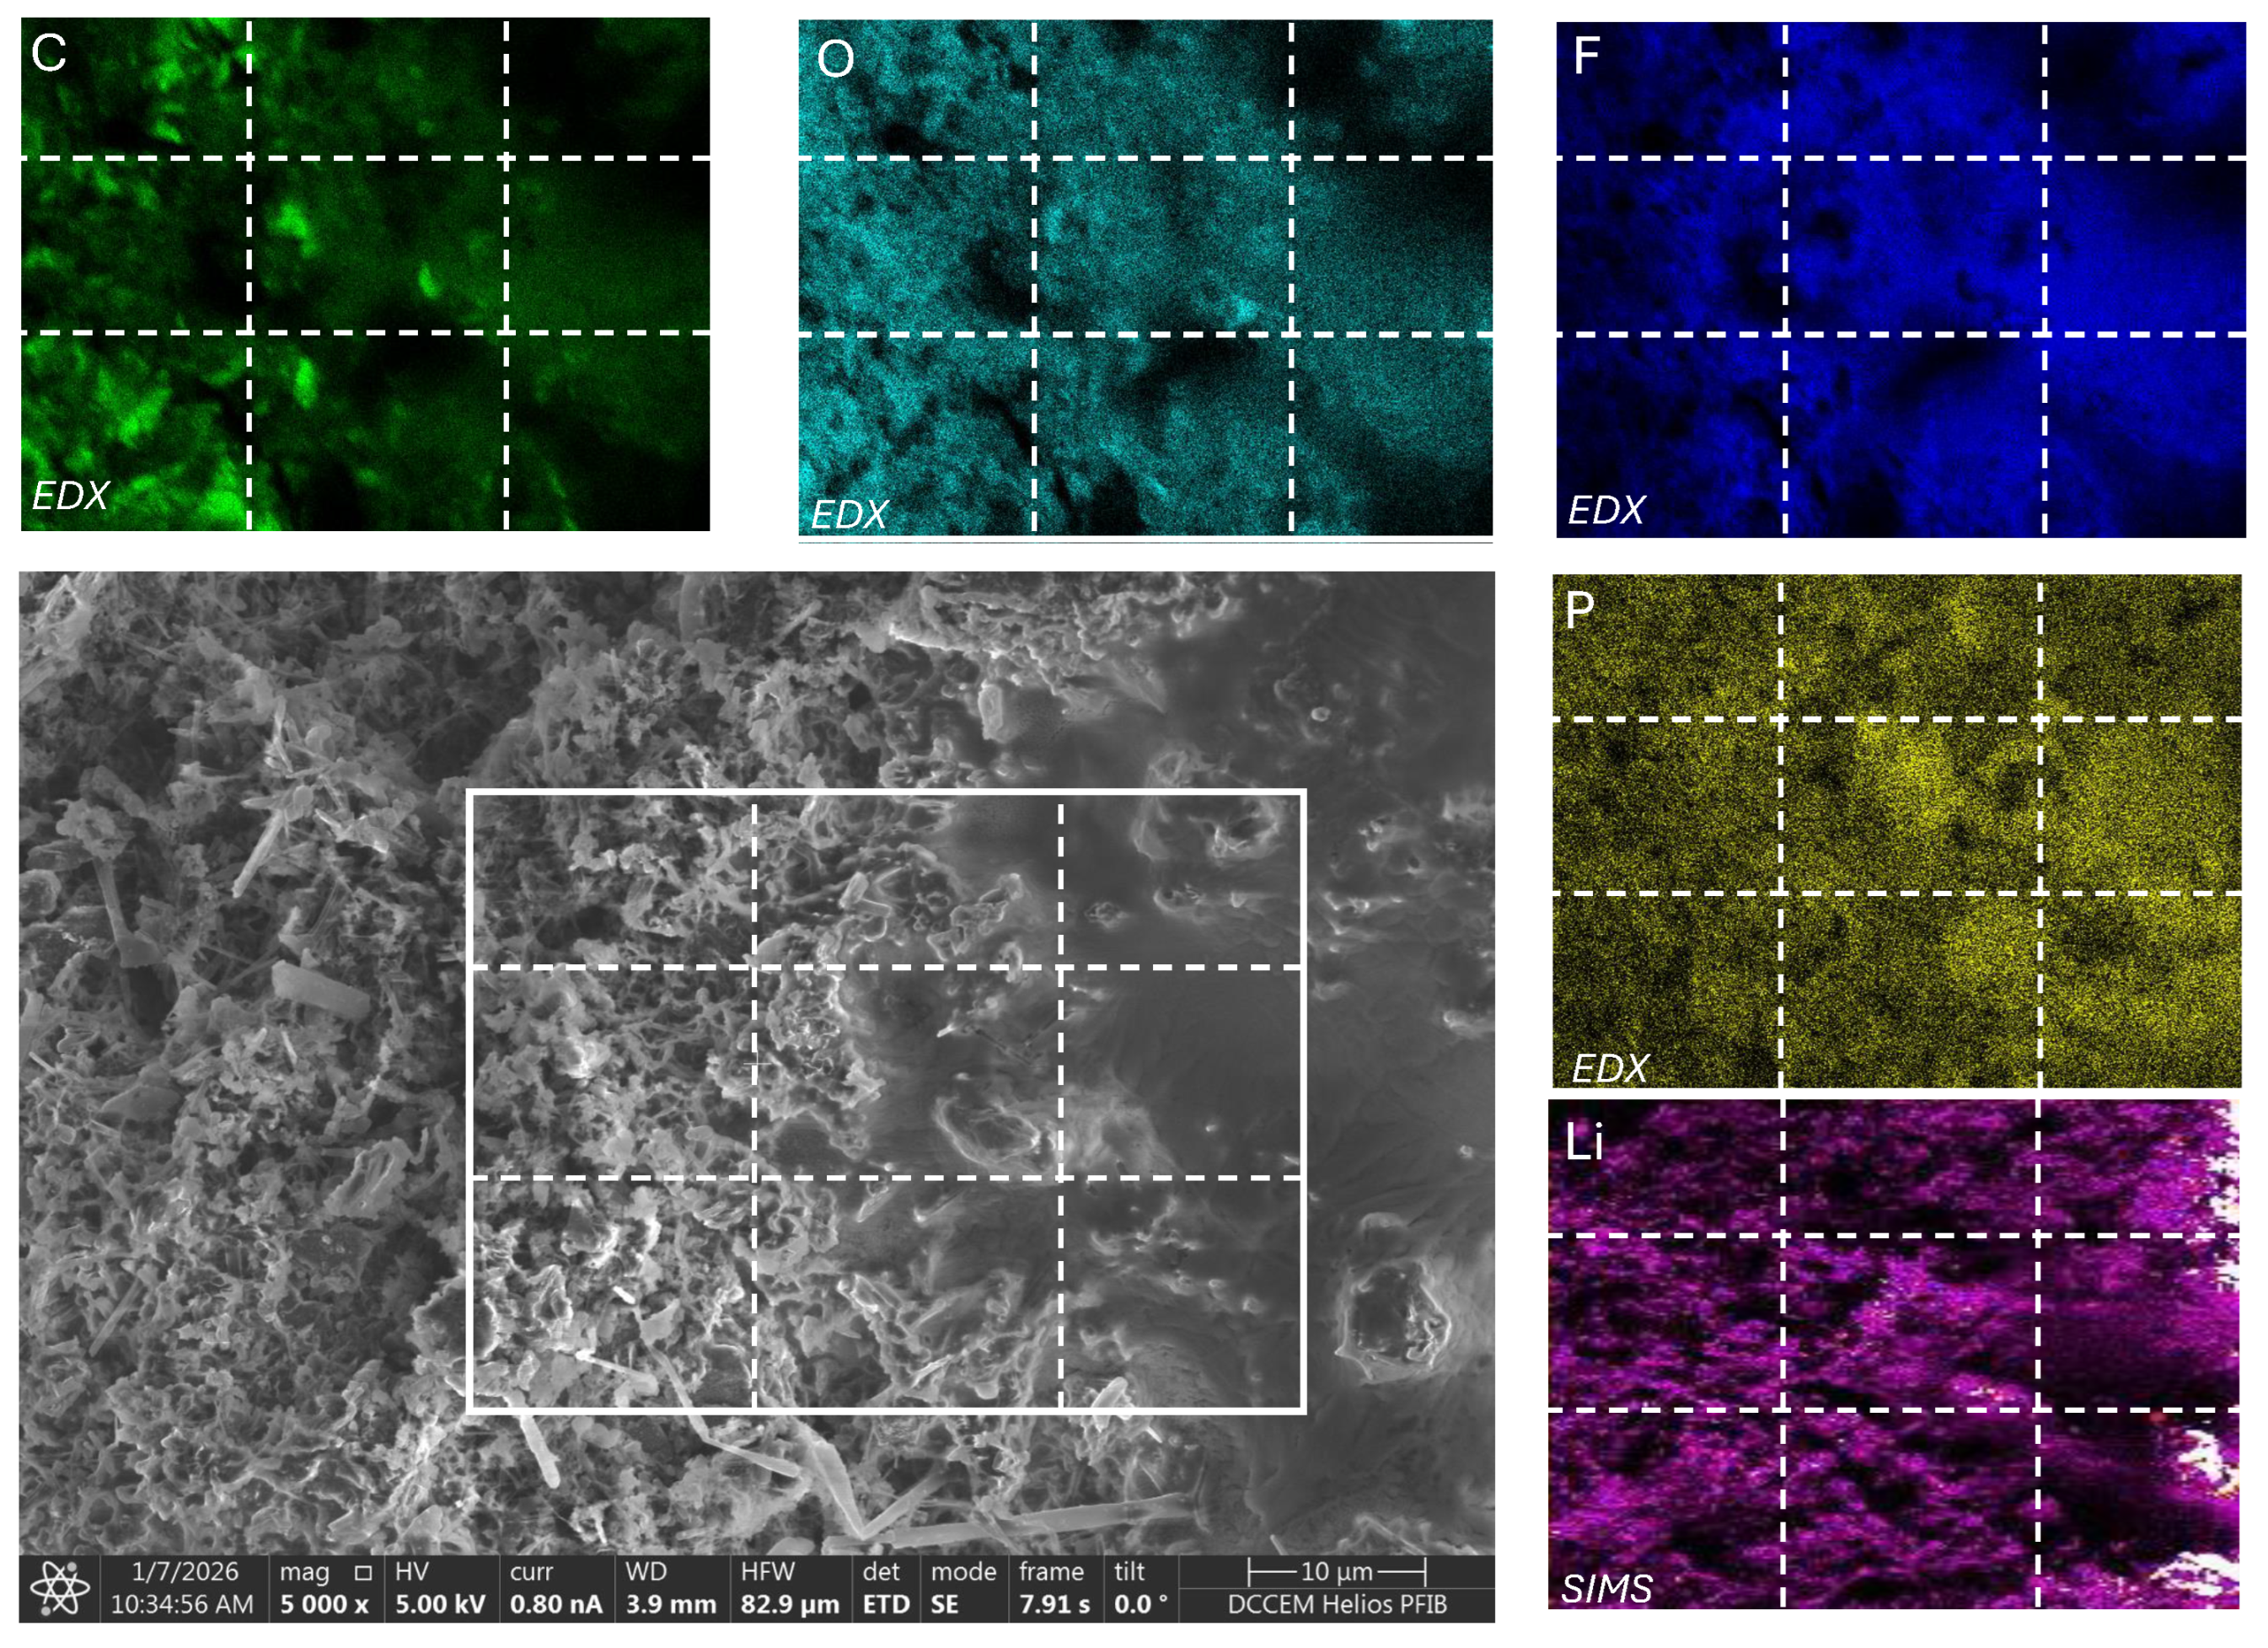
Looking first at the top view of the electrode in Figure A4, one can see the characteristic surface coatings, the porous crystal layer (type (ii)) and the smooth coating (type (iii)). To assist the reader in comparing the different graphics in Figure A4, dashed white grid lines are added consistently applied throughout the graphics. From EDX elemental composition analysis (excluding Li), it was found that the general composition of fluorine and phosphorus was very close to 6:1, indicating residual electrolyte salt, LiPF6, was present at the surface. It can also be seen that in the region where the type (iii) layer is present, oxygen appears to be absent. Oxygen can be seen as a sign of lithium deposits that, over time, have adsorbed and reacted with even the small amounts of oxygen in a glove box. Carbon is also observed in relation to the type (ii) layer. Generally, from the EDX mapping, it appears that the topography of the type (ii) layer gives a topographic shadowing effect on the left and the upper side of the structure sticks out slightly more. Where holes are absent (e.g., lower middle of the lower middle sections and the lower middle of the upper left section), the EDX signal also appears to be absent. This indicates that carbon is present in the crystalline layer characteristic of type (ii). As such, it is difficult to argue that the type (ii) layer is lithium metal alone; it could also be lithium–carbon that is oxidised to hold oxygen. Examination by FIB and SIMS can provide further details on this. Thus, this is a point of discussion that needs to be understood from the FIB milled cross-section inspection discussed in the following paragraphs.
The smooth type (iii) coating appears to weaken the signal of all elements, suggesting this layer is neither of the investigated elements. The lack of response for all four elements in the type (iii) layer makes it very difficult to assess what this is. It could be electrolyte organic solvent compounds; however, this should then also include the electrolyte salt (LiPF6), which is simultaneously less visible. It was noted that this type of layer would react to become porous and cracked when exposed to the electron beam for a longer period or at a higher intensity, further suggesting that this could be an organic material, for example electrolyte solvent.
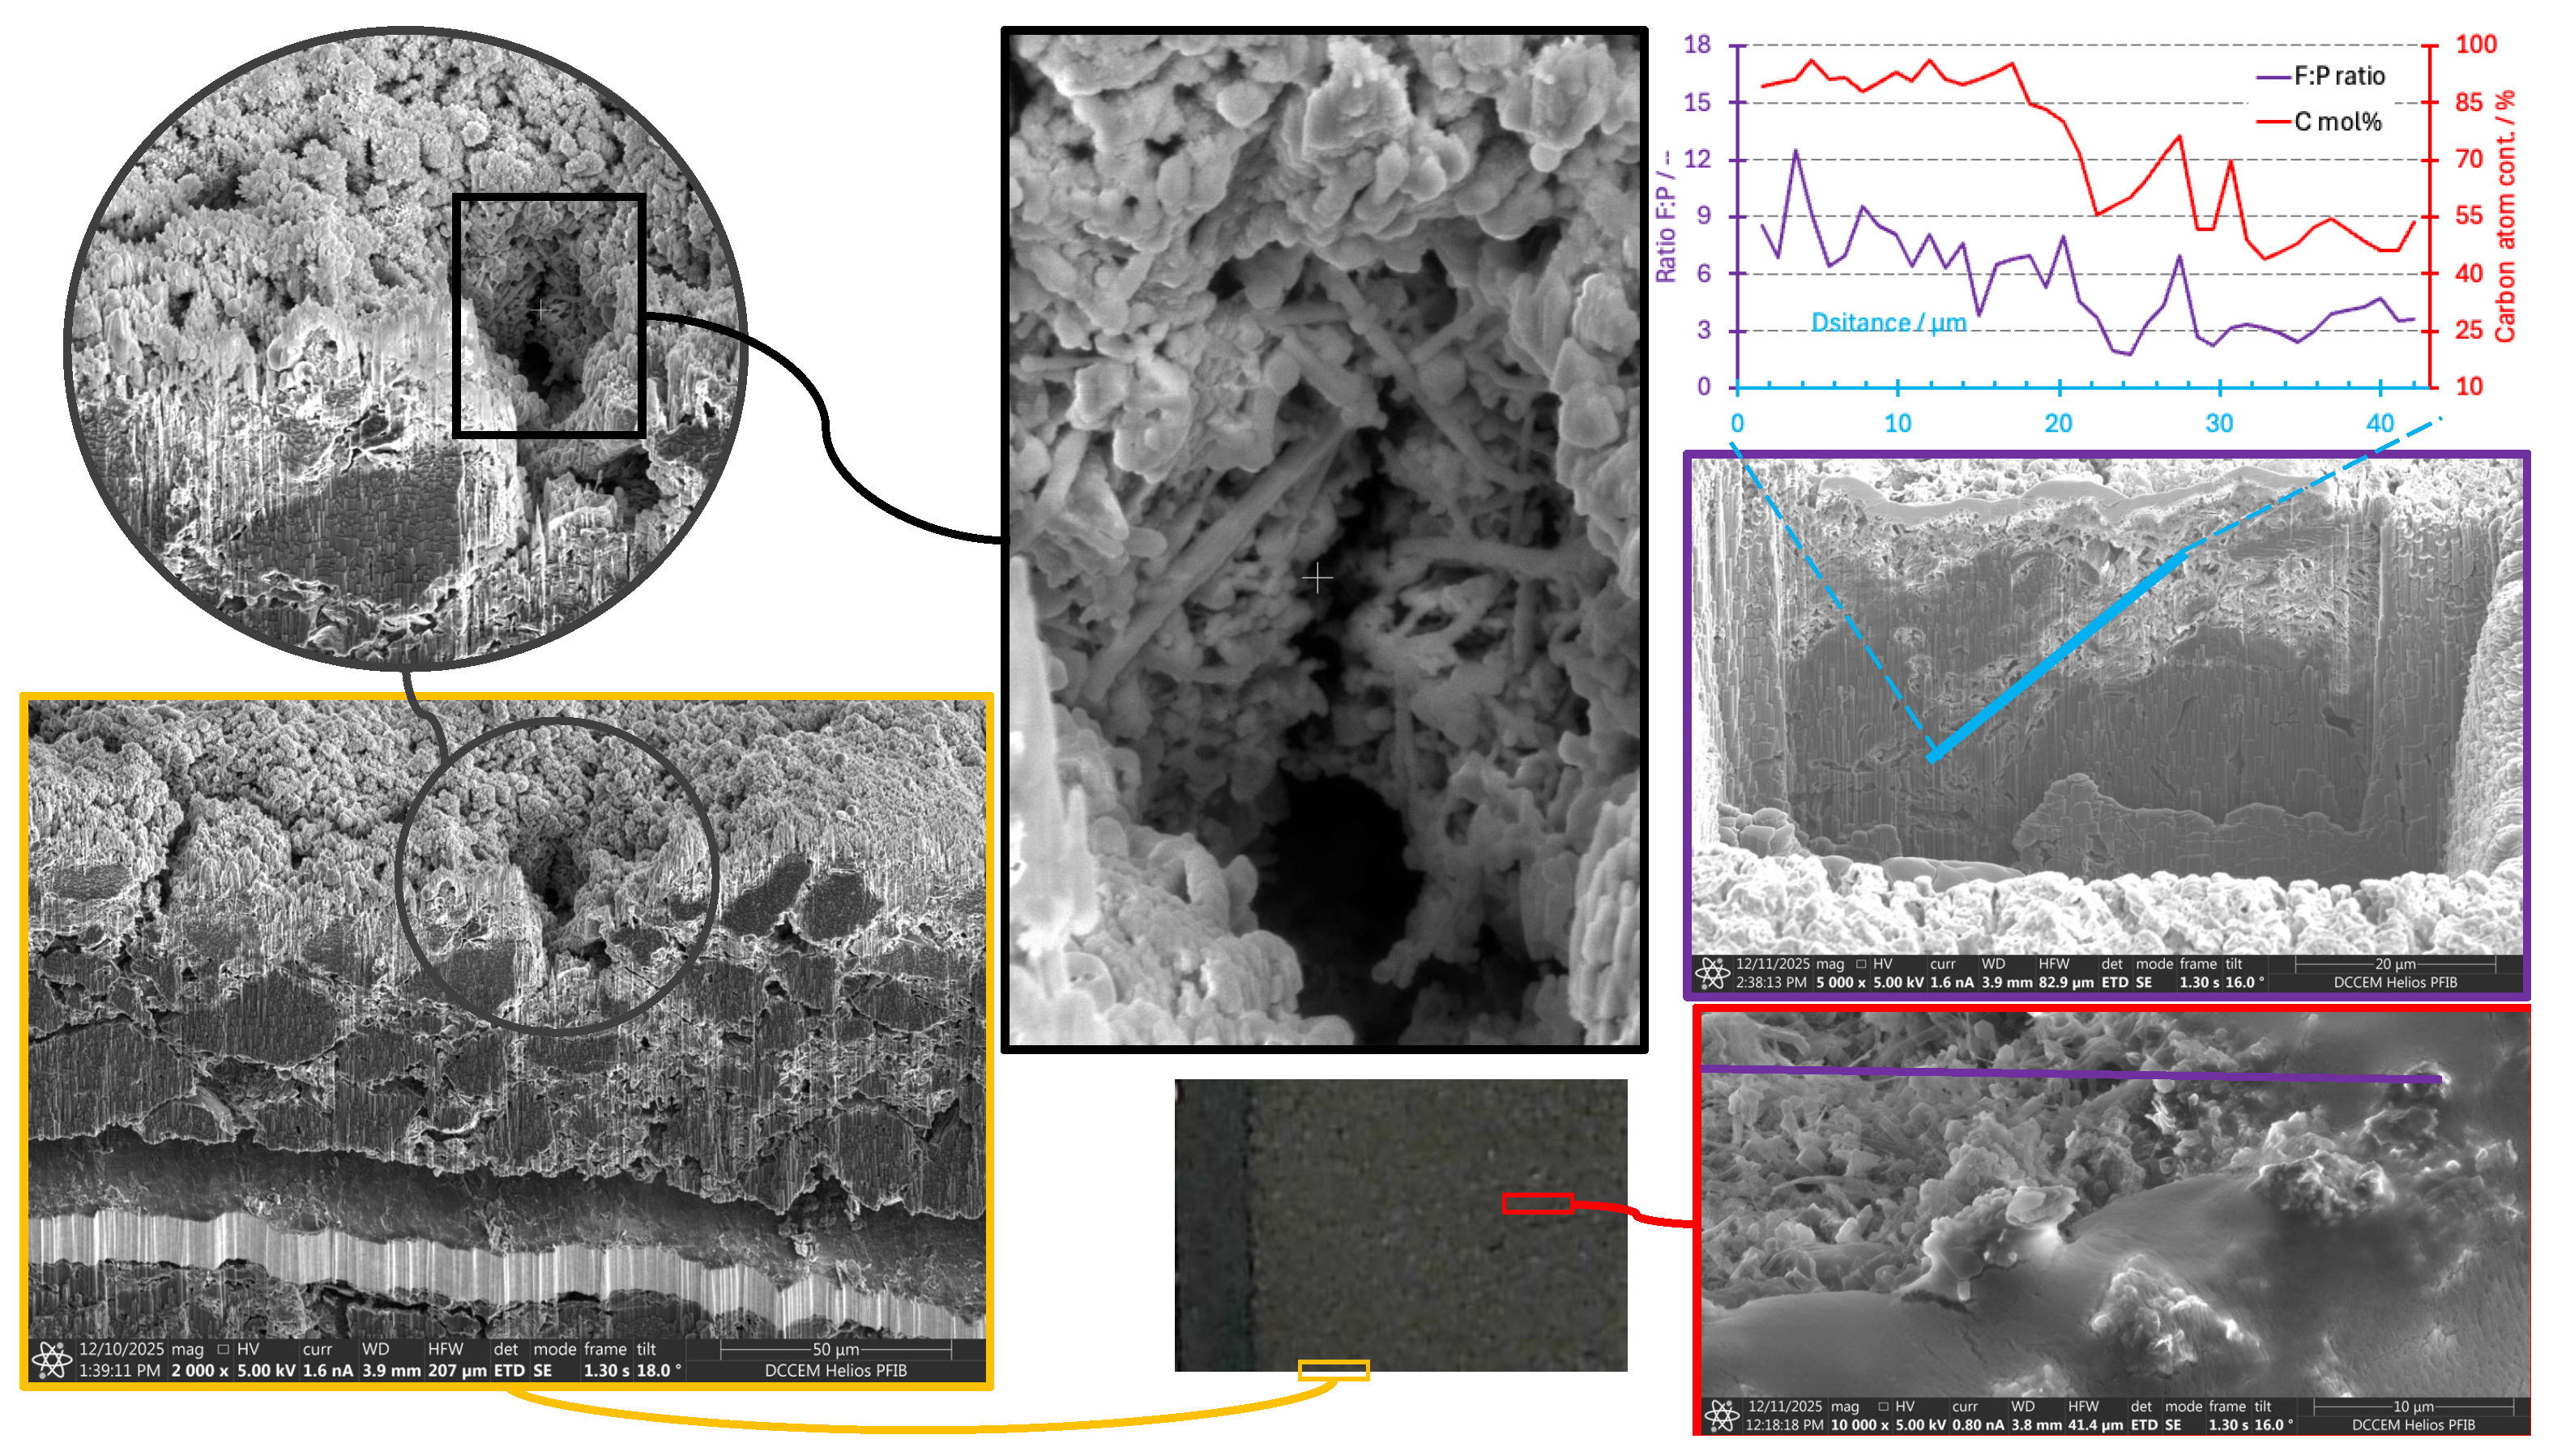
Having investigated the surface topography and composition, the study further delves into the subsections underneath. This is done via FIB etching and the use of EDX and partly SIMS. Looking at Figure A5, one can see a picture of piece of an anode (similar to those in Figure A3) in the lower centre. Two places were investigated: along the edge (yellow frames) where the piece was cut out of the anode sheet, and an area well into the material where it was unaffected by the cutting (red frames).
Looking at the edge investigation (yellow- and black-framed images in Figure A5), one can see that the material cutting has led to delamination, as well as being covered by the type (ii) layer. One can see that the hole in the electrode (likely from the manufacturing) has a very different type of crystal pattern from the surface, as discussed previously. It follows that the surface structure in this image is covered by the FIB redeposition of sputtered material, so the type (ii) top view crystals no longer appear with their original structure, now being more volumetric in shape. Those in the pit or hole are shielded from this scatter and have retained their more needle-like shape.
Figure A4. SEM micrograph of a typical top view of the anodes cycled at 5 °C (lower left), 4 EDX elemental intensity maps for carbon (C), oxygen (O), fluorine (F), and phosphor (P), and a SIMS lithium (Li) intensity map.
Batteries 12 00121 g0a4
Looking at the micrographs taken well into the material (red- and purple-framed pictures in Figure A5), one can get a view of both the top view (red frame) as well as the cross-sectional view (purple frame) of the material. In the top view, the purple line indicates the site of the FIB cross section. Prior to milling, a block of platinum was deposited to preserve and protect the surface detail in the cross section. The platinum deposit can be recognised in the purple frame image and as a grey line on top. In the cross-sectional view, it can be seen more clearly how the type (ii) surface layer has grown in what were initially empty surface pores. An EDX line scan was taken along a pore from relatively deep into an area that is clearly coated with a type (ii) layer. This line scan is indicated using a blue line, and it was approximately 45 μm long. The elemental composition was then plotted in the graph in the uppermost right corner of Figure A5. This plot shows the ratio of fluorine to phosphorus (F:P in purple) as well as the carbon content (red line). In the lower part of the pore, one can see more than 80% carbon, which reflects less than 20% porosity for carbon. One can also see that this region has a presence of fluorine that is much higher than 6 (consider PF 6 ), and this can be attributed to a mixture of carbon black and fluorine rich binder, like PVDF. In the region where the pore was likely more open, deposits of LiPF6 salt can be considered, given that the fluorine–phosphorus ratio is closer to 6. At the outer end of the pore, one can see that the type (ii) surface layer is predominant. Using SIMS and EDX, this layer was rich in both lithium and oxygen. One can also see that this layer is rich in carbon, so it is not solely lithium or oxidized lithium.
Figure A5. SEM views of sections subject to FIB milling and EDX/SIMS investigation. Images on the left show FIB milling into an edge of an anode sample. Images of the right show a surface FIB milled section (lower) with indication of the line area subject to FIB front (purple line) and the through-plane section SEM view (right middle purple frame), where in turn an EDX line scan through a pore (blue line is indicated) and atomic percentage of carbon (red) and F:P molar ratio (light purple) are further plotted graphically (upper right).
Batteries 12 00121 g0a5
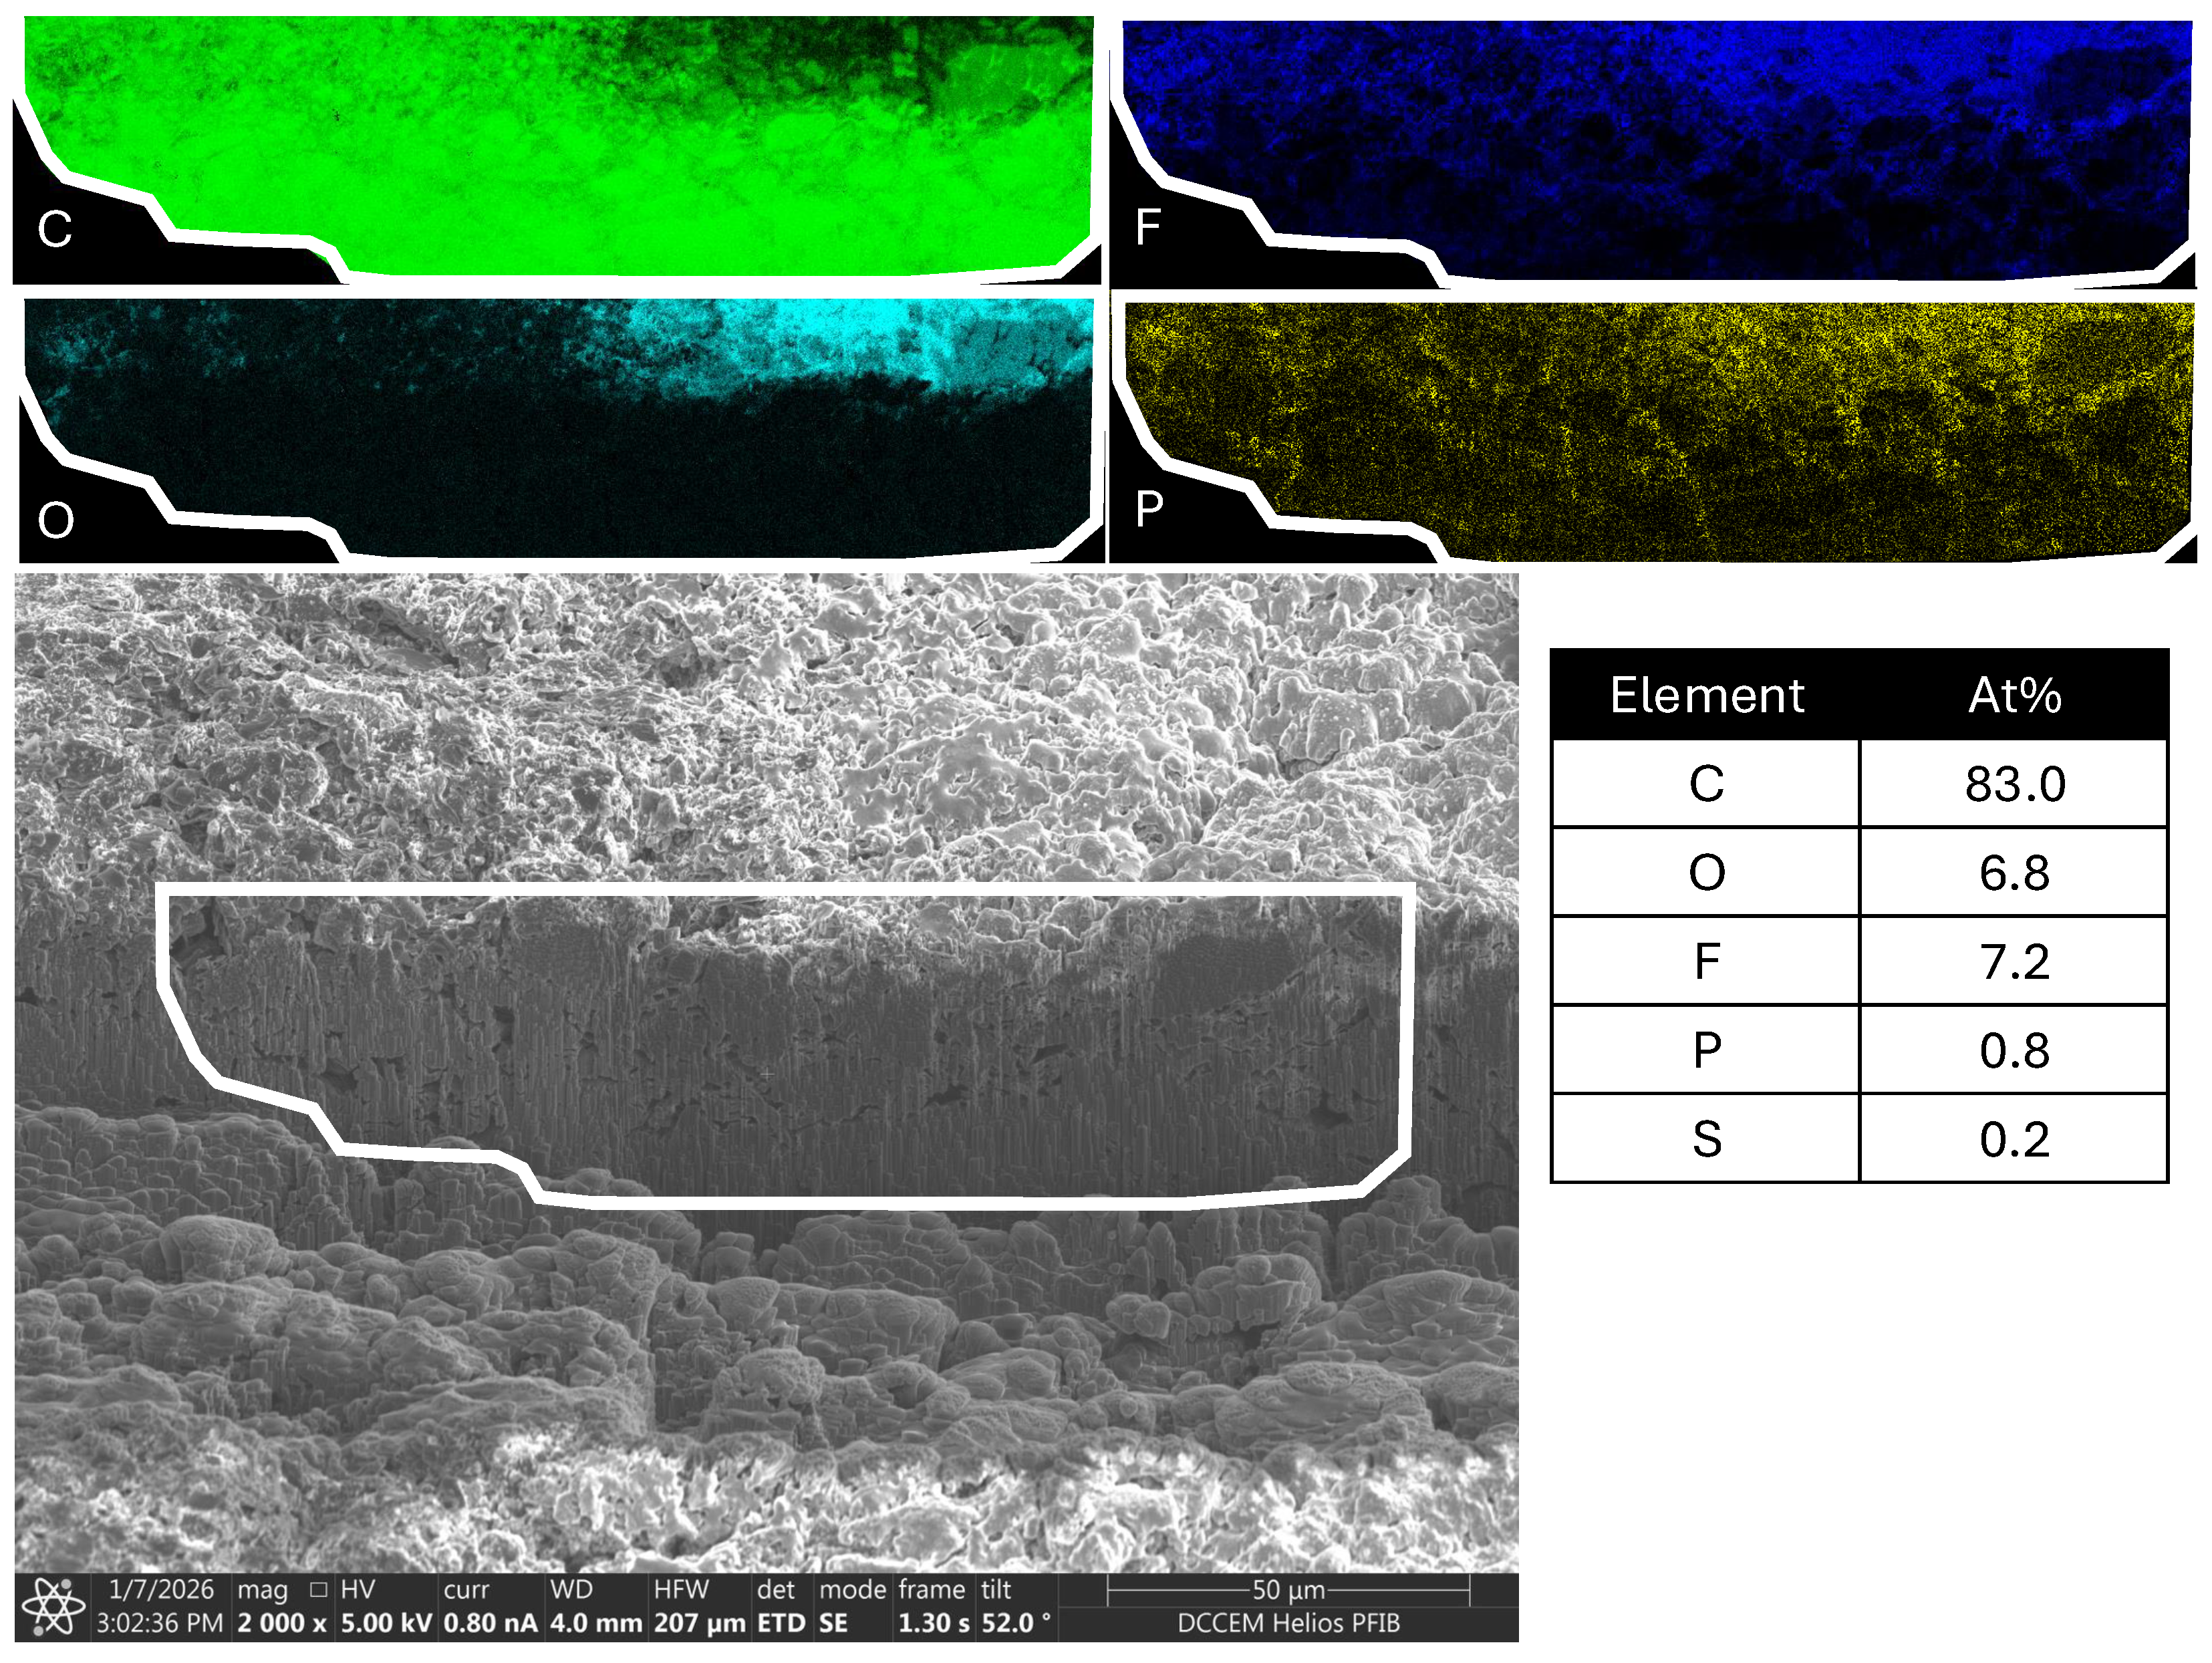
Here, we provide further documentation for some of the statements given in relation to Figure 6, the transition zone between type (i) and type (ii) surface characteristics. This is the transition zone between the anode overhang and cathode underlying anode, and it is shown here with EDX maps and as a table. This can be seen in Figure A6. The SEM micrograph (same section as in Figure 6) indicates the EDX mapped region using a white line that can also be seen in the elemental intensity pictures. The first thing to note is how strong the linkage is between the type (ii) coating and oxygen and inversely so for carbon. Recall the discussion from five paragraphs above in relation to the top view of Figure A4 around the visibility of carbon and other elements. In the combination of Figure A4 and Figure 6, one can conclude that the top view carbon signal is essentially from the EDX signal penetrating though the surface coating, making carbon seemingly appear together with oxygen and, likely, also lithium, which is thus not the case. In fact, from views of FIB milled cross sections, supported by EDX and SIMS oxygen coincides with lithium and oppositely so with carbon. Oxygen and carbon appear to be not simultaneously present. Fluorine and phosphorus have a similar trend. It is therefore important to display local composition as well as the overall average elemental composition, and to point out the relationship between fluorine and phosphorus and how close their stoichiometric ratio is to 6. This is an indication that LiPF6 is present in the type (ii) surface layer. It can also be seen that this ratio is present well into the pores in the deeper layers of the anode; however, it occurs much more in the type (ii) surface layer, which also coincides with the presence of oxygen.
Figure A6. SEM micrograph of a region subject to FIB milling, where the anode overhang transcends into the cathode underlying area, corresponding to Figure 6. EDX intensity plots of relevant elements are also shown. A tabulated overview of EDX-scanned total atomic composition is also shown.
Batteries 12 00121 g0a6

Appendix E. XCT Visualisation and Porosity

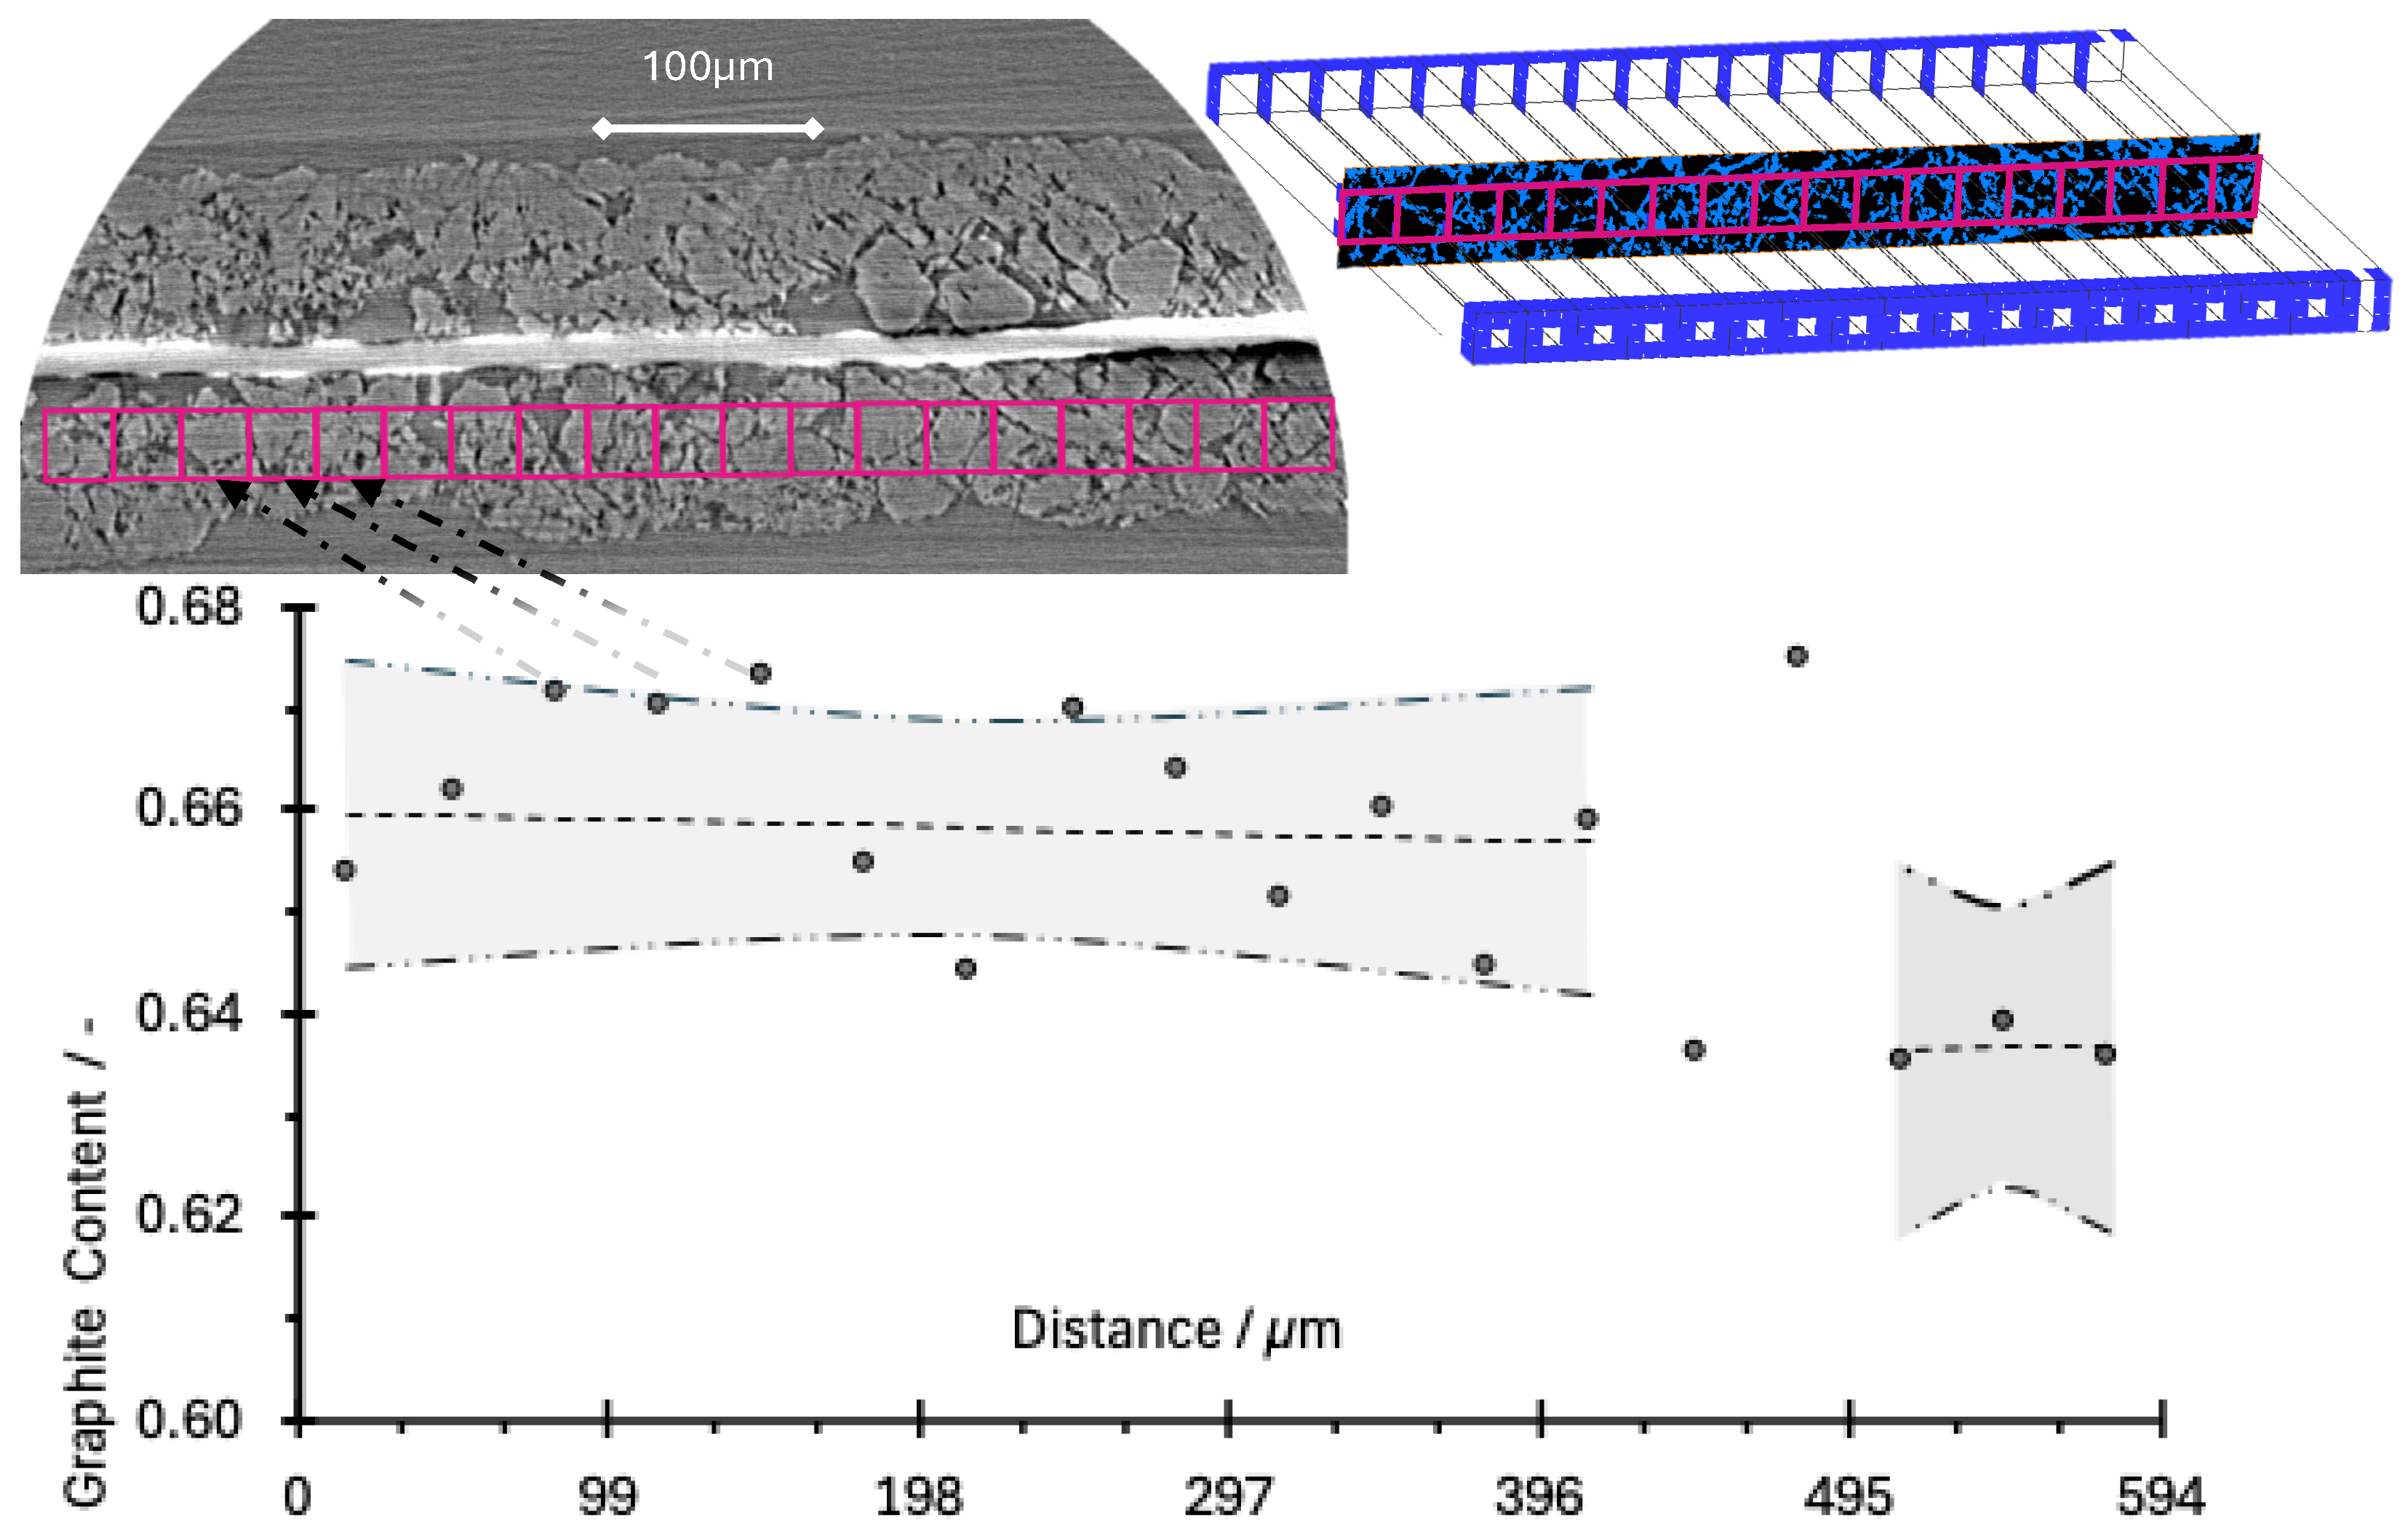
As described in the main section, the porosity of the overhang region appears to visually differ from the part of the anode overlayed by the cathode. Using XCT, it is possible to quantify the volume fraction of the active graphite material and thus make considerations about the state of the graphite particles in the two regions. This is because the resolution of the XCT is not sufficiently fine to include detecting carbon black and binder materials. Figure A7 shows how this is done in volumetric boxes in parallel with the overlay–overhang transition edge zone. The volumes analysed for graphite filling degree consisted of over 10.5 million (1151 × 100 × 92) voxels (ca 500 × 33 × 33 μm3), creating a high degree of accuracy for each data point. The smaller variation between each volume is assumed to be natural variation between them. Moreover, if considering that there is a transition zone and dividing them into two, Figure A7 indicates that there are two regions with fairly constant graphite fillings. One can see that this is a distinct shift around 450 μm in the graph in Figure A7, but one can also see that this shift is challenging to argue the significance of, at least with a sigma two (95%) confidence.
Furthermore, porosity in a classical sense of gas volume is not actually possible using the present XCT resolution. If considering a solid content of 66%, it would indicate a porosity of 34%. This is however not the case, as the reported graphite content of Figure A7 only accounts for graphite (active material) and not for other materials (binders and carbon black). If, however, approximately 10% additional solid volume is added by these other materials in the anode (pristine), graphite (only) contents of 62, 65, and 68% would correspond to electrode porosities (graphite, carbon black, and binder) of 32, 29, and 25%.
Figure A7. The graphite volume counting. To the upper left, an XCT cross-section reconstruction is shown while indicating the voxels used for the volumes (upper right) that in turn provide the graphite volume content shown graphically (lower).
Batteries 12 00121 g0a7

Appendix F. Lithium Leaching

For the cells cycled at 5 °C, we saw an extremely fast loss of capacity under cycling and that a distinct layer (particularly type (ii)) is formed on the top of the anode. We have also observed that this layer increases reactivity. As this material can not decisively be concluded to be lithium metal, however lithium rich it is. We are curious to see whether it deviates from metallic lithium in other ways too. The comparison between lithium metal and the type (ii) layer reported in this study involves placing lithium metal and the anode sheets in separate water solutions and then measuring the dissolved lithium concentration by detecting the potential using reference electrodes.
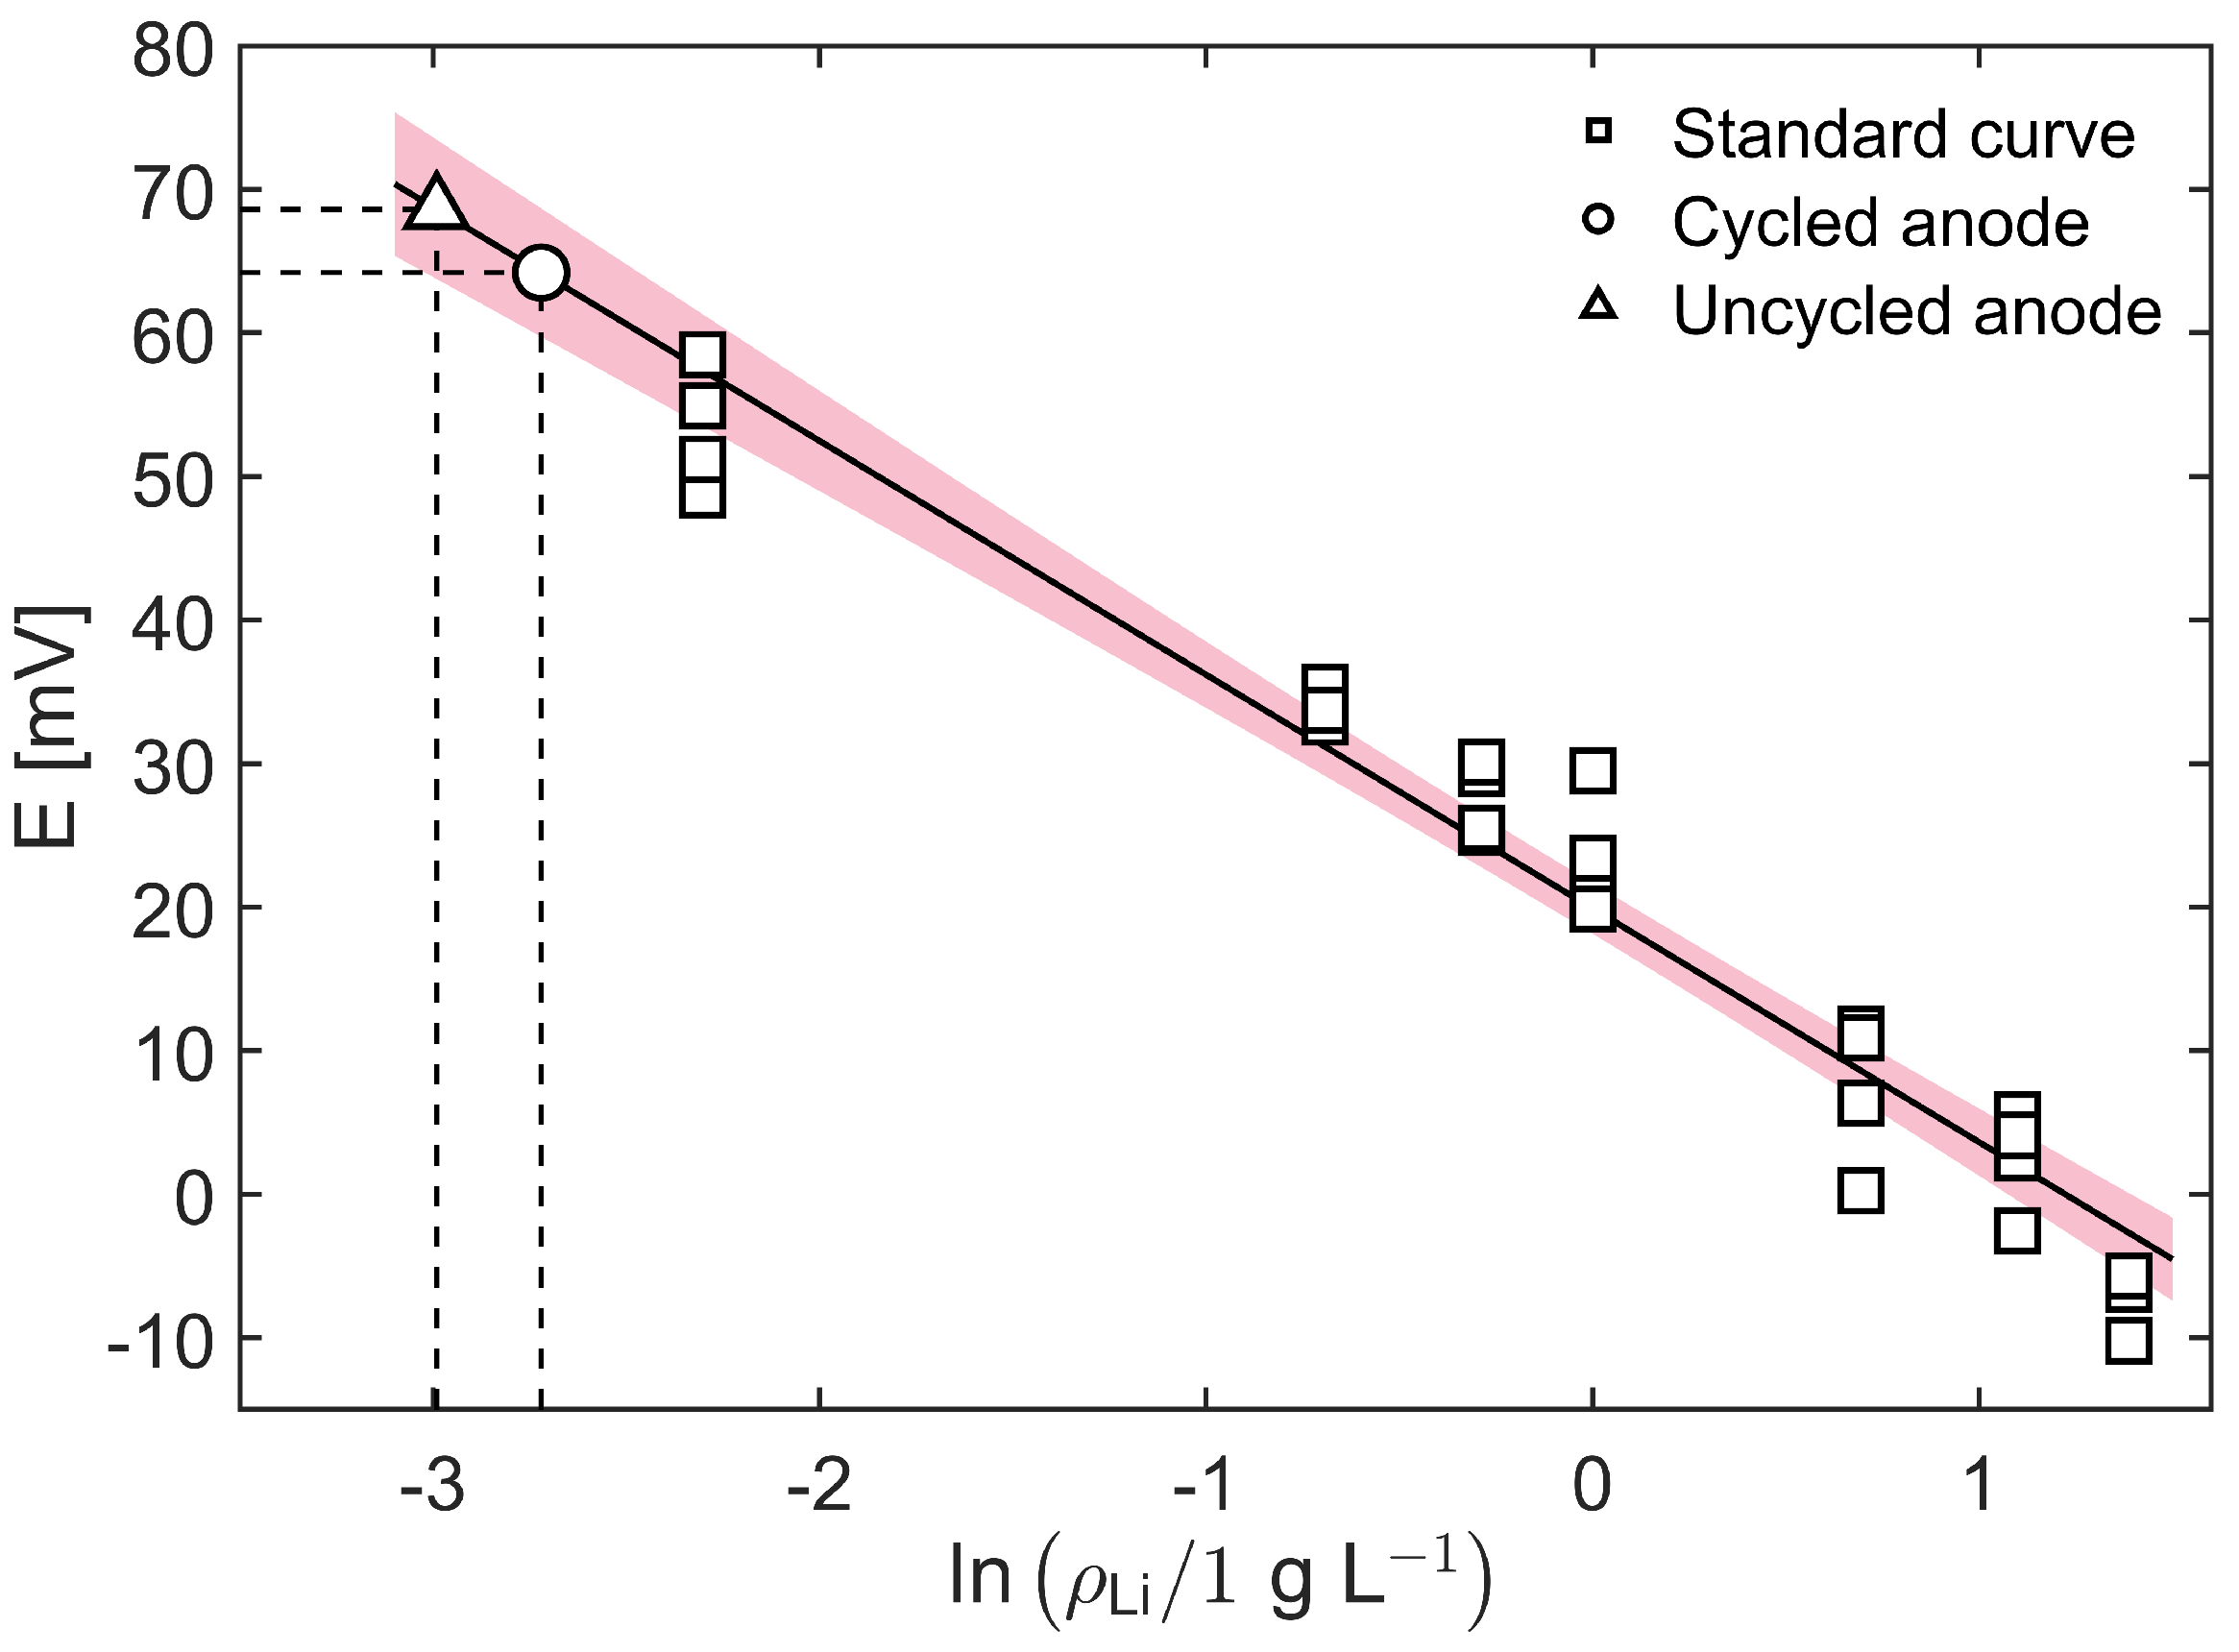
All voltage values measured for standard solutions and solutions obtained from dissolving lithium plated on anode sheets are shown in Figure A8. Using a standard regression curve fitted to the voltage results at known concentrations, the concentrations of the unknown samples are estimated. The lithium concentration amount recorded (from the concentration) by immersing the double-sided anode in water for the uncycled cell was 1.65 mmol. For the cycled anode sheet, the recorded amount of lithium was 1.91 mmol. This means that the amount of lithium released to water caused by the cycling at low temperature (by immersing a double-sided anode sheet) was around 0.26 mmol.
If the battery has 31 Ah capacity, 34 double-sided anode sheets, and all LLI plates as metal on the anode, then a double-layered anode aged to 65% SoH should leach 68.0 mmol more lithium compared to the uncycled sheet. In the present case, we observe that the amount of lithium released in relation to the ΔSoH was just above 1% of what it maximally could have been. Since we do not see much lithium release during the water immersion of the anode compared to the ΔSoH, we reason that we cannot argue that the deposited type (ii) layer material on the anode is classic lithium metal plating.
From the results presented in this section, it appears that the deposited layer is not metallic lithium. This, however, does not mean that the layer does not contain lithium. The deposited layer could, for example, be lithium organic compounds, where lithium is chemically bound to carbon and hydrocarbons, as often seen in SEI layers. With the available tools, we have not been able to trace where and in what form the lost capacity of the cells cycled at 5 °C ended up. It is not unreasonable that a large portion of this lithium ended up trapped in the observed type (ii) layer; however, the results of this study are not suited to documenting it quantitatively or confirming that it is metallic lithium.
Figure A8. The measured voltage, E, of the Li+ selective electrode vs. Ag/AgCl as a function of the mass concentration of Li, ρ Li . A standard regression curve (solid line) with a 95% confidence interval (red shaded area) fitted to measurements with known concentrations (squares) is shown. The regression curve, given by E = 20 16 ln ρ Li , is used to estimate the Li concentration in solutions obtained from cycled (circle) and uncycled (triangle) anode sheets. Dashed lines show the measured values for the unknown concentrations.
Batteries 12 00121 g0a8

References

  1. International Energy Agency (IEA). Batteries and Secure Energy Transitions. 2024. Available online: https://www.iea.org/reports/batteries-and-secure-energy-transitions (accessed on 18 February 2026).
  2. Shahjalal, M.; Roy, P.K.; Shams, T.; Fly, A.; Chowdhury, J.I.; Ahmed, M.R.; Liu, K. A review on second-life of Li-ion batteries: Prospects, challenges, and issues. Energy 2022, 241, 122881. [Google Scholar] [CrossRef]
  3. Martinez-Laserna, E.; Gandiaga, I.; Sarasketa-Zabala, E.; Badeda, J.; Stroe, D.I.; Swierczynski, M.; Goikoetxea, A. Battery second life: Hype, hope or reality? A critical review of the state of the art. Renew. Sustain. Energy Rev. 2018, 93, 701–718. [Google Scholar] [CrossRef]
  4. Farrington, M.D. Proposed amendments to UN ST/SG/AC.10/11: Transport of dangerous goods—Lithium batteries. J. Power Sources 1999, 80, 278–285. [Google Scholar] [CrossRef]
  5. Shen, H.; Zhang, Y.; Wu, Y. A comparative study on air transport safety of lithium-ion batteries with different SOCs. Appl. Therm. Eng. 2020, 179, 115679. [Google Scholar] [CrossRef]
  6. Haram, M.H.S.M.; Lee, J.W.; Ramasamy, G.; Ngu, E.E.; Thiagarajah, S.P.; Lee, Y.H. Feasibility of utilising second life EV batteries: Applications, lifespan, economics, environmental impact, assessment, and challenges. Alex. Eng. J. 2021, 60, 4517–4536. [Google Scholar] [CrossRef]
  7. Eleftheriadis, P.; Leva, S.; Gangi, M.; Rey, A.V.; Borgo, A.; Coslop, G.; Groppo, E.; Grande, L.; Sedzik, M. Second Life Batteries: Current Regulatory Framework, Evaluation Methods, and Economic Assessment: Reuse, refurbish, or recycle. IEEE Ind. Appl. Mag. 2024, 30, 46–58. [Google Scholar] [CrossRef]
  8. Neigum, K.; Wang, Z. Technology, economic, and environmental analysis of second-life batteries as stationary energy storage: A review. J. Energy Storage 2024, 103, 114393. [Google Scholar] [CrossRef]
  9. Rallo, H.; Casals, L.C.; De La Torre, D.; Reinhardt, R.; Marchante, C.; Amante, B. Lithium-ion battery 2nd life used as a stationary energy storage system: Ageing and economic analysis in two real cases. J. Clean. Prod. 2020, 272, 122584. [Google Scholar] [CrossRef]
  10. Koh, S.; Smith, L.; Miah, J.; Astudillo, D.; Eufrasio, R.; Gladwin, D.; Brown, S.; Stone, D. Higher 2nd life Lithium Titanate battery content in hybrid energy storage systems lowers environmental-economic impact and balances eco-efficiency. Renew. Sustain. Energy Rev. 2021, 152, 111704. [Google Scholar] [CrossRef]
  11. Vullum-Bruer, F.; Galteland, O.; Gouis, M.; McDougall, N.; Tenhunen-Lunkka, A. Existing and Upcoming Challenges for Extending Electric Vehicle Battery Lifetime Through 2nd Life Applications. J. Circ. Econ. 2024, 2. [Google Scholar] [CrossRef]
  12. Casals, L.C.; García, B.A.; Canal, C. Second life batteries lifespan: Rest of useful life and environmental analysis. J. Environ. Manag. 2019, 232, 354–363. [Google Scholar] [CrossRef]
  13. Lee, H.; Lim, D.; Lee, B.; Gu, J.; Choi, Y.; Lim, H. What is the optimized cost for a used battery?: Economic analysis in case of energy storage system as 2nd life of battery. J. Clean. Prod. 2022, 374, 133669. [Google Scholar] [CrossRef]
  14. Hossain, E.; Member, S.; Murtaugh, D.; Mody, J.; Mansur, H.; Faruque, R.; Sunny, S.H. A Comprehensive Review on Second-Life Batteries: Current State, Manufacturing Considerations, Applications, Impacts, Barriers and Potential Solutions, Business Strategies, and Policies. IEEE Access 2019, 7, 73215–73252. [Google Scholar] [CrossRef]
  15. Wewer, A.; Bilge, P.; Dietrich, F. Advances of 2nd life applications for lithium ion batteries from electric vehicles based on energy demand. Sustainability 2021, 13, 5726. [Google Scholar] [CrossRef]
  16. Iqbal, H.; Sarwar, S.; Kirli, D.; Shek, J.K.; Kiprakis, A.E. A survey of second-life batteries based on techno-economic perspective and applications-based analysis. Carbon Neutrality 2023, 2, 8. [Google Scholar] [CrossRef]
  17. Neubauer, J.; Pesaran, A. The ability of battery second use strategies to impact plug-in electric vehicle prices and serve utility energy storage applications. J. Power Sources 2011, 196, 10351–10358. [Google Scholar] [CrossRef]
  18. Viswanathan, V.V.; Kintner-Meyer, M. Second use of transportation batteries: Maximizing the value of batteries for transportation and grid services. IEEE Trans. Veh. Technol. 2011, 60, 2963–2970. [Google Scholar] [CrossRef]
  19. Martinez-Laserna, E.; Sarasketa-Zabala, E.; Sarria, I.V.; Stroe, D.I.; Swierczynski, M.; Warnecke, A.; Timmermans, J.M.; Goutam, S.; Omar, N.; Rodriguez, P. Technical viability of battery second life: A study from the ageing perspective. IEEE Trans. Ind. Appl. 2018, 54, 2703–2713. [Google Scholar] [CrossRef]
  20. Wang, C.; Lin, D.; Zhao, B.; Zhang, X.; Wang, Y.; Wang, Y.; Cao, W.; Jiang, F. State estimation and aging mechanism of 2nd life lithium-ion batteries: Non-destructive and postmortem combined analysis. Electrochim. Acta 2023, 443, 141996. [Google Scholar] [CrossRef]
  21. Timke, B.; Winter, M.; Niehoff, P. Impact of State of Health (SOH) on the Thermal Safety of Lithium Ion Cells for Long 1st Life and 2nd Life Applications. J. Electrochem. Soc. 2024, 171, 100526. [Google Scholar] [CrossRef]
  22. Hu, X.; Deng, X.; Wang, F.; Deng, Z.; Lin, X.; Teodorescu, R.; Pecht, M.G. A review of second-life lithium-ion batteries for stationary energy storage applications. Proc. IEEE 2022, 110, 735–753. [Google Scholar] [CrossRef]
  23. Li, J.; He, S.; Yang, Q.; Wei, Z.; Li, Y.; He, H. A comprehensive review of second life batteries toward sustainable mechanisms: Potential, challenges, and future prospects. IEEE Trans. Transp. Electrif. 2022, 9, 4824–4845. [Google Scholar] [CrossRef]
  24. Salek, F.; Resalati, S.; Babaie, M.; Henshall, P.; Morrey, D.; Yao, L. A review of the technical challenges and solutions in maximising the potential use of second life batteries from electric vehicles. Batteries 2024, 10, 79. [Google Scholar] [CrossRef]
  25. John, J.; Kudva, G.; Jayalakshmi, N. Secondary life of electric vehicle batteries: Degradation, state of health estimation using incremental capacity analysis, applications and challenges. IEEE Access 2024, 12, 63735–63753. [Google Scholar] [CrossRef]
  26. Roslan, M.; Satpathy, P.R.; Prasankumar, T.; Ramachandaramurthy, V.K.; Mansor, M.; Walker, S.L. Second-life battery energy storage system for energy sustainability: Recent advancements, key takeaways and future perspectives. J. Energy Storage 2025, 123, 116808. [Google Scholar] [CrossRef]
  27. Shen, J.; Zhou, M.; Liu, W.; Shi, Y.; Tang, W.; Deng, Y.; Liu, R.; Zuo, Y.; Zhang, J. Advanced direct recycling technology enables a second life of spent lithium-ion battery. Energy Storage Mater. 2025, 74, 103964. [Google Scholar] [CrossRef]
  28. Gu, X.; Bai, H.; Cui, X.; Zhu, J.; Zhuang, W.; Li, Z.; Hu, X.; Song, Z. Challenges and opportunities for second-life batteries: Key technologies and economy. Renew. Sustain. Energy Rev. 2024, 192, 114191. [Google Scholar] [CrossRef]
  29. Nazim, M.S.; Elavarasan, R.M. Extending battery lifecycles: A holistic review of second-life lithium-ion technology in sustainable energy systems from assessment to emerging trends. Renew. Sustain. Energy Rev. 2026, 233, 116848. [Google Scholar] [CrossRef]
  30. Redondo-Iglesias, E.; Venet, P.; Pelissier, S. Calendar and cycling ageing combination of batteries in electric vehicles. Microelectron. Reliab. 2018, 88-90, 1212–1215. [Google Scholar] [CrossRef]
  31. Uddin, K.; Chouchelamane, G.H.; Pastor-fern, C.; Widanage, W.D.; Marco, J. A Comparison between Electrochemical Impedance Spectroscopy and Incremental Capacity-Differential Voltage as Li-ion Diagnostic Techniques to Identify and Quantify the Effects of Degradation Modes within Battery Management Systems. J. Power Sources 2017, 360, 301–3018. [Google Scholar] [CrossRef]
  32. Gordon, I.J.; Genies, S.; Larbi, G.S.; Boulineau, A.; Daniel, L.; Alias, M. Original implementation of Electrochemical Impedance Spectroscopy (EIS) in symmetric cells: Evaluation of post-mortem protocols applied to characterize electrode materials for Li-ion batteries. J. Power Sources 2016, 307, 788–795. [Google Scholar] [CrossRef]
  33. Choi, W.; Shin, H.c.; Kim, J.M.; Choi, J.y.; Yoon, W.s. Modeling and Applications of Electrochemical Impedance Spectroscopy (EIS) for Lithium-ion Batteries. J. Electrochem. Sci. Technol. 2020, 11, 1–13. [Google Scholar] [CrossRef]
  34. Spitthoff, L.; Shearing, P.R.; Burheim, O.S. Temperature, Ageing and Thermal Management of Lithium-Ion Batteries. Energies 2021, 14, 1248. [Google Scholar] [CrossRef]
  35. Burheim, O.S.; Lamb, J.J. Engineering Energy Storage; Academic Press: Cambridge, MA, USA, 2024. [Google Scholar]
  36. Bloom, I.; Cole, B.W.; Sohn, J.J.; Jones, S.A.; Polzin, E.G.; Battaglia, V.S.; Henriksen, G.L.; Motloch, C.; Richardson, R.; Unkelhaeuser, T.; et al. An accelerated calendar and cycle life study of Li-ion cells. J. Power Sources 2001, 101, 238–247. [Google Scholar] [CrossRef]
  37. Dubarry, M.; Qin, N.; Brooker, P. Calendar aging of commercial Li-ion cells of different chemistries—A review. Curr. Opin. Electrochem. 2018, 9, 106–113. [Google Scholar] [CrossRef]
  38. Vetter, J.; Novák, P.; Wagner, M.R.; Veit, C.; Möller, K.C.; Besenhard, J.O.; Winter, M.; Wohlfahrt-Mehrens, M.; Vogler, C.; Hammouche, A. Ageing mechanisms in lithium-ion batteries. J. Power Sources 2005, 147, 269–281. [Google Scholar] [CrossRef]
  39. Broussely, M.; Herreyre, S.; Biensan, P.; Kasztejna, P.; Nechev, K.; Staniewicz, R.J. Aging mechanism in Li ion cells and calendar life predictions. J. Power Sources 2001, 97–98, 13–21. [Google Scholar] [CrossRef]
  40. Dubarry, M.; Anseán, D. Best practices for incremental capacity analysis. Front. Energy Res. 2022, 10, 1023555. [Google Scholar] [CrossRef]
  41. Bloom, I.; Christophersen, J.; Gering, K. Differential voltage analyses of high-power lithium-ion cells: 2. Applications. J. Power Sources 2005, 139, 304–313. [Google Scholar] [CrossRef]
  42. Dubarry, M.; Truchot, C.; Liaw, B.Y. Synthesize battery degradation modes via a diagnostic and prognostic model. J. Power Sources 2012, 219, 204–216. [Google Scholar] [CrossRef]
  43. Edge, J.S.; O’Kane, S.; Prosser, R.; Kirkaldy, N.D.; Patel, A.N.; Hales, A.; Ghosh, A.; Ai, W.; Chen, J.; Yang, J.; et al. Lithium ion battery degradation: What you need to know. Phys. Chem. Chem. Phys. 2021, 23, 8200–8221. [Google Scholar] [CrossRef]
  44. Birkl, C.R.; Roberts, M.R.; McTurk, E.; Bruce, P.G.; Howey, D.A. Degradation diagnostics for lithium ion cells. J. Power Sources 2017, 341, 373–386. [Google Scholar] [CrossRef]
  45. Troxler, Y.; Wu, B.; Marinescu, M.; Yufit, V.; Patel, Y.; Marquis, A.J.; Brandon, N.P.; Offer, G.J. The effect of thermal gradients on the performance of lithium-ion batteries. J. Power Sources 2014, 247, 1018–1025. [Google Scholar] [CrossRef]
  46. Lin, X.; Khosravinia, K.; Hu, X.; Li, J.; Lu, W. Lithium Plating Mechanism, Detection, and Mitigation in Lithium-Ion Batteries. Prog. Energy Combust. Sci. 2021, 87, 100953. [Google Scholar] [CrossRef]
  47. Ma, S.; Jiang, M.; Tao, P.; Song, C.; Wu, J.; Wang, J.; Deng, T.; Shang, W. Progress in Natural Science: Materials International Temperature effect and thermal impact in lithium-ion batteries: A review. Prog. Nat. Sci. Mater. Int. 2018, 28, 653–666. [Google Scholar] [CrossRef]
  48. Yang, B.; Zhang, H.; Yu, L.; Fan, W.; Huang, D. Lithium difluorophosphate as an additive to improve the low temperature performance of LiNi0.5Co0.2Mn0.3O2/graphite cells. Electrochim. Acta 2016, 221, 107–114. [Google Scholar] [CrossRef]
  49. Wang, H.; Zhang, H.; Cheng, Y.; Feng, K.; Li, X.; Zhang, H. All-NASICON LVP-LTP aqueous lithium ion battery with excellent stability and low-temperature performance. Electrochim. Acta 2018, 278, 279–289. [Google Scholar] [CrossRef]
  50. Hong, Z.; Tian, H.; Fang, Z.; Luo, Y.; Wu, H.; Zhao, F.; Li, Q.; Fan, S.; Wang, J. Challenges and Advances in Wide-Temperature Electrolytes for Lithium-Ion Batteries. ChemElectroChem 2024, 11, e202300759. [Google Scholar] [CrossRef]
  51. Zhang, S.S.; Xu, K.; Jow, T.R. The low temperature performance of Li-ion batteries. J. Power Sources 2003, 115, 137–140. [Google Scholar] [CrossRef]
  52. Zhang, S.S.; Xu, K.; Jow, T.R. A new approach toward improved low temperature performance of Li-ion battery. Electrochem. Commun. 2002, 4, 928–932. [Google Scholar] [CrossRef]
  53. Gunawardhana, N.; Dimov, N.; Sasidharan, M.; Park, G.J.; Nakamura, H.; Yoshio, M. Suppression of lithium deposition at sub-zero temperatures on graphite by surface modification. Electrochem. Commun. 2011, 13, 1116–1118. [Google Scholar] [CrossRef]
  54. Petzl, M.; Kasper, M.; Danzer, M.A. Lithium plating in a commercial lithium-ion battery—A low-temperature aging study. J. Power Sources 2015, 275, 799–807. [Google Scholar] [CrossRef]
  55. Alcaide, F.; Álvarez, G.; Bekaert, E.; Bonilla, F.; Gucciardi, E.; Urdampilleta, I.; Vicedo, R.; Ayerbe, E. Exploring the Influence of Temperature on Anode Degradation in Cycling-Aged Commercial Cylindrical Graphite-Si|NCA Cells. J. Electrochem. Soc. 2023, 170, 80523. [Google Scholar] [CrossRef]
  56. Zhu, Y.; Zhu, J.; Jiang, B.; Wang, X.; Wei, X.; Dai, H. Insights on the degradation mechanism for large format prismatic graphite/LiFePO4 battery cycled under elevated temperature. J. Energy Storage 2023, 60, 106624. [Google Scholar] [CrossRef]
  57. Sun, H.; Jiang, B.; You, H.; Yang, B.; Wang, X.; Wei, X.; Dai, H. Quantitative Analysis of Degradation Modes of Lithium-Ion Battery under Different Operating Conditions. Energies 2021, 14, 350. [Google Scholar] [CrossRef]
  58. Zhu, J.; Dewi Darma, M.S.; Knapp, M.; Sørensen, D.R.; Heere, M.; Fang, Q.; Wang, X.; Dai, H.; Mereacre, L.; Senyshyn, A.; et al. Investigation of lithium-ion battery degradation mechanisms by combining differential voltage analysis and alternating current impedance. J. Power Sources 2020, 448, 227575. [Google Scholar] [CrossRef]
  59. Wittman, R.; Dubarry, M.; Ivanov, S.; Juba, B.W.; Romàn-Kustas, J.; Fresquez, A.; Langendorf, J.; Grant, R.; Taggart, G.; Chalamala, B.; et al. Characterization of Cycle-Aged Commercial NMC and NCA Lithium-ion Cells: I. Temperature-Dependent Degradation. J. Electrochem. Soc. 2023, 170, 120538. [Google Scholar] [CrossRef]
  60. Spitthoff, L.; Vie, P.J.S.; Wahl, M.S.; Wind, J.; Burheim, O.S. Incremental capacity analysis (dQ/dV) as a tool for analysing the effect of ambient temperature and mechanical clamping on degradation. J. Electroanal. Chem. 2023, 944, 117627. [Google Scholar] [CrossRef]
  61. Richter, F.; Kjelstrup, S.; Vie, P.J.S.; Burheim, O.S. Thermal conductivity and internal temperature profiles of Li-ion secondary batteries. J. Power Sources 2017, 359, 592–600. [Google Scholar] [CrossRef]
  62. Hua, J.; Vie, P.J.S.; Wind, J. Methods for faster estimation of the entropy profile of a lithium-ion battery: A comparison of accelerated potentiometry and the estimation of entropy through thermal signatures. Electrochim. Acta 2025, 509, 145289. [Google Scholar] [CrossRef]
  63. Wind, J.; Vie, P.J.S. Entropy Profiles for Li-Ion Batteries—Effects of Chemistries and Degradation. Entropy 2025, 27, 364. [Google Scholar] [CrossRef]
  64. Sun, Y.; Hughes, G.M.; Bu, J.; Liu, J.; Grovenor, C.R.; Grant, P.S. Visualizing the Li distribution in an all-solid-state battery composite electrode using combined plasma focused-ion beam microscopy and secondary-ion mass spectroscopy. Micron 2025, 190, 103746. [Google Scholar] [CrossRef]
  65. Scott, S.; Du, W.; Horwood, R.; Lei, C.; Shearing, P.; Abbott, A.P. An Assessment of Blended Short Loop Recycled Graphite Electrodes Using X-Ray Micro-Computed Tomography. Adv. Energy Mater. 2025, 15, 2403498. [Google Scholar] [CrossRef]
  66. Milojevic, Z.; Attidekou, P.S.; Muhammad, M.; Ahmeid, M.; Lambert, S.; Das, P.K. Influence of orientation on ageing of large-size pouch lithium-ion batteries during electric vehicle life. J. Power Sources 2021, 506, 230242. [Google Scholar] [CrossRef]
  67. Solchenbach, S.; Tacconis, C.; Martin, A.G.; Peters, V.; Wallisch, L.; Stanke, A.; Hofer, J.; Renz, D.; Lewerich, B.; Bauer, G.; et al. Electrolyte motion induced salt inhomogeneity–a novel aging mechanism in large-format lithium-ion cells. Energy Environ. Sci. 2024, 17, 7294–7317. [Google Scholar] [CrossRef]
  68. Attia, P.M.; Bills, A.; Brosa Planella, F.; Dechent, P.; dos Reis, G.; Dubarry, M.; Gasper, P.; Gilchrist, R.; Greenbank, S.; Howey, D.; et al. Review—“Knees” in Lithium-Ion Battery Aging Trajectories. J. Electrochem. Soc. 2022, 169, 60517. [Google Scholar] [CrossRef]
  69. You, H.; Zhu, J.; Wang, X.; Jiang, B.; Wei, X.; Dai, H. Nonlinear aging knee-point prediction for lithium-ion batteries faced with different application scenarios. eTransportation 2023, 18, 100270. [Google Scholar] [CrossRef]
  70. Laszczynski, N.; Solchenbach, S.; Gasteiger, H.A.; Lucht, B.L. Understanding Electrolyte Decomposition of Graphite/NCM811 Cells at Elevated Operating Voltage. J. Electrochem. Soc. 2019, 166, A1853. [Google Scholar] [CrossRef]
  71. Zhu, J.; Knapp, M.; Sørensen, D.R.; Heere, M.; Darma, M.S.D.; Müller, M.; Mereacre, L.; Dai, H.; Senyshyn, A.; Wei, X.; et al. Investigation of capacity fade for 18650-type lithium-ion batteries cycled in different state of charge (SoC) ranges. J. Power Sources 2021, 489, 229422. [Google Scholar] [CrossRef]
  72. Lian, T.; Vie, P.J.S.; Gilljam, M.; Forseth, S. (Invited) Changes in Thermal Stability of Cyclic Aged Commercial Lithium-Ion Cells. Electrochem. Soc. Trans. 2019, 89, 73–81. [Google Scholar] [CrossRef]
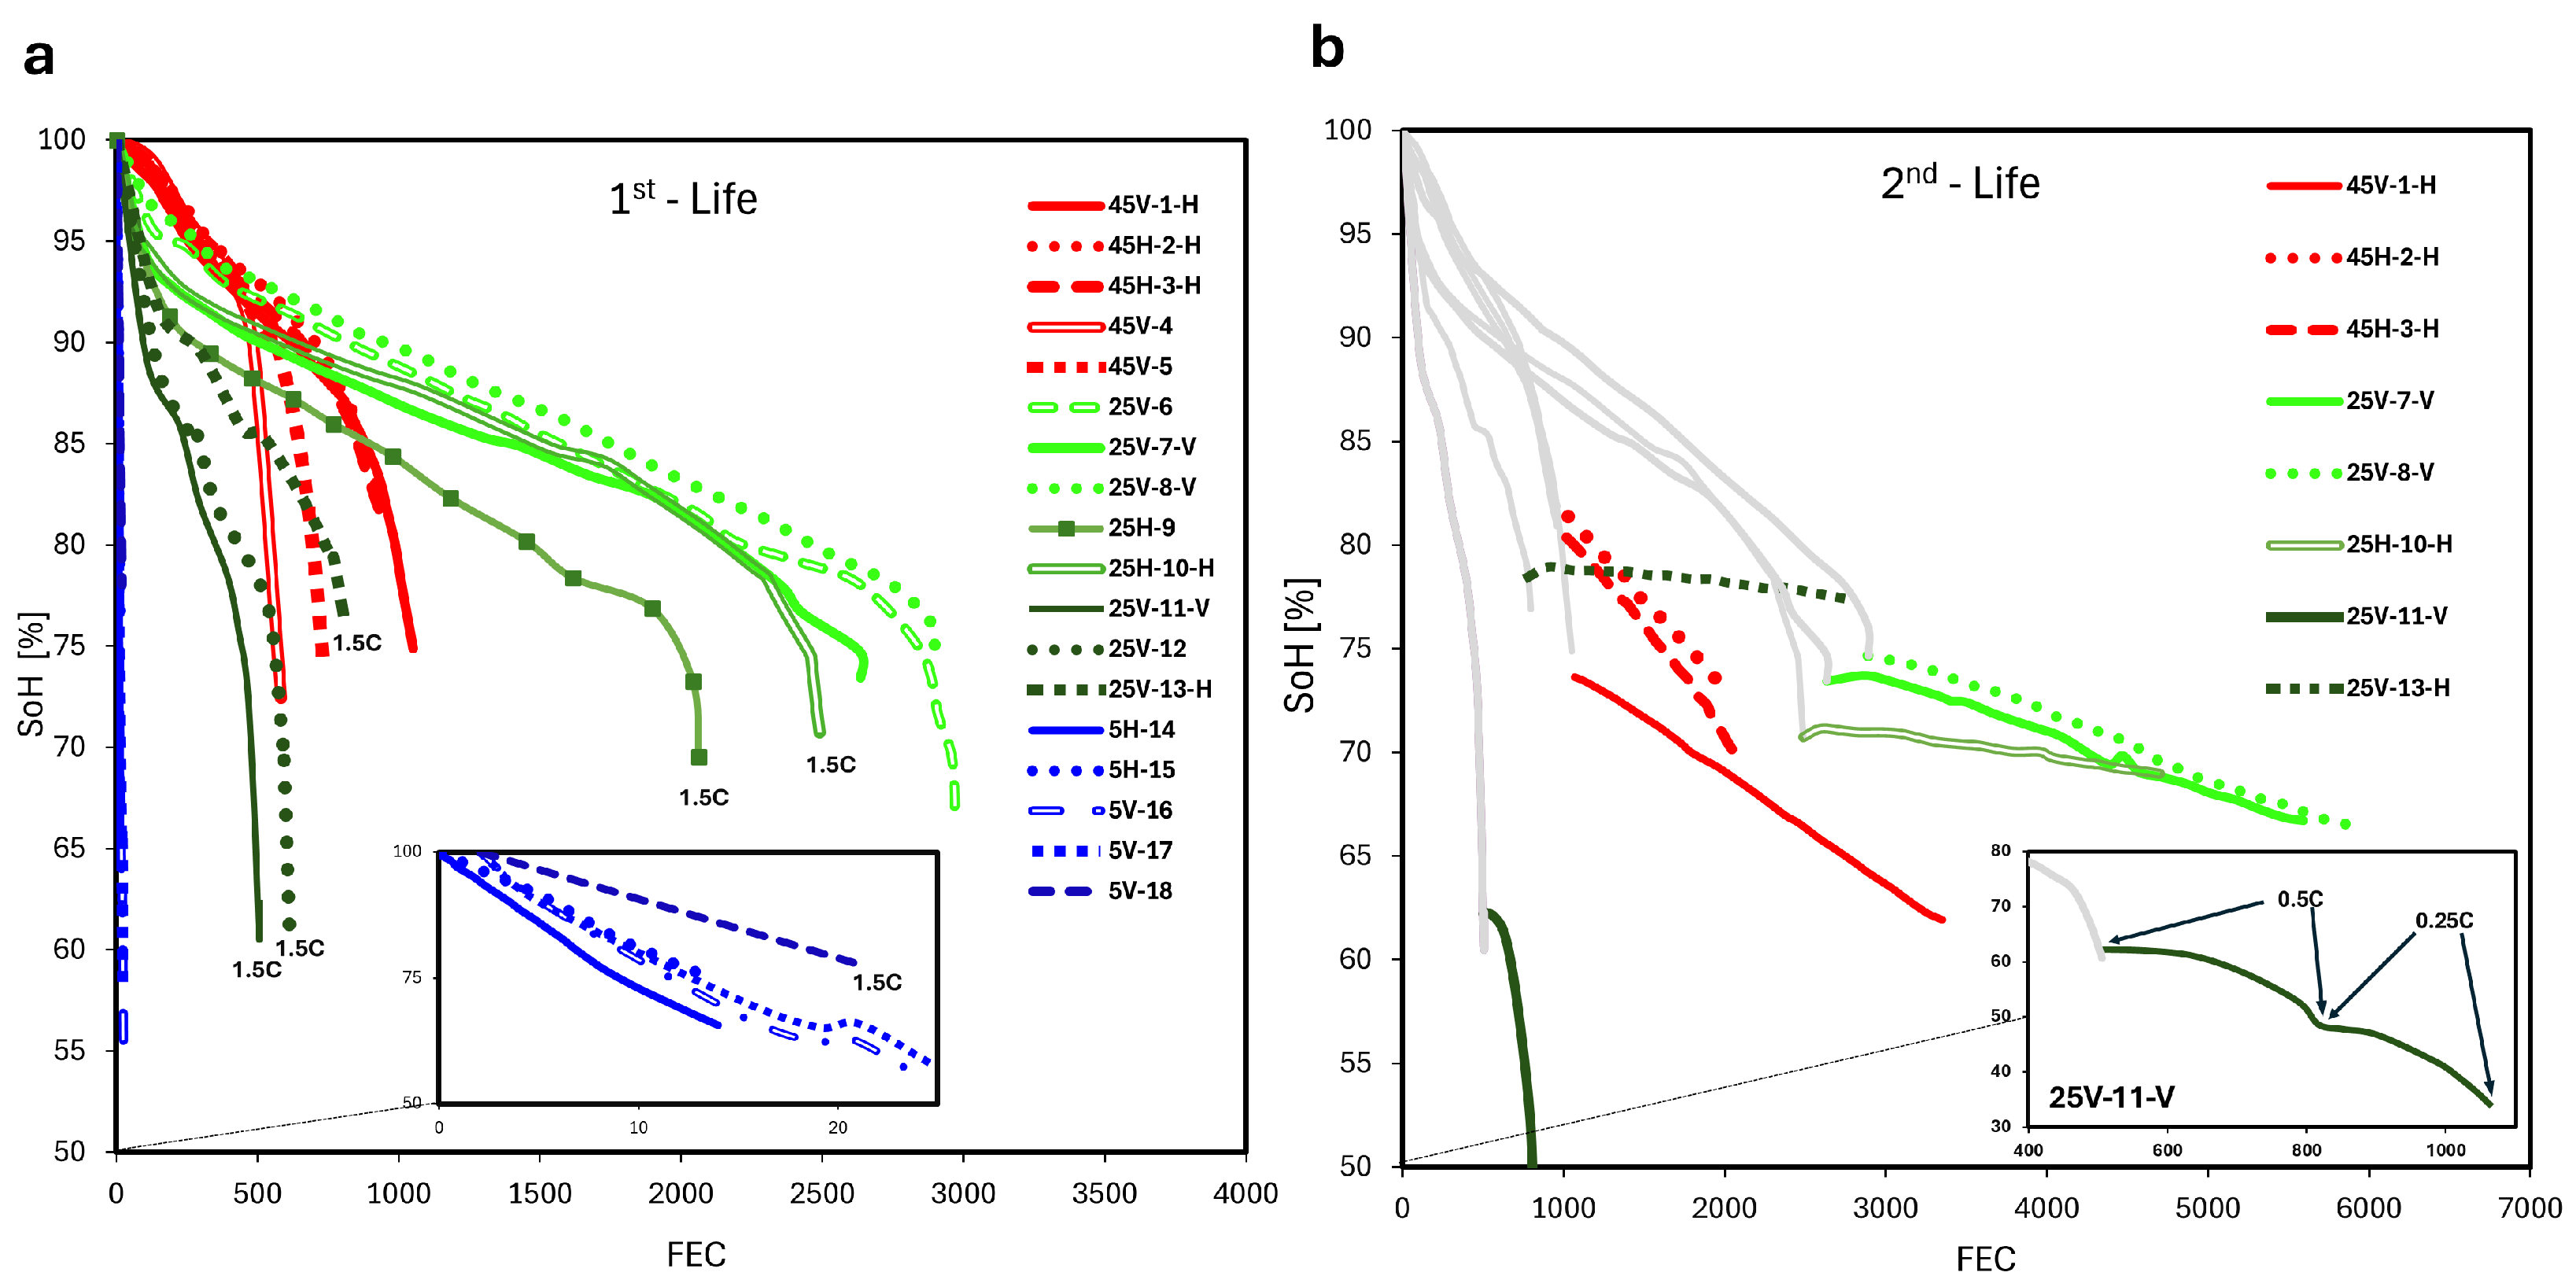
Figure 1. SoH as a function of FEC for cells cycled at different temperatures, C-rates, and orientations. The specific test conditions for all cells are presented in Table 1. The cell label discloses cycle temperature in 1st life as well as orientation in both 1st- and 2nd-life cycling in addition to a specific cell number. In 1st-life cycling (a), all cells were cycled in the full SoC window and at 1 C current, except those where 1.5 C is indicated at the end of the lines. In 2nd-life cycling (b), all cells were cycled at 25 °C in a reduced SoC window of 10 to 70% and at a C-rate of 0.25 C, except for cell 25V-11-V, which was cycled from 0 to 100% SoC, first at 0.5 C and then at 0.25 C.
Batteries 12 00121 g001
Figure 2. Plot of the DC resistance at 50% SoC as a function of SoH for cells cycled under different temperatures and C-rates during (a) 1st-life and (b) 2nd-life cycling. For information on test conditions and cell labels, see Table 1 and Figure 1.
Batteries 12 00121 g002
Figure 3. Incremental Capacity Aanalysis (ICA) presented as dQ/dV during charge as a function of cell voltage at 0.05 C for cells during their first life for selected cells aged at different temperatures. In (a), the IC curves for the cells range from a SoH of 91 to 95%. In (b), the SoH ranges from 81 to 85%. Below each of the plots, (a,b), arrows or bars indicate the trends of change in potential (left) and dQ/dV (right) for each peak from 100% SoH, as well as the cycling condition and corresponding plot colours (For the arrows; the color red, green and blue indicate 45, 25, and 5 °C, respectively, and dash bar no significant change.).
Batteries 12 00121 g003
Figure 4. Potential (top) and intensity (bottom) shifts of (a) F1 and (b) F2 versus SoH for cells cycled at different temperatures (5 °C, 25 °C, and 45 °C) under1st-life and 2nd-life cycling conditions. Second-life data points are indicated with open markers.
Batteries 12 00121 g004
Figure 5. ARC test of the cycled anode material from a 5 °C cell, with reference data from [72].
Batteries 12 00121 g005
Figure 6. The figure shows a sample of an anode examined by SEM, FIB-SIMS and SEM-EDX. In the lower centre, one can observe the sample (optical picture) of a section of the anode. Two characteristic sections of the anode where inspected further; the transition between overhang and cathode underlay anode (green) and well into the actively cycled anode (light orange). From these two SEM images (green and orange framed), one can see the three types of layers (i), (ii), and (iii). (i) is visible in the left part of the green-framed micrograph, (ii) is visible in the right of the green-framed micrograph and in the majority of the orange-framed figure, and (iii) is visible in the upper right part of the orange-framed micrograph. Further, layer type (ii) was found to have surface (purple framed) and pit/hole (pink framed) characteristics.
Batteries 12 00121 g006
Figure 7. Illustration of the X-ray setup (upper left) and a slice cut through the battery anode thickness direction (centre). Also, a picture of the electrode near the end is displayed (lower middle), with enlarged XCT images of under surface coating type (ii)/(iii) (left) and under type (i) (right). In the upper-right semicircle, XCT images of the transition zone between the active cathode overlay region and the anode overhang region, oriented accordingly, are shown. Images include 100 μm bars for indication of dimensions, as well as one 1 mm bar in the centre picture. The anode current collector can be recognised as the bright centreline or region.
Batteries 12 00121 g007
Table 1. Overview of all tested cells and their cycling conditions during the 1st-life and 2nd-life testing. The test conditions were temperature, orientation (H = horizontal, V = vertical), C-rate, SoC window, and which year(s) the cells were tested. The cell label has the format of TTO-N-O, where TTO is the 1st-life cycle temperature and orientation, N is the cell number, and the final O represents the possible orientation during 2nd-life cycling.
Cell LabelCycling Conditions During 1st LifeCycling Conditions During 2nd Life
Temp (°C)OrientationC-RateSoC (%)Year(s)Temp (°C)OrientationC-RateSoC (%)Year(s)
45V-1-H45V10–1002015–201625H0.2510–702022–2023
45H-2-H45H10–1002022–202425H0.2510–702023–2024
45H-3-H45H10–1002022–202425H0.2510–702023–2024
45V-445V10–1002015–2016
45V-545V10–1002015–2016
25V-625V10–1002016–2017
25V-7-V25V10–1002016–201725V0.2510–702019–2023
25V-8-V25V10–1002016–201725V0.2510–702019–2023
25H-925H1.50–1002016–2017
25H-10-H25H1.50–1002016–201725H0.2510–702022–2023
25V-11-V25V1.50–1002015–201625V0.25–0.5 *0–1002016–2017
25V-1225V1.50–1002015–2016
25V-13-H25V1.50–1002015–201625H0.2510–702022–2023
5H-145H10–1002022
5H-155H10–1002022
5V-165V10–1002015
5V-175V10–1002015
5V-185V1.50–1002015
* Cell 25V-11-V went through a different 2nd-life test than the other cells; 1st life with 1.5 C, 2nd life with C/2 current, and later C/4 current, all in the full SoC window.
Disclaimer/Publisher’s Note: The statements, opinions and data contained in all publications are solely those of the individual author(s) and contributor(s) and not of MDPI and/or the editor(s). MDPI and/or the editor(s) disclaim responsibility for any injury to people or property resulting from any ideas, methods, instructions or products referred to in the content.