1. Introduction
With the rapid expansion of the electric vehicle (EV) market, the sustainable management of retired lithium-ion batteries—often referred to as “second-life” batteries—has emerged as an important economic and environmental topic in battery management [
1,
2,
3,
4,
5]. Globally, and particularly in dominant markets like China, the industry is entering a critical stage of large-scale battery retirement. Driven by government regulations and traceability-oriented management, “echelon utilization” has been actively promoted for stationary storage and backup-power applications, aiming to improve resource efficiency [
6]. However, unlike fresh battery packs with uniform properties, retired modules exhibit significant cell-to-cell heterogeneity in their State of Health (SOH) and impedance characteristics, stemming from diverse historical operating conditions and thermal gradients [
7,
8,
9,
10,
11,
12]. This inconsistency poses a fundamental dilemma: retired modules often exhibit incomplete usage history and highly dispersed degradation states, making fast screening and safe operation considerably difficult [
13].
Accurate state estimation is a prerequisite for managing such heterogeneity in embedded Battery Management Systems (BMS). In China, growing attention has been devoted to these challenges, reflected in a stable increase in related patent applications [
14]. In practice, research and industrial efforts in China broadly follow two complementary streams—material recycling and echelon utilization—aiming at element recovery and residual-value maximization, respectively. While material recycling technologies (e.g., hydrometallurgy) focus on element recovery [
15], echelon utilization aims to maximize the remaining value of the battery. For the latter, rapid sorting methods based on feature-based sorting and clustering methods have been investigated to classify retired cells with similar static characteristics [
16]. Simultaneously, for online applications, model-based state estimation has been recognized as a key enabling technique for echelon-utilization BMS, with increasing emphasis on robust SOC/SOH estimation and engineering-oriented BMS management under parameter dispersion [
17]. Despite these advances, a clear gap remains between academic methods and engineering needs: many existing approaches for second-life scenarios still rely on intensive calibration—such as periodic full-capacity tests, full OCV curve characterization, or long rest periods—or are validated under relatively controlled conditions. Consequently, embedded, calibration-light, and robustness-oriented state estimation for heterogeneous retired cells under dynamic loads is still limited.
From a methodological perspective, two major technical routes are commonly adopted to address these issues: (i) continuously tracking battery dynamics via online parameter identification, such as Recursive Least Squares (RLS) and Adaptive Extended Kalman Filters (A-EKFs) [
18,
19,
20,
21,
22,
23,
24,
25,
26]; and (ii) utilizing data-driven models, such as Support Vector Regression (SVR) or neural networks [
27,
28]. While online identification theoretically reduces modeling mismatch, it suffers from high computational burdens and divergence risks under weak excitation, and is particularly sensitive to aging-induced parameter drift in retired cells. Similarly, although data-driven approaches deliver high accuracy on specific datasets, they often function as “black boxes” with poor interpretability and require massive labeled training data, which is unavailable for retired batteries with unknown histories.
To enhance robustness without the drawbacks of the above methods, multi-model fusion strategies, such as the Interacting Multiple Model (IMM) algorithm [
29,
30], offer a promising pathway by interpolating between pre-defined models. However, traditional IMM approaches often require a large bank of pre-calibrated models and complex transition probability matrices, leading to high computational costs. More critically, the efficacy of any fusion strategy relies entirely on the fidelity of its base models (anchors). In offline identification using standard Hybrid Pulse Power Characterization (HPPC) tests, researchers face a critical, yet often overlooked, challenge which we term the “E-point selection dilemma”. Arbitrary truncation of the relaxation curve leads to a fundamental trade-off: short intervals cause underfitting of slow polarization dynamics, while excessively long intervals induce overfitting of measurement noise. This dilemma compromises the physical fidelity of Equivalent Circuit Models (ECMs), rendering them unreliable as baselines for fusion algorithms.
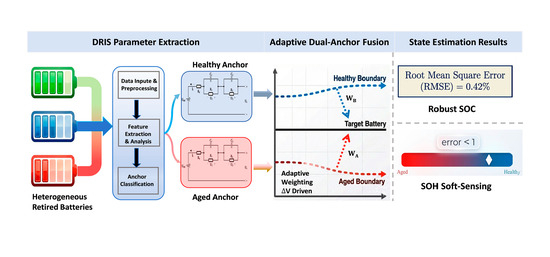
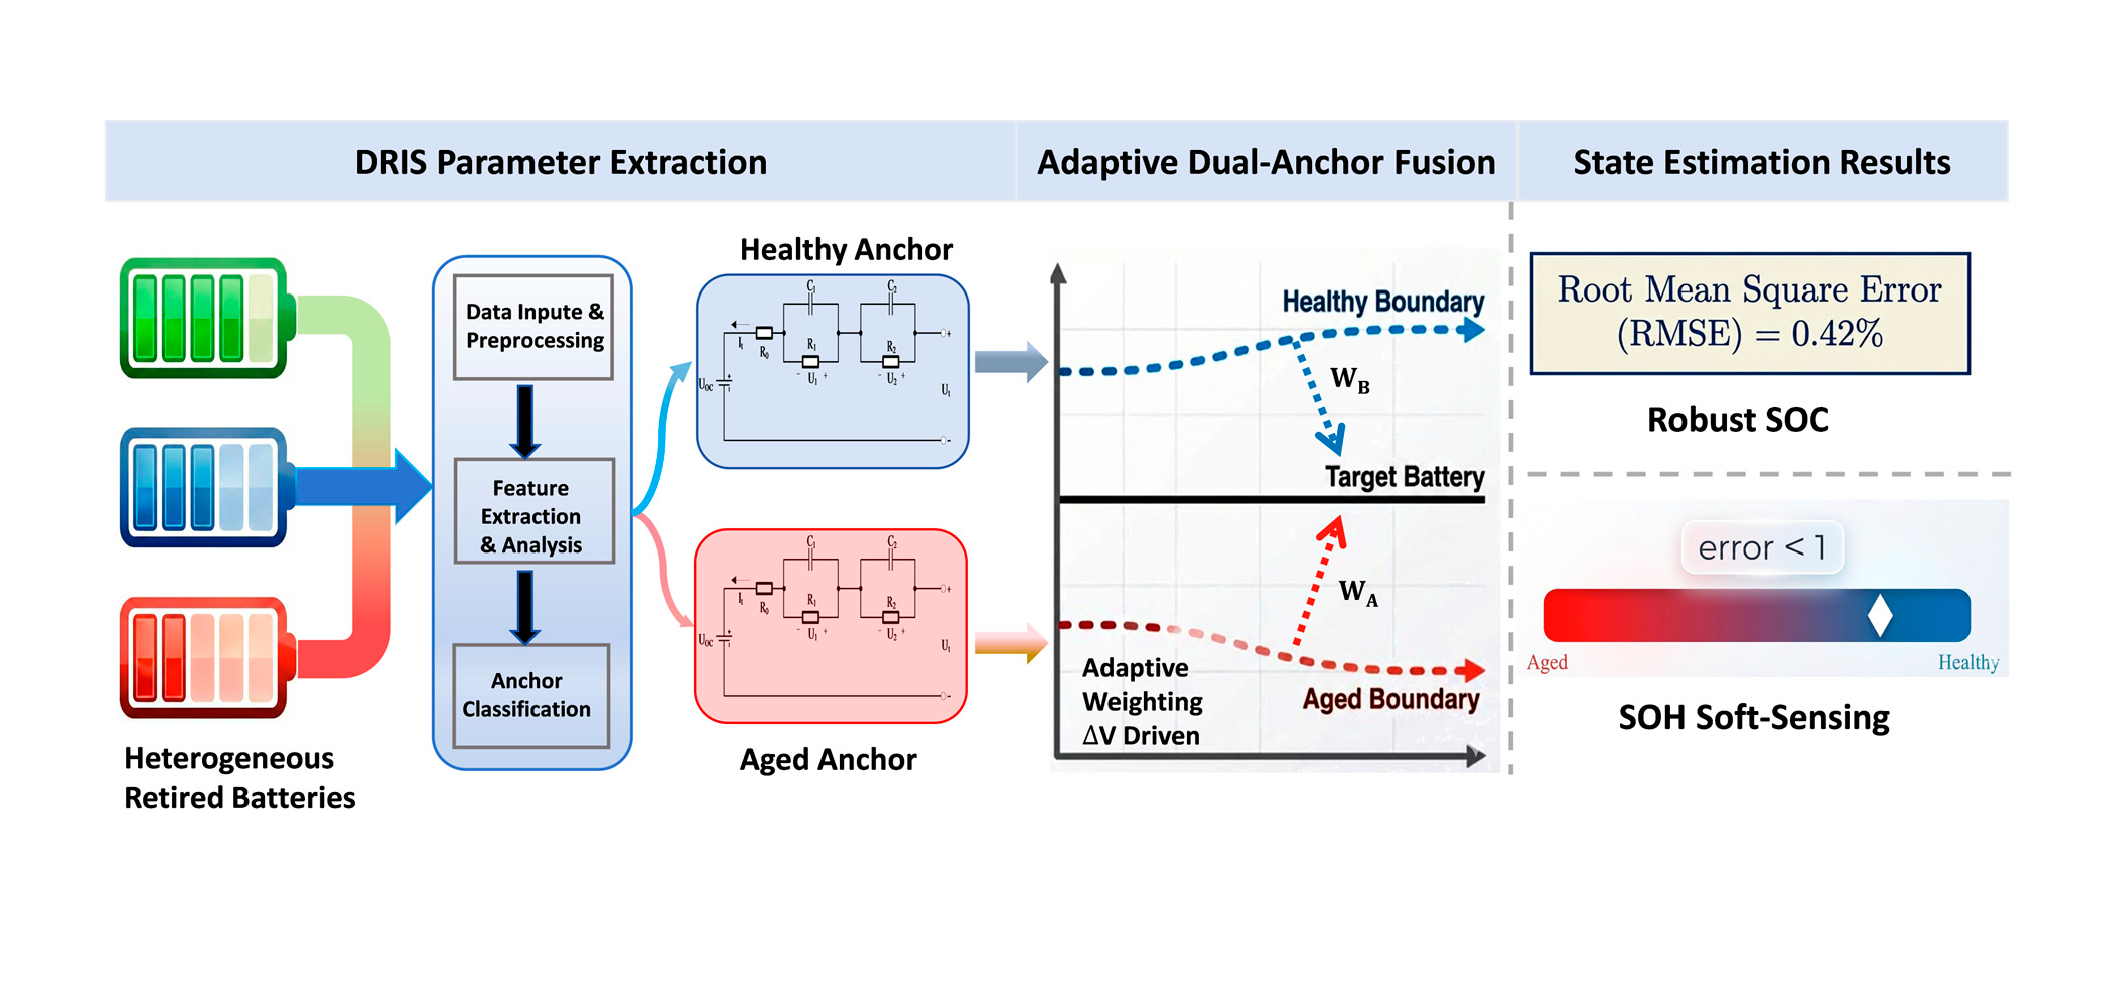
To systematically resolve these interconnected challenges, this paper proposes a comprehensive Adaptive Dual-Anchor Fusion Framework. First, we introduce an automated Dynamic Relaxation Interval Selection (DRIS) strategy. By minimizing the fitting Root Mean Square Error (RMSE) over a dynamic window, DRIS rigorously extracts high-fidelity parameters to construct robust “anchor models” representing the boundaries of the aging space (e.g., an aged anchor and a healthy anchor). Building on these solid foundations, a residual-driven Bayesian fusion mechanism is developed to dynamically interpolate between anchors, enabling the BMS to adapt to uncalibrated target batteries.
The main contributions of this work are three-fold:
Resolution of the “E-point Selection Dilemma”: An innovative automated DRIS strategy is proposed to replace empirical data truncation. It ensures the construction of physically meaningful anchor models that accurately capture electrochemical dynamics without noise corruption.
Cost-Effective Solution for Heterogeneity: A “Modeling by Boundary” concept is introduced. The observability and stability of the proposed dual-anchor framework are rigorously verified mathematically, ensuring its feasibility for control systems. We demonstrate at the cell level that robust state estimation can be achieved using only two extreme anchor models, offering a scalable pathway to reduce calibration effort compared to building a massive model library.
Physics-Informed SOH Soft-Sensing: A novel soft-sensing capability is discovered and validated. The adaptive fusion weights are shown to inherently reflect the battery’s health status, allowing for real-time SOH inference under dynamic loads without requiring full calibration cycles or offline capacity tests during operation.
2. High-Fidelity Anchor Model Construction via DRIS
2.1. Second-Order RC Equivalent
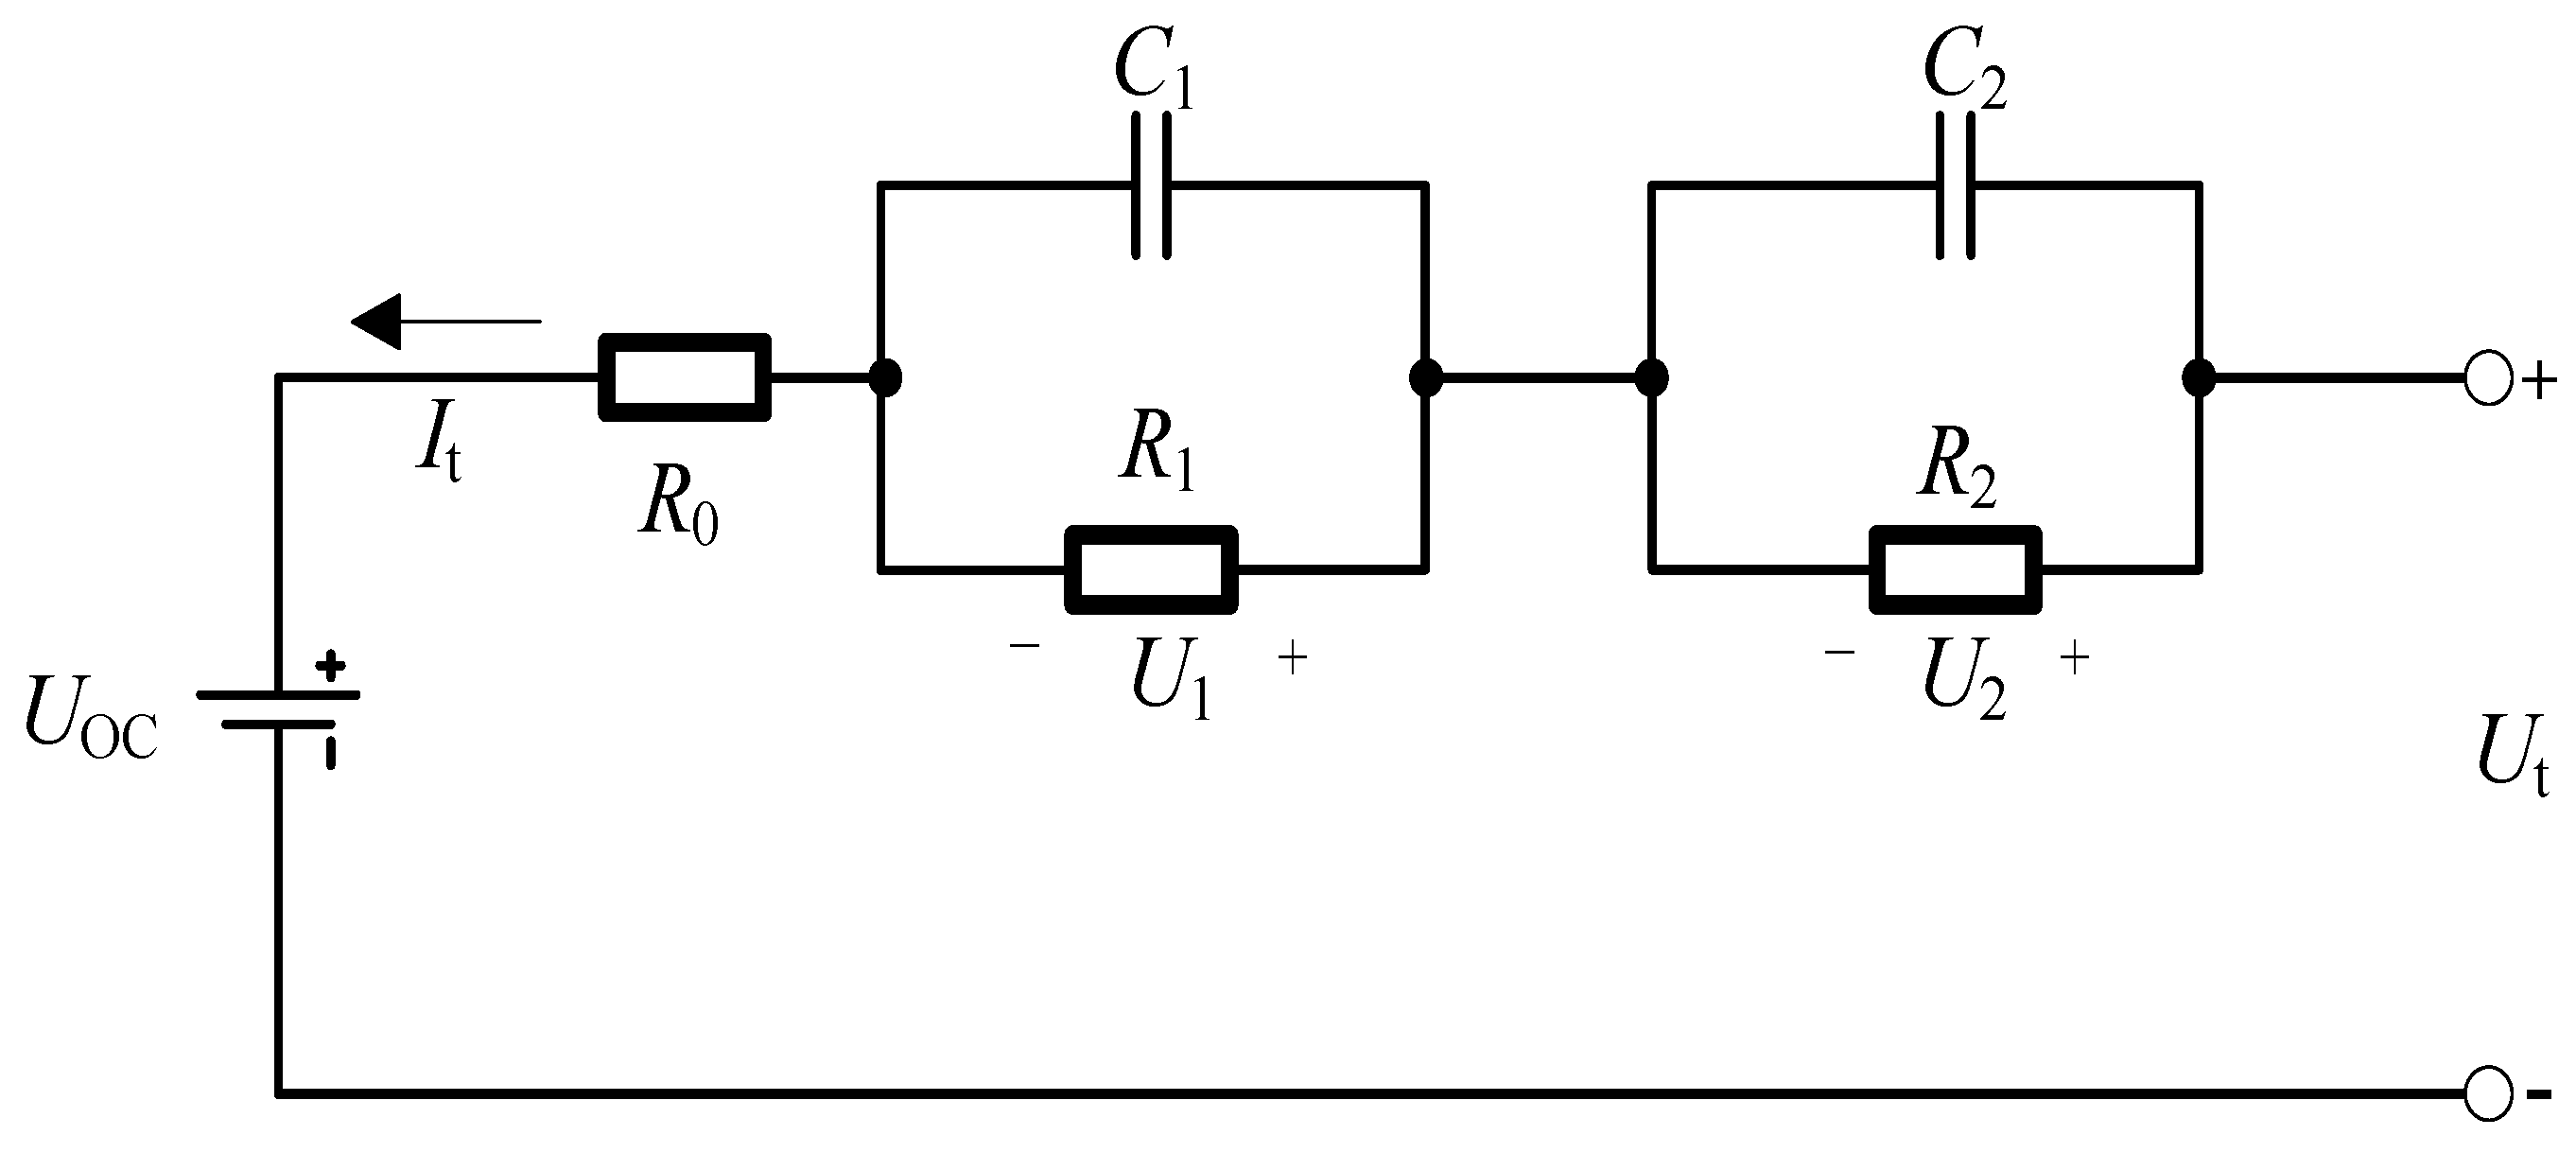
To accurately capture the dynamic electrochemical characteristics of retired lithium-ion batteries, the second-order RC Equivalent Circuit Model (ECM) is employed. As a trade-off between computational complexity and physical fidelity, this model structure is widely adopted in BMS applications [
31,
32]. As shown in
Figure 1, the electrical behavior is governed by Kirchhoff’s laws.
To ensure consistency with the convention used by the experimental testing equipment, the sign convention for current is defined globally throughout this paper: current is considered positive for charging and negative for discharging. All subsequent equations and analyses adhere to this convention.
Based on Kirchhoff’s Voltage Law (KVL) and Current Law (KCL), the electrical behavior of this model is described by Equations (1) and (2):
where
denotes the terminal voltage, and
(labeled as
It in
Figure 1, with the arrow indicating the positive charging direction) is the load current.
represents the open-circuit voltage as a function of
.
is the ohmic resistance, while (
,
) and (
,
) characterize the lumped polarization dynamics with different time constants. Since these parameters can vary significantly with the battery’s aging state and operating conditions, a robust identification strategy is essential.
It is worth noting that while the adopted circuit topology follows the standard second-order RC structure widely utilized in BMS applications, the “High-Fidelity” designation in this framework pertains specifically to the parameterization methodology rather than a new circuit topology. Conventional identification approaches often rely on empirical, fixed relaxation windows, which may make the identified parameters sensitive to noise and truncation-induced under-/overfitting. In contrast, the anchor models in this work are constructed using parameter sets rigorously extracted via the automated DRIS strategy (detailed in
Section 2.3), where an optimal truncation point
is selected by validation error minimization. Therefore, compared with a traditional single second-order ECM identified with a fixed window, our anchor models share the same structure but provide more stable and physically consistent parameter sets that serve as boundary anchors for subsequent fusion.
2.2. The “E-Point Selection Dilemma” in Parameter Identification
Parameter identification is essentially an inverse problem that extracts physical parameters from voltage relaxation curves. In a standard Hybrid Pulse Power Characterization (HPPC) test [
33,
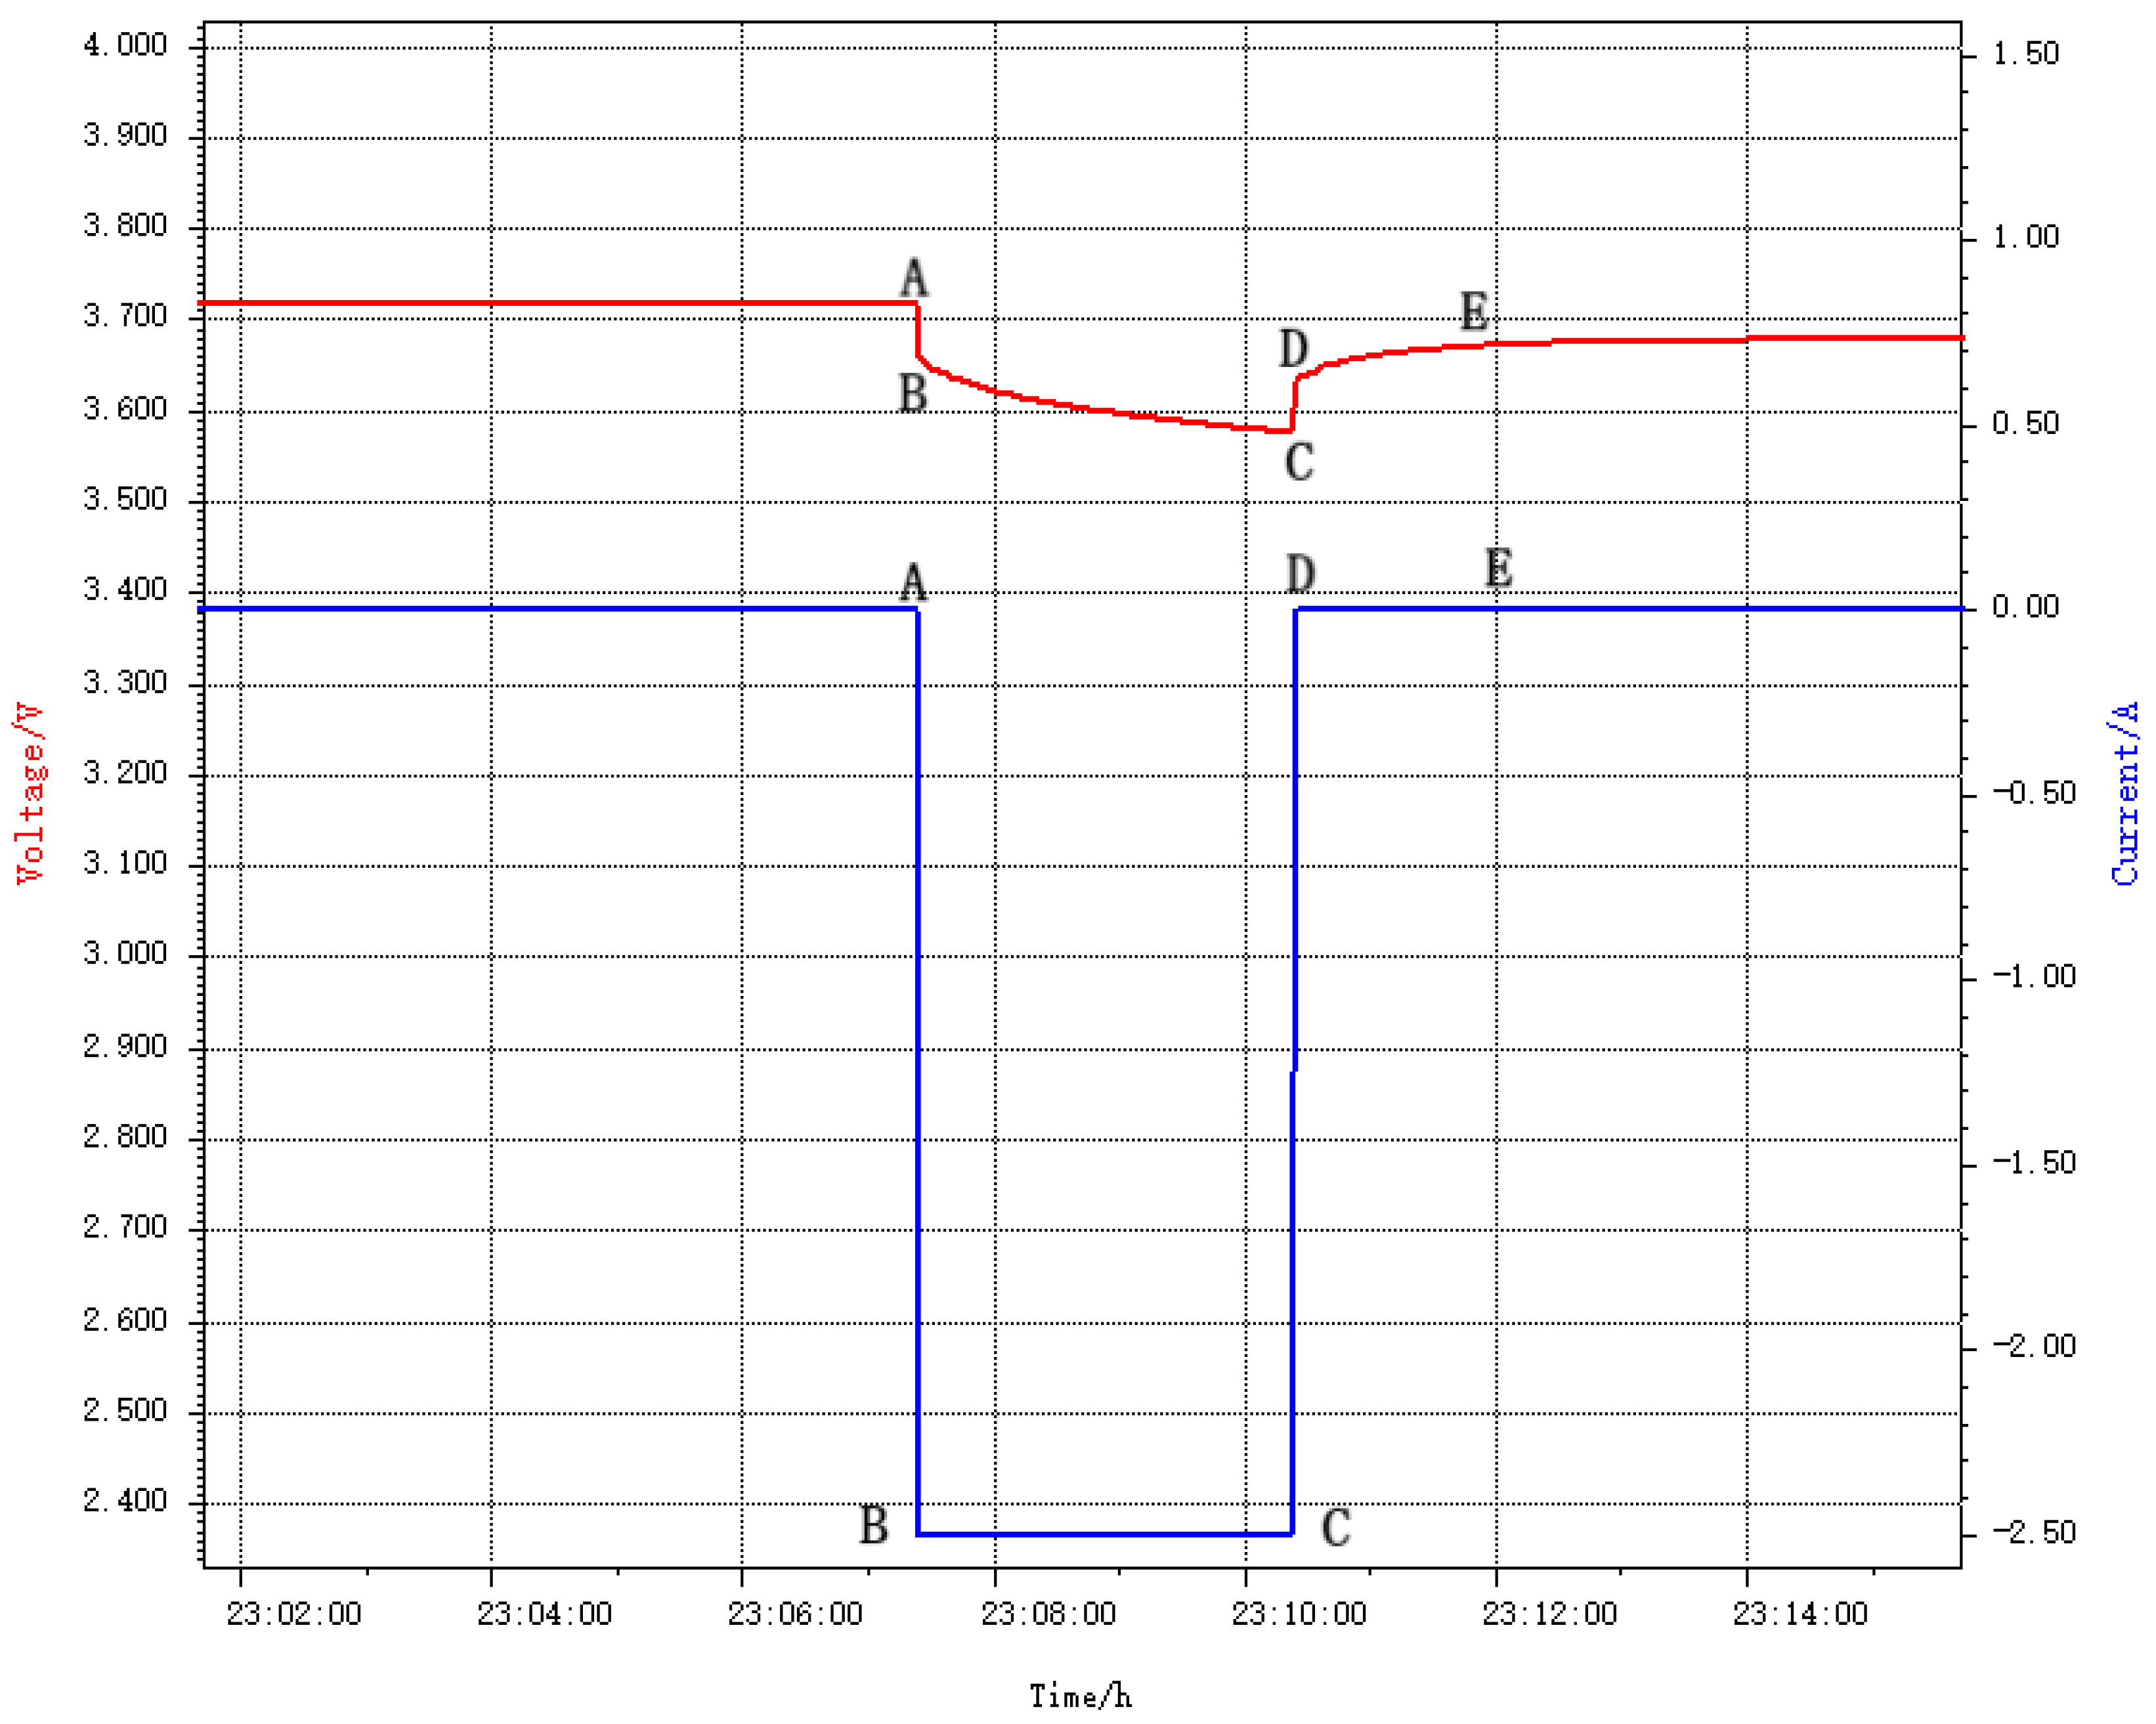
34], the relaxation phase spans from the moment the current is cut off (Point D) to a stable equilibrium state (Point E).
However, defining the optimal cutoff time for Point E is a critical, yet often overlooked, challenge, which we term the “E-point selection dilemma”. The choice of the data window length involves a fundamental trade-off between signal integrity and noise corruption. As illustrated in
Figure 2, this dilemma manifests in two distinct failure modes:
Underfitting (Short Interval): If the selected interval (D–E) is too short, the data fails to capture the slow polarization dynamics governed by the large time constant (concentration polarization). The identification algorithm consequently “forces” a fit to the incomplete transient, resulting in significant estimation errors for R2 and C2.
Overfitting (Long Interval): Conversely, if the interval is extended too long into the equilibrium tail where the voltage change is minimal, the signal-to-noise ratio (SNR) degrades [
35,
36]. The algorithm begins to fit the random measurement noise rather than the underlying system dynamics, leading to unstable parameter solutions with high variance.
Therefore, finding the mathematically optimal “E-point” is not trivial but is a prerequisite for obtaining high-fidelity anchor models for the subsequent fusion framework.
2.3. Dynamic Relaxation Interval Selection (DRIS) Strategy
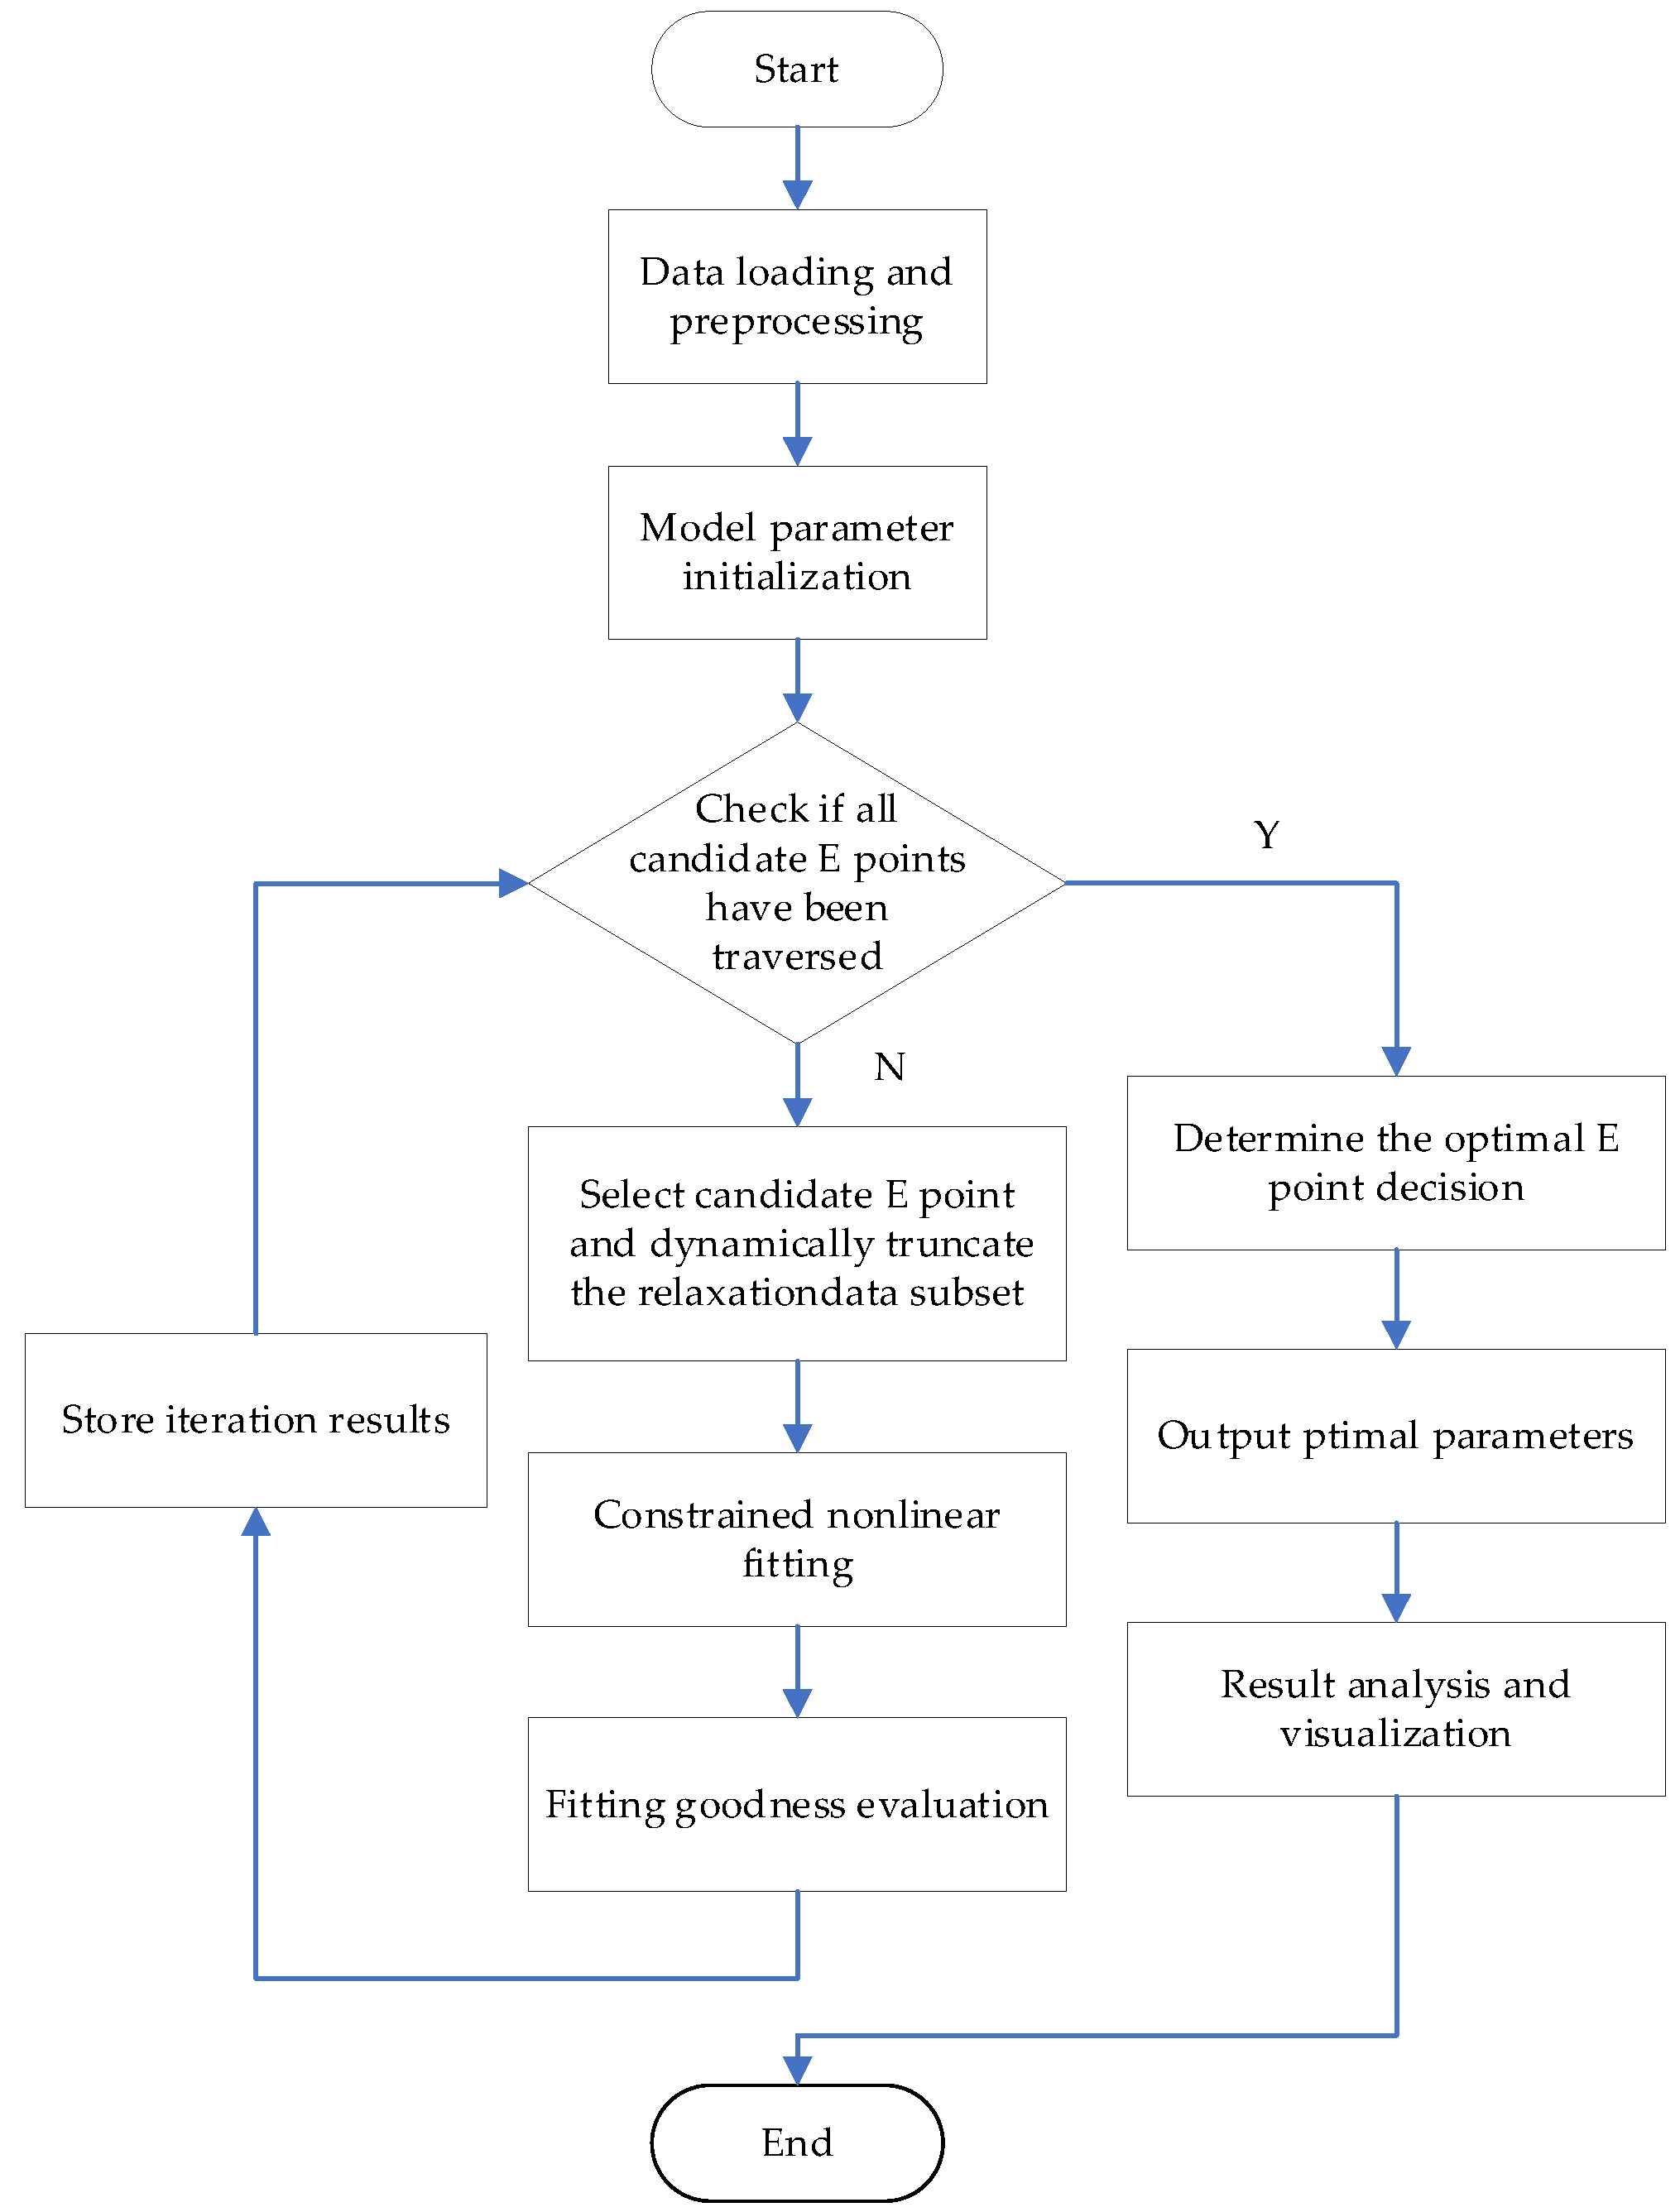
To systematically resolve the aforementioned dilemma and extract pure electrochemical parameters, this study employs the Dynamic Relaxation Interval Selection (DRIS) strategy. The core principle of DRIS is to transform the subjective choice of the data cutoff point into an automated optimization problem based on the goodness-of-fit. The complete workflow is depicted in
Figure 3.
The strategy operates by iteratively traversing a set of candidate endpoints,
, within the relaxation phase. For each candidate endpoint, a subset of voltage relaxation data Ω(
Ei) = {(
tk,
Vk)|
tk ≤
Ei} is constructed. Parameter identification is then performed on this subset using a nonlinear least-squares algorithm [
37]. To quantitatively evaluate the quality of the identified parameters for each candidate interval, the Root Mean Square Error (RMSE) is calculated as Equation (3):
where
is the number of data points in the subset Ω(
Ei), and
is the measured voltage at time step
k. The term
denotes the model-predicted voltage, calculated using the optimal parameter set
identified for the specific cutoff point
. Based on this metric, the optimal E-point,
, is defined as the time point that yields the global minimum of the RMSE curve, as defined in Equation (4):
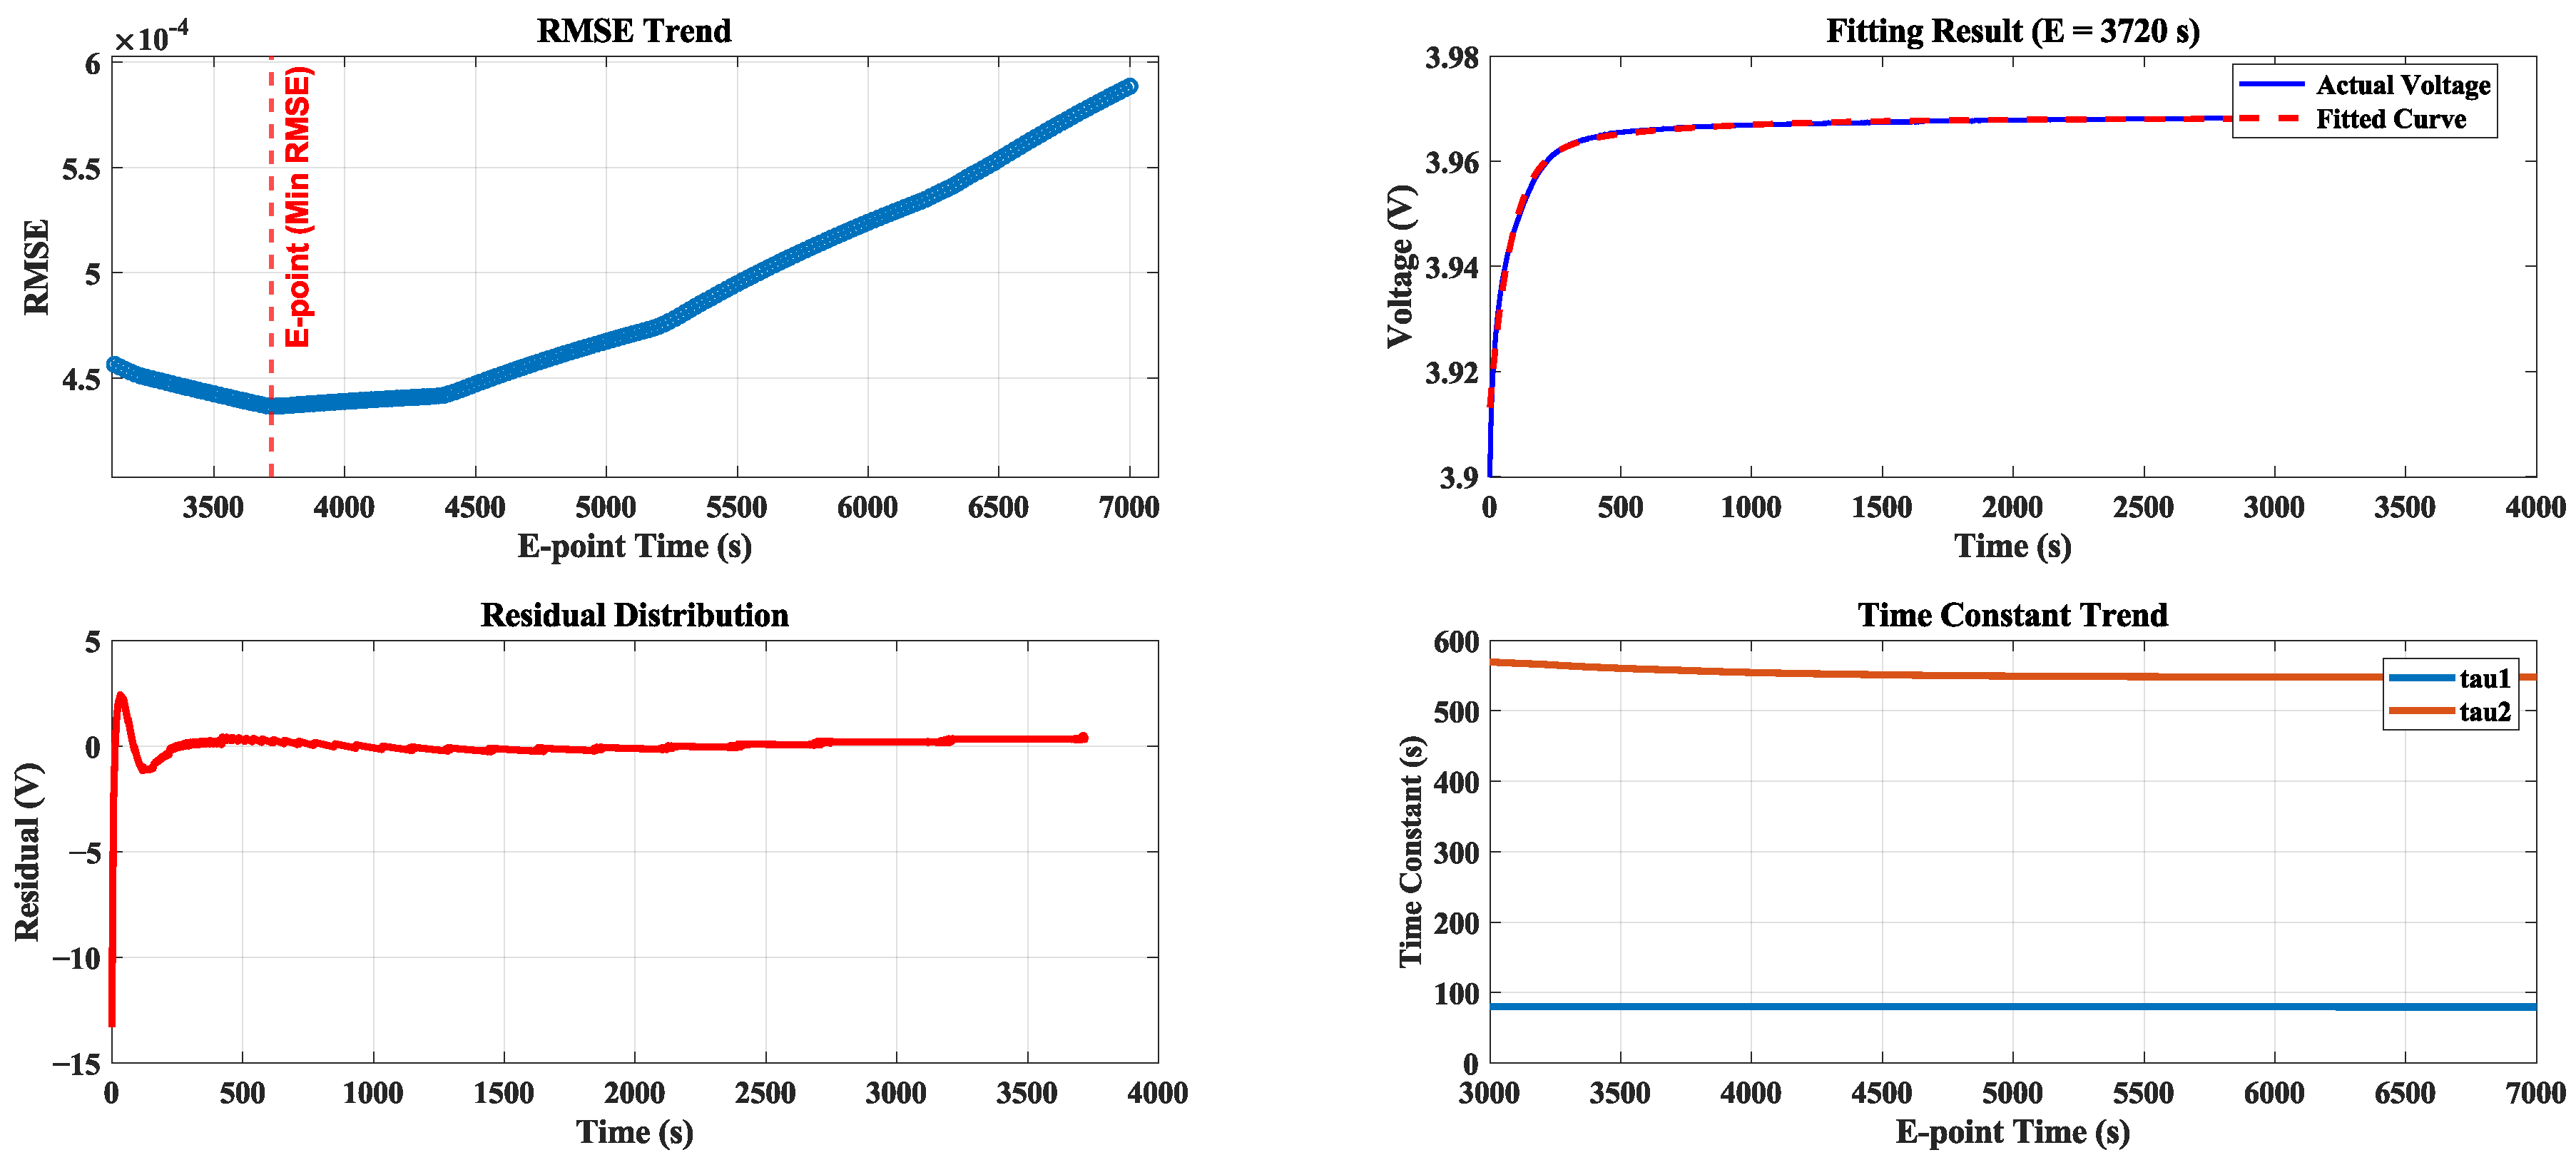
In the implementation, the search space for candidate E-points ε covers the entire relaxation period, with a search step interval of 1 s to guarantee high resolution. The efficacy of this strategy is visually analyzed in
Figure 4. The top-left subplot validates the ‘E-point selection dilemma’ via the ‘U-shaped’ RMSE curve, identifying the optimal window that balances underfitting and noise. At this optimal point, the top-right subplot demonstrates high fitting accuracy—comparing the actual voltage (blue solid line) with the model-fitted voltage (red dashed line)—while the bottom-left subplot confirms minimal residuals. Crucially, the bottom-right subplot (labeled ‘Time Constant Trend’) demonstrates the evolution of the time constants, denoted as ‘tau1’ (
) and ‘tau2’ (
), where the blue and orange lines correspond to
and
, respectively. Both parameters rapidly converge to stable values near the optimal E-point, verifying the extraction of true electrochemical dynamics.
2.4. Identification Results for Anchor Boundaries
By applying the DRIS strategy, we successfully constructed two representative anchor models: Anchor A (Aged, SOH ≈ 0.61) and Anchor B (Healthy, SOH ≈ 0.80). To verify their fidelity, a rigorous back-testing validation was conducted under the HPPC profile.
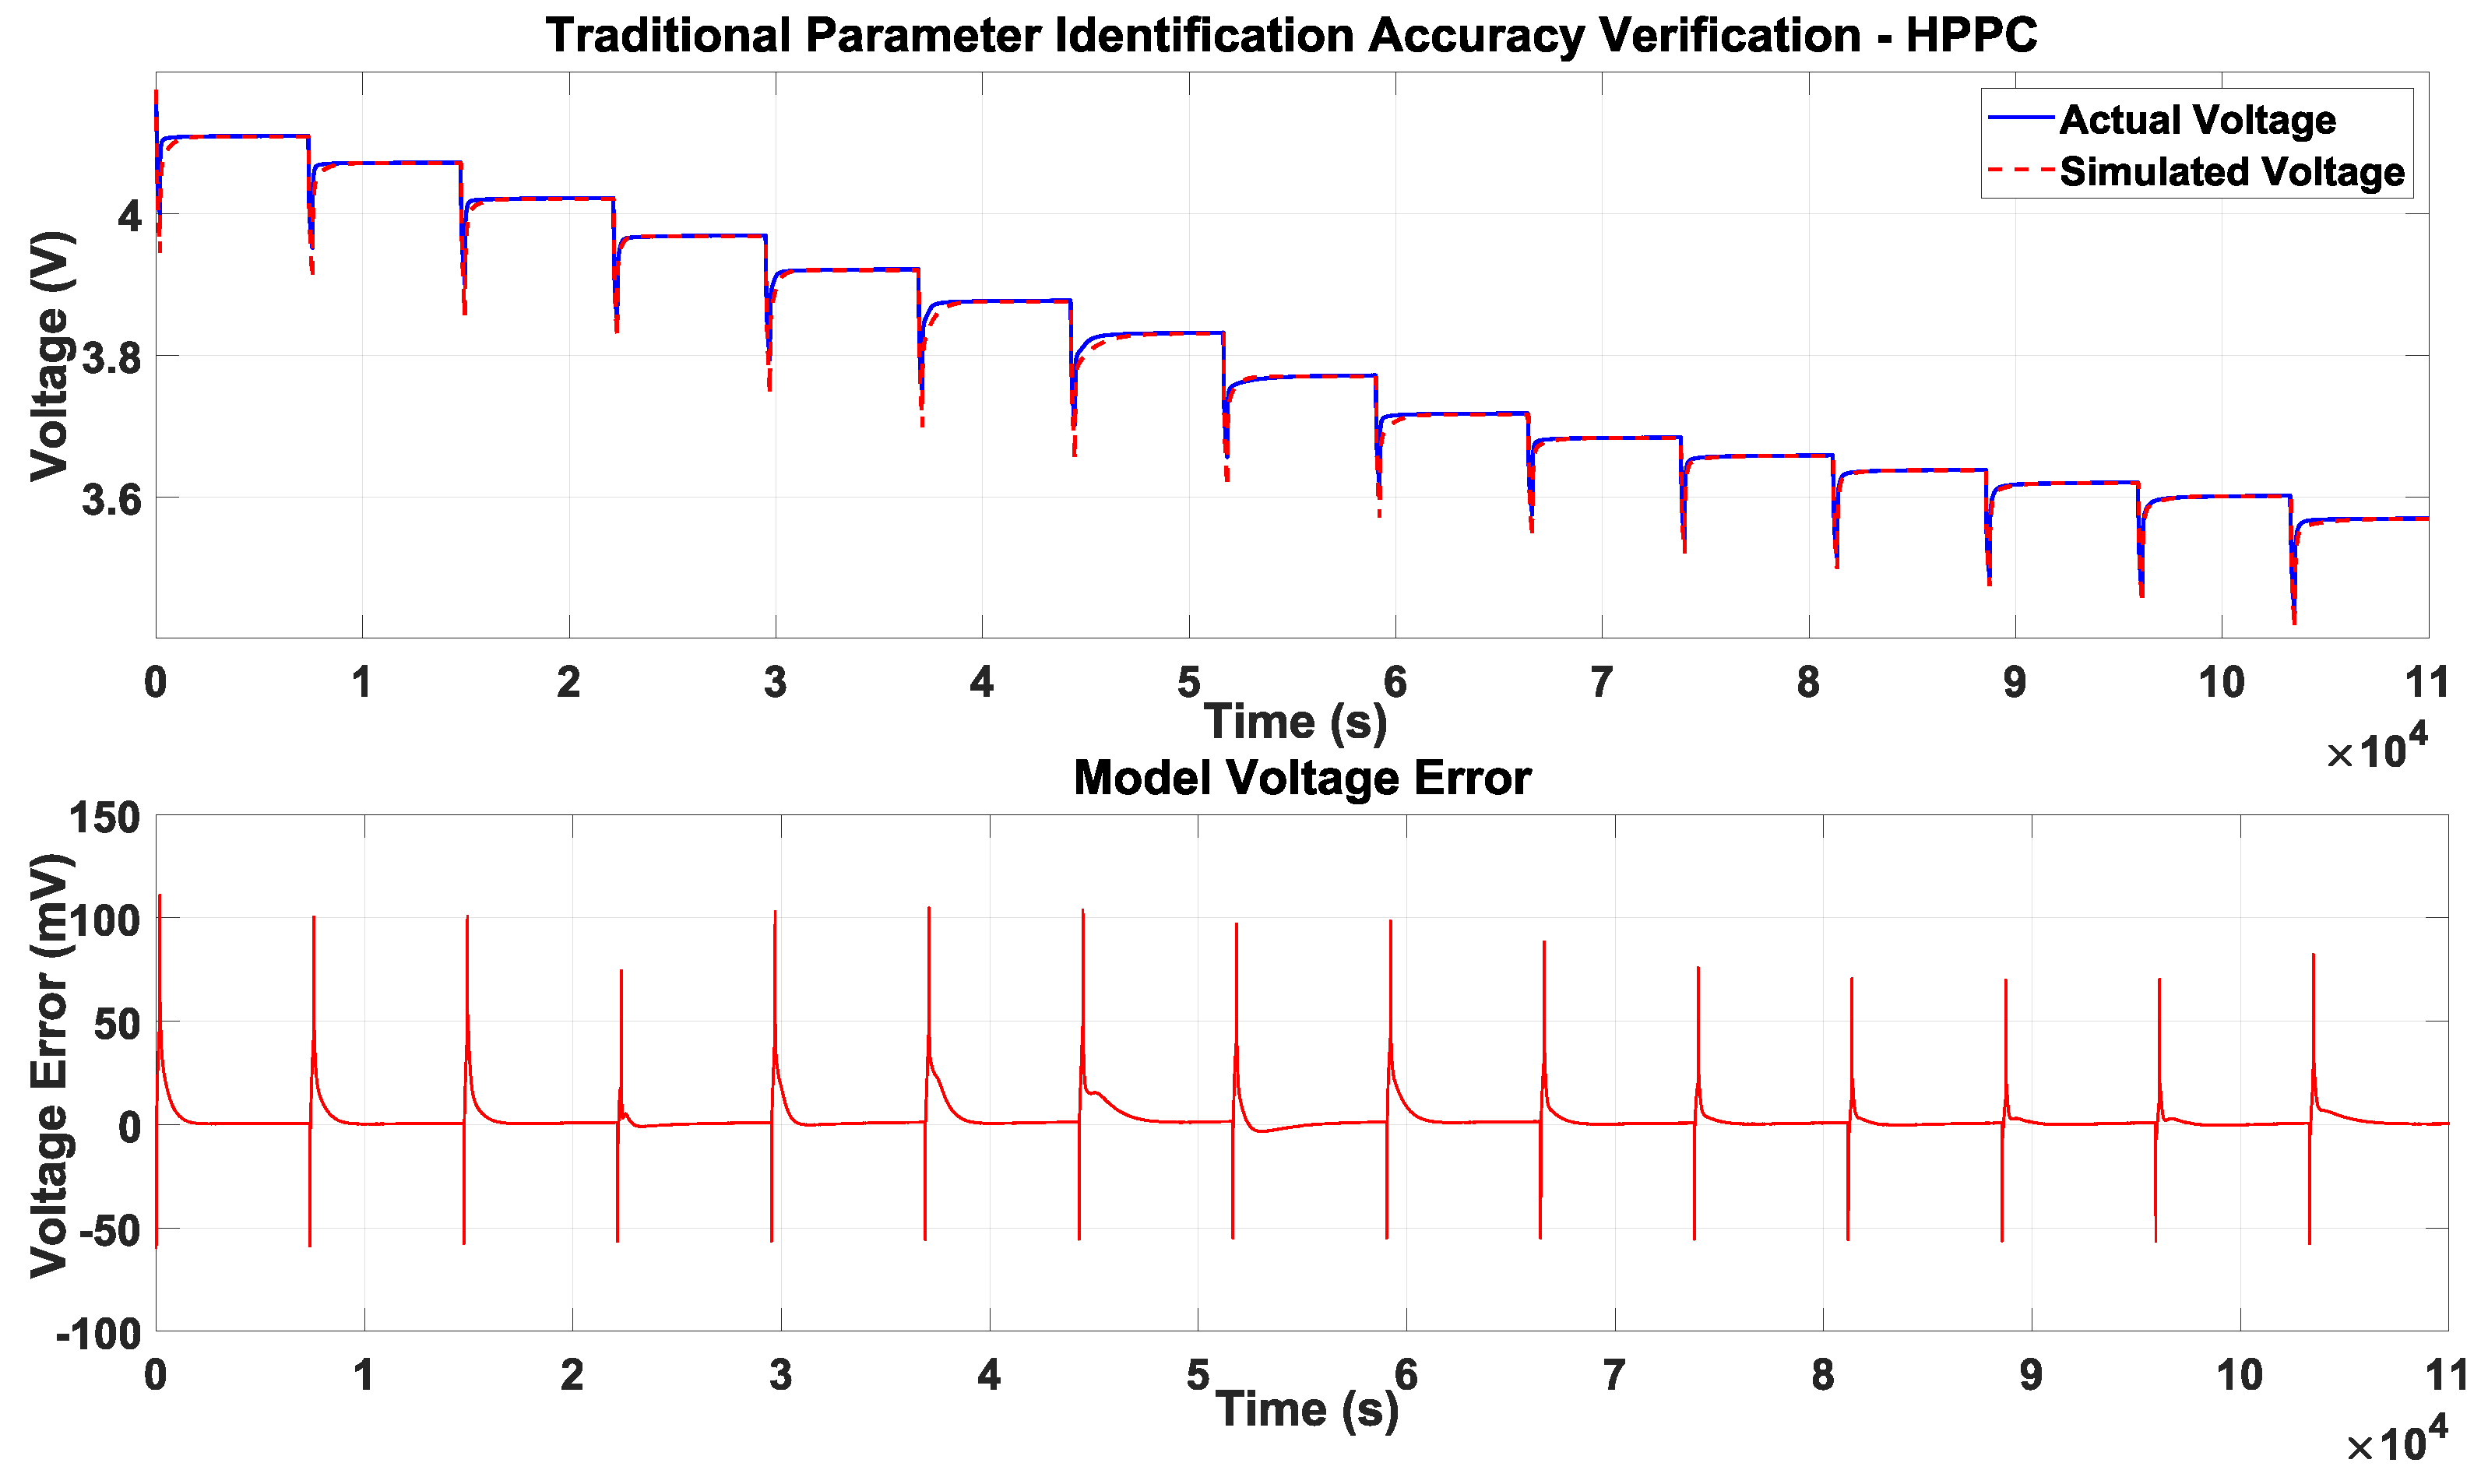
First, the performance of the traditional method (using a fixed 2-h relaxation window) is evaluated. As shown in
Figure 5, where the red dashed line represents the model simulation and the blue solid line denotes the actual measured voltage, the model exhibits significant voltage prediction deviations. The error subplot reveals large spikes reaching up to 100 mV, confirming that arbitrarily extending the data window introduces excessive measurement noise into the fitting process, thereby degrading parameter accuracy.
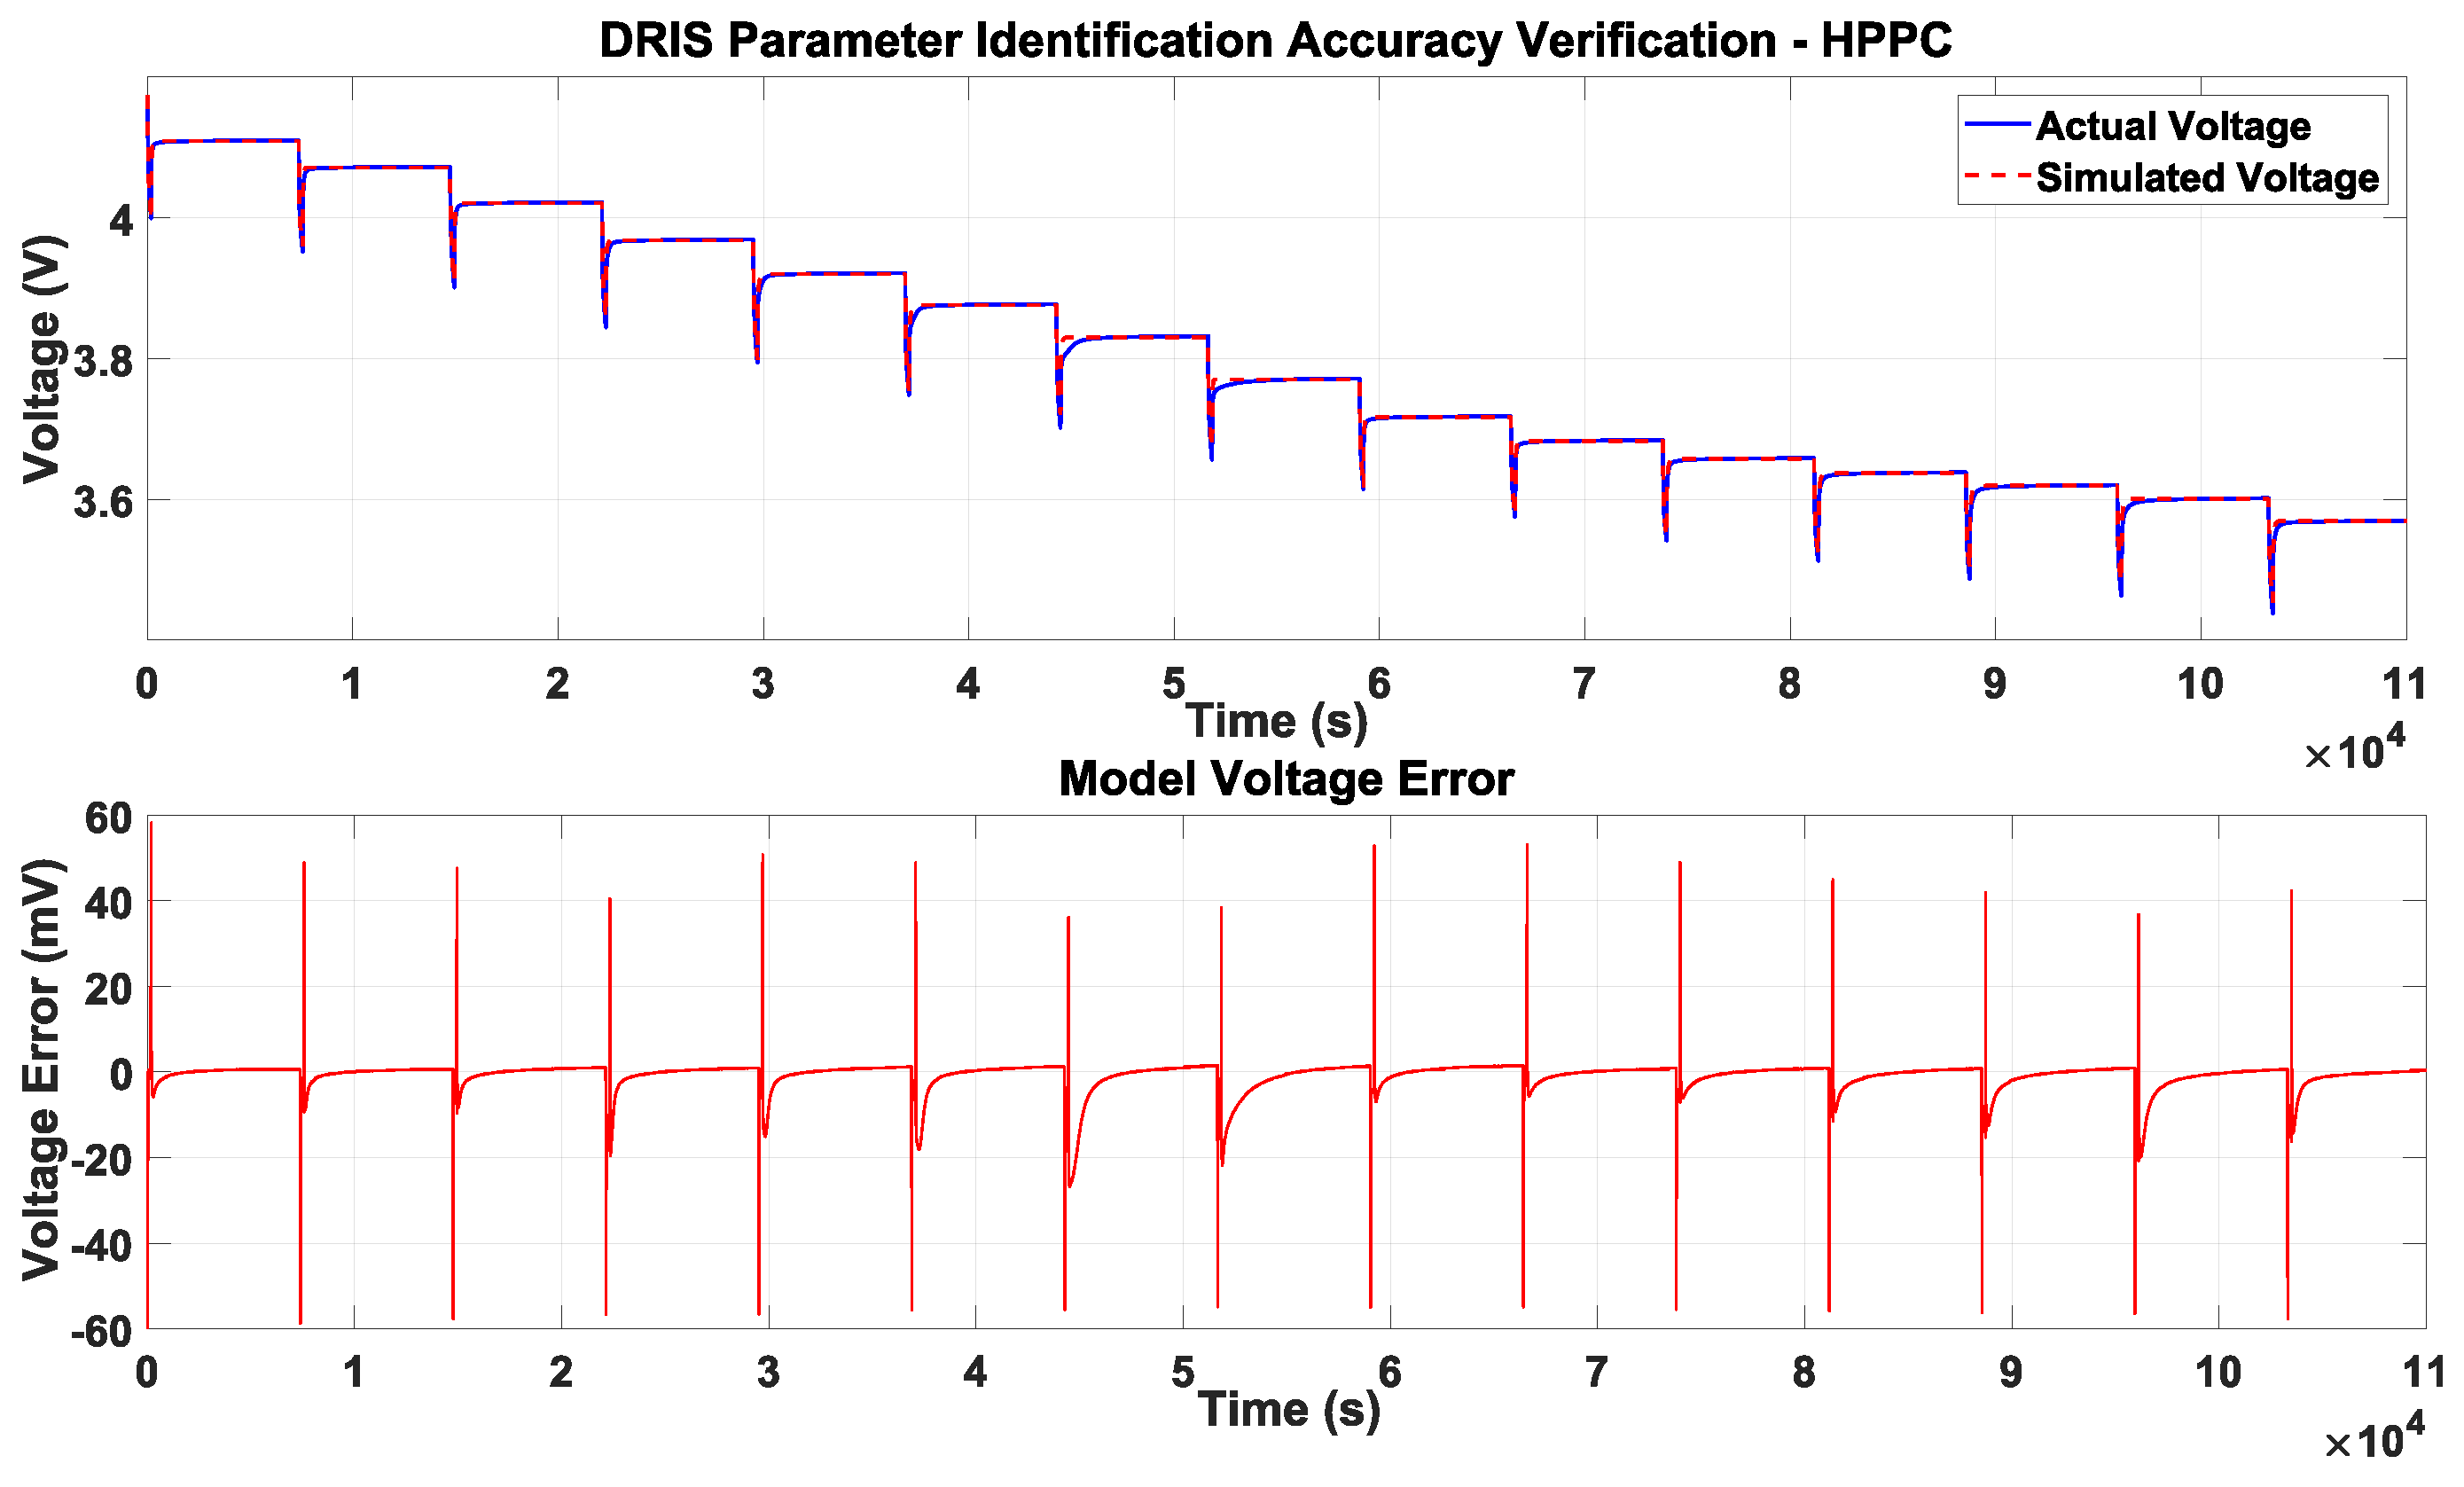
In contrast, the verification results for the model identified via the proposed DRIS strategy are presented in
Figure 6. Consistent with the benchmark comparison, the red simulation curve tracks the blue measured curve closely. By automatically truncating the data at the optimal
, the model achieves a significantly tighter fit. The peak voltage error is suppressed to below 50 mV, and the overall RMSE is reduced from 6.22 mV (Traditional) to 3.39 mV (DRIS). This 45.5% quantitative improvement demonstrates that the DRIS-based anchors provide a much higher fidelity representation of the battery dynamics.
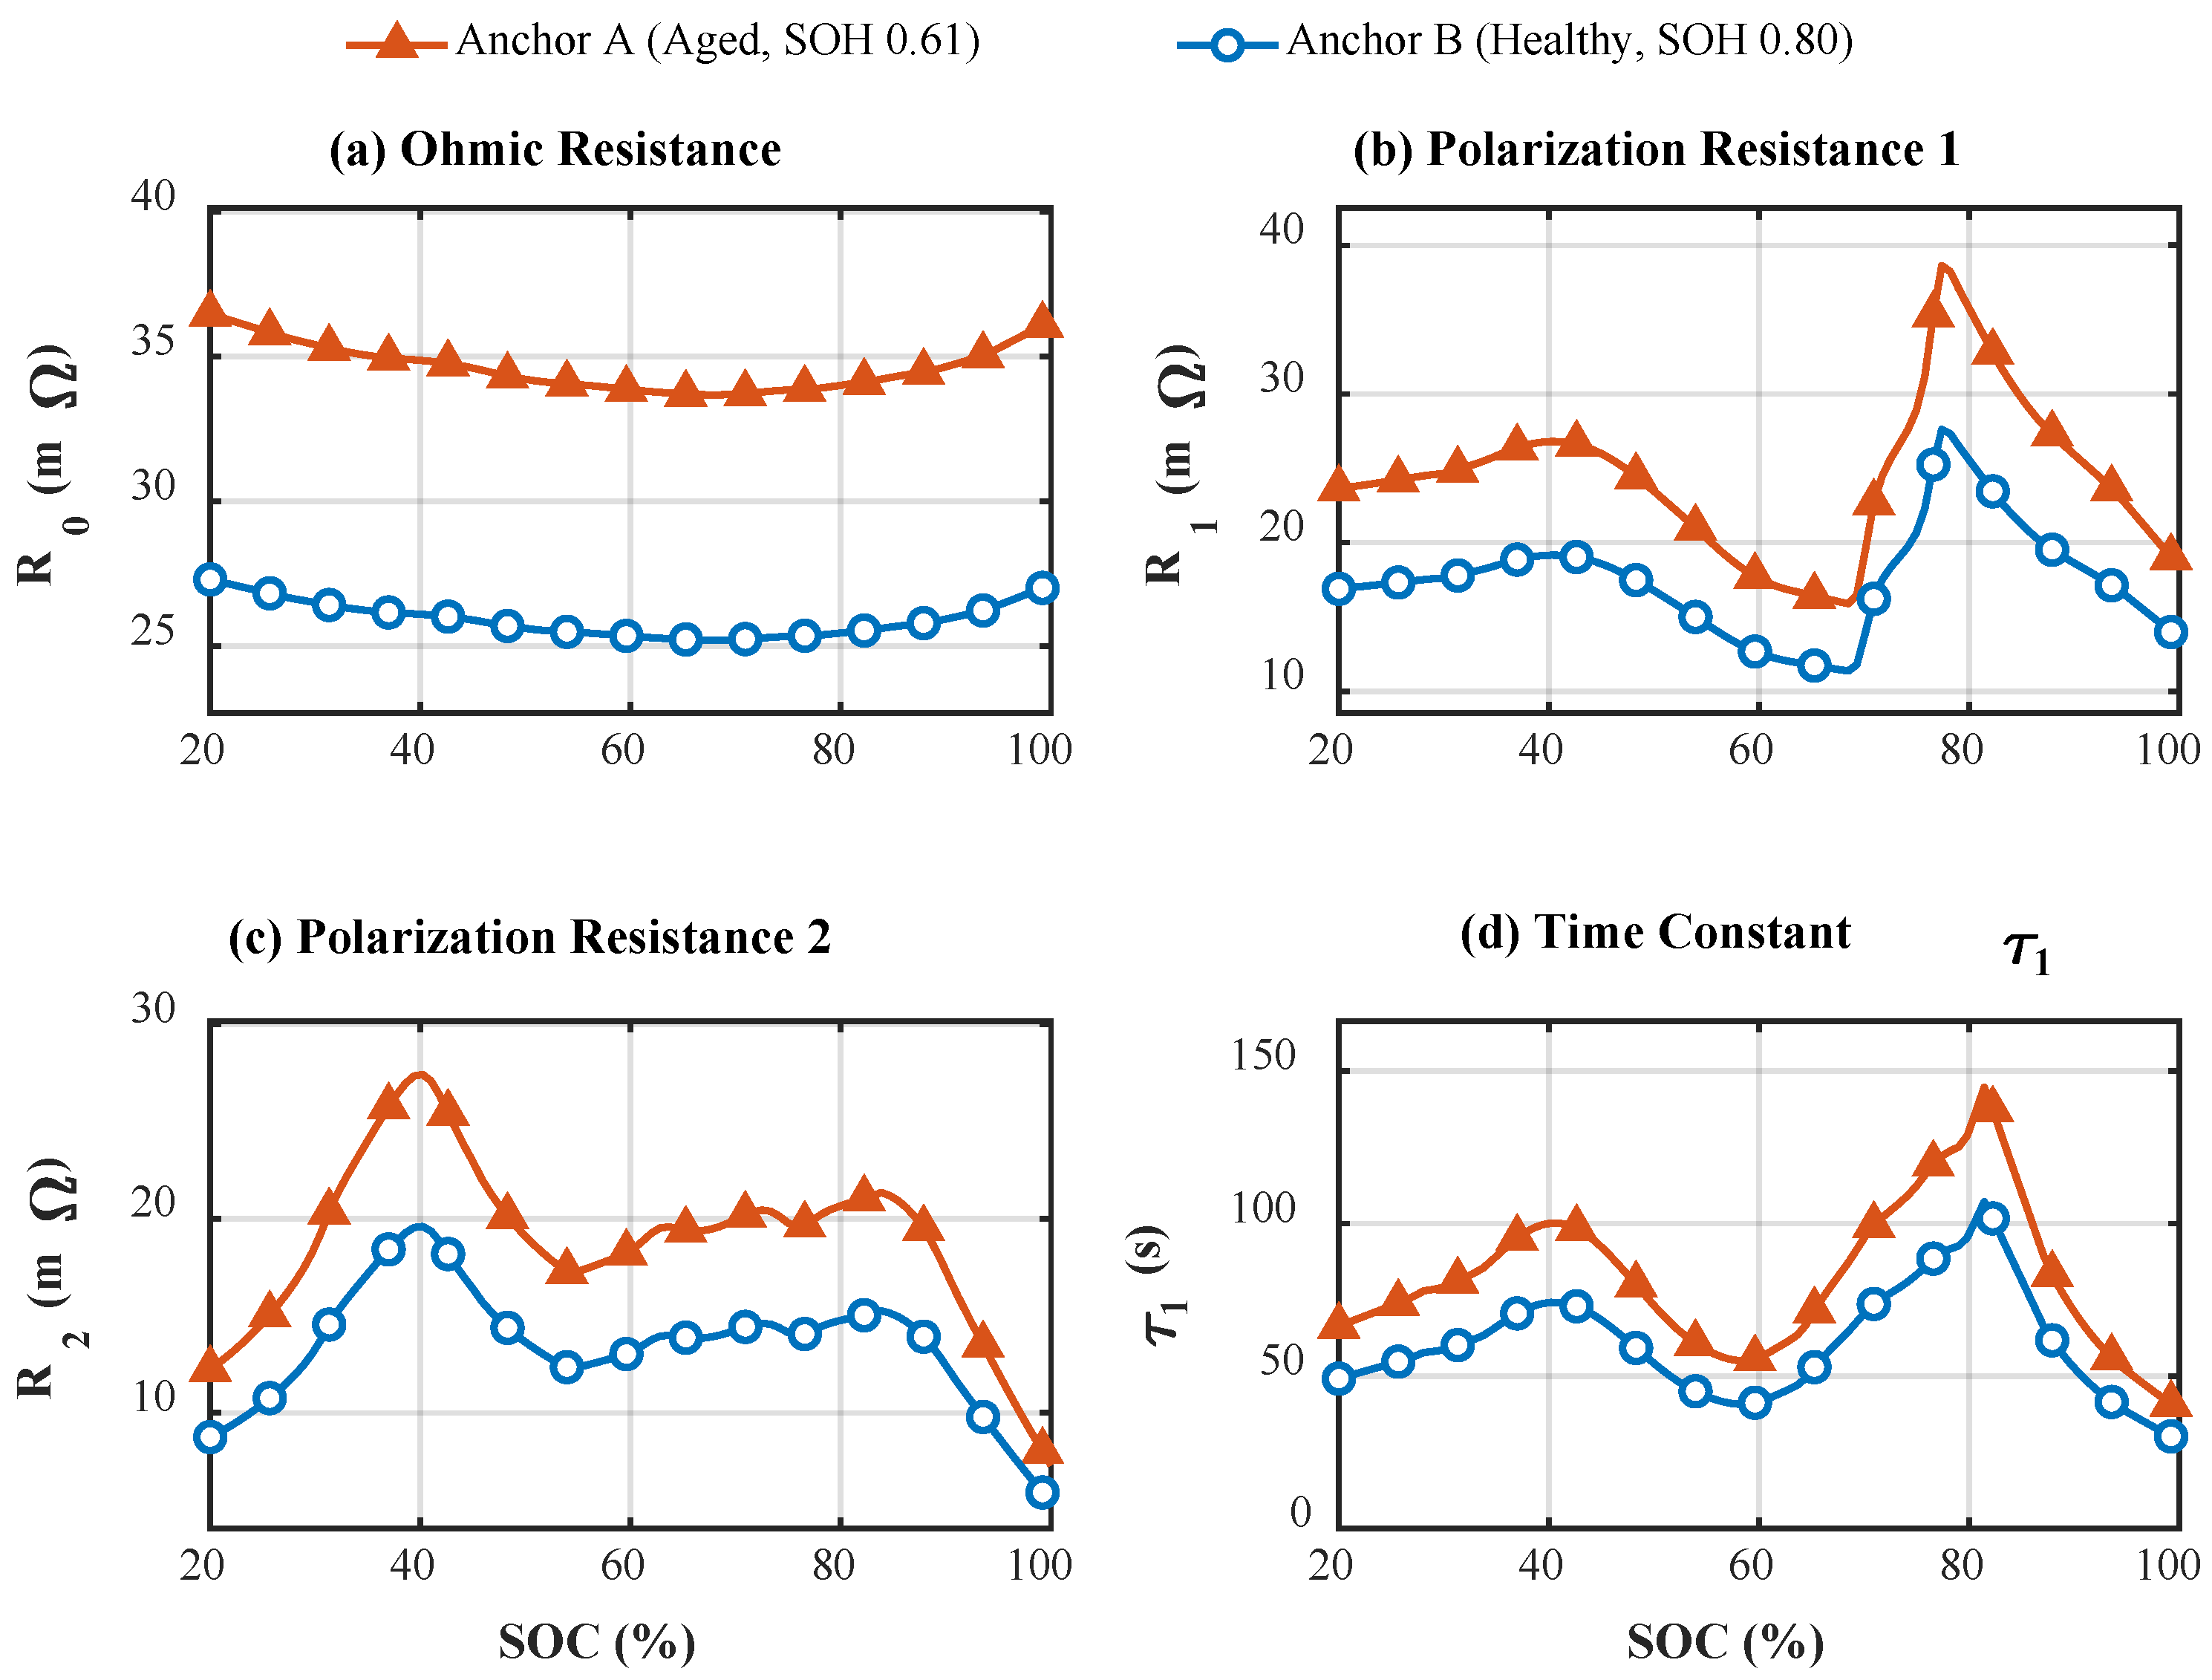
Finally, the physical consistency of the identified anchors is visually verified in
Figure 7.
Figure 7 provides a comprehensive comparison of the identified parameters. The results exhibit strong physical consistency and provide a clear envelope for the subsequent fusion:
First, a distinct impedance separation is observed across the entire operating range (20–100% SOC). The aged anchor (Anchor A, red line) consistently exhibits higher ohmic (R0) and polarization resistances (R1, R2) compared to the healthy anchor (Anchor B, blue line). For instance, the R0 of Anchor A is approximately 25–30% higher, effectively capturing the degradation-induced impedance rise.
Second, despite the magnitude differences, the parameter trajectories of both anchors follow consistent dynamic trends with respect to SOC (e.g., the characteristic peaks in R1 and R2 around 40% and 80% SOC). This indicates that the DRIS strategy successfully filters out measurement noise and captures the underlying electrochemical properties of the NCM chemistry.
Third, the time constants (τ) demonstrate excellent stability, avoiding the erratic fluctuations often seen in traditional identification methods. These distinct and stable parameter sets confirm that Anchor A and Anchor B form a reliable boundary space, which is a prerequisite for the proposed adaptive fusion framework.
3. Adaptive Dual-Anchor Fusion Framework
3.1. Structure of the Dual-Anchor Observer
Based on the high-fidelity parameters identified via the DRIS strategy in
Section 2, we establish two distinct observer models, defined as the “Anchor Models”. Let model
represent the battery state at a lower health condition (e.g., SOH = 0.61) and
represent the state at a higher health condition (e.g., SOH = 0.80).
These two models run in parallel to form a state-estimation envelope. Following the standard discrete-time state-space realization of the second-order (two-RC) Thevenin ECM widely used in model-based battery estimation, we define the state vector as
and update SOC via Coulomb counting. By applying zero-order-hold (ZOH) discretization to the continuous-time polarization dynamics over each sampling interval
, the discrete-time state-space equations for the
i-th anchor model (
i ∈ {A,B}) are formulated as follows. The exponential terms in Equations (7) and (8) arise from the analytical ZOH discretization of the first-order RC polarization dynamics, determined by
with time constants
and
[
38,
39].
For the
i-th anchor model
i ∈ {A, B} the discrete state-space equations are formulated as Equations (5) and (6), with the system matrices explicitly defined in Equations (7) and (8):
Here,
is the calibrated capacity of the
i-th anchor model.
represents the Coulombic efficiency. Since the focus of this study is on the fusion algorithm and the battery operates within a normal temperature range,
is assumed to be unity, as the validation is performed under controlled laboratory conditions with negligible side reactions. The system matrices
and
are populated using the high-fidelity physical parameters
rigorously extracted via the DRIS strategy in
Section 2.
Critically, unlike traditional adaptive filters that tune parameters online (which risks divergence), the parameters in our anchor models are fixed. The adaptation is achieved solely through the dynamic weighting mechanism described below.
3.2. Observability and Stability Analysis of the Anchor Models
Before implementing the fusion estimation, it is essential to verify the observability and stability of the discrete-time state-space models constructed in
Section 3.1. These properties determine whether the internal states (SOC and polarization voltages) can be accurately reconstructed from the terminal voltage measurements and whether the estimation error remains bounded.
The system described by Equations (5) and (6) is locally linearized at each time step
. The Jacobian matrix of the measurement equation
with respect to the state vector
is defined as:
Let
be the state transition matrix defined in Equation (7). Substituting the diagonal matrix
, the observability matrix
expands to:
For the system to be observable, the observability matrix must be full rank, i.e., rank = 3. By performing Gaussian elimination, it can be proven that the rank condition is satisfied if and only if the slope of the OCV curve and the time constants are distinct, i.e., . For the NCM battery used in this study, the OCV curve is strictly monotonic across the operating range, and the identified time constants naturally differ by an order of magnitude. Therefore, the proposed dual-anchor models are locally observable, ensuring the feasibility of the EKF algorithm.
Furthermore, the stability of the discrete-time system is determined by the eigenvalues of the state transition matrix
. As shown in Equation (7),
is a diagonal matrix, so its eigenvalues are its diagonal elements:
Since time constants and sampling interval , the eigenvalues for the polarization states satisfy , indicating that the polarization dynamics are asymptotically stable. Although the eigenvalue corresponds to the SOC integration process representing a marginally stable system, the stability of the estimation error dynamics in the closed-loop EKF observer is guaranteed by the Kalman gain , provided that the system is observable and the noise covariance matrices Q and R are positive definite. Consequently, the proposed framework satisfies the stability requirements for real-time control systems.
3.3. Residual-Driven Likelihood Assessment
To evaluate the fitness of each anchor model for the current target battery, the algorithm calculates the instantaneous output residual,
, defined as the difference between the measured terminal voltage
and the model-predicted voltage
, as shown in Equation (12):
Assuming the measurement noise follows a Gaussian distribution, the likelihood of the
i-th model matching the true battery state at time step
can be quantified using a Gaussian probability density function, given by Equation (13):
Here, is a tuning parameter representing the tolerance for voltage mismatch. Since the weights are normalized in the subsequent step (Equation (15)), the constant coefficient of the probability density function is omitted; the likelihood is thus expressed as proportional to the exponential term. In this study, the tuning parameter σ is set to 0.015 V. Although the data acquisition system possesses a high resolution, a conservative tolerance (larger than the physical noise floor) was selected. This robustness-oriented tuning effectively desensitizes the weighting mechanism to transient outliers and high-frequency measurement noise, ensuring that the weight adaptation is driven solely by significant impedance mismatches. A higher likelihood indicates that the impedance characteristics of the target battery at the current moment are closer to those of anchor model .
3.4. Recursive Weight Update with Fading Memory
Directly using the instantaneous likelihood for fusion may lead to jitter due to sensor noise. Conversely, a simple cumulative average limits the system’s ability to track time-varying behaviors (e.g., dynamic impedance changes under load). To balance stability and responsiveness, we introduce a recursive Bayesian update law with a fading memory factor
(Equation (14)), followed by the normalization step in Equation (15):
where
is the normalized weight of model
. The factor
(set to 0.99 in this study) serves as a “forgetting” mechanism. It prevents the weights from locking onto a single model history, ensuring the algorithm remains sensitive to instantaneous nonlinear polarization responses, as visualized later in the experimental results.
From a theoretical perspective, the essence of this recursive weight update mechanism is a Maximum Likelihood Estimation (MLE) process constrained by the physical boundaries of the anchor models. Unlike neural networks that minimize a global loss function via backpropagation, our framework performs instantaneous impedance matching. The adaptive weight serves as a dynamic ‘slider,’ automatically positioning the target battery within the convex parameter set defined by the aged and healthy anchors. This ensures that the estimation is not only numerically optimized but also electrochemically plausible, as it physically maps the target’s degradation state onto the trajectory established by the high-fidelity DRIS anchors.
The recursive process is initialized with equal weights, i.e., , reflecting an unbiased initial estimation of the battery’s SOH.
3.5. Fusion Estimation and SOH Soft-Sensing
Based on the recursive weight update mechanism derived above, the complete workflow of the proposed framework is summarized in Algorithm 1. This algorithm integrates the dual-model EKF prediction (Time Update) with the Bayesian weight correction (Measurement Update) into a unified real-time loop. Crucially, in Step 2.3, the fused SOC is computed as the weighted sum of the states from both anchors, while the SOH is simultaneously inferred (‘soft-sensed’) by mapping the adaptive weights onto the known aging boundaries (SOH A and SOH B).
The final estimated SOC is derived from the weighted sum of the states from both independent EKFs, as expressed in Equation (16):
Furthermore, a novel capability of this framework is the “Soft-Sensing” of the battery’s health state. Since the anchor models
and
correspond to known, fixed SOH values (
and
), the fusion weights inherently reflect the relative position of the target battery within this aging parameter space. The estimated SOH can thus be inferred using Equation (17):
The validity of this linear interpolation relies on the concept of local linearity. While the degradation trajectory of lithium-ion batteries is globally nonlinear over their full lifecycle, the parameter evolution within the bounded interval defined by the two anchors (e.g., SOH range of 0.61–0.80) can be effectively approximated as linear. Since the fusion weights are dynamically calculated based on the instantaneous impedance match between the target battery and the anchor models, they serve as a reliable metric for determining the target’s relative position within this “piecewise linear” aging envelope. However, it implies that if the SOH interval between anchors is excessively large (e.g., spanning regions with distinct degradation mechanisms), the non-linearity error would increase. In such scenarios, the proposed framework allows for scalability: additional intermediate anchors can be inserted to maintain the validity of the local linearity assumption.
This mechanism enables real-time monitoring of the degradation level without requiring additional capacity test cycles, providing a cost-effective solution for second-life battery management.
| Algorithm 1. Dual-Anchor Adaptive Fusion and SOH Soft-Sensing |
Inputs: Current , Voltage (at time step k), Anchor Models , (Parameters from DRIS strategy)
Outputs: Fused SOC , Estimated SOH
1. Initialization: Initialize state vectors , and covariance matrices , . Set initial fusion weights: .
2. Recursive Loop (for each time step k = 1, 2, …):
Step 2.1: Dual-Model Prediction (Time Update)
for i ∈ {A, B} do
State prediction:
Voltage prediction:
end for
Step 2.2: Adaptive Weight Update (Measurement Update)
Calculate voltage residuals:
Compute likelihood:
Recursive update (with fading factor α):
Normalization:
Step 2.3: State Fusion & SOH Soft-Sensing
Step 2.4: EKF State Correction
Update individual model states using Kalman gain .
3. Return and . |
4. Experimental Setup
4.1. Experimental Platform and Data Acquisition
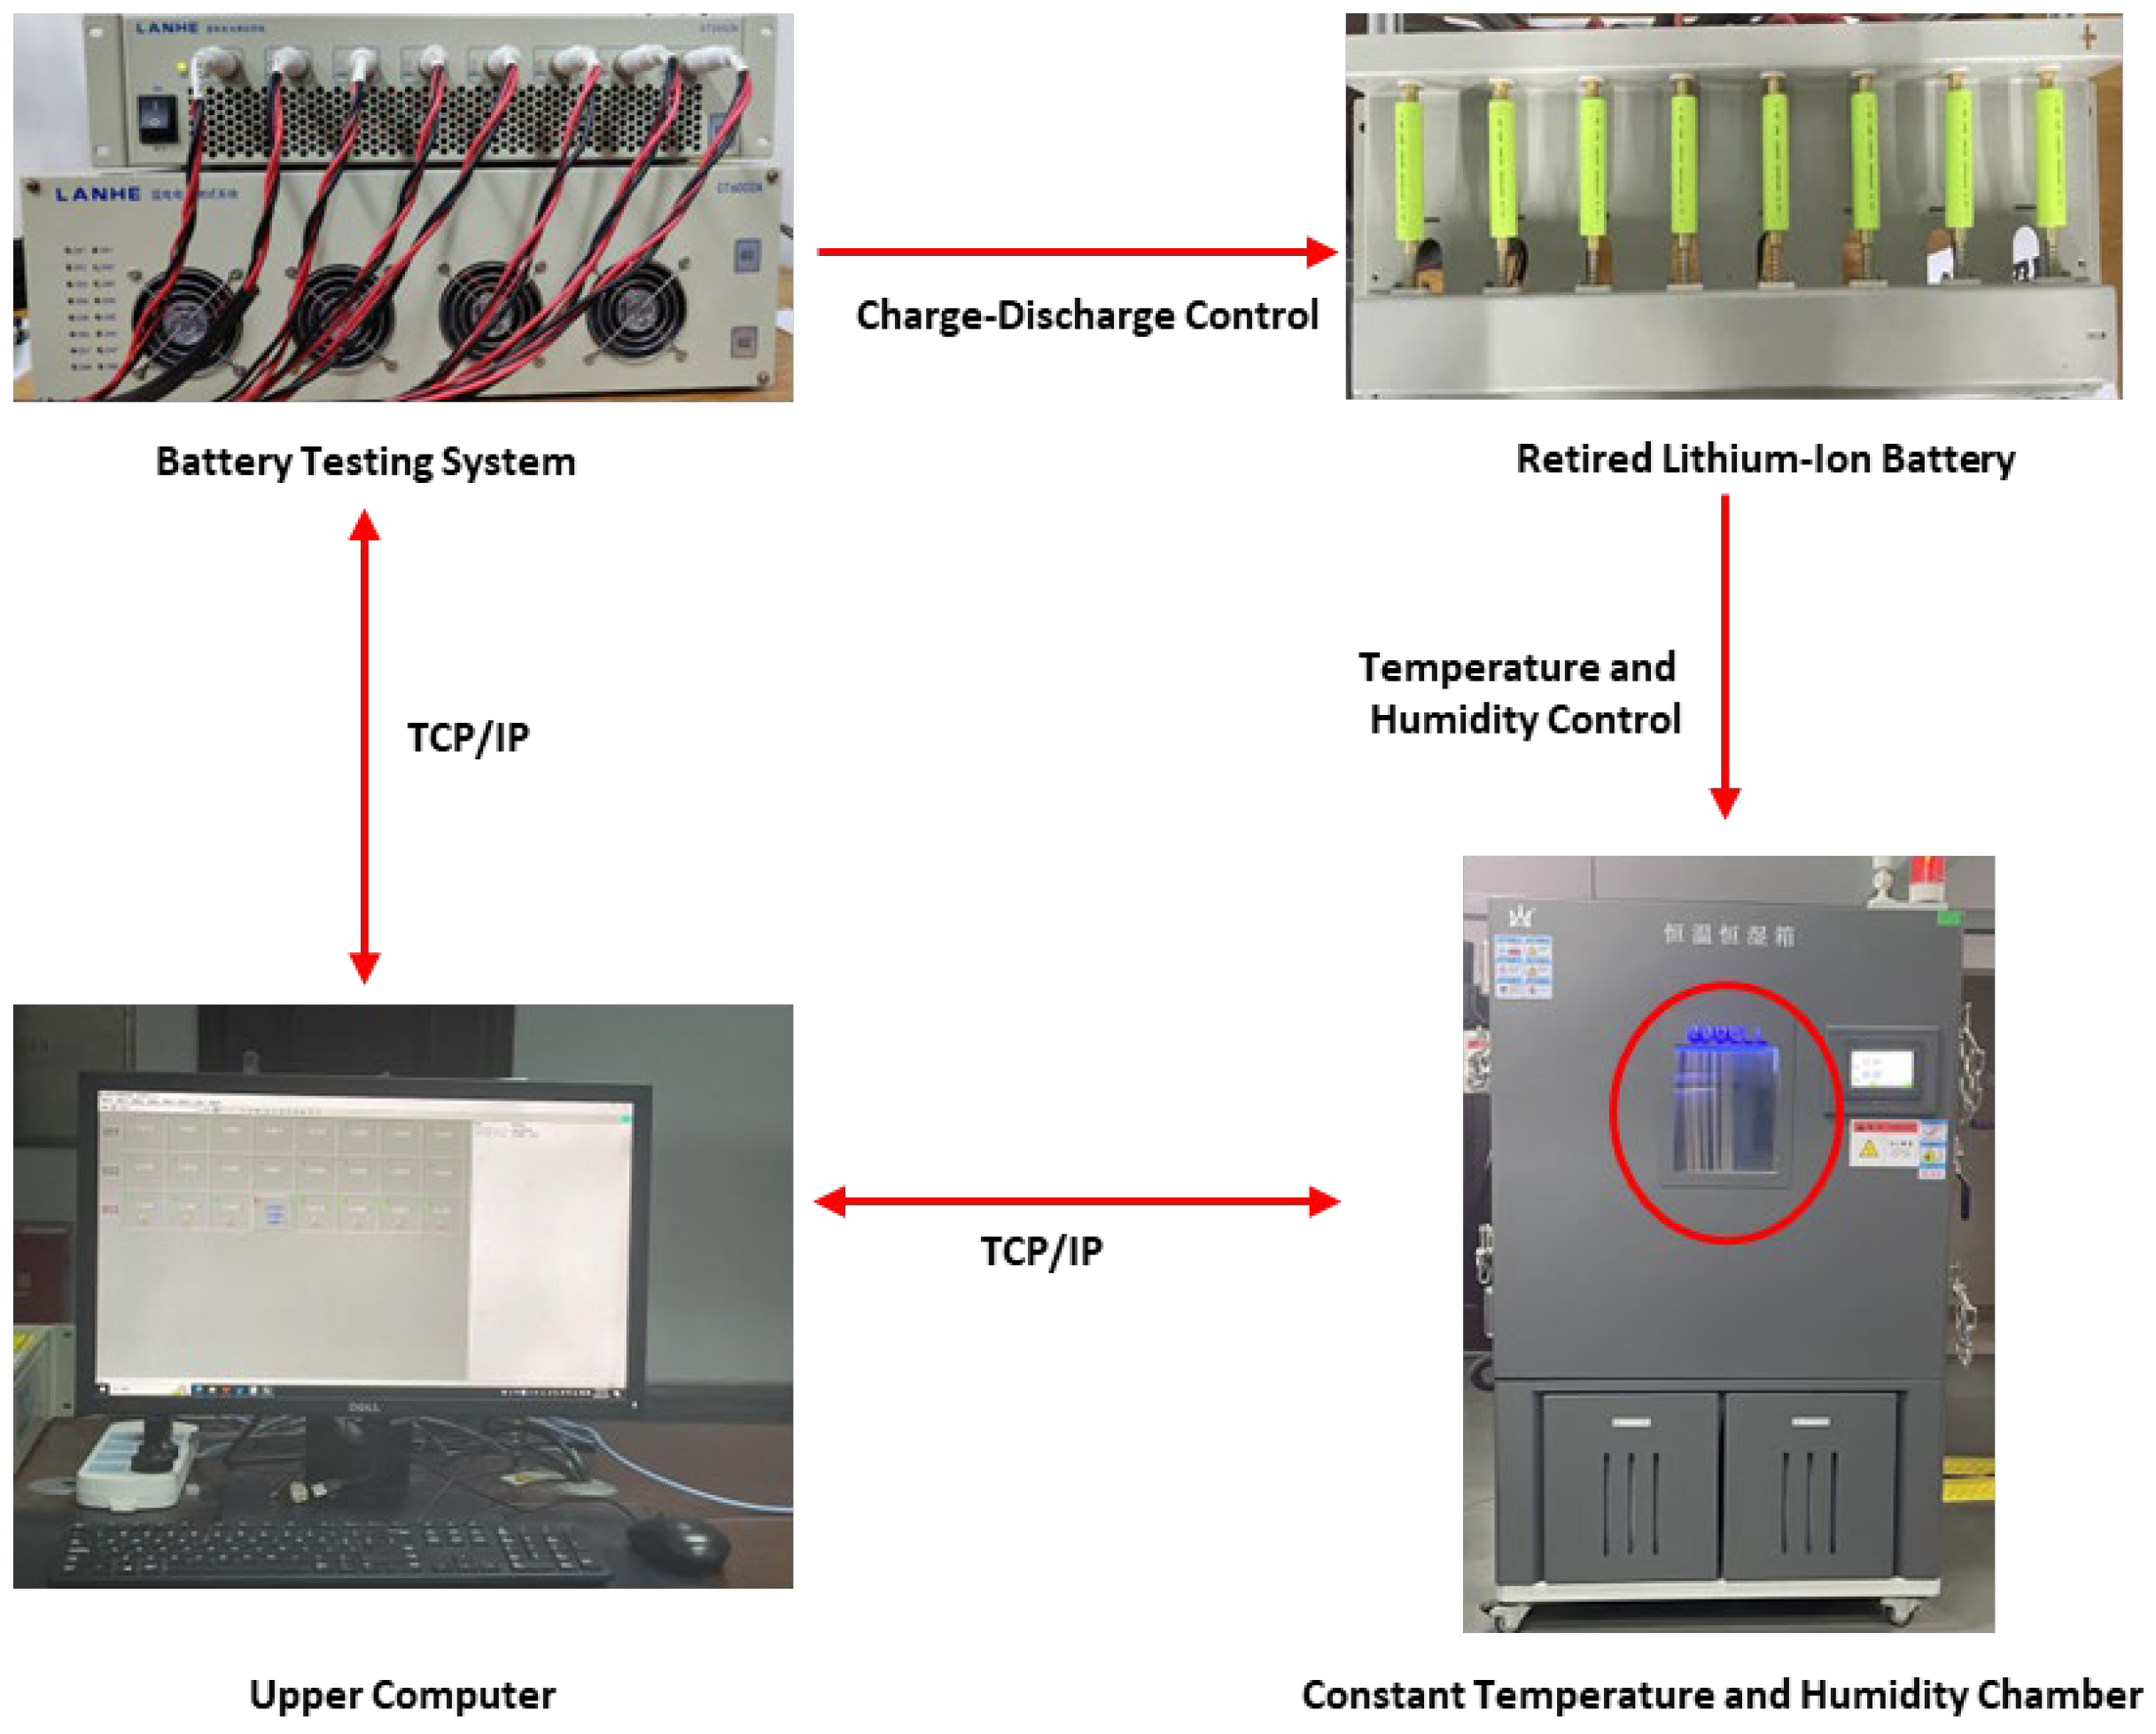
To validate the proposed method using realistic data rather than public datasets, rigorous experiments were conducted on a professional test bench. The experimental platform comprised a LANHE CT6002A battery testing system (Wuhan Land Electronics Co., Ltd., Wuhan, China; 5 V/100 A, 0.05% accuracy) for precise charge–discharge control and a GDBell BTH-1000CT constant temperature and humidity chamber (Guangdong Bell Experiment Equipment Co., Ltd., Guandong, China). As illustrated in
Figure 8, the retired lithium-ion batteries were placed inside the thermal chamber to provide well-controlled ambient temperature conditions. Prior to data acquisition, the batteries were rested for at least 2 h to reach thermal equilibrium with the chamber environment. All experiments were subsequently performed at a constant temperature of 25 °C ± 0.1 °C to eliminate thermal variability. The test subjects were retired prismatic NCM (Ni–Co–Mn) lithium-ion batteries originally designed for automotive applications (nominal capacity: 3.0 Ah; voltage window: 2.75–4.20 V; see
Table 1 for details [
40].
4.2. Dual-Anchor Identification and Blind Validation Scenario
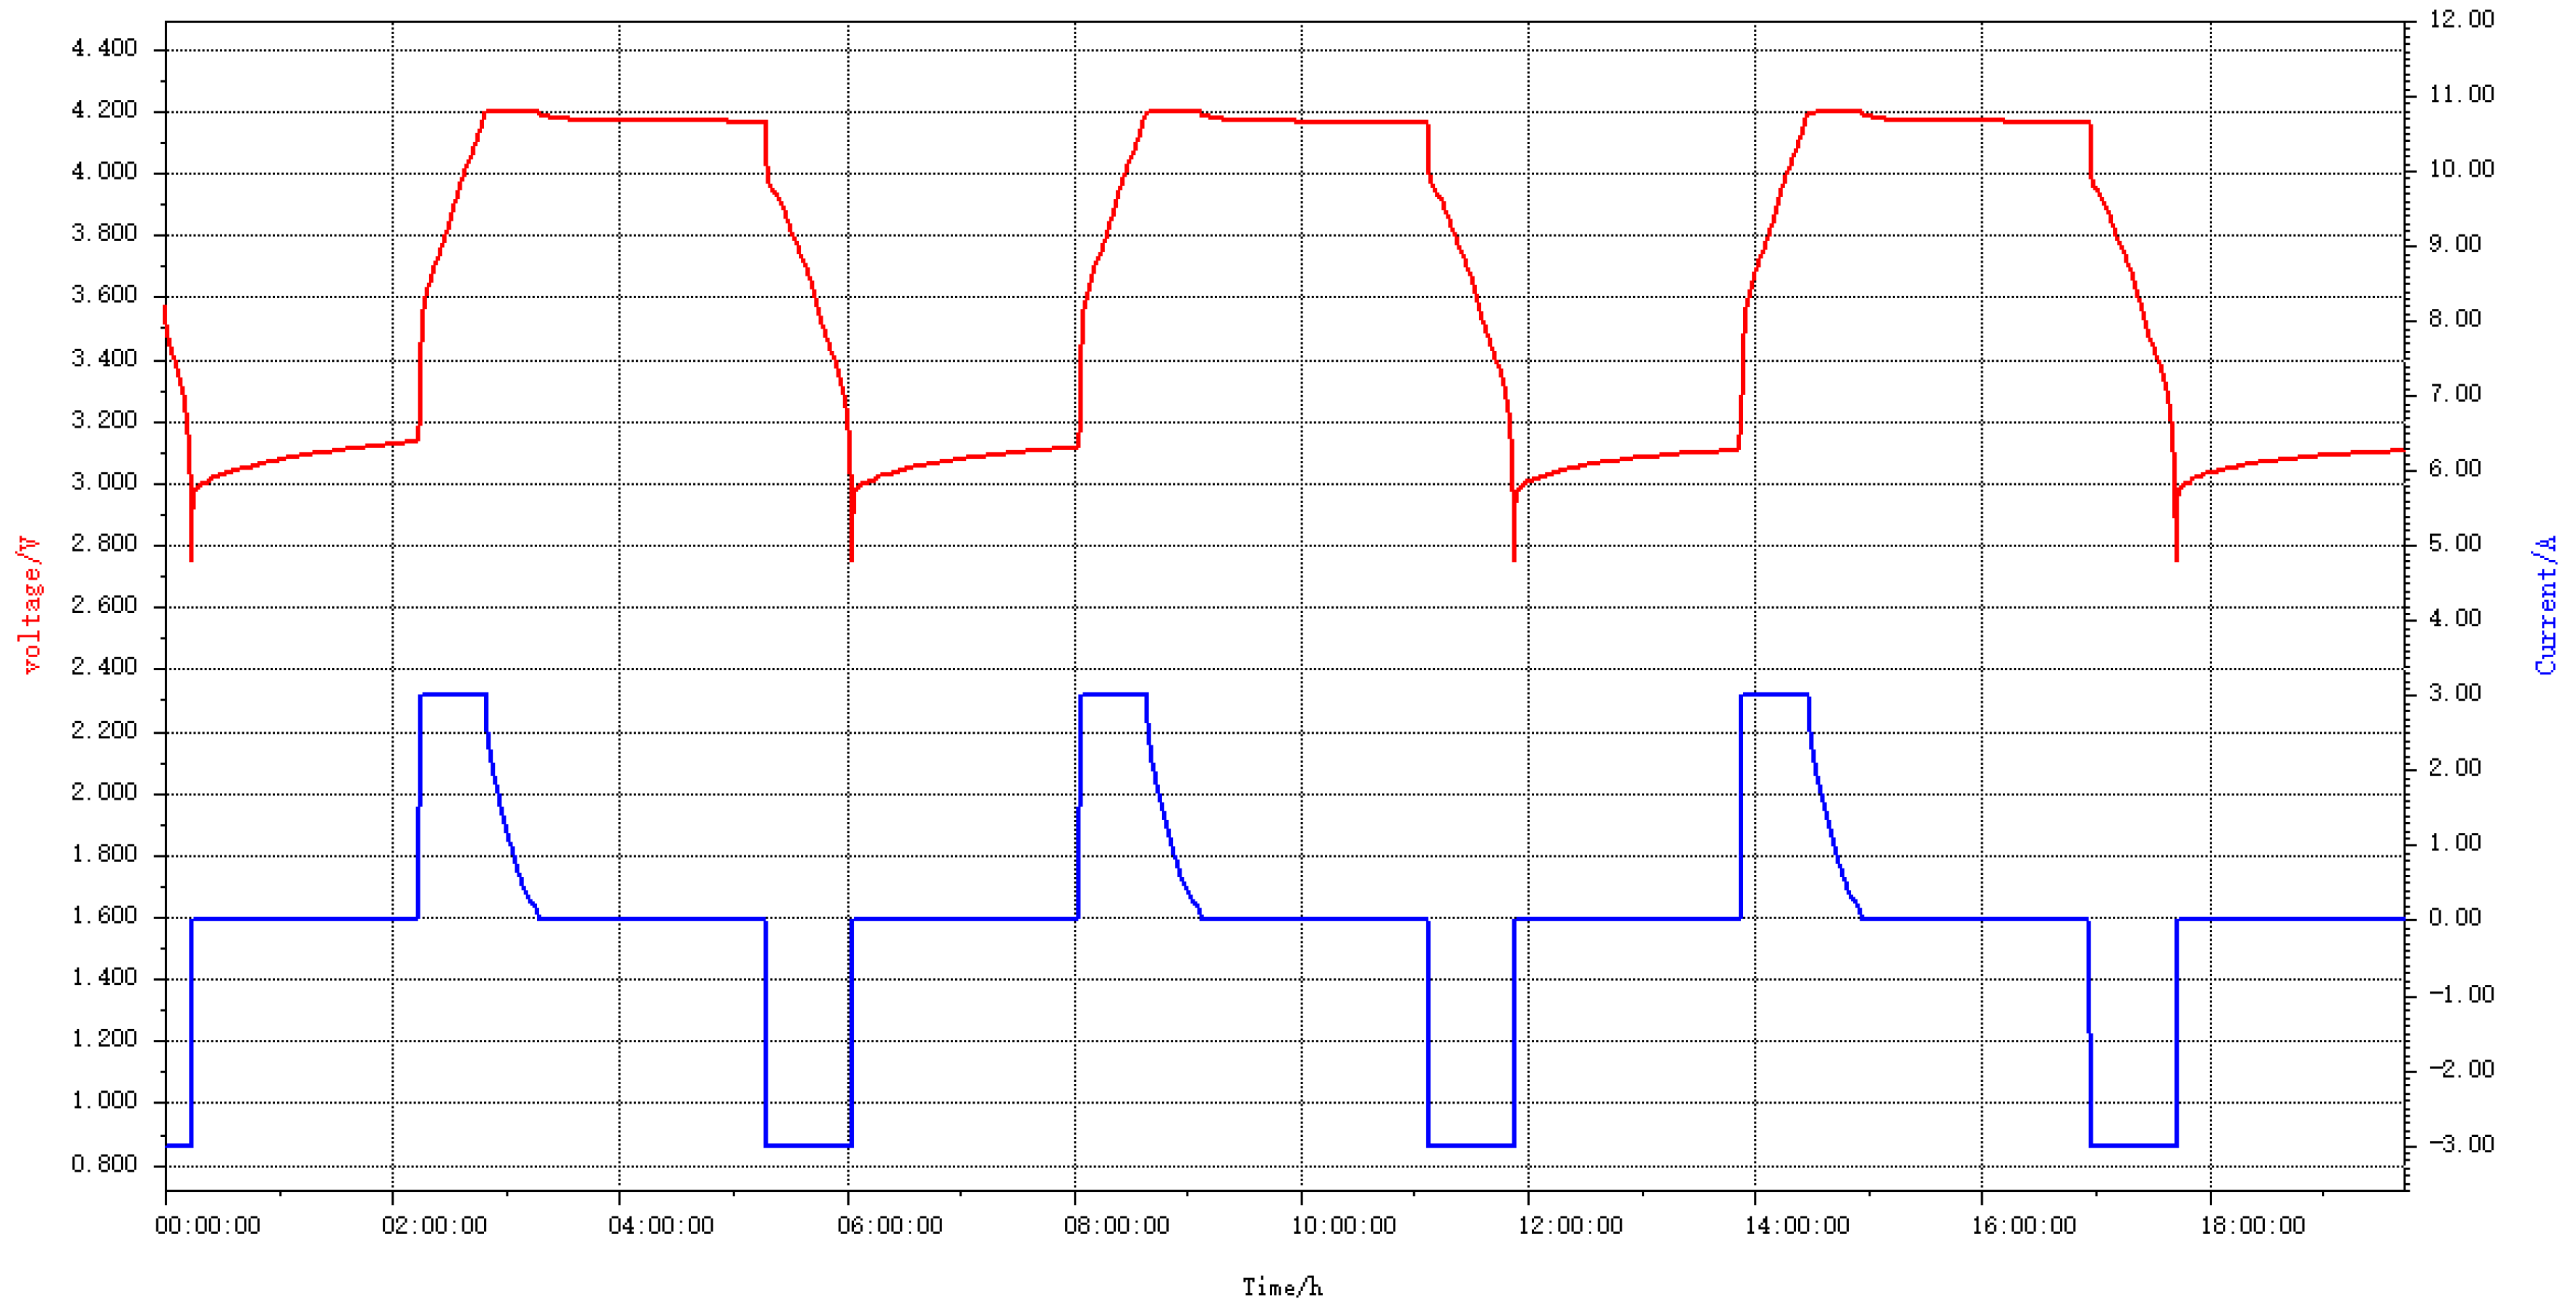
The experimental design consists of two phases: anchor construction and blind validation. Prior to the experiments, the true SOH of each cell was rigorously calibrated. The calibration procedure involved three consecutive static capacity tests at 25 °C, consisting of a constant current–constant voltage (CC-CV) charge at 0.5 C to 4.2 V (cutoff 0.05 C) and a constant current (CC) discharge at 1 C to 2.75 V.
To ensure the reliability of the benchmark values, the capacity calibration test was repeated three times for each cell. yielding a standard deviation of less than 0.3%. The raw experimental data corresponding to these calibration tests is visualized in
Figure 9, where the consistent voltage and current trajectories across the three consecutive cycles empirically verify the stability of the measurement setup.
First, to establish the parameter envelope, two retired cells representing the boundaries of the health status were selected: an aged cell (Anchor A, SOH ≈ 0.61) and a healthier cell (Anchor B, SOH ≈ 0.80). Their high-fidelity parameters were extracted using the DRIS strategy based on HPPC tests, serving as fixed references for the fusion model (as detailed in
Section 2.4). To ensure reproducibility, the specific configuration parameters for the proposed Dual-Anchor Adaptive Fusion algorithm and the underlying EKF observers are explicitly detailed in
Table 2.
Subsequently, to rigorously evaluate the robustness and interpolation capability of the framework, a third battery (“Target A”) was selected for blind validation. Its true SOH was calibrated to be 0.7576.
Target A was strategically selected to lie strictly inside the anchor interval (SOH 0.61–0.80) and close to the mid-range. This selection ensures a valid test of the algorithm’s interpolation capability, as the target’s electrochemical parameters are distinct from both boundary models. The target battery was subjected to a Dynamic Stress Test (DST). It is worth noting that the DST profile is chosen for its comprehensive coverage of dynamic operating conditions, including rapid charge/discharge pulses, varying current rates, and rest periods. This complexity effectively simulates a wide range of real-world driving scenarios, making it a rigorous benchmark for assessing model generalization. To establish a reliable baseline for validation, the reference ‘True SOC’ trajectory was calculated using the Coulomb counting method (Ampere-hour integration). The integration employed the actual discharge capacity of Target A (2.26 Ah, calibrated from the static tests) and relied on the high-precision current measurements from the battery tester (accuracy ± 0.05% F.S.), assuming negligible current sensor bias over the test duration. Furthermore, to eliminate initial offset errors, the initial SOC was strictly calibrated to 100% by fully charging the battery (CC-CV mode) and allowing a 2-h relaxation period before the commencement of the DST profile.
Crucially, this validation was conducted as a “blind test”: the true SOH of Target A was hidden from the fusion algorithm, which was initialized with unbiased weights (. This setup forces the algorithm to infer the battery state solely from instantaneous voltage and current responses, providing a rigorous assessment of its “soft-sensing” capability.
5. Results and Discussion
5.1. Robust SOC Estimation Performance in Blind Test
To verify the robustness and generalization capability of the proposed framework, a rigorous blind validation test was conducted under the Dynamic Stress Test (DST) profile. Unlike data-driven methods that typically require a random split of training and testing datasets (e.g., 70%/30%) to learn aging patterns, the proposed Dual-Anchor framework operates in a completely calibration-free mode. The target battery (Target A, True SOH = 0.7576) was entirely unknown to the algorithm, and no specific data from this battery was used for model training. The algorithm’s task was to estimate the state of this uncharacterized target solely by interpolating between the fixed boundary anchors (SOH 0.61 and 0.80).
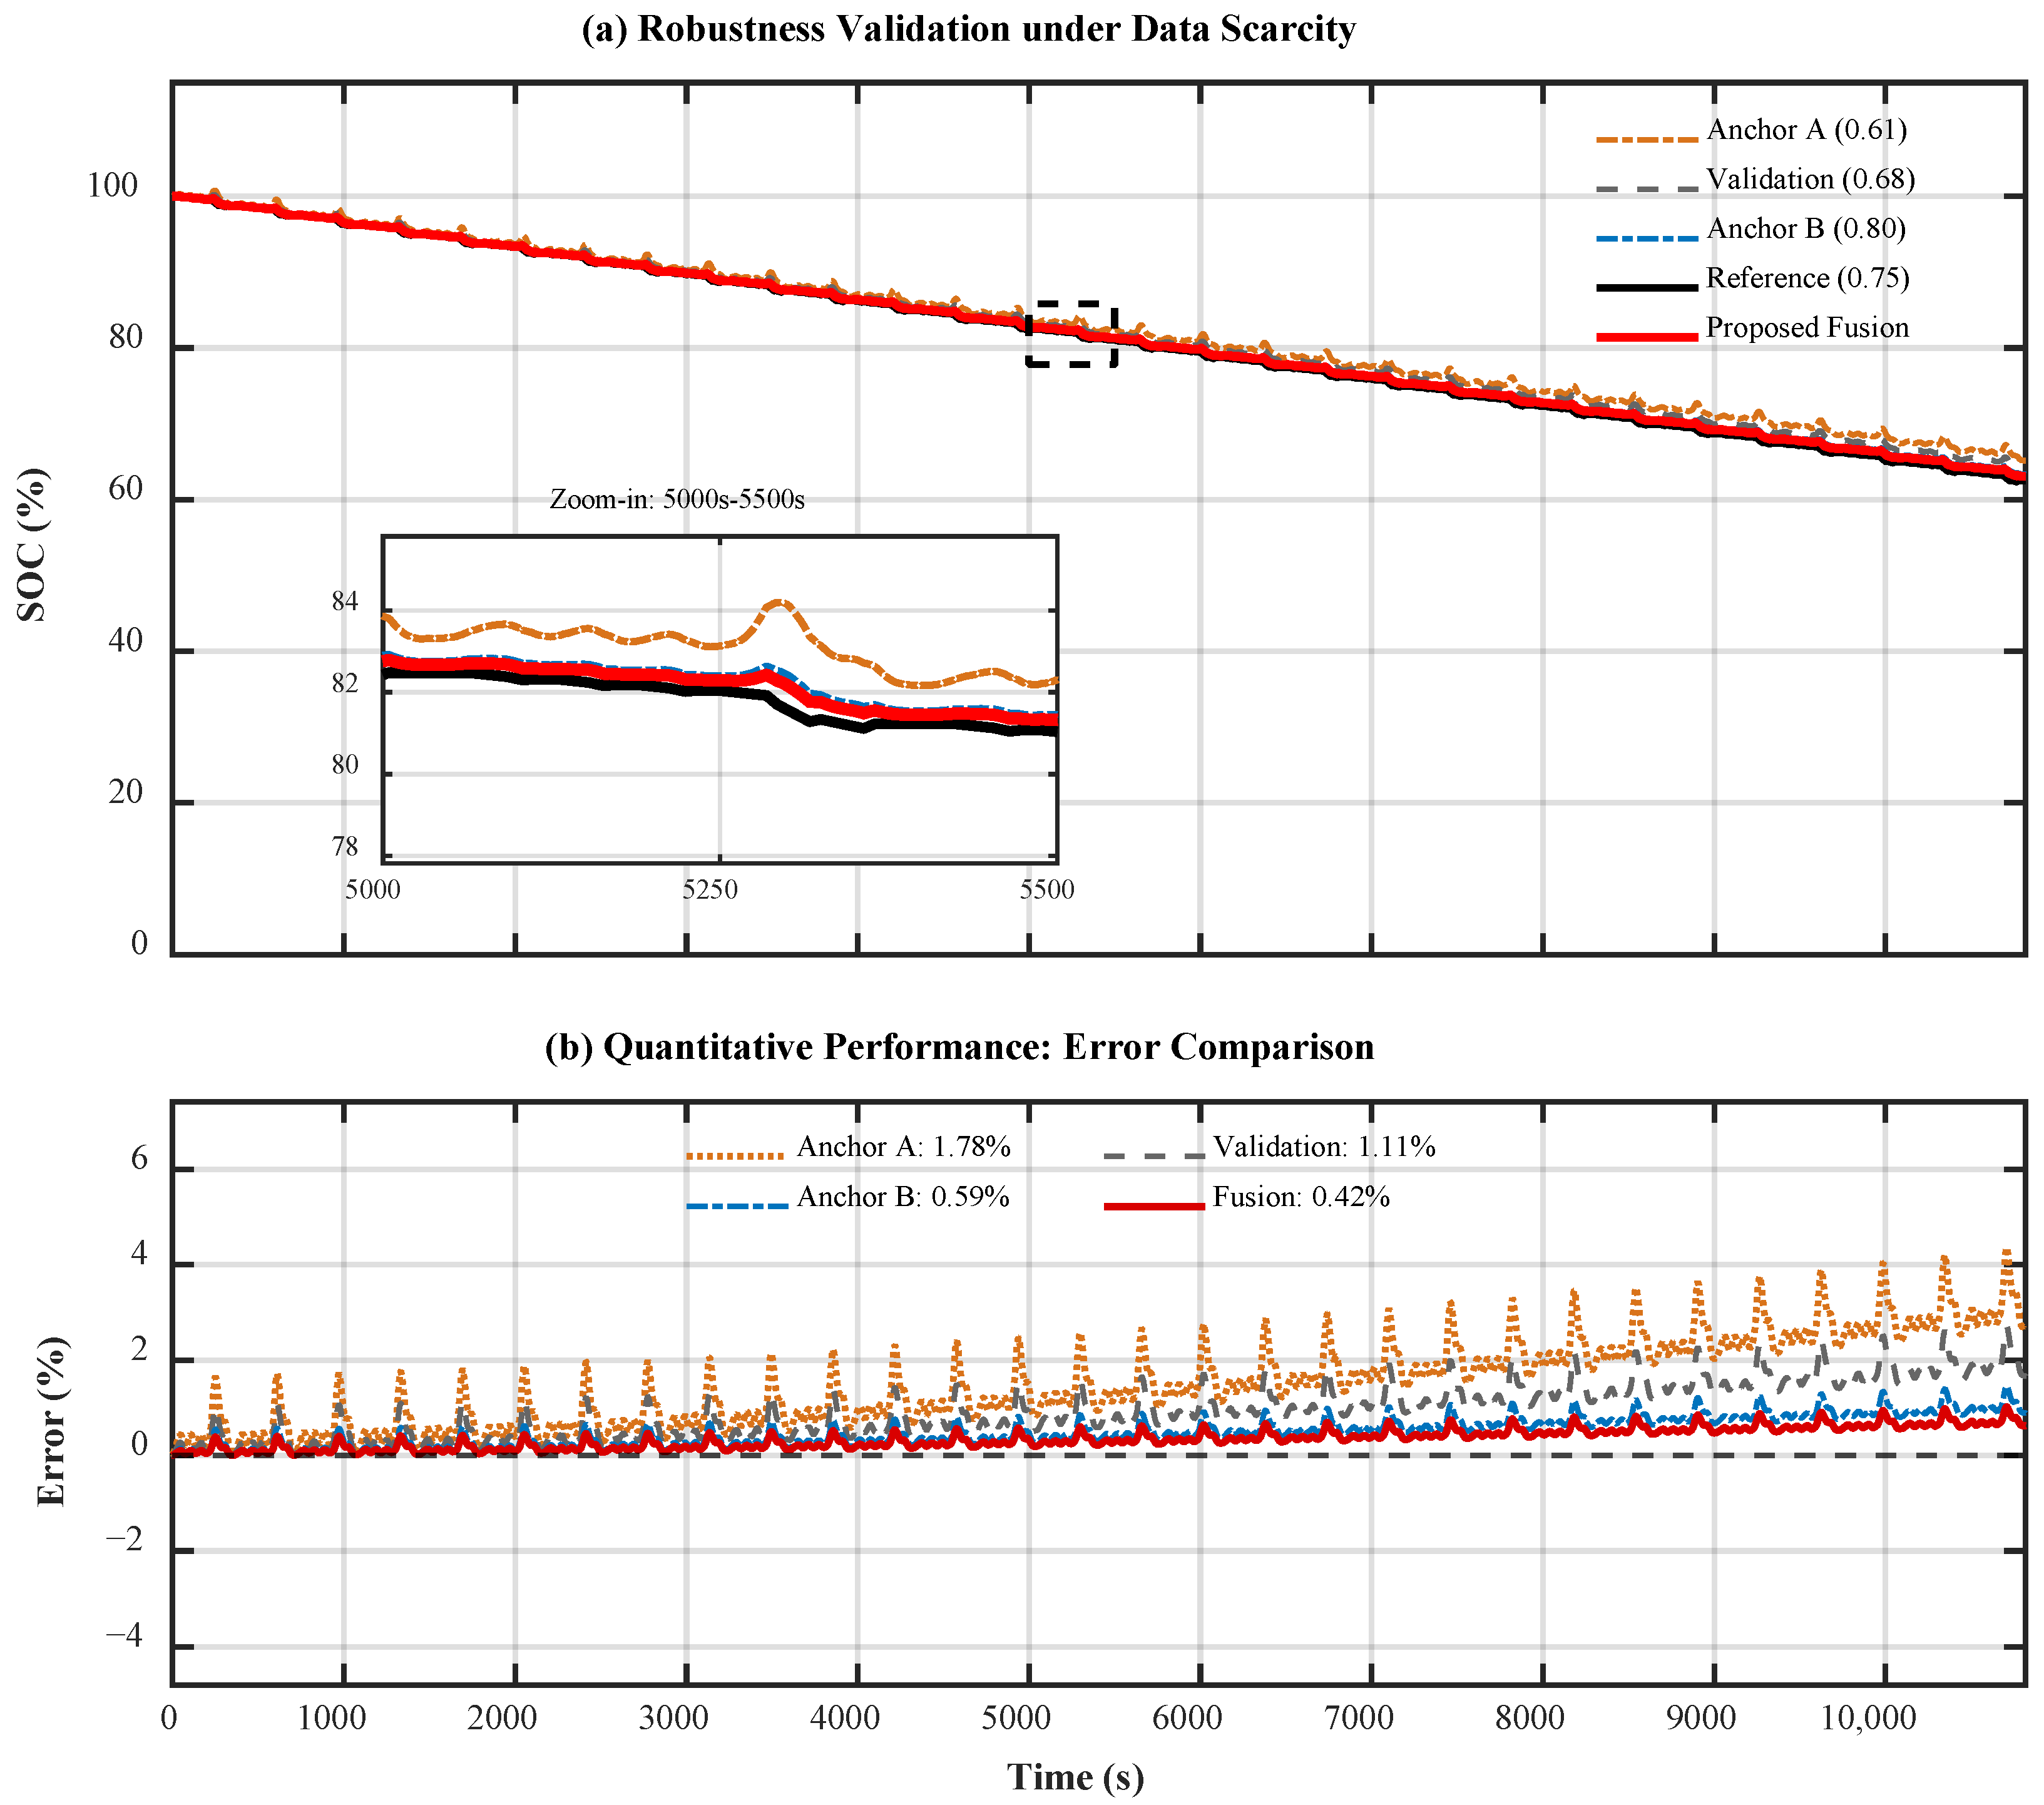
The estimation results of the proposed framework are presented in
Figure 10. It can be clearly observed that the single anchor models exhibit systematic biases due to parameter mismatch: the aged Anchor A (orange dot-dashed line) tends to underestimate the SOC, while the healthy Anchor B (blue dot-dashed line) tends to overestimate it.
To further highlight the limitation of fixed-parameter approaches, the ‘Validation (0.68)’ model (gray dashed line) is included as a control group. Although this intermediate model (calibrated at SOH 0.68) reduces the bias compared to the extreme anchors, it still fails to align perfectly with the target trajectory (Reference, SOH 0.75), exhibiting a persistent static offset. This confirms that a static parameter set, unless perfectly matched to the target’s unknown SOH, cannot guarantee estimation accuracy.
In contrast, the Proposed Fusion (red solid line) successfully bridges this gap. By dynamically adjusting the weights based on real-time voltage feedback, the fusion algorithm automatically interpolates between the two boundaries, tracking the Reference (black solid line) trajectory with remarkable precision. The estimation error is effectively bounded within a narrow range, achieving an RMSE of 0.42%, which significantly outperforms the individual anchors.
It is noteworthy that the healthy Anchor B also yields a relatively low RMSE (0.59%). This is physically intuitive because the Target battery (SOH ≈ 0.76) is much closer to the healthy state (SOH ≈ 0.80) than to the aged state (SOH ≈ 0.61). However, relying solely on Anchor B is risky; its performance would severely degrade if the target battery were closer to the aged boundary. In contrast, the Fusion framework not only further reduces the error by ~29% (from 0.59% to 0.42%) but, more critically, guarantees consistent robustness across the entire aging spectrum, independent of the target’s specific health state.
This verifies the framework’s capability to ‘lock onto’ the true state of an uncalibrated battery solely through boundary constraints.
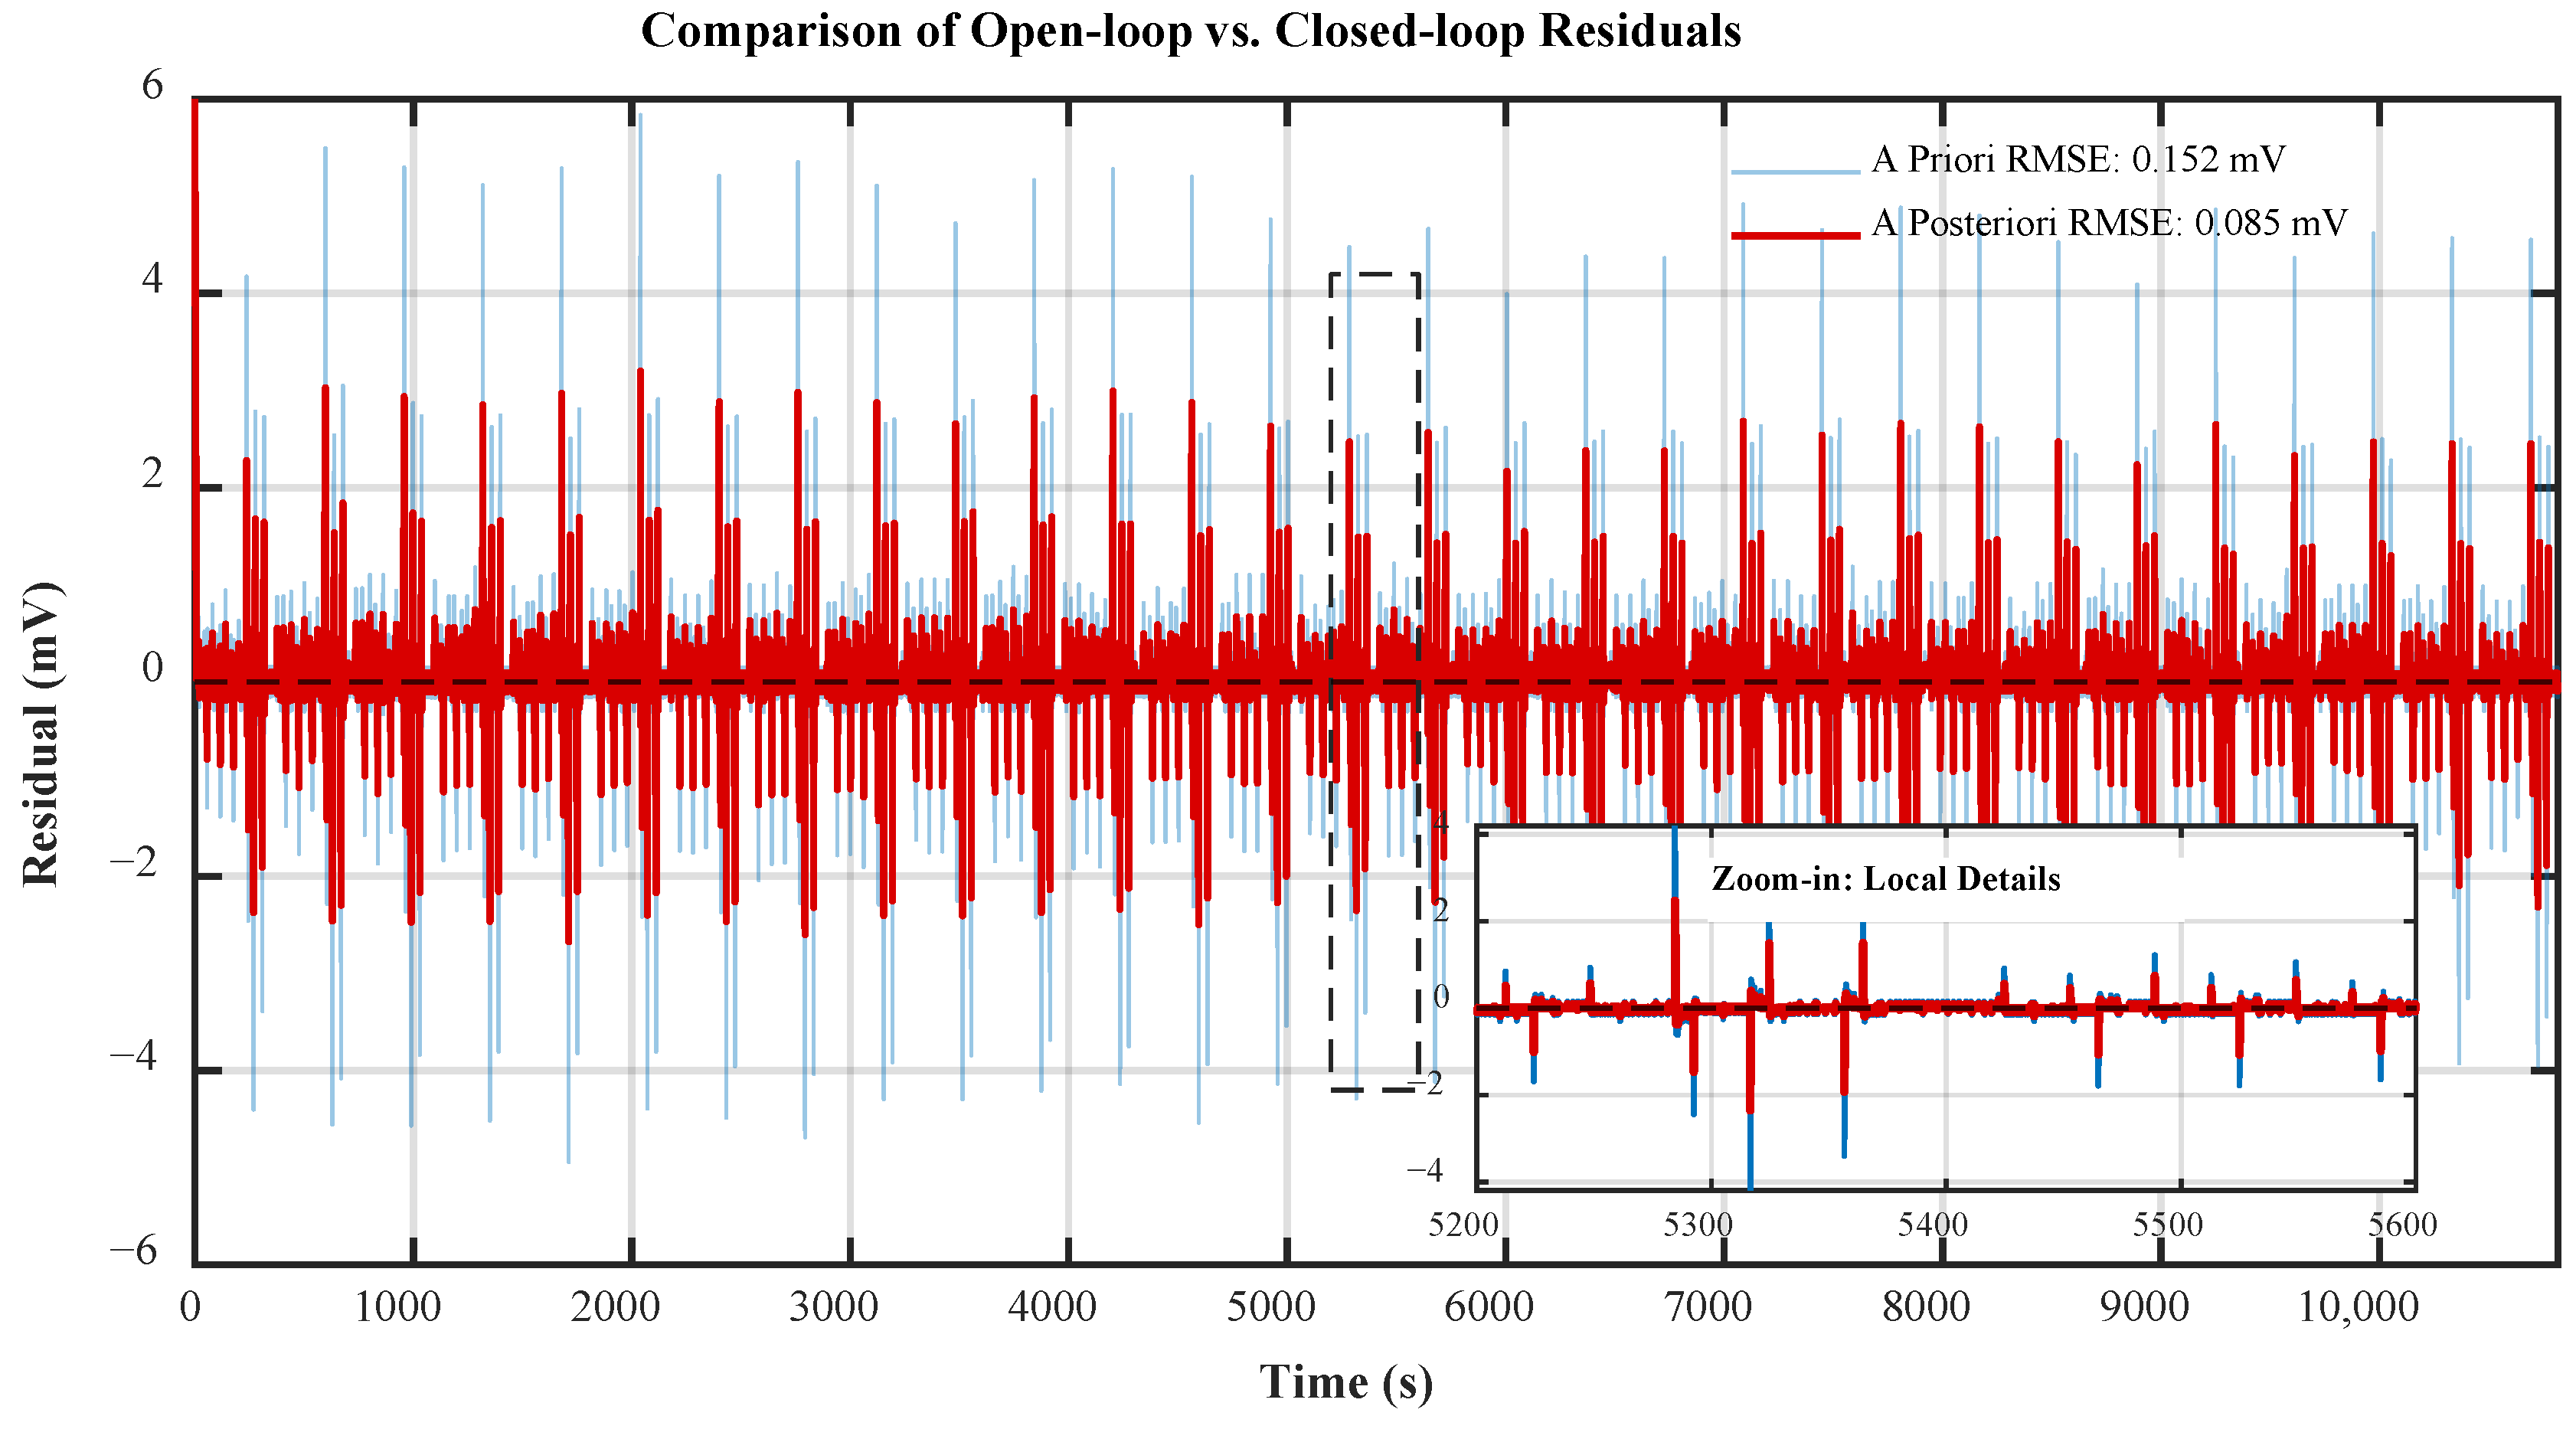
To further validate that the superior SOC accuracy stems from the physical fidelity of the model rather than solely from feedback correction, we conducted a decoupled analysis of the terminal voltage residuals, as shown in
Figure 11.
The A Priori residual (blue line) reflects the open-loop prediction accuracy. Remarkably, the RMSE is compressed to 0.152 mV, a value that effectively aligns with the quantization noise limit (resolution floor) of the experimental hardware’s ADC. This indicates that the DRIS-based anchor parameters have captured the electrochemical dynamics to the maximum extent resolvable by the sensing equipment, leaving virtually no residual error attributable to model structural mismatch.
Furthermore, the A Posteriori residual (red line) demonstrates the contribution of the EKF. With the feedback gain active, the residual is further compressed to 0.085 mV, effectively approaching the hardware resolution limit (quantization floor) of the ADC. It is worth noting that while the absolute measurement accuracy is bounded by ±2–3 mV (bias), the tracking consistency represented by the RMSE has converged to the microvolt level (~85 μV), indicating that the model captures the battery dynamics with maximal fidelity allowed by the sensing granularity. This comparison confirms that the framework relies on a precise physical foundation, with the adaptive filter serving primarily to eliminate residual measurement uncertainties. The quantitative comparison of these voltage residuals is summarized in
Table 3.
5.2. External Benchmarking: Comparison with State-of-the-Art Algorithms
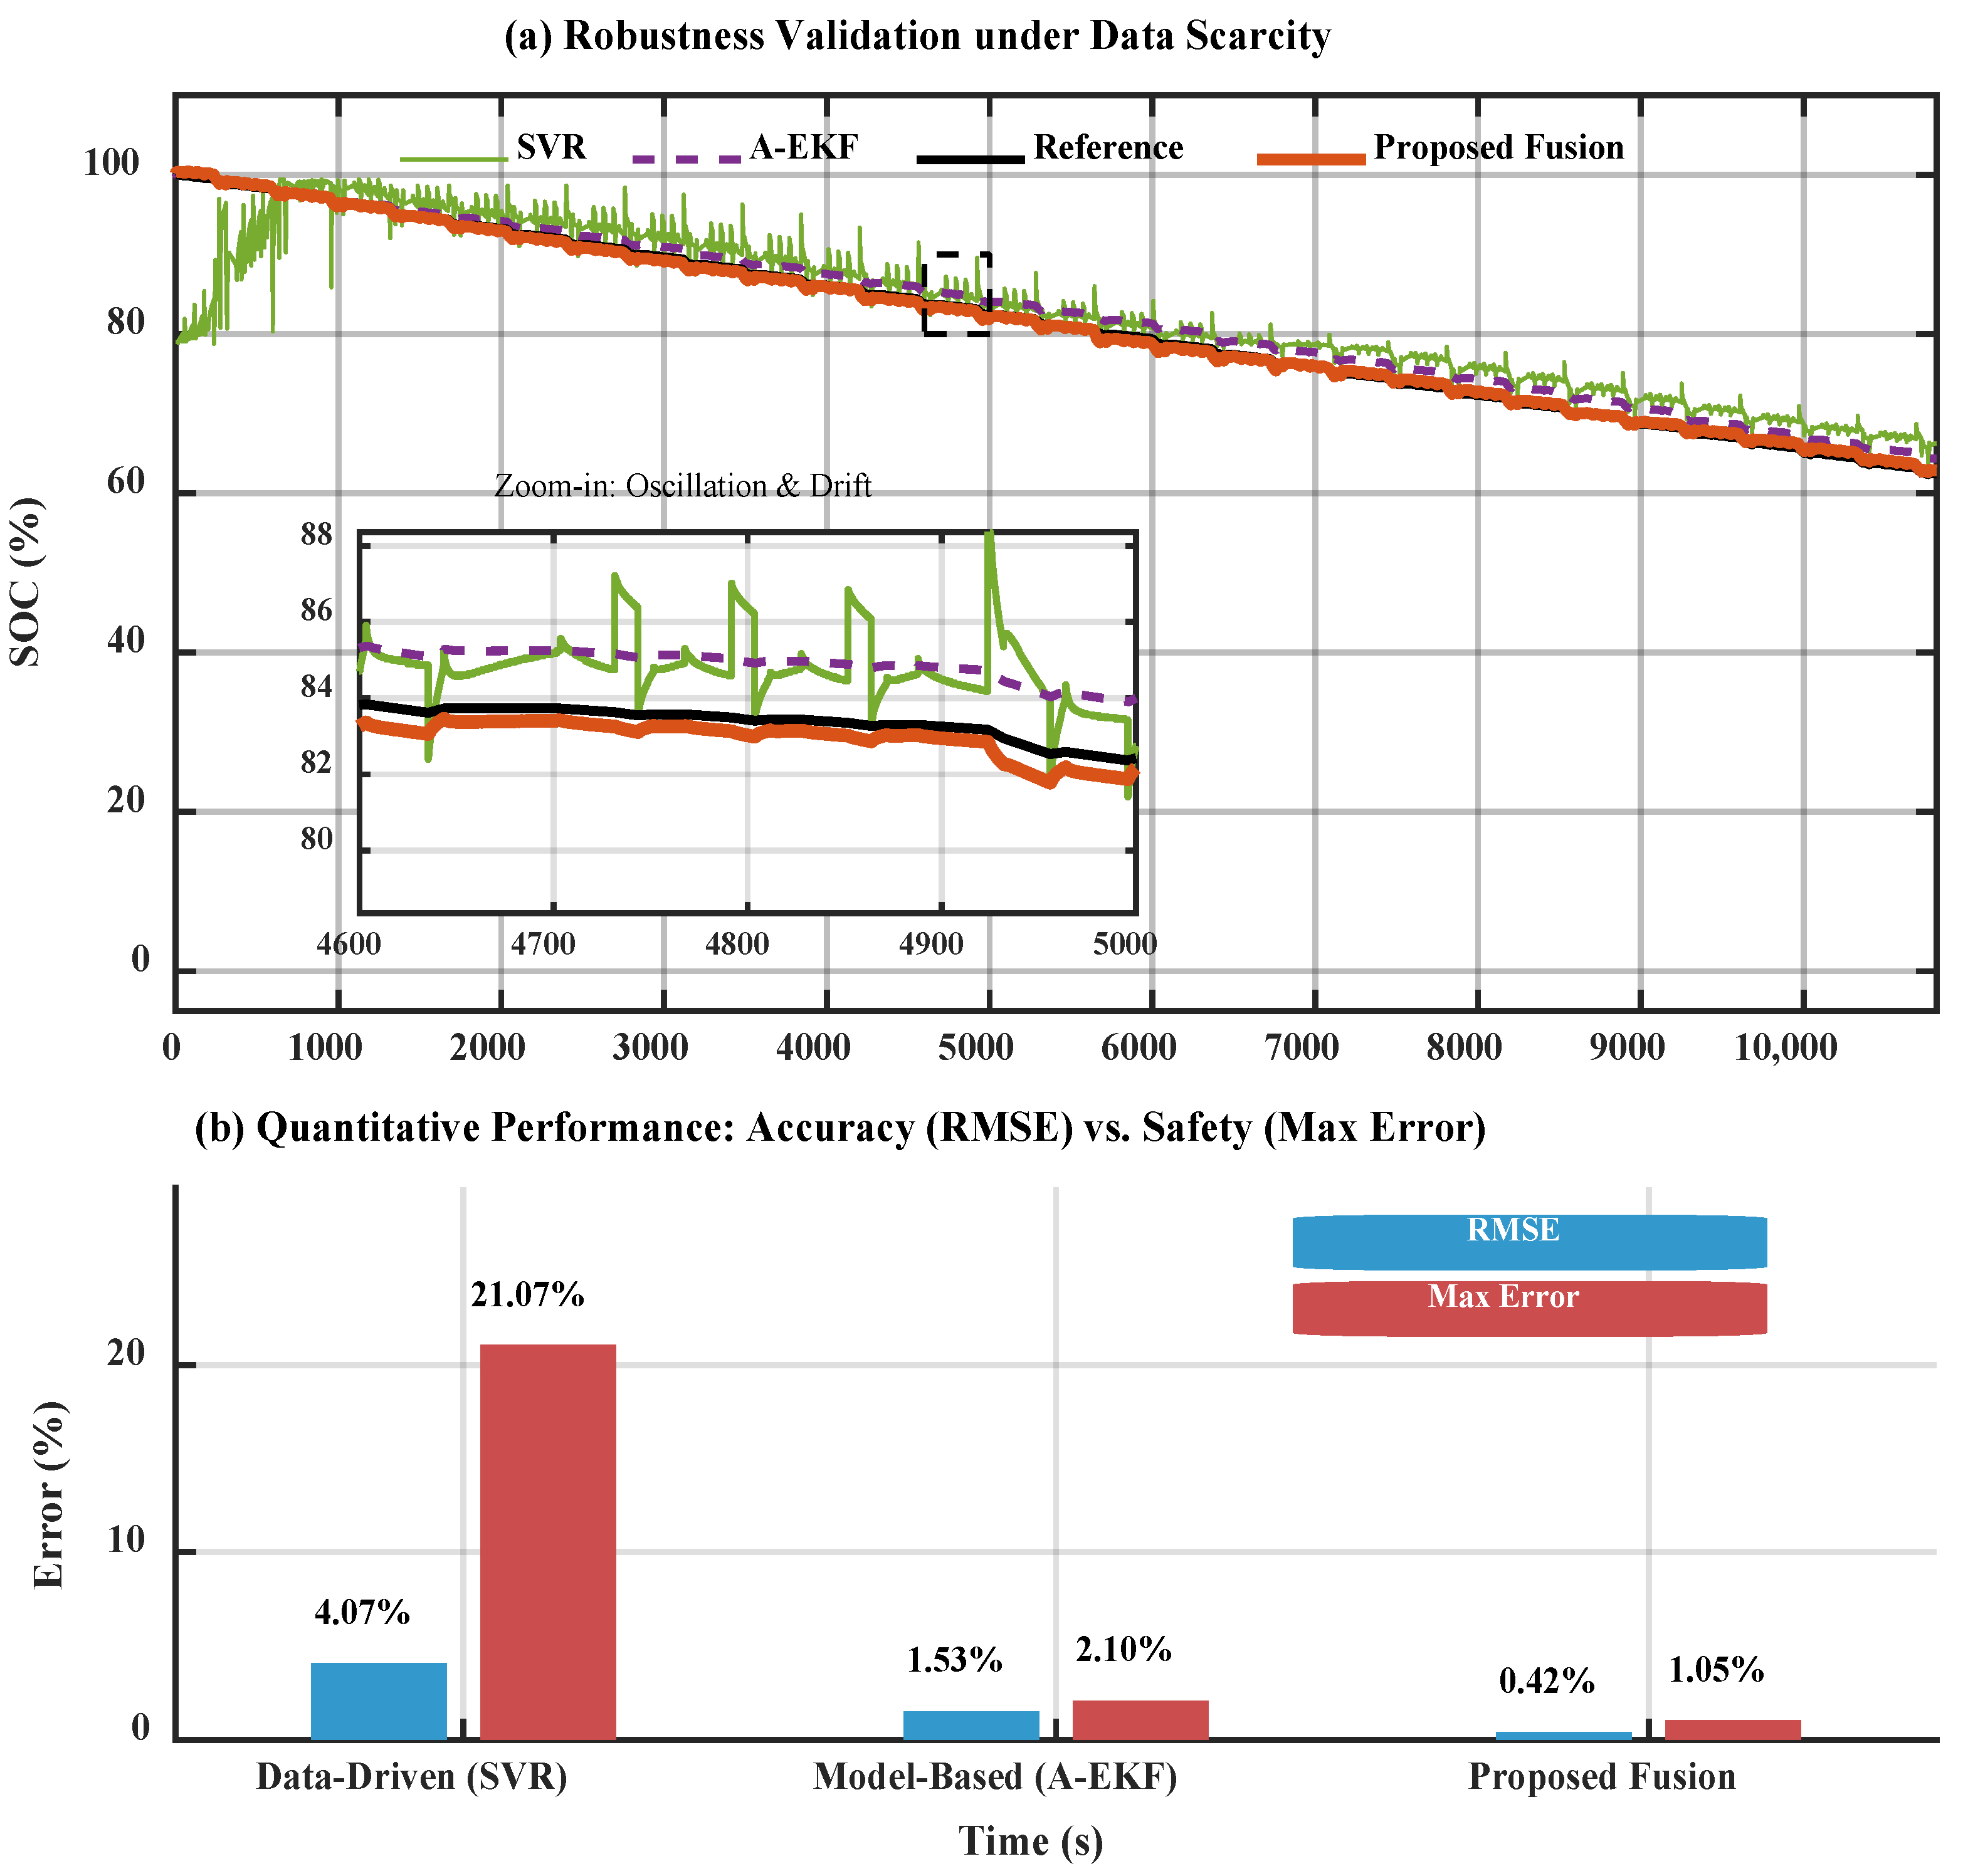
To rigorously position the proposed framework, comparative experiments were conducted against two representative methodologies suggested by literature: a data-driven Support Vector Regression (SVR) and a model-based Adaptive Extended Kalman Filter (A-EKF), as shown in
Figure 12.
As observed in
Figure 12a, the data-driven SVR (teal line) fails to generalize to the uncharacterized target battery. Due to the lack of training data covering the specific aging state of the target, the SVR model produces severe non-physical oscillations. This failure is fundamentally attributed to the ‘distribution shift’ between the source domain (training data) and the target domain (uncharacterized battery). Unlike physics-informed models, pure data-driven approaches often lack the extrapolation capability to handle such shifts without extensive transfer learning. The A-EKF (purple dashed line), while physically interpretable, exhibits noticeable parameter drift under the dynamic DST profile, resulting in an RMSE of 1.53%.
Figure 12b further reveals the critical safety implications. While the A-EKF provides a reasonable average accuracy, the SVR exhibits a Maximum Estimation Error of 21.07%. Such unpredictability in extrapolation scenarios poses an unacceptable safety hazard for BMS. In sharp contrast, the proposed Dual-Anchor Fusion framework achieves superior robustness, yielding the lowest RMSE of 0.42% and strictly capping the Maximum Error at 1.05%.
These results confirm that the proposed physics-informed strategy effectively eliminates both the divergence risk of adaptive algorithms and the overfitting risk of pure data-driven models, making it a highly reliable solution for retired battery applications.
5.3. SOH Soft-Sensing Capability
Beyond robust SOC tracking, this section experimentally validates the ‘SOH Soft-Sensing’ capability proposed in
Section 3.5. Instead of analyzing the raw fusion weights in isolation, this section focuses on the physical health metrics derived from them. By mapping the adaptive weights—which represent the instantaneous impedance match—onto the fixed anchor boundaries (Equation (17)), the framework continuously infers the battery’s real-time health status.
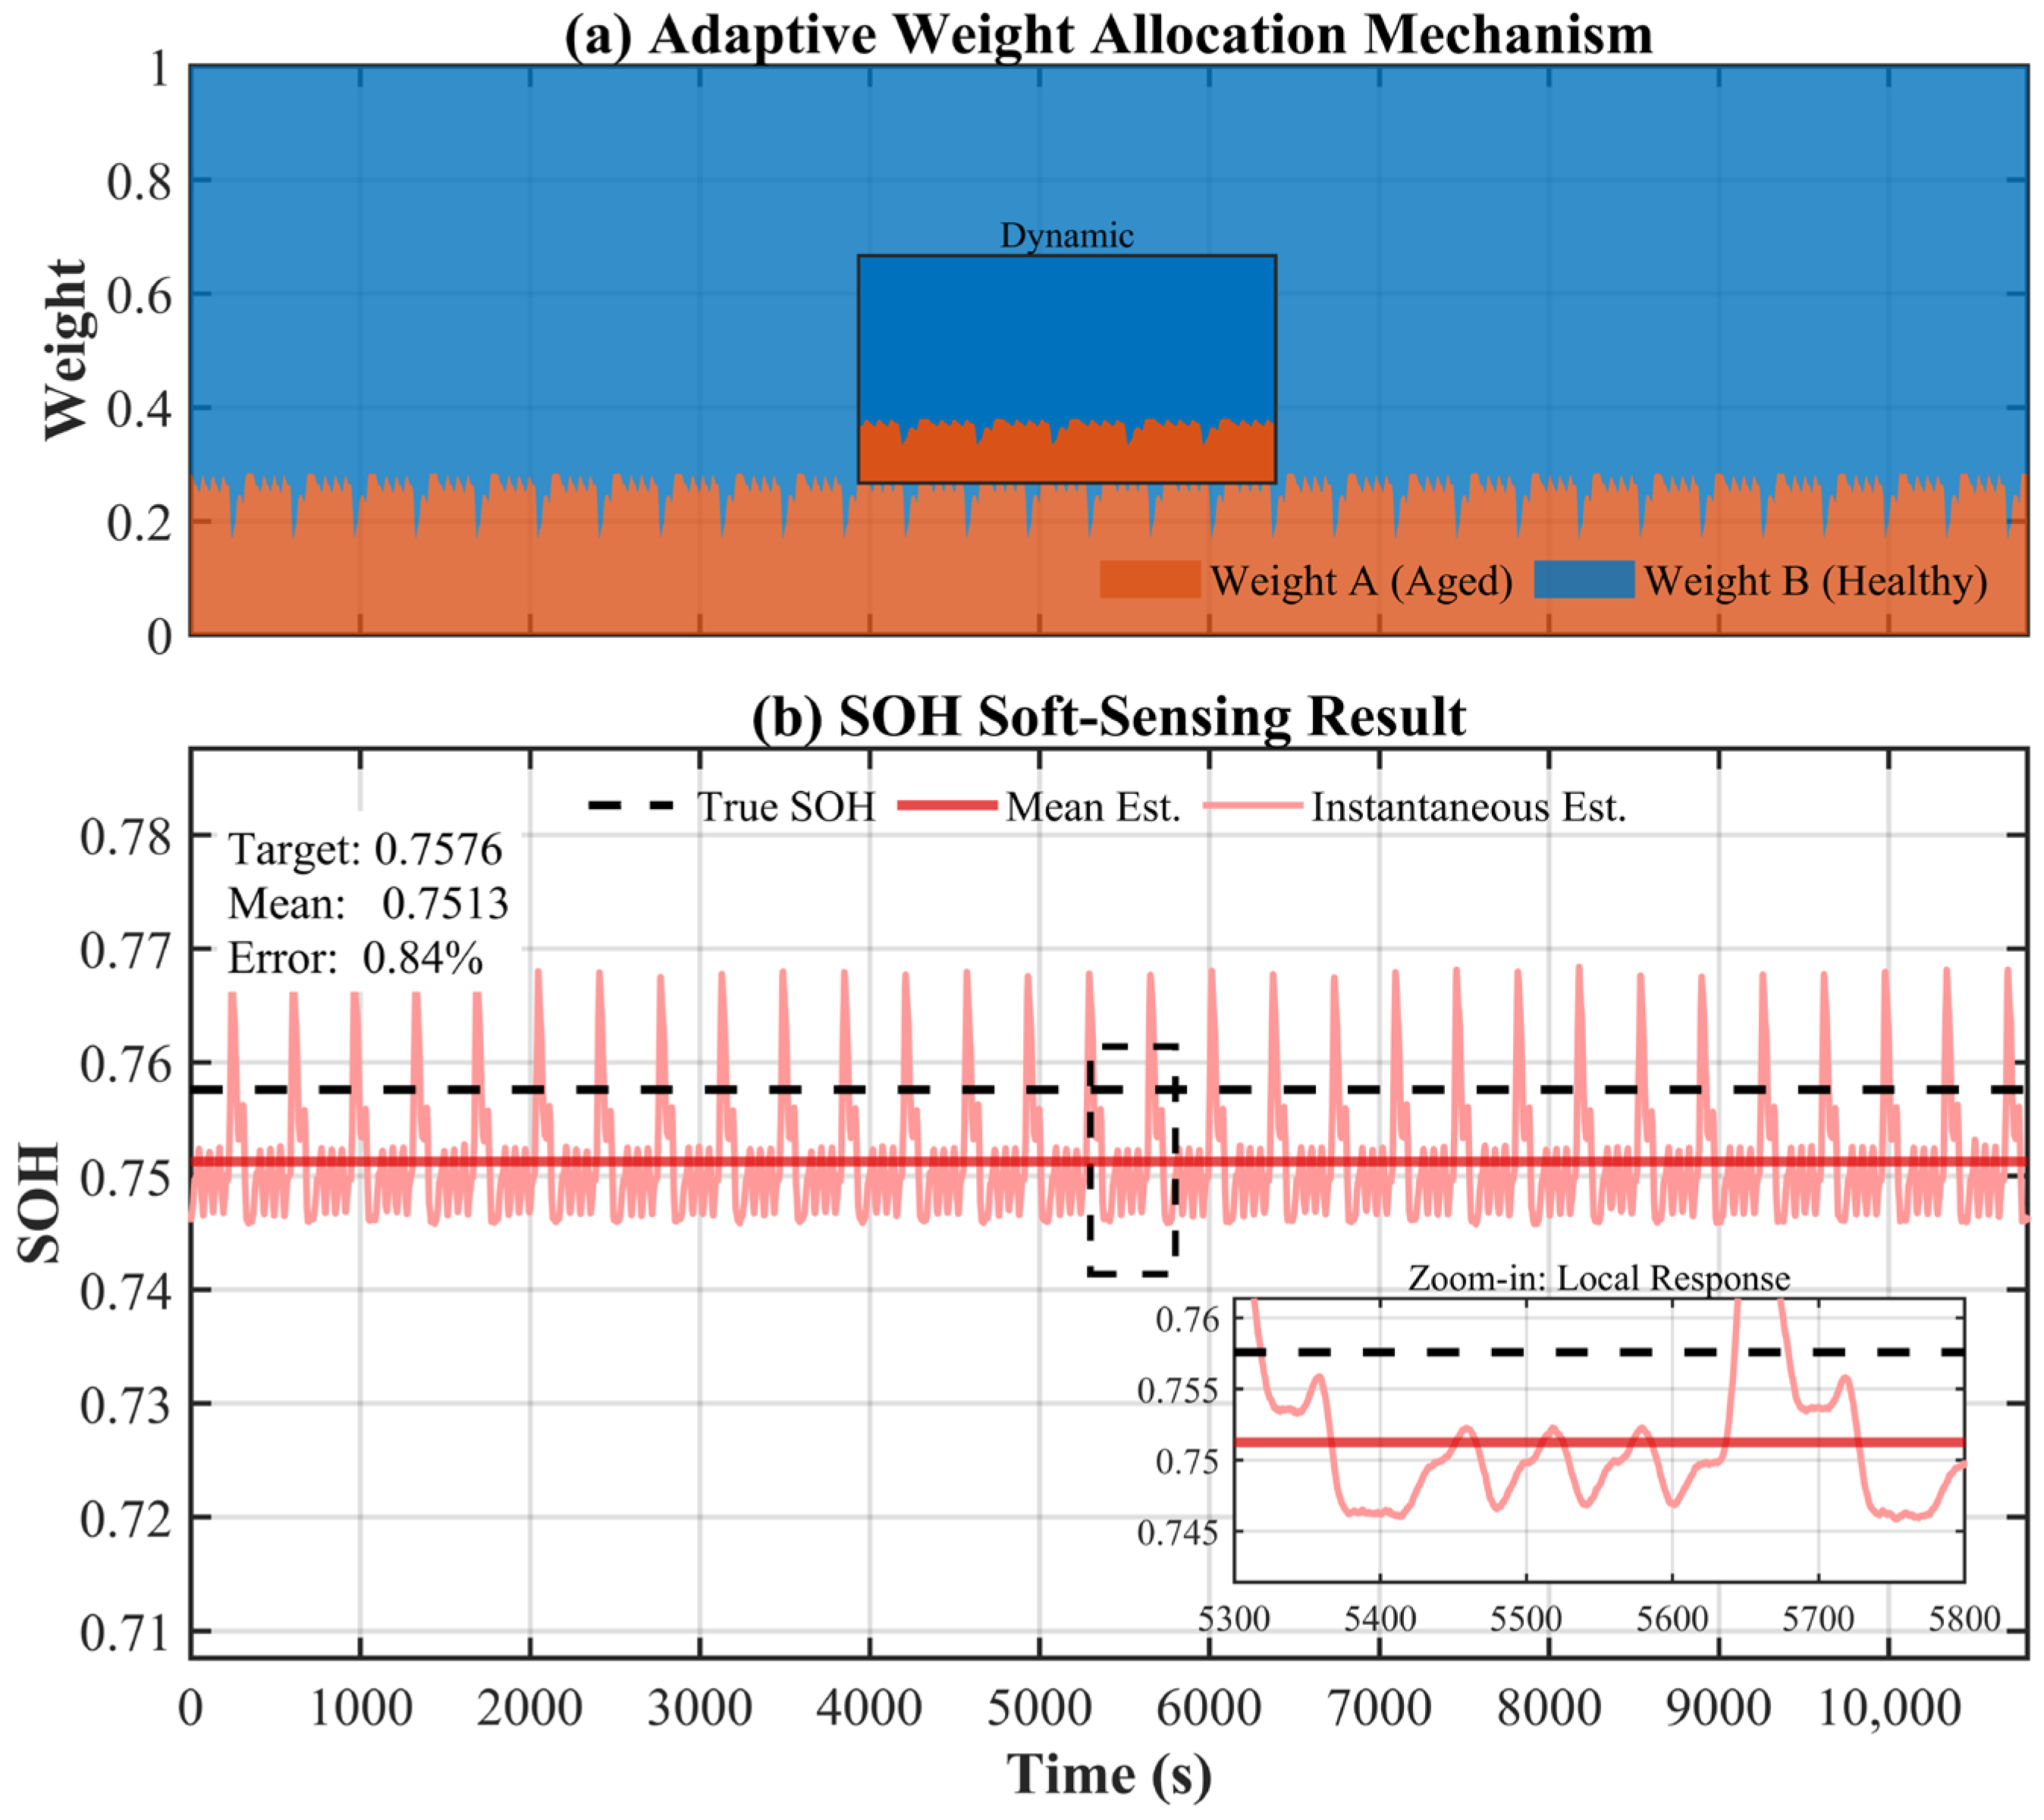
Figure 13 presents the comprehensive soft-sensing results.
Figure 13a illustrates the dynamic adaptive weight allocation mechanism, while
Figure 13b displays the resulting SOH trajectory compared against the calibrated target.
As visualized in
Figure 13b, the results are highly compelling. High-Fidelity Estimation: The mean estimated SOH over the test duration is 0.7513, which closely tracks the ground truth (0.7576) with a relative error of only 0.84%. This confirms that the framework successfully interpolates the target battery’s position within the parameter envelope defined by the DRIS-based anchors, achieving high accuracy without any prior calibration.
The fidelity of the model is further illuminated by the dynamic evolution of the fusion weights shown in
Figure 13a. It can be observed that the weights are not static; instead, they exhibit rapid, physically explainable adjustments corresponding to high-dynamic load phases. When a sudden voltage drop occurs (e.g., in the Zoom-in region of
Figure 13a), the algorithm instantaneously shifts the weight allocation towards the aged anchor (Weight A, orange area), which possesses higher internal resistance. This rapid adaptation confirms that the fusion mechanism is not merely fitting a static average but is performing a real-time “impedance matching” process, capturing the battery’s dynamic characteristics with high sensitivity.
Furthermore, it is critical to substantiate the physical basis of this soft-sensing capability to rule out numerical coincidence. The underlying mechanism relies on the monotonic correlation between internal impedance and SOH in lithium-ion batteries. As established in
Section 2.4, the aged anchor (Anchor A) inherently possesses significantly higher internal resistance than the healthy anchor (Anchor B). The fusion algorithm, by minimizing the real-time voltage residual (
), is effectively performing an instantaneous “impedance matching” process.
The adaptive weight therefore quantifies the ‘impedance distance’ of the target battery relative to the aged boundary. Since impedance rise is the primary symptom of degradation in this aging stage, the weight-derived SOH () serves as a physically grounded proxy for the true health state, robustly bridging the gap between mathematical optimization and electrochemical reality.
5.4. Sensitivity and Robustness Analysis
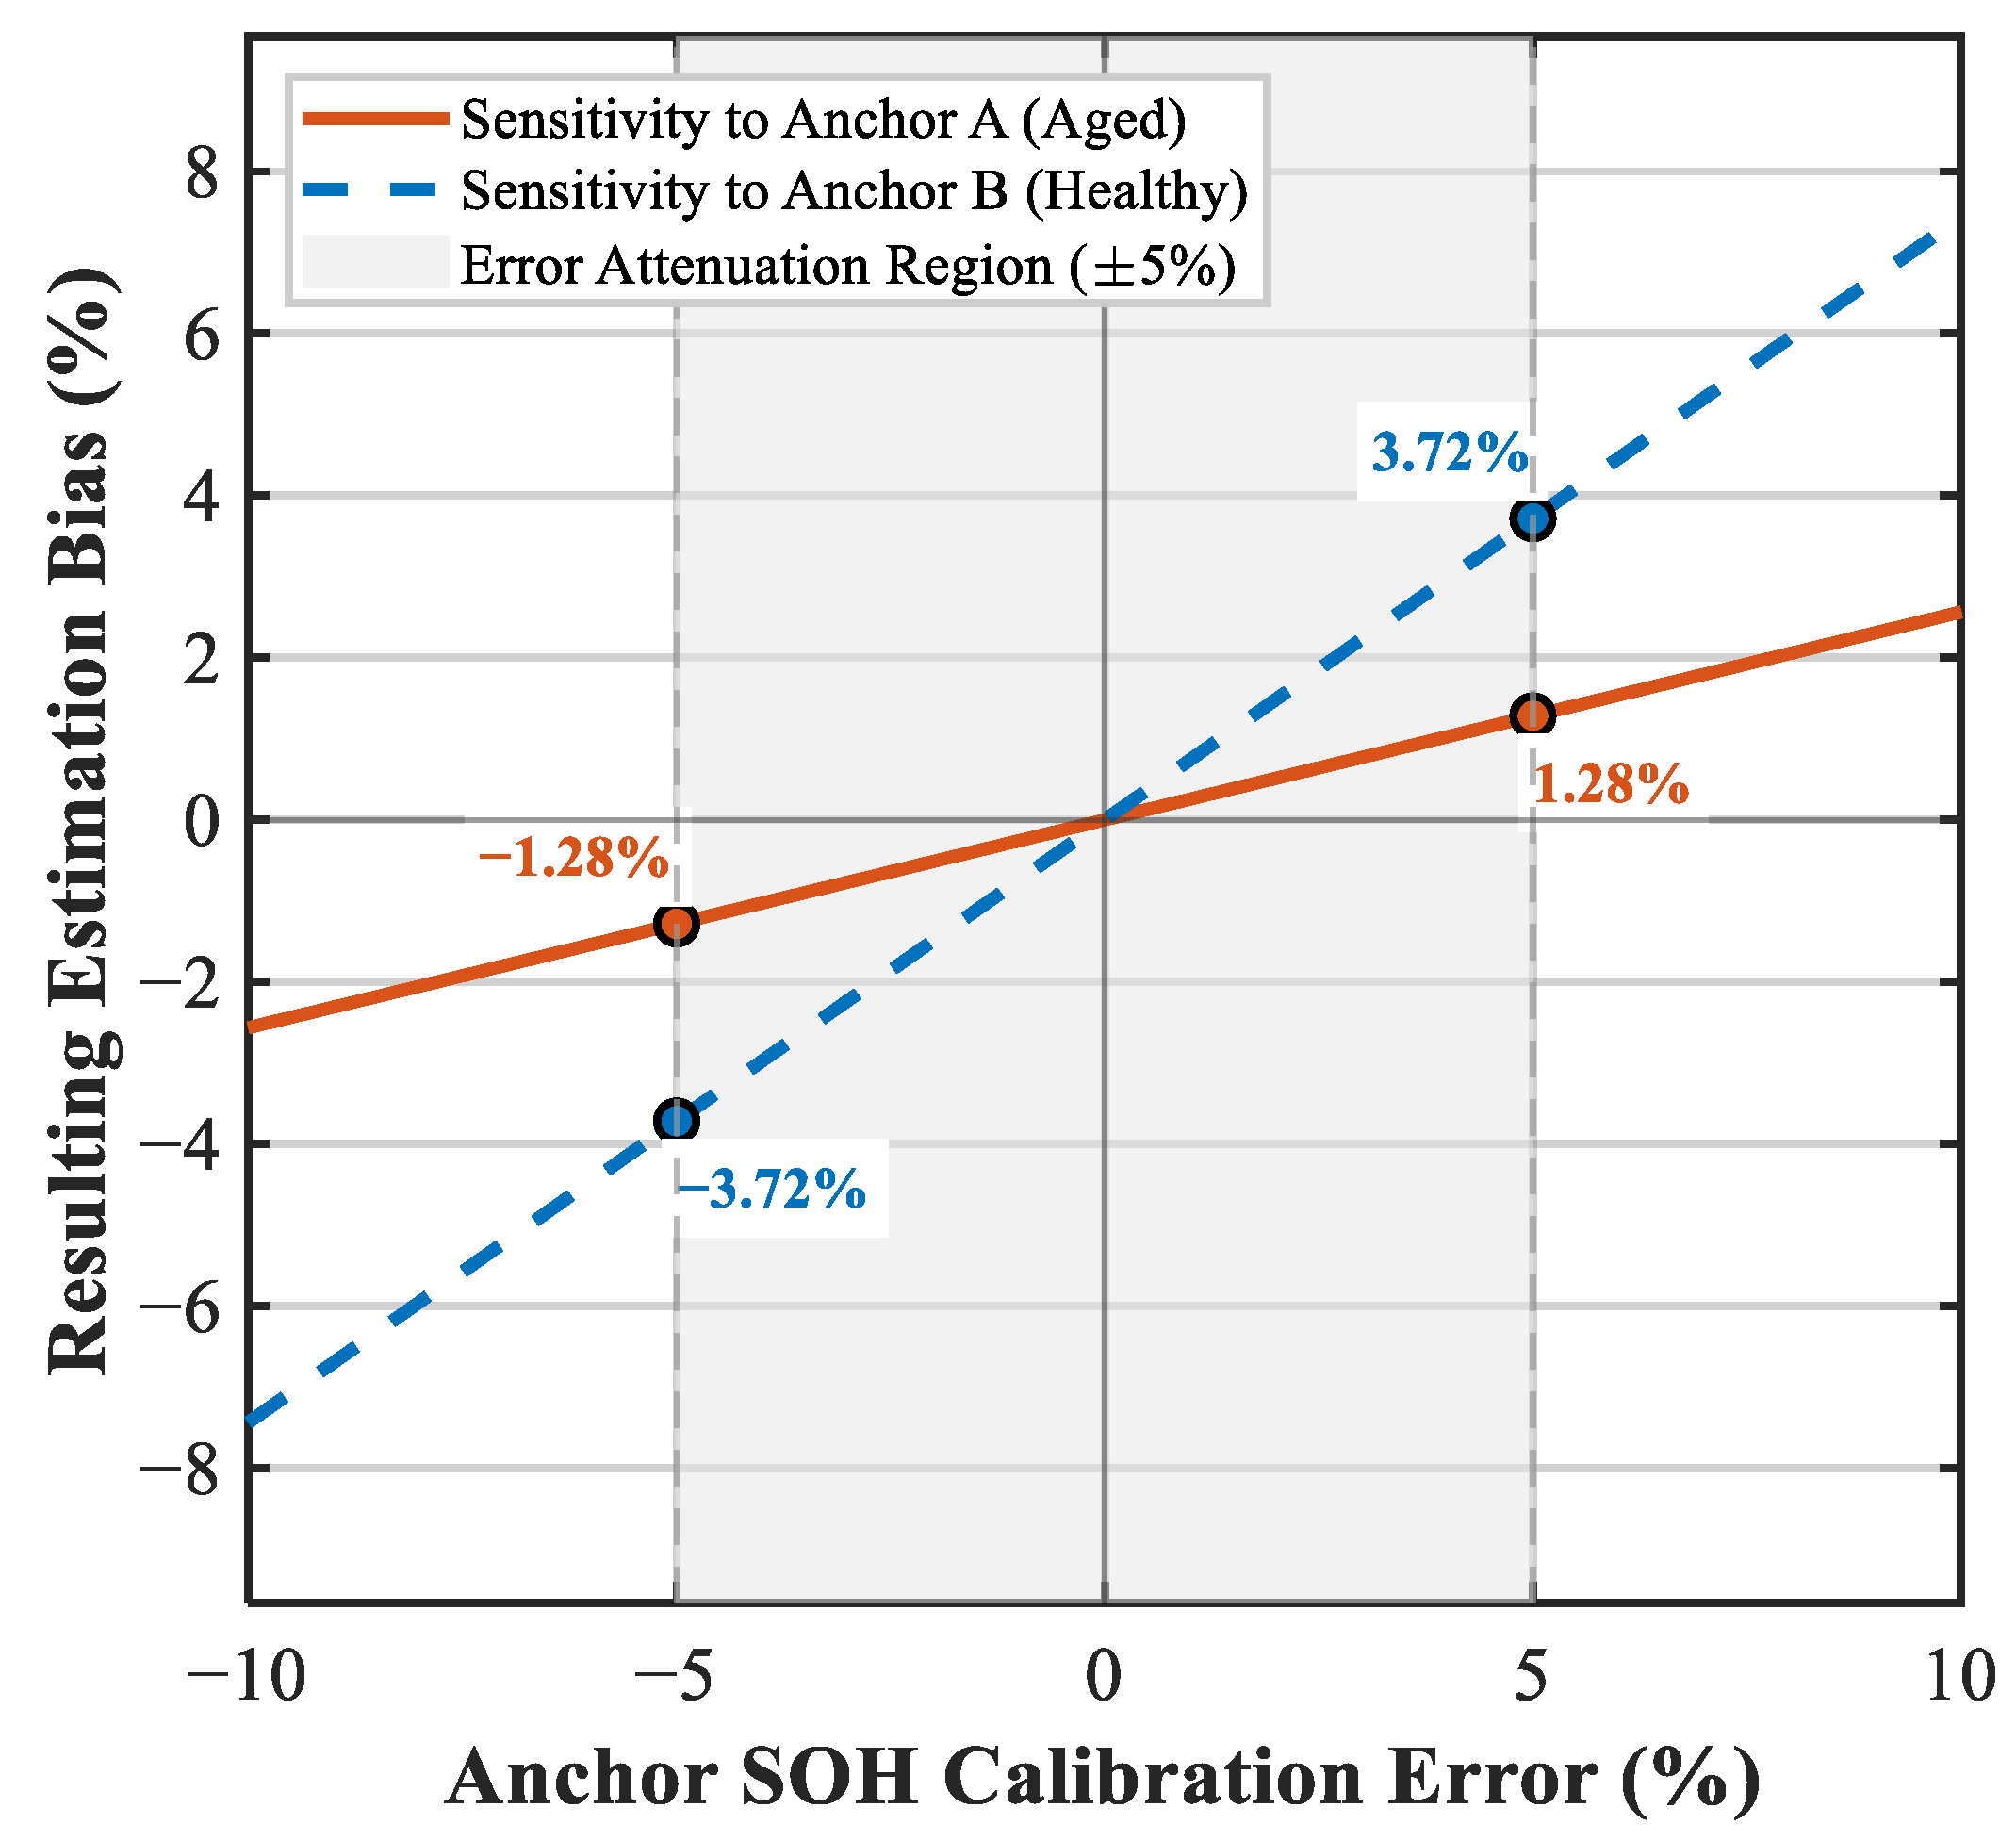
Ideally, the anchor models serve as precise references; however, in practical second-life applications, the initial SOH labels of retired modules may contain measurement uncertainties. To rigorously evaluate the framework’s robustness under such conditions, a quantitative sensitivity analysis was conducted, as illustrated in
Figure 14. The analysis introduces a perturbation of up to ±10% to the SOH labels of the anchor models while monitoring the induced bias in the final estimation.
The results reveal an intrinsic “Error Attenuation” mechanism inherent to the proposed fusion architecture. As shown in
Figure 14, the sensitivity of the estimation bias is linear and strictly governed by the fusion weights (
). For the target battery in this validation (SOH ≈ 0.76), which is electrochemically closer to the Healthy Anchor (SOH = 0.80), the algorithm assigns a dominant weight to the healthy model (
≈ 0.74, indicated by the steeper blue dashed line), while the Aged Anchor contributes less (
, indicated by the flatter orange solid line).
Crucially, even within the significant perturbation range of ±5% (highlighted in the shaded region), the maximum induced estimation error is strictly bounded. Specifically, a 5% calibration error in the dominant Healthy Anchor results in only a 3.72% estimation bias, while the same error in the Aged Anchor leads to a negligible 1.28% bias. This confirms that the output error is consistently lower than the input parameter error (i.e., Slope < 1), verifying the Bounded Input Bounded Output (BIBO) stability of the framework. This characteristic ensures that the proposed method remains reliable even when deployed with imperfectly characterized retired batteries.
6. Discussion and Conclusions
Theoretical Insights: This study addresses the critical challenge of state estimation for retired batteries with heterogeneous aging characteristics by proposing a Dual-Anchor Adaptive Fusion Framework. By integrating offline high-fidelity feature extraction (DRIS) with online probabilistic fusion, the proposed method effectively bridges the gap between static modeling and the dynamic reality of second-life batteries. The core innovation lies in the discovery of “Physics-Informed Soft-Sensing,” where the adaptive fusion weights are interpreted not merely as mathematical coefficients but as physical health metrics. Unlike “black-box” data-driven models that often require massive labeled datasets for pre-training, our framework operates in a calibration-free mode, utilizing only two fixed boundary anchors to cover the entire aging space. Furthermore, by prioritizing the time-domain DRIS strategy over frequency-domain EIS, we ensure that the identified parameters are optimized specifically to minimize the EKF prediction residual, offering superior applicability for online state estimation. The ability of the framework to infer the target SOH with a relative error of 0.84% (
Figure 13) functionally validates that the identified impedance parameters exhibit a strict monotonic relationship with degradation, serving as reliable proxies for the battery’s health state. To further clarify the positioning of this work,
Table 4 provides a comprehensive comparison with mainstream state estimation methods.
Limitations and Future Work: While the proposed framework demonstrates robust performance, it is objectively important to acknowledge the constraints of the present study to define its valid application scope. First, regarding experimental conditions, the validation was conducted on a specific batch of retired NCM cells under strictly controlled laboratory temperatures (25 °C). While this successfully isolates aging-induced heterogeneity, it does not fully capture the complex coupling effects of varying ambient temperatures and thermal gradients often encountered in real-world battery packs. Second, regarding model dependence, the framework’s baseline accuracy relies on the initial high-fidelity calibration of the anchor models. Although the sensitivity analysis confirms robustness against minor calibration errors (e.g., ±5%), significant deviations in aging mechanisms (such as lithium plating vs. SEI growth) could potentially compromise the estimation accuracy. Third, the “SOH Soft-Sensing” capability relies on the assumption of piecewise linear impedance evolution between the two anchors. This assumption is physically valid for the specific “second-life” window investigated (SOH 0.61–0.80); however, the linearization error would inherently increase over wider SOH ranges (e.g., from 100% down to 50%) or in the presence of nonlinear aging “knees”. To address these limitations, future research will focus on extending the validation to a larger population of cells with diverse chemistries (e.g., LFP) and form factors to verify the method’s universality. Additionally, developing temperature-dependent anchor models that integrate thermal dynamics will be crucial for enabling robust estimation under wide-range temperature variations. Furthermore, exploring a scalable “Multi-Anchor” architecture—by inserting intermediate anchors to linearize the degradation path locally—will be investigated to maintain estimation precision across the full battery lifespan.
Conclusions: The experimental results support three key findings. (1) Resolution of the “E-point Selection Dilemma”: The automated DRIS strategy effectively eliminates subjectivity in offline parameter identification, reducing the fitting RMSE from 6.22 mV (traditional method) to 3.39 mV and ensuring the construction of physically meaningful anchor models. (2) Robust Calibration-Free Estimation: For uncalibrated target batteries, the Dual-Anchor Fusion framework maintains high tracking stability with an RMSE of 0.42%. It effectively mitigates the parameter drift observed in the standard A-EKF (RMSE 1.53%), with the a posteriori voltage tracking error converging to ~0.085 mV, effectively matching the hardware quantization limit. (3) Real-time SOH Inference: The adaptive fusion weights accurately reflect the battery’s health status. The SOH is inferred with a relative error of 0.84% under dynamic loading, providing a cost-effective mechanism for online health monitoring while obviating the need for additional capacity test cycles.




 ,
,