Article

Synthesis of Cathode Material Li2FeTiO4 for Lithium-Ion Batteries by Sol–Gel Method

1
School of Materials Science and Engineering, Shenyang University of Technology, Shenyang 110870, China
2
School of Resources and Materials, Northeastern University at Qinhuangdao, Qinhuangdao 066004, China
*
Authors to whom correspondence should be addressed.
Batteries 2025, 11(4), 142; https://doi.org/10.3390/batteries11040142
Submission received: 27 February 2025 / Revised: 3 April 2025 / Accepted: 4 April 2025 / Published: 6 April 2025

Abstract

:
The development of a simple and reliable strategy to synthesize cathode materials is crucial for achieving the overall high performance of rechargeable lithium batteries, which has proved to be quite challenging. Herein, we report a simple sol–gel method for the synthesis of Li2FeTiO4 cathode materials. The reaction mechanism of Li2FeTiO4 crystals can be divided into five stages: including the breakage of the coordination bond; the thermal decomposition of citric acid; the thermal decomposition of metal salts and the reduction of trivalent iron and the formation of Li2FeTiO4 crystals. Finally, the optimum calcination temperature for the preparation of Li2FeTiO4 cathode materials was explored. The Li2FeTiO4 cathode material prepared at 700 °C provides a discharge-specific capacity of 121.3 mAh/g in the first cycle and capacity retention of 89.2%. Our results provide new insights into the application of Li2FeTiO4 cathode materials.

1. Introduction

As the first generation of lithium-ion battery cathode materials, lithium cobalt oxide (LCO) has high energy density, but its high cobalt resource cost has been gradually replaced [1,2]. Lithium iron phosphate (LFP) has become the first choice for low-power devices due to its excellent thermal stability, low toxicity, and cost advantages, but its lower operating voltage (~3.4 V vs. Li+/Li) results in low energy density (~170 mAh/g) [3]. In contrast, ternary nickel–cobalt–manganese (NMC) and nickel–cobalt–aluminum (NCA) materials achieve capacity breakthroughs by boosting nickel content to extend operating voltage above 4.3 V, but high nickelization exacerbates the risk of oxygen release (thermal runaway onset temperature reduced to ~150 °C) [4,5]. These limitations therefore highlight the urgency of developing sustainable alternative cathode materials.
Li-rich transition metal oxides, such as Li2MTiO4 (M = Fe, Mn, Co, Ni, or Cu), have emerged as promising candidates due to their unique polyanionic frameworks and high theoretical capacities [6,7,8,9,10]. Among them, Li2FeTiO4 stands out with a disordered cubic (Fd-3m) or monoclinic structure, enabling the extraction of two Li⁺ ions per formula unit for a theoretical capacity of 297 mAh/g. The robust covalent Ti–O bonds in TiO4 polyhedra ensure exceptional structural stability, mitigating phase collapse during cycling [11,12]. Compared to polyanionic LiFePO4 cathode materials, Li2FeTiO4 cathode materials have attracted attention from researchers due to their lower raw material cost, a wider range of sources, mild working voltage, environmental friendliness, excellent cycling stability, and thermal stability. They can meet the requirements of low cost, high safety, and high capacity for the next generation of lithium-ion battery cathode materials and are suitable for large-scale production and application.
The preparation methods of polyanionic Li2FeTiO4 cathode materials mainly include the high-temperature solid phase method [13,14,15,16], sol–gel method, hydrothermal method, and microwave method. Hydrothermal methods are considered to be an effective way to prepare nanomaterials [17,18]. Luo et al. [19] reported the synthesis of nanoscale Li2FeTiO4 cathode materials using hydrothermal methods, but their industrial scalability was limited by high equipment requirements, long processing times, and low yields. The advantages of the sol–gel method over the hydrothermal method are its better mixing uniformity, shorter preparation time, and more precise control of the particle size and morphology of the material [20,21,22,23]. Unlike mechanical mixing in the high-temperature solid phase method, this method involves hydrolysis and condensation reactions in a liquid medium (e.g., water or organic solvents), forming a sol that gradually polymerizes into a gel. This process ensures uniform mixing of precursors, effectively reducing impurities and yielding products with narrow grain size distributions [24,25]. For instance, Kuzma et al. [26] utilized citric acid and ethylene glycol as chelating agents, combined with anatase TiO2, LiOH, and ferric citrate, to prepare a homogeneous precursor gel under mild conditions (65 °C water bath). Subsequent calcination at 700 °C in a CO-CO2 atmosphere produced phase-pure Li2FeTiO4 nanoparticles (<25 nm), demonstrating the method’s capability to tailor material morphology and crystallinity.
Li2FeTiO4, a titanium oxide-based cathode material, has become one of the promising materials for the next generation of cathode materials due to its excellent theoretical capacity and low cost. Although there have been relevant research reports on the preparation of Li2FeTiO4 cathode materials by the sol–gel method, research on its reaction mechanism and process parameters is rarely involved. In this paper, Li2FeTiO4 cathode material was synthesized by the sol–gel method as the research object to explore its reaction mechanism, optimize the sol–gel method synthesis process parameters, such as the amount of chelating agent and calcination temperature, etc., and use X-ray diffraction (XRD), scanning electron microscope (SEM), Fourier Transform infrared spectroscopy(FTIR), and other characterization methods to analyze the phase, morphology, and other aspects of the precursor and product, and explore the optimum calcination temperature of Li2FeTiO4. The Li2FeTiO4 cathode material prepared at 700 °C provides a discharge-specific capacity of 121.3 mAh/g in the first cycle and capacity retention of 89.2%.

2. Materials and Methods

2.1. Materials Preparation

Preparation of precursors: First, citric acid (C6H8O7, Aladdin, Shanghai, China, 99.5%) was dissolved in an amount of anhydrous ethanol. Then, CH3COOLi-2H2O (Aladdin, 99.0%), FeCl2-4H2O (Macklin, Shanghai, China, 98.0%), and Ti(OC4H9)4 (Alaadin, 99.0%) were added at a molar ratio of 2.05.1:1, and the above solutions were homogenized by continuous stirring for 24 h at room temperature. The gel was obtained by continued heating in a water bath at 65 °C for 5 h. Subsequently, it was dried in a vacuum drying oven at 120 °C for 24 h. After drying and grinding, sample precursors were obtained.
Calcination at various reaction temperatures: The precursors were placed in a tube furnace under an Ar atmosphere and precalcined at 500 °C for 8 h. The precursors were then subjected to secondary calcination at several temperature ranges (600 °C, 700 °C, 800 °C) and fully milled to obtain powdered samples at different temperatures.

2.2. Materials Characterization

The morphology and composition of the precursor and cathode powder were determined using a scanning electron microscope (SEM, S-4800, Hitachi, Tokyo, Japan). X-ray diffraction (XRD, SMARTLAB(9), Rigaku, Tokyo, Japan) analysis was performed using Cu Kα rays (λ = 1.5406 Å), and the data were collected at 2θ = 10–80° at 2° min−1. The structure of the material was characterized by Fourier transform infrared spectroscopy (FTIR, 8400S, Shimadzu, Tokyo, Japan) and thermogravimetry (TG, STA2500, Netzsch, Exton, PA, USA). The specific surface area of the materials was characterized by a specific surface area and porosity analyzer (BET, KuboX1000, Beijing Builder, Beijing, China).

2.3. Electrochemical Measurements

The cathode slurry was prepared by mixing 80 wt% active material (Li2FeTiO4), 10 wt% acetylene black (MTI Corporation, Richmond, CA, USA, 99.9%), and 10 wt% polyvinylidene fluoride (PVDF, Sigma-Aldrich, St. Louis, MO, USA) binder in N-methyl-2-pyrrolidone (NMP, Aladdin, 99.5%). The slurry was uniformly coated onto an Al foil current collector using a doctor blade, with a target mass loading of 1.0 mg/cm2 (active material basis). The coated electrodes were dried at 80 °C for 12 h under vacuum to remove residual solvents and then pressed at 10 MPa using a hydraulic press to ensure intimate contact between components. The dried electrodes were punched into disks with a diameter of 10 mm and further vacuum-dried at 120 °C for 6 h prior to cell assembly.
CR2032 coin cells were assembled in an argon-filled glovebox (O2 < 0.1 ppm, H2O < 0.1 ppm). The cells were assembled in the order of negative case, shrapnel, spacer, lithium foils, Celgard 2400 polypropylene film, Li2FeTiO2 cathode, and positive case. The cells were assembled dropwise with 100 μL of commercial lithium electrolyte per assembly.
Cyclic voltammetry (CV) tests were conducted at a scan rate of 0.1 mV/s within a voltage range of 1.5–4.8 V using a CHI760E electrochemical workstation. Galvanostatic charge/discharge tests were performed on a LAND-CT2001A system at various current densities, with 1 C defined as 300 mA/g based on the active material mass. Rate capability (0.1 C–5 C) and long-term cycling stability (100 cycles at 1 C) were evaluated under ambient temperature conditions. All specific capacities and current densities were calculated using the mass of Li2FeTiO4 in the electrode.

3. Results

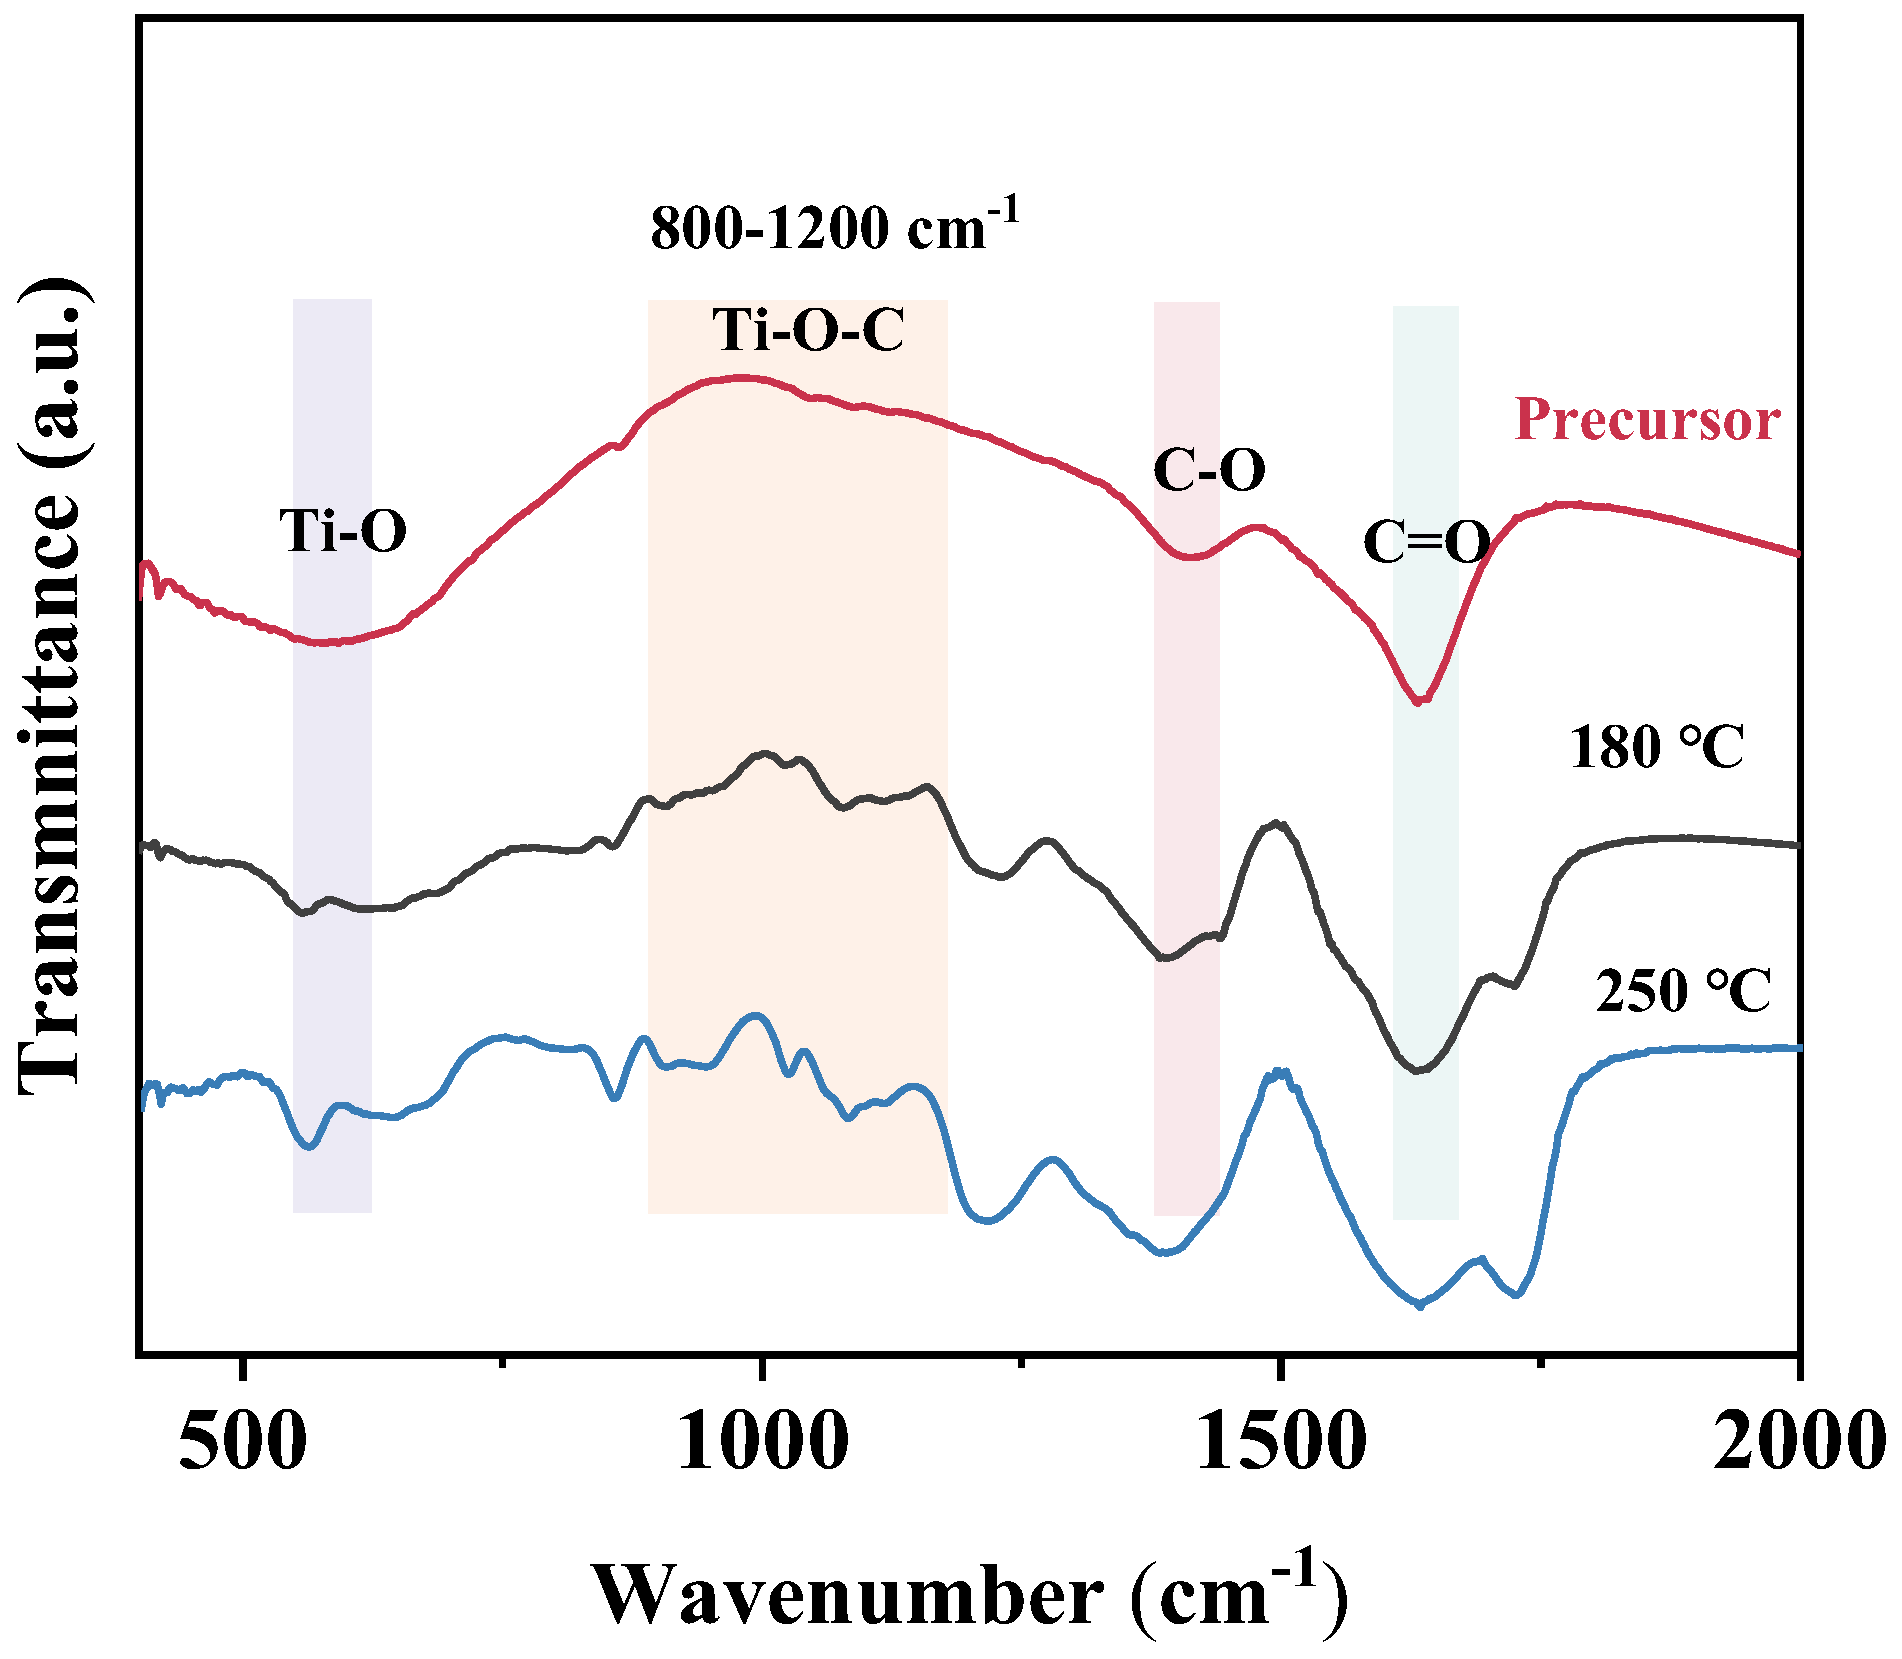
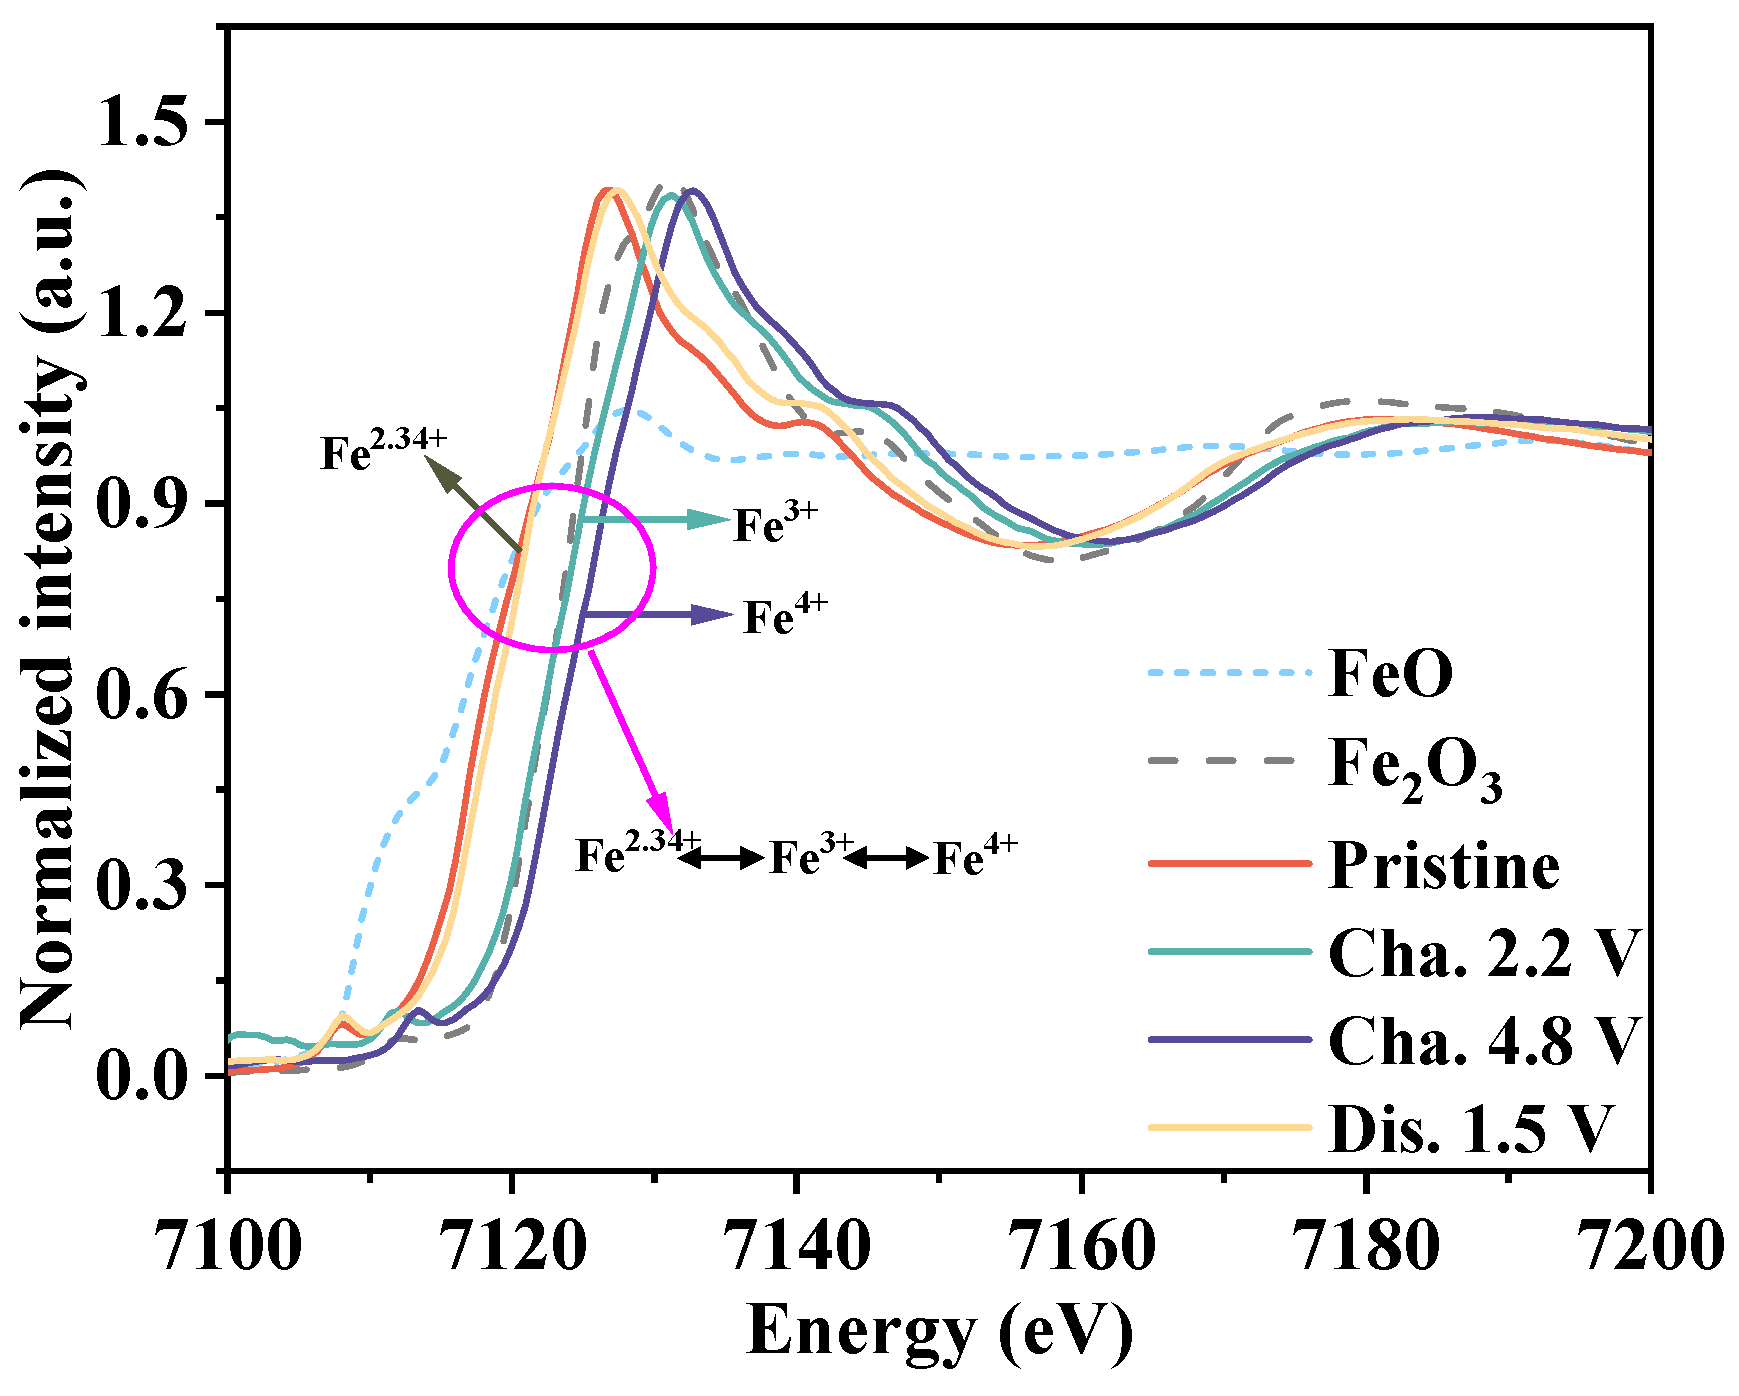
3.1. Research on the Mechanism of Reaction

Firstly, the reaction mechanism of the preparation technology was studied in detail from the angle of ion reaction. In general, the sol–gel process is divided into two parts, one involving the chelation and hydrolysis process, and the other the gel heat treatment stage. In the chelation and hydrolysis process, citric acid acts as a pH regulator and chelator in the reaction process [27]. If the amount is too small, it will lead to the formation of colloidal instability, which may precipitate during the aging process, leading to the failure of the experiment. In addition, the insufficient amount of citric acid may not ensure the uniform distribution of metal elements, affecting the chemical properties of the product. On the contrary, excess citric acid may remain in the dry gel, resulting in insufficient citric acid combustion during the roasting process and affecting the crystallinity of the product. Therefore, it is necessary to select the appropriate citric acid content from the perspective of ionic reaction is crucial for preparation.
Li2FeTiO4 composites are synthesized by sol–gel method and citric acid undergoes the following dissociation in the system [28]:
H3Cit ↔ H2Cit + H+ (K1 = 7.4 × 10⁻⁴)
H2Cit ↔ HCit2− + H+ (K2 = 1.7 × 10⁻⁵)
HCit2− ↔ Cit3− + H+ (K1 = 4.0 × 10⁻⁷)
From the above dissociation equation, it can be seen that, when the pH value of the system is low, citric acid exists in the form of HCit2−, and, as the pH gradually increases, it mainly exists in the form of HCit2− and Cit3−. During the formation of sol–gel, transition metal ions (such as Fe2+, Ti4+) mainly chelate with HCit2− and Cit3− polyanions. When the pH of the solution is less than 3, citric acid in the solution system mainly exists in the form of HCit2−, so a low pH is not conducive to the formation of the sol. Taking Fe2+ as an example, the equation for the complexation reaction is as follows [29]:
Fe2+ + C6H6O72− → [Fe(C6H6O7)]
Fe2+ + C6H5O73− → [Fe(C6H5O7)]
The chelating ions formed by the above formula combine with chloride ions to form chelates, which are then hydrolyzed to form active monomers:
[Fe(C6H6O7)]Cl + 2H2O → Fe(OH)2 + C6H8O7 + Cl
The generated active monomer is polymerized. In the formation of gel, polymerization and hydrolysis are carried out at the same time. The reaction equation is as follows [30]:
Fe(OH)2 + Fe(OH)2 → (OH)Fe-O-Fe(OH) + H2O
(OH)Fe-O-Fe(OH) + Fe(OH)2 → [(OH)Fe-O-Fe-O-Fe(OH)] + H2O
From the above equation, it can be seen that, when Fe2+ forms complex ions [Fe(C6H6O7)] and [Fe(C6H5O7)], the molar ratio of Fe2+ to C6H6O72− and C6H5O73− is 1:1. Therefore, it can be inferred that the molar ratio of citric acid to transition metal is 1:1.

3.2. Research on Reduction Reaction

In addition to the above pH regulation and chelation, citric acid can also act as a reducing agent to maintain the stability of Fe2+. Since Fe2+ is inevitably oxidized to Fe3+ in the air, it affects the synthesis of the product. This requires the addition of a strengthening reducing agent to replace the oxidation of Fe2+. Citric acid plays a role in this process. Therefore, citric acid plays an important role in this process with the following equation [31]:
C6H8O7 → 3CO2 + 4H2O + 18e
Fe3+ + e → Fe2+
From the analysis of valence states alone, the ratio of citric acid to iron is 1:18, which is much smaller than the amount of citric acid used for complexation. However, the carboxyl group of citric acid cannot reduce Fe3+. In the system, the reduction is mainly carried out by the cracked carbon after the thermal decomposition of citric acid. Previous studies have shown that the reduction of trivalent iron is mainly an indirect reduction of the cracked carbon, and its equation is as follows [32]:
Fe2O3 + CO → 2FeO + CO2
Based on this analysis, the ratio of reducing agent citric acid to iron is at least 1:12.

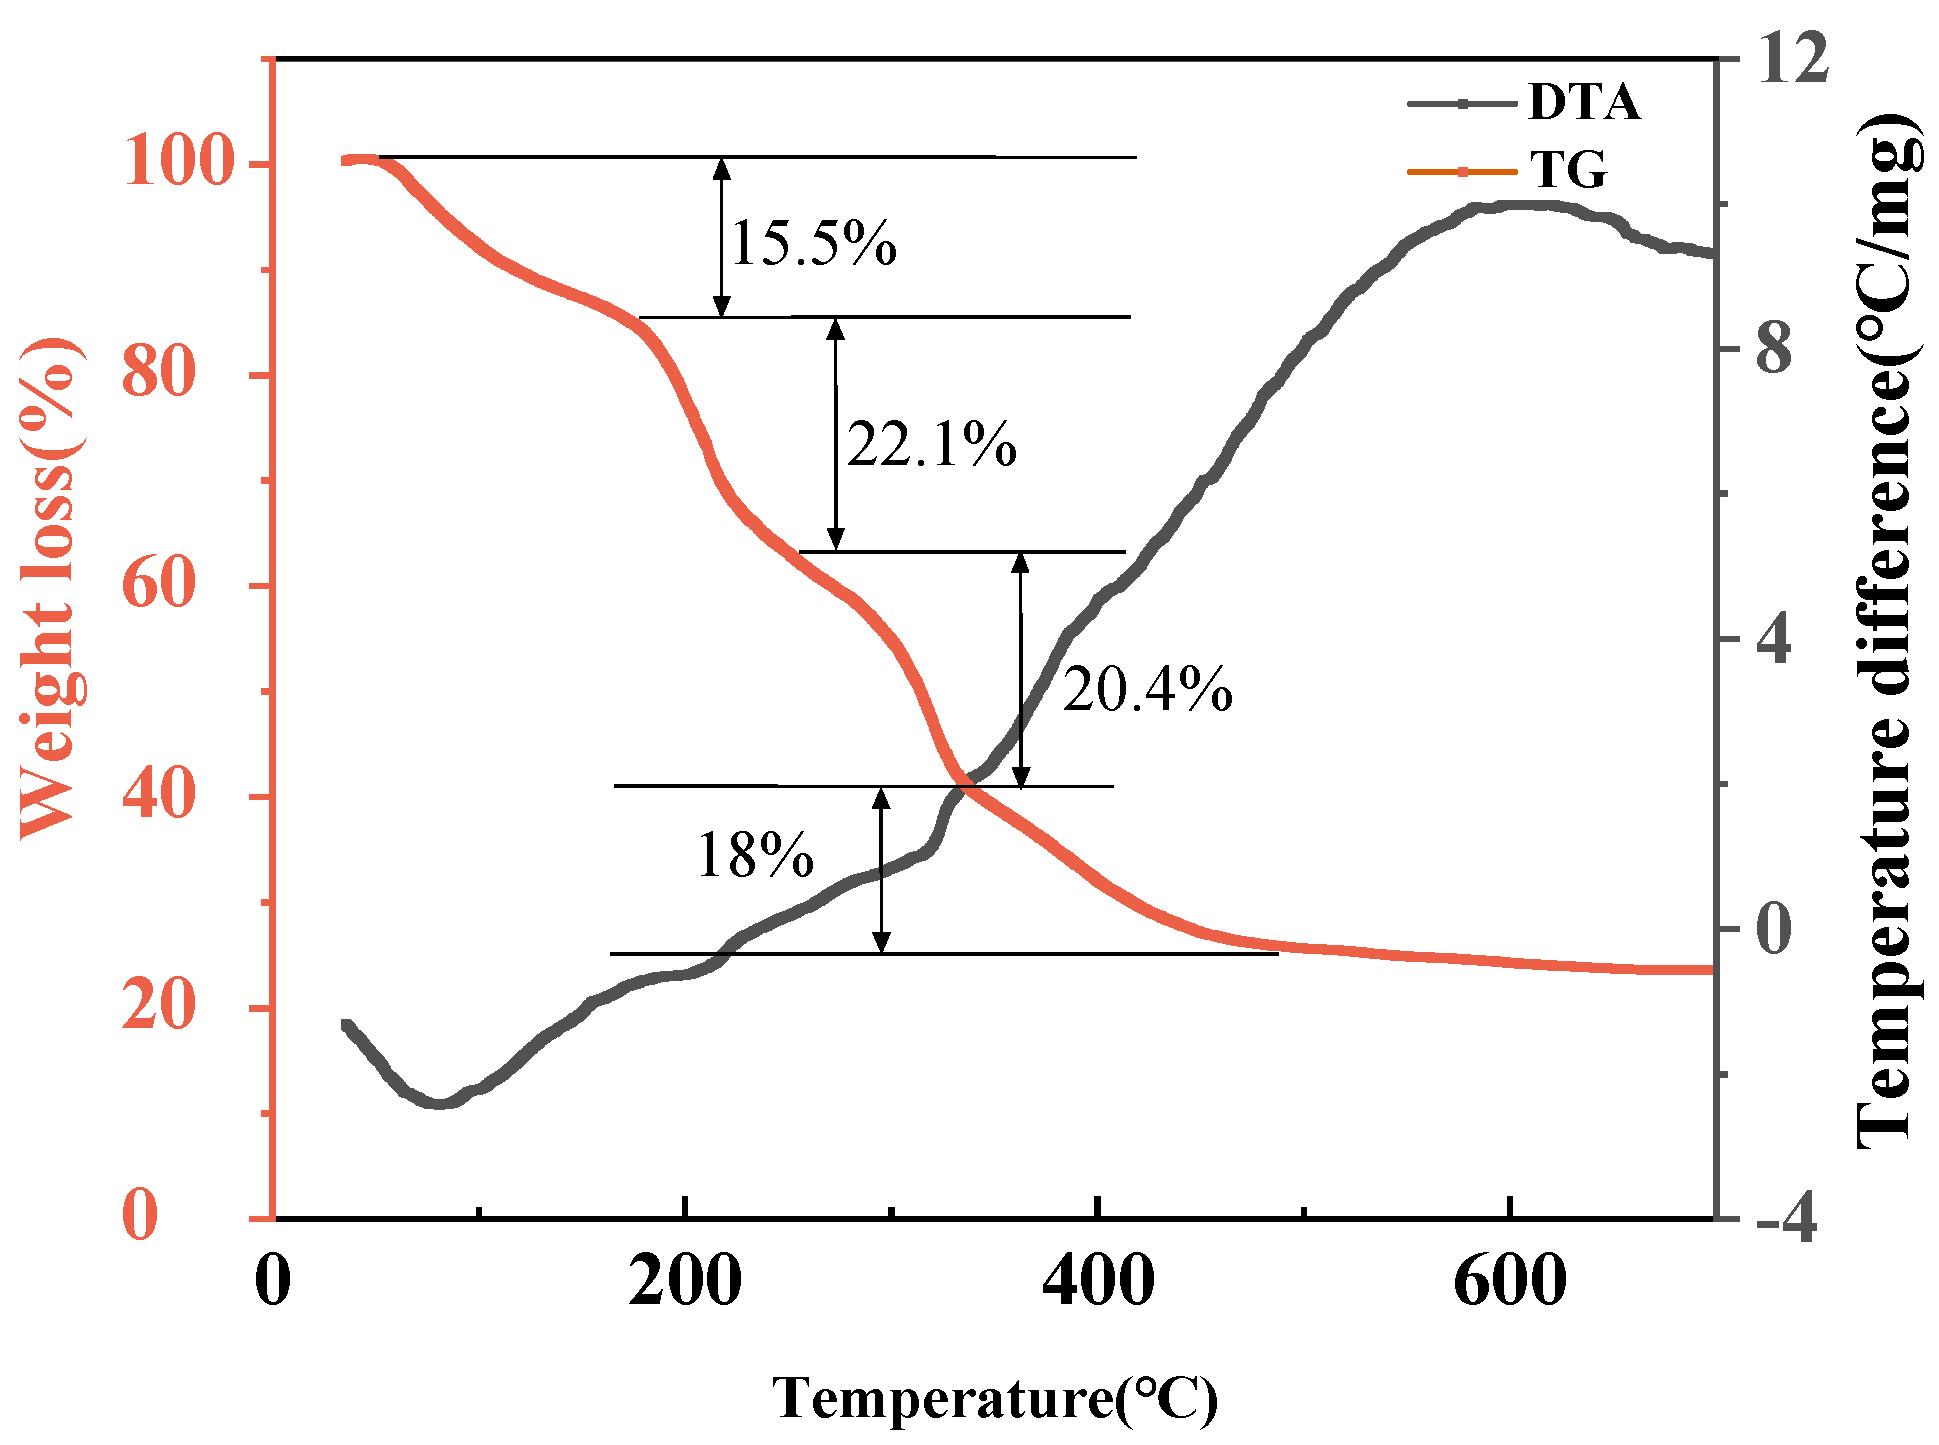
3.3. Thermogravimetry-Differential Thermal Analysis Study on Precursors

Material preparation and processes determine the structure and properties of materials, and understanding the reaction history is the basis for determining specific process routes and parameters. The heat treatment of gel, as the second part of sol–gel, is an important stage of grain growth. Decomposition and phase transitions of the reaction during heat treatment were studied with the aid of thermogravimetry-differential thermal analysis (TG-DTA) and infrared spectra. Figure 1 shows the TG-DTA curve of dry gel precursor in an Ar atmosphere from room temperature (about 25 °C) to 700 °C, with a heating rate of 5 °C/min. From the TG curve, it can be seen that 200~400 °C is the main temperature range for the reaction to occur, and the main weight loss (about 50%) of the entire reaction occurs within this temperature range. At the same time, it can be seen that there are changes in the rate of weight loss at 180 °C, 250 °C, 330 °C, and 470 °C, corresponding to the four peaks appearing on the DTA curve.
According to the previous TG-DTA curve analysis, the weight loss of the sample during the room temperature ~180 °C stage is about 15.5%. The mass proportion of crystalline water in raw materials C6H8O7·H2O, FeCl2·4H2O, Ti(OC4H9)4, and CH3COOLi·H2O can be calculated using the following expression:
k = m ( H 2 O ) m ( C 6 H 8 O 7 H 2 O ) + m ( F e C l 2 4 H 2 O ) + m ( T i ( OC 4 H 9 ) 4 ) + m ( CH 3 COOLi H 2 O )
The proportion of crystalline water by mass is about 16%, which is close to the TG curve. Based on this, it can be inferred that the weight loss occurring at room temperature ~180 °C is mainly caused by the loss of crystalline water by the compound.
With the help of infrared spectroscopy, we can further determine the evolution law of the sample structure in the middle and low-temperature region (180–250 °C). Figure 2 shows the infrared spectra of the precursor and after calcination at 180 °C. From the spectrum of the precursor in the figure, it can be seen that there are continuous bending vibrations in the spectral lines between 800 and 1200 cm−1, which are the vibrations of C-O, C-C, and other functional groups, corresponding to the coordination and bridging ligands. Once again, it indicates that chelation is very thorough. Specifically, vibration of Ti-O-C bonds was observed at approximately 1100 cm−1, indicating the formation of a coordination complex between titanium ions and citric acid. There is a broad peak at 500 cm−1 that corresponds to the characteristic peak of the Ti-O bond. Due to the fact that the absorption peak of Fe-O is usually located outside 400 cm−1, the characteristic peak of Fe-O cannot be found in the infrared spectrum. Compared with the infrared spectrum of the precursor, the characteristic peak corresponding to the Ti-O bond in the 180 °C infrared spectrum is more prominent, and the spectral lines between 800 and 1200 cm−1 become flat, indicating that the chelating coordination bond is gradually broken. In summary, it can be concluded that the main occurrence from room temperature to 180 °C is the loss of crystalline water, accompanied by partial breakage of chelating coordination bonds. The IR spectrum of the sample calcined at 250 °C almost disappears at the peak at 1400 cm−1 compared to the sample calcined at 180 °C.
The thermal decomposition products of citric acid are relatively complex, and their products may include aldehydes (such as formaldehyde, acetaldehyde, etc.), alcohols (such as methanol, ethanol, etc.), acids (such as formic acid, acetic acid, etc.), carbon monoxide, carbon dioxide, and other gases. Aldehydes, due to their aldehyde groups and strong reducibility, can reduce trivalent iron to iron in this temperature environment. The equation is as follows [33]:
Fe2O3 + 3CH3CHO → 3CH3COOH + 2Fe
In summary, the reactions in the range of 250~330 °C are mainly the thermal decomposition of FeCl2, Ti(OC4H9)4, and CH3COOLi, generating phases such as Li2O, TiO2, Fe, and the reduction reaction of Fe3+ in the system.
According to the TG-DTA curve, the weight loss of the TG curve corresponding to the 330–470 °C stage is about 15%. Compared with the standard spectral line, the characteristic peaks of Li2FeTiO4 are obvious, indicating the formation of Li2FeTiO4 crystals in this temperature range.
Furthermore, it can be observed that the baseline of the sample is not smooth, indicating that the Li2FeTiO4 crystal is only initially formed with low crystallinity and needs to be further crystallized at high temperatures.
At the stage above 470 °C, according to the TG-DTA curve, the product at this temperature did not exhibit severe weight loss, nor did it generate endothermic and exothermic peaks, indicating that Li2FeTiO4 crystals had already been formed at this temperature, and no other substances were generated, nor did Li2FeTiO4 crystal decomposition occur.
Through sampling and characterization of samples at various temperatures, it can be seen that the reaction process of preparing Li2FeTiO4 crystal by sol–gel method can be divided into the following five stages:
(1)
Room temperature ~180 °C stage: This stage mainly refers to the weight loss reaction of raw materials losing crystalline water, accompanied by the gradual rupture of complex coordination bonds.
(2)
180–250 °C stage: During this stage, the thermal decomposition of citric acid (C6H8O7) occurs, and the product is mainly organic matter. Aldehydes (such as formaldehyde, acetaldehyde, etc.) and CO will serve as reducing agents to achieve the reduction of Fe3+ in the system.
(3)
250–330 °C stage: This stage mainly involves the thermal decomposition of metal salts (such as FeCl2, Ti(OC4H9)4, CH3COOLi, etc.), resulting in Li2O, TiO2, Fe, among which Fe3O4 is the intermediate phase obtained from insufficient reduction of trivalent iron.
(4)
330–470 °C stage: The reactions that occur during this stage include further reduction of Fe3O4 and the initial formation of Li2FeTiO4 crystals.
(5)
Stage above 470 °C: This stage is the further formation of Li2FeTiO4 crystals and changes in their crystallization properties and microstructure.

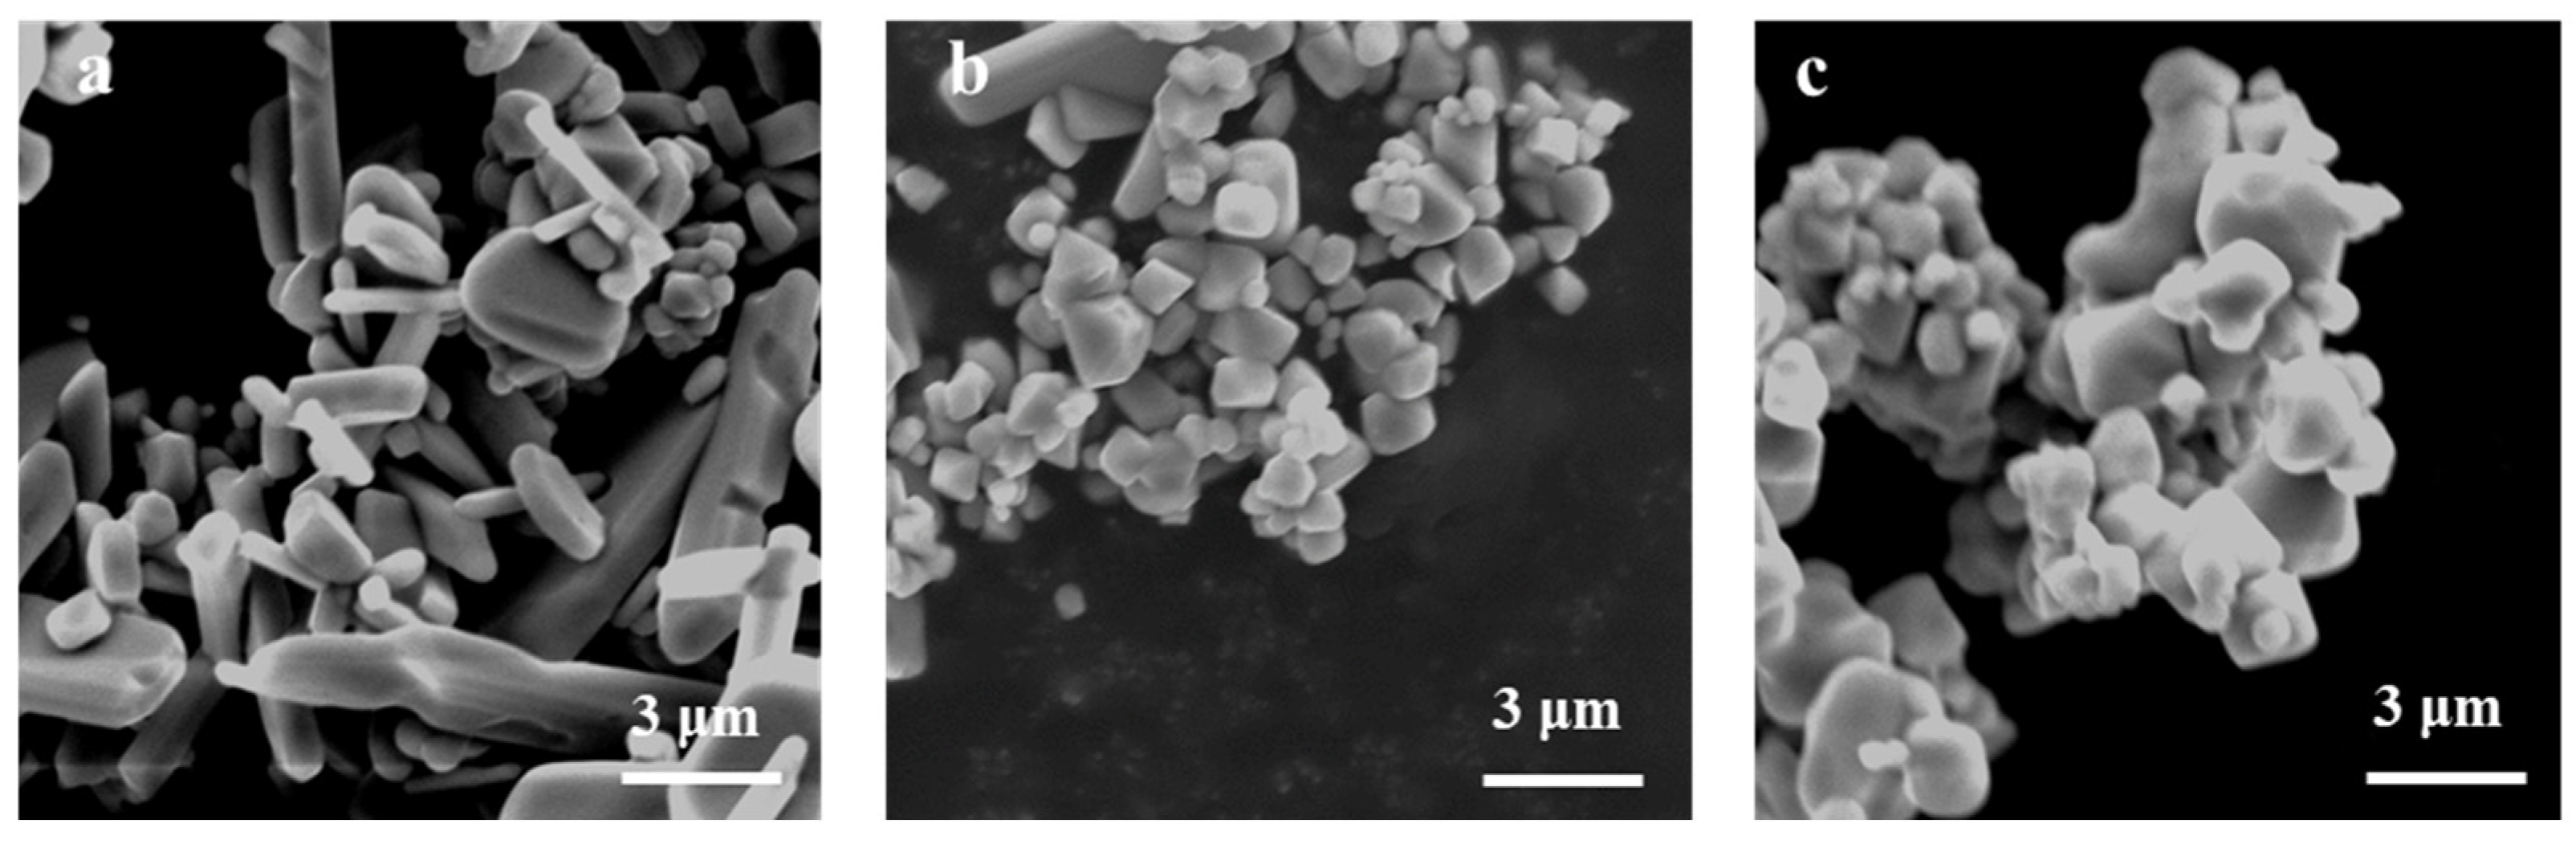
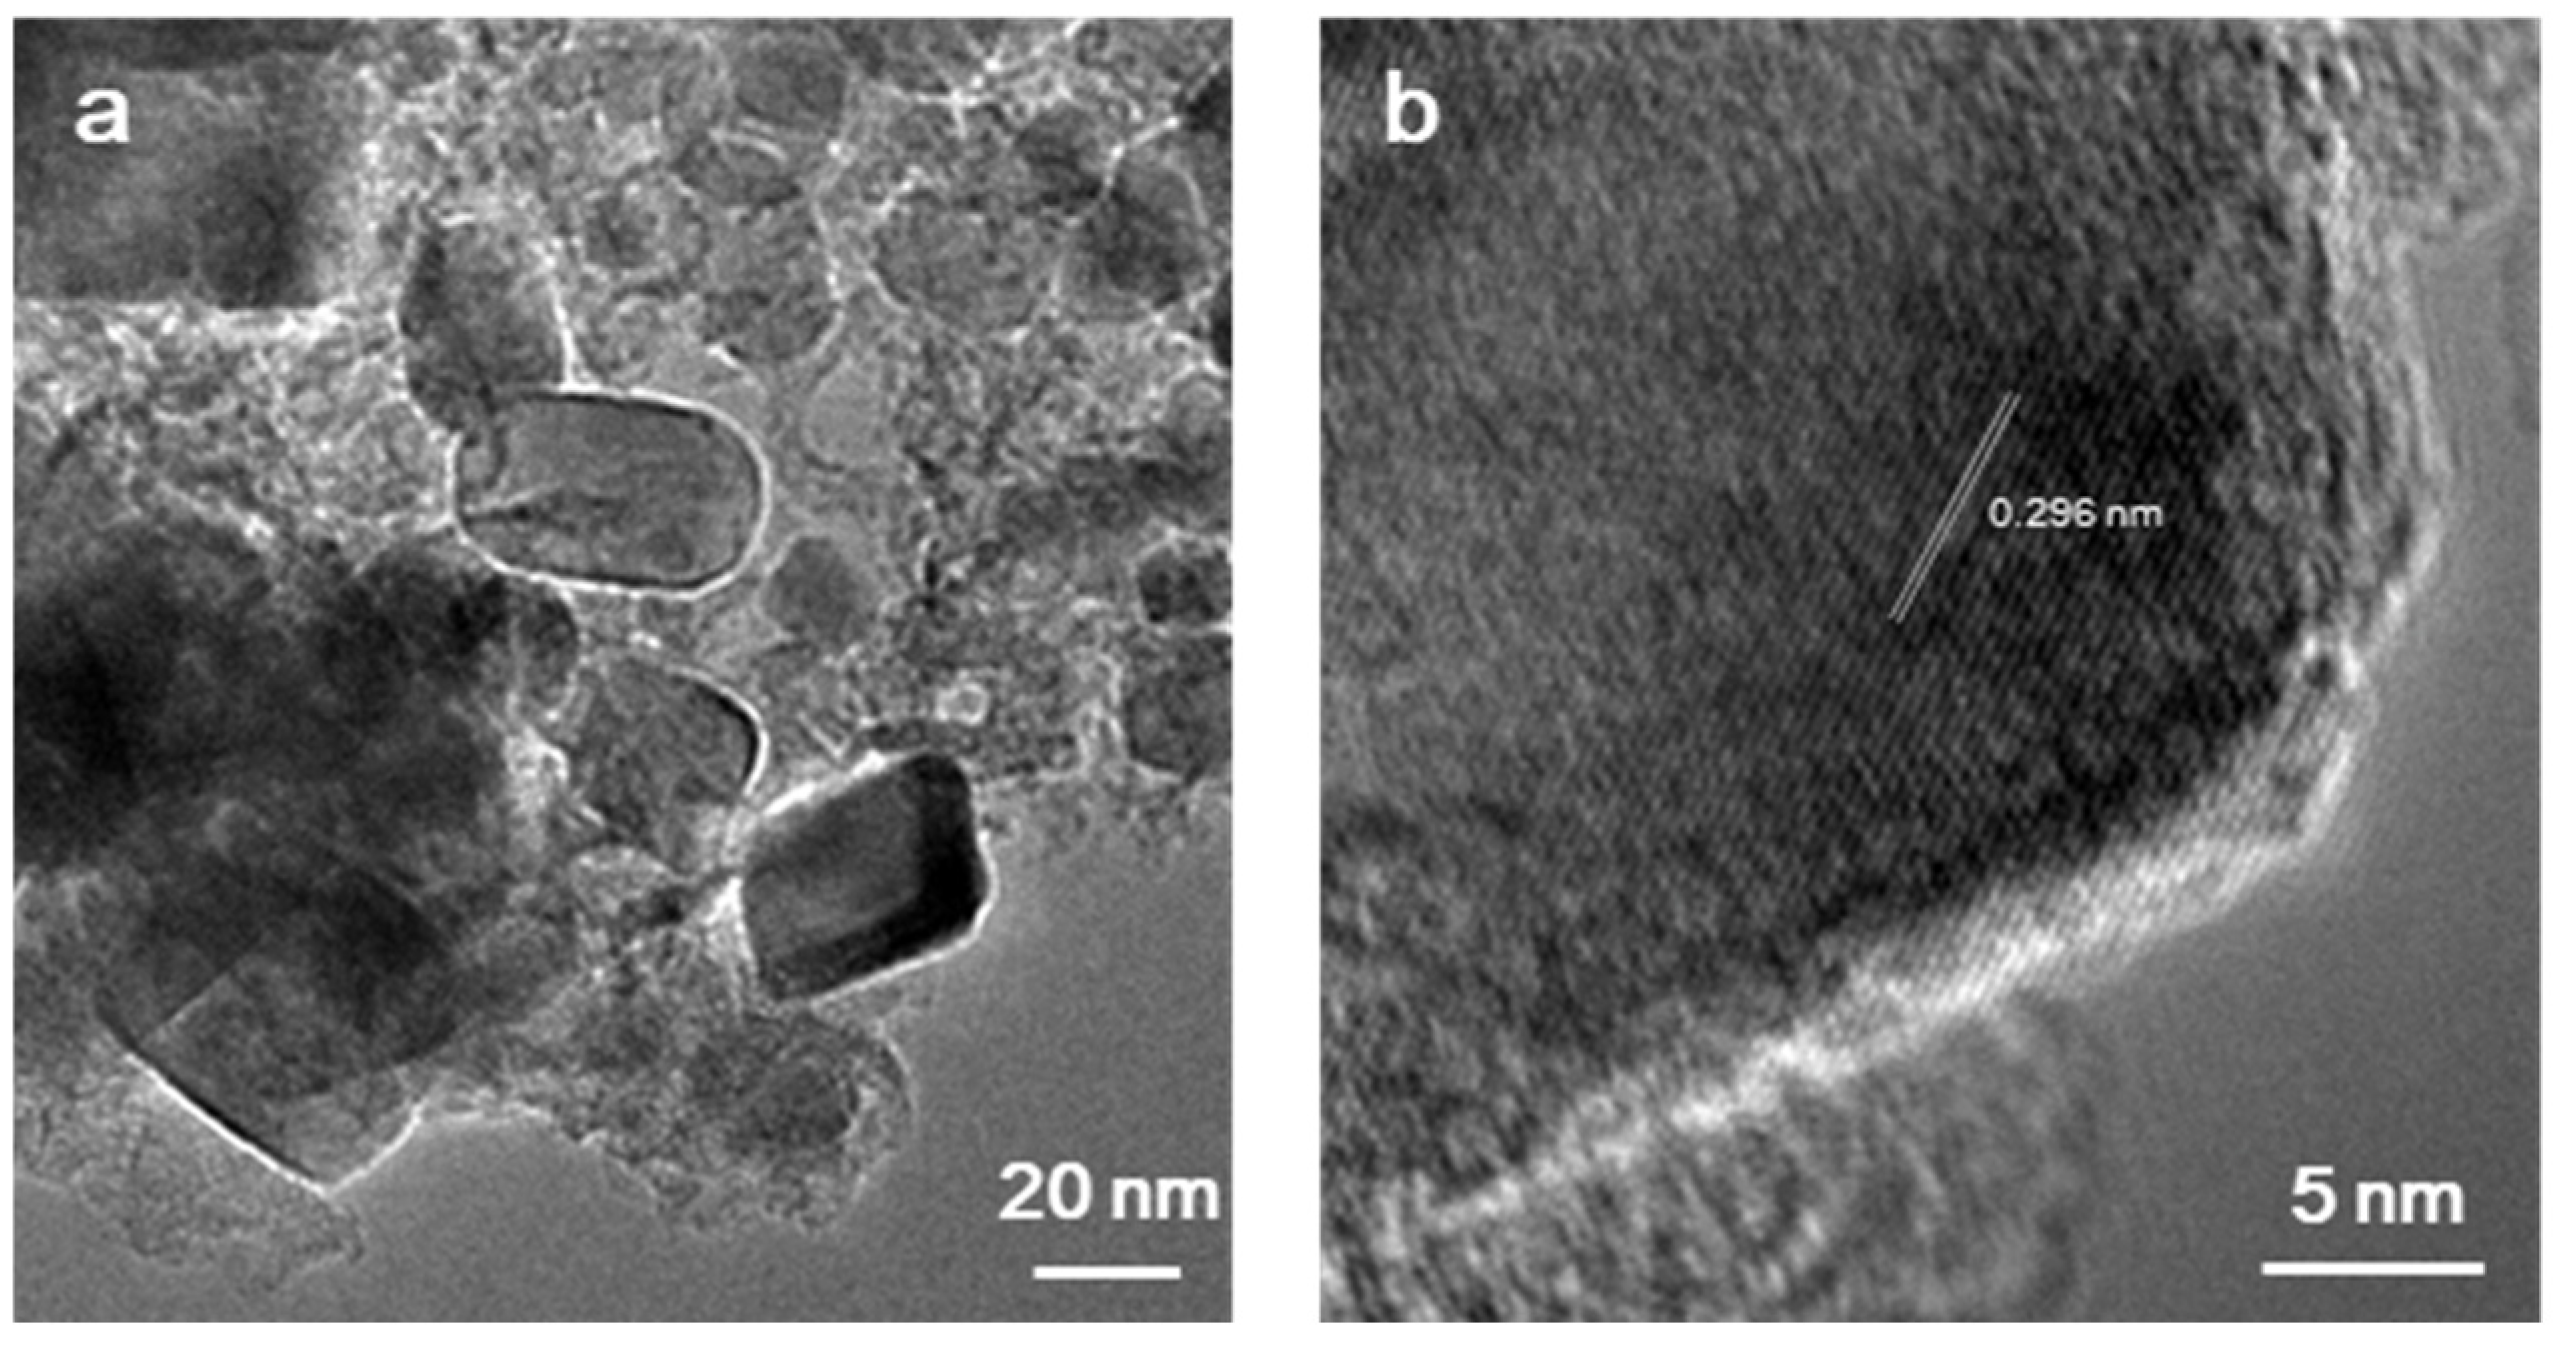
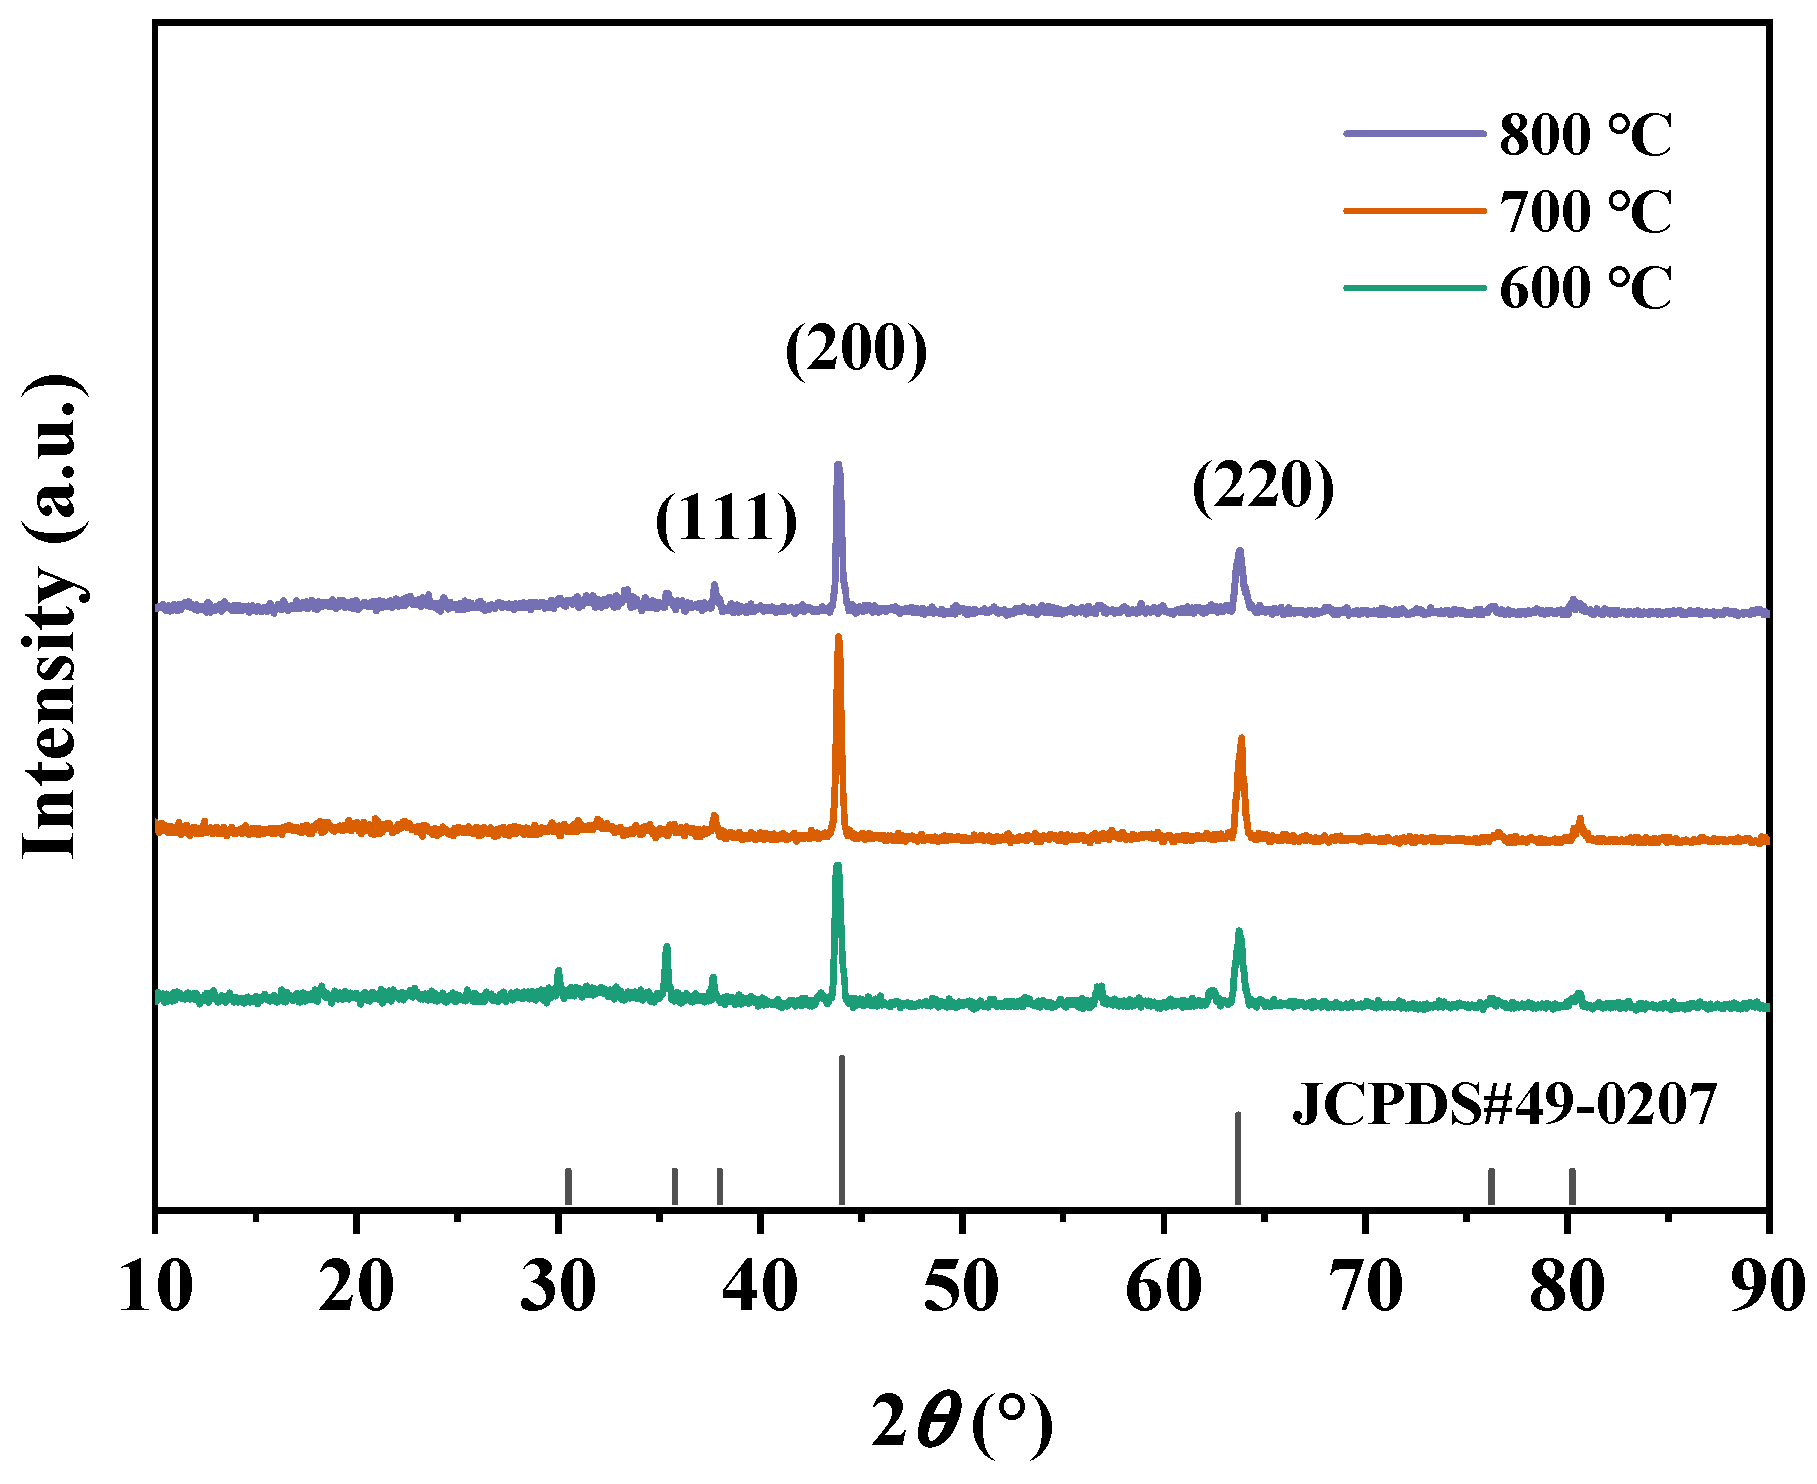
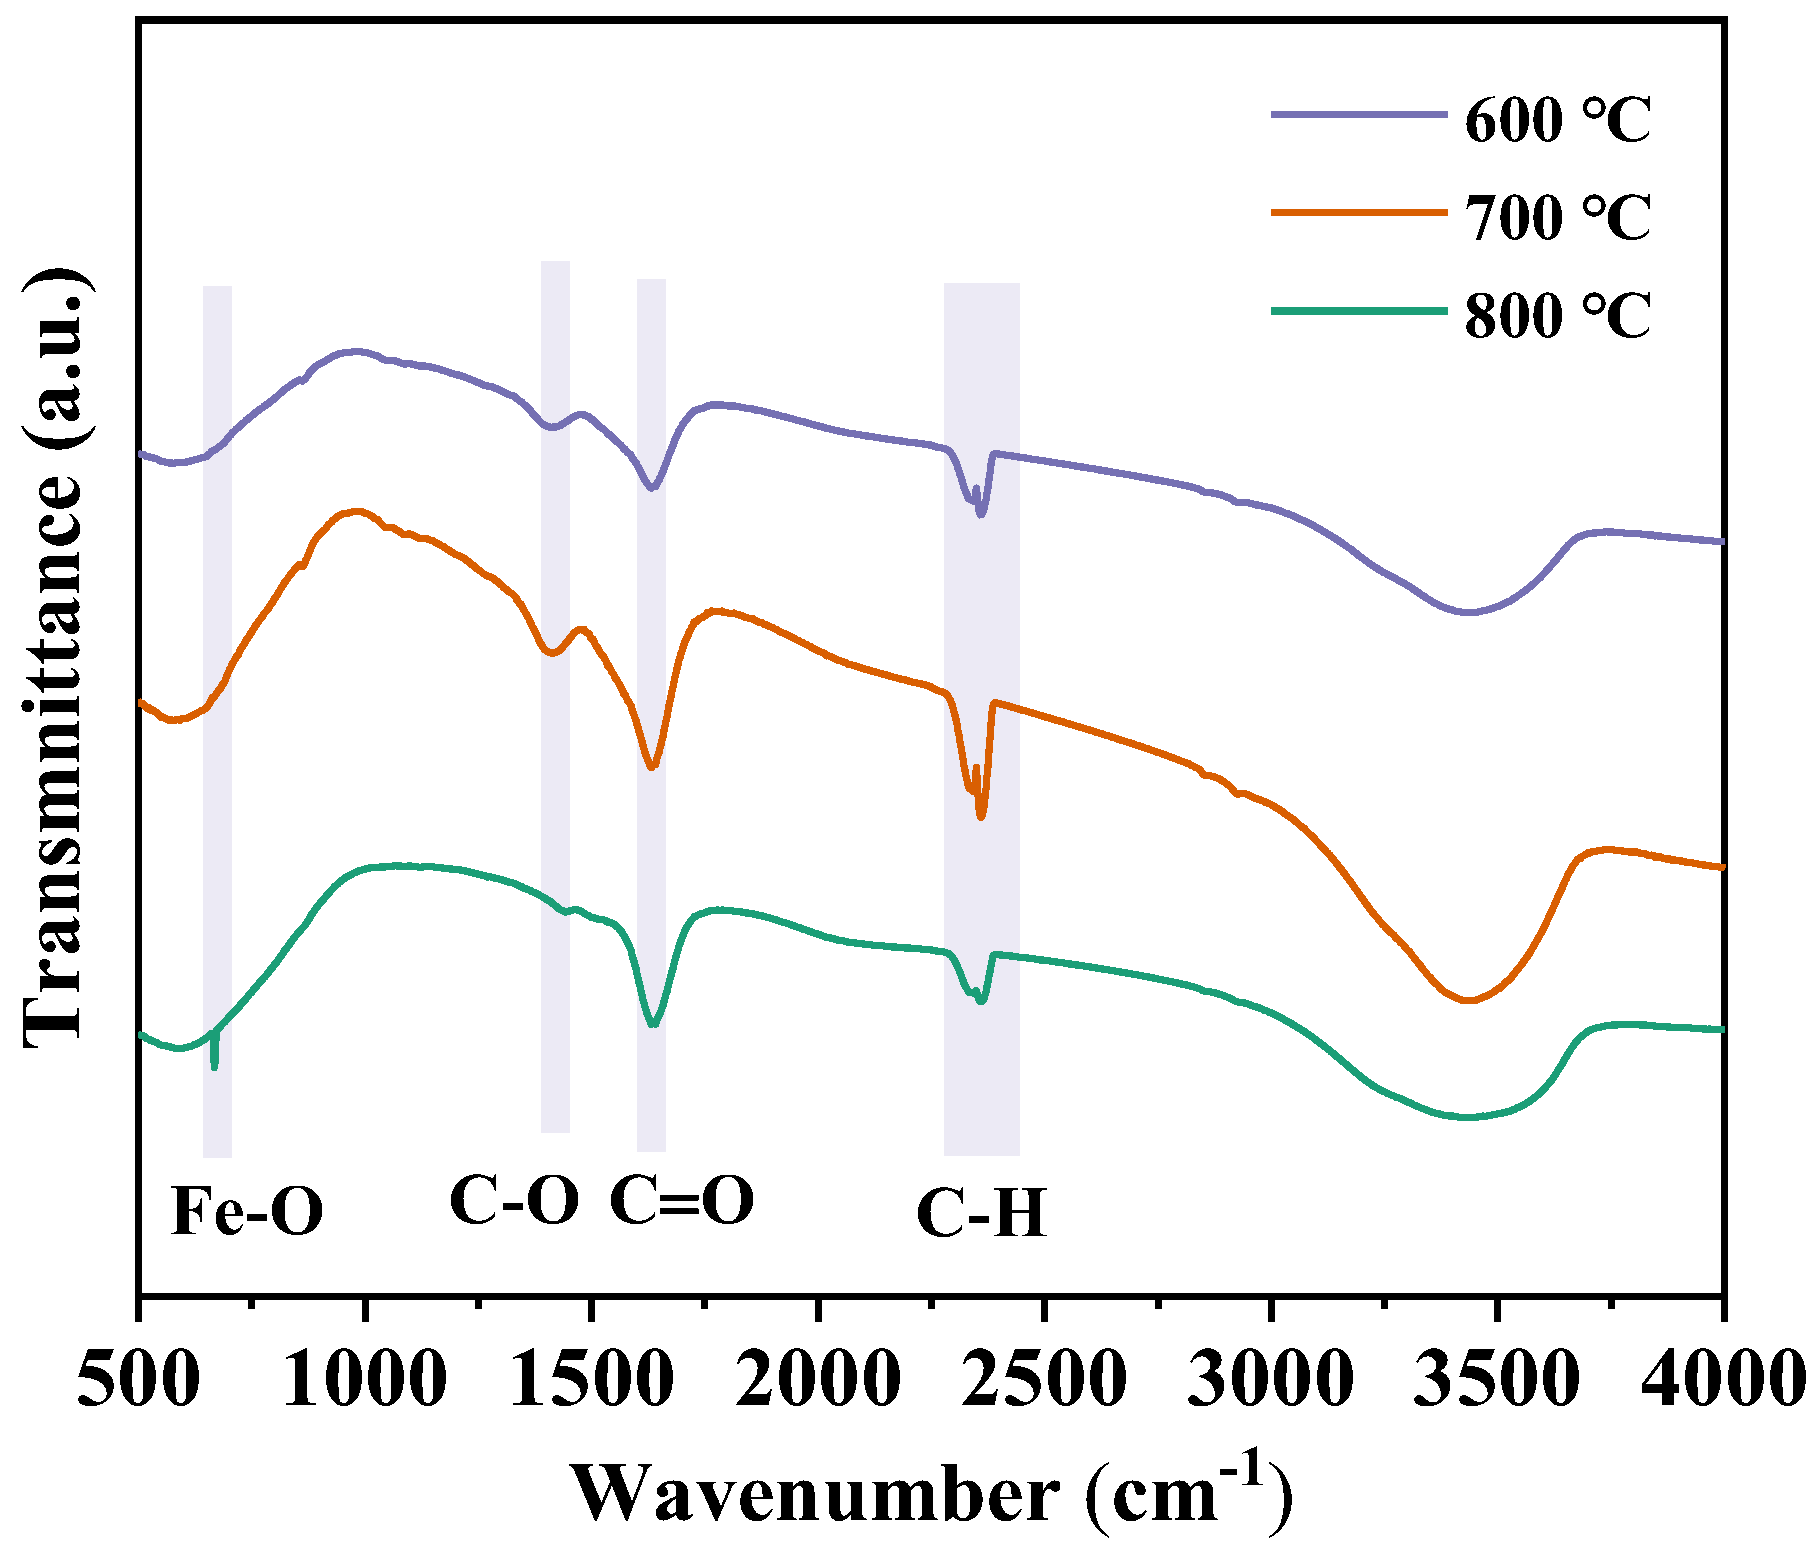
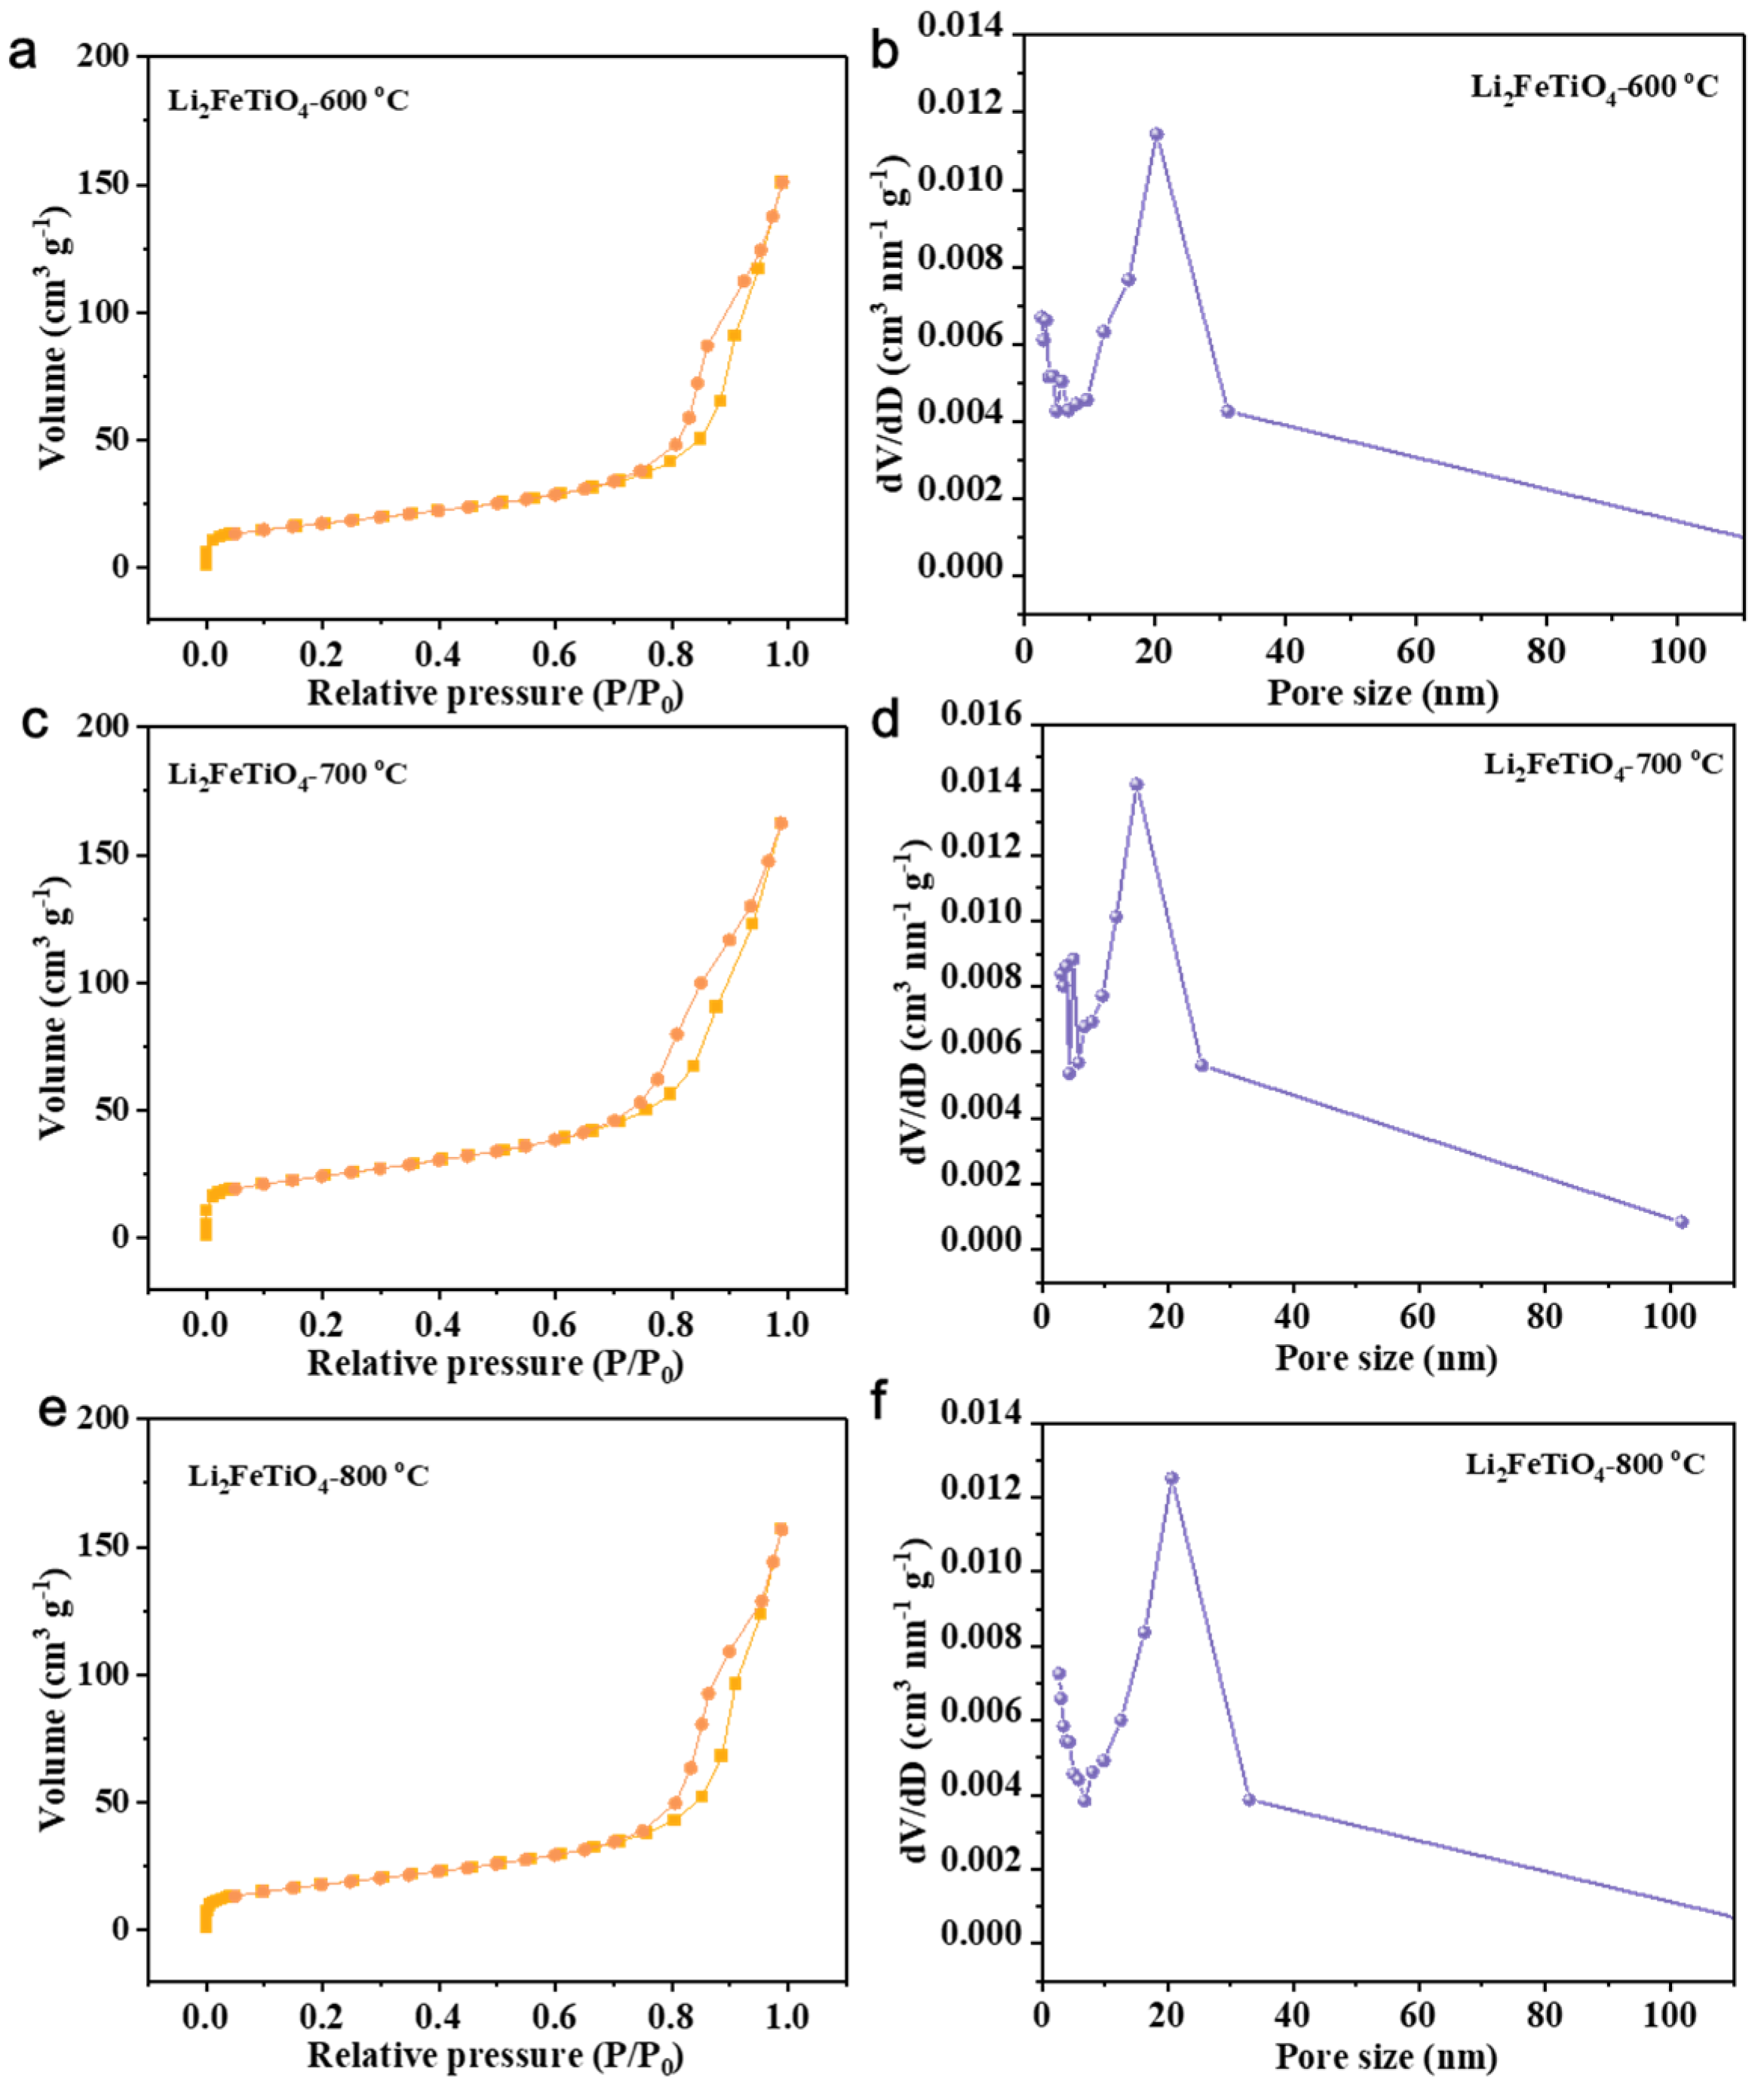
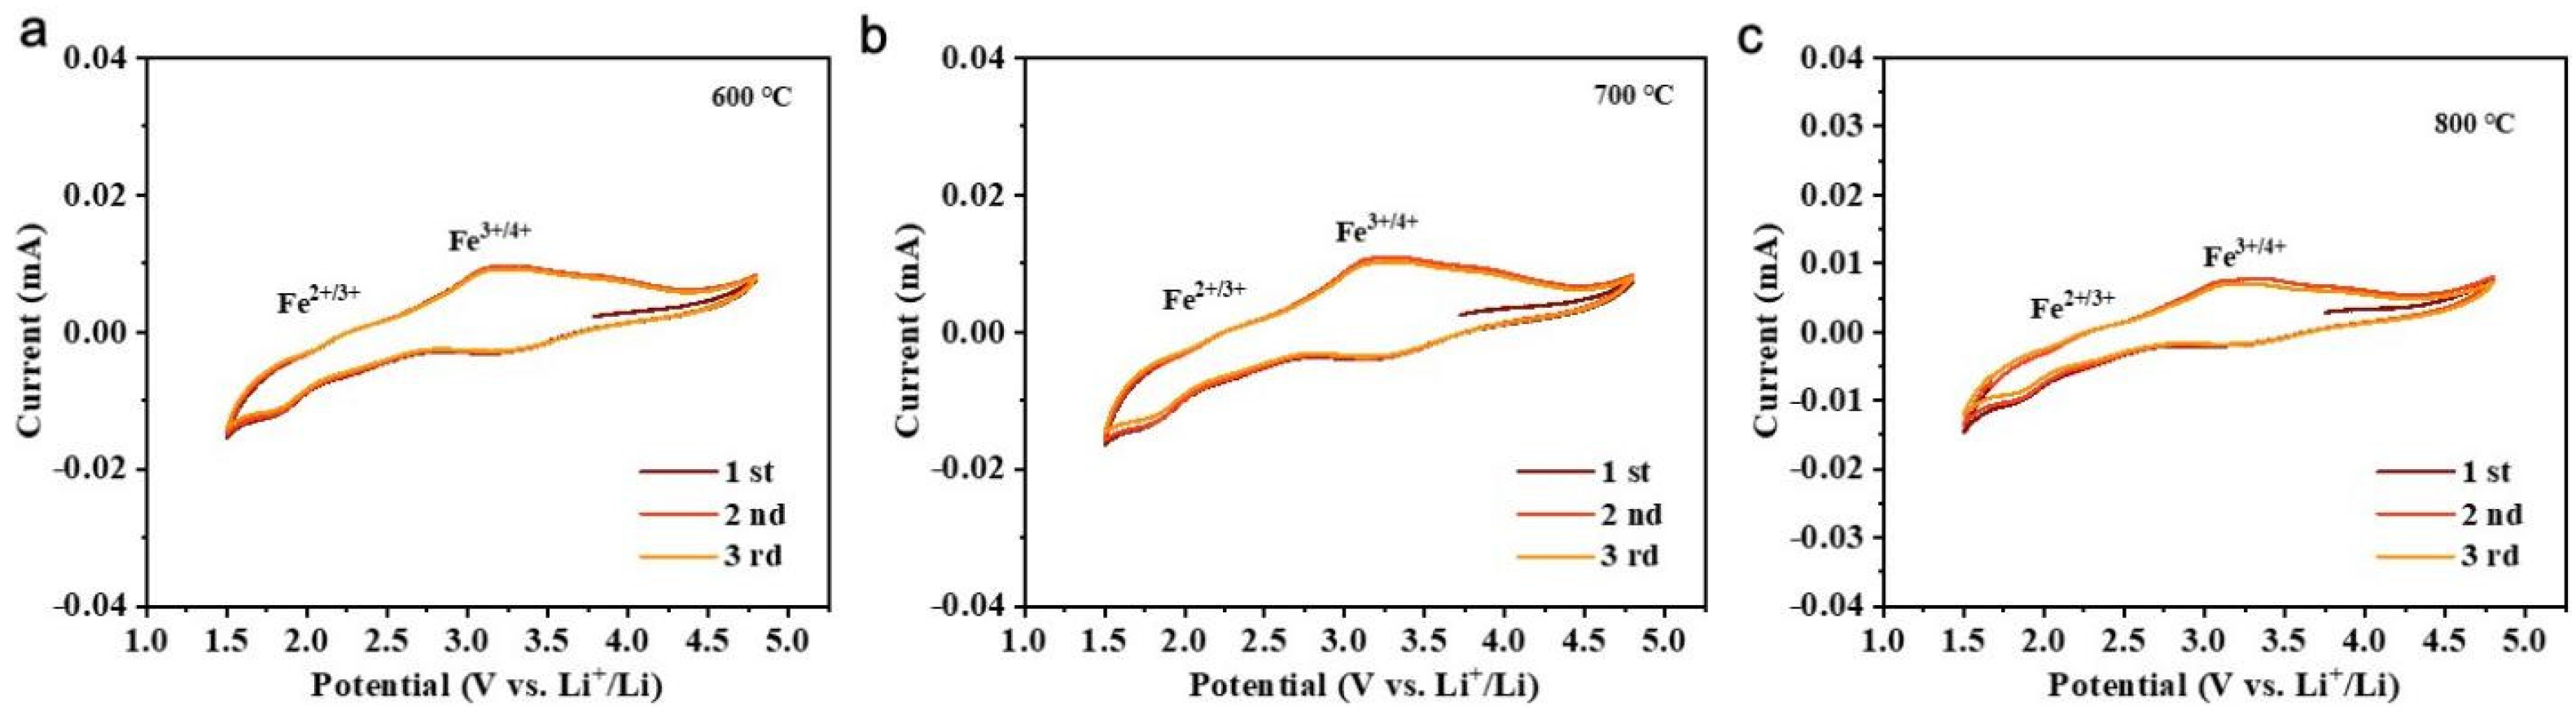
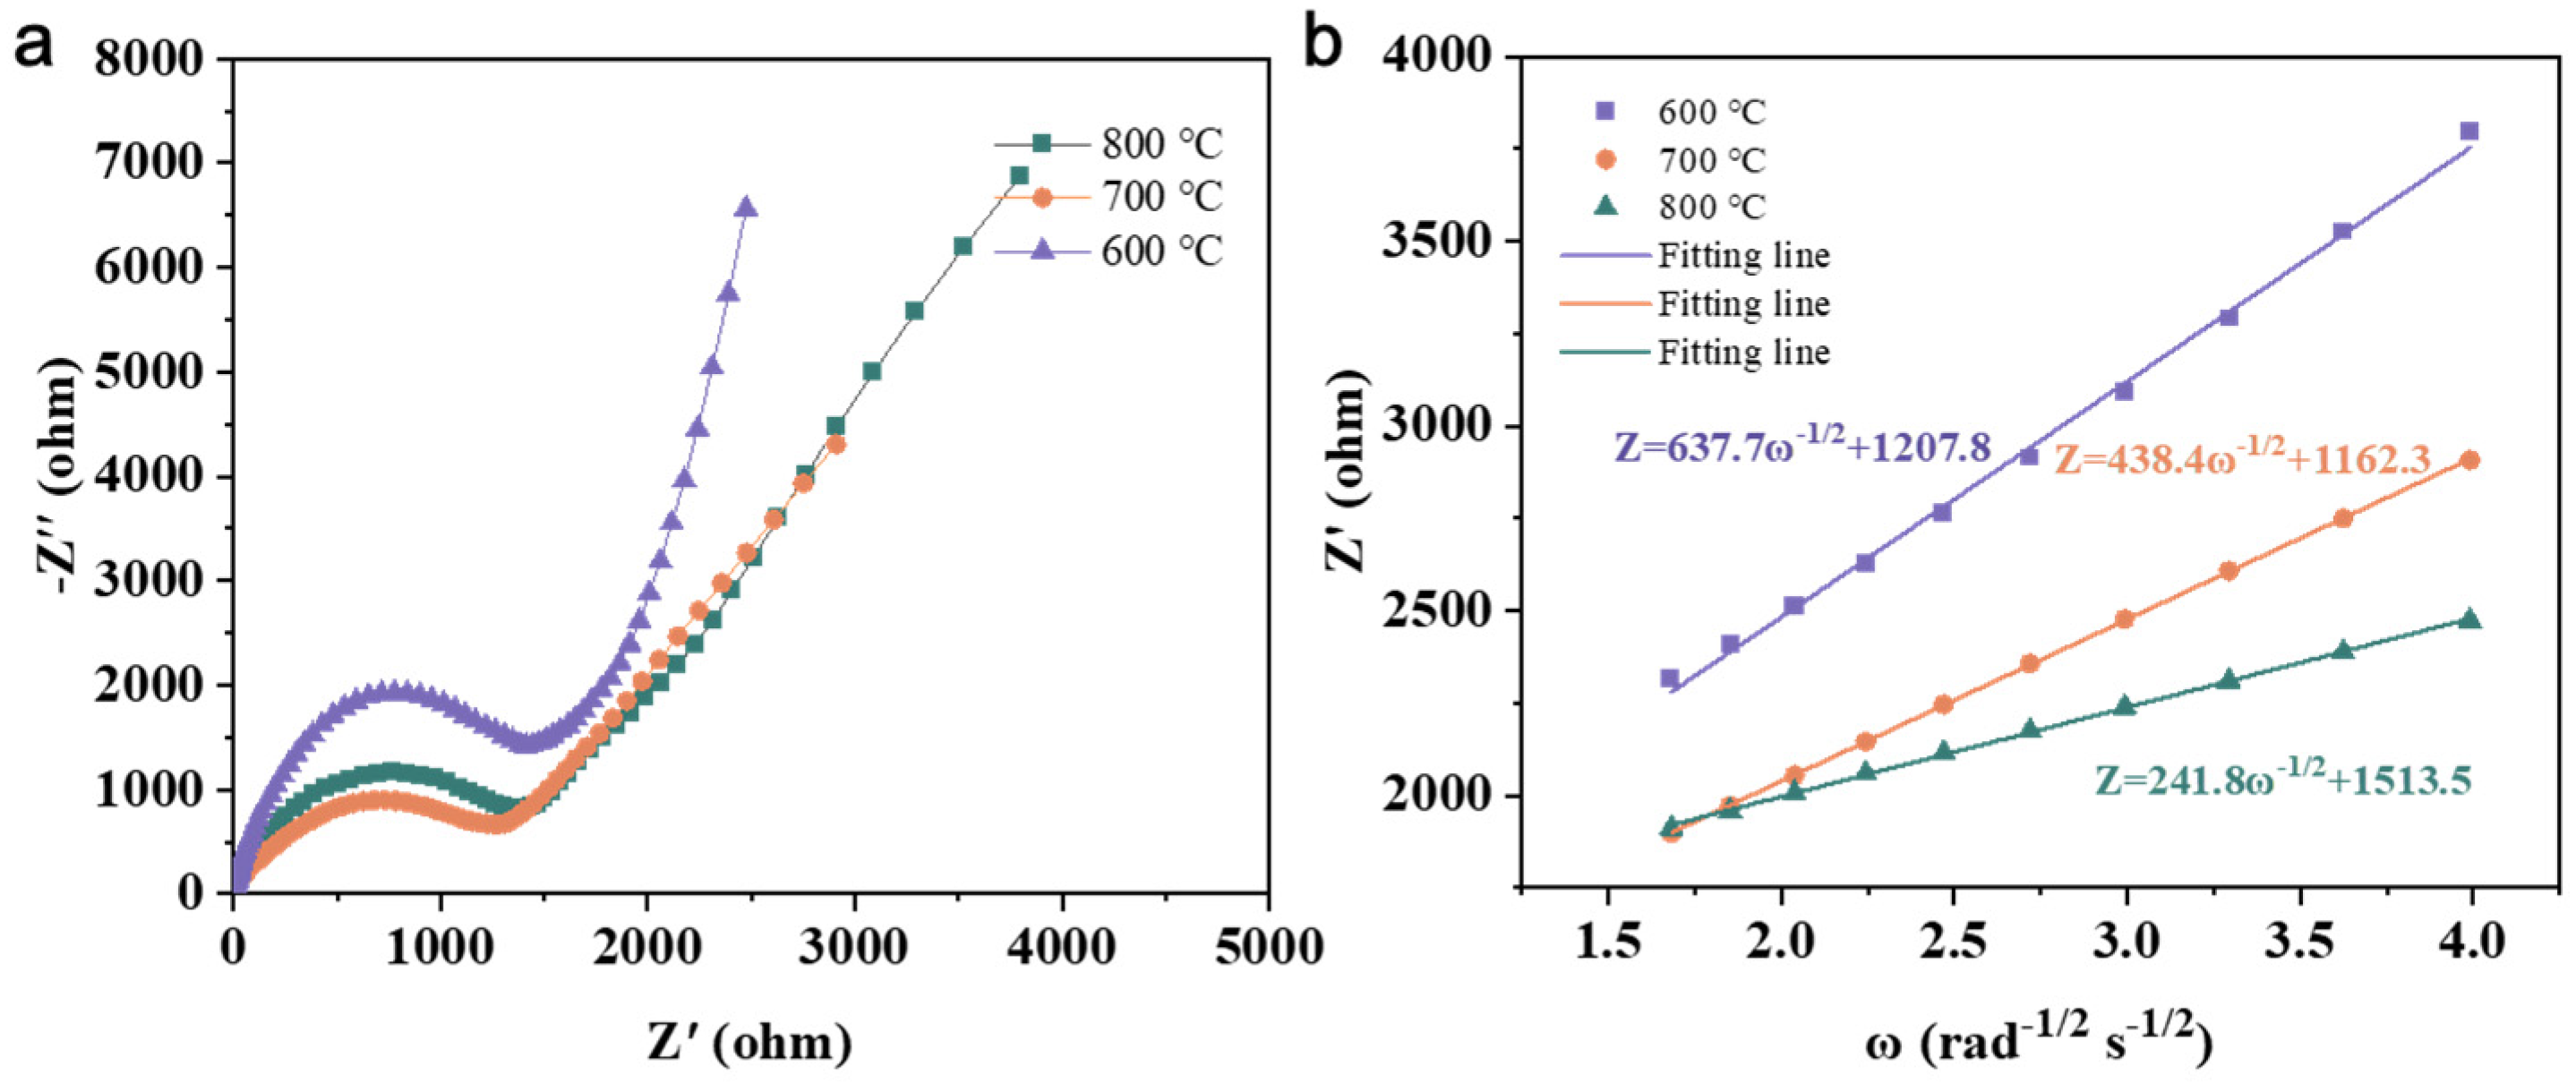
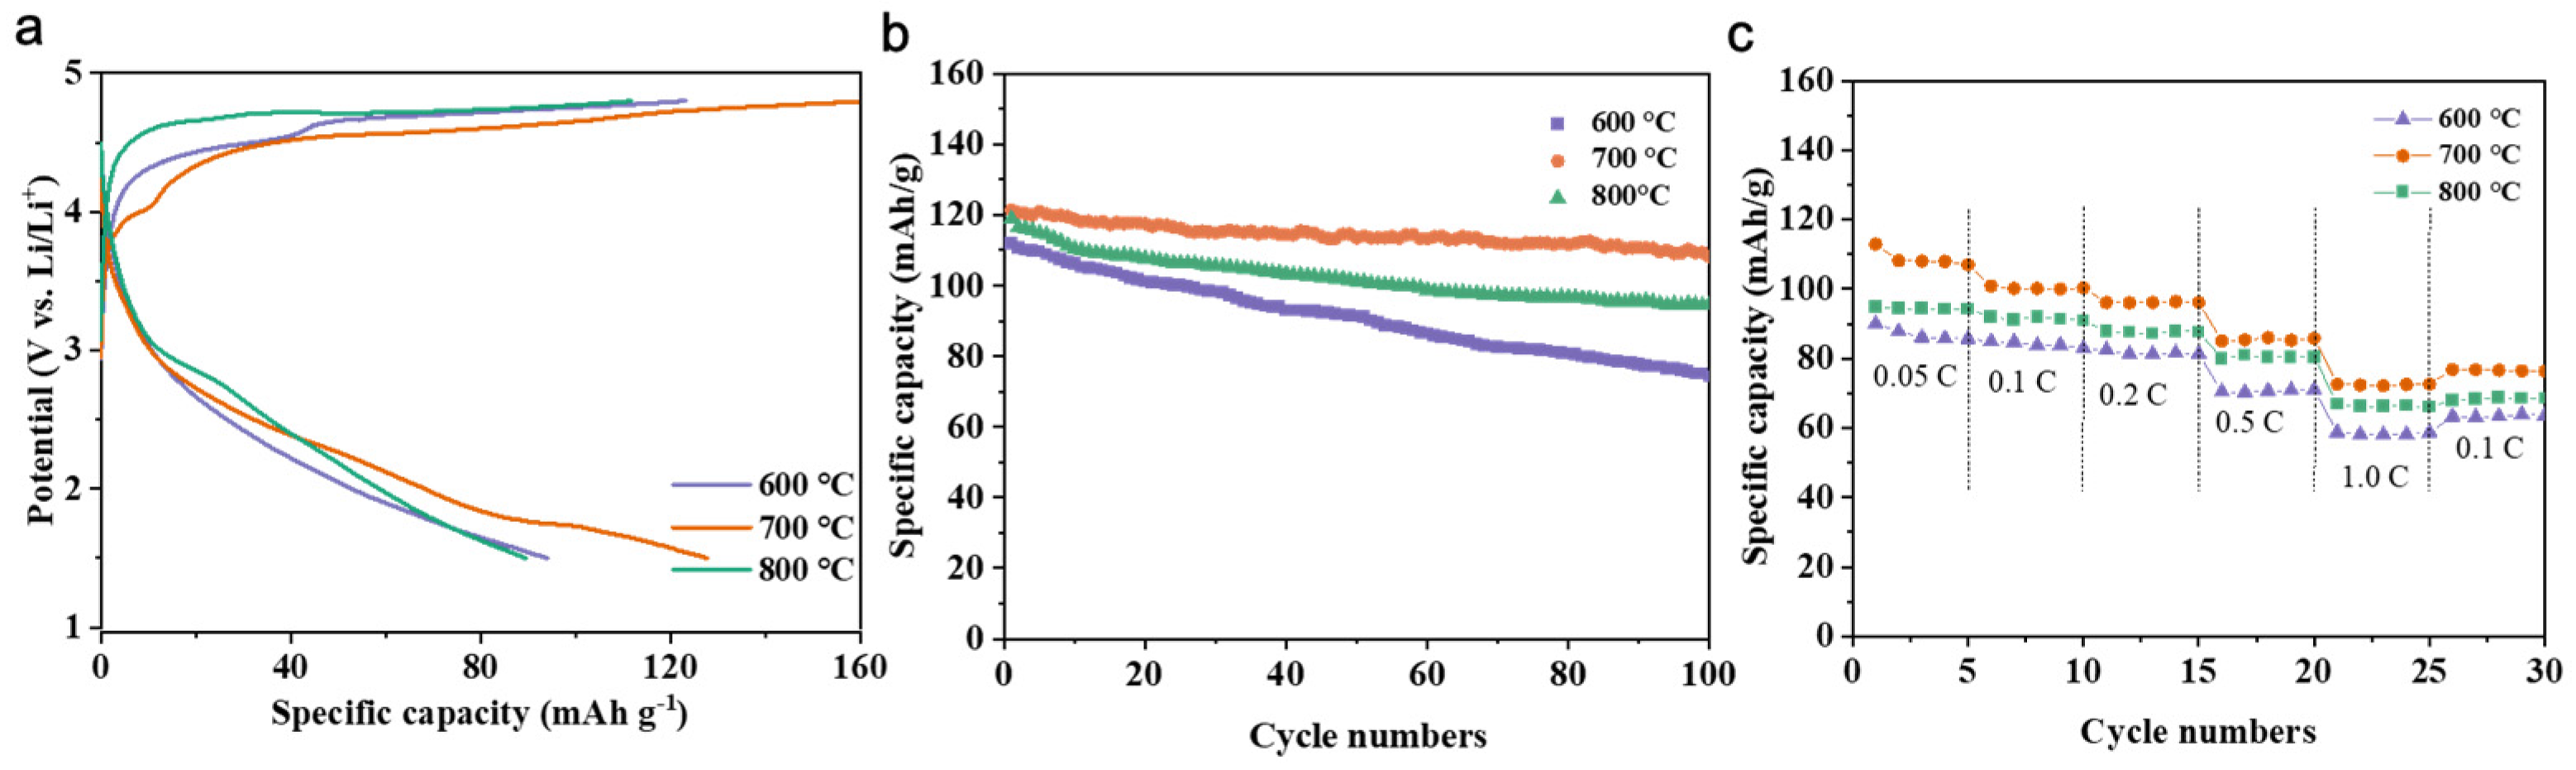
3.4. Effect of Calcination Firing Temperature on Li2FeTiO4 Materials

The calcination temperature plays a pivotal role in determining the physical phase, morphology, and electrochemical properties of Li2FeTiO4 samples. Specifically, an inadequate calcination temperature can adversely affect the crystallinity of the material, leading to the formation of impurities that compromise its electrochemical performance. On the other hand, an excessively high calcination temperature may result in particle agglomeration, which negatively impacts both the physical and chemical properties of the material. This investigation seeks to address these challenges by systematically exploring the optimal calcination temperature to achieve a balance between crystallinity and particle morphology, thereby enhancing the electrochemical properties of Li2FeTiO4. To investigate how calcination temperature influences the morphology of Li2FeTiO4, the samples were examined using SEM. In Figure 3, SEM images of Li2FeTiO4 crystals synthesized at various temperatures reveal key insights: at 600 °C, particle non-uniformity hinders the rapid migration of Li+, while, at 700 °C, uniform particle distribution and a regular cubic morphology promote efficient Li+ embedding and detachment in the cathode material. However, at excessively high calcination temperatures, particle agglomeration becomes prominent, detracting from the material’s overall performance. In short, the calcination temperature of 700 °C is relatively suitable for crystal growth, and it is easy to obtain a uniform and regular microscopic morphology. The transmission electron microscopy (TEM) plots to more fully reveal the microscopic features of Li2FeTiO4. Figure 4 shows the high-resolution transmission electron microscopy (HRTEM) image of the Li2FeTiO4 composite, and the lattice spacing of 0.296 nm corresponds to the (220) crystallographic plane of Li2FeTiO4, indicating that Ti4+ has been successfully doped into the Li2FeTiO4 bulk phase.
To determine the structural evolution of Li2FeTiO4 with different calcination temperatures, X-ray diffraction (XRD) analysis was applied. All diffraction patterns align well with the standard reference (JCPDS#49-0207), confirming the formation of a pure monoclinic phase, with the diffraction peaks becoming sharper and more intense as the calcination temperature increases, particularly at 700 °C (Figure 5). This suggests enhanced crystal purity and higher crystalline quality, which are critical for optimizing electrochemical performance. Notably, the sample calcined at 700 °C exhibits the most pronounced (200) peak at 43.83°, indicating superior long-range atomic ordering. The interplanar spacing (d-spacing) for the (200) plane was calculated using the Bragg equation. According to Equation (14), where the spacing λ represents the wavelength of the incident X-rays, θ represents the peak position, n represents the number of diffraction stages, and d represents the intergranular spacing or d-spacing. This calculated d-spacing value is 1.70 Å, demonstrating minimal lattice distortion and high structural integrity at 700 °C.
d = n λ 2 sin θ
To survey the effect of different calcination temperatures on the bond environment of Li2FeTiO4, FTIR was employed. In Figure 6, the FTIR results further confirm that the calcination process does not significantly alter the chemical functional groups in the Li2FeTiO4 system. This finding highlights that, while the calcination temperature influences the crystallization and physical properties of the material, it does not induce major changes in the fundamental chemical composition.
The effects of different calcination temperatures (600 °C, 700 °C, 800 °C) on the specific surface area and pore structure of Li2FeTiO4 were systematically investigated by the nitrogen adsorption–desorption method. As shown in Figure 7a–f, the curves belong to type IV hysteresis loops, and the 600 °C sample retains a rich mesoporous structure due to incomplete crystallization, with a specific surface area of 61.61 m2/g. The specific surface area of the 700 °C sample is 84.22 m2/g. A high specific surface area optimizes interfacial charge transfer and facilitates efficient lithium-ion diffusion. Further raising the temperature to 800 °C leads to particle coarsening and pore collapse, drastically reducing the surface area to 62.92 m2/g and impairing kinetic performance. These results highlight calcination temperature as a critical parameter for tuning the porosity–crystallinity synergy, thereby governing the electrochemical properties of Li2FeTiO4. Optimal kinetics are achieved at 700 °C, where structural integrity and ion accessibility are harmonized.
The electrochemical reaction kinetics of Li2FeTiO4 under different temperatures are further explored by conducting CV at 1.5–4.8 V with 0.1 mV/s. Redox reactions involving the Fe2+/Fe3+ and Fe3+/Fe4+ couples are clearly observed in the samples (Figure 8). The overlap ratio and curve areas at 700 °C were the highest, indicating exceptional stability and capacity. Additionally, the Li2FeTiO4 sample calcined at 700 °C shows less polarization than the other samples, suggesting a superior Li+ diffusion coefficient and faster electrochemical storage performance. These properties contribute to more efficient electrochemical storage.
The kinetic behavior of Li2FeTiO4 cathodes prepared at different temperatures was evaluated using electrochemical impedance spectroscopy (EIS), as shown in Figure 9a. Both cathode materials exhibit Nyquist plots characterized by semicircular arcs in the mid- to high-frequency range, followed by linear regions at lower frequencies. The comparative analysis indicates that the Li2FeTiO4 cathode obtained at 700 °C displays a lower Rct value (1258.6 Ω), indicating the fastest reaction kinetics. The increase in charge transfer efficiency is consistent with the observed increase in Li+ diffusion rate, confirming the excellent properties of the cathodes prepared at 700 °C. Furthermore, the lithium-ion diffusion coefficient (DLi+) and the Warburg impedance parameter (σw) were derived from the following empirical relationship (Equations (15)–(17)) [34]:
ω = 2 π f
Z = R + σ w ω 0.5
D = R 2 T 2 2 A 2 n 4 F 4 C 2 σ 2
The measured values of the Warburg coefficient (σw) at different temperatures were 637.7, 438.4, and 241.8, respectively (Figure 9b), with higher calcination temperatures exhibiting faster kinetics. Calculated analysis of Li+ diffusion coefficients showed that the DLi+ value of Li2FeTiO4 at 700 °C was 1.096 × 10⁻¹² cm2 s−1. Li2FeTiO4 highlights a higher Li+ diffusion coefficient compared to LiMTiO4 (M = Mn, Fe, Co) materials (2.71 × 10⁻¹⁴, 2.91 × 10⁻¹⁴, and 3.05 × 10⁻¹⁴ cm2 s−1) [35]. The significant increase in DLi+ of Li2FeTiO4 highlights the favorable role of calcination temperature in promoting Li⁺ mobility. These results confirm that higher calcination temperatures are effective in optimizing ion migration paths, which is consistent with their enhanced electrochemical performance.
To further evaluate the impacts of different calcination temperatures on electrochemical performance, some electrochemical analyses in Figure 10 including charge/discharge curves, and cycling performance tests, are conducted. It reveals that the Li2FeTiO4 cathode material calcined at 700 °C exhibits the best electrochemical stability and specific capacity, with optimal redox reaction behavior and overlapping curves. The material achieves superior electrochemical performance. Additionally, the cycling stability of the material obtained at 700 °C, with a first discharge capacity of 121.3 mAh/g and a 100th discharge capacity of 108.2 mAh/g, indicates that this temperature offers excellent long-term stability with 89.2% retention after 100 cycles (Figure 10a,b). Table 1 shows a summary of the characteristics of Li2FeTiO4 and commercial cathode materials (e.g., LNO, NMC, LCO) in terms of current density, discharge capacity, cycle numbers, and capacity retention. The rate capability of Li2FeTiO4 material was tested from 0.05 to 1 C and then back to 0.05 C (Figure 10c). At 700 °C, Li2FeTiO4 material showed better multiplicity performance and reversibility at different rates. The discharge capacities of all samples were 67.0, 72.6, and 58.7 mAh g−1 at 1 C. When the discharge multiplicity was reduced to 0.1 C, the reversible capacitances of all samples were 68.0, 76.8, and 63.4 mAh g−1, which corresponded to the capacity retention of 77.4%, 79.9%, and 76.8% of their initial specific capacities, respectively. Obviously, the Li2FeTiO4 material obtained at 700 °C has the highest discharge-specific capacity after 100 cycles, showing its extraordinary multiplicative performance. The excellent performance may be due to the sample’s better uniformity, more regular microstructure, and optimal crystallinity at 700 °C, which can support the rapid and stable transport of lithium ions. This phenomenon further proves the identity of structure and performance. In the first part, the reaction principle of the preparation process by ion reaction is discussed from the theoretical point of view, in order to pursue the appropriate content of citric acid. The physicochemical changes during high-temperature preparation were also discussed in combination with TG and FTIR. In the middle part, the rule and mechanism of calcination temperature on its structural evolution are analyzed through various characterization data. Finally, the rationality of the optimized process parameters was further verified by electrochemical analysis.
We conducted ex situ X-ray absorption near edge structure (XANES) analysis on the samples to assess the valence states of elements and investigate the charge compensation mechanism [39]. The analysis of valence changes during charging/discharging involved comparing peak shifts in the XANES spectra at different voltage levels (Figure 11). It was evident that the valence state of Fe in the Li2FeTiO4 samples was a mixed state (+2.34), which serves as the primary source of the redox reaction. The Fe K-edge XANES spectra showed a clear difference. Li2FeTiO4 demonstrated a marked shift during charging, suggesting the participation of the Fe2+/Fe3+/Fe4+ redox process and highlighting the role of Fe in charge compensation. Even a small shift in the high-voltage region (4.8 V) confirmed the existence of Fe4+. The spectra returned to a lower energy region, indicating a reversible process. Therefore, the shift in the Fe K edges offered additional proof of Fe’s electrochemical activity.

4. Conclusions

In summary, the Li2FeTiO4 cathode material is synthesized by a simple sol–gel method. Firstly, the function mechanism of citric acid in the synthesis process is explained theoretically. The physical and chemical changes during high-temperature preparation, including the fracture of complex bonds, are discussed. These include citric acid thermal decomposition, the thermal decomposition of metal salts, the reduction of iron trivalent, and the formation of Li2FeTiO4 crystals. The optimum calcination temperature for preparing Li2FeTiO4 cathode material is studied by various kinds of characterization. Finally, after electrochemical analysis, it is found that the Li2FeTiO4 cathode material prepared at 700 °C can be plated/stripped of lithium in the first cycle. The Li2FeTiO4 cathode material prepared at 700 °C provides a discharge-specific capacity of 121.3mAh/g in the first cycle and capacity retention of 89.2%. The progress demonstrated here suggests the potential of the sol–gel method for the synthesis of Li2FeTiO4.

Author Contributions

Conceptualization, P.H. and G.L.; methodology, Q.S.; validation, G.L., S.L. and Y.Q.; formal analysis, P.H.; investigation, Q.S.; resources, G.L.; writing—original draft preparation, P.H.; writing—review and editing, Y.Q. and S.L.; project administration, S.Y.; funding acquisition, Y.Q. and S.L. All authors have read and agreed to the published version of the manuscript.

Funding

This work was financially supported by the Natural Science Foundation of Hebei Province (E2021501029) and the National Natural Science Foundation of China (52204394).

Data Availability Statement

The original contributions presented in this study are included in the article. Further inquiries can be directed to the corresponding authors.

Conflicts of Interest

The authors declare no conflict of interest.

References

  1. Oboh, R.K.; Huang, K.; Pan, L. Overcoming heterocoagulation challenge in selective flotation separation between lithium cobalt oxide and lithium manganese oxide. Sep. Purif. Technol. 2025, 364, 132480. [Google Scholar] [CrossRef]
  2. Wu, Q.; Zhang, B.; Lu, Y. Progress and perspective of high-voltage lithium cobalt oxide in lithium-ion batteries. J. Energy Chem. 2022, 74, 283–308. [Google Scholar] [CrossRef]
  3. Zhao, T.; Li, W.; Traversy, M.; Choi, Y.; Ghahreman, A.; Zhao, Z.; Zhang, C.; Zhao, W.; Song, Y. A review on the recycling of spent lithium iron phosphate batteries. J. Environ. Manag. 2024, 351, 119670. [Google Scholar] [CrossRef] [PubMed]
  4. Bin Abu Sofian, A.D.A.; Imaduddin, I.S.; Majid, S.R.; Kurniawan, T.A.; Chew, K.W.; Lay, C.-H.; Show, P.L. Nickel-rich nickel–cobalt–manganese and nickel–cobalt–aluminum cathodes in lithium-ion batteries: Pathways for performance optimization. J. Clean. Prod. 2024, 435, 140324. [Google Scholar] [CrossRef]
  5. Cao, J.; Hu, Y.; Zhu, Y.; Cao, H.; Fan, M.; Huang, C.; Shu, K.; He, M.; Chen, H.C. Synthesis of mesoporous nickel-cobalt-manganese sulfides as electroactive materials for hybrid supercapacitors. Chem. Eng. J. 2021, 405, 126928. [Google Scholar] [CrossRef]
  6. Wang, M.; Chen, X.; Yao, H.; Lin, G.; Lee, J.; Chen, Y.; Chen, Q. Research Progress in Lithium-Excess Disordered Rock-Salt Oxides Cathode. Energy Environ. Mater. 2022, 5, 1139–1154. [Google Scholar] [CrossRef]
  7. Kesavan, T.; Senthil, C.; Sasidharan, M. Solvothermally synthesized Ti-rich LiMnTiO4 as cathode material for high Li storage. J. Mater. Sci. 2018, 53, 4406–4416. [Google Scholar] [CrossRef]
  8. Yamauchi, K.; Momida, H.; Oguchi, T. First-Principles Study on Cathode Properties of Li2MTiO4 and Na2MTiO4 (M = V, Cr, Mn, Fe, Co, Ni). J. Phys. Soc. Jpn 2022, 91, 034704. [Google Scholar] [CrossRef]
  9. Kitajou, A.; Tanaka, K.; Miki, H.; Koga, H.; Okajima, T.; Okada, S. Improvement of Cathode Properties by Lithium Excess in Disordered Rocksalt Li2+2xMn1−xTi1−xO4. Electrochemistry 2016, 84, 597–600. [Google Scholar] [CrossRef]
  10. Li, J.; Luo, S.-h.; Wang, Q.; Yan, S.; Feng, J.; Liu, H.; Ding, X.; He, P. Facile synthesis of carbon-LiMnPO4 nanorods with hierarchical architecture as a cathode for high-performance Li-ion batteries. Electrochim. Acta 2018, 289, 415–421. [Google Scholar] [CrossRef]
  11. Chen, Z.; Qiu, S.; Cao, Y.; Qian, J.; Ai, X.; Xie, K.; Hong, X.; Yang, H. Hierarchical porous Li2FeSiO4/C composite with 2 Li storage capacity and long cycle stability for advanced Li-ion batteries. J. Mater. Chem. A 2013, 1, 4988–4992. [Google Scholar] [CrossRef]
  12. Saracibar, A.; Van der Ven, A.; Arroyo-de Dompablo, M.E. Crystal Structure, Energetics, And Electrochemistry of Li2FeSiO4 Polymorphs from First Principles Calculations. Chem. Mater. 2012, 24, 495–503. [Google Scholar] [CrossRef]
  13. Delmas, C.; Carlier, D.; Guignard, M. The Layered Oxides in Lithium and Sodium-Ion Batteries: A Solid-State Chemistry Approach. Adv. Energy Mater. 2021, 11, 2001201. [Google Scholar] [CrossRef]
  14. Han, J.; Kim, J.C. A solid-state route to stabilize cubic Li7La3Zr2O12 at low temperature for all-solid-state-battery applications. Chem. Commun. 2020, 56, 15197–15200. [Google Scholar] [CrossRef]
  15. Jiang, X.J.; Wang, S.Z.; Feng, Z.H.; Qi, H.B.; Fu, H.; Liu, R.P. Improving vacuum gas nitriding of a Ti-based alloy via surface solid phase transformation. Vacuum 2022, 197, 110860. [Google Scholar] [CrossRef]
  16. Li, Y.; Zan, M.; Chen, P.; Huang, Y.; Xu, X.; Zhang, C.; Cai, Z.; Yu, X.; Li, H. Facile Solid-State Synthesis to In Situ Generate a Composite Coating Layer Composed of Spinel-Structural Compounds and Li3PO4 for Stable Cycling of LiCoO2 at 4.6 V. ACS Appl. Mater. Interfaces 2023, 15, 51262–51273. [Google Scholar] [CrossRef]
  17. Li, Y.; Xia, D.; Tao, L.; Xu, Z.; Yu, D.; Jin, Q.; Lin, F.; Huang, H. Hydrothermally Assisted Conversion of Switchgrass into Hard Carbon as Anode Materials for Sodium-Ion Batteries. ACS Appl. Mater. Interfaces 2024, 16, 28461–28472. [Google Scholar] [CrossRef]
  18. Cheng, C.; Wang, X. Preparation of CuBi2O4 nanosheets as a high-capacity and cycle-stable anode material for Li recharge batteries. J. Energy Stor. 2024, 93, 112217. [Google Scholar] [CrossRef]
  19. Amedzo-Adore, M.; Han, J.I. Chemically lithiated layered VOPO4 by a microwave-assisted hydrothermal method and its electrochemical properties in rechargeable Li-ion batteries and supercapacitor applications. J. Alloys Compd. 2022, 911, 165067. [Google Scholar] [CrossRef]
  20. Yao, L.; Xi, Y.; Han, H.; Li, W.; Wang, C.; Feng, Y. LiMn2O4 prepared from waste lithium ion batteries through sol-gel process. J. Alloys Compd. 2021, 868, 159222. [Google Scholar] [CrossRef]
  21. Danks, A.E.; Hall, S.R.; Schnepp, Z. The evolution of ‘sol–gel’ chemistry as a technique for materials synthesis. Mater. Horiz. 2016, 3, 91–112. [Google Scholar] [CrossRef]
  22. Zhang, J.; Luo, S.-H.; Sui, L.-L.; Ren, Q.-X.; Qin, Y.; Zhang, D.-J. Preparation of neodymium-doped LiMnPO/C cathode by sol-gel method with excellent electrochemical performance for lithium-ion batteries. Int. J. Energy Res. 2021, 45, 10590–10598. [Google Scholar] [CrossRef]
  23. Bokov, D.; Turki Jalil, A.; Chupradit, S.; Suksatan, W.; Javed Ansari, M.; Shewael, I.H.; Valiev, G.H.; Kianfar, E. Nanomaterial by Sol-Gel Method: Synthesis and Application. Adv. Mater. Sci. Eng. 2021, 2021, 5102014. [Google Scholar] [CrossRef]
  24. Ganeshbabu, M.; Vasylechko, L.; Selvan, R.K. Li-ion diffusional insights and temperature dependent electrical & dielectric properties of LiNi1/3Mn1/3Co1/3PO4 electrodes. J. Phys. Chem. Solids 2025, 197, 112420. [Google Scholar] [CrossRef]
  25. Alsamet, M.A.M.M.; Burgaz, E. Synthesis and characterization of nano-sized LiFePO4 by using consecutive combination of sol-gel and hydrothermal methods. Electrochim. Acta 2021, 367, 137530. [Google Scholar] [CrossRef]
  26. Küzma, M.; Dominko, R.; Meden, A.; Makovec, D.; Bele, M.; Jamnik, J.; Gaberšček, M. Electrochemical activity of Li2FeTiO4 and Li2MnTiO4 as potential active materials for Li ion batteries: A comparison with Li2NiTiO4. J. Power Sources 2009, 189, 81–88. [Google Scholar] [CrossRef]
  27. Xu, D.; Wan, J.; Xu, D.; Luo, T.; Zhong, Y.; Yang, X.; Yang, L.; Zhang, Z.; Wang, X. Chelation of metal ions with citric acid in the ammoniation process of wet-process phosphoric acid. Can. J. Chem. Eng. 2020, 98, 665–675. [Google Scholar] [CrossRef]
  28. Rodrigo, M.M.; Ribeiro, A.C.F.; Verissimo, L.M.P.; Esteso, M.A.; Leaist, D.G. Coupled diffusion in aqueous citric acid + calcium citrate solutions. J. Chem. Thermodyn. 2019, 131, 314–321. [Google Scholar] [CrossRef]
  29. Ou, X.; Zhang, F.; Zhang, C.; Zou, X.; Bi, X.; Wang, D.; Li, H.; Zhang, S. Photodegradation of Malachite Green Catalyzed by Aqueous Iron(III)-Citrate Complex: Roles of Iron(II) and Hydrogen Peroxide. ChemistrySelect 2019, 4, 2089–2094. [Google Scholar] [CrossRef]
  30. Nejad, M.I.; Price, N.E.; Haldar, T.; Lewis, C.; Wang, Y.; Gates, K.S. Interstrand DNA Cross-Links Derived from Reaction of a 2-Aminopurine Residue with an Abasic Site. ACS Chem. Biol. 2019, 14, 1481–1489. [Google Scholar] [CrossRef]
  31. Hong, C.; Brookes, V.J.; Zadoks, R.N.; Webb, C.E. Citric Acid and Sodium Bicarbonate as an Alternative Carbon Dioxide Source for Mosquito Surveillance. Insects 2025, 16, 90. [Google Scholar] [CrossRef] [PubMed]
  32. Ma, X.; Li, D.; Jin, H.; Zeng, X.; Qi, J.; Yang, Z.; You, F.; Yuan, F. Urchin-like band-matched Fe2O3@In2S3 hybrid as an efficient photocatalyst for CO2 reduction. J. Colloid Interface Sci. 2023, 648, 1025–1033. [Google Scholar] [CrossRef] [PubMed]
  33. Ma, D.; Li, J.; Cao, Z. CH4 Carbonylation to Acetic Acid Using H2O as an Oxidant on a Rh-Functionalized UiO-67 Combined with Oriented External Electric Fields: Selectivity and Mechanistic Insights from DFT Calculations. Inorg. Chem. 2024, 63, 21110–21120. [Google Scholar] [CrossRef] [PubMed]
  34. Huang, R.; Luo, S.; Li, P.; Sun, Q.; Sun, K.; Zhao, W.; Wang, J.; Yan, S. Enhanced structural stability of P2-Na0.75Ni0.25Mn0.75−xTixO2 cathodes with high-voltage non-phase transitions property by Mn-sites manipulation strategy. J. Alloys Compd. 2024, 1005, 176168. [Google Scholar] [CrossRef]
  35. Luo, M.; Yu, H.; Lan, H.; Yan, L.; Qian, S.; Ye, W.; Shui, M.; Long, N.; Shu, J. Synthesis and electrochemical characteristics of isostructural LiMTiO4 (M = Mn, Fe, Co). Ceram. Int. 2017, 43, 5728–5733. [Google Scholar] [CrossRef]
  36. Hawley, W.B.; Du, Z.; Kukay, A.J.; Dudney, N.J.; Westover, A.S.; Li, J. Deconvoluting sources of failure in lithium metal batteries containing NMC and PEO-based electrolytes. Electrochim. Acta 2022, 404, 139579. [Google Scholar] [CrossRef]
  37. Zhang, Y.; Ding, G.; Li, J.; Liu, J.; Huang, S.; Cheng, F. Heterogeneous doping-induced surface reconstruction toward high-performance LiNiO2 cathode materials for lithium-ion batteries. Sci. China Mater. 2023, 66, 2582–2590. [Google Scholar] [CrossRef]
  38. Ronduda, H.; Zybert, M.; Szczęsna, A.; Trzeciak, T.; Ostrowski, A.; Wieciński, P.; Wieczorek, W.; Raróg-Pilecka, W.; Marcinek, M. Addition of yttrium oxide as an effective way to enhance the cycling stability of LiCoO2 cathode material for Li-ion batteries. Solid State Ion. 2020, 355, 115426. [Google Scholar] [CrossRef]
  39. Hou, P.-Q.; Qu, Y.; Huang, R.; Tian, X.; Li, G.; Luo, S. Facile design and synthesis of Li2FeTiO4 as advanced cathode material for lithium-ion batteries. J. Solid State Electrochem. 2025. [Google Scholar] [CrossRef]
Figure 1. TG-DTA curve of Li2FeTiO4 precursor.
Batteries 11 00142 g001
Figure 2. Infrared spectra of precursor and samples calcined at 180 °C and 250 °C.
Batteries 11 00142 g002
Figure 3. SEM patterns of Li2FeTiO4 at (a) 600 °C, (b) 700 °C, (c) 800 °C.
Batteries 11 00142 g003
Figure 4. (a) TEM and (b) HRTEM patterns of Li2FeTiO4 at 700 °C.
Batteries 11 00142 g004
Figure 5. XRD diffraction pattern of samples calcined at 600 °C, 700 °C, and 800 °C.
Batteries 11 00142 g005
Figure 6. FTIR of Li2FeTiO4 samples under different calcination temperatures.
Batteries 11 00142 g006
Figure 7. (a,c,e) N2 adsorption–desorption isotherms and (b,d,f) pore size distributions of Li2FeTiO4 obtained by preparation at different temperatures.
Batteries 11 00142 g007
Figure 8. CV curves of Li2FeTiO4 samples at (a) 600 °C, (b) 700 °C, and (c) 800 °C.
Batteries 11 00142 g008
Figure 9. (a) EIS of Li2FeTiO4 obtained by preparation at different temperatures; (b) linear fitting between Z’ and w−1/2 based on EIS.
Batteries 11 00142 g009
Figure 10. (a) Capacity–voltage curves of Li2FeTiO4 materials at different temperatures. (b) Cycle properties of Li2FeTiO4 materials at different temperatures. (c) Multiplicity properties of Li2FeTiO4 materials at different temperatures.
Batteries 11 00142 g010
Figure 11. Normalized XANES spectra of Fe at charging/discharging state.
Batteries 11 00142 g011
Table 1. The electrochemical performance comparison of Li2FeTiO4 and commercial cathode materials.
Cathode Current Density Discharge Capacity (mAh/g) Cycles NumbersCapacity
Retention (%)
Refs.
NMC0.1 C16010025[36]
LNO0.1 C167.515063.8[37]
LCO1 C16510061[38]
Li2FeTiO40.1 C121.310089.2This work
Disclaimer/Publisher’s Note: The statements, opinions and data contained in all publications are solely those of the individual author(s) and contributor(s) and not of MDPI and/or the editor(s). MDPI and/or the editor(s) disclaim responsibility for any injury to people or property resulting from any ideas, methods, instructions or products referred to in the content.

