Article

Magnetic Properties of CuCr1−xLaxS2 Thermoelectric Materials

by
Evgeniy V. Korotaev
*,
Mikhail M. Syrokvashin
,
Veronica S. Sulyaeva
and
Irina Yu. Filatova
Nikolaev Institute of Inorganic Chemistry, Siberian Branch, Russian Academy of Sciences, 630090 Novosibirsk, Russia
*
Author to whom correspondence should be addressed.
Magnetochemistry 2023, 9(7), 168; https://doi.org/10.3390/magnetochemistry9070168
Submission received: 1 June 2023 / Revised: 23 June 2023 / Accepted: 26 June 2023 / Published: 28 June 2023
(This article belongs to the Special Issue Magnetism: Energy, Recycling, Novel Materials)

Abstract

:
The magnetic properties (magnetic susceptibility, magnetic moment) and Weiss constant for lanthanum-doped CuCr1−xLaxS2 (x = 0; 0.005; 0.01; 0.015; 0.03) solid solutions were studied using static magnetochemistry at 80–750 K. The samples were characterized by both powder X-ray diffraction and energy-dispersive X-ray spectroscopy. It was shown that synthesized samples are single-phased up to x ≤ 0.01. The presence of the additional phase in the solid solutions with x > 0.015 caused deviation from the simple isovalent Cr3+→Ln3+ cationic substitution principle. It was found that magnetic susceptibility and the Weiss constant are significantly affected by both magnetic properties and lanthanum concentration for the solid solutions doped up to x = 0.01. The largest magnetic moment value of 3.88 µB was measured for the initial CuCrS2-matrix. The lowest value of 3.77 µB was measured for the CuCr0.99La0.01S2 solid solution. The lowest Weiss constant value of −147 K was observed for the initial matrix; the highest one was observed for CuCr0.99La0.01S2 (−139 K). The largest Seebeck coefficient value of 373 µV/K was measured for CuCr0.985La0.015S2 at 500 K; the obtained value was 3.3 times greater compared to the initial CuCrS2-matrix. The field dependence of the magnetic susceptibility allowed one to conclude the absence of ferromagnetic contributions in the total magnetic susceptibility of CuCr1−xLaxS2. The data on magnetic properties can be successfully utilized to investigate the limits of doping atom suitability and order–disorder phase transition temperature in CuCrS2-based solid solutions.

1. Introduction

The transition and rare-earth metal dichalcogenides are considered to be promising functional materials. The combination of the magnetic, thermoelectric, electrophysical and optical properties of these compounds facilitates their application in spintronics, energy harvesting, sensor technologies and optoelectronics [1]. Some properties are attributed to the structure of transition metal and rare-earth metal dichalcogenides formed by alternating X–M–X layers (X—chalcogenide, M—metal). The functional properties can be easily tuned by substitution of the metal and chalcogenide atoms. Note that interlayer space can be intercalated not only with the atoms, but also with organic cations and molecules [2,3]. Thus, the combination of cationic substitution and intercalation allows one to design and fabricate new hybrid materials with enhanced functional properties. However, some MX2-layers in pure form could be unstable in normal conditions [4,5]. For instance, the unstable CrS2-layers in CuCrS2 dichalcogenide are stabilized by the copper atoms intercalated between the layers. Thus, the sublattices of chromium atoms in CrS2-layers and copper atoms in the interlayer gap form the quasi-layered structure of CuCrS2 [6,7]. Note that copper atoms could occupy two different crystallographic sites. However, as reported previously, the octahedral sites in the copper sublattice are unoccupied at room temperature and copper atoms are placed in the tetrahedral sites [8,9,10,11,12]. At higher temperatures (≥690 K), the mobility of atoms increases, and copper atoms can slide between the tetrahedral and octahedral sites, thereby forming the conductivity channels. The ionic conductivity of CuCrS2 and CuCrS2-based solid solutions allows one to consider these compounds as promising superionic materials for application in the chemical current sources and chemical sensing devices [9,10,12,13]. The superionic properties of CuCrS2 were successfully improved by the cationic substitution of chromium with vanadium or iron atoms [10,14]. The initial CuCrS2-matrix is an antiferromagnetic compound with a Neel temperature of 40 K. At temperatures below the Neel temperature, chromium Cr3+ ions in CrS2-layers have a ferromagnetic arrangement with an antiferromagnetic ordering between the layers. The intercalation of the interlayer gap significantly affects the magnetic arrangement of the layers and results in non-collinear magnetic ordering between the neighboring layers. Consequently, this leads to a non-zero magnetic moment that is circularly arranged perpendicular to the layer along the c crystallographic axis. Thus, the helimagnetic ordering is observed. The combination of both helimagnetic ordering and semiconductor electrical behavior allow one to consider CuCrS2 as a promising material for application in magnetic memory devices. At temperatures above the Neel temperature, CuCrS2 and CuCrS2-based solid solutions are paramagnetic. The magnetic susceptibility obeys the Curie-Weiss law with a negative Weiss constant Θ of ~−100 K and corresponds to antiferromagnetic exchange interaction [8,9,15,16,17,18,19,20,21,22,23]. Note that the vanadium-doped solid solutions based on the CuCrS2-matrix were reported to demonstrate colossal magnetoresistance (CMR) at the same temperature range [16,17,24,25]. The CMR effect in these compounds was related to the presence of the different magnetic phases. Thus, CuCrS2-based solid solutions could be considered to be promising materials for magnetic sensors and magnetic memory devices based on the CMR effect. The promising values of the Seebeck coefficient of CuCrS2 and CuCrS2-based solid solutions in the room-temperature and higher-temperature ranges have recently gained significant attention [1,11,21,26,27,28,29,30,31,32,33,34,35,36,37]. For instance, the high values of both the Seebeck coefficient and the thermoelectric figure of merit (ZT) for the individual specimens of CuCrS2-matrix were reported [29,32,34]. Note that the coexistence of both thermoelectric properties and ionic conductivity allows one to consider CuCrS2 and CuCrS2-based solid solutions as phonon-glass electron-crystal (PGEC) materials [38,39,40]. The high thermoelectric performance of PGEC materials is achieved due to effective phonon scattering on mobile cations migrating through the fixed matrix with a high Seebeck coefficient value. Hence, CuCrS2-based solid solutions can be considered to be promising functional materials for the fabrication of high-efficiency thermoelectric generators (TEGs) and solid-state temperature sensors [32,39,40]. Note that phonon scattering can significantly affect thermoelectric properties. In magnetic thermoelectric materials, the scattering process involves both phonons and magnons and is referred to as magnon–phonon scattering due to the significant contribution of the scattering over the magnetic structure [40,41,42]. Thus, one can conclude that the study of the magnetic properties of CuCrS2-matrix and CuCrS2-based solid solutions is of special interest. However, to date, the majority of studies have been focused on CuCrS2-based solid solutions doped with transition metal atoms. The studies concerning lanthanide-doped CuCr0.99Ln0.01S2 solid solutions were primarily focused on the variation of doping atom type (from La to Lu) at a consistent concentration [1,18,21,22,27,28,43]. It should be noted that the cation substitution of chromium atoms in the initial CuCrS2-matrix with lanthanum atoms led to the largest increase in the Seebeck coefficient among the series of lanthanide-doped solid solutions CuCr0.99Ln0.01S2(Ln = La…Lu) [1,21,28]. Therefore, it is of great interest to study the influence of doping concentration on the magnetic and thermoelectric properties of lanthanide-doped CuCrS2-based solid solutions.
Here, we report the detailed study of the magnetic properties of lanthanum-doped CuCr1−xLaxS2 (x = 0; 0.005; 0.01; 0.015; 0.03) solid solutions. The samples were characterized using powder X-ray diffraction (XRD), energy dispersive X-ray (EDX) analysis and scanning electron microscopy (SEM). The obtained data on the sample morphology, phase composition and magnetic properties were used for the interpretation of the Seebeck coefficient behavior of CuCr1−xLaxS2 solid solutions.

2. Experimental

The powder samples of CuCr1−xLaxS2 (x = 0; 0.005; 0.01; 0.015; 0.03) solid solutions and CuLaS2 sulfide were synthesized using metal oxides CuO, Cr2O3 and La2O3 with a purity of 99.99%. The stoichiometric mixture of the initial oxides in a glassy carbon crucible was placed in a horizontal high-temperature quartz tube furnace. The sulfidization procedure was carried out in argon flow by the gaseous thermolysis products of ammonium rhodanide (NH4SCN) at 1050 °C [21,22,44]. The products were grounded several times during the sulfidization procedure. The completeness of the sulfidization process was controlled by powder X-ray diffraction (XRD).
The surface morphology was studied by scanning electron microscopy (SEM) on a Jeol JSM 6700F scanning electron microscope (Jeol, Tokyo, Japan) at an accelerating voltage of 15 kV. The element mapping was acquired by energy dispersive X-ray (EDX) analysis using a Bruker Quantax 200 with a X-Flash 6|60 detector (Bruker, Berlin, Germany). The detector energy resolution was <129 eV. The measured data were analyzed using Esprit 2.1 software with P/B-ZAF correction (accounting for the background, atomic number, absorption and secondary fluorescence).
The magnetic properties of CuCr1−xLaxS2 were measured using the Faraday technique in the extended temperature range of 80–750 K. The temperature was stabilized using a Delta DTB9696 temperature controller (Delta Electronics, Taipei, Taiwan). The signal from the magnetometer was measured using a Keysight 34465A voltmeter (Keysight Technologies, Santa-Rosa, CA, USA). The magnetic field strength was varied in the range of 4.7 to 8.2 kOe. The powder sample of ~20 mg in an open quartz ampoule was placed in the measurement cell of the magnetometer and then vacuumed to 0.01 Torr pressure. Then, the measurement cell was filled with helium of 5 Torr pressure. The diamagnetic contributions to the magnetic susceptibility value were taken into account according to the additive Pascal scheme. The ferromagnetic contribution was estimated using the data of the inverse field dependence of the magnetic susceptibility χ(1/H). The effective magnetic was calculated as follows [45,46]:
μ e f f ( T ) 8 · χ T
The Seebeck coefficient temperature dependencies of CuCr1−xLaxS2 (x = 0; 0.005; 0.01; 0.015; 0.03; 1) were measured in a rarefied helium atmosphere of 5 Torr. The ceramic samples were prepared by compressing the synthesized powder samples at 923 K under a uniaxial pressure of 70 MPa for 2 h in a vacuum of 5 × 10⁻⁵ Torr. The ceramic samples were positioned between two copper contact pads with integrated heaters. A temperature gradient of 5 K was applied to the sample and maintained using a Thermodat-13K5 temperature controller. The thermoelectric power arising from the sample was recorded using a 6½ Keysight 34465A multimeter. During the measurements, the temperature gradient was reversed from +5 K to −5 K. Thus, the total Seebeck coefficient value was measured as a slope of the voltage generated by the sample as a function of temperature gradient. The experimental setup was tested using a thermocouple grade constantan reference sample.
The Hall voltage measurements were carried out at room temperature using a laboratory-made setup, employing the Van der Pauw technique. A DC magnetic field of 1T was applied perpendicular to both the current and the sample plane. A current of 10 mA was passed through the sample. The Hall voltage was measured using a 6½ Keysight 34461A voltmeter. During the measurements, the magnetic field polarity and the current direction were systematically reversed, and, subsequently, the current and potential probes were swapped. The Hall voltage value was determined through eight independent measurements. The Hall voltage polarity was calibrated using a reference sample of a p-type silicon wafer.

3. Results and Discussion

The XRD patterns for the initial CuCrS2-matrix and CuCr1−xLaxS2 (x = 0.005; 0.01; 0.015; 0.03) solid solutions after the final sulfidation stage are plotted in Figure 1. The synthesized solid solutions are isostructural to the initial matrix and corresponded to the rhombohedral R3m space group [5,47]. The XRD data are in good agreement with the previously reported data for the lanthanide-doped CuCr0.99Ln0.01S2 solid solutions and the reference data of the Inorganic Crystal Structure Database (ICSD) for the initial CuCrS2-matrix (ICSD card ID 100594). However, the additional diffraction peaks of CuLaS2 phase (marked with * symbol in Figure 1) can be observed in the XRD patterns of CuCr1−xLaxS2 (x = 0.015; 0.03). Thus, one can conclude that the solubility limit of lanthanum in CuCrS2-matrix is approximately one atomic percent. Note that the data concerning vanadium-, iron- and manganese-substituted solid solutions CuCr1−xMxS2 (M = V, Mn, Fe; x = 0 ÷ 0.4) estimate the solubility of these metals as ~20 at.%. This could be due to the higher lanthanum atomic radii compared to traditional metals. The solubility limits of other lanthanides are assumed to vary from approximately one to a few percent. In order to clarify the influence of the CuLaS2 impurity phase on magnetic and thermoelectric properties, this compound was also synthesized. The XRD pattern of CuLaS2 is presented in Figure 1. Note that CuLaS2 can be crystallized in several space groups: P21/c, P1121/b and P63 [47]. It was found that the obtained CuLaS2 sample consisted of particles of different pace groups. However, the particles of the P21/c space group are prevalent. The diffraction peaks of the CuLaS2 phase are significantly overlapped with those for CuCr1−xLaxS2. However, only the most intense peak at 23.7° of the CuLaS2 phase is observed in the XRD patterns for the high-doping CuCr1−xLaxS2 (x = 0.015; 0.03) solid solutions. Table 1 lists the lattice parameters for CuCr1−xLaxS2 solid solutions calculated from the XRD data. It was found that a and c lattice parameters have an increasing trend to x = 0.01. This fact is in agreement with the substitution of Cr3+ to La3+ ions. The decrease in the lattice parameters for x = 0.015 and x = 0.03 could be due to the formation of the CuLaS2 phase. For instance, the redundant lanthanum atoms that cannot be dissolved in CuCrS2-matrix were used in the formation of the CuLaS2 phase. Hence, the formation of the CuLaS2 phase can promote the emergence of vacancies in the copper sublattice and, therein, cause the unit cell parameters to decrease.
The EDX mapping images of the powder and ceramic samples are plotted in Figure 2 and Figure 3, respectively. As can be seen, EDX mapping reveals a homogeneous distribution of the matrix elements (Cu, Cr, S) for both the powder and ceramic samples. However, in the case of lanthanum distribution, homogeneity was observed only for the solid solutions with low doping concentrations (x = 0.005; 0.01). An increase in lanthanum concentration to x = 0.015 and x = 0.03 resulted in the enlargement of the regions with increased lanthanum concentration for both the powder (Figure 2) and ceramic (Figure 3) samples. The obtained result correlates with the XRD data discussed above. Hence, one can conclude that the observed regions can be identified as inclusions of the CuLaS2 phase. The morphology of the powder particles for the initial CuCrS2-matrix and CuCr1−xLaxS2 solid solutions, observed by SEM, is depicted in Figure 4 and Figure 5, respectively. The high-magnification SEM images (Figure 4) clearly reveal the layered structure of the initial matrix. The sheet-like powder grains and the stepped structure of the larger particles indicate the preservation of the layered structure after the cationic substitution (Figure 5).
Magnetic susceptibility (χ) of chemical compounds is the sum of various magnetic contributions: diamagnetic, paramagnetic and ferromagnetic [45,46]. Diamagnetism is a fundamental property of matter. It is associated with the response of electrons to an externally applied magnetic field. The external magnetic field induces the circulation of electrons to compensate for the applied field. The paramagnetic contributions primarily arise from the presence of unpaired electrons and the temperature-independent Van Vleck paramagnetism, which occurs due to the circulation of electrons in an external magnetic field. The ferromagnetic contributions are associated with the internal Weiss molecular field, which results in the alignment of magnetic moments in parallel orientations. This contribution is most significant for ferromagnetic materials. The weak ferromagnetism can also be associated with non-collinear antiferromagnetic ordering in antiferromagnetic materials. It should be noted that the magnetochemical measurements can be significantly influenced by the presence of magnetic impurities. For instance, the presence of ferromagnetic impurities in the composition of vanadium-doped CuCr1−xVxS2 solid solutions resulted in a significant overestimation of the total magnetic susceptibility value [45]. Note that the ferromagnetic contribution could be the reason for the deviation observed in the reported data concerning the magnetic properties of CuCr1−xVxS2 [20]. Hence, in order to take into account the possible presence of ferromagnetic impurities in the composition of CuCr1−xLaxS2, the inverse magnetic field dependencies of magnetic susceptibility χ(1/H) were analyzed. The positive slope of χ(1/H) should indicate the presence of the ferromagnetic contribution [20,45]. However, the absence of the slope of χ(1/H) dependencies for CuCr1−xLaxS2 allows one to conclude the absence of ferromagnetic impurities in the composition of the samples studied. As an example, the inverse field dependence of χ for CuCr0.97La0.03S2 is shown in Figure 6a. Note that the ferromagnetic contributions in the previously studied CuCr1−xVxS2 solid solutions increased with vanadium concentration. As an illustration, the χ(1/H) dependence for the CuCr0.95V0.05S2 sample with magnetic impurities is shown in Figure 6b. Note that the doping concentration of x = 0.05 is assumed to be comparable to that for CuCr0.97La0.03S2. Thus, one can conclude that the investigated samples do not contain any ferromagnetic impurities.
The temperature dependencies of the magnetic susceptibility of CuCr1−xLaxS2 are shown in Figure 7. It can be observed that the temperature dependencies for CuCr1−xLaxS2 solid solutions closely overlapped with those for the initial CuCrS2-matrix. The dependencies for CuCr1−xLaxS2 demonstrated a hyperbolic behavior, which is typical for antiferromagnetic compounds, within the temperature range above the Neel temperature (Figure 7a) [45,46]. A linear dependence of the inverse magnetic susceptibility was observed for the samples studied within the temperature range of 80–600 K. In the temperature region above 600 K, a slight deviation from the linear shape was observed (Figure 7b). The deviations were clearly observed in the temperature dependencies of the effective magnetic moment μeff (Figure 7c,d). It was previously reported that this deviation corresponds to the order–disorder phase transition (ODT) [8,10,11,22,48]. The ODT temperature of ~695 K was previously determined using differential scanning calorimetry (DSC) [11,22]. Note that μeff(T) temperature dependence can be also used to determine the magnetic phase transition temperature [45,46]. In this regard, the minima of μeff(T) in the high-temperature region were measured using spline interpolation (Figure 8). Note that the measured value of 699 K for the initial CuCrS2-matrix was found to be 4 degrees greater compared to the reported DSC measurements [11,22]. This could be attributed to the indirect relationship between the mechanism of the structural ODT and the changes in μeff. It was previously suggested that the ODT leads to an increase in the indirect exchange interaction as a result of the sliding of copper atoms into the octahedral sites [22]. Therefore, the increase in exchange interaction could be attributed to the decrease in μeff within the temperature region of the ODT. In the concentration range x ≤ 0.015, the temperatures of μeff(T) minima are within a one-degree difference compared to the initial CuCrS2-matrix. This fact correlates with the DSC data reported previously for lanthanide-doped CuCr0.99Ln0.01S2 (Ln = La…Lu) solid solutions [22]. The temperature of μeff(T) minimum for CuCr0.97Ln0.03S2 was shifted by 5 degrees compared to the CuCrS2-matrix. Thus, the trend of temperature decreasing with an increase in lanthanum concentration was observed. Note that this observed trend was previously empirically assumed for the vanadium-doped CuCr1−xVxS2 solid solutions [9,10,13]. It was assumed that an increase in vanadium concentration promoted a decrease in the formation energy of defects. In the case of lanthanum-doped CuCr1−xLaxS2 solid solutions, the observed trend could also be related to a decrease in the formation energy of defects. This could be due to the larger ionic radius of lanthanum compared to chromium. Thus, one can conclude that the analysis of μeff(T) dependencies can be used to study the ODT, at least for CuCrS2-based solid solutions.
The linear behavior of the 1/χ temperature dependencies of CuCr1−xLaxS2 within the temperature range of 80–600 K allows one to approximate the χ(T) dependencies using the Curie-Weiss law (solid lines in Figure 7):
χ T = C T Θ = N A μ B 2 3 k ( T Θ ) μ e f f 2
where T is temperature, k is the Boltzmann constant, NA is the Avogadro number, μB is the Bohr magneton, μeff is the effective magnetic moment and Θ is the Weiss constant [45,46].
The μeff and Θ concentration dependencies are shown in Figure 9a,b. The μeff value of 3.88 μΒ for CuCrS2 correlates well with the theoretical value of 3.87 μΒ corresponded to the Cr3+ state [45,46]. The cationic substitution led to the μeff value decrease for CuCr1−xLaxS2 solid solutions compared to the initial CuCrS2-matrix. This fact indicates the simple isovalent substitution model of paramagnetic Cr3+ to diamagnetic La3+ ions [22,49]. Note that the μeff(x) was monotonically decreased in the concentration range of x ≤ 0.01. The lowest μeff value of 3.77 µB was measured for CuCr0.99La0.01S2. Further increase in lanthanum concentration does not significantly affect the μeff value.
The behavior of μeff(x) dependency at the concentration range of x > 0.01 could be related to the presence of the CuLaS2 impurity phase, discussed above. Formally, CuLaS2 is expected to be a diamagnetic compound since copper(I), lanthanum(III) and sulfur(II) are diamagnetic species [45,46]. In order to confirm this suggestion, the pure CuLaS2 phase was additionally synthesized. Accordingly, the CuLaS2 phase exhibited a negative magnetic susceptibility value (Figure 10a). An increase in the χ value within the temperature range below 300 K indicated the presence of magnetic impurities in the sample. Indeed, the analysis of χ(1/H) indicated the presence of ferromagnetic contributions within the temperature range studied. As an illustrative example, Figure 10b depicts the inverse field dependency measured at 80 K. Note that a similar trend was observed at other temperatures as well. The correction in the ferromagnetic contribution resulted in a decrease in the total χ value. However, even after the correction procedure, the tendency of χ to increase was preserved in the temperature range below 200 K. This could be due to the presence of paramagnetic impurities in the sample in addition to the ferromagnetic impurities. Note that 1/χ(T) dependency was not linear and could not be fitted using the Curie-Weiss law approximation. This fact allows one to confirm the presence of a few types of impurities with different magnetic properties. However, the measurements of magnetic susceptibility for the CuLaS2 phase have consistently shown that the contribution of this impurity to the main CuCr1−xLaxS2 phase was negligibly small. Thus, one can conclude that the contribution of the CuLaS2 impurity phase could not be the direct reason for the observed behavior of μeff(x) dependency in the concentration range of x > 0.01. On the other hand, the presence of the additional phase in the composition of CuCr1−xLaxS2 could lead to the emergence of defects. For instance, defects in the chromium or copper sublattice could affect the magnetic moment of neighboring atoms. Thus, the decrease in the concentration of chromium atoms could be compensated by the presence of additional magnetic moments. However, the magnetic moment concentration dependency can be used to study the solubility limit of doping atoms in CuCrS2-based solid solutions.
The concentration dependency of Θ for CuCr1−xLaxS2 demonstrated a similar behavior to that of the μeff(x) dependence (Figure 9b,c, respectively). In the concentration range x ≤ 0.01, the absolute value of Θ was decreased. A further increase in lanthanum concentration led to a slight increase in the absolute value of Θ. Note that lanthanum has an unfilled f-shell, resulting in spin-only behavior of the magnetic properties of CuCr1−xLaxS2. Since the Weiss constant is related to the total exchange interaction, spin value, and, consequently, the effective magnetic moment, one can utilize this relationship to calculate the exchange interaction value as follows [45,46]:
Θ = 2 s ( s + 1 ) 3 k z i J i = μ e f f 2 6 k z i J i
where s is the spin, zi is the magnetic coordination number, Ji is the exchange interaction between magnetic centers and i is the magnetic center number. The concentration dependence of the exchange interaction absolute value is presented in Figure 9c. The obtained values indicate the absence of significant changes in the magnetic exchange interaction ΣziJi in the solid solutions studied. Thus, one can conclude that changes in the Θ value are due to changes in the effective magnetic moment.
As discussed above, CuCrS2-based solid solutions are considered to be promising thermoelectric materials. Thus, measurement of the Seebeck coefficient of CuCr1−xLaxS2 was carried out (Figure 11). The positive sign of the Seebeck coefficient indicates the preservation of p-type conductivity in CuCr1−xLaxS2 after the cationic substitution of the initial CuCrS2-matrix. It was previously reported that the cationic substitution of chromium atoms with lanthanum in CuCr0.99La0.01S2 led to a significant increase in the Seebeck coefficient compared to the initial matrix [21]. The current study confirms the previous findings.
Note that all the solid solutions showed a higher Seebeck coefficient compared to the initial CuCrS2-matrix. The largest Seebeck coefficient value of 373 µV/K was measured at 500 K for CuCr0.015La0.015S2. The obtained value was 3.3 times greater compared to the initial matrix (113 µV/K). This could be due to electronic structure reconfiguration after cationic substitution. For instance, the occupied 3d-states of chromium in the case of the initial CuCrS2-matrix are replaced by the unoccupied 4f-states of lanthanum in CuCr1−xLaxS2 solid solutions. This process leads to an electronic density decrease at the valence band top and, consequently, causes a shift of the valence band top to the higher binding energy region [21,49]. Note that, as reported previously, DFT calculations for the model solid solutions with a high lanthanum concentration (x ≈ 0.33) lead to vanishing of the band gap [27,49]. Thus, one could expect an increase in the Seebeck coefficient value at the low lanthanum concentration region (x ≤ 0.01) and a decrease in the Seebeck coefficient value with increasing lanthanum concentration (x→0.33). However, the influence of lanthanum concentration on the Seebeck coefficient behavior is more complicated. For instance, the Seebeck coefficient was significantly increased for x = 0.005 compared to the initial matrix. A further concentration increase to x = 0.01 led to a decrease in the Seebeck coefficient value. Hence, one can conclude that the proposed model agrees well with the observed behavior of the lanthanum concentration influence for solid solutions with x ≤ 0.01. However, an increase in the concentration to x = 0.015 caused a further increase in the Seebeck coefficient compared to CuCr0.99La0.01S2. The observed Seebeck coefficient values for CuCr0.985La0.015S2 are comparable with those for CuCr0.995La0.005S2. The Seebeck coefficient for the solid solutions with the highest lanthanum concentration CuCr0.97La0.03S2 are lower compared to CuCr0.985La0.015S2. As mentioned above, the solid solutions with x ≥ 0.015 contained the additional CuLaS2 phase. The Seebeck coefficient temperature dependency for CuLaS2 is presented in Figure 11. The Seebeck coefficient values for CuLaS2 are much lower compared to CuCrS2 and CuCr1−xLaxS2 solid solutions. Thus, the presence of the CuLaS2 phase in CuCr1−xLaxS2 could not be a direct reason for the increase in the Seebeck coefficient observed for CuCr0.985La0.015S2. On the other hand, indirect mechanisms such as increase in defectiveness, lattice strain or phase boundaries due to the presence of CuLaS2 inclusions could affect the total Seebeck coefficient value [40,42].
The measured carrier concentrations for CuCr1−xLaxS2 solid solutions at room temperature are presented in Figure 12. The positive sign of the Hall voltage confirmed the p-type conductivity of CuCr1−xLaxS2. The decrease in carrier concentration was observed for lanthanum concertation of x ≤ 0.015 (Figure 12). This fact is consistent with previously reported results, which showed the cationic substitution of chromium atoms leads to a decrease in carrier concentration in CuCrS2-based solid solutions [1]. The lowest carrier concentration of ~3 × 1016 cm−3 was measured for CuCr0.985La0.015S2 with a higher Seebeck coefficient value. Note that the carrier concentration for CuCr0.985La0.015S2 was an order lower compared to the other solid solutions studied. An increase in lanthanum concentration leads to an increase in carrier concentration of ~4.4 × 10¹⁷ for CuCr0.97La0.03S2. Thus, the observed trend of charge carrier concentration increase confirmed the proposed model of electronic structure reconfiguration discussed above.

4. Conclusions

The influence of the doping atom concentration on the magnetic properties of CuCrS2-based CuCr1−xLaxS2 (x = 0; 0.005; 0.01; 0.015; 0.03) solid solutions was studied. The magnetic susceptibility, magnetic moment and Weiss constant of the samples were analyzed using static magnetochemistry within a wide temperature range of 80 to 750 K. The low-doping solid solutions with a lanthanum concentration of x ≤ 0.01 were determined to be single-phased based on the obtained XRD and EDX data. The deviation from the simple isovalent Cr3+→Ln3+ cationic substitution principle was observed for solid solutions with a higher lanthanum concentration of x > 0.01. The magnetic properties of CuCr1−xLaxS2 were found to be significantly influenced by lanthanum concentration, especially in the low-doping concentration region of x ≤ 0.01. The highest magnetic moment value of 3.88 µB was measured for the initial CuCrS2-matrix. The lowest value of 3.77 µB was observed for the CuCr0.99La0.01S2 solid solution. The minimum Weiss constant of −147 K was measured for the initial matrix. The maximum value of −139 K was observed for CuCr0.99La0.01S2. An increase in the Seebeck coefficient value is observed after the cationic substitution of CuCrS2 with lanthanum. The maximum value of 373 µV/K was measured for CuCr0.985La0.015S2 at 500 K. The obtained value was 3.3 times greater compared to the initial CuCrS2-matrix. The cationic substitution of chromium atoms in the initial matrix results in a decrease in the charge carrier concentration. The lowest carrier concentration of ~3 × 1016 cm−3 was measured for CuCr0.985La0.015S2 with a higher Seebeck coefficient value. The field dependence of the magnetic susceptibility indicated the absence of ferromagnetic contributions in the total magnetic susceptibility value of CuCr1−xLaxS2. It should be noted that the previously reported data on vanadium-doped solid solutions demonstrated a significant ferromagnetic contribution in the magnetic susceptibility value. The data on magnetic properties can be successfully utilized to investigate the limits of doping atom suitability and ODT temperature in CuCrS2-based solid solutions.

Author Contributions

Conceptualization, E.V.K. and M.M.S.; Methodology, E.V.K., M.M.S., I.Y.F. and V.S.S.; Validation, E.V.K.; Formal analysis, M.M.S.; Investigation, E.V.K., M.M.S. and V.S.S.; Resources, I.Y.F. and E.V.K.; Data curation, E.V.K., M.M.S. and V.S.S.; Writing—original draft, E.V.K. and M.M.S.; Writing—review and editing, E.V.K., M.M.S. and V.S.S.; Visualization, E.V.K. and M.M.S.; Supervision, E.V.K.; Funding acquisition, E.V.K. All authors have read and agreed to the published version of the manuscript.

Funding

This study was funded by the Russian Science Foundation (project No. 19-73-10073, https://rscf.ru/project/19-73-10073/ (accessed on 25 June 2023)).

Institutional Review Board Statement

Not applicable.

Informed Consent Statement

Not applicable.

Data Availability Statement

Not applicable.

Acknowledgments

The authors are grateful to the Ministry of Science and Higher Education of the Russian Federation. The authors thank Sotnikov A.V. for assistance with obtaining the ceramic samples.

Conflicts of Interest

The authors declare no conflict of interest.

References

  1. Korotaev, E.V.; Syrokvashin, M.M.; Filatova, I.Y.; Sotnikov, A.V.; Kalinkin, A.V. The Charge Distribution, Seebeck Coefficient, and Carrier Concentration of CuCr0.99Ln0.01S2 (Ln = Dy–Lu). Materials 2023, 16, 2431. [Google Scholar] [CrossRef]
  2. Okada, T. Intercalation of Organic Compounds into Layered Clay Minerals. Oleoscience 2014, 14, 189–196. [Google Scholar] [CrossRef] [Green Version]
  3. Constantino, V.R.L.; Barbosa, C.A.S.; Bizeto, M.A.; Dias, P.M. Intercalation Compounds Involving Inorganic Layered Structures. An. Acad. Bras. Cienc. 2000, 72, 45–49. [Google Scholar] [CrossRef] [Green Version]
  4. Ushakov, A.V.; Kukusta, D.A.; Yaresko, A.N.; Khomskii, D.I. Magnetism of Layered Chromium Sulfides MCrS2 (M = Li, Na, K, Ag, and Au): A First-Principles Study. Phys. Rev. B 2013, 87, 014418. [Google Scholar] [CrossRef] [Green Version]
  5. Engelsman, F.M.R.; Wiegers, G.A.; Jellinek, F.; Van Laar, B. Crystal Structures and Magnetic Structures of Some Metal(I) Chromium(III) Sulfides and Selenides. J. Solid State Chem. 1973, 6, 574–582. [Google Scholar] [CrossRef]
  6. Sanchez Rodriguez, J.J.; Nunez Leon, A.N.; Abbasi, J.; Shinde, P.S.; Fedin, I.; Gupta, A. Colloidal Synthesis, Characterization, and Photoconductivity of Quasi-Layered CuCrS2 Nanosheets. Nanomaterials 2022, 12, 4164. [Google Scholar] [CrossRef]
  7. Chernozatonskii, L.A.; Artyukh, A.A. Quasi-Two-Dimensional Transition Metal Dichalcogenides: Structure, Synthesis, Properties, and Applications. Physics-Uspekhi 2018, 61, 2–28. [Google Scholar] [CrossRef]
  8. Vasilyeva, I.G. Chemical Aspect of the Structural Disorder in CuCrS2 and CuCr1–XVxS2 Solid Solutions. J. Struct. Chem. 2017, 58, 1009–1017. [Google Scholar] [CrossRef]
  9. Almukhametov, R.F.; Yakshibayev, R.A.; Gabitov, E.V.; Abdullin, A.R.; Kutusheva, R.M. Structural Properties and Ionic Conductivities of CuCr1–XVxS2 Solid Solutions. Phys. Status Solidi 2003, 236, 29–33. [Google Scholar] [CrossRef]
  10. Al’mukhametov, R.F.; Yakshibaev, R.A.; Gabitov, É.V.; Abdullin, A.R. Investigation of Superionic Phase Transition in the CuCr1-XVxS2 System by X-ray Diffraction and Magnetic Methods. Phys. Solid State 2000, 42, 1508–1511. [Google Scholar] [CrossRef]
  11. Korotaev, E.V.; Syrokvashin, M.M.; Filatova, I.Y.; Sotnikov, A.V. Effect of the Order-Disorder Transition on the Electronic Structure and Physical Properties of Layered CuCrS2. Materials 2021, 14, 2729. [Google Scholar] [CrossRef]
  12. Akmanova, G.R.; Davletshina, A.D. Ionic Conductivity and Diffusion in Superionic Conductors CuCrS2–AgCrS2. Lett. Mater. 2013, 3, 76–78. [Google Scholar] [CrossRef] [Green Version]
  13. Al’mukhametov, R.F.; Yakshibaev, R.A.; Gabitov, E.V.; Abdullin, A.R. Synthesis and X-ray Diffraction Study of CuCr1-XVxS2. Inorg. Mater. 2000, 36, 437–440. [Google Scholar] [CrossRef]
  14. Almukhametov, R. Structural Properties and Ionic Conductivity of New CuCr1−xVxSe2 Solid Solutions. Solid State Ionics 2003, 158, 409–414. [Google Scholar] [CrossRef]
  15. Bongers, P.F.; Van Bruggen, C.F.; Koopstra, J.; Omloo, W.P.F.A.M.; Wiegers, G.A.; Jellinek, F. Structures and Magnetic Properties of Some Metal (I) Chromium (III) Sulfides and Selenides. J. Phys. Chem. Solids 1968, 29, 977–984. [Google Scholar] [CrossRef]
  16. Abramova, G.M.; Petrakovskii, G.A. Metal-Insulator Transition, Magnetoresistance, and Magnetic Properties of 3d-Sulfides (Review). Low Temp. Phys. 2006, 32, 725–734. [Google Scholar] [CrossRef]
  17. Abramova, G.M.; Petrakovskǐ, G.A.; Vorotynov, A.M.; Velikanov, D.A.; Kiselev, N.I.; Bovina, A.F.; Szymczak, R.; Al’mukhametov, R.F. Phase Transitions and Colossal Magnetoresistance in CuVxCr 1-x S2 Layered Disulfides. JETP Lett. 2006, 83, 118–121. [Google Scholar] [CrossRef]
  18. Tsujii, N.; Kitazawa, H. Substitution Effect on the Two-Dimensional Triangular-Lattice System CuCrS2. J. Phys. Condens. Matter 2007, 19, 145245. [Google Scholar] [CrossRef]
  19. Karmakar, A.; Dey, K.; Chatterjee, S.; Majumdar, S.; Giri, S. Spin Correlated Dielectric Memory and Rejuvenation in Multiferroic CuCrS2. Appl. Phys. Lett. 2014, 104, 052906. [Google Scholar] [CrossRef] [Green Version]
  20. Korotaev, E.V.; Syrokvashin, M.M.; Filatova, I.Y.; Zvereva, V.V. Vanadium Doped Layered Copper-Chromium Sulfides: The Correlation between the Magnetic Properties and XES Data. Vacuum 2020, 179, 109390. [Google Scholar] [CrossRef]
  21. Korotaev, E.V.; Syrokvashin, M.M.; Filatova, I.Y.; Trubina, S.V.; Nikolenko, A.D.; Ivlyushkin, D.V.; Zavertkin, P.S.; Sotnikov, A.V.; Kriventsov, V.V. XANES Investigation of Novel Lanthanide-Doped CuCr0.99Ln0.01S2 (Ln = La, Ce) Solid Solutions. Appl. Phys. A 2020, 126, 537. [Google Scholar] [CrossRef]
  22. Korotaev, E.V.; Syrokvashin, M.M.; Filatova, I.Y.; Zvereva, V.V. Magnetic Properties of Novel Layered Disulfides CuCr0.99Ln0.01S2 (Ln = La…Lu). Materials 2021, 14, 5101. [Google Scholar] [CrossRef] [PubMed]
  23. Fomenko, Y.S.; Gushchin, A.L.; Tkachev, A.V.; Vasilyev, E.S.; Abramov, P.A.; Nadolinny, V.A.; Syrokvashin, M.M.; Sokolov, M.N. Fist Oxidovanadium Complexes Containing Chiral Derivatives of Dihydrophenanthroline and Diazafluorene. Polyhedron 2017, 135, 96–100. [Google Scholar] [CrossRef]
  24. Abramova, G.M.; Petrakovskiǐ, G.A.; Vtyurin, A.N.; Vorotynov, A.M.; Velikanov, D.A.; Krylov, A.S.; Gerasimova, Y.; Sokolov, V.V.; Bovina, A.F. Magnetic Properties, Magnetoresistance, and Raman Spectra of CuV x Cr1–X S2. Phys. Solid State 2009, 51, 532–536. [Google Scholar] [CrossRef]
  25. Tsujii, N.; Kitazawa, H.; Kido, G. Insulator to Metal Transition Induced by Substitution in the Nearly Two-Dimensional Compound CuCr1–XVxS2. Phys. Status Solidi 2006, 3, 2775–2778. [Google Scholar] [CrossRef]
  26. Korotaev, E.V.; Syrokvashin, M.M.; Filatova, I.Y.; Pelmenev, K.G.; Zvereva, V.V.; Peregudova, N.N. Seebeck Coefficient of Cation-Substituted Disulfides CuCr1−xFexS2 and Cu1−xFexCrS2. J. Electron. Mater. 2018, 47, 3392–3397. [Google Scholar] [CrossRef]
  27. Korotaev, E.V.; Syrokvashin, M.M.; Filatova, I.Y.; Trubina, S.V.; Nikolenko, A.D.; Ivlyushkin, D.V.; Zavertkin, P.S.; Kriventsov, V.V. The Conduction Band of the Lanthanide Doped Chromium Disulfides CuCr0.99Ln0.01S2 (Ln = La, Ce, Gd): XANES Investigations. In Proceedings of the AIP Conference Proceedings, Novosibirsk, Russia, 13–16 July 2020; Volume 2299, p. 080004. [Google Scholar]
  28. Korotaev, E.V.; Syrokvashin, M.M.; Filatova, I.Y.; Sotnikov, A.V.; Kalinkin, A.V. Charge Distribution in Layered Lanthanide-Doped CuCr0.99Ln0.01S2 (Ln = Pr–Tb) Thermoelectric Materials. Materials 2022, 15, 8747. [Google Scholar] [CrossRef]
  29. Chen, Y.-X.; Zhang, B.-P.; Ge, Z.-H.; Shang, P.-P. Preparation and Thermoelectric Properties of Ternary Superionic Conductor CuCrS2. J. Solid State Chem. 2012, 186, 109–115. [Google Scholar] [CrossRef]
  30. Romanenko, A.I.; Chebanova, G.E.; Katamanin, I.N.; Drozhzhin, M.V.; Artemkina, S.B.; Han, M.-K.; Kim, S.-J.; Wang, H. Enhanced Thermoelectric Properties of Polycrystalline CuCrS2−x Se X (x = 0, 0.5, 1.0, 1.5, 2) Samples by Replacing Chalcogens and Sintering. J. Phys. D. Appl. Phys. 2021, 55, 135302. [Google Scholar] [CrossRef]
  31. Tewari, G.C.; Karppinen, M.; Rastogi, A.K. Effects of Competing Magnetic Interactions on the Electronic Transport Properties of CuCrSe2. J. Solid State Chem. 2013, 198, 108–113. [Google Scholar] [CrossRef]
  32. Tewari, G.C.; Tripathi, T.S.; Rastogi, A.K. Thermoelectric Properties of Layer-Antiferromagnet CuCrS 2. J. Electron. Mater. 2010, 39, 1133–1139. [Google Scholar] [CrossRef] [Green Version]
  33. Tewari, G.C.; Tripathi, T.S.; Rastogi, A.K. Effect of Chromium Disorder on the Thermoelectric Properties of Layered-Antiferromagnet CuCrS2. Z. Fur Krist. 2010, 225, 471–474. [Google Scholar] [CrossRef]
  34. Srivastava, D.; Tewari, G.C.; Karppinen, M.; Nieminen, R.M. First-Principles Study of Layered Antiferromagnetic CuCrX2 (X = S, Se and Te). J. Phys. Condens. Matter 2013, 25, 105504. [Google Scholar] [CrossRef]
  35. Kim, K.; Asaoka, S.; Yamamoto, T.; Hayakawa, S.; Takeda, K.; Katayama, M.; Onoue, T. Mechanisms of Hydrogen Sulfide Removal with Steel Making Slag. Environ. Sci. Technol. 2012, 46, 120907070404002. [Google Scholar] [CrossRef]
  36. Hansen, A.-L.; Dankwort, T.; Groß, H.; Etter, M.; König, J.; Duppel, V.; Kienle, L.; Bensch, W. Structural Properties of the Thermoelectric Material CuCrS2 and of Deintercalated CuxCrS2 on Different Length Scales: X-ray Diffraction, Pair Distribution Function and Transmission Electron Microscopy Studies. J. Mater. Chem. C 2017, 5, 9331–9338. [Google Scholar] [CrossRef]
  37. Kaltzoglou, A.; Vaqueiro, P.; Barbier, T.; Guilmeau, E.; Powell, A.V. Ordered-Defect Sulfides as Thermoelectric Materials. J. Electron. Mater. 2014, 43, 2029–2034. [Google Scholar] [CrossRef]
  38. Bhattacharya, S.; Basu, R.; Bhatt, R.; Pitale, S.; Singh, A.; Aswal, D.K.; Gupta, S.K.; Navaneethan, M.; Hayakawa, Y. CuCrSe2: A High Performance Phonon Glass and Electron Crystal Thermoelectric Material. J. Mater. Chem. A 2013, 1, 11289–11294. [Google Scholar] [CrossRef]
  39. Wu, D.; Huang, S.; Feng, D.; Li, B.; Chen, Y.; Zhang, J.; He, J. Revisiting AgCrSe2 as a Promising Thermoelectric Material. Phys. Chem. Chem. Phys. 2016, 18, 23872–23878. [Google Scholar] [CrossRef]
  40. Dmitriev, A.V.; Zvyagin, I.P. Current Trends in the Physics of Thermoelectric Materials. Uspekhi Fiz. Nauk 2010, 180, 821. [Google Scholar] [CrossRef]
  41. Terasaki, I. Thermal Conductivity and Thermoelectric Power of Semiconductors. In Comprehensive Semiconductor Science and Technology; Elsevier Science: Amsterdam, The Netherlands, 2011; ISBN 9780444531537. [Google Scholar]
  42. Nandihalli, N. Thermoelectric Films and Periodic Structures and Spin Seebeck Effect Systems: Facets of Performance Optimization. Mater. Today Energy 2022, 25, 100965. [Google Scholar] [CrossRef]
  43. Korotaev, E.V.; Kanazhevskiy, V.V.; Peregudova, N.N.; Syrokvashin, M.M.; Mazalov, L.N.; Sokolov, V.V.; Filatova, I.Y.; Pichugin, A.Y. Xanes of X-ray Absorbtion K Edges of Chromium Dichalcogenides CuCr1−x M′ x S2 and MCrX2. J. Struct. Chem. 2016, 57, 1355–1361. [Google Scholar] [CrossRef]
  44. Sotnikov, A.V.; Bakovets, V.V.; Sokolov, V.V.; Filatova, I.Y. Lanthanum Oxide Sulfurization in Ammonium Rhodanide Vapor. Inorg. Mater. 2014, 50, 1024–1029. [Google Scholar] [CrossRef]
  45. Selwood, P. Magnetochemistry, 2nd ed.; Interscience Publishers: New York, NY, USA, 1956. [Google Scholar]
  46. Blundell, S. Magnetism in Condensed Matter; OXFORD University Press: Oxford, UK, 2001. [Google Scholar] [CrossRef]
  47. Inorganic Crystal Structure Database, Version 2.1.0, Leibniz Institute for Information Infrastructure, FIZ Karlsruhe, Eggenstein—Leopoldshafen, Germany. Available online: https://icsd.products.fiz-karlsruhe.de/ (accessed on 17 May 2023).
  48. Vassilieva, I.G.; Kardash, T.Y.; Malakhov, V.V. Phase Transformations of CuCrS2: Structural and Chemical Study. J. Struct. Chem. 2009, 50, 288–295. [Google Scholar] [CrossRef]
  49. Korotaev, E.V.; Syrokvashin, M.M.; Filatova, I.Y.; Kalinkin, A.V.; Sotnikov, A.V. Valence Band Structure and Charge Distribution in the Layered Lanthanide-Doped CuCr0.99Ln0.01S2 (Ln = La, Ce) Solid Solutions. Sci. Rep. 2021, 11, 18934. [Google Scholar] [CrossRef]
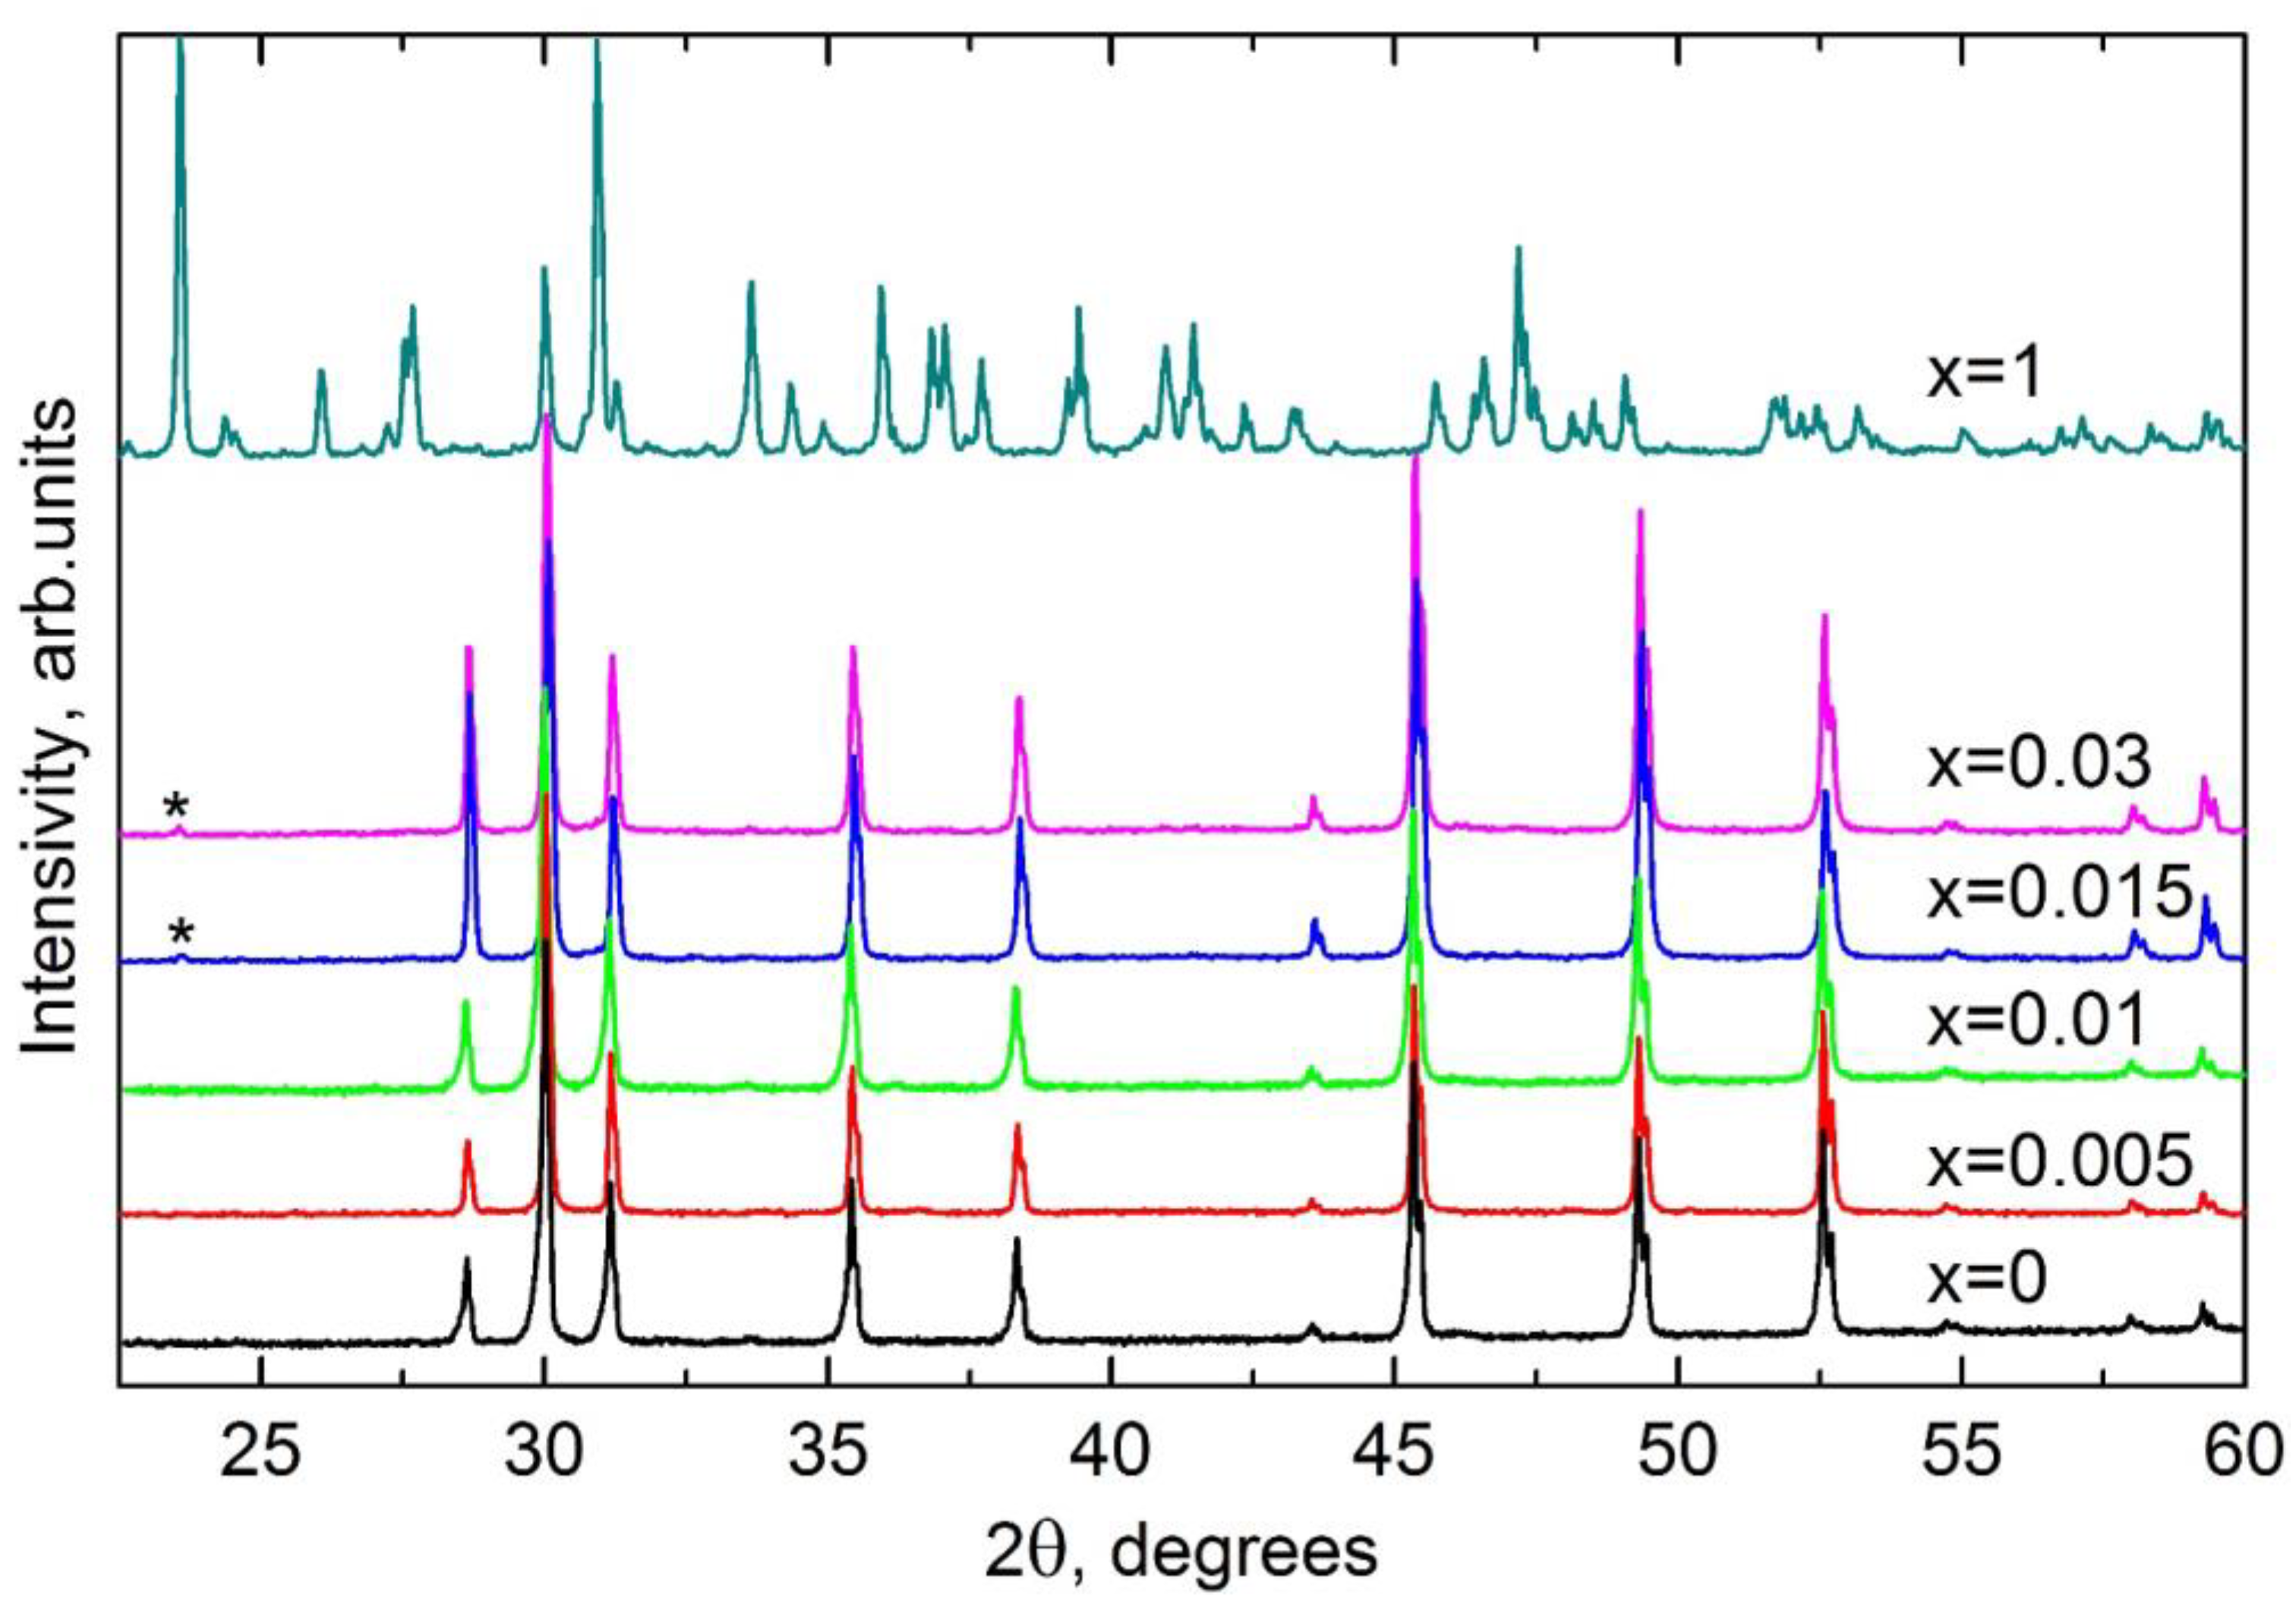
Figure 1. XRD patterns for CuCr1−xLaxS2 (x = 0; 0.005; 0.01; 0.015; 0.03; 1) powder samples.
Magnetochemistry 09 00168 g001
Figure 2. SEM and EDX mapping images of copper, chromium, lanthanum and sulfur for CuCr1−xLaxS2 powder samples.
Magnetochemistry 09 00168 g002
Figure 3. SEM and EDX mapping images of copper, chromium, lanthanum and sulfur for CuCr1−xLaxS2 ceramic samples.
Magnetochemistry 09 00168 g003
Figure 4. High-magnification SEM images of powder particles for initial CuCrS2-matrix.
Magnetochemistry 09 00168 g004
Figure 5. High-magnification SEM images of powder particles for CuCr1−xLaxS2 solid solutions.
Magnetochemistry 09 00168 g005
Figure 6. Inverse field dependencies for CuCr0.97La0.03S2 (a) and CuCr0.95V0.05S2 (b) measured at 80 K.
Magnetochemistry 09 00168 g006
Figure 7. Temperature dependencies of magnetic susceptibility (a), inverse magnetic susceptibility (b) and effective magnetic moment (c,d) for CuCr1−xLaxS2 solid solutions.
Magnetochemistry 09 00168 g007
Figure 8. Minimum temperatures of effective magnetic moment for CuCr1−xLaxS2 solid solutions.
Magnetochemistry 09 00168 g008
Figure 9. Concentration dependencies for CuCr1−xLaxS2 solid solutions: effective magnetic moment (a), Weiss constants (b) and total magnetic exchange interaction absolute value (c).
Magnetochemistry 09 00168 g009
Figure 10. CuLaS2 sulfide phase: magnetic susceptibility temperature dependencies before and after correction (a) and inverse field dependence measured at 80 K (b).
Magnetochemistry 09 00168 g010
Figure 11. Seebeck coefficient temperature dependencies for CuCr1−xLaxS2 solid solutions and CuLaS2 sulfide.
Magnetochemistry 09 00168 g011
Figure 12. Carrier concentrations at room temperature for CuCr1−xLaxS2 solid solutions.
Magnetochemistry 09 00168 g012
Table 1. The calculated lattice parameters for CuCr1−xLaxS2.
Samplea, Åc, Å
CuCrS2 3.482(7) 18.701(5)
CuCr0.995La0.005S2 3.482(9)18.706(6)
CuCr0.99La0.01S23.483(6) 18.716(4)
CuCr0.985La0.015S2 3.479(1)18.686(8)
CuCr0.97La0.03S2 3.480(1)18.696(7)
Disclaimer/Publisher’s Note: The statements, opinions and data contained in all publications are solely those of the individual author(s) and contributor(s) and not of MDPI and/or the editor(s). MDPI and/or the editor(s) disclaim responsibility for any injury to people or property resulting from any ideas, methods, instructions or products referred to in the content.

