Article

Dynamic Footprints of the Specific Artificial Spin Ice Microstate on Its Spin Waves

by
Pietro Micaletti
and
Federico Montoncello
*
Department of Physics and Earth Sciences, University of Ferrara, 44122 Ferrara, Italy
*
Author to whom correspondence should be addressed.
Magnetochemistry 2023, 9(6), 158; https://doi.org/10.3390/magnetochemistry9060158
Submission received: 30 March 2023 / Revised: 1 June 2023 / Accepted: 9 June 2023 / Published: 16 June 2023
(This article belongs to the Special Issue Spin Waves in Magnonic Crystals and Hybrid Ferromagnetic Structures)

Abstract

:
We present a micromagnetic investigation of the spin dynamics at remanence (zero applied field) in a periodic square artificial spin ice (ASI) prepared four different microstates (i.e., with zero, two or four magnetic charges at the vertex). The ASI elements consist of permalloy elliptical dots with a fixed long axis, and a variable width and interdot separation. For each vertex configuration, we compute the equilibrium ground state at zero applied field by relaxing a previously set magnetic configuration (microstate). After the excitation of such ground state, we perform a Fourier analysis obtaining frequency spectra and space phase profiles. We discuss the behavior of the spectra in changing the system’s microstate and geometry, with reference to the spin mode space profiles, magnetization configuration, and effective internal field. Our results draw a correlation between ASI macrospin orientation at vertex and a few important dynamic properties like a phase-shift in the mode profiles or the frequency gap between the edge and fundamental modes. We suggest a few specific experiments to validate of our predictions, as well as applications in the field of interferometric magnonic devices. We believe that our results can help, from the fabrication stage, in tailoring the appropriate ASI geometry for specific application purposes.

1. Introduction

Artificial spin ice (ASI) systems were initially conceived to simulate, to a larger scale, the atomic spin ice [1,2,3] reproducing peculiar effects like frustration and Dirac strings to provide insight, as a feedback, to the world of atomic spin ice. More recently, they have become an independent subject of investigation in Nanomagnetism and Magnonics. In Nanomagnetism, ASI can represent a macrospin network where the action of an external field can trigger the reversal of adjacent elements following certain given paths [4,5,6,7,8], even in the perspective of geometrically induced magneto-resistance phenomena [9], or magnetophoretic technologies [10]. In Magnonics, not only the opening of specific paths in the network allows a correlated, peculiar spin-wave (SW) propagation, but also the same periodicity of the structure can represent a diffraction grating for spin waves, providing new, partly unexplored, SW properties that the unpatterned material does not have [11,12,13,14,15]. In particular, the peculiar combination of geometry and magnetization distribution offers different microstates (ground states) at remanence (zero external field), each with distinct SW profiles and spectra. The different microstates at remanence can be seen as a new degree of freedom for SWs, and the experimental implementation is a current issue, especially on how to induce deterministically a microstate or another by (e.g.) the application of an external field and following an hysteresis cycle [16,17]. Recently this issue was solved by using macrospins with different aspect ratio to allow different switching fields and in such a way allowing the preparation of any desired microstate [18,19,20].
ASI systems were also considered as parts of hybrid magnonic systems, i.e., multilayer structures where one (or more) layer precisely consists of an ASI lattice. The idea behind these structures is to exploit the ASI elements to imprint a nonuniform magnetization in the film to alter and control SW propagation along it. Intensive theoretical and experimental studies are being done on these special structures, with special relevance to the vertical coupling [21,22,23,24,25,26,27,28].
Besides ferromagnetic resonance measurements (FMR) [29,30], other ways to measure the SW spectra in any microstates can be Brillouin light scattering (BLS) [31,32] or time-resolved scanning Kerr microscopy (TRSKM) [33,34]. A problem in real, fabricated ASI, is the regularity of the microstate distribution across the sample array, which is way far to be simply attained. This means the spectra might result as a combination, superposition of more spectra of different microstates, making the correlation “microstate type vs. SW spectrum” simply unreliable.
In this paper, we would like to investigate thoroughly in a square ASI the SW spectra and profiles of four special microstates, out of a large number, to highlight the main characteristics and provide key features not only interesting for theoretical reasons, but also possibly recognizable in BLS, TRSKM or FMR experiments. We will see how the main active modes are only a few, with characteristic behavior strictly linked to the specific microstate and lattice interaction strength, so that we believe our results, though refereed to a specific geometry and material, can easily generalized and be a reference for any experimental investigation. Indeed, the correlation between microstate and dynamic properties is important not only for experimental prospects, but also for possible SW-based technology, since the different microstates can be induced by purpose to modify the SW propagation properties on-demand.

2. Materials and Methods

Micromagnetic Framework and Simulations

We performed micromagnetic simulations using the graphic processing unit (GPU) accelerated software mumax 3 [35]. The ASI element is an ellipse 256 × 96 × 15 nm 3 , which we will address as ’macrospin’ in the following, the inter-element spacer is 48 nm, and the system is discretized into 4 × 4 × 5 nm 3 micromagnetic cells (hence, each ellipse consists of 64 × 24 × 3 micromagnetic cells).
Depending on the extension of the allowed primitive cell, we have a determined number of macrospins n, each possessing two states k [macrospin orientations toward north (N) or south (S)], so that the total number of possible configurations (“microstates”) is k n . In our study, we focus on a square artificial spin ice with 8 macrospin in the primitive cell, hence giving 256 configurations, which we however reduce with some additional symmetries. First, from the dynamic point of view, the spin waves are sensitive to the magnetization flux density, not its sense of circulation, and this greatly decreases the number. Then, if we introduce that the spins along a direction must be all parallel and concordant, we reduce to three only the number of microstates. For simplicity, we label them as 4N, 3N1S and 2N2S (Figure 1), referring to the type of poles in one of the vertices of the lattice taken as a reference. These labels easily lead to the effective magnetic charge ( q eff ) at the central vertex of the primitive cell, i.e., q 4 N = 4 q , q 3 N 1 S = 2 q , q 2 N 2 S = 0 , correspondingly. For symmetry reasons, while 2N2S extending in a lattice produces only vertices of the same kind, a 4N vertex inevitably requires a 2N2S vertex, and also the opposite ones 4S and 2S2N, while a 3N1S inevitably requires its opposite 3S1N (see Figure 1a–c). Finally, we also consider the simplest periodic flux-closure configuration (“Vortex”) to complete the whole study framework, which possesses 2N2S and 2S2N vertices, i.e., a magnetic charge q vort = 0 (Figure 1d). In the following, when we address the “effective charge at vertex”, we will include Configurations (c) and (d) that have the same magnetic charge at vertices, but different orientation of the macrospins: this will have distinct consequences on the spectra, as we will discuss in the following.
The actual physical size of our square primitive cell is 704 × 704 nm 2 , which, though geometrically non-unitary, is magnetically unitary when considering the magnetization configuration maps 4N, 3N1S and flux-closure (Vortex). The configuration 2N2S has instead a unitary primitive cell with just two ellipses only, however we keep the same size for simplicity and comparison.
We use quasi-periodic boundary conditions [36], namely 32 × 32 copies of the primitive cell along either coordinates to simulate an extended, realistic system. We assumed the magnetic parameters of permalloy, hence: saturation magnetization M s = 800 kA/m, exchange stiffness parameter A = 13 pJ/m, and gyromagnetic ratio γ = 185 rad GHz/T. With these values, the exchange length, below which the spins are spontaneously aligned, is λ e x = 5.69 nm: this observation incidentally justifies our choice of an elemental cell of about 4 nm.
We first compute the relaxed state using a fictitious large damping factor α = 0.9 to get a fast convergence. Then we set α to zero (to allow long lasting precession and larger resolution) and apply to the relaxed state a uniform sinc pulse perpendicular to the plane:
b ( t ) = b 0 sin 2 π ν 0 ( t t 0 ) 2 π ν 0 ( t t 0 )
with b 0 = 10 mT, cutoff frequency ν 0 = 25 GHz (so we work off-resonance, since the frequency of interest will be below 15 GHz), and a delay time t 0 = 2 ns. The 2D ( x , y ) profile map of the out-of-plane (z) magnetization m z ( x , y | t ) is recorded at a sampling timesteps of 20 ps, for a total duration of 20 ns. Then the space-resolved time Fast Fourier Transform (FFT) is applied and mode profiles and spectra are obtained. The SW spatial profile shown throughout the manuscript correspond to the real part of the FFT coefficients m z of each micromagnetic cell in the simulated primitive cell [37]. The spectra I ν are calculated by integrating the amplitude over all micromagnetic cells in the primitive cell (k = 0) for each frequency ν , and then taking its square modulus (compare to theory in Ref. [38]):
I ν = x y m z ( ν | x , y ) d x d y 2
The resulting Dirac comb function I ν is convoluted to a gaussian function with full width at half maximum equal to 0.1 GHz (FWHM = 0.1 GHz), a value which is consistent with standard BLS and FMR experiments. In this way, we obtain the final spectra.

3. Results

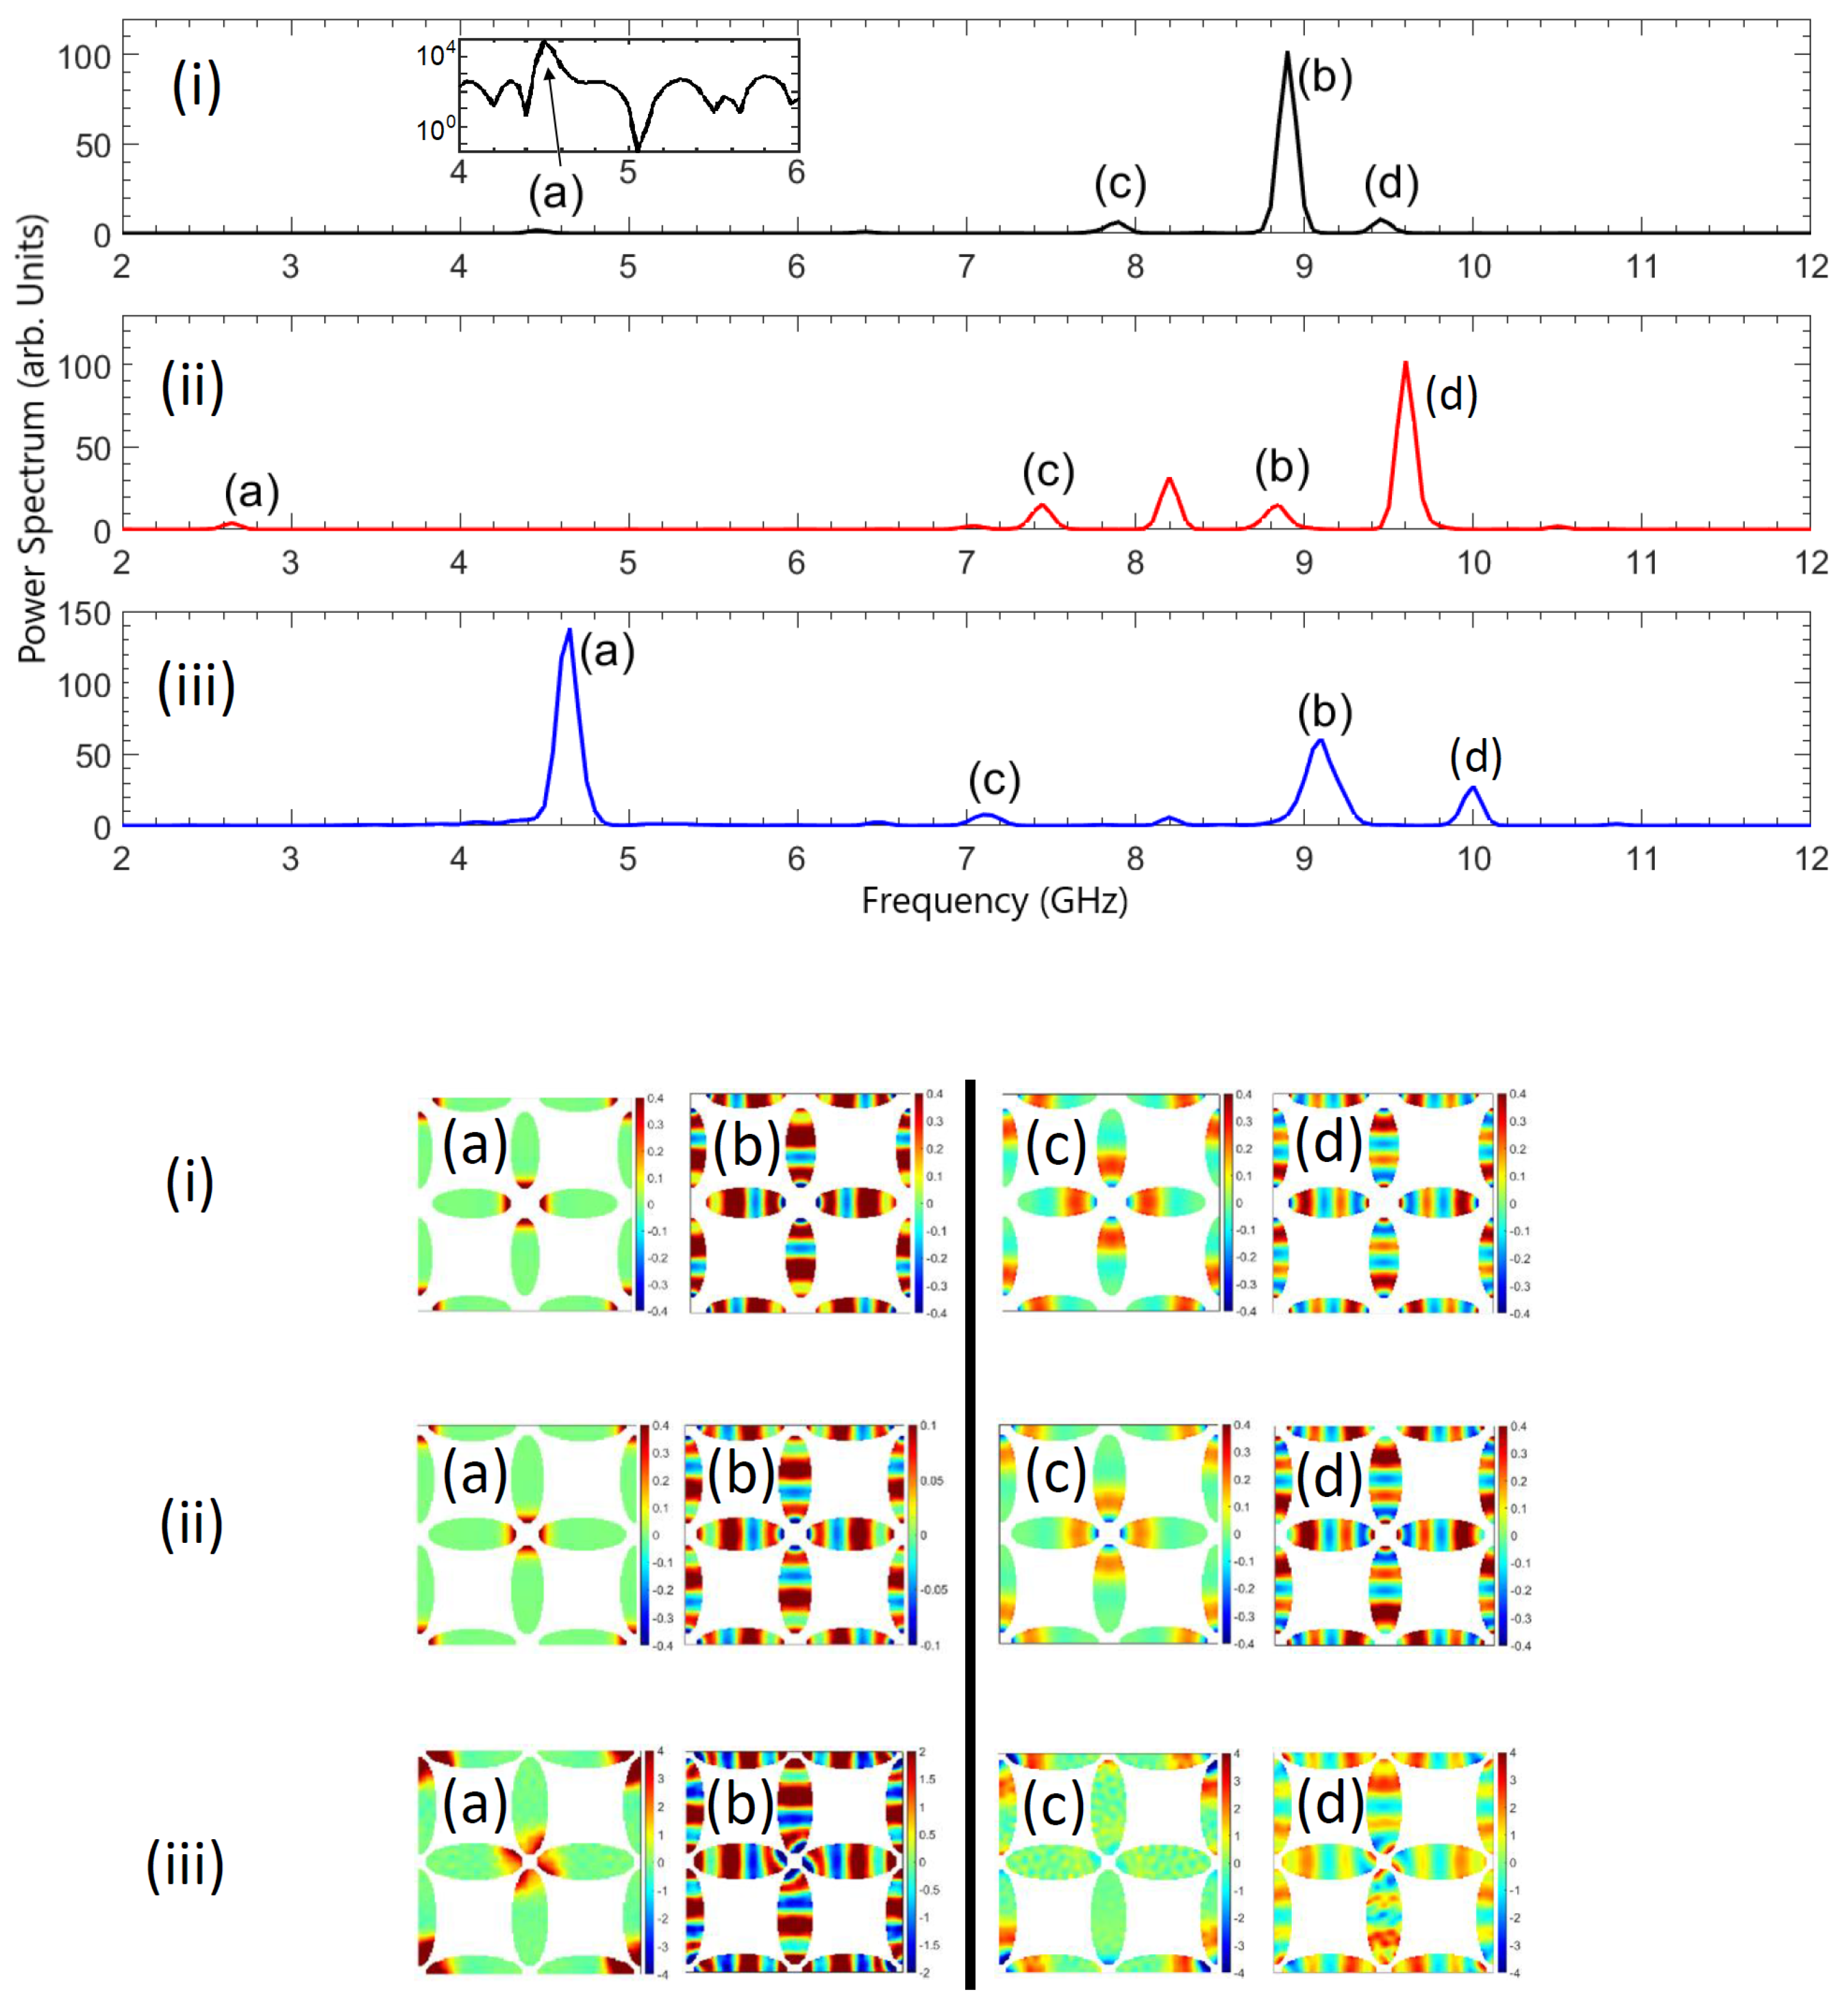
In a network where the elements are elliptical macrospins, the main modes ruling the power spectra and the dynamics are essentially two: the edge mode (EM, uniform and localized at the edge of an ellipse, and possibly forming a vertex mode in a lattice [30]; the fundamental bulk mode (FM), which, due to the elongated, non-ellipsoidal shape of the island, shows a non-uniform profile with a change of phase in the proximity of the macrospin center. The intensity in the spectra of the FM is always high, since this mode involves the most part of the magnetization in the ASI elements, while the intensity of the EM is always rather smaller, or even barley appreciable, because the precession of the magnetic moments has significant amplitude only in a narrow area close to the macrospin ends. This effect appears even exaggerated in the calculations (based on a single primitive cell): in the real experiment, the relative height among the peaks can change, first because large arrays of many ASI vertices are involved (each inevitably different from the other), second because the cross section specific to the measurement method can modify the relative intensity among the peaks [38,39,40]. Being uniform, despite localized, the EM is important and in the following we will show the position of the mode in the spectra even when barely appreciable. Even though we show the plots in linear scale to simulate the possible real spectra, in order to detect such tiny peaks we suggest a logarithmic plot, as we show, as an illustrative example, in the inset of Figure 2i.
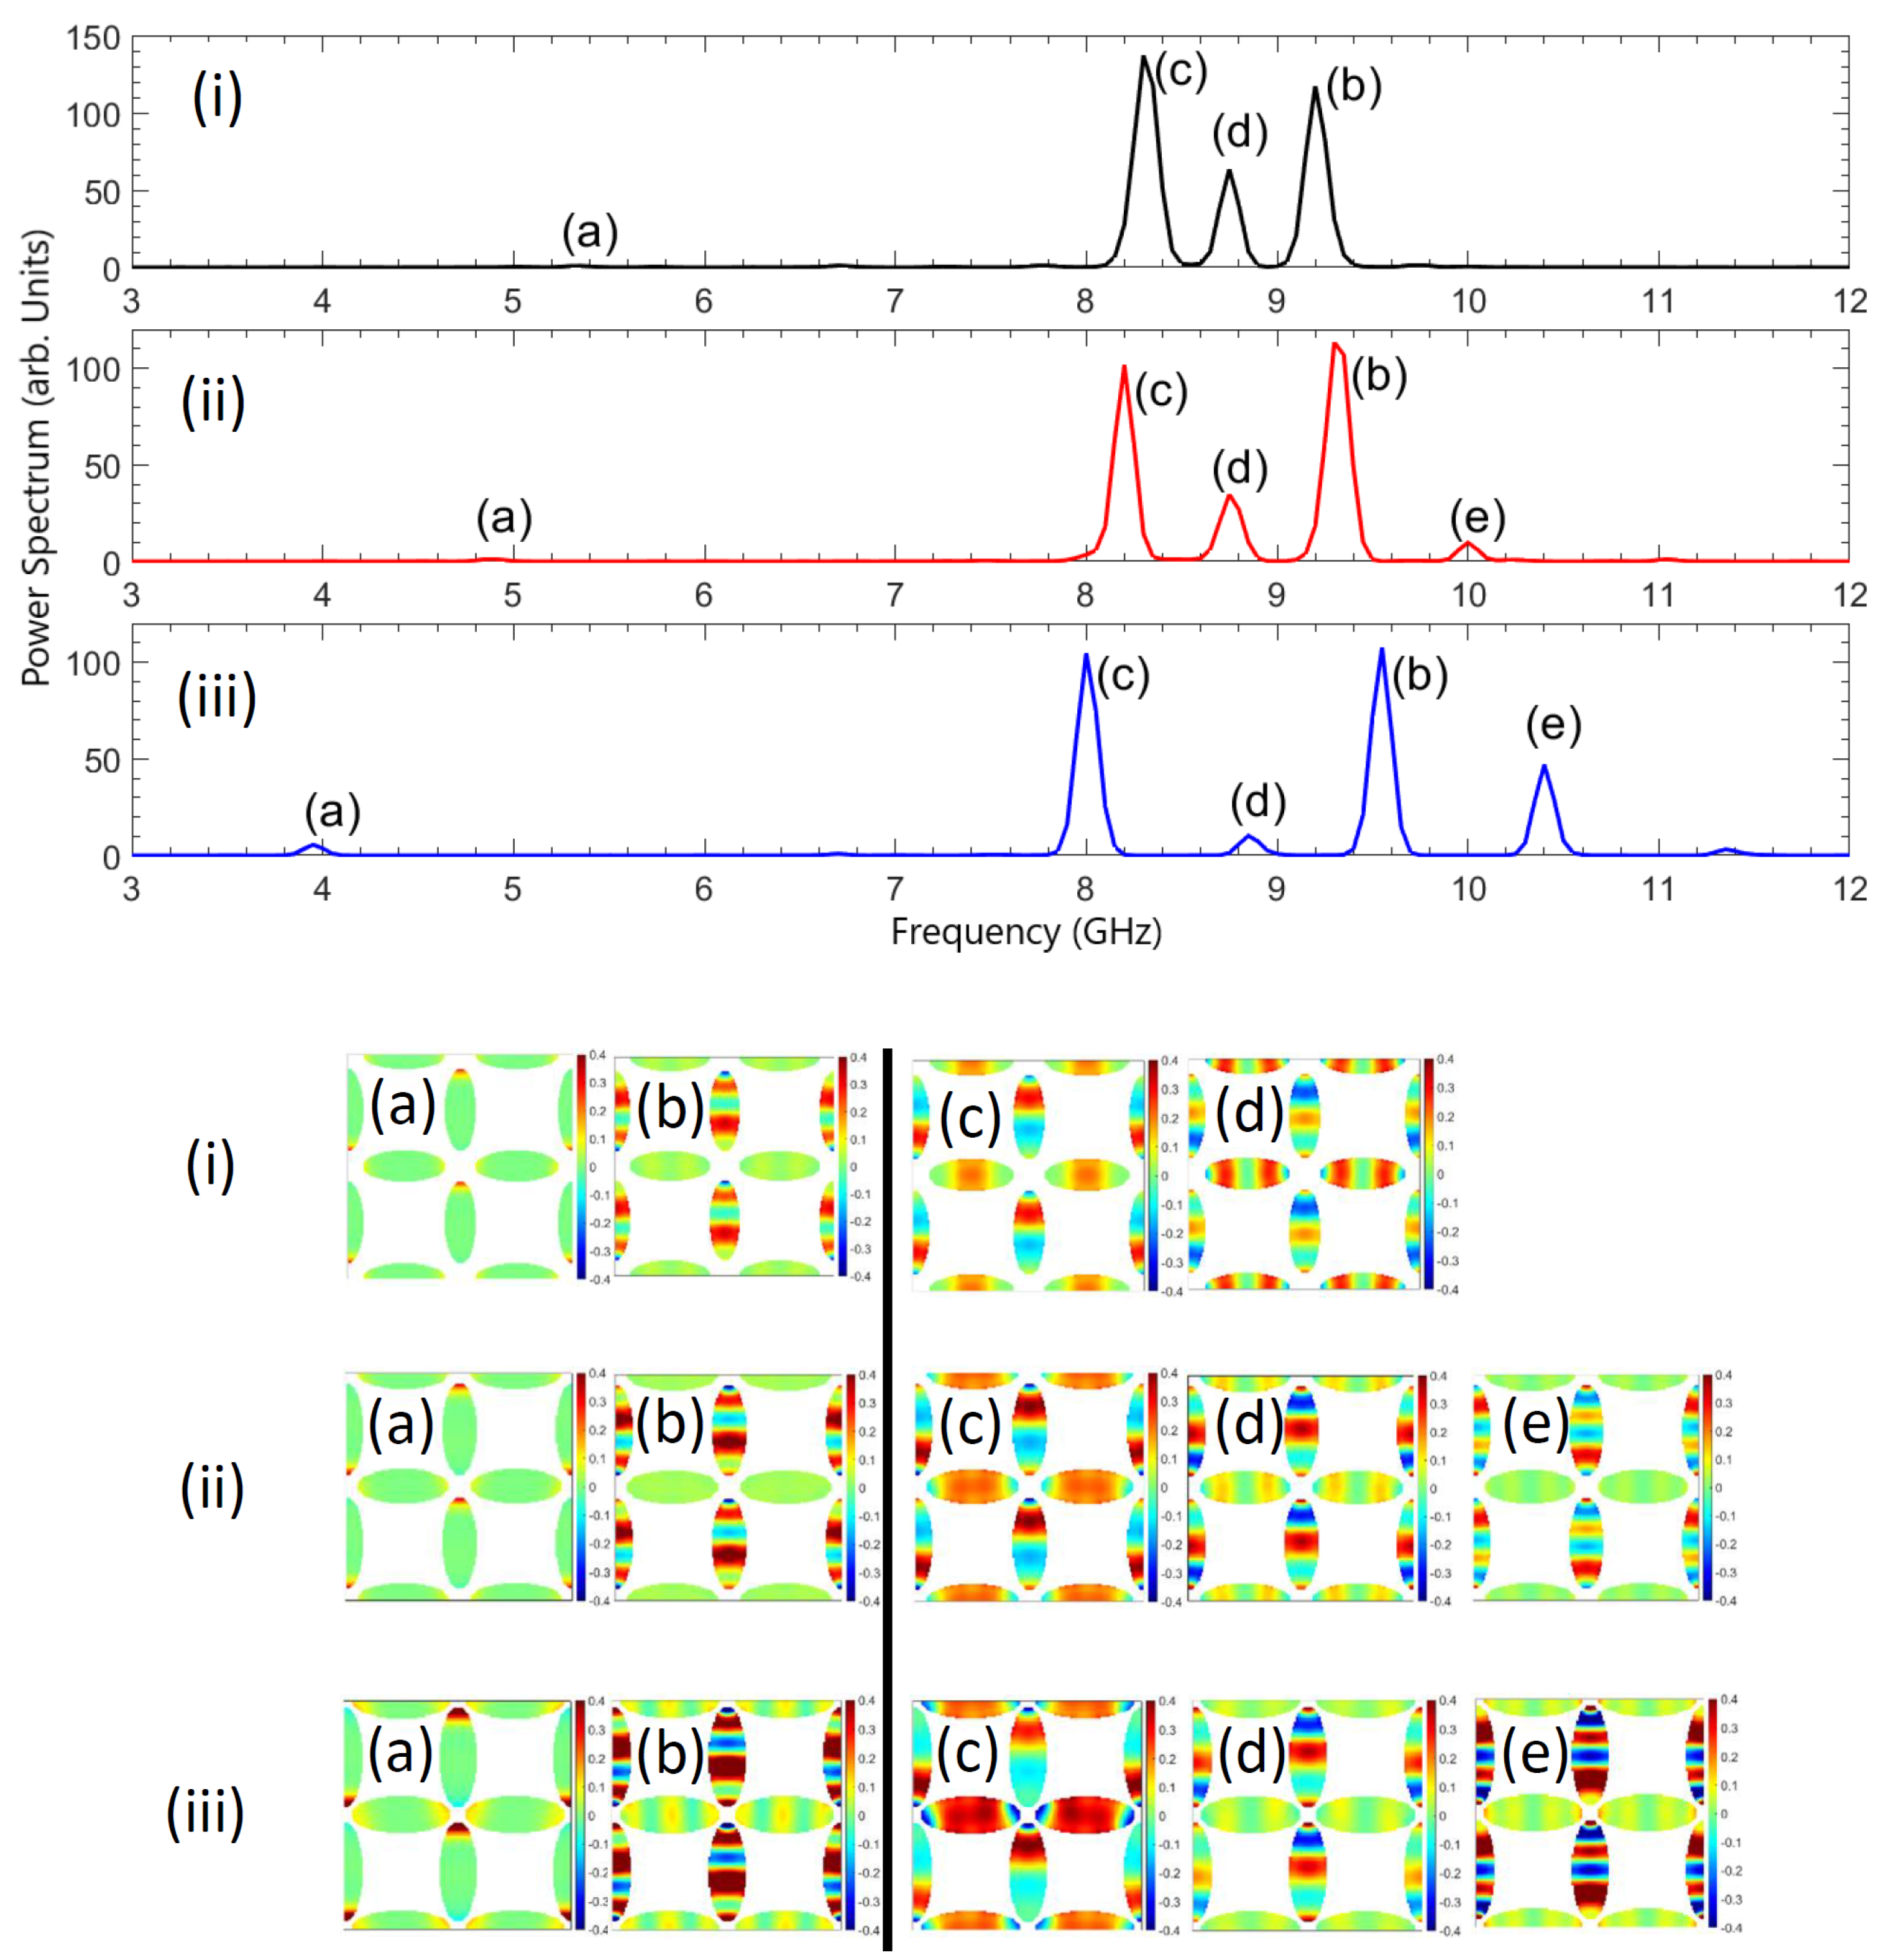
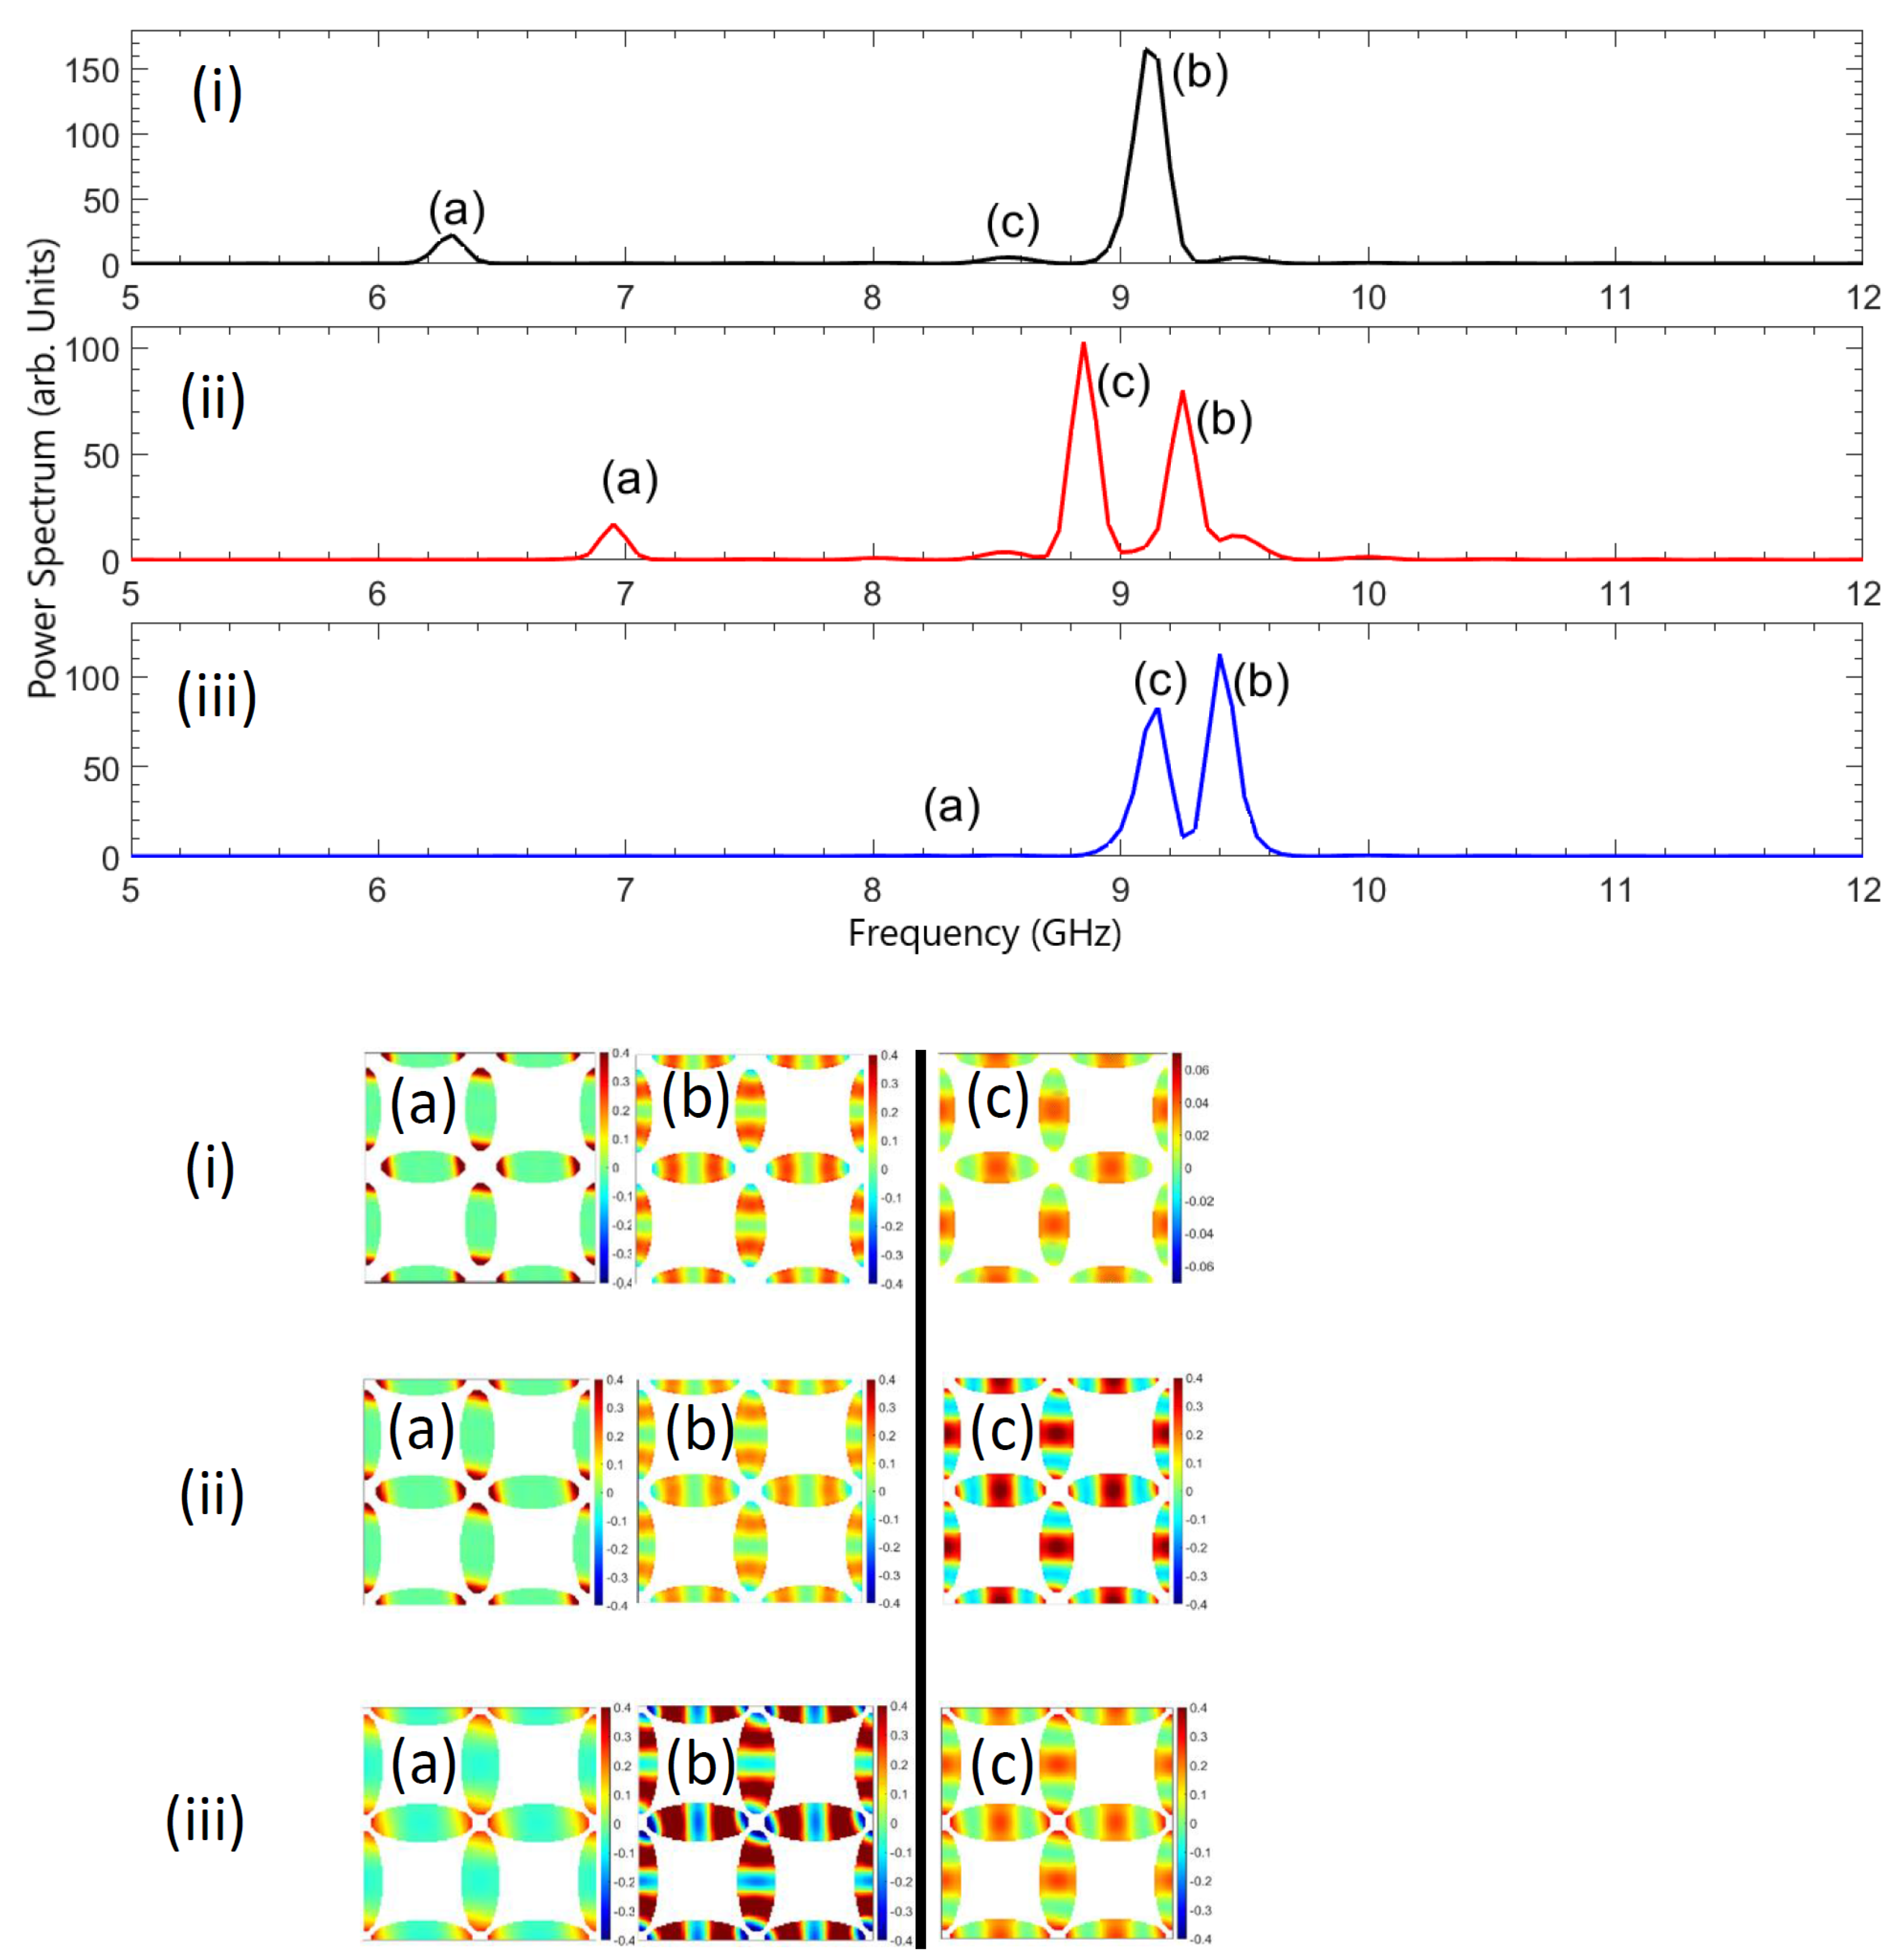
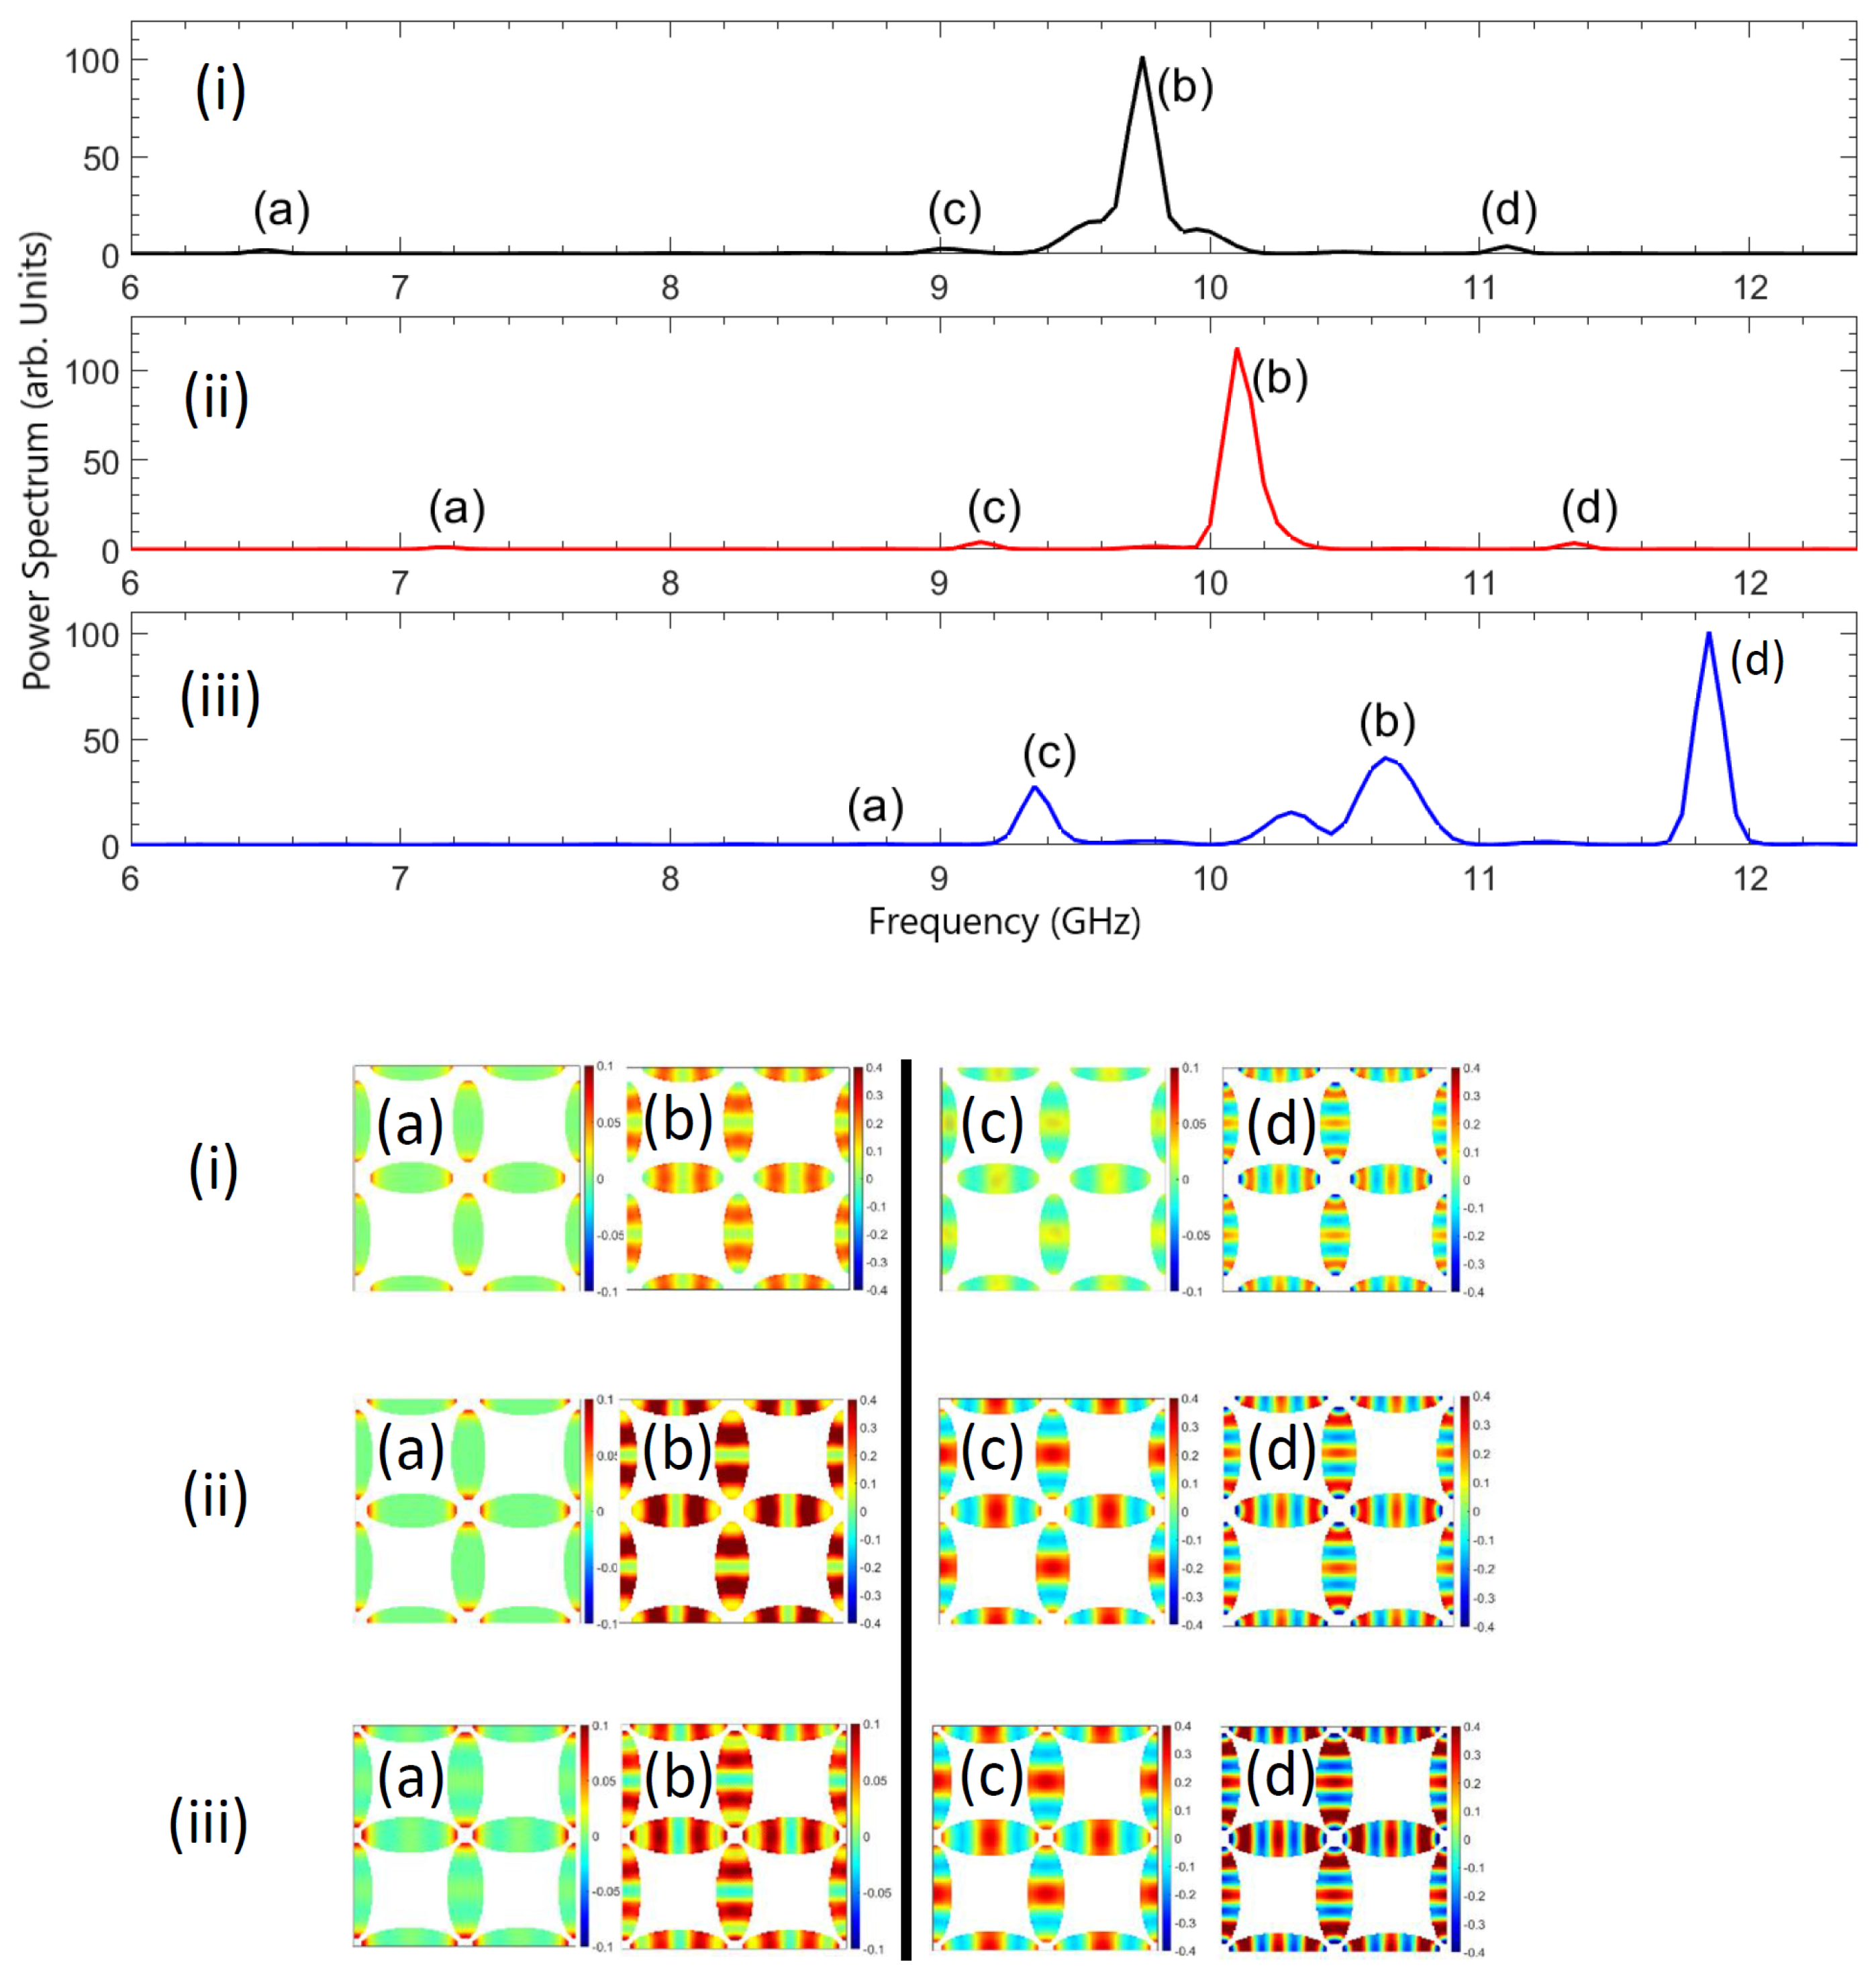
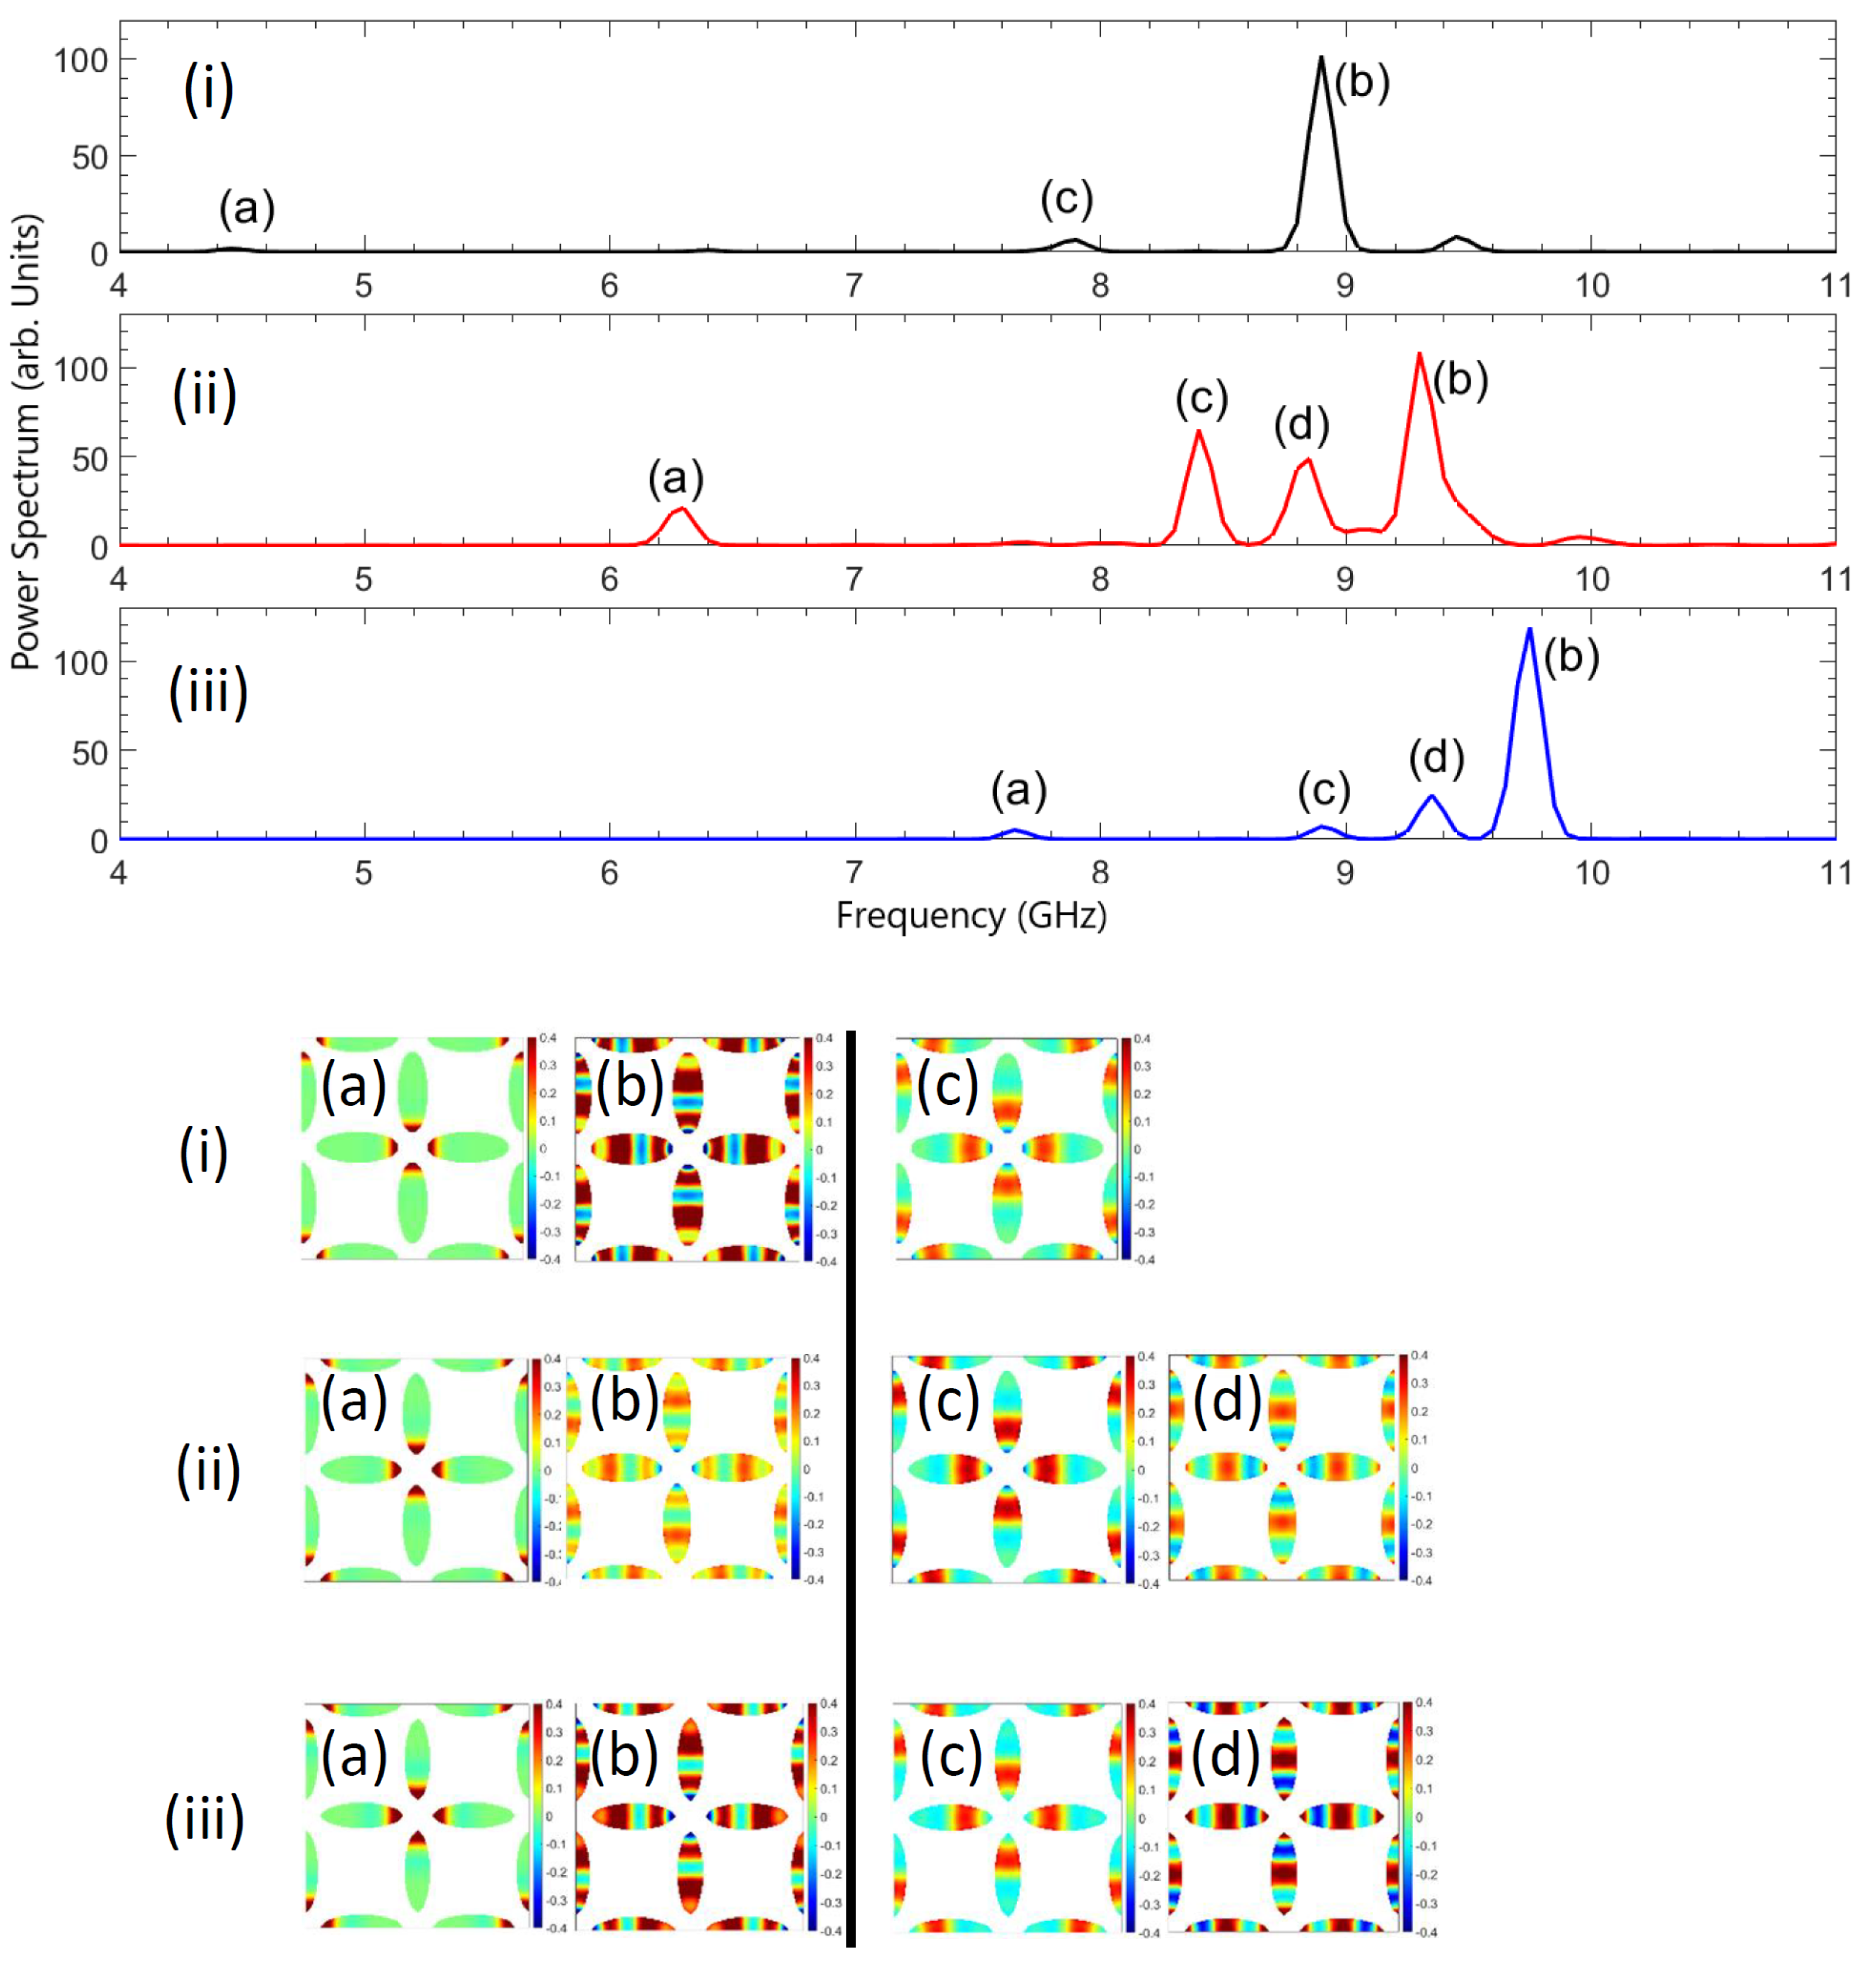
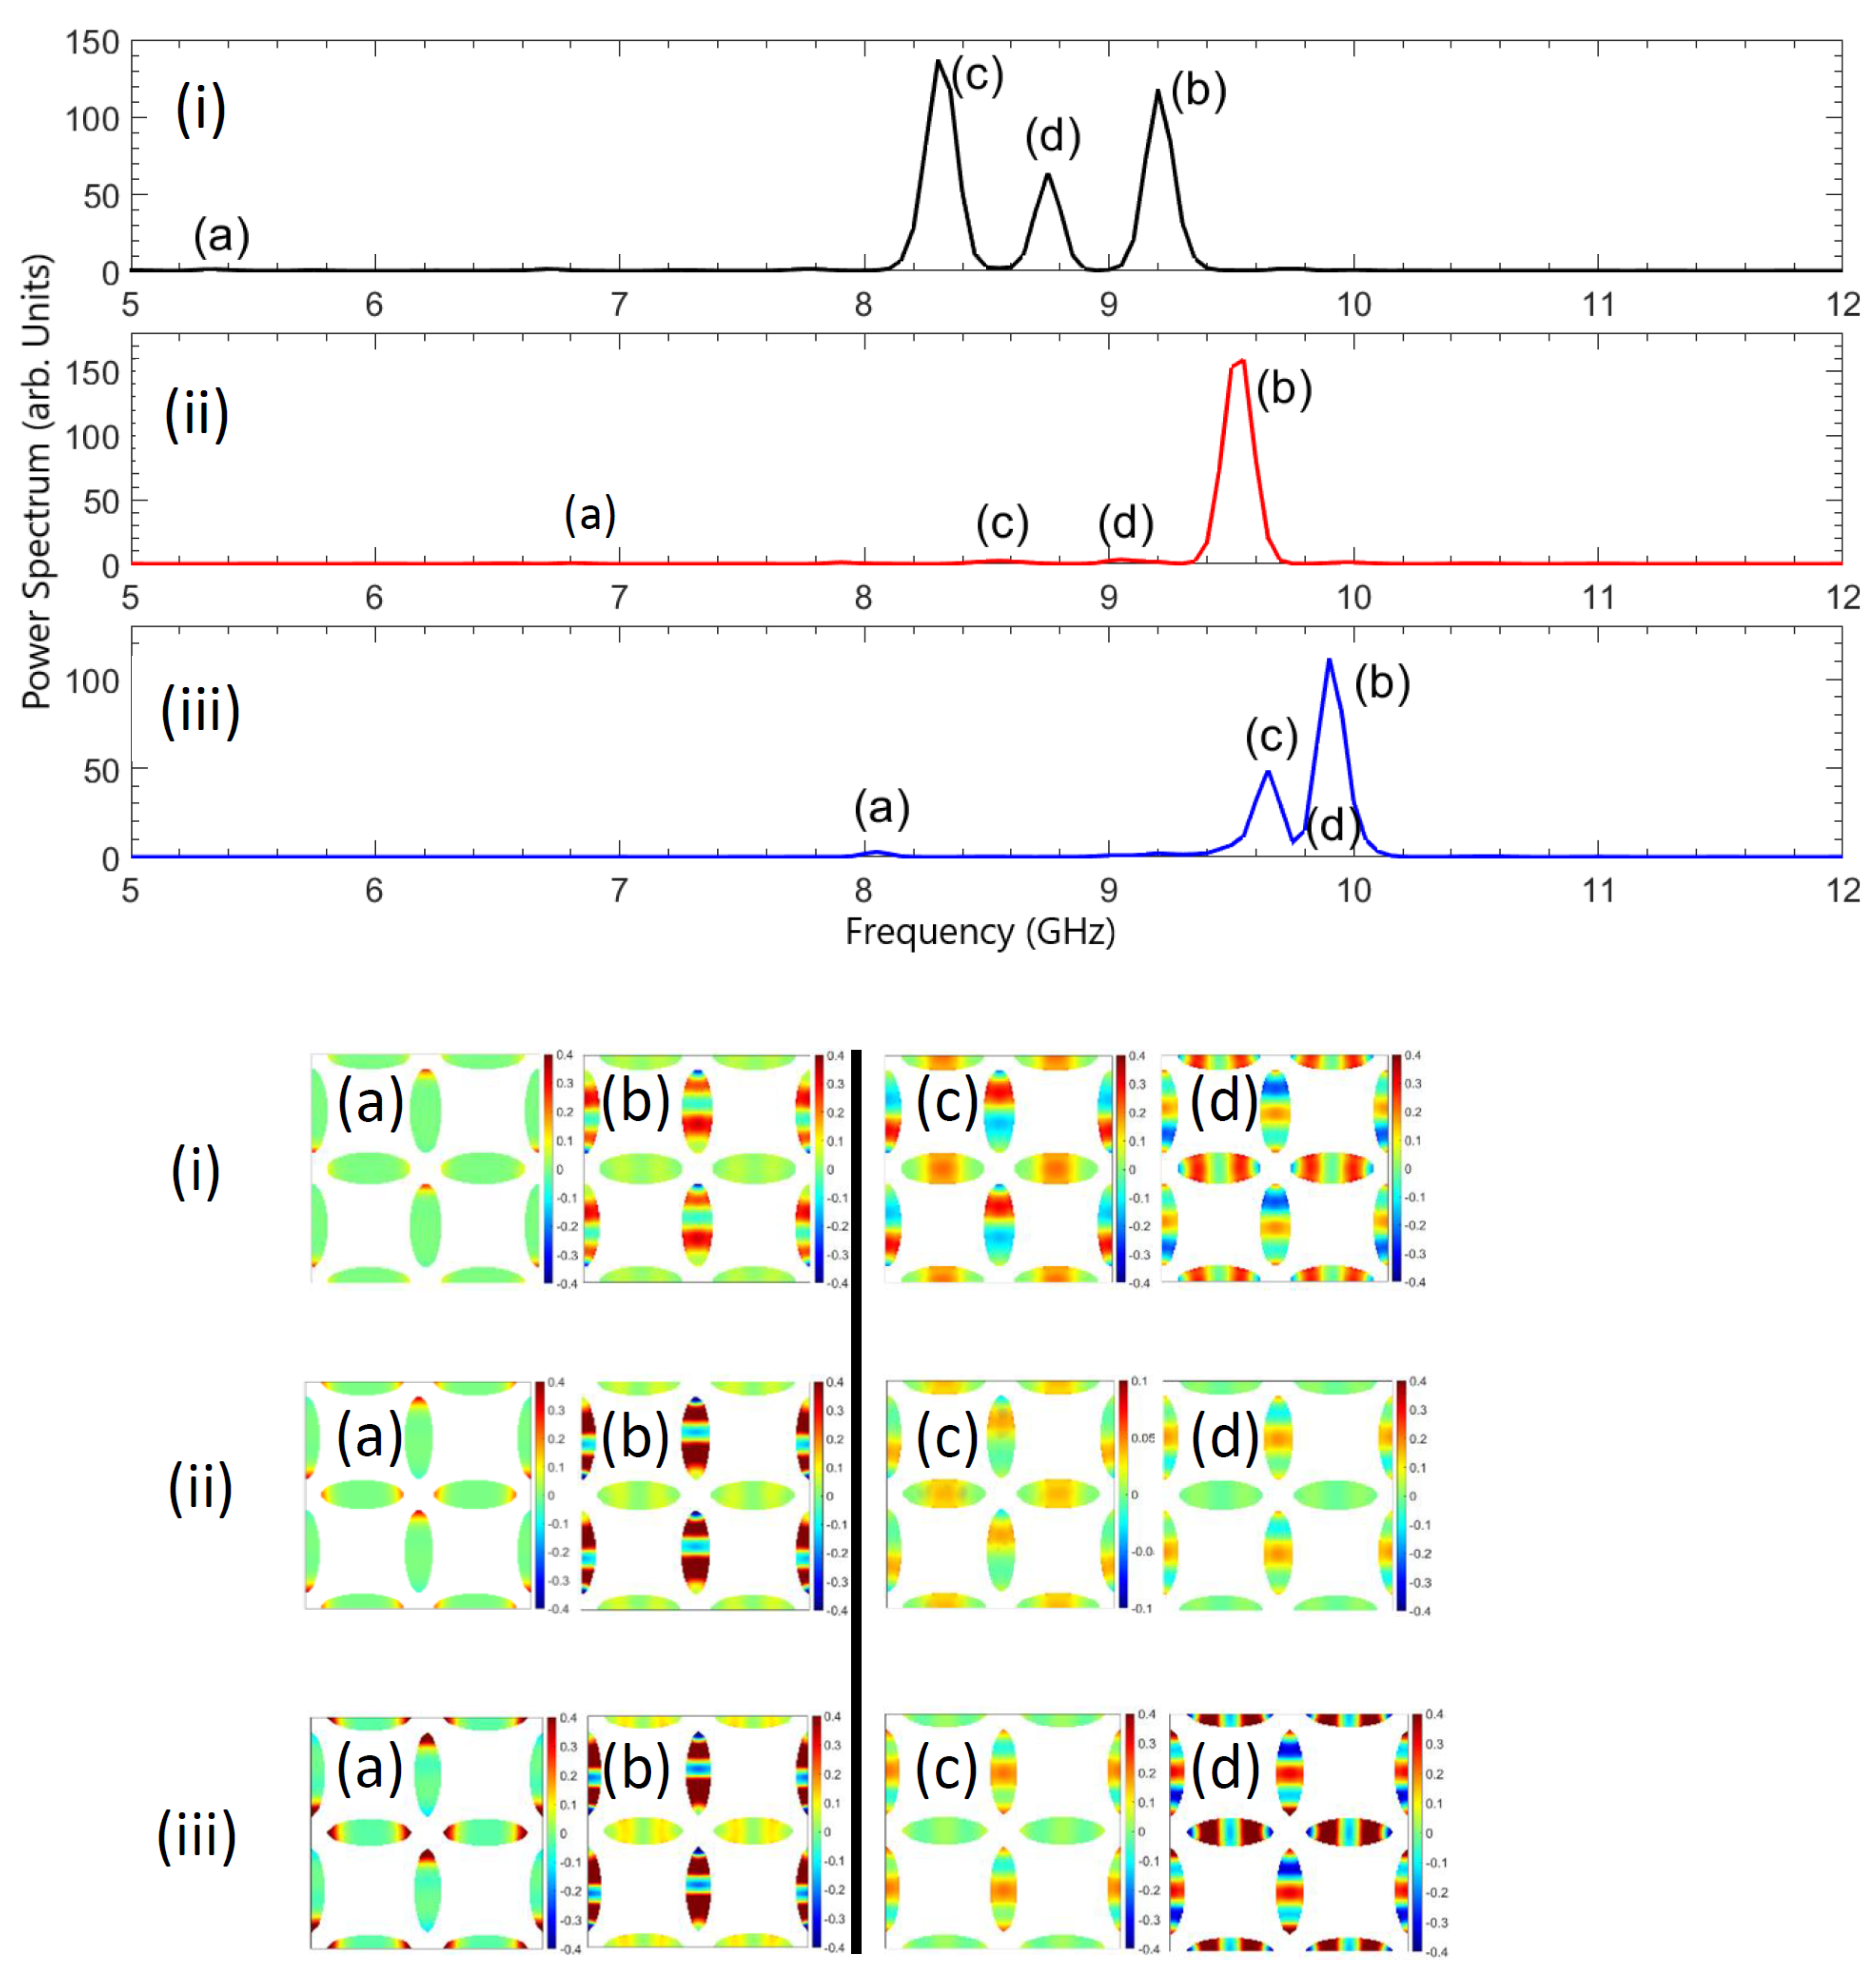
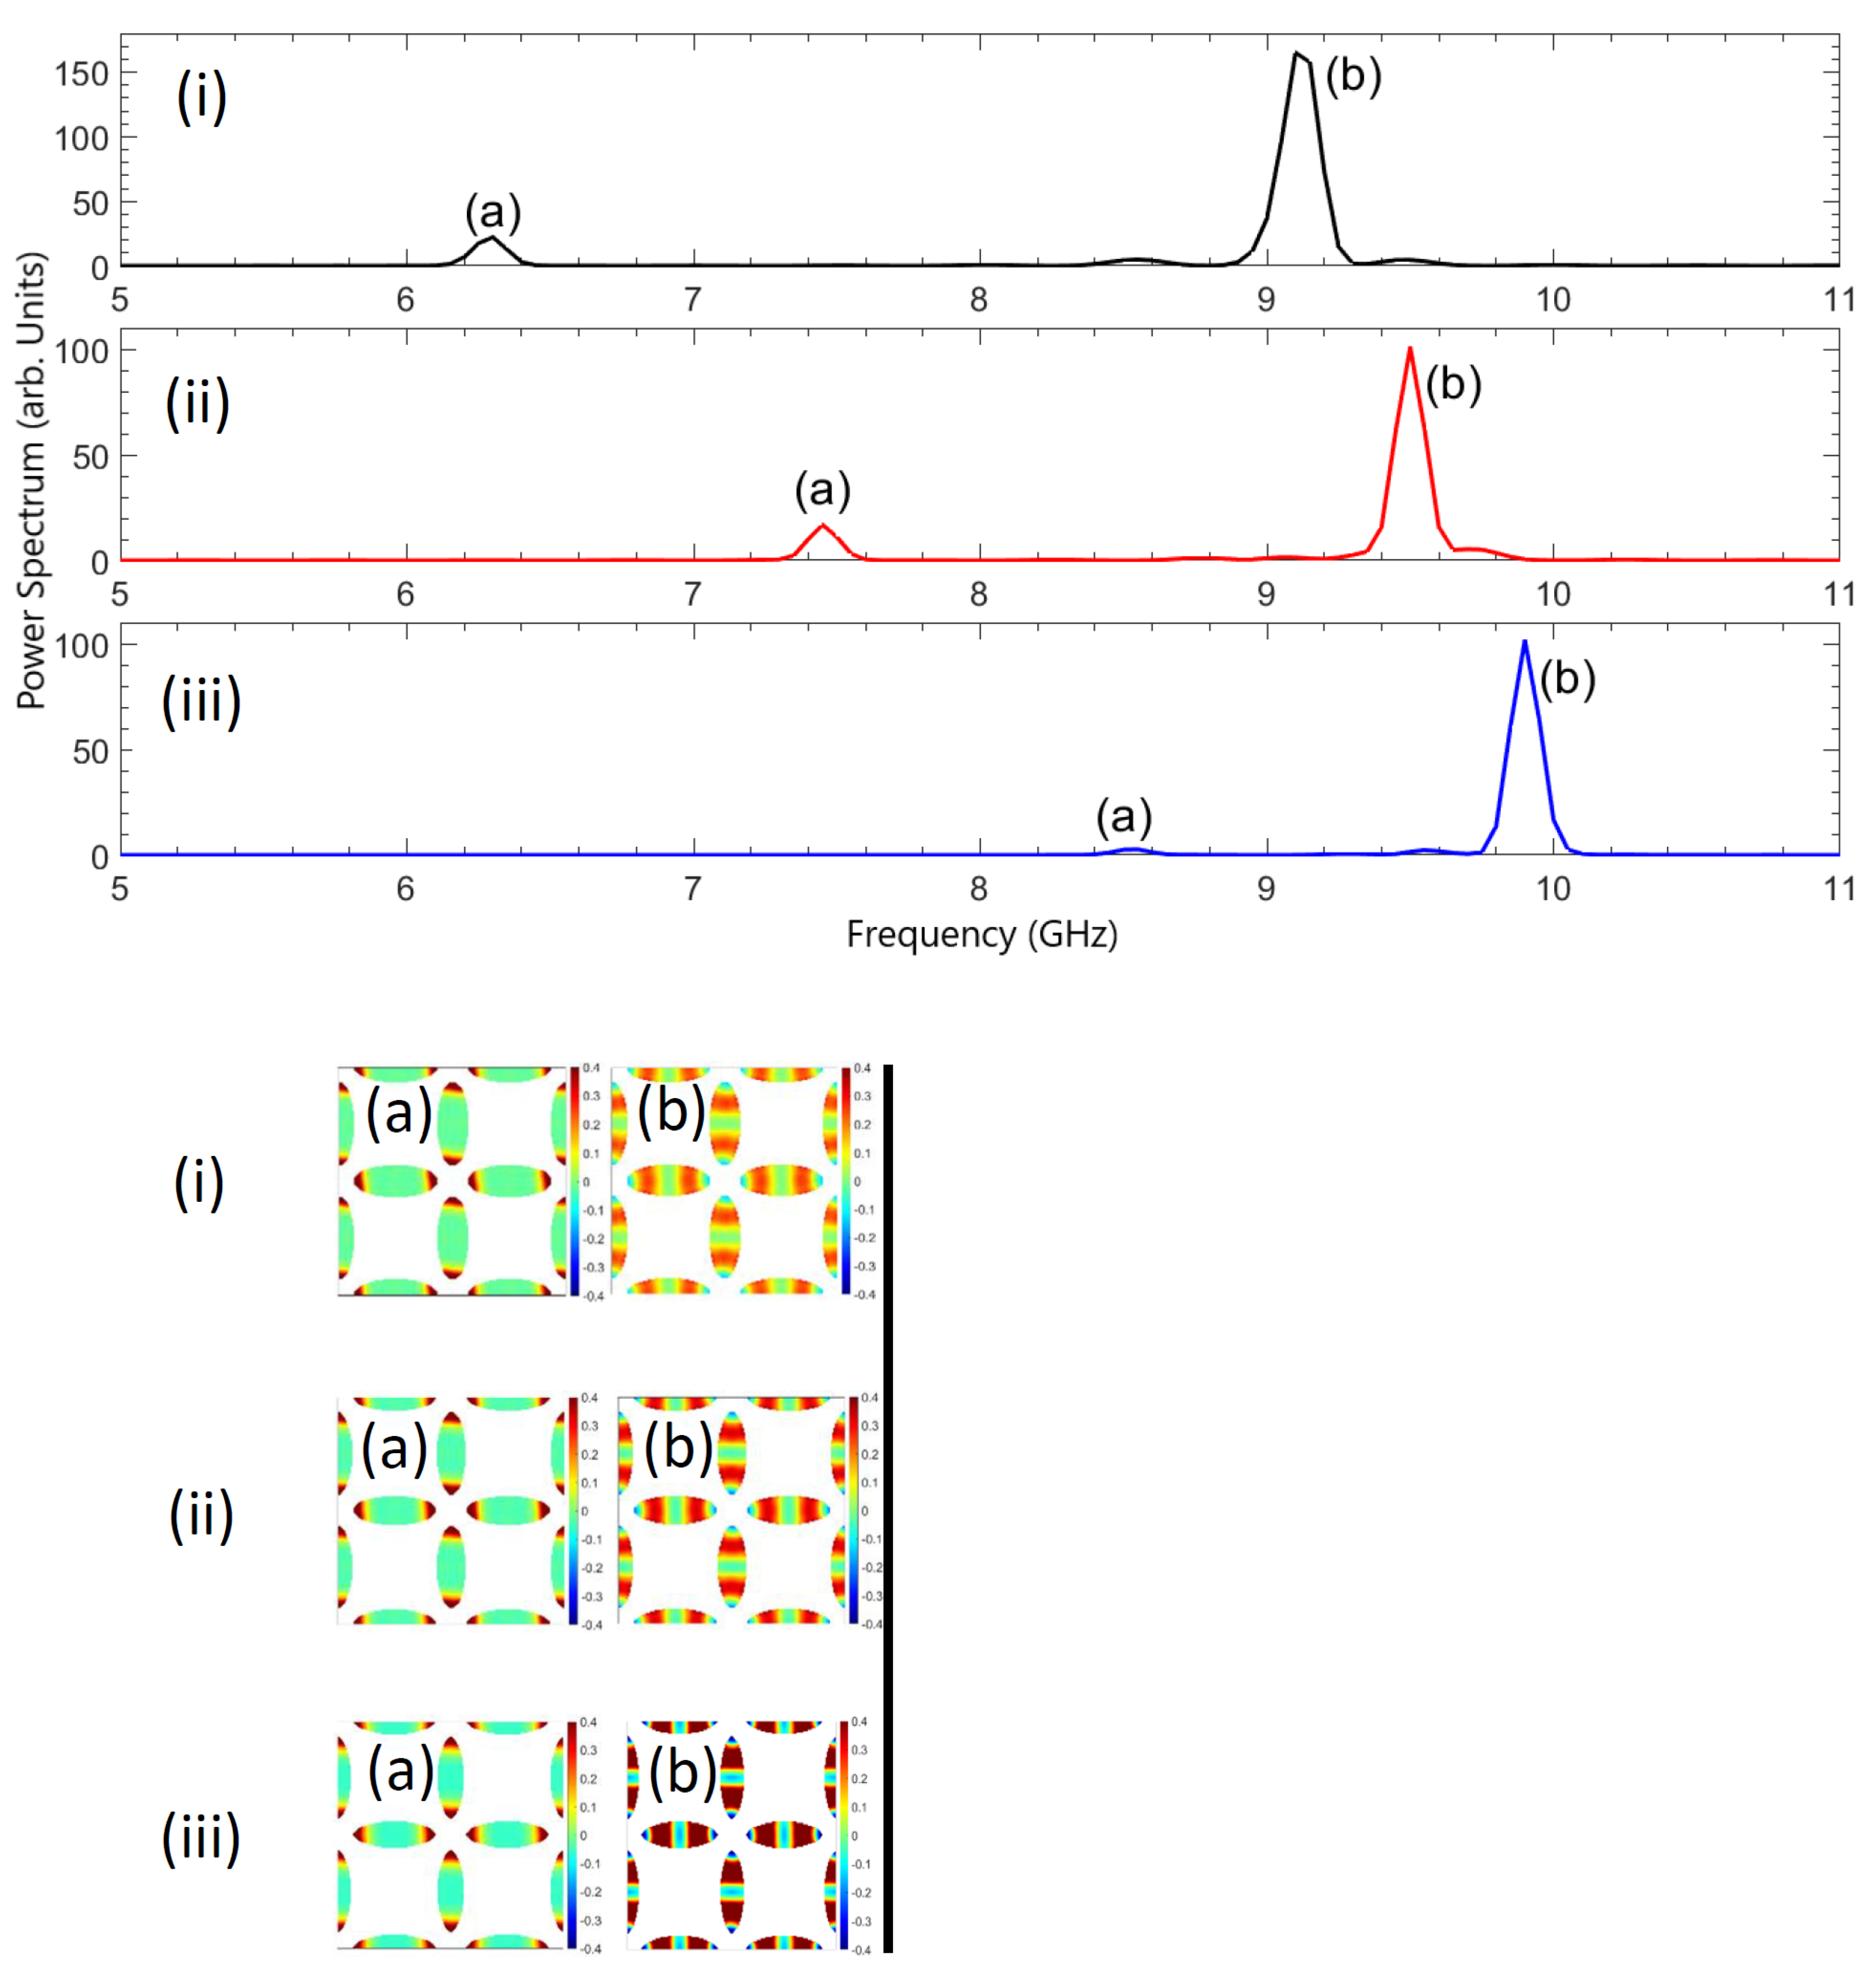
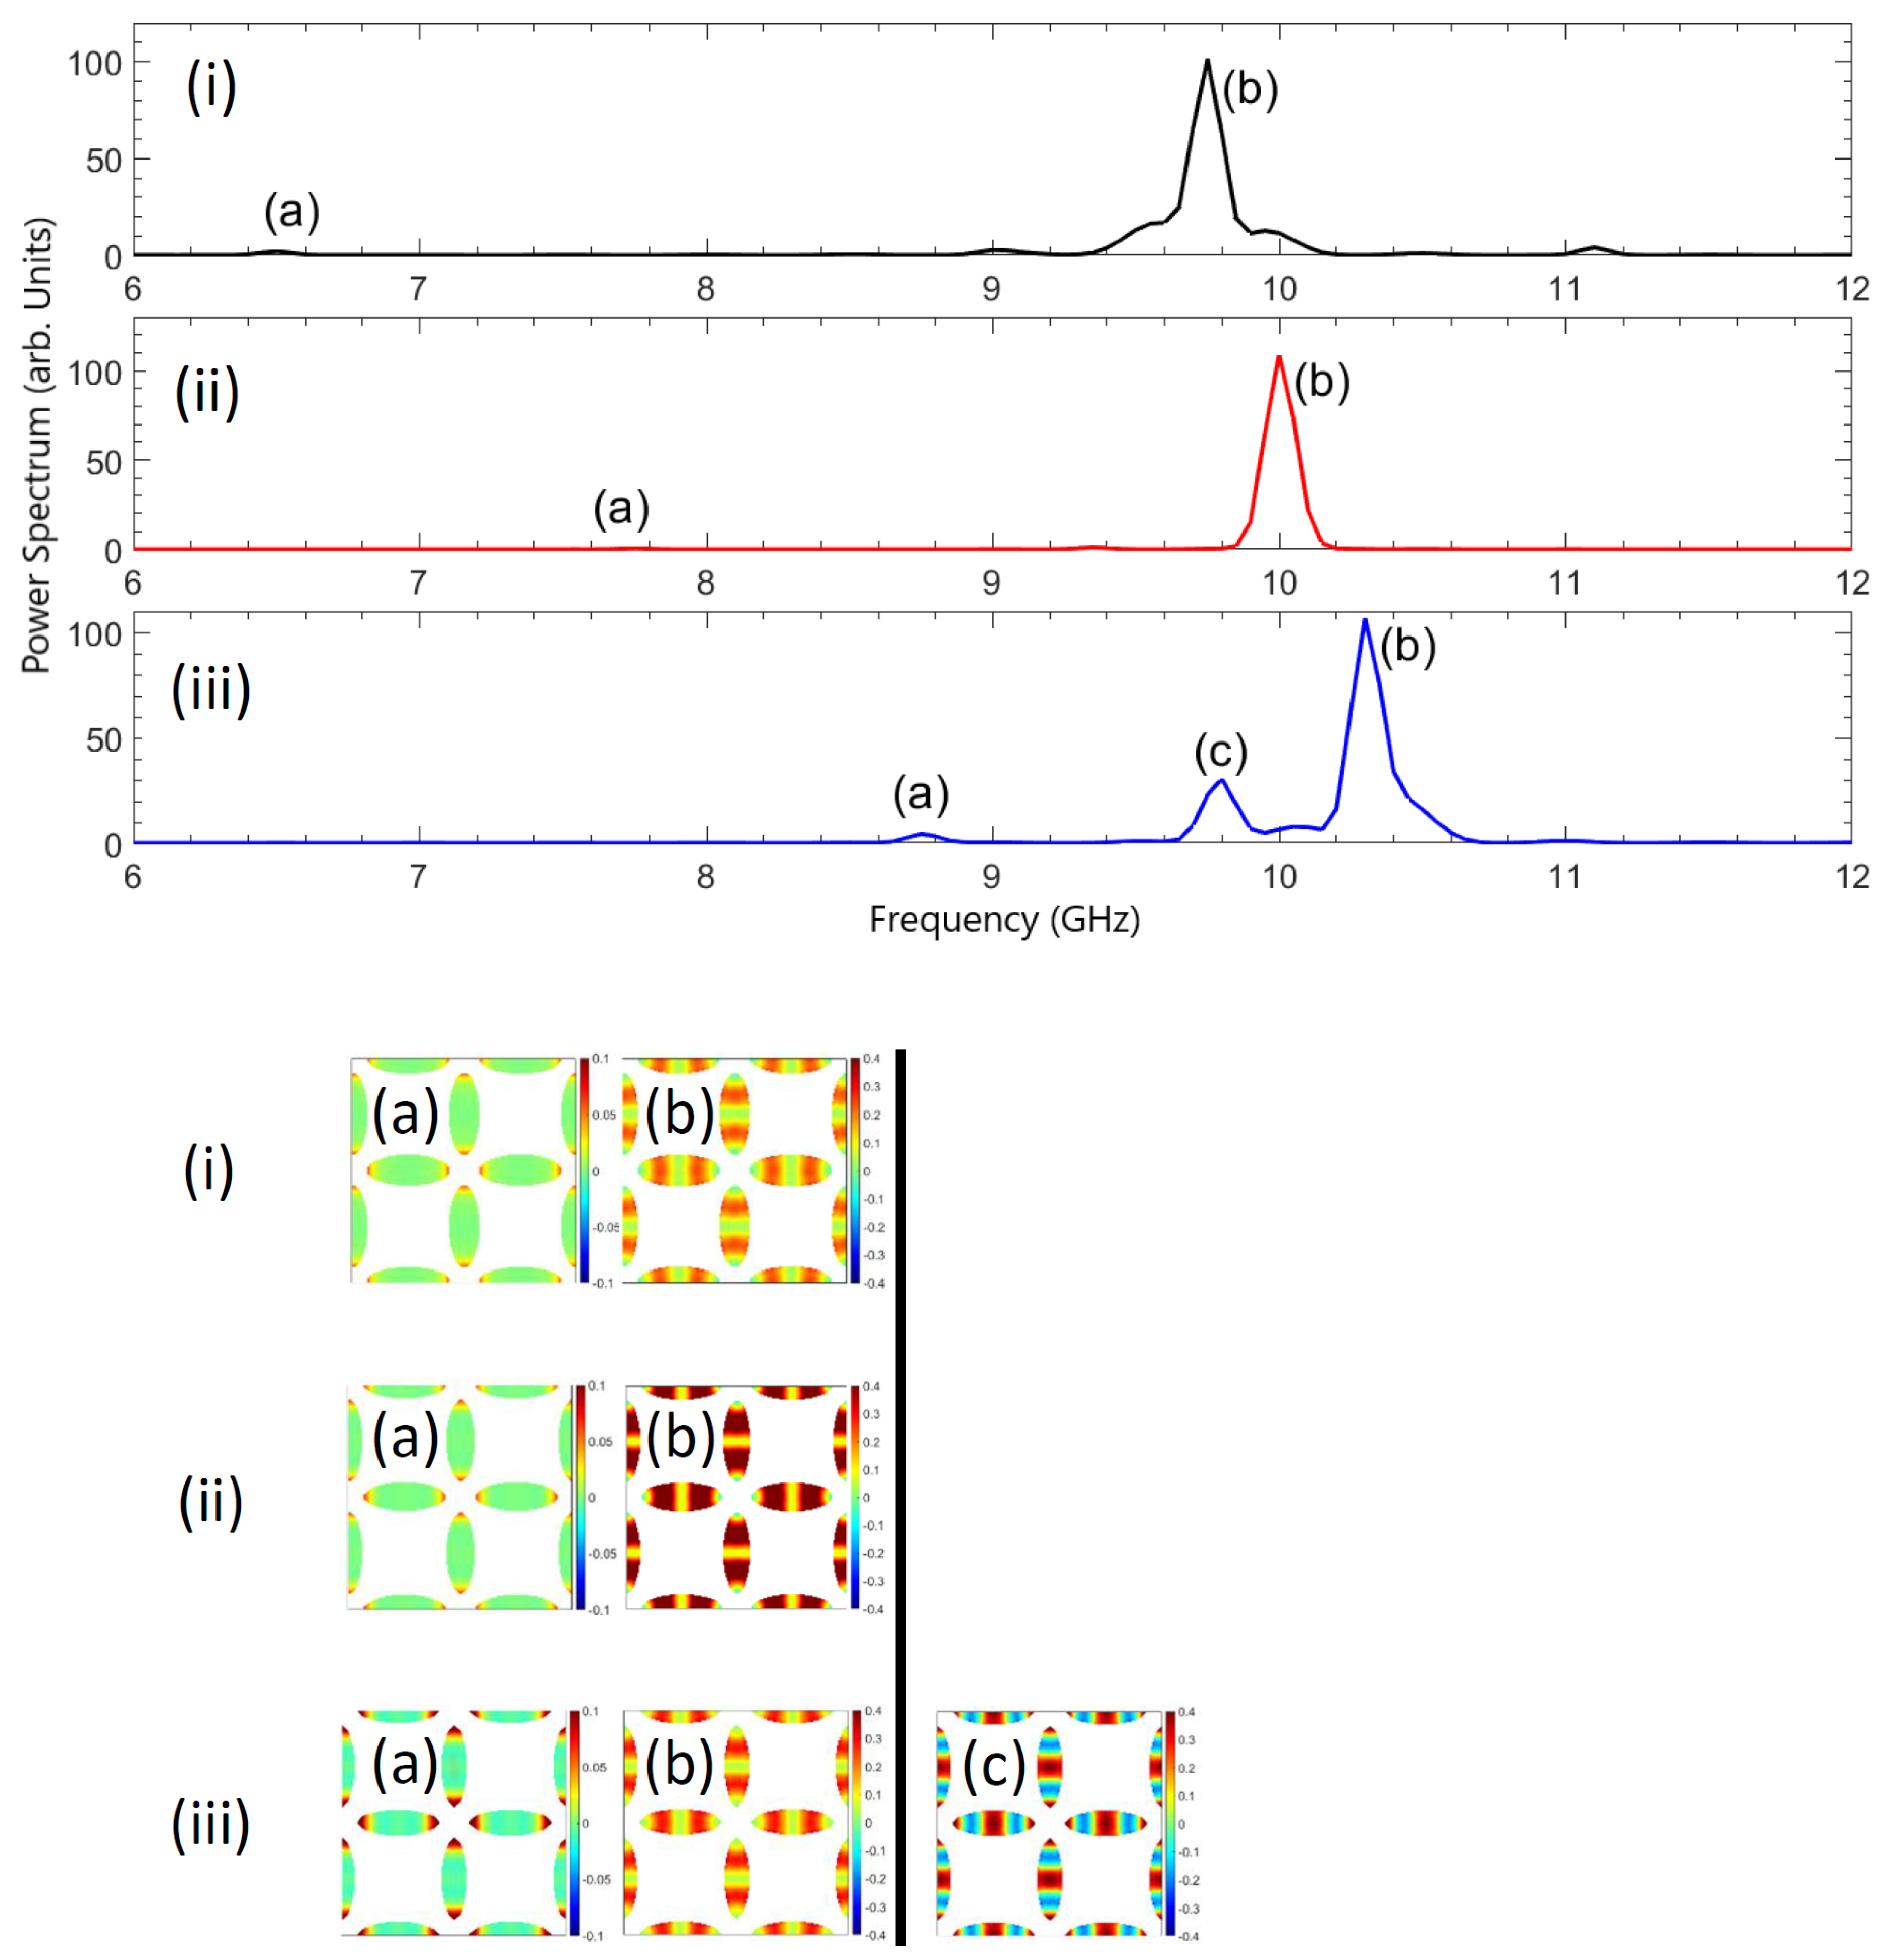
We can occasionally have other high order modes, appearing in the spectra as side-peaks. Their space profiles have nodal lines perpendicular to the direction of the magnetization (said backward-like modes) [38]: a few profiles are shown as an example in insets (c), (d) and (e) of Figure 2, Figures 6–8 and 10–13. The presence of out-of-phase amplitude regions (due to the nodes) makes their intensity lower than that of the FM. Exceptions are due to either mode mixing (e.g., mode (c) in Figure 6, which is a superposition of a fundamental mode for the horizontal macrospins and a higher order mode in the vertical macrospins) or computation artifacts, which can give non-physical high intensities to higher order modes, like peak (d) in Figure 2 (panel ii), peak (e) in Figure 6 (panel iii) or peak (d) in Figure 8 (panel iii). We recall that in a real ASI lattice, the inevitably difference of shape at the edges, from macrospin to macrospin, makes it unrealistic that any intensity could sum up to make a corresponding large peak at a same precise frequency. Being hardly detectable in real experiments, these high order modes are less interesting for the dynamics, hence we just show aside each figure only a few exemplifying profiles for completeness, together with little information in the corresponding caption, but will not discuss them any further.
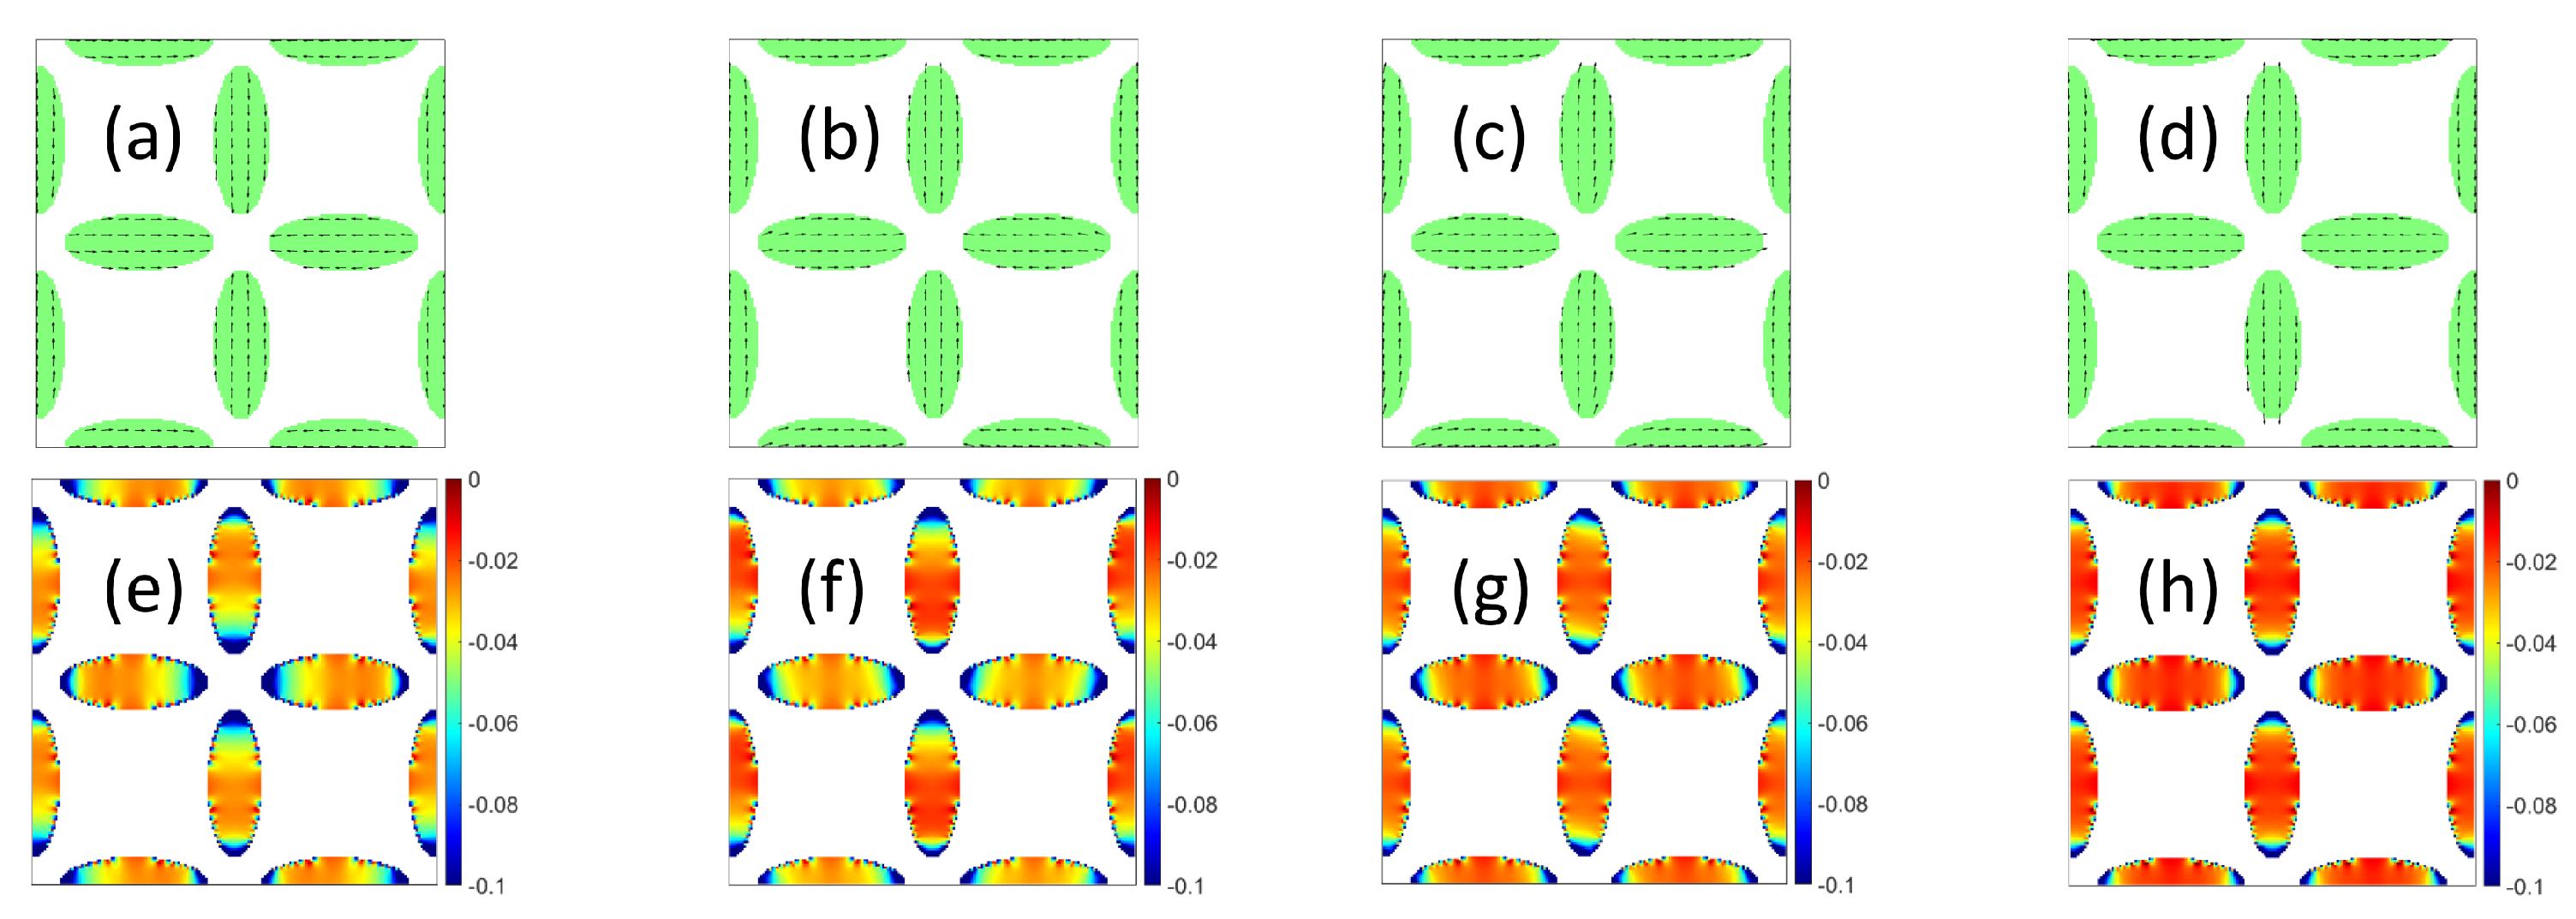
In Figure 4e–h we show the space profiles of B eff in the four chosen microstates. We recall that in general, the internal effective field is the sum of the external field B 0 with the exchange B ex and demagnetizing B dem fields generated by the magnetic moments of the medium, hence:
B eff = B 0 | B dem | + B ex
and since in our case B 0 = 0 , and in general B ex < < | B dem | , we get:
B eff = | B dem | + B ex < 0
which justifies the negative values in the plots. We recall how the EM and FM can be seen as the fundamental modes in the region where they happen to be localized.

3.1. Footprints of the Microstate on the Fundamental Mode

Before discussing the dynamics of each microstate, we illustrate the modification of the space profile of the fundamental mode as a function of the type of ASI microstate and strength of the lattice interaction.
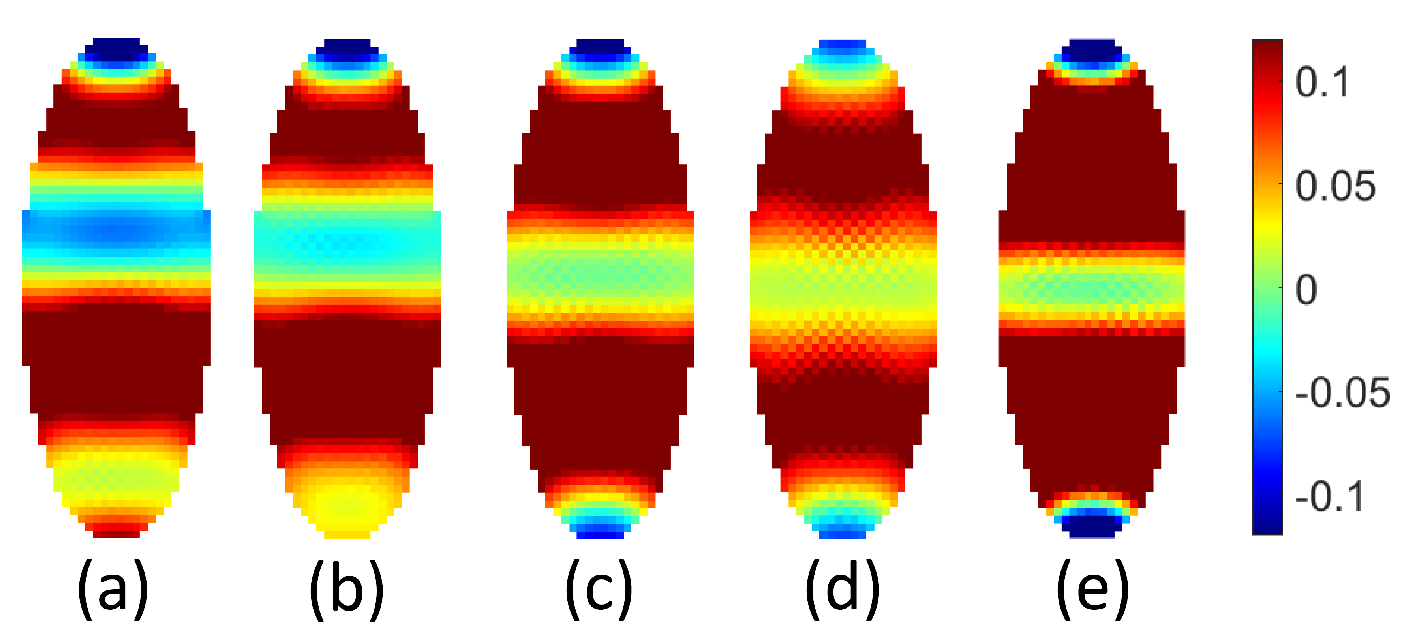
In Figure 3 we show the profiles of the fundamental modes (FM) in the four studied microstates, each corresponding to the magnetization distribution shown in Figure 4a–d. Note that mode profiles of Figure 3c,d are similar in the bulk of the ellipses, but different at the edges, where a curling of the nodal lines is observed only in (c), following the similar curling of the magnetic flux lines in microstate 2N2S (Figure 4c), where the like poles are side-by-side. On the contrary, in the Vortex state (Figure 4d) the like poles are face-forward: this preserves a straight distribution of the magnetization at the edges. We also observe that the profile of the FM in the 4N microstate is not symmetric with respect to the ellipse (Figure 3a), but the nodal lines are definitely shifted toward the ASI vertices where the magnetization divergence has the largest magnitude (phase asymmetry). This effect is less pronounced in the 3N1S microstate, and completely absent in the 2N2S and Vortex microstates (Figure 3c–d), which apparently links the shift to the type of vertex (or effective magnetic charge q eff = d i v M × V , where V is the volume). At the same time, we observe how the profile of B eff in Figure 4e is likewise asymmetric, with larger values far from the 4N vertex, and lower values close to the 4N vertex: it is just within these lower values that the FM profile shows the nodal lines and the out-of-phase oscillation. In fact, B eff rules the precession motion and the frequency of the modes.
To prove the dependence of this subtle effect on the lattice interaction symmetry and intensity, we calculated the mode profile at increasing values of the spacer between adjacent macrospins, with reference to Figure 5, (a) s = 96 nm, (b) s = 128 nm, (c) s = 256 nm, (d) s = 512 nm, and finally (e) s which means we did simulations on a single, isolated macrospin. As apparent from the figure, the phase asymmetry gradually decreases with increasing spacer up to disappearing for s (single macrospin). So, the asymmetric position of the nodes in the SW profile is also an indication of the strength of the lattice interaction, besides the microstate type.
We speculate that, at least in principle, it may be possible to gain experimental information about the vertex type (i.e., the static orientation of the macrospin magnetization) by a dynamic local measurement, which can map the exact position of the SW nodes across the macrospin, as for example by microfocus BLS in the so called BLS microscopy imaging [31,32,33,41,42].
We observe how the experimental validation of our predictions can substantiate an interesting application in the context of information processing: namely, the possibility of changing the dynamic properties of travelling spin waves by switching one or more macrospins at vertex, determining the vanishing of the signal in specific macrospins e.g., moving from a 4N to a 3N1S microstate, as in Figure 3a,b, or, for the fundamental mode, determining a phase shift from the center to the ends of specific macrospins, e.g., in moving from a Vortex to a 4N microstate, as in Figure 3a,d. The last effect might be particularly useful in spin wave interferometry [43,44,45], where the relative phase displacement between two travelling spin waves plays a crucial role. We outline a simple possible experiment realizing this effect. We consider an interferometer where two Bloch waves are travelling along two distinct ASI waveguides, one with microstate 4N, the other with microstate 2N2S: hence, one wave has cell function (a) of Figure 3, the other wave has cell function (c) of the same figure. When driven to interfere in a same region, these waves give an overall vanishing signal (logic level 0) in the center of each macrospin, where the spin waves are out-of-phase. However, if a field is applied so that in the first waveguide the 4N microstate switches to a 2N2S, and then the field is removed, the two interfering Bloch waves would be in-phase and their amplitudes would sum up to give a large signal (logic level 1). This is at the basis of every SW-based device, either for logic or sensing purposes.

3.2. Main Effects in the Spectra Due to the Different Vertex Configurations

We can order the microstates as 4N, 3N1S, 2N2S, Vortex, namely from the one containing the maximum charge (4N) to those containing only zero charge vertices (2N2S and Vortex). In general, comparing the corresponding panels (say, panel i) in Figure 2, Figure 6, Figure 7 and Figure 8 we see that the EM increases its frequency moving from the 4N configuration to 3N1S, to 2N2S and Vortex (zero magnetic charge at vertex), simply as a consequence of the curling of the magnetization at the edges caused by the increasing presence of poles of opposite sign at the vertices (i.e., the decrease of the effective charge at vertex). This curling increases the stability and hence the stiffness of the magnetization against the precession motion: for this reason, the frequency increases.
We examined the results as a function either of the distance (spacer) between adjacent macrospins (which is a measure of lattice interaction) or the aspect ratio (which is illustrative of any, not only shape, anisotropy).

3.2.1. Lattice Interaction and SW Profile

The lattice interaction strength modifies the SW frequency and also, as remarked above, the space profile of the SW modes: as a consequence, in the spectra the position and height of the peaks change, and we investigate the possibility of drawing a bi-univocal correspondence between spectrum appearance and underlying ASI microstate.
We studied three situations, which can provide the functional trend, reducing the spacer s between adjacent and parallel macrospins, from s = 96 nm (i.e., 24 micromagnetic cells, mc) to 64 nm (16 mc) and to 40 nm (10 mc). Clearly, in reducing the spacer at a fixed macrospin size, the primitive cell becomes progressively smaller. As apparent from the spectra in Figure 2 and Figure 6 in the two microstates 4N and 3N1S, we see a frequency decrease for the EM [peak and profile marked with (a)] and a (light) increase for the FM [peak and profile marked with (b)] as the spacer is decreased. The progressive decrease of the EM frequency is interpreted as an increasing vertex instability due to the demagnetizing field, which in these two cases increases as the macrospin separation is decreased. In the 4N microstate however, when the spacer is reduced to 40 nm, the behavior is the opposite. In fact, we observe how this change of trend is accompanied by a change in the disposition of the nodal lines with respect to the magnetization flux lines: for s = 48 nm and 64 nm the disposition is perpendicular, for s = 40 nm it is oblique. At the same time, the magnetization flux lines are almost fully straight aligned independently of which macrospin: under our knowledge, this effect was not found nor discussed previously in literature (where nodal lines are either parallel or perpendicular to the local flux lines of the magnetization, and the corresponding modes are said backward-like or Damon-Eshbach-like) [46,47,48], and must have a dynamic origin and explanation, which is however outside the scope of the present paper. A decrease of the EM frequency is associated to an increasing instability of the underlying magnetization at the edges, which in turn is due to the increasing internal demagnetizing (dipolar) field caused by the presence of imbalanced poles at the vertex (4 like poles, or 3 against 1). Incidentally, note that also peak (c) of Figure 2 and Figure 6 decreases its frequency, and the reason stands in its hybridization with the EM (see the phase amplitude profile at the macrospin edges in the figure plots). Even this effect is hence due to the increasing instability while getting same-poles closer to each other.
As shown in Table 1, in the case of 4N microstate, we found that the EM frequency gradually decreases until a critical separation value s c , below which, however, the magnetization does not undergo any rearrangement (i.e., no first/second order phase transition [49]). Instead, the magnetization keeps its symmetry unchanged despite the increasingly stronger demagnetizing fields, while the modes change their phase amplitude profile at the edges, with nodal lines tilted with respect to the magnetization. This dynamic change in the mode profile decreases the total demagnetizing fields (static plus dynamic) and raises the system’s stability. As a consequence, below s c the frequency of the edge modes with tilted nodal lines increases. This subtle effect will be thoroughly presented in a dedicated publication.
Conversely, ASI microstate 2N2S and Vortex both have vertices with zero magnetic charge, which clearly makes the magnetization more stable as the distances are decreased: as well known [49,50,51,52,53,54,55] the increased stability makes the magnetization stiffer to oscillations and the frequencies higher. As a consequence, both modes EM and FM, in these two microstates, are clearly increasing their frequencies as the macrospin separation is decreasing (Figure 7 and Figure 8).
In summary, the behavior of the frequency of the peaks in varying the macrospin separation is an indication of the microstate type: in 4N and 3N1S the EM and FM peaks have opposite trends, in 2N2S and Vortex have the same trend.

3.2.2. Macrospin Size

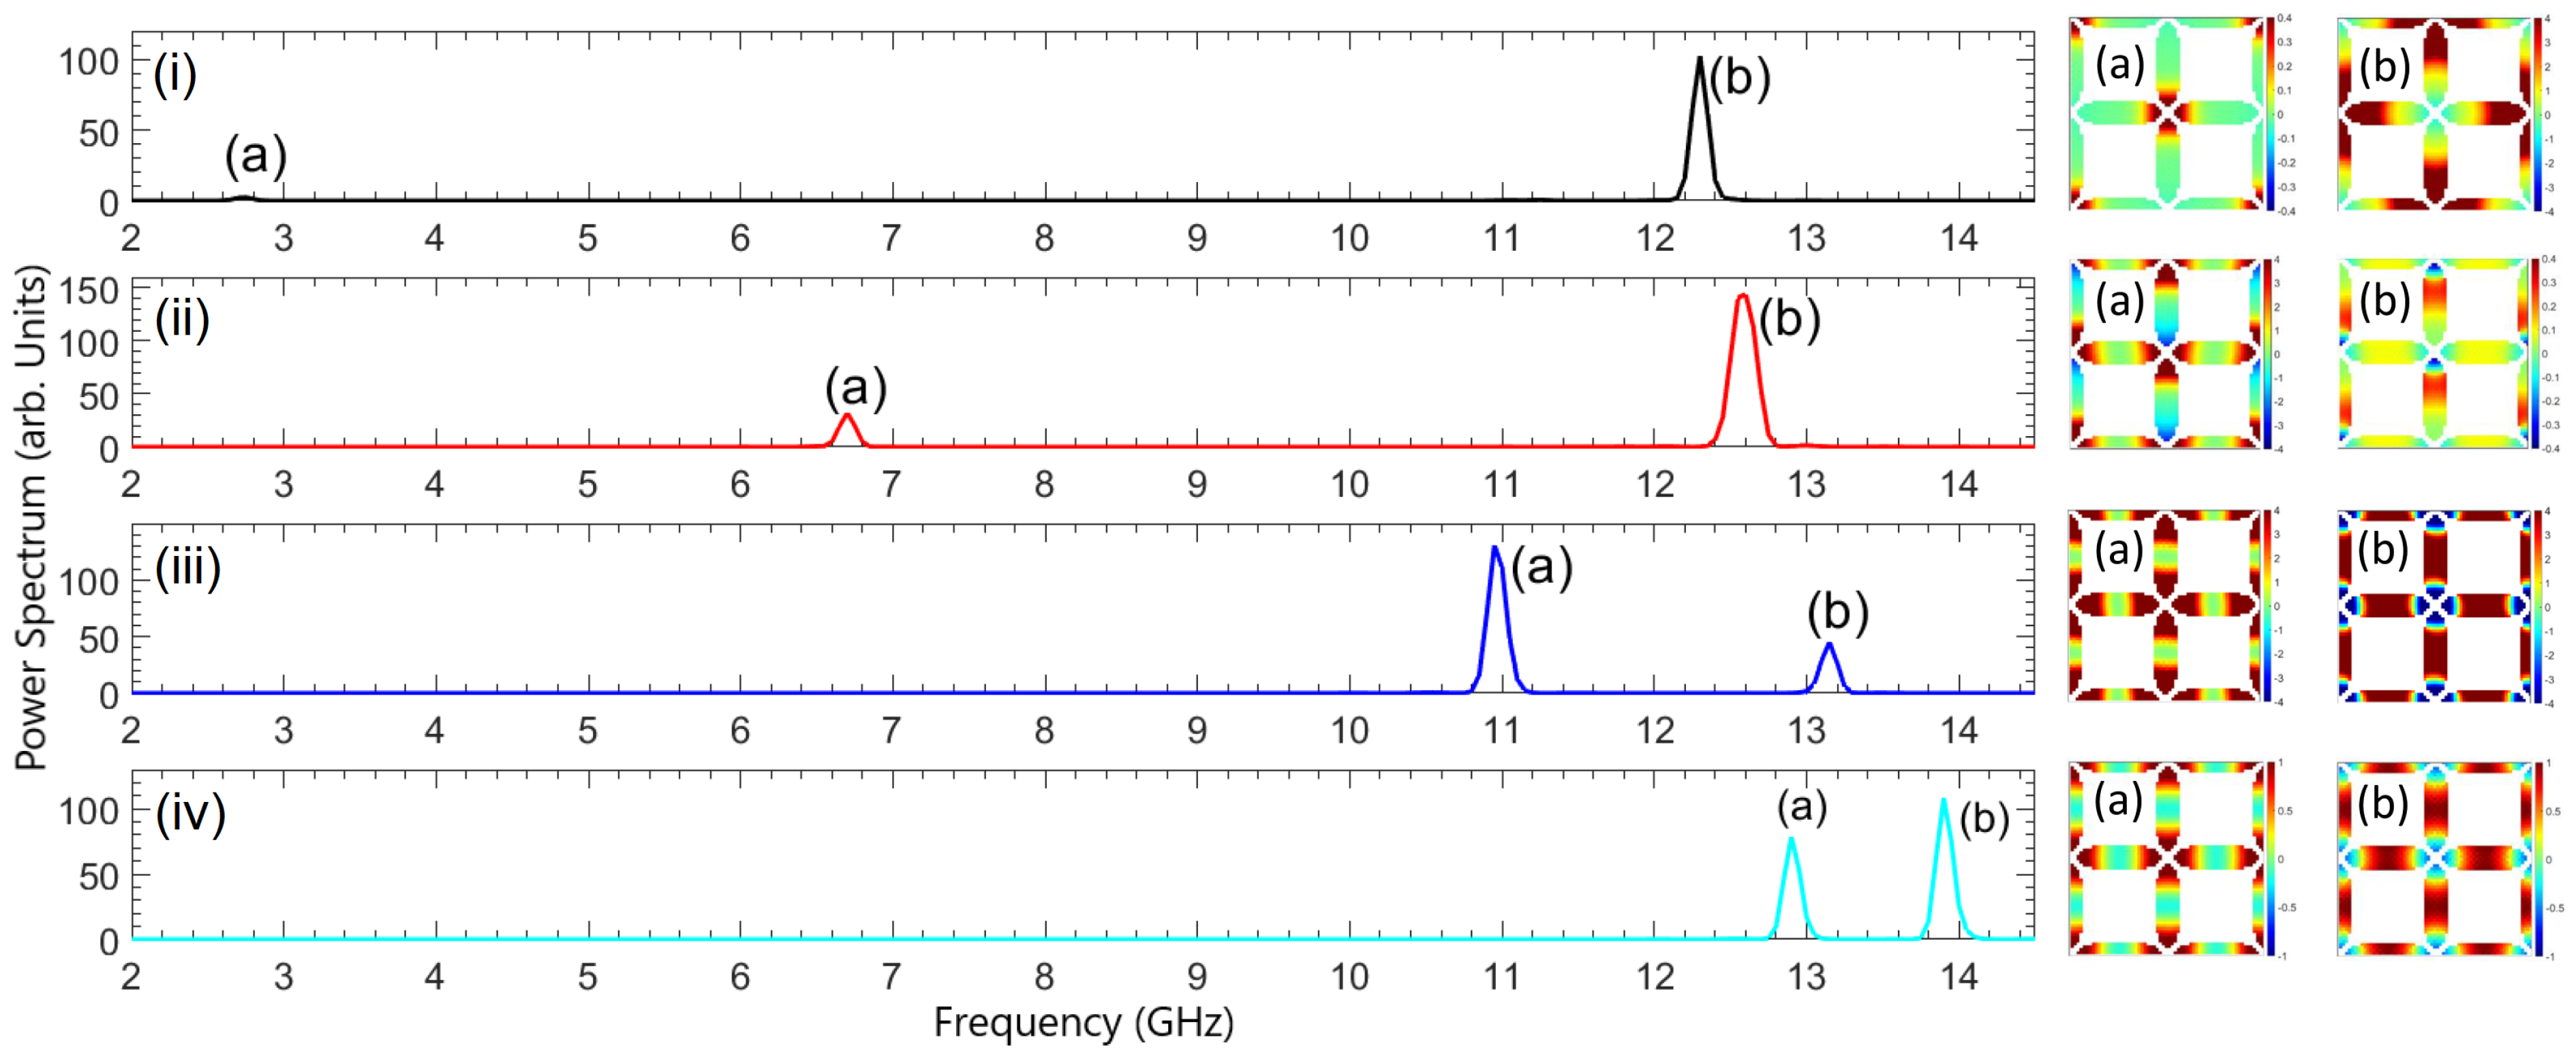
We performed the calculations on a reduced system, with the primitive cell being 256 × 256 × 15 nm 3 , and each macrospin being 112 × 32 × 15 nm 3 : the resulting spectra and profiles are shown in Figure 9. The reduction of the ASI element size causes a confinement of the SW excitations, with consequent general increase of the SW frequencies and the gap between different mode frequencies. In particular, since we plot spectra below 15 GHz, no higher order mode is present. In Figure 9 mode (a) is at the lowest frequency in microstate 4N, where its amplitude is large at the vertices with maximum effective charge q eff = q 4 N = | 4 q | , while is smaller, and with opposite phase, at the vertices with q eff = 0 . Hence the oscillation involves a region with large demagnetizing fields, responsible for the resulting very low frequency. On the contrary, the amplitude of mode (b) is localized only at the vertices with q eff = 0 , where demagnetizing fields are small and magnetization is more stable: this justifies the resulting large frequency. As a final comment, we observe how, in the perspective of identifying the microstate type by a sole spectrum analysis, it may be way more effective to use small elements, such that the frequency gap between mode (a) and (b) could strongly vary as the ASI microstate varies from Vortex (balanced, most stable) to 4N (unbalanced, least stable): as apparent from Figure 9, the gap moves from about 1 GHz (Vortex), to about 10 GHz (4N). The gap extent can be an indirect indication of the magnetization orientations at the vertices: the larger the gap, the more unbalanced are the magnetic moments at vertices.
The other panels clearly show how, moving to microstates with increasingly more stable vertices, both modes increase their frequency. Furthermore, they show an asymmetric phase profile in microstates where the adjacent vertices have different magnetic charge (Figure 9, panel i–ii), and a symmetric one where the vertices have the same magnetic charge (Figure 9, panel iii–iv).

3.2.3. Aspect Ratio

The variation of the aspect ratio modifies the magnetic (shape) anisotropy in the macrospin. In order to investigate the behavior of the spectra with increasing shape anisotropy, keeping the macrospin length fixed at 256 nm, we considered three different width values: 96 nm, 88 nm, 80 nm. The results are shown in Figure 10, Figure 11, Figure 12 and Figure 13. Apparently, as the shape anisotropy increases, all the modes undergo a frequency increase, particularly mode (a), i.e., the edge mode, and mode (b), i.e., the fundamental mode. The largest variation is experienced by mode (a), since it is localized at the edges of the islands, where the magnetization variations are larger.
We recall that an effective variation of anisotropy can be operated in a system with a fixed shape by an interaction with a voltage-driven ferroelectric layer. By inverse magnetoelastic effect, it is possible to make, in the ferromagnetic layer, a magnetization direction easier than the others, and variable, producing the same effect we described by modifying the macrospin shape.

4. Conclusions

We investigated the spectra and mode profiles of spin waves in four basic microstates of a square ASI at remanence ( H = 0 ), as a function of distance and macrospin aspect ratio. We found footprints of the specific ASI microstate on a few important dynamic properties of the spin wave resonances. The main results can be outlined as follows.
The gap between the frequency of the EM (edge mode) and the FM (fundamental mode) increases for increasing effective charge at a vertex, as a consequence of the increasing demagnetizing fields. In particular, it happens to be the smallest in the closure-flux (Vortex) microstate, and the largest when the microstate includes 4N vertices. Noteworthy, microstate 2N2S and Vortex differ only in macrospin disposition at vertex, not in the effective charge, and though the gap is different, considerably when the macrospins are smaller.
Small ASI elements behave closer to actual macrospins and hence show just two main, detectable modes (EM and FM), while bigger ASI elements depart from a macrospin behavior, display a richer spectrum and show higher order modes with non-zero intensity.
In decreasing the distance between adjacent macrospins (i.e., increasing the ASI density) would impact first and foremost the dynamics at the macrospin edges, causing the EM frequency to decrease if the effective charge at vertex q eff is non-zero (due to increasing instability) or to increase it if q eff is zero (due to increasing stability). The FM just slightly increases its frequency simply due to an increased effective magnetic moment density. Hence, in varying the macrospin separation the FM and EM frequencies show opposite behavior in 4N and 3N1S microstates, and similar behavior in 2N2S and Vortex microstates. On the other side, the decrease of the macrospin width is proven to simply increase the frequency of all the modes, as a consequence of the increased confinement in a progressively smaller region. The variation of the width corresponds to a variation of the in-plane aspect ratio of the macrospin (shape anisotropy), and we mention here that the same effect could be attained by the introduction of any magnetic anisotropy of different origin, for example by the coupling with a different layer with a different material with magneto-crystalline anisotropy, or by inverse magnetostriction, depending on the material type.
We detected also a subtle effect, worth to be thoroughly investigated in further studies. In ASI with q eff 0 (i.e., 4N and 3N1S microstates), the EM frequency decreases down to a minimum value in correspondence of a critical minimum separation, below which a transition is observed, which apparently forces modes to get nodal lines tilted with respect to the direction of the magnetization at the edges: this dynamic transition is seen to increase the system’s stability, and consequently the corresponding frequency is seen to increase. This effect is found independent of the macrospin size.
Another interesting effect represents an additional footprint of the specific ASI microstate on the dynamic properties of its SWs. The profile of the FM is sensitive to the vertex type, with nodes shifting to the macrospin side close to the vertex that has the largest modulus of the magnetization divergence (i.e., effective charge in absolute value). This effect corresponds to a phase-shift in a restricted area of the macrospin, was proven to be dependent also of the macrospin distance (interdot interaction), and is believed to play an important role in spin wave interferometry, where phase-shifts between interfering signals can dramatically change the interference pattern intensity, as well as the truth table of any associated magnonic logic gate.
We believe all these results, a few ones particularly unexpected, show the presence of univocal characteristics in the dynamics that are very peculiar to the specific ASI microstate and consequent q eff , and can be very useful for further studies of the topic, aiming to characterize the specific microstate. We also hope we raised the curiosity of experimentalists to verify in measurements the interesting predictions we made, concerning details either in spectra or mode amplitude profiles. We suggest for example ferromagnetic resonance and particularly by microfocus Brillouin light scattering (Brillouin microscopy) or time-resolved Kerr microscopy. Finally, we remark how the technological control of the dynamic properties we investigated can have interesting applications in the field of signal processing, where magnonic devices based on spin-wave interferometry are concerned.

Author Contributions

Formal analysis, investigation, data curation, writing—review and editing, P.M.; Conceptualization, methodology, software, formal analysis, investigation, data curation, writing—original draft preparation, writing—review and editing, F.M.; All authors have read and agreed to the published version of the manuscript.

Funding

This research received no external funding.

Data Availability Statement

Not applicable.

Conflicts of Interest

The authors declare no conflict of interest.

References

  1. Morris, D.J.P.; Tennant, D.A.; Grigera, S.A.; Klemke, B.; Castelnovo, C.; Moessner, R.; Czternasty, C.; Meissner, M.; Rule, K.C.; Hoffmann, J.U.; et al. Dirac Strings and Magnetic Monopoles in the Spin Ice Dy2Ti2O7. Science 2009, 326, 411. [Google Scholar] [CrossRef] [PubMed] [Green Version]
  2. Bramwell, S.T.; Harris, M.J. The history of spin ice. J. Phys. Condens. Matter 2020, 32, 374010. [Google Scholar] [CrossRef]
  3. Wang, R.F.; Nisoli, C.; Freitas, R.S.; Li, J.; McConville, W.; Cooley, B.J.; Lund, M.S.; Samarth, N.; Leighton, C.; Crespi, V.H.; et al. Artificial ‘spin ice’ in a geometrically frustrated lattice of nanoscale ferromagnetic islands. Nature 2006, 439, 303–306. [Google Scholar] [CrossRef] [PubMed] [Green Version]
  4. Skjærvø, S.H.; Marrows, C.H.; Stamps, R.L.; Heyderman, L.J. Advances in artificial spin ice. Nat. Rev. Phys. 2020, 2, 13. [Google Scholar] [CrossRef] [Green Version]
  5. Farhan, A.; Derlet, P.M.; Anghinolfi, L.; Kleibert, A.; Heyderman, L.J. Magnetic charge and moment dynamics in artificial kagome spin ice. Phys. Rev. B 2017, 96, 064409. [Google Scholar] [CrossRef] [Green Version]
  6. Morrison, M.J.; Nelson, T.R.; Nisoli, C. Unhappy vertices in artificial spin ice: New degeneracies from vertex frustration. New J. Phys. 2013, 15, 045009. [Google Scholar] [CrossRef] [Green Version]
  7. Pollard, S.D.; Volkov, V.; Zhu, Y. Propagation of magnetic charge monopoles and Dirac flux strings in an artificial spin-ice lattice. Phys. Rev. B 2012, 85, 180402(R). [Google Scholar] [CrossRef] [Green Version]
  8. Mengotti, E.; Heyderman, L.J.; Rodríguez, A.F.; Nolting, F.; Hügli, R.V.; Braun, H.B. Real-space observation of emergent magnetic monopoles and associated Dirac strings in artificial kagome spin ice. Nat. Phys. 2011, 7, 68–74. [Google Scholar] [CrossRef]
  9. Le, B.L.; Park, J.; Sklenar, J.; Chern, G.W.; Nisoli, C.; Watts, J.D.; Manno, M.; Rench, D.W.; Samarth, N.; Leighton, C.; et al. Understanding magnetotransport signatures in networks of connected permalloy nanowires. Phys. Rev. B 2017, 95, 060405(R). [Google Scholar] [CrossRef] [Green Version]
  10. Sander, D.; Valenzuela, S.O.; Makarov, D.; Marrows, C.H.; Fullerton, E.E.; Fischer, P.; McCord, J.; Vavassori, P.; Mangin, S.; Pirro, P.; et al. The 2017 Magnetism Roadmap. J. Phys. D Appl. Phys. 2017, 50, 363001. [Google Scholar] [CrossRef]
  11. Lendinez, S.; Jungfleisch, M.B. Magnetization dynamics in artificial spin ice. J. Physics Condens. Matter 2019, 32, 013001. [Google Scholar] [CrossRef] [PubMed]
  12. Gliga, S.; Kákay, A.; Hertel, R.; Heinonen, O.G. Spectral Analysis of Topological Defects in an Artificial Spin-Ice Lattice. Phys. Rev. Lett. 2013, 110, 117205. [Google Scholar] [CrossRef] [PubMed] [Green Version]
  13. Montoncello, F.; Gubbiotti, G. Controlling the three dimensional propagation of spin waves in continuous ferromagnetic films with an increasing out of plane undulation. Sci. Rep. 2021, 11, 21344. [Google Scholar] [CrossRef]
  14. Graczyk, P.; Krawczyk, M.; Dhuey, S.; Yang, W.G.; Schmidt, H.; Gubbiotti, G. Magnonic band gap and mode hybridization in continuous permalloy films induced by vertical dynamic coupling with an array of permalloy ellipses. Phys. Rev. B 2018, 98, 174420. [Google Scholar] [CrossRef] [Green Version]
  15. Saha, S.; Zhou, J.; Hofhuis, K.; Kákay, A.; Scagnoli, V.; Heyderman, L.J.; Gliga, S. Spin-Wave Dynamics and Symmetry Breaking in an Artificial Spin Ice. Nano Lett. 2021, 21, 2382. [Google Scholar] [CrossRef]
  16. Bhat, V.S.; Watanabe, S.; Baumgaertl, K.; Kleibert, A.; Schoen, M.A.W.; Vaz, C.A.F.; Grundler, D. Magnon Modes of Microstates and Microwave-Induced Avalanche in Kagome Artificial Spin Ice with Topological Defects. Phys. Rev. Lett. 2020, 125, 117208. [Google Scholar] [CrossRef]
  17. Ghosh, A.; Ma, F.; Lourembam, J.; Jin, X.; Maddu, R.; Yap, Q.J.; Lim, S.T. Emergent Dynamics of Artificial Spin-Ice Lattice Based on an Ultrathin Ferromagnet. Nano Lett. 2020, 20, 109. [Google Scholar] [CrossRef]
  18. Gartside, J.C.; Vanstone, A.; Dion, T.; Stenning, K.D.; Arroo, D.M.; Kurebayashi, H.; Branford, W.R. Reconfigurable magnonic mode-hybridisation and spectral control in a bicomponent artificial spin ice. Nat. Commun. 2021, 12, 2488. [Google Scholar] [CrossRef]
  19. Dion, T.; Arroo, D.M.; Yamanoi, K.; Kimura, T.; Gartside, J.C.; Cohen, L.F.; Kurebayashi, H.; Branford, W.R. Tunable magnetization dynamics in artificial spin ice via shape anisotropy modification. Phys. Rev. B 2019, 100, 054433. [Google Scholar] [CrossRef] [Green Version]
  20. Iacocca, E.; Gliga, S.; Stamps, R.L.; Heinonen, O. Reconfigurable wave band structure of an artificial square ice. Phys. Rev. 2016, 93, 134420. [Google Scholar] [CrossRef] [Green Version]
  21. Ladak, S.; Fernández-Pacheco, A.; Fischer, P. Science and technology of 3D magnetic nanostructures. APL Mater. 2022, 10, 5. [Google Scholar] [CrossRef]
  22. Negrello, R.; Montoncello, F.; Kaffash, M.T.; Jungfleisch, M.B.; Gubbiotti, G. Dynamic coupling and spin-wave dispersions in a magnetic hybrid system made of an artificial spin-ice structure and an extended NiFe underlayer. APL Mater. 2022, 10, 091115. [Google Scholar] [CrossRef]
  23. Montoncello, F.; Kaffash, M.T.; Carfagno, H.; Doty, M.F.; Gubbiotti, G.; Jungfleisch, M.B. A Brillouin light scattering study of the spin-wave magnetic field dependence in a magnetic hybrid system made of an artificial spin-ice structure and a film underlayer. J. Appl. Phys. 2023, 133, 083901. [Google Scholar] [CrossRef]
  24. Barman, A.; Gubbiotti, G.; Ladak, S.; Adeyeye, A.O.; Krawczyk, M.; Gräfe, J.; Adelmann, C.; Cotofana, S.; Naeemi, A.; Vasyuchka, V.I.; et al. The 2021 Magnonics Roadmap. J. Physics Condens. Matter 2021, 33, 413001. [Google Scholar] [CrossRef] [PubMed]
  25. Sahoo, S.; May, A.; van Den Berg, A.; Mondal, A.K.; Ladak, S.; Barman, A. Observation of Coherent Spin Waves in a Three-Dimensional Artificial Spin Ice Structure. Nano Lett. 2021, 21, 4629. [Google Scholar] [CrossRef] [PubMed]
  26. Gubbiotti, G. Three-Dimensional Magnonics: Layered, Micro- and Nanostructures; Jenny Stanford Publishing: Singapore, 2019. [Google Scholar]
  27. Iacocca, E.; Gliga, S.; Heinonen, O.G. Tailoring Spin-Wave Channels in a Reconfigurable Artificial Spin Ice. Phys. Rev. Appl. 2020, 13, 044047. [Google Scholar] [CrossRef] [Green Version]
  28. Iacocca, E.; Heinonen, O. Topologically Nontrivial Magnon Bands in Artificial Square Spin Ices with Dzyaloshinskii-Moriya Interaction. Phys. Rev. Applied 2017, 8, 034015. [Google Scholar] [CrossRef] [Green Version]
  29. Jungfleisch, M.B.; Zhang, W.; Iacocca, E.; Sklenar, J.; Ding, J.; Jiang, W.; Zhang, S.; Pearson, J.E.; Novosad, V.; Ketterson, J.B.; et al. Dynamic response of an artificial square spin ice. Phys. Rev. B 2016, 93, 100401(R). [Google Scholar] [CrossRef] [Green Version]
  30. Bang, W.; Sturm, J.; Silvani, R.; Kaffash, M.T.; Hoffmann, A.; Ketterson, J.B.; Montoncello, F.; Jungfleisch, M.B. Influence of the Vertex Region on Spin Dynamics in Artificial Kagome Spin Ice. Phys. Rev. Appl. 2020, 14, 014079. [Google Scholar] [CrossRef]
  31. Sebastian, T.; Schultheiss, K.; Obry, B.; Hillebrands, B.; Schultheiss, H. Micro-focused Brillouin light scattering: Imaging spin waves at the nanoscale. Front. Phys. 2015, 3, 35. [Google Scholar] [CrossRef] [Green Version]
  32. Madami, M.; Montoncello, F.; Capuzzo, G.; Giovannini, L.; Nizzoli, F.; Gubbiotti, G.; Tacchi, S.; Carlotti, G.; Tanigawa, H.; Ono, T. Experimental Evidence of Field-Induced Localization of Spin Excitations in NiFe Elliptical Rings by Micro-Focused Brillouin Light Scattering. IEEE Trans. Magn. 2010, 46, 1531. [Google Scholar] [CrossRef]
  33. Berweger, S.; Tyrell-Ead, R.; Chang, H.; Wu, M.; Zhu, N.; Tang, H.X.; Nembach, H.; Karl Stupic, T.; Russek, S.; Wallis, T.M.; et al. Imaging of magnetic excitations in nanostructures with near-field microwave microscopy. J. Magn. Magn. Mater. 2022, 546, 168870. [Google Scholar] [CrossRef]
  34. Keatley, P.S.; Loughran, T.H.J.; Hendry, E.; Barnes, W.L.; Hicken, R.J.; Childress, J.R.; Katine, J.A. A platform for time-resolved scanning Kerr microscopy in the near-field. Rev. Sci. Instruments 2017, 88, 123708. [Google Scholar] [CrossRef] [Green Version]
  35. Vansteenkiste, A.; Leliaert, J.; Dvornik, M.; Helsen, M.; Garcia-Sanchez, F.; Van Waeyenberge, B. The design and verification of MuMax3. AIP Adv. 2014, 4, 107133. [Google Scholar] [CrossRef] [Green Version]
  36. Fangohr, H.; Bordignon, G.; Franchin, M.; Knittel, A.; de Groot, P.A.J.; Fischbacher, T. A new approach to (quasi) periodic boundary conditions in micromagnetics: The macrogeometry. J. Appl. Phys. 2009, 105, 07D529. [Google Scholar] [CrossRef] [Green Version]
  37. De Wiele, B.V.; Montoncello, F. A continuous excitation approach to determine time-dependent dispersion diagrams in 2D magnonic crystals. J. Phys. D Appl. Phys. 2014, 47, 315002. [Google Scholar] [CrossRef]
  38. Gubbiotti, G.; Carlotti, G.; Okuno, T.; Grimsditch, M.; Giovannini, L.; Montoncello, F.; Nizzoli, F. Spin dynamics in thin nanometric elliptical Permalloy dots: A Brillouin light scattering investigation as a function of dot eccentricity. Phys. Rev. B 2005, 72, 184419. [Google Scholar] [CrossRef]
  39. Gubbiotti, G.; Xiong, L.L.; Montoncello, F.; Giovannini, L.; Adeyeye, A.O. pin wave dispersion and intensity correlation in width-modulated nanowire arrays: A Brillouin light scattering study. J. Appl. Phys. 2018, 124, 083903. [Google Scholar] [CrossRef] [Green Version]
  40. Bang, W.; Montoncello, F.; Hoffmann, A.; Giovannini, L.; Ketterson, J.B. Thickness dependence of spin wave dynamics in three-fold nano-ellipse clusters. AIP Adv. 2018, 8, 101502. [Google Scholar] [CrossRef] [Green Version]
  41. Madami, M.; Tacchi, S.; Gubbiotti, G.; Carlotti, G.; Montoncello, F.; Capuzzo, G.; Giovannini, L.; Nizzoli, F.; Tanigawa, H.; Ono, T. Spin Modes in Elliptical Nanorings in the Vortex State: Two-Dimensional Mapping by Micro-Focused Brillouin Light Scattering. IEEE Trans. Magn. 2010, 46, 199. [Google Scholar] [CrossRef]
  42. Perzlmaier, K.; Buess, M.; Back, C.H.; Demidov, V.E.; Hillebrands, B.; Demokritov, S.O. Spin-Wave Eigenmodes of Permalloy Squares with a Closure Domain Structure. Phys. Rev. Lett. 2005, 94, 057202. [Google Scholar] [CrossRef] [PubMed]
  43. Schneider, T.; Serga, A.A.; Leven, B.; Hillebrands, B.; Stamps, R.L.; Kostylev, M.P. Realization of spin-wave logic gates. Appl. Phys. Lett. 2008, 92, 022505. [Google Scholar] [CrossRef] [Green Version]
  44. Lee, K.S.; Kim, S.K. Conceptual design of spin wave logic gates based on a Mach–Zehnder-type spin wave interferometer for universal logic functions. J. Appl. Phys. 2008, 104, 053909. [Google Scholar] [CrossRef] [Green Version]
  45. Csaba, G.; Papp, Á.; Porod, W. IPerspectives of using spin waves for computing and signal processing. Phys. Lett. A 2017, 381, 1471. [Google Scholar] [CrossRef] [Green Version]
  46. Damon, R.; Eshbach, J. Magnetostatic modes of a ferromagnet slab. J. Phys. Chem. Solids 1961, 19, 308–320. [Google Scholar] [CrossRef]
  47. Jorzick, J.; Demokritov, S.O.; Hillebrands, B.; Bailleul, M.; Fermon, C.; Guslienko, K.; Slavin, A.N.; Berkov, D.; Gorn, N.L. Spin Wave Wells in Nonellipsoidal Micrometer Size Magnetic Elements. Phys. Rev. Lett. 2002, 88, 047204. [Google Scholar] [CrossRef] [Green Version]
  48. Bailleul, M.; Höllinger, R.; Fermon, C. Microwave spectrum of square Permalloy dots: Quasisaturated state. Phys. Rev. B 2006, 73, 104424. [Google Scholar] [CrossRef]
  49. Montoncello, F.; Giovannini, L.; Nizzoli, F.; Vavassori, P.; Grimsditch, M. Dynamic origin of first and second order phase transitions in magnetization reversal of elliptical nanodots. Phys. Rev. B 2008, 77, 214402. [Google Scholar] [CrossRef]
  50. Yuan, H.Y.; Duine, R.A. Universal field dependence of magnetic resonance near zero frequency. Phys. Rev. B 2021, 103, 134440. [Google Scholar] [CrossRef]
  51. Montoncello, F.; Giovannini, L.; Bang, W.; Ketterson, J.B.; Jungfleisch, M.B.; Hoffmann, A.; Farmer, B.W.; De Long, L.E. Mutual influence between macrospin reversal order and spin-wave dynamics in isolated artificial spin-ice vertices. Phys. Rev. B 2018, 97, 014421. [Google Scholar] [CrossRef] [Green Version]
  52. Montoncello, F.; Giovannini, L.; Farmer, B.; De Long, L.E. Dynamic origin of segment magnetization reversal in thin-film Penrose tilings. J. Magn. Magn. Mater. 2017, 423, 158–163. [Google Scholar] [CrossRef]
  53. Montoncello, F.; Giovannini, L. Bandwidth broadening and asymmetric softening of collective spin waves in magnonic crystals. Appl. Phys. Lett. 2014, 104, 242407. [Google Scholar] [CrossRef]
  54. Montoncello, F.; Giovannini, L.; Nizzoli, F.; Vavassori, P.; Grimsditch, M.; Ono, T.; Gubbiotti, G.; Tacchi, S.; Carlotti, G. Soft spin waves and magnetization reversal in elliptical Permalloy nanodots: Experiments and dynamical matrix results. Phys. Rev. B 2007, 76, 024426. [Google Scholar] [CrossRef]
  55. Mamica, S. Influence of the demagnetizing field on the spin-wave softening in bicomponent magnonic crystals. J. Magn. Magn. Mater. 2022, 546, 168690. [Google Scholar] [CrossRef]
Figure 1. The three microstates in the square ASI: (a) 4N, which contains the vertex types 4N, 4S, 2N2S, 2S2N; (b) 3N1S, which contains also 3S1N; (c) 2N1S, which is reproduced at all ASI vertices, since the geometric primitive cell matches with the magnetic one; (d) which displays a closure distribution (Vortex). Note that we refer to spin or macrospin, but the actual physical quantity that is shown through the arrows is the magnetic moment. The red square frame encloses the primitive cell.
Magnetochemistry 09 00158 g001
Figure 2. (Upper panels) SW spectra and (lower panels) mode phase profiles for the 4N microstate at the three different separation values between the macrospins: s = 96 nm (panel i), s = 64 nm (panel ii), s = 40 nm (panel iii). Each peak has a label corresponding to the calculated mode profiles, in particular (a) is the EM, (b) is the FM, (c,d) are higher order modes, with 1 and 3 nodal lines, respectively. In panel (i) the inset features a semi-log plot in correspondence to the EM frequency and an arrow to highlight the position of the EM peak (a). In this microstate, EM and FM frequencies have opposite behavior as a function of macrospin separation.
Magnetochemistry 09 00158 g002
Figure 3. Fundamental mode profile for the different ASI microstates: (a) 4N, (b) 3N1S, (c) 2N2S, (d) Vortex. Note how modes (c,d) differ only at the edges of the ASI elements, as the static magnetization does, i.e., curled in (c) and straight in (d).
Magnetochemistry 09 00158 g003
Figure 4. (Upper panels) Magnetization distributions at remanence of microstate (a) 4N, (b) 3N1S, (c) 2N2S, (d) Vortex. The arrows represent the average direction of the magnetization in 5 micromagnetic cells, while the green background marks the effective area of the macrospins in the micromagnetic representation. (Lower panels) Magnitude of internal B eff in unit [T] for microstate (e) 4N, (f) 3N1S, (g) 2N2S, (h) Vortex. Note that the minima at the edges host the EM oscillation, while the central region in the bulk hosts the FM oscillation: these confinements play a crucial role in determining the ultimate dynamics of the modes.
Magnetochemistry 09 00158 g004
Figure 5. Evolution of the fundamental mode phase profile (amplitude in arb. units), as appearing in a single macrospin belonging to a square–ASI in the microstate 4N, as the spacer between adjacent elements is increased: (a) s = 96 nm, (b) s = 128 nm, (c) s = 256 nm, (d) s = 512 nm, (e) s .
Magnetochemistry 09 00158 g005
Figure 6. (Upper panels) SW spectra and (lower panels) mode phase profiles for the 3N1S microstate at the three different separation values between the macrospins: s = 96 nm (panel i), s = 64 nm (panel ii), s = 40 nm (panel iii). Each peak has a label corresponding to the calculated mode profiles, in particular (a) is the EM, (b) is the FM. We show also mixed modes: (c) is a FM-like mode in the horizontal macrospins and a mode with 1 node in the vertical ones; (d) a mode with 2 nodes in the horizontal macrospins and 1 node in the vertical ones; (e) a mode localized in the vertical macrospins only, with 3 nodes. In this microstate, EM and FM frequencies have opposite behavior as a function of macrospin separation.
Magnetochemistry 09 00158 g006
Figure 7. (Upper panels) SW spectra and (lower panels) mode phase profiles for the 2N2S microstate at the three different separation values between the macrospins: s = 96 nm (panel i), s = 64 nm (panel ii), s = 40 nm (panel iii). Each peak has a label corresponding to the calculated mode profiles, in particular (a) is the EM, (b) is the FM, (c) is a hybrid of FM and a mode with two nodal lines perpendicular to the magnetization. In this microstate, EM and FM frequencies have the same behavior as a function of macrospin separation.
Magnetochemistry 09 00158 g007
Figure 8. (Upper panels) SW spectra and (lower panels) mode phase profiles for the Vortex microstate at the three different separation values between the macrospins: s = 96 nm (panel i), s = 64 nm (panel ii), s = 40 nm (panel iii). Each peak has a label corresponding to the calculated mode profiles, in particular (a) is the EM, (b) is the FM. Then we show a mode with (c) two and (d) four nodal lines perpendicular to the magnetization, displaying non-physical large intensities, which we attribute to a computational artifact. In this microstate, EM and FM frequencies have the same behavior as a function of macrospin separation.
Magnetochemistry 09 00158 g008
Figure 9. SW spectra (panels on the left) and mode phase profiles (panels on the right) for microstate (i) 4N, (ii) 3N1S, (iii) 2N2S, (iv) Vortex, for the small macrospin ASI. Below 15 GHz only two modes are found with non-negligible intensity: (a) the EM and (b) the FM. Note how, at these small sizes, the gap between the frequencies of these modes greatly decreases with decreasing effective charge at vertex.
Magnetochemistry 09 00158 g009
Figure 10. (Upper panels) SW spectra and (lower panels) mode phase profiles for the 4N microstate at the three different aspect ratios, with fixed length (256 nm) and variable width: w = 96 nm (panel i), w = 88 nm (panel ii), w = 80 nm (panel iii). Each peak has a label corresponding to the calculated mode profiles, in particular (a) is the EM, (b) is the FM. Then, we show a mode with (c) one and (d) two nodal lines perpendicular to the magnetization.
Magnetochemistry 09 00158 g010
Figure 11. (Upper panels) SW spectra and (lower panels) mode phase profiles for the 3N1S microstate at the three different aspect ratios, with fixed length (256 nm) and variable width: w = 96 nm (panel i), w = 88 nm (panel ii), w = 80 nm (panel iii). Each peak has a label corresponding to the calculated mode profiles, in particular (a) is the EM, (b) is the FM. Mode (c) is a mixed mode, having one nodal line in the vertial macrospins and two in the horizontal ones; mode (d) shows two nodes in the vertical macrospins and a profile similar to the FM in the horizontal macrospin.
Magnetochemistry 09 00158 g011
Figure 12. (Upper panels) SW spectra and (lower panels) mode phase profiles for the 2N2S microstate at the three different aspect ratios, with fixed length (256 nm) and variable width: w = 96 nm (panel i), w = 88 nm (panel ii), w = 80 nm (panel iii). Each peak has a label corresponding to the calculated mode profiles, in particular (a) is the EM, (b) is the FM. Remarkably, in this case we do not obtain higher order modes with appreciable intensity.
Magnetochemistry 09 00158 g012
Figure 13. (Upper panels) SW spectra and (lower panels) mode phase profiles for the Vortex microstate at the three different aspect ratios, with fixed length (256 nm) and variable width: w = 96 nm (panel i), w = 88 nm (panel ii), w = 80 nm (panel iii). Each peak has a label corresponding to the calculated mode profiles, in particular (a) is the EM, (b) is the FM. Mode (c) has two nodal lines perpendicular to the magnetization, and gets appreciable intensity only in panel (iii).
Magnetochemistry 09 00158 g013
Table 1. Behavior of the EM frequency with decreasing the macrospin separation s in the 4N microstate. A change of behavior occurs in crossing some s c intermediate of 56 and 48 nm.
s (nm)9664564840
Frequency (GHz)4.52.61.03.24.6
Disclaimer/Publisher’s Note: The statements, opinions and data contained in all publications are solely those of the individual author(s) and contributor(s) and not of MDPI and/or the editor(s). MDPI and/or the editor(s) disclaim responsibility for any injury to people or property resulting from any ideas, methods, instructions or products referred to in the content.