Article

Magnetic Enrichment of SARS-CoV-2 Antigen-Binding B Cells for Analysis of Transcriptome and Antibody Repertoire

1
Department of Immunology and Microbiology, School of Medicine, University of Colorado Anschutz Medical Campus, Aurora, CO 80045, USA
2
Division of Rheumatology, Department of Medicine, School of Medicine, University of Colorado Anschutz Medical Campus, Aurora, CO 80045, USA
3
Medicine Service, Rheumatology Section, Rocky Mountain Regional Veterans Affairs Medical Center, Aurora, CO 80045, USA
4
Quidel Corporation, R&D, San Diego, CA 92121, USA
*
Author to whom correspondence should be addressed.
Magnetochemistry 2022, 8(2), 23; https://doi.org/10.3390/magnetochemistry8020023
Submission received: 1 December 2021 / Revised: 17 December 2021 / Accepted: 20 December 2021 / Published: 5 February 2022
(This article belongs to the Special Issue Magnetic Cell Separation)

Abstract

:
The ongoing COVID-19 pandemic has had devastating health impacts across the globe. The development of effective diagnostics and therapeutics will depend on the understanding of immune responses to natural infection and vaccination to the causative agent of COVID-19, severe acute respiratory syndrome coronavirus 2 (SARS-CoV-2). While both B-cell immunity and T-cell immunity are generated in SARS-CoV-2-infected and vaccinated individuals, B-cell-secreted antibodies are known to neutralize SARS-CoV-2 virus and protect from the disease. Although interest in characterizing SARS-CoV-2-reactive B cells is great, the low frequency of antigen-binding B cells in human blood limits in-depth cellular profiling. To overcome this obstacle, we developed a magnetic bead-based approach to enrich SARS-CoV-2-reactive B cells prior to transcriptional and antibody repertoire analysis by single-cell RNA sequencing (scRNA-seq). Here, we describe isolation of SARS-CoV-2 antigen-binding B cells from two seropositive donors and comparison to nonspecific B cells from a seronegative donor. We demonstrate that SARS-CoV-2 antigen-binding B cells can be distinguished on the basis of transcriptional profile and antibody repertoire. Furthermore, SARS-CoV-2 antigen-binding B cells exhibit a gene expression pattern indicative of antigen experience and memory status. Combining scRNA-seq methods with magnetic enrichment enables the rapid characterization of SARS-CoV-2 antigen-binding B cells.

1. Introduction

Diagnostic and therapeutic countermeasures are needed to limit crippling health consequences of the novel coronavirus disease 2019, COVID-19. Defining immune responses to SARS-CoV-2 virus infection or immunization is critical for ongoing efforts to design effective diagnostic and therapeutic tools. Immunity generated by T and B cells can provide long-term protection against reinfection. Importantly, patients with immune-mediated diseases who receive immunosuppressive medications that deplete or inhibit B cells, have increased risk for COVID-19 infection and develop less protective antibodies following vaccination [1,2,3]. Although B cells are critical in fighting COVID-19, their low numbers in human blood hinder their characterization.
As an arm of the adaptive immune system, B cells recognize antigens by B-cell receptors (BCRs) expressed on their surface or by antibodies. Antibodies comprise two heavy and two light chains, forming a “Y”-shaped molecule. Three variable complementarity-determining regions (CDRs) encoded in each light and heavy chain form an antigen-binding site and determine antigen specificity and affinity. Specific variable (V), diversity (D), and joining (J) gene segments in the genome are somatically recombined during B-cell development to encode the variable regions of BCR heavy and light chains. The combinatorial nature of VDJ recombination and the addition of non-template nucleotides between the segments increase BCR diversity and ensure a broad repertoire of antigen reactivity.
During SARS-CoV-2 infection, antibody responses are mainly directed against three viral elements of SARS-CoV-2 virus: the spike glycoprotein and its receptor-binding domain (RBD), and the nucleocapsid (N) [4]. Required for attachment, fusion, and entry into mammalian cells, the spike and its RBD are key mediators of viral infection [5]. Protruding from the surface of mature virions, the spike is the primary antigenic target of neutralizing antibodies [6]. Dominance of N-protein antibody responses is likely due to its immunogenicity and abundant expression during infection [7,8]. Whereas antibodies targeting the spike are often neutralizing, N-binding antibodies may be of utility for monitoring infection. Of note, antibodies produced in response to infection by severe acute respiratory syndrome coronavirus (SARS-CoV) predominantly recognize the spike and N, which is consistent with the immunogenicity of these proteins [9].
Monoclonal antibodies derived from individual B cells from convalescent patients have been used to treat numerous viral diseases. Antibodies against respiratory syncytial virus are used prophylactically in pediatric patients [10]. Therapeutic monoclonal antibodies have been developed for COVID-19 and other emerging diseases such as Ebola and Zika [11,12,13,14]. Early proof-of-concept studies were carried out with the anticipation that the next global pandemic would arise from a novel influenza virus strain [15]. The experience of the COVID-19 pandemic has shown that methods to rapidly obtain sequences of antibodies that recognize specific antigens are greatly needed. The antibody discovery field has relied on methodologies such as hybridoma, phage, and yeast display over the past few decades. Although these methodologies can deliver antibody heavy- and light-chain variable region sequences, they are laborious and their throughput with respect to antigen specificity is relatively low. In addition, these approaches do not yield information about the immunophenotype, development, and function of antibody-producing B cells.
Following recent advances in single-cell RNA sequencing (scRNA-seq), paired light- and heavy-chain antibody sequences can be matched on a single-cell basis to resolve the antibody clonality and transcriptomics of antibody-producing B cells. This information allows identification of antibodies with increased specificity and affinity on the basis of selection of antigen-binding B cells with a memory B-cell transcriptional phenotype. Such correlated multiparametric data contribute to understanding the B-cell immune response. In most scRNA-seq protocols, each cell is encapsulated in a liquid droplet which contains molecular tags and reagents necessary for cDNA synthesis and library construction. According to the scRNA-seq of peripheral blood mononuclear cells (PBMCs) from convalescent COVID-19 patients, Rogers et al. reconstructed antibodies with high neutralizing activity that could provide protection from high-dose challenge with SARS-CoV-2 in animal models [16]. Several other groups exploited scRNA-seq to analyze B cells from COVID-19 patients and accelerate the discovery of antibodies with potent SARS-CoV-2-neutralizing activity [17,18,19,20]. One limitation of these approaches is that the frequency of B cells reactive with any specific antigen is usually low and below 0.1% of lymphocytes in human blood. In the case of SARS-CoV-2, SARS-CoV, and Middle East respiratory syndrome coronavirus (MERS-CoV), antigen-specific B cells are not always readily detectable even in convalescent patients [16,21,22,23,24].
Magnetic particle-based enrichment provides a useful approach to increase the number of antigen-binding B cells in a sample. Magnetic beads conjugated to SARS-CoV-2 spike and RBD or antibodies to a B-cell-specific marker such as CD19 have been previously used in conjunction with scRNA-seq to retrieve sequences of antibodies recognizing SARS-CoV-2 antigens [19,25]. We adapted our previously developed methodology for characterization of autoantigen-binding B cells to isolate SARS-CoV-2 antigen-binding B cells [26]. The protocol includes a two-step purification with sequential incubation of human PBMCs with biotinylated-antigen, streptavidin-conjugated AF647 fluorochrome, and anti-AF647 antibody coupled to magnetic beads, before subjecting the labeled cells to magnetic separation and fluorescence-activated cell sorting (FACS) [26]. Here, we employed this methodology to isolate SARS-CoV-2 antigen-binding B cells from seropositive convalescent donors and to define their transcriptional profile and antibody repertoire via scRNA-seq. We showed that SARS-CoV-2 antigen-binding B cells from convalescent donors express a unique transcriptional profile consistent with a memory B-cell response and a distinct antibody repertoire. Our novel approach allows high-yield magnetic enrichment of antigen-specific B cells and cost-effective characterization of their transcriptome and antibody repertoire at the single-cell level.

2. Results

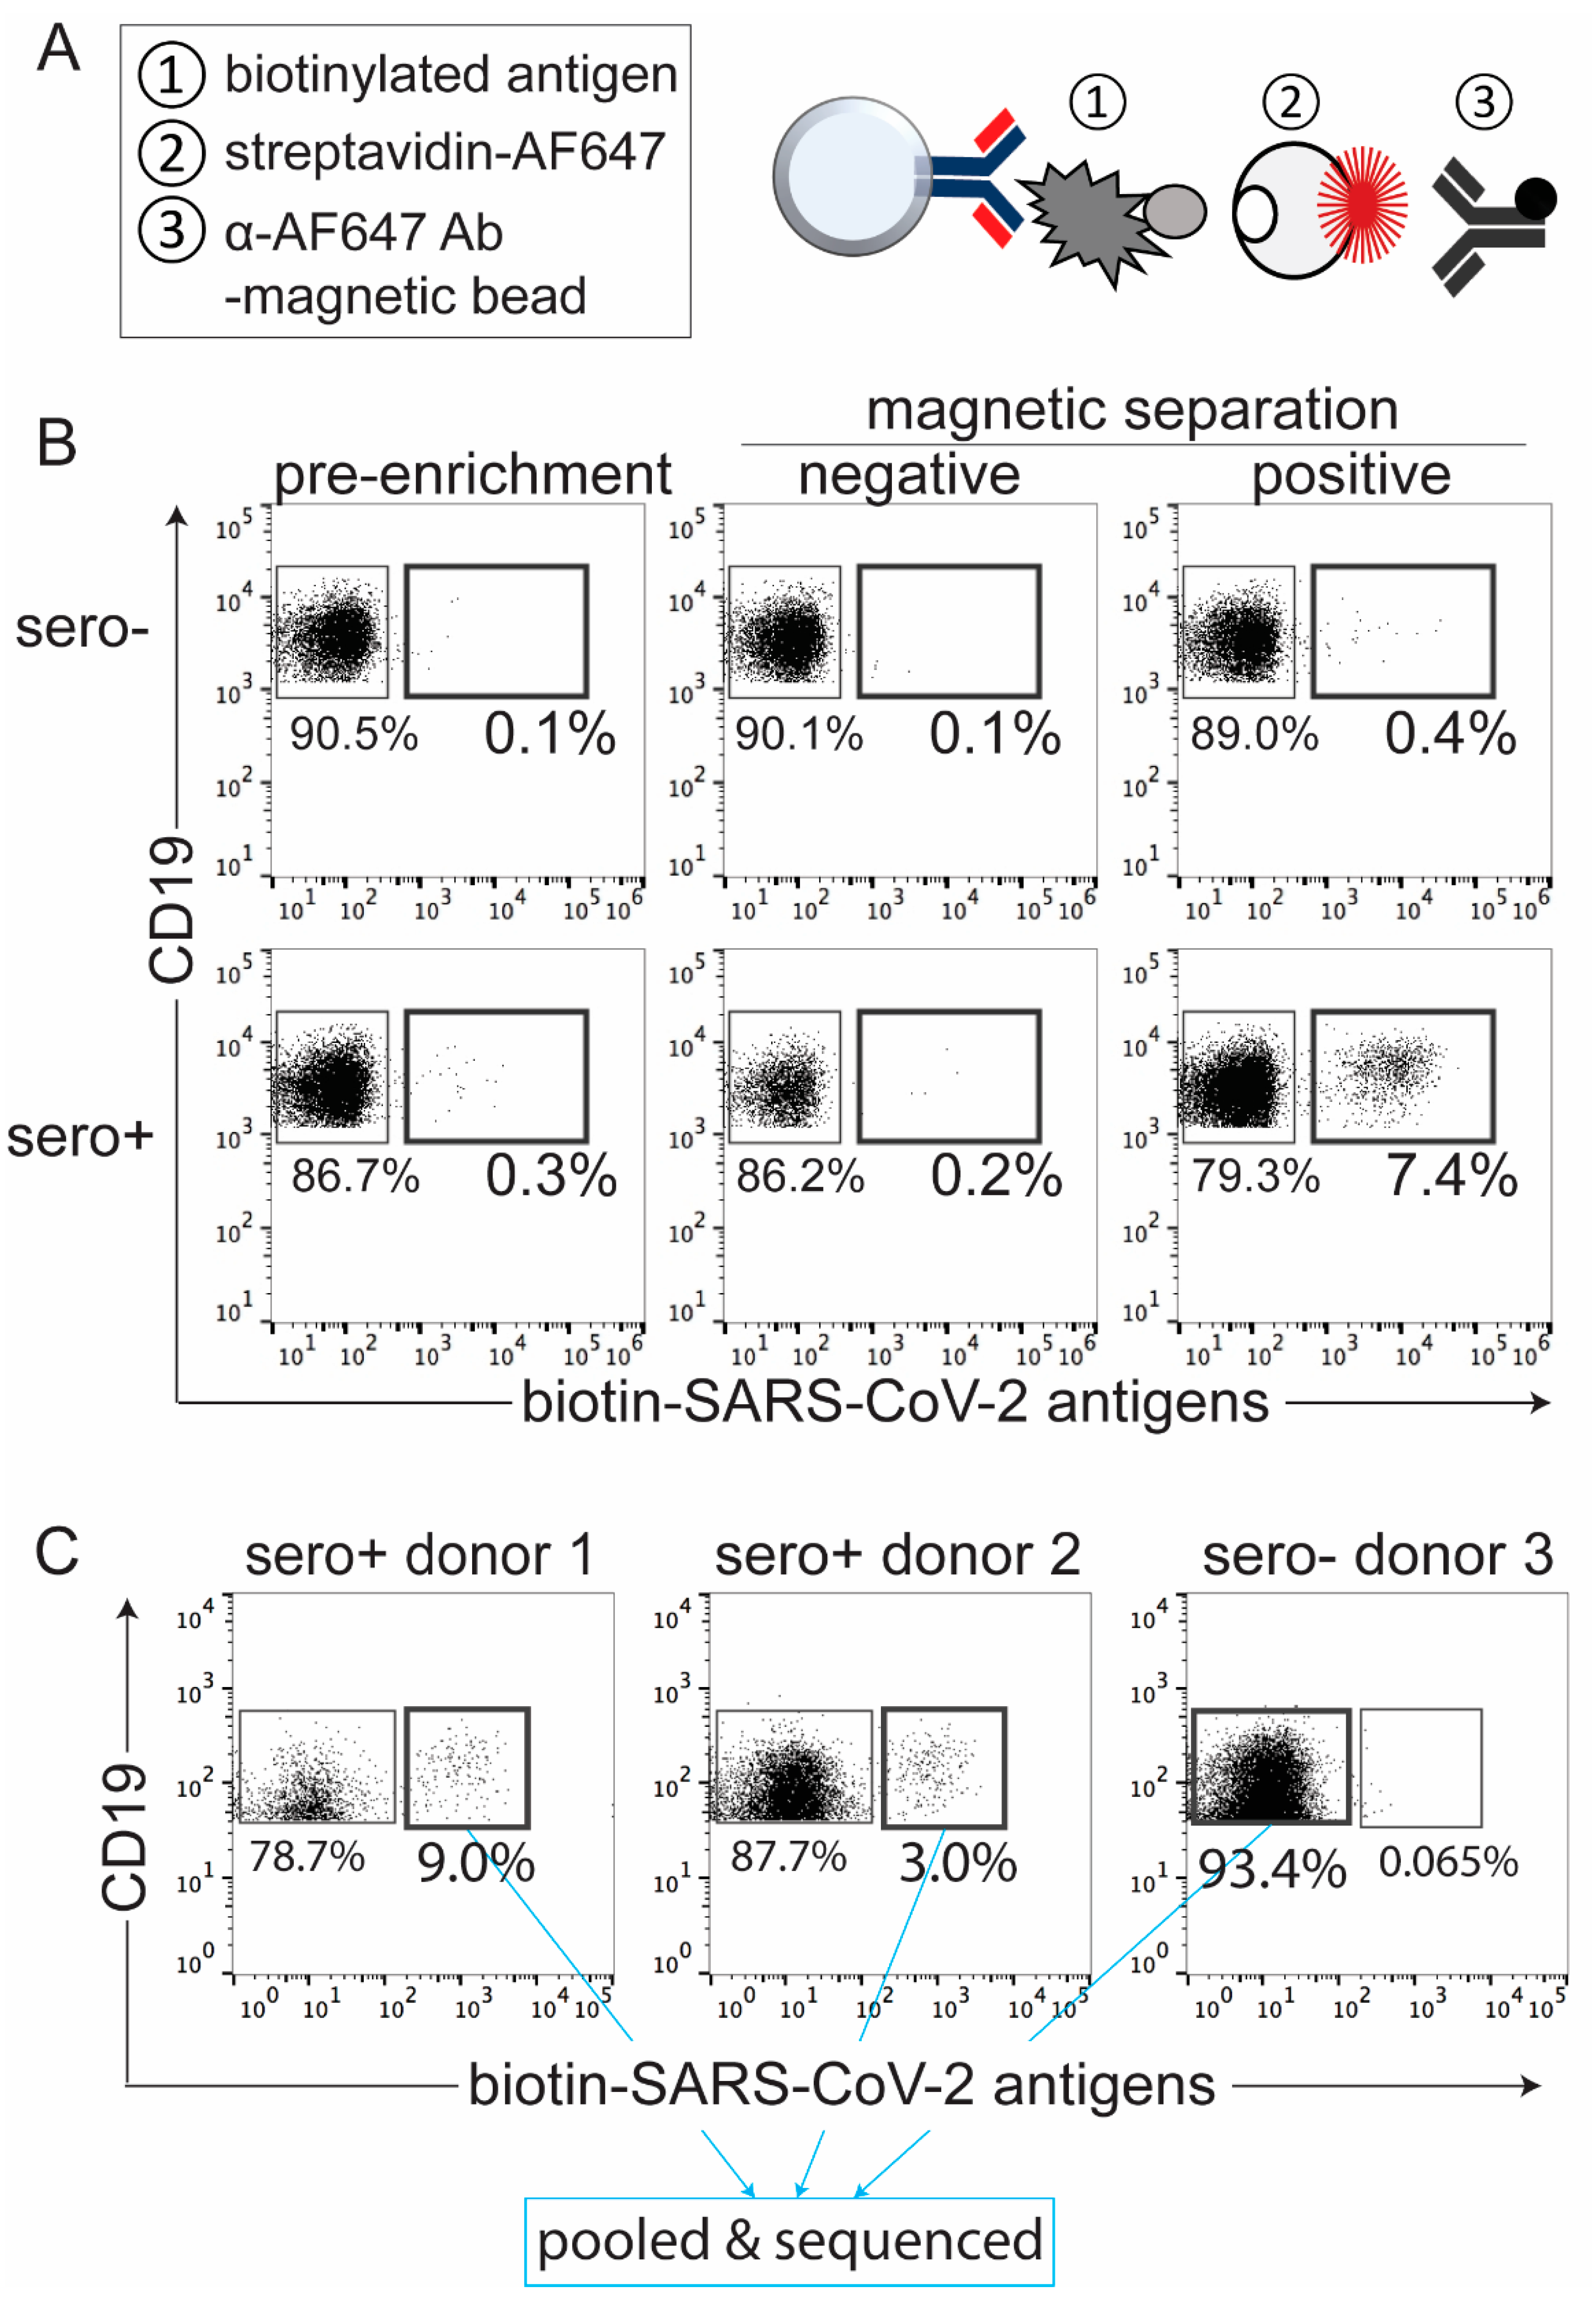
2.1. Detection and Isolation of SARS-CoV-2 Antigen-Binding B Cells from PBMCs Facilitated by Magnetic Bead Enrichment

To optimize the purification of SARS-CoV-2 antigen-binding B cells, we utilized a two-step method to enrich and isolate antigen-binding B cells. Steps included magnetic bead particle enrichment followed by purification by FACS. For the magnetic separation, we applied a “molecular fishing rod” composed of three biologics: biotinylated antigen that binds to the cognate B-cell antigen receptors (BCR) of antigen-binding B cells, streptavidin-conjugated AF647 fluorochrome, and anti-AF647 antibody coupled to magnetic beads (Figure 1A). Antigen-binding B cells, normally occurring in frequency of lower than 0.1% among PBMCs, were enriched via a magnetic column. We minimize the enrichment of B cells that bind non-SARS-CoV-2 antigen components using streptavidin, which is a deglycosylated avidin, and a small organic fluorochrome, AF647, with few epitopes. Compared to other methods, e.g., involving antigens directly conjugated to fluorochromes, our approach is advantageous because it enables a more specific enrichment of cells binding the antigen of interest without collateral enrichment of cells that recognize irrelevant fluorochrome epitopes. However, the use of magnetic columns leads to some nonspecific cell trapping in the matrix. These cells, which normally comprise 20–60% of the enriched population, can be recognized as AF647-negative by flow cytometry. To purify the cell population of interest, we subject the bead-enriched cell population to FACS based on AF647 staining. We previously demonstrated feasibility of this approach to isolate tetanus toxoid- and insulin-binding B cells for flow and mass cytometric analysis [26,27].
To characterize SARS-CoV-2 antigen-binding B cells from human PBMCs, we generated biotinylated SARS-CoV-2 viral antigens: the full-length spike, receptor-binding domain (RBD), and nucleocapsid (N) (data not shown). Using PBMCs from SARS-CoV-2 seropositive donors, we enriched SARS-CoV-2 antigen-binding B cells achieving 25-fold enrichment (Figure 1B). These cells were then purified by FACS. Next, we sought to define the transcriptome and antibody repertoire of these SARS-CoV-2 antigen-binding B cells via scRNA-seq. We isolated B cells that bound to the three biotinylated SARS-CoV-2 antigens from PBMCs of two seropositive donors (Figure 1C, donor 1 and donor 2). In addition, we sorted CD19+ and CD19 cells, irrespective of antigen specificity, from PBMCs of a seronegative donor (Figure 1C, donor 3). Prior to sorting and sequencing, PBMCs from the individual donors were barcoded with a unique molecular identifier through binding with an antibody coupled to an oligonucleotide tag, termed a hashtag antibody. This allowed assignment of each cell to a specific donor following scRNA-seq. To ensure a comparable level of binding for each antibody, we used hashtag antibodies that target ubiquitously expressed cell surface markers: MHC class I β2m subunit and Na+/K+ ATPase from BioLegend. We sorted 154 and 229 SARS-CoV-2 antigen-binding B cells from seropositive donor 1 and donor 2, respectively (Figure 1C). Since 10x Genomics (Pleasanton, CA, USA) suggests a minimum of 10,000 cells per sample to facilitate a successful scRNA-seq experiment, we also added 7000 nonbinding CD19+ B cells and 11,000 CD19 cells from seronegative donor 3, labeled with hashtag 3, as filler cells (Figure 1C, data not shown). Hashtagged, enriched, purified, and pooled cells were subjected to the 10x Genomics scRNA-seq protocols for cDNA synthesis and library construction.

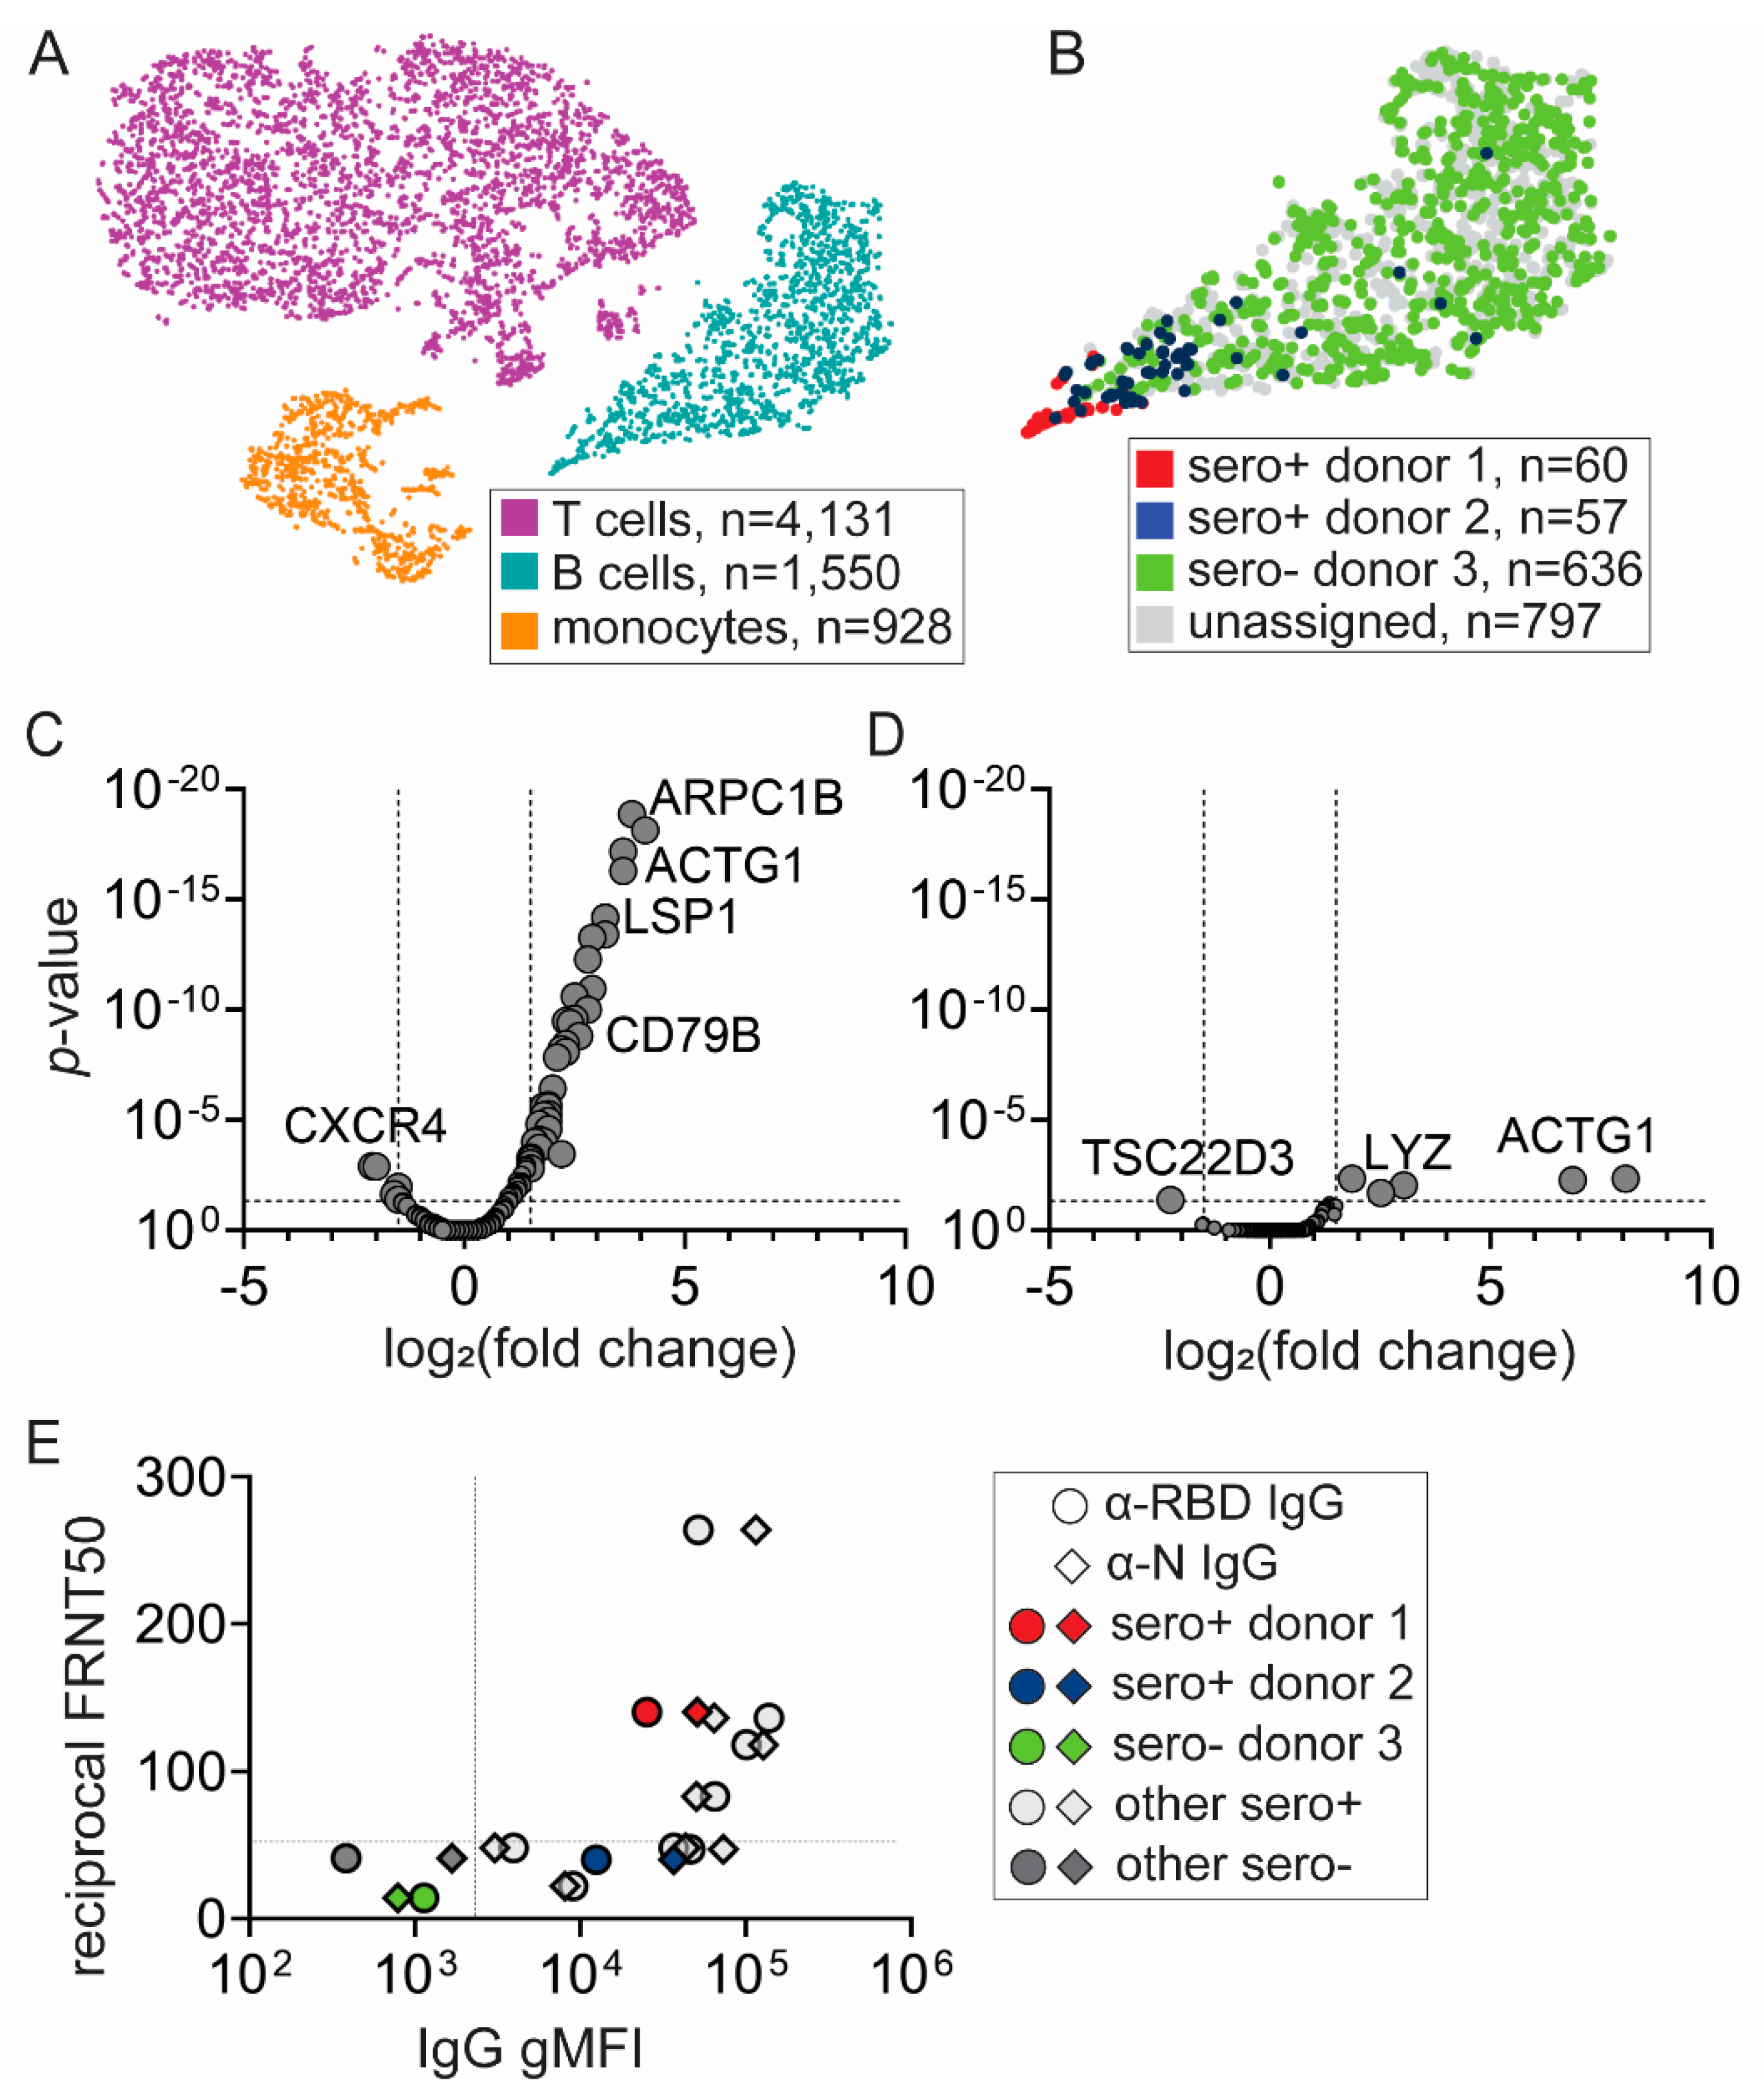
2.2. Unique Transcriptional Profile of SARS-CoV-2 Antigen-Binding B Cells from a Seropositive Donor with Neutralizing Antibody Activity

The four cell populations from three donors were used for generation of three sequence libraries: 5′ total gene expression representing cellular transcriptomics, VDJ for antibody repertoire, and hashtag for establishing the relationship of each cell to its donor. To visualize scRNA-seq results, we applied the t-distributed stochastic neighbor embedding (t-SNE) dimensionality reduction algorithm to plot the cells from three donors in a two-dimensional space, such that each point represents a single cell, and cells with similar transcriptional profiles are closer together. In Figure 2A, we identified T cells (magenta) by transcript markers CD3D, CD3E, B cells (dark turquoise) by CD79A, CD79B, CD19, MS4A1 (transcript of CD20), and monocytes (dark orange) by CD14, ITGAM, FCGR3A. Because the hashtag nucleotide sequence differed for each donor, we were able to bioinformatically identify the origin of each cell and transcript. We superimposed the t-SNA plot of B cell cluster with the hashtag library to compare SARS-CoV-2 antigen-binding B cells from seropositive donor 1 (red) and donor 2 (blue), as well as nonbinding B cells from seronegative donor 3 (green) (Figure 2B). B cells for which the hashtag assignment was incomplete are represented in gray. The T and monocyte clusters were derived from CD19 filler cells from seronegative donor 3 (data not shown).
Next, we determined differences in gene expression (Figure 2C,D). In the B-cell subset, we detected the expression of 272 genes. Compared to nonbinding B cells from seronegative donor 3, 45 out of 266 genes in SARS-CoV-2 antigen-binding B cells from donor 1 and six out of 240 genes in SARS-CoV-2 antigen-binding B cells from donor 2 were significantly expressed (Figure 2C,D, Supplementary Tables S1 and S2). These genes can be associated with biological processes such as actin processing (ARPC1B, RAC2, ACTG1, CORO1A, CNN2), as well as metabolism and calcium processing (OAZ, UCP2, S100A4, CNN2). We also found upregulation of transcripts encoding cell surface markers such as MS4A1, CD79B, LSP1, Ly6E, and CD52. The limited sample size of SARS-CoV-2 antigen-binding B cells (n = 117) precludes determination of whether these cells have activated or memory B cell profiles. However, these data indicate that the transcriptome of SARS-CoV-2 antigen-binding B cells significantly differs from nonbinding B cells. Additionally, the SARS-CoV-2 antigen-binding B cells from donor 2 are transcriptionally more similar to B cells from an uninfected donor than the SARS-CoV-2 antigen-binding B cells from donor 1.

2.3. Transcriptional Signature of SARS-CoV-2 Antigen-Binding B Cells Is Correlated with the Neutralizing Activity of the Donor’s Serum Antibodies

To gather more insight regarding differences between SARS-CoV-2 antigen-binding B cells derived from two different seropositive donors, we tested plasma samples from the donors for antibody titers and neutralizing activity by established methods [28]. We measured IgG antibody to RBD and N by a rapid flow-based multiplex microsphere immunoassay (MMIA) and neutralizing activity by focus reduction neutralization test (FRNT), which defines antibody dilution that reduces the number of viral foci by half [28]. To understand how the antibody responses of the donors compare to the broader population, we included other seropositive and seronegative plasma samples from donors whose PBMCs were not subjected to scRNA-seq analysis (Figure 2E). Interestingly, plasma samples from donor 1 and donor 2 had robust anti-RBD and anti-N antibodies; however, only antibodies from donor 1 had neutralizing activity compared to threshold levels from donor 2 and HC donor 3 (Figure 2E). These data are also consistent with a more protective antibody response in donor 1.

2.4. Analysis of B-Cell Ontogeny Signature

The single-cell transcriptional data were not able to resolve whether the B cells from donors 1 and 2 exhibited a stronger memory phenotype. However, the observation that the SARS-CoV-2 antigen-binding B cells from donor 1 were less similar to B cells from the control donor than those of donor 2 suggests that donor 1 B cells were more differentiated. Additionally, the serum antibodies from donor 1 were more effective at neutralizing SARS-CoV-2 virus than those from donor 2. On the basis of these findings, we performed a deeper analysis of cells in the respective B cell clusters to better understand their transcriptional differences (Figure 3).
Using the 10x Genomics Loupe Cell browser, we found three B cell subclusters: subcluster 1 (violet), subcluster 2 (yellow), and subcluster 3 (aqua marine) (Figure 3A). Next, we identified 35 genes that were uniquely and differentially expressed in subcluster 1 and 3 when compared to all B cell subclusters (Figure 3B, Supplementary Table S3). We reasoned that, if SARS-CoV-2 antigen-binding B cells were differentiated and had a memory phenotype, we should find transcriptional differences reflecting such a status. Since subcluster 3 contained over 99% nonbinding B cells from seronegative donor 3 and subcluster 1 contained 95.7% of SARS-CoV-2 antigen-binding B cells, we thought that the genes expressed by cells in these subclusters should be enriched for genes expressed in naïve and memory B cells, respectively. To test this, we compared the 35 identified genes in subcluster 1 and subcluster 3 to a public database GenomicScape at http://www.genomicscape.com of transcriptional signature throughout the course of human B-cell development [29]. Of 35 genes, 22 genes exhibited 1.5-fold-change difference with p-value <0.05 between naïve and memory B cells. We found that 12 genes with increased relative expression in subcluster 1 which contained SARS-CoV-2 antigen-binding B cells were significantly upregulated in memory B cells (Figure 3C). Likewise, nine genes with increased relative expression in subcluster 3 which contained nonbinding B cells were significantly upregulated in naïve B cells (Figure 3C). Only one of the 22 genes, MEF2C, was discordantly assigned as it had increased expression in subcluster 1 but exhibited decreased expression in memory B cells compared to naïve B cells. Together, our results suggest that transcriptional profile of SARS-CoV-2 antigen-binding B cells from convalescent donors is biased toward memory B-cell gene signature.

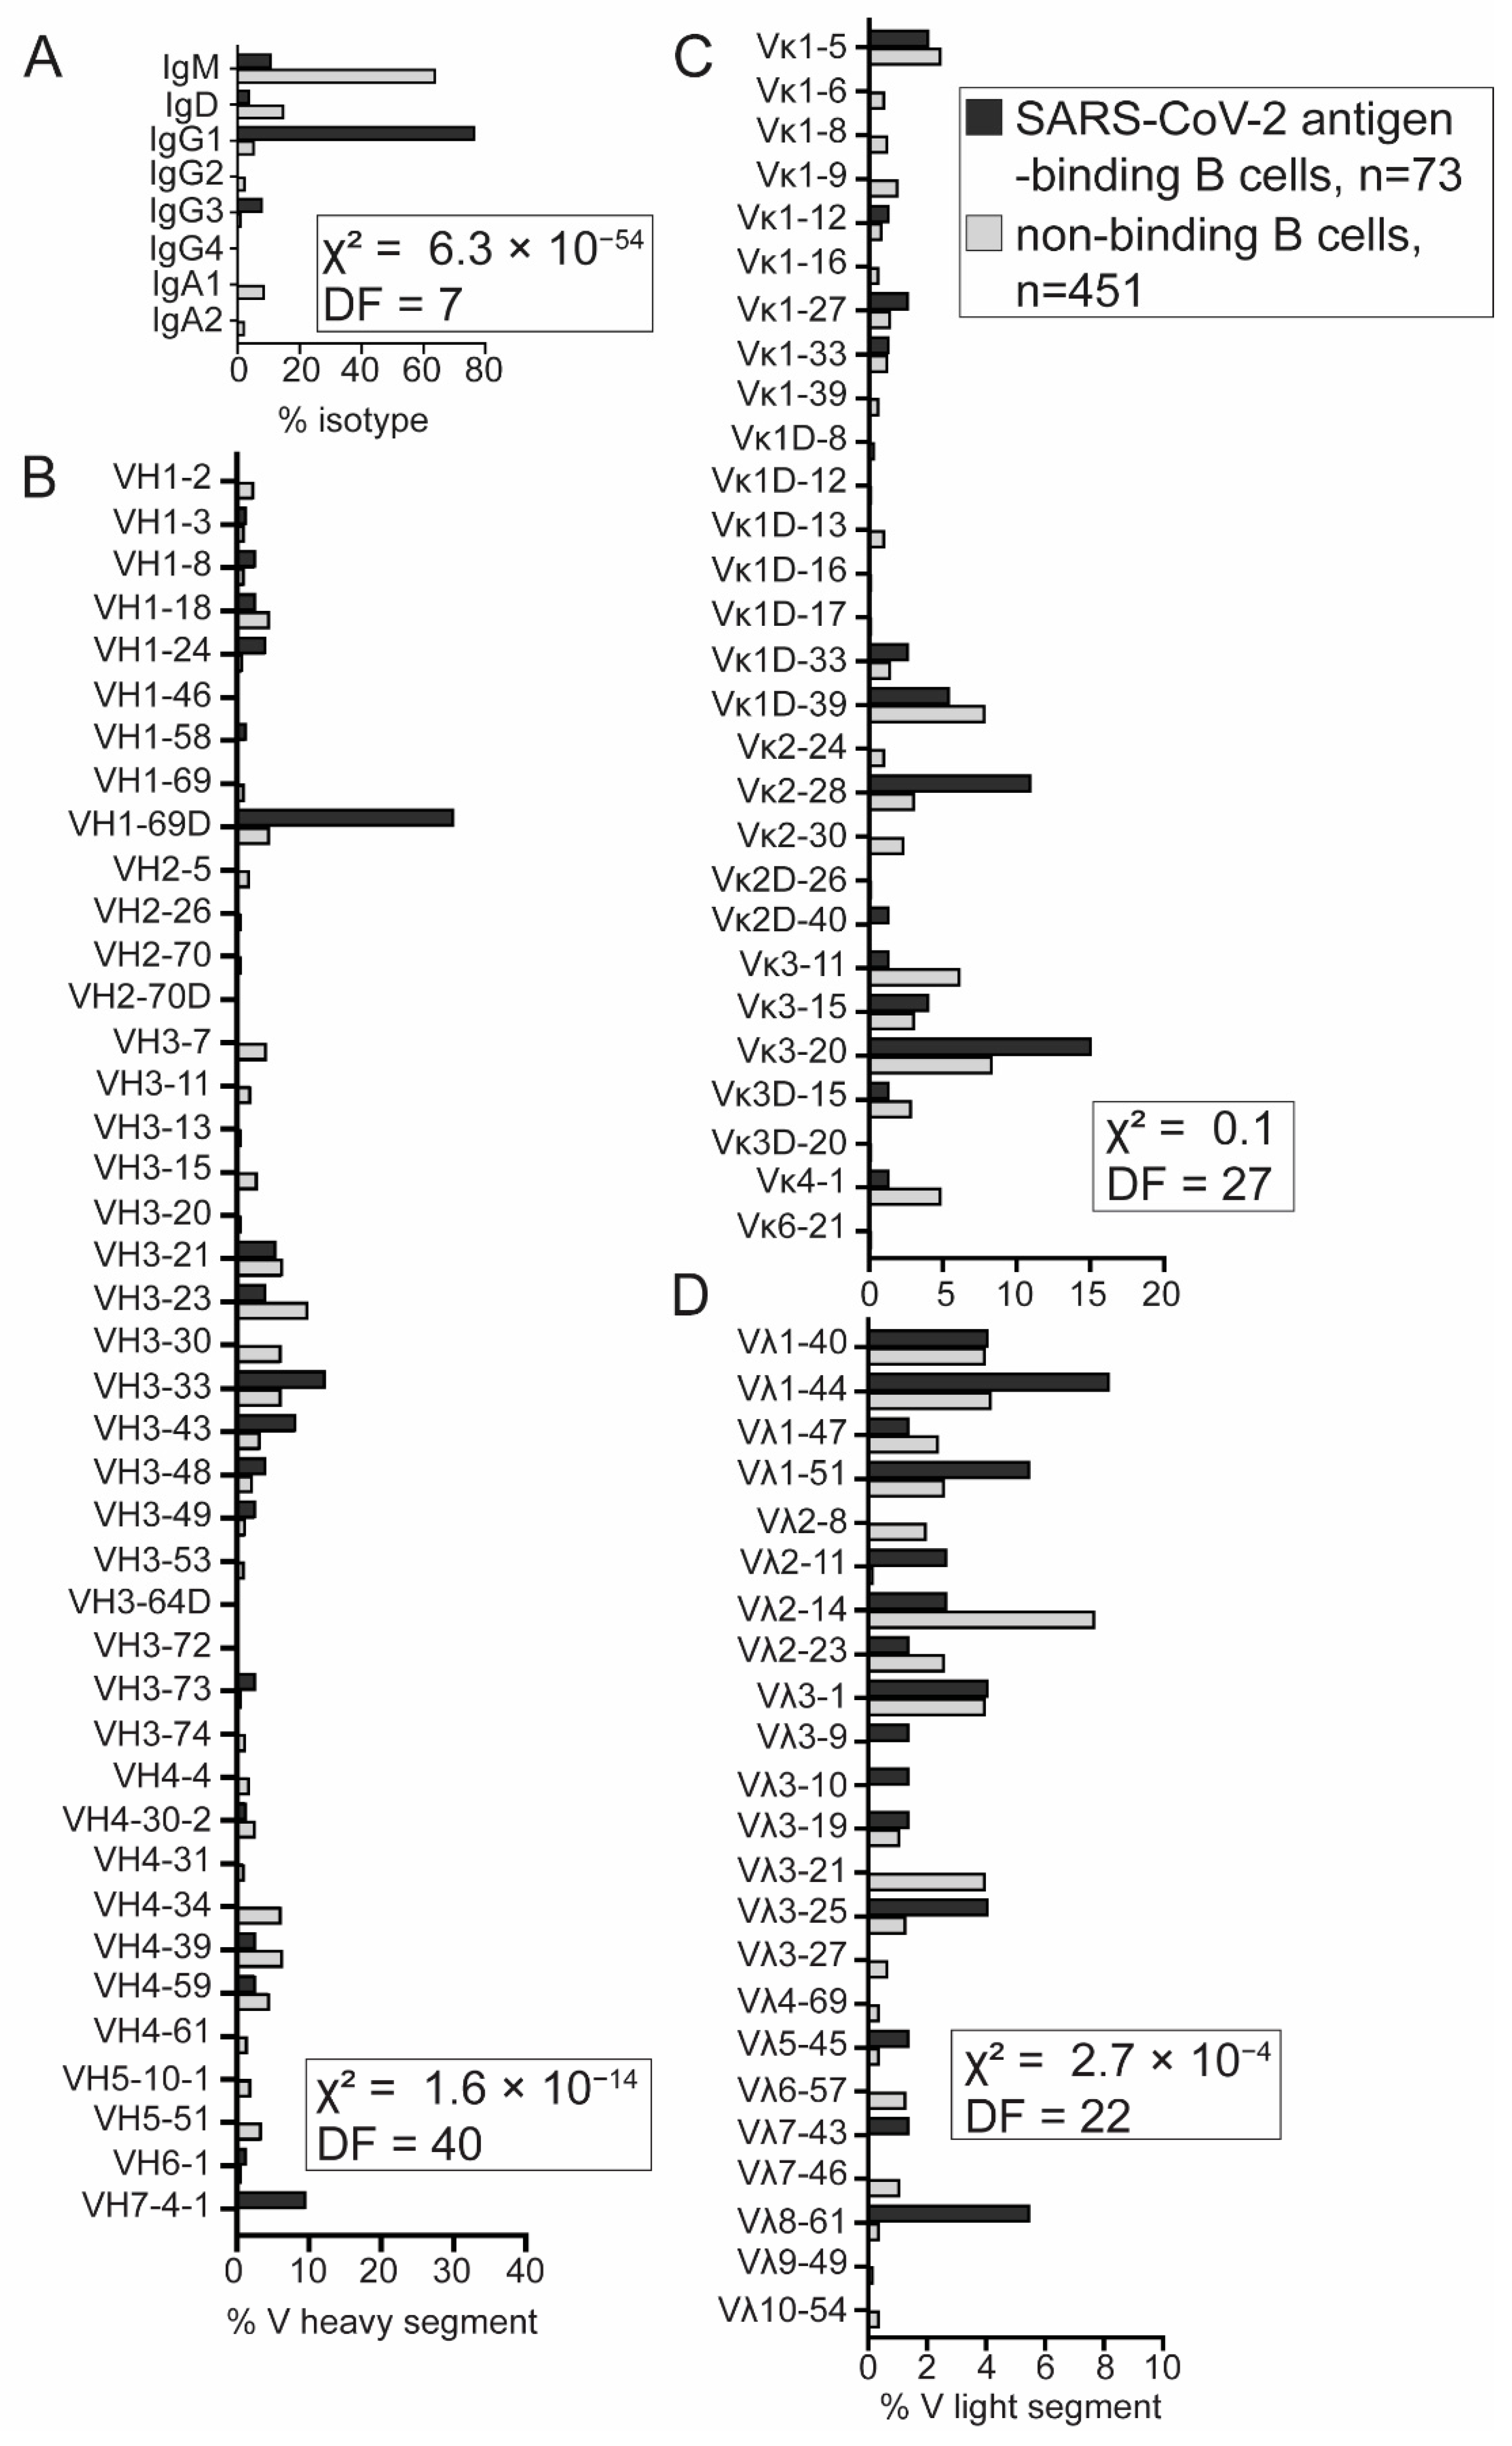
2.5. Distinct VDJ Repertoire Expressed by SARS-CoV-2 Antigen-Binding B Cells

We did not observe striking differences in the immunoglobulin VDJ usage between SARS-CoV-2 antigen-binding cells from seropositive donor 1 and 2. Therefore, we analyzed SARS-CoV-2 antigen-binding B cells from the two donors together and compared them to nonbinding B cells from seronegative donor 3. Over 75% of SARS-CoV-2 antigen-binding B cells expressed the IgG1 constant region, indicating that these cells are not naïve but rather are antigen-experienced and class-switched (Figure 3A). Next, we observed that the distribution of isotypes, i.e., the variable segment of heavy chain and of light chain lambda but not of kappa, is significantly different in SARS-CoV-2 antigen-binding B cells compared to nonbinding B cells (Figure 4). We found that SARS-CoV-2 antigen-binding B cells are enriched in the V segments of heavy chain: VH1-69D, VH3-33, VH3-43, VH3-48, and VH7-4-1 (Figure 4B). Interestingly, VH1-69 (which is closely related to VH1-69D), VH3-33, and VH7-4-1 have been identified among potent SARS-CoV-2 neutralizing antibodies by other groups [16,30]. In addition, the VH4-34 that is encoded in an autoreactive antibody recognizing carbohydrates on red blood cells and B cells and that confers autoreactivity was only found among nonbinding B cells (Figure 4B). This observation is consistent with the idea that SARS-CoV-2 antigen-binding B cells in this dataset are likely not autoreactive. Among light chains, we observed that SARS-CoV-2 antigen-binding B cells preferentially express the V segments of light chain: Vκ1-27, Vκ1D-33, Vκ2-28, Vκ3-20, Vλ1-44, Vλ1-51, Vλ8-61.
We analyzed complementarity determining region 3 (CDR3) in the heavy chain because of its close contact with an antigen. The distribution of heavy chain CDR3 length was significantly skewed toward longer CDR3 in SARS-CoV-2 antigen-binding B cells from seropositive donor 1 and 2 compared to nonbinding B seronegative donor 3 (Supplementary Figure S1A). In addition, the composition of positively but not negatively charged amino-acid residues in the CDR3 heavy chain was different between SARS-CoV-2 antigen-binding and nonbinding B cells (Supplementary Figure S1). The number of positively charged amino acids in CDR3 heavy chain exhibited a narrower range in SARS-CoV-2 antigen-binding B cells compared to nonbinding B cells (Supplementary Figure S1).
Lastly, we selected 19 paired heavy and light chain sequences from our identified SARS-CoV-2 antigen-binding B cells for the recombinant antibody (recAb) generation. These 19 antibodies were tested for reactivity against the spike S1 and S2 subunits and N via surface plasmon resonance. Among these, 18 exhibited high affinity for N and one for S1 (Table 1). Together, VDJ library analysis indicated that most SARS-CoV-2 antigen-binding B cells from convalescent donors are class-switched memory cells expressing a unique VDJ repertoire with reactivity to N-protein.

3. Discussion

B cells and their antibodies provide essential immunity to neutralize and eliminate viral infections. The progressive improvements in scRNA-seq have facilitated the understanding of B-cell immune responses on an unprecedented scale. The method of isolating SARS-CoV-2 antigen-binding B cells described here relies on magnetic cell separation and FACS to enrich and purify antigen-reactive cells (Figure 1). We predict that these two purification steps are critical for successful downstream scRNA-seq analysis and retrieval of high-quality antigen-specific antibody sequences. Our scRNA-seq results provided confirmation that seropositive donors were previously infected with SARS-CoV-2 (Figure 2 and Figure 3). In support of this argument, the transcriptional profile of SARS-CoV-2 antigen-binding B cells indicated enrichment for a memory B-cell gene signature (Figure 3). Furthermore, we observed transcriptional differences between SARS-CoV-2 antigen-binding B cells from the two convalescent donors that were correlated with relative antibody neutralizing activity and titers. Increased neutralizing activity and titers in donor 1 were correlated with a transcriptional profile that places the SARS-CoV-2 antigen-binding B cells at a more extreme memory phenotype (Figure 2 and Figure 3). Additionally, the distribution of heavy and lambda light-chain segment usage was significantly different in SARS-CoV-2 antigen-binding B cells compared to nonbinding B cells, indicating a bias in the selection of antibody heavy and light variable regions (Figure 4). Interestingly, the majority of our recAbs were reactive with N (Table 1). Recently, Dugan et al. showed that antibodies derived from memory B cells in convalescent donors and reactive to N did not neutralize the SARS-CoV-2 virus [20]. Combining magnetic cell separation, FACS, and scRNA-seq allowed us to efficiently characterize the transcriptome of SARS-CoV-2 antigen-binding B cells and their antibodies.
Although, our study is limited by a small seropositive sample size, we identified important molecular features that allowed us to discriminate SARS-CoV-2 antigen-binding from nonbinding B cells. Akin to other studies, we observed that antibodies targeting SARS-CoV-2 viral antigens exhibited diverse variable gene segments [16,25,31,32]. Similar to a previous report, we did not observe a significant clonal expansion within our dataset [31]. In addition, we found an enrichment of VH1-69D (closely related to VH1-69), VH3-33, and VH7-4-1 in SARS-CoV-2 antigen-binding B cells compared to nonbinding B cells, which was previously reported in antibodies with potent SARS-CoV-2-neutralizing activity [16,30]. Others have recently reported the prevalence of variable gene segments such as VH1-18, VH3-23, VH4-39, and VH4-59 in SARS-CoV-2 antigen-binding B cells [16,18,25,32]. Although, we detected these variable gene segments among our SARS-CoV-2 antigen-binding B cells, their frequency was lower compared to nonbinding B cells. These disparate results may stem from the usage of different SARS-CoV-2 antigens. Along with SARS-CoV-2 spike and RBD, we also included N in our isolation. Therefore, it is possible that our set contains antibodies which target spike, RBD, or N.
CDR3 of the heavy chain (HCDR3) is often in close contact with the antigen. Whereas we observed a bias for longer heavy chains, others noted that the length of HCDR3 in SARS-CoV-2-specific antibodies is either shorter or similar to nonspecific antibodies [31,32]. Skewing toward longer HCDR3 has been described in viral infections and autoimmune diseases, as well as in auto- and polyreactive B cells [33,34]. However, shorter HCDR3 length distributions have been reported in patients with autoimmune diseases such as systemic lupus erythematosus and systemic sclerosis [35,36]. While the HCDR3 length cannot reliably be used in determining reactivity of a particular heavy-chain sequence, expression of the sequences as recombinant antibodies can resolve whether longer HCDR3 are associated with increased specificity and affinity to SARS-CoV-2 antigens.
We predict that there are several potential applications for antigen-specific B-cell isolation as it was previously applied to study insulin-binding and tetanus toxoid-binding B cells [26,37]. The methodology can in principle be adapted to any soluble antigen that is amenable to biotinylation. Alternative tagging strategies may expand target antigen compatibility. Transcriptome and antibody sequence data from antigen-specific B cells can accelerate the pace of research performed on emerging pathogens and novel infectious diseases to understand immune responses to natural infection and vaccination. Once antigen-binding antibody sequences are determined, generation of recombinant antibodies can aid in testing for novel candidates for diagnostics and therapeutics use. Indeed, such an approach has been used to identify potent neutralizing antibodies from convalescent COVID-19 patients [16]. By requiring only convalescent blood cells and biotinylated antigen, this method ensures a rapid route to develop novel monoclonal antibody therapies. Likewise, monoclonal antibodies targeting mutated or resistant strains of SARS-CoV-2 or other infectious viruses can be identified faster using this approach. In addition to natural infection, the methodology can be applied to better understand immune responses to vaccination and to improve design of novel vaccines. Antibody characterization in combination with transcriptional profiling of antigen-specific B cells can be used to identify cell-intrinsic factors that are involved in the development and selection of B cells producing neutralizing antibodies by vaccines and adjuvants. As such, B cells expressing transcripts of IgG, CD38, and CD27 can indicate the development of memory and differentiation of these cells into antibody secreting cells.
Similarly, antigen-specific B cells that recognize self- or tumor-associated antigens can be isolated to dissect which cellular pathways are differentially expressed genes. For example, biotinylation of anticyclic citrullinated peptides and rheumatoid factor was used to identify antigen-specific B cells in certain rheumatoid arthritis patients [38]. Similarly, the magnetic separation approach was utilized to identify islet-binding T cells in PBMCs of type 1 diabetic patients and healthy individuals [39]. As our understanding of the contribution of tumor-infiltrating B cells in antitumor immune responses is becoming clearer, characterization of these cells will be crucial for better immunotherapeutic approaches [40]. Together, we developed an efficient methodology to enrich and isolate antigen-specific B cells for analyzing transcriptional profile and antibody repertoire. Characterization of antigen-specific B cells can benefit diagnostic and therapeutic approaches in diverse viral, autoimmune, and cancer diseases.

4. Materials and Methods

4.1. Research Subject Selection

PBMCs and plasma samples were obtained from New York Blood Center, USA. PBMCs were isolated via standard leukofilters used in blood banks to generate leukoreduced whole blood or plasma or from buffy coats via Ficoll separation. All samples were collected in April and May 2020 and were confirmed to be virus-negative by quantitative reverse transcription PCR (RT-qPCR, Lyra SARS-CoV-2 Assay, Quidel). For scRNA-seq analysis, donors were selected on the basis of plasma antibody seropositivity determined by surface plasmon resonance (Biacore, Cytiva). Briefly, His-tagged SARS-CoV-2 antigens (nucleocapsid (N) (GenScript), spike subunit 1 (S1), spike subunit 2 (S2) (Sino Bio)) were immobilized on nickel saturated sensory chip NTA. Next, samples were added with subsequent binding of human IgG and IgM. Samples containing IgG antibodies targeting N, S1, and S2 with resonance unit (RU) values above the threshold were considered seropositive.

4.2. Preparation of Antigens for Isolating SARS-CoV-2 Antigen-Binding B Cells

Three SARS-CoV-2 antigens (180 kDa spike, 27 kDa RBD, 50 kDa N) were used for enrichment of SARS-CoV-2 antigen-binding B cells. RBD and spike were produced in transfected HEK293 cells and N in E. coli at CU Anschutz Medical Campus. Antigens were chemically labeled with biotin via sulfo-NHS long chains, according to the manufacturer’s protocols (Thermo Fisher Scientific, Waltham, MA, USA).

4.3. Enrichment and Fluorescence Cell Sorting of SARS-CoV-2 Antigen-Binding B Cells

PBMCs were treated with human Fc block (Miltenyi Biotec, Bergisch Gladbach, Germany) to reduce nonspecific binding of antibodies to Fc receptors. To detect SARS-CoV-2 antigen-binding B cells, PBMCs were stained with CD19-BV510 (BioLegend, San Diego, CA, USA), 0.1 μg of biotinylated-RBD, 0.1 μg of biotinylated-spike, and 0.1 μg of biotinylated-N for 30 min, on ice. After washing with FACS buffer (1% bovine serum albumin in PBS), PBMCs were incubated with 2 µg of streptavidin-conjugated Alexa Fluor 647 (Invitrogen) for 20 min on ice. Cells were washed and resuspended in MACS buffer (0.5% BSA, 2 mmol/L EDTA in PBS), before incubating with anti-Cy5/anti-Alexa 647 microbeads (Miltenyi Biotec) for 15 min at 4 °C. As indicated by the manufacturer, the anti-Cy5/anti-Alexa Fluor 647 antibodies on these beads react with both the Alexa Fluor 647 and Cy5 fluorochromes. To enrich SARS-CoV-2 antigen-binding B cells, MACS® LS column (Miltenyi Biotec) were used. DAPI was used to discriminate between live and dead cells. Flow cytometry and cell sorting was performed on LSR Fortessa X-20 (BD Biosciences, Franklin Lakes, NJ, USA) and MoFlo Astrios EQ (Beckman Coulter, Brea, CA, USA), respectively. Data were analyzed with FlowJo software version 9 (BD Biosciences).

4.4. Cellular Barcoding

During staining with surface antibodies and antigens, PBMCs were additionally labeled with TotalSeq-C antibodies (BioLegend): donor 1—TotalSeq-CO251 anti-human hashtag 1 with a barcode sequence 5′-GTCAACTCTTTAGCG-3′, donor 2—TotalSeq-CO252 anti-human hashtag 2 with a barcode sequence 5′-TGATGGCCTATTGGG-3′, donor 3—TotalSeq-CO253 anti-human hashtag 3 with a barcode sequence 5′-TTCCGCCTCTCTTTG-3′. Hashtagging was performed for 30 min, on ice. After sorting, cells from different donors were pooled for 10x Genomics library construction.

4.5. Single-Cell RNA-Seq (scRNA-Seq) Library Preparation, Sequencing, and Data Processing

High-affinity SARS-CoV-2 antigen-binding B cells were sorted into PBS supplemented with 10% fetal bovine serum (FBS), counted, and assessed for cell viability. Cells were diluted into a final concentration of 700 cells/µL. Single-cell RNA-sequencing (scRNA-seq) was performed with 10x Genomics pipelines and protocols. Briefly, about 7000 cells were loaded onto the Chromium Controller microfluidics device, and each cell was encapsulated in oil-droplet-containing sequencing beads and cDNA synthesis reagents (10x Genomics). Three libraries were prepared: 5′ gene expression, hashtag, and VDJ, according to the manufacturer’s instructions. Briefly, reverse transcription (RT) of total mRNA occurred in individual droplets to generate barcoded cDNA. Simultaneously, hashtag barcodes were captured and overlap-extended with mRNA transcripts within the same droplet to generate DNA. After RT, droplets were broken, and the cDNA and DNA were amplified by PCR, purified, and separated with size selection beads. VDJ was amplified with additional cycles of PCR using primers provided in human B cell Chromium Single-Cell V(D)J Enrichment Kit (10x Genomics). Sequencing was performed on a NovaSEQ 6000 system (Illumina). Raw FASTQ files were processed with the 10x Genomics Cell Ranger software pipeline (version 3.1.0) using human reference genomes: GRCh38-2020-A and vdj_GRCh38_alts_ensembl-3.1.0. Analysis was performed using 10x Genomics software: Loupe Cell and Loupe VDJ Browsers.

4.6. SARS-CoV-2 Multiplex Microsphere Immunoassay (MMIA)

SARS-CoV-2 MMIA was previously published [28]. Briefly, LEGENDplex carboxyl beads (BioLegend) with different sizes and allophycocyanin (APC) fluorescence intensity were conjugated to BSA (sample negative control), tetanus toxoid (sample positive control), SARS-CoV-2 nucleocapsid (N), and receptor-binding domain (RBD), according to the manufacturer’s protocol. Antigen-conjugated beads were incubated with plasma samples for 1 h at room temperature and detected by anti-human IgG-biotin, followed by streptavidin–phycoerythrin (SA–PE). CytoFlex cytometer (Beckman Coulter) and FlowJo software v.10.7.1 (BD Biosciences) were used to obtain geometric median fluorescence intensity (gMFI).

4.7. Focus Reduction Neutralization Test (FRNT)

Plasma samples were heat-inactivated, serially diluted (1% FBS, DMEM), and added to Vero E6 cells (ATTC) previously seeded in 96-well plates. Then, 100 focus-forming units of SARS-CoV-2 USA-WA1/2020 were added to each well and incubated for 1 h at 37 °C. The following steps were applied to infected cells: (1) capture with 1% methylcellulose (MilliporeSigma, Burlington, MA, USA) in 2% FBS, minimum essential medium for 30 h at 37 °C; (2) fixation with 4% paraformaldehyde; (3) incubation with monoclonal human IgG1 antibody against SARS-CoV and SARS-CoV-2 spike (clone: CR3022, Invivogen, San Diego, CA, USA) in perm wash (0.1% saponin, 0.1% BSA) for 2 h at RT; (4) incubation with horseradish peroxidase (HRP)-conjugated goat anti-human IgG (Southern Biotech, Birmingham, AL, USA) for 1.5 h at RT; (5) visualization with TrueBlue substrate (Thermo Fisher Scientific). SARS-CoV-2-positive foci were analyzed with CTL BioSpot analyzer and software (Cellular Technology Limited). The reciprocal antibody dilution which reduces viral foci number by 50% (FRTN50) was calculated relatively to a virus only control.

4.8. Transcriptional Signature of B Cell Ontogeny

B-cell subclusters were defined by unsupervised clustering via 10x Cell Ranger software with a prebuilt human reference transcriptome available at www.10xgenomics.com and visualized by 10x Loupe Browser (see Section 4.5). Analysis yielded three subclusters amongst the pooled CD19+ SARS-CoV-2 antigen-binding and nonbinding B cells. Cluster-based log2 fold-change and p-values were exported from 10x Genomics Loupe Cell Browser for the 272 detected genes. To set thresholds for analysis of ontogeny signatures, a p-value of <0.05 that captured the tenth percentile of most significantly differentially expressed genes was selected. Additionally, visual inspection of volcano plots (Figure 3B) demonstrated that intersection of subcluster 1 and subcluster 3 corresponded to a threshold p-value lower than 0.05 with log2 of 1.5-fold change expression equating to <−0.848 or >0.848. Genes with reciprocal changes in expression in each of subcluster (i.e., genes significantly upregulated in subcluster 1 and significantly downregulated in subcluster 3) were selected. As such, 35 unique and unambiguous genes corresponding to increased or decreased expression in the three subclusters were probed against the GenomicScape atlas of gene expression differences across human B cell ontogeny from naïve to plasma cells at http://www.genomicscape.com [29]. Online significance analysis of microarrays webSAM and interface to R-language microarray analysis pipelines were used to define differences in gene expression between naïve (n = 5 samples) and memory B cell (n = 5 samples) [29,41,42].

4.9. Generation of Recombinant Antibodies

Recombinant antibodies were expressed by GenScript by high-throughput antibody production (HTP Gene to Antibody) service.

4.10. Statistical Analyses

All data analysis was performed using Prism software (GraphPad Version 9). Statistical tests were indicated in figure legends. A p-value < 0.05 was considered statistically significant.

Supplementary Materials

The following are available online at https://www.mdpi.com/article/10.3390/magnetochemistry8020023/s1: Figure S1. Characteristics of IgH CDR3 segment from SARS-CoV-2 antigen-binding B cells; Table S1. List of 45 out of 266 differentially and significantly expressed genes between SARS-CoV-2 antigen-binding B cells from seropositive donor 1 and nonbinding B cells from seronegative donor; Table S2. List of six out of 240 differentially and significantly expressed genes between SARS-CoV-2 antigen-binding B cells from seropositive donor 2 and nonbinding B cells from seronegative donor; Table S3. Thirty-five unique and unambiguous genes with significantly increased or decreased expression in B cell subcluster 1 and subcluster 3.

Author Contributions

Conceptualization, M.B., J.C.C. and A.S.; experimentation, M.B., M.K.M., C.R., A.S., R.M.K. and T.E.M.; data analysis, M.B., I.T.W.H., M.K.M., C.R., A.S., R.M.K., T.E.M. and J.C.C.; manuscript preparation, M.B., I.T.W.H. and J.C.C.; project administration, M.B. and J.C.C.; funding acquisition, M.B. and J.C.C. All authors have read and agreed to the published version of the manuscript.

Funding

Studies were founded by Colorado Clinical and Translational Sciences Institute Pilot Grant Award (M.B.), Rheumatology Research Foundation Scientist Development Award (I.T.W.H.), and Quidel Corporation (J.C.C.).

Institutional Review Board Statement

The Institutional Review Board (IRB) at the New York Blood Center provided oversight for subject recruitment. All donors provided written consent for approval of donation and blood collection. Samples used in this study were de-identified by NYBC, followed by their processing at Quidel Corporation and completion of experimentations at University of Colorado Anschutz Medical Campus. As such, those de-identified samples are not qualified as human subjects research and not subject to IRB of the Research Compliance Office at the University of Colorado.

Data Availability Statement

Data available on request due to restrictions e.g. privacy or ethical.

Acknowledgments

We thank Elan Eisenmesser, Jasmina Redzic, Mario Santiago, and Kejun Guo, from the School of Medicine at CU Anschutz, for their kind donation of SARS-CoV-2 antigens: nucleocapsid and full-length spike as well as Jian Yang from Quidel Corporation for his experimental support. We would like to express our gratitude to the CU Anschutz Cancer Center Flow Cytometry and Genomics Shared Resources for technical assistance.

Conflicts of Interest

J.C.C. received funding for these studies from Quidel Corporation but does not have an equity position in the company. Several antibodies generated from this study are being currently developed for diagnostic tests by Quidel Corporation.

References

  1. Patel, N.J.; D’Silva, K.M.; Hsu, T.Y.; DiIorio, M.; Fu, X.; Cook, C.; Prisco, L.; Martin, L.; Vanni, K.M.M.; Zaccardelli, A.; et al. COVID-19 Outcomes Among Users of CD20 Inhibitors for Immune-Mediated Diseases: A Comparative Cohort Study. medRxiv 2021. [Google Scholar] [CrossRef]
  2. Deepak, P.; Kim, W.; Paley, M.A.; Yang, M.; Carvidi, A.B.; Demissie, E.G.; El-Qunni, A.A.; Haile, A.; Huang, K.; Kinnett, B.; et al. Effect of Immunosuppression on the Immunogenicity of mRNA Vaccines to SARS-CoV-2: A Prospective Cohort Study. Ann. Intern. Med. 2021, 174, 1572–1585. [Google Scholar] [CrossRef]
  3. Strangfeld, A.; Schäfer, M.; Gianfrancesco, M.A.; Lawson-Tovey, S.; Liew, J.W.; Ljung, L.; Mateus, E.F.; Richez, C.; Santos, M.J.; Schmajuk, G.; et al. Factors associated with COVID-19-related death in people with rheumatic diseases: Results from the COVID-19 Global Rheumatology Alliance physician-reported registry. Ann. Rheum. Dis. 2021, 80, 930–942. [Google Scholar] [CrossRef] [PubMed]
  4. McAndrews, K.M.; Dowlatshahi, D.P.; Dai, J.; Becker, L.M.; Hensel, J.; Snowden, L.M.; Leveille, J.M.; Brunner, M.R.; Holden, K.W.; Hopkins, N.S.; et al. Heterogeneous antibodies against SARS-CoV-2 spike receptor binding domain and nucleocapsid with implications for COVID-19 immunity. JCI Insight 2020, 5, e142386. [Google Scholar] [CrossRef] [PubMed]
  5. Ou, X.; Liu, Y.; Lei, X.; Li, P.; Mi, D.; Ren, L.; Guo, L.; Guo, R.; Chen, T.; Hu, J.; et al. Characterization of spike glycoprotein of SARS-CoV-2 on virus entry and its immune cross-reactivity with SARS-CoV. Nat. Commun. 2020, 11, 1620. [Google Scholar] [CrossRef] [Green Version]
  6. Walls, A.C.; Park, Y.J.; Tortorici, M.A.; Wall, A.; McGuire, A.T.; Veesler, D. Structure, Function, and Antigenicity of the SARS-CoV-2 Spike Glycoprotein. Cell 2020, 181, 281–292.e286. [Google Scholar] [CrossRef]
  7. Post, N.; Eddy, D.; Huntley, C.; van Schalkwyk, M.C.I.; Shrotri, M.; Leeman, D.; Rigby, S.; Williams, S.V.; Bermingham, W.H.; Kellam, P.; et al. Antibody response to SARS-CoV-2 infection in humans: A systematic review. PLoS ONE 2020, 15, e0244126. [Google Scholar] [CrossRef]
  8. Galipeau, Y.; Greig, M.; Liu, G.; Driedger, M.; Langlois, M.-A. Humoral Responses and Serological Assays in SARS-CoV-2 Infections. Front. Immunol. 2020, 11, 610688. [Google Scholar] [CrossRef]
  9. Meyer, B.; Drosten, C.; Müller, M.A. Serological assays for emerging coronaviruses: Challenges and pitfalls. Virus Res. 2014, 194, 175–183. [Google Scholar] [CrossRef]
  10. Suresh, G. IMpact-RSV Study Group report. Pediatrics 1999, 104, 993. [Google Scholar] [CrossRef]
  11. Corti, D.; Misasi, J.; Mulangu, S.; Stanley, D.A.; Kanekiyo, M.; Wollen, S.; Ploquin, A.; Doria-Rose, N.A.; Staupe, R.P.; Bailey, M.; et al. Protective monotherapy against lethal Ebola virus infection by a potently neutralizing antibody. Science 2016, 351, 1339–1342. [Google Scholar] [CrossRef] [PubMed] [Green Version]
  12. Gilchuk, P.; Bombardi, R.G.; Erasmus, J.H.; Tan, Q.; Nargi, R.; Soto, C.; Abbink, P.; Suscovich, T.J.; Durnell, L.A.; Khandhar, A.; et al. Integrated technology platform for accelerated discovery of antiviral antibody therapeutics. bioRxiv 2020, 4, 1030–1043. [Google Scholar]
  13. Copin, R.; Baum, A.; Wloga, E.; Pascal, K.E.; Giordano, S.; Fulton, B.O.; Zhou, A.; Negron, N.; Lanza, K.; Chan, N.; et al. The monoclonal antibody combination REGEN-COV protects against SARS-CoV-2 mutational escape in preclinical and human studies. Cell 2021, 184, 3949–3961.e3911. [Google Scholar] [CrossRef]
  14. Dougan, M.; Nirula, A.; Azizad, M.; Mocherla, B.; Gottlieb, R.L.; Chen, P.; Hebert, C.; Perry, R.; Boscia, J.; Heller, B.; et al. Bamlanivimab plus Etesevimab in Mild or Moderate COVID-19. N. Engl. J. Med. 2021, 385, 1382–1392. [Google Scholar] [CrossRef] [PubMed]
  15. Wrammert, J.; Smith, K.; Miller, J.; Langley, W.A.; Kokko, K.; Larsen, C.; Zheng, N.Y.; Mays, I.; Garman, L.; Helms, C.; et al. Rapid cloning of high-affinity human monoclonal antibodies against influenza virus. Nature 2008, 453, 667–671. [Google Scholar] [CrossRef] [PubMed] [Green Version]
  16. Rogers, T.F.; Zhao, F.; Huang, D.; Beutler, N.; Burns, A.; He, W.-t.; Limbo, O.; Smith, C.; Song, G.; Woehl, J.; et al. Isolation of potent SARS-CoV-2 neutralizing antibodies and protection from disease in a small animal model. Science 2020, 369, 956–963. [Google Scholar] [CrossRef] [PubMed]
  17. Zost, S.J.; Gilchuk, P.; Chen, R.E.; Case, J.B.; Reidy, J.X.; Trivette, A.; Nargi, R.S.; Sutton, R.E.; Suryadevara, N.; Chen, E.C.; et al. Rapid isolation and profiling of a diverse panel of human monoclonal antibodies targeting the SARS-CoV-2 spike protein. Nat. Med. 2020, 26, 1422–1427. [Google Scholar] [CrossRef]
  18. He, B.; Liu, S.; Wang, Y.; Xu, M.; Cai, W.; Liu, J.; Bai, W.; Ye, S.; Ma, Y.; Hu, H.; et al. Rapid isolation and immune profiling of SARS-CoV-2 specific memory B cell in convalescent COVID-19 patients via LIBRA-seq. Signal. Transduct. Target. Ther. 2021, 6, 195. [Google Scholar] [CrossRef]
  19. Mor, M.; Werbner, M.; Alter, J.; Safra, M.; Chomsky, E.; Lee, J.C.; Hada-Neeman, S.; Polonsky, K.; Nowell, C.J.; Clark, A.E.; et al. Multi-clonal SARS-CoV-2 neutralization by antibodies isolated from severe COVID-19 convalescent donors. PLoS Pathog. 2021, 17, e1009165. [Google Scholar] [CrossRef] [PubMed]
  20. Dugan, H.L.; Stamper, C.T.; Li, L.; Changrob, S.; Asby, N.W.; Halfmann, P.J.; Zheng, N.Y.; Huang, M.; Shaw, D.G.; Cobb, M.S.; et al. Profiling B cell immunodominance after SARS-CoV-2 infection reveals antibody evolution to non-neutralizing viral targets. Immunity 2021, 54, 1290–1303.e1297. [Google Scholar] [CrossRef]
  21. Hartley, G.E.; Edwards, E.S.J.; Aui, P.M.; Varese, N.; Stojanovic, S.; McMahon, J.; Peleg, A.Y.; Boo, I.; Drummer, H.E.; Hogarth, P.M.; et al. Rapid generation of durable B cell memory to SARS-CoV-2 spike and nucleocapsid proteins in COVID-19 and convalescence. Sci. Immunol. 2020, 5, eabf8891. [Google Scholar] [CrossRef] [PubMed]
  22. Li, C.; Yu, D.; Wu, X.; Liang, H.; Zhou, Z.; Xie, Y.; Li, T.; Wu, J.; Lu, F.; Feng, L.; et al. Twelve-month specific IgG response to SARS-CoV-2 receptor-binding domain among COVID-19 convalescent plasma donors in Wuhan. Nat. Commun. 2021, 12, 4144. [Google Scholar] [CrossRef]
  23. Van Kerkhove, M.; Alaswad, S.; Assiri, A.; Perera, R.A.P.M.; Peiris, M.; El Bushra, H.; BinSaeed, A. Transmissibility of MERS-CoV Infection in Closed Setting, Riyadh, Saudi Arabia, 2015. Emerg. Infect. Dis. J. 2019, 25, 1802. [Google Scholar] [CrossRef] [Green Version]
  24. Cao, W.-C.; Liu, W.; Zhang, P.-H.; Zhang, F.; Richardus, J.H. Disappearance of Antibodies to SARS-Associated Coronavirus after Recovery. N. Engl. J. Med. 2007, 357, 1162–1163. [Google Scholar] [CrossRef]
  25. Cao, Y.; Su, B.; Guo, X.; Sun, W.; Deng, Y.; Bao, L.; Zhu, Q.; Zhang, X.; Zheng, Y.; Geng, C.; et al. Potent Neutralizing Antibodies against SARS-CoV-2 Identified by High-Throughput Single-Cell Sequencing of Convalescent Patients’ B Cells. Cell 2020, 182, 73–84.e16. [Google Scholar] [CrossRef]
  26. Smith, M.J.; Packard, T.A.; O’Neill, S.K.; Henry Dunand, C.J.; Huang, M.; Fitzgerald-Miller, L.; Stowell, D.; Hinman, R.M.; Wilson, P.C.; Gottlieb, P.A.; et al. Loss of anergic B cells in prediabetic and new-onset type 1 diabetic patients. Diabetes 2015, 64, 1703–1712. [Google Scholar] [CrossRef] [PubMed] [Green Version]
  27. Stensland, Z.C.; Smith, M.J. Enrichment and Detection of Antigen-Binding B Cells for Mass Cytometry. Magnetochemistry 2021, 7, 92. [Google Scholar] [CrossRef] [PubMed]
  28. Schultz, J.S.; McCarthy, M.K.; Rester, C.; Sabourin, K.R.; Annen, K.; DomBourian, M.; Eisenmesser, E.; Frazer-Abel, A.; Knight, V.; Jaenisch, T.; et al. Development and Validation of a Multiplex Microsphere Immunoassay Using Dried Blood Spots for SARS-CoV-2 Seroprevalence: Application in First Responders in Colorado, USA. J. Clin. Microbiol. 2021, 59, e00290-21. [Google Scholar] [CrossRef]
  29. Kassambara, A.; Rème, T.; Jourdan, M.; Fest, T.; Hose, D.; Tarte, K.; Klein, B. GenomicScape: An easy-to-use web tool for gene expression data analysis. Application to investigate the molecular events in the differentiation of B cells into plasma cells. PLoS Comput. Biol. 2015, 11, e1004077. [Google Scholar]
  30. Ju, B.; Zhang, Q.; Ge, J.; Wang, R.; Sun, J.; Ge, X.; Yu, J.; Shan, S.; Zhou, B.; Song, S.; et al. Human neutralizing antibodies elicited by SARS-CoV-2 infection. Nature 2020, 584, 115–119. [Google Scholar] [CrossRef]
  31. Kreer, C.; Zehner, M.; Weber, T.; Ercanoglu, M.S.; Gieselmann, L.; Rohde, C.; Halwe, S.; Korenkov, M.; Schommers, P.; Vanshylla, K.; et al. Longitudinal Isolation of Potent Near-Germline SARS-CoV-2-Neutralizing Antibodies from COVID-19 Patients. Cell 2020, 182, 843–854.e812. [Google Scholar] [CrossRef]
  32. Yuan, M.; Liu, H.; Wu, N.C.; Lee, C.D.; Zhu, X.; Zhao, F.; Huang, D.; Yu, W.; Hua, Y.; Tien, H.; et al. Structural basis of a shared antibody response to SARS-CoV-2. Science 2020, 369, 1119–1123. [Google Scholar] [CrossRef]
  33. Breden, F.; Lepik, C.; Longo, N.S.; Montero, M.; Lipsky, P.E.; Scott, J.K. Comparison of antibody repertoires produced by HIV-1 infection, other chronic and acute infections, and systemic autoimmune disease. PLoS ONE 2011, 6, e16857. [Google Scholar] [CrossRef] [Green Version]
  34. Wardemann, H.; Yurasov, S.; Schaefer, A.; Young, J.W.; Meffre, E.; Nussenzweig, M.C. Predominant Autoantibody Production by Early Human B Cell Precursors. Science 2003, 301, 1374–1377. [Google Scholar] [CrossRef] [Green Version]
  35. Bashford-Rogers, R.J.M.; Smith, K.G.C.; Thomas, D.C. Antibody repertoire analysis in polygenic autoimmune diseases. Immunology 2018, 155, 3–17. [Google Scholar] [CrossRef] [PubMed]
  36. Shi, X.; Shao, T.; Huo, F.; Zheng, C.; Li, W.; Jiang, Z. An analysis of abnormalities in the B cell receptor repertoire in patients with systemic sclerosis using high-throughput sequencing. PeerJ 2020, 8, e8370. [Google Scholar] [CrossRef] [Green Version]
  37. Smith, M.J.; Rihanek, M.; Coleman, B.M.; Gottlieb, P.A.; Sarapura, V.D.; Cambier, J.C. Activation of thyroid antigen-reactive B cells in recent onset autoimmune thyroid disease patients. J. Autoimmun. 2018, 89, 82–89. [Google Scholar] [CrossRef]
  38. Lu, D.R.; McDavid, A.N.; Kongpachith, S.; Lingampalli, N.; Glanville, J.; Ju, C.H.; Gottardo, R.; Robinson, W.H. T Cell-Dependent Affinity Maturation and Innate Immune Pathways Differentially Drive Autoreactive B Cell Responses in Rheumatoid Arthritis. Arthritis Rheumatol. 2018, 70, 1732–1744. [Google Scholar] [CrossRef] [Green Version]
  39. Cerosaletti, K.; Barahmand-Pour-Whitman, F.; Yang, J.; DeBerg, H.A.; Dufort, M.J.; Murray, S.A.; Israelsson, E.; Speake, C.; Gersuk, V.H.; Eddy, J.A.; et al. Single-Cell RNA Sequencing Reveals Expanded Clones of Islet Antigen-Reactive CD4(+) T Cells in Peripheral Blood of Subjects with Type 1 Diabetes. J. Immunol. 2017, 199, 323–335. [Google Scholar] [CrossRef] [Green Version]
  40. Kinker, G.S.; Vitiello, G.A.F.; Ferreira, W.A.S.; Chaves, A.S.; Cordeiro de Lima, V.C.; Medina, T.D.S. B Cell Orchestration of Anti-tumor Immune Responses: A Matter of Cell Localization and Communication. Front. Cell Dev. Biol. 2021, 9, 678127. [Google Scholar] [CrossRef] [PubMed]
  41. Jourdan, M.; Caraux, A.; Caron, G.; Robert, N.; Fiol, G.; Rème, T.; Bolloré, K.; Vendrell, J.P.; Le Gallou, S.; Mourcin, F.; et al. Characterization of a transitional preplasmablast population in the process of human B cell to plasma cell differentiation. J. Immunol. 2011, 187, 3931–3941. [Google Scholar] [CrossRef] [Green Version]
  42. Jourdan, M.; Caraux, A.; De Vos, J.; Fiol, G.; Larroque, M.; Cognot, C.; Bret, C.; Duperray, C.; Hose, D.; Klein, B. An in vitro model of differentiation of memory B cells into plasmablasts and plasma cells including detailed phenotypic and molecular characterization. Blood 2009, 114, 5173–5181. [Google Scholar] [CrossRef] [Green Version]
Figure 1. Detection and isolation of SARS-CoV-2 antigen-binding B cells by magnetic enrichment. (A) Diagram representing three critical steps for magnetic enrichment of SARS-CoV-2 antigen-binding B cells from human PBMCs. (B) Flow cytometric panels showing frequency of SARS-CoV-2 antigen-binding B cells before (pre-enrichment) and after application of magnetic separation from seronegative (top) and seropositive (bottom) donors. (C) Cell sorted and pooled SARS-CoV-2 antigen-binding B cells from two different seropositive donors, labeled with hashtag 1 and 2, and seronegative control donor CD19+ B cells, barcoded with hashtag 3, for scRNA-seq.
Magnetochemistry 08 00023 g001
Figure 2. Unique transcriptional profile of SARS-CoV-2 antigen-binding B cells from a seropositive donor with neutralizing antibody activity. (A) t-SNE projection of sorted cells from Figure 1C: SARS-CoV-2 antigen-binding B cells from two seropositive donors, CD19+ B cells and CD19 filler cells from seronegative donor. Each dot represents a single cell. Using 5′ gene expression libraries, each cluster was assigned to a cell type: T cells (magenta), B cells (dark turquoise), monocytes (dark orange). (B) B-cell assignment to seropositive (donor 1—red, donor 2—blue) and seronegative (donor 3—green) donors with scRNA-seq hashtag libraries. Unassigned (gray) represents cells for which hashtag assignment to one of the donors was incomplete. (C,D) Transcriptional analysis revealed differences in gene expression between SARS-CoV-2 antigen-binding B cells from seropositive (C) donor 1 and (D) donor 2 compared to seronegative donor 3. (E) Plasma samples from donors 1, 2, and 3, and other seropositive and seronegative donors were tested for antibody titers and neutralizing activity. IgG antibody titers were determined by a microbead flow-based assay detecting antibodies targeting the SARS-CoV-2 receptor-binding domain of spike (RBD, circle) and nucleocapsid (N, diamond). Neutralizing activity was determined by focus reduction neutralization test (FRNT) which measures reciprocal antibody dilution which reduces viral foci number by 50% (FRTN50). gMFI: geometric median fluorescent intensity.
Magnetochemistry 08 00023 g002
Figure 3. Memory B-cell transcriptional subcluster contains SARS-CoV-2 antigen-binding B cells. (A) Unsupervised clustering identified three subclusters with unique gene signatures within B cell cluster. (B) Subcluster 1 and subcluster 3 exhibit significant and differential gene expression compared to all B cells. (C) Majority of differentially expressed genes in subcluster 1 and subcluster 3 segregated into memory and naïve B-cell transcriptomics, respectively, defined by GenomicScape—a public database of human B-cell development.
Magnetochemistry 08 00023 g003
Figure 4. Distinct VDJ repertoire expressed by SARS-CoV-2 antigen-binding B cells. (A) The majority of SARS-CoV-2 antigen-binding B cells expressed the IgG1 constant region. (B) Variable (V) heavy-chain distribution in SARS-CoV-2 antigen-binding and nonbinding B cells. (C,D) Frequency of V light-chain distribution: V kappa (Vκ) and V lambda (Vλ) (D). SARS-CoV-2 antigen-binding B cells from seropositive donors (black), non-SARS-CoV-2 antigen-binding B cells from seronegative donor (gray). Chi-square2) test with indicated degrees of freedom was used to test differences in distributions of isotype and V heavy, Vκ, and Vλ segment usage between SARS-CoV-2 antigen-binding B cells from donor 1 and 2 and seronegative nonbinding B cells from donor 3.
Magnetochemistry 08 00023 g004
Table 1. Specificity and affinity of 19 recombinant antibodies (recAb) derived from the single-cell RNA sequencing of SARS-CoV-2 antigen-binding B cells. Nucleocapsid (N), the spike subunit 1 (S1), affinity (KD), association rate constant (ka), dissociation rate constant (kd).
recAb IDSpecificityKD (M)kakd
1N2.1 × 10−131.7 × 1053.5 × 10−8
2N2.2 × 10−132.4 × 1055.5 × 10−8
3N7.0 × 10−132.3 × 1051.6 × 10−7
4N1.3 × 10−123.1 × 1054.1 × 10−7
5N2.4 × 10−123.2 × 1057.6 × 10−7
6N2.6 × 10−122.3 × 1055.8 × 10−7
7N3.6 × 10−122.0 × 1057.0 × 10−7
8N5.5 × 10−122.9 × 1051.6 × 10−6
9N8.7 × 10−123.1 × 1052.7 × 10−6
10N5.5 × 10−114.0 × 1052.2 × 10−5
11N8.1 × 10−112.7 × 1052.2 × 10−5
12N9.5 × 10−111.6 × 1051.6 × 10−5
13N1.1 × 10−102.2 × 1052.4 × 10−5
14N2.3 × 10−102.8 × 1056.4 × 10−5
15N2.3 × 10−101.8 × 1054.1 × 10−5
16N7.4 × 10−101.8 × 1051.3 × 10−4
17N5.0 × 10−91.8 × 1058.9 × 10−4
18N1.7 × 10−82.7 × 1044.6 × 10−3
19S19.7 × 10−104.8 × 1054.7 × 10−4
Publisher’s Note: MDPI stays neutral with regard to jurisdictional claims in published maps and institutional affiliations.

