Abstract
Luminescent nanocrystals embedded into silica microspheres were shown to be useful for silica labeling for biological applications, ensuring mechanical and chemical stability, nontoxicity, biocompatibility and optical properties. We used sol–gel technology to prepare silica nanospheres embedded with fluorescent and magnetic Eu3+(1 mol%)-doped CeO2 nanocrystals. The X-ray diffraction pattern analysis and transmission electron microscopy investigations showed CeO2:Eu3+(1 mol%) nanocrystals of about 9 nm size and Ce3+ ions substitution by the Eu3+ ions; the nanocrystals dispersed inside the nanosized silica spheres of about 400 nm diameters. The photoluminescence spectra recorded under UV-light excitation showed Eu3+ ions luminescence peaks (5D0-7FJ, J = 0–4) accompanied by a weaker 425 nm luminescence due to the silica matrix; the quantum yield was 0.14. The weak hysteresis loop and magnetization curves recorded up to 20,000 Oe showed dominantly paramagnetic behavior associated with the silica matrix; a slight opening of the hysteresis loop to a very small magnetic field (about 0.005 Oe) was due to the presence of the two rare earth ions. The photonic crystal properties of SiO2-CeO2:Eu3+(1 mol%) silica nanospheres deposited as films on quartz plates were revealed by the two weak attenuation peaks at 420 and 500 nm and were associated with the reflection from different planes. The SiO2-CeO2:Eu3+(1 mol%) nanospheres are attractive potential candidates for photonics-related applications or for multifunctional bio-labels by combining the luminescence and magnetic properties of the nanocrystals.
1. Introduction
Rare-earth-doped nanomaterials are widely studied due to characteristics related to the presence of unpaired electrons in the inner 4f sub-shell: fluorescence, downconversion, upconversion, persistent phosphorescene and also magnetic properties, with applications spanning from laser optoelectronics, optical amplifiers, lasers, up-converters to biosensing, biology carrier applications and multifunctional imaging ([1,2] and references therein). In order to maintain their functionalities for practical applications, it is necessary to isolate them with a thin SiO2 layer around the nanocrystalline core and that results in a core–shell composite. The coating of the nanocrystals with a thin SiO2 shell provides several advantages such as: protection against oxidation and agglomeration, increase in the mechanical stability, and enabling dispersion in various aqueous solvents. Furthermore, the surface of silica particles can be chemically modified to link bioconjugates. As the silica can be easily made controllable in spherical morphology from nano-to micrometer size [3], a novel approach is to embed the nano-phosphors in a transparent inert silica matrix [4,5,6,7]. Fluorescent microspheres can be produced by the incorporation of luminescent nanocrystals into the bigger silica microspheres and have been demonstrated to be useful for silica labeling in a variety of biological or phosphor related applications [4,5,6]. Whatever the path used, the grains with core–shell architecture can combine diverse functionalities into a single hybrid composite with improved or new physical properties compared with those of each component.
Ceria (CeO2) is an insulating pale-yellow oxide with a cubic fluorite structure (space group ) and is a widely studied material with various applications, the main one being related to oxidative catalysis [8]. Rare-earth-doped CeO2 has attracted great interest for various applications including high oxygen storage capacity, electrolytes for intermediate-temperature or electrolyte and anode material [9]. Most of the previous studies were related to the CeO2 material properties’ improvement, but doping is accompanied by unique optical features which originate from their 4f-electronic configuration [10]. In particular, regarding photoluminescence properties induced by rare-earth doping for Eu3+-doped CeO2 nanoparticles, the mechanism has been extensively investigated [11,12,13,14]. Great efforts have been made to understand the relationship between morphology, dimensions, surface chemistries, crystalline defects and fluorescent properties [14]; all of them showed a high influence on the Eu3+ emission [14]. On the other hand, the magnetic properties shown by CeO2 nanoparticles have been widely investigated in terms of the influence of the morphology, defect structure of the oxide and the influence of the impurities [15,16,17,18]. As pure CeO2 is composed of nominally closed-shell ions (with no unpaired electrons), it might be expected to present an independent orbital diamagnetism, but well-crystallized stoichiometric CeO2 show a weakly paramagnetic behavior associated with oxygen vacancies or pentavalent substitutions in the structure ([15] and references therein). Moreover, rare-earth-doped CeO2 powders show room temperature ferromagnetism (RE = Nd, Sm) or paramagnetism (RE = Gd, Tb, Er, Dy) associated with oxygen vacancies and the formation of fluorite crystal structure [9,17].
The aim of the present study was to prepare silica nanospheres embedded with Eu3+(1 mol%)-doped CeO2 nanocrystals in order to combine the magnetic and optical functionalities into a single hybrid composite and to perform a structural, morphological investigation by using X-ray diffraction and electron microscopy techniques. Then, the magnetic and optical properties such as photoluminescence, quantum efficiency and optical absorption were investigated and discussed.
2. Materials and Methods
2.1. Samples Preparation
For the preparation of silica nanospheres embedded with Eu3+(1 mol%)-doped CeO2 nanocrystals we used a two-step approach. Firstly, we synthesized Eu3+(1 mol%)-doped CeO2 nanocrystals by using polyvinyl-pyrrolidone (PVP) solution route [19] and using cerium (III) acetate hydrate (Sigma-Aldrich, Saint Louis, MO, USA, 99.9%), europium (III) acetate hydrate (Sigma-Aldrich, Saint Louis, MO, USA, 99.9 and polyvinyl pyrrolidone (PVP) (Mn = 1,300,000, Sigma-Aldrich, Saint Louis, MO, USA) as the starting chemicals. In the first step, a water solution was made by 1.5 g of PVP dissolved in 100 mL of de-ionized water under vigorous stir at 27 °C for 30 min. A powder mixture of 0.99 g of cerium (III)) acetate hydrate and 0.01 g europium (III)) acetate hydrate was added to the PVP solution under vigorous stir at 60 °C for 30 min until a well-dissolved solution was obtained. Then, the water solution was evaporated by heating in a water bath at 60 °C, and the resulting solid precursor was dried in an oven at 100 °C. Finally, the dried precursor was calcined in open atmosphere at 500 °C for 2 h.
In the second step, we proceeded with the preparation of the Eu3+(1 mol%)-doped CeO2 nanocrystalline powders embedded in silica spheres (4% wt, CeO2:Eu/SiO2) according to the procedure described in ref [15]. The CeO2:Eu(1 mol%) nanocrystalline powder (0.0168 g) was ultrasonically dispersed in 21 mL of ethanol (≥99.8%, Sigma-Aldrich, Saint Louis, MO, USA). Then, to the mixture was added 1.55 mL of TEOS (99.9%, Alfa-Aesar, Heysham, Lancashire, UK) and 5.5 mL of aqueous ammonia solution (25%; Merck, Darmstadt, Germany), and a silica sol was produced. The sol solution was stirred at room temperature for 2 h, and a silica powder was formed at the bottom of the vessel; the powder was filtered, dried and used for the measurements.
2.2. Samples Characterization
For the structural analysis of the samples, we used a BRUKER D8 ADVANCE (Billerica, MA, USA) type X-ray diffractometer in focusing geometry, with a copper target X-ray tube and a LynxEye one-dimensional detector. The XRD pattern was recorded in the 20 to 80° range with 0.05° step and 3 s integration time. The crystalline phase analysis and crystal structure refinement was made by using the Rietveld analysis approach and a dedicated software (MAUD, Springfield, MA, USA) [20,21] with the starting parameters from PDF 04-015-2673 (CeO2) files from the ICDD Powder Diffraction Files database [22]. For the morphological analysis by scanning electron microscopy (SEM), we used an EVO 50 XVP and Merlin Compact equipment from Zeiss (Jena, Germany). Transmission electron microscopy (TEM) analysis of the samples was performed by using the ARM200F electron microscope equipped with an energy-dispersive X-ray spectrometer (EDS); the accelerating voltage of the electron beam was 200 kV. The optical characterization of the samples was performed by using photoluminescence and absorption spectroscopy. The photoluminescence and excitation spectra were recorded at room temperature by using a FluoroMax 4P spectrophotometer (HORIBA Jobin Yvon, Kyoto, Japan); for the chromaticity and quantum efficiency analysis, we used the QuantaPhy accessory. Optical absorption spectra were performed on thin-film samples deposited by the spin-coating technique on quartz substrates and by using a Varian Cary 4000 UV–Vis spectrophotometer, (Agilent Technologies Inc. Santa-Clara, CA, USA) in the 250 to 800 nm range with 1 nm step. The magnetic properties were investigated with a Superconducting Quantum Interference Device (SQUID) from Quantum Design. Both curves, the hysteresis loop and magnetization versus applied magnetic fields were acquired at room temperature under a magnetic field up to 50,000 Oe.
3. Results
3.1. Structural and Morphological Characterization
In Figure 1, the XRD pattern of Eu3+(1%)-doped CeO2 nanocrystalline powder calcinated for 2 h at 500 °C and the results of the Rietveld refinement are presented. The analysis results from Table 1 and Table 2 only show the presence of cerium europium oxide crystalline phase without any additional ones, with the lattice parameters very close to those from the ICDD database (PDF 04-015-2673) [22]; the nanocrystallite’s size agrees very well with TEM microscopy data (see below). Structural analysis of undoped CeO2 nanocrystals prepared by using the same PVP solution route [19] is shown for the lattice parameter a = 0.5394 ± 0.0002 nm and the nanocrystals with sizes of 11.6 nm. Therefore, the PVP solution method [19] and processing conditions ensured the substitutional incorporation of Eu3+ dopant ions in the CeO2 crystalline matrix accompanied by a weak lattice expansion and without oxygen-related defects, vacancies or additional parasite phases that might influence the magnetism ([15] and references therein). Hence, compared to the other synthesis methods, the PVP solution method is useful to investigate the Eu3+-ions’ dopant effects on magnetic properties (without any other interferences) by correlation to the structural ones.
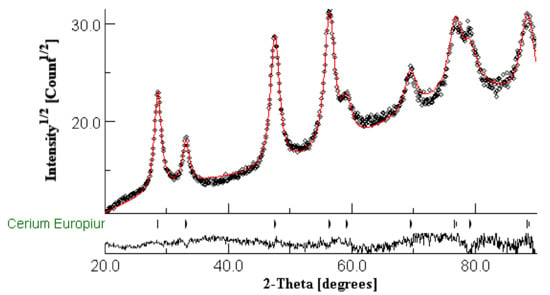
Figure 1.
XRD pattern (black curve) and Rietveld refinement plot (red curve) of Eu3+(1%)-doped CeO2 nanocrystalline powder calcinated at 500 °C; the lower trace represents the difference curve between observed and calculated patterns.

Table 1.
The Rietveld refinement analysis results for Eu3+(1%)-doped CeO2 nanocrystalline powders calcinated at 500 °C.

Table 2.
Atomic site occupancy for Eu3+(1%)-doped CeO2 nanocrystals calcinated at 500 °C.
The morphology and structure analysis of the CeO2:Eu3+ nanocrystalline powder by using electron microscopy TEM are presented in Figure 2. The TEM image shows agglomerated nanoparticles about 5–10 nm in size, and the selected-area electron diffraction (SAED) pattern shows spotty ring patterns, confirming the CeO2 crystalline structure with a = 0.541 nm.
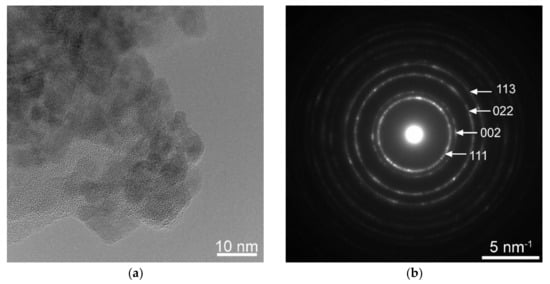
Figure 2.
TEM microscopy showing CeO2:Eu3+ nanoparticles (a) and the corresponding SAED where the Miller indices of the main diffraction spots are indicated (b).
The SEM images of the SiO2-CeO2:Eu3+ nanospheres (Figure 3) showed a relatively uniform distribution of nanospheres about 350 nm in size. Low-magnification TEM imaging evidenced spherical silica particles of about 300-400 nm in size containing dispersed CeO2 nanocrystals mostly in the central region, as can be seen in Figure 4a; some of the spheres seem to show CeO2 nanocrystals on their surface, as was revealed by high-magnification TEM imaging (Figure 4b).
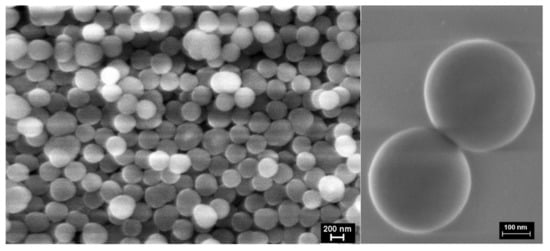
Figure 3.
The SEM image of the silica SiO2-CeO2:Eu3+ nanospheres.
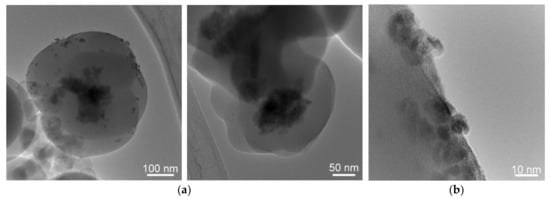
Figure 4.
Low-magnification TEM images (a) and high-magnification TEM image (b) of silica SiO2-CeO2:Eu3+ nanospheres.
The nature and the dispersion of the nanoparticles inside the silica spheres were revealed by scanning transmission electron microscopy (STEM) images in dark field mode. They showed a central region consisting of elements with higher atomic numbers, as it appears brighter than the surrounding material, as it is the case of Ce atoms compared with Si. The STEM-EDS mapping images revealed the presence of CeO2 nanocrystals mainly in the core region of the sphere but also partially dispersed in the volume (Figure 5).
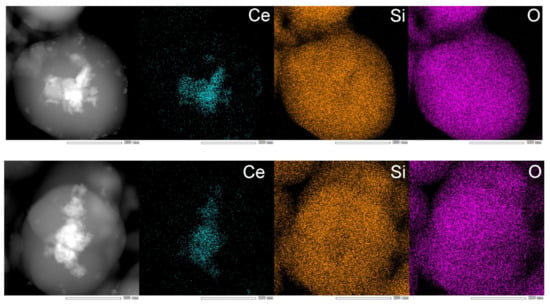
Figure 5.
STEM images of SiO2-CeO2:Eu3+ silica nanospheres.
3.2. Optical Properties
The visual observation of a solution of SiO2-CeO2:Eu3+(1 mol%) silica nanospheres solution (in ethanol) under 360 nm UV-light excitation showed a red-pink luminescence due to the Eu3+ luminescent ions (Figure 6).
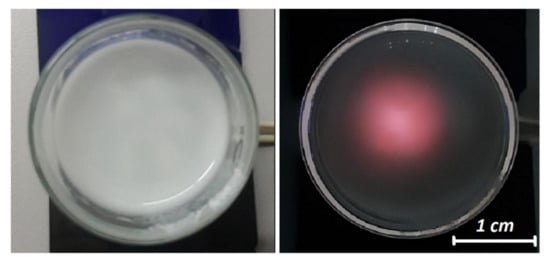
Figure 6.
Optical images of SiO2-CeO2:Eu3+ silica nanospheres solution (in ethanol) under daylight (left) and 360 nm spotlight excitation (right).
3.3. Photoluminescence Properties
The photoluminescence and excitation spectra recorded on SiO2-CeO2:Eu3+(1 mol%) silica nanospheres are depicted in Figure 7a. Under 345 nm excitation, the photoluminescence spectrum exhibited a sharp and intense emission at 590 nm, accompanied by a broad blue, weaker luminescence at about 425 nm assigned to the silica matrix. The 590 nm sharp emission peak is due to the 5D0-7F1 magnetic dipole transition of Eu3+ ions, while emission through the 5D0-7F2 electric dipole transition between 600 and 650 nm are very weak (Figure 7). According to the structural data analysis (Section 3.1) and for low dopant ions’ concentration, the Eu3+ dopant ions substitute the high-symmetry octahedral Ce4+ sites within the CeO2 crystalline lattice [11,12], and therefore, the hypersensitive 5D0-7F2 electric dipole transition at 610 nm and 630 nm is suppressed. The single weak, sharp peak at 570 nm is due to the 5D0-7F0 transition and is consistent with a single Eu3+-site in the CeO2 lattice [23]. The broad band peaking at 345 nm observed in the excitation spectrum of 590 nm luminescence is due to the charge transfer (CT) transition from O2− to Ce4+ (not from the oxygen vacancy or from the CT of O2− to Eu3+ [12]), and the subsequent energy transfer to excited 4f states of Eu3+ ions followed by their radiative deexcitation. The location of the excitation peak agrees with the 340 nm band observed for 15 nm sized CeO2:Eu3+ (1%) nanocrystals [12] and is shifted from the 373 nm band observed on CeO2:Eu3+ microcrystalline phosphor powders [11]. The reasons for the shifts of the excitation spectra are supposed to be related to the nanosize influence on the band gap through the environmental factor, and was discussed in detail in refs. [12,24].
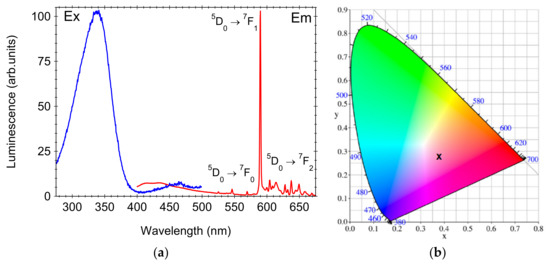
Figure 7.
Photoluminescence and excitation spectra of SiO2-CeO2:Eu3+(1 mol%) silica nanospheres (a) and the chromaticity coordinates of the Commission Internationale de l’Eclairage (CIE) chromaticity diagram (b).
In Figure 7b, the Commission Internationale de l’Eclairage (CIE) chromaticity diagram of SiO2-CeO2:Eu3+ nanocomposite spheres is shown. Under 345 nm UV excitation, the coordinates x = 0.37 and y = 0.28 were relatively close to the region of red Eu3+ luminescence (Figure 7), and the photoluminescence quantum efficiency was about 14%. The high efficiency under 345 nm UV-light excitation was given by the CT transition from O2− to Ce4+ followed by the energy transfer to the Eu3+ excited states and then photoluminescence [25].
3.4. Optical Absorption
Finally, interesting features are revealed by the optical transmission spectra recorded on SiO2-CeO2:Eu3+(1 mol%) nanospheres deposited as thick films on quartz plates (Figure 8); the visual observation of iridescence might suggest photonic properties [26]. As expected, the spectra showed transparency in the whole visible and blue region down to 300 nm and strong absorption in the UV region due to the silica matrix. In addition, there are two weak attenuation peaks at 420 and 500 nm in the range expected for Bragg reflection from different planes [26,27] in the fcc structure, most probably (200) and (111) (Figure 8). The peaks position can be computed by the Bragg low at normal incidence and are dependent on the value fraction of the silica spheres in a close-packed structure and the refractive index of the silica spheres [27]. In the present case, their position is different from that reported at about 450 and 600 nm in [27], and they are very weak because of the poor packaging of the silica spheres (Figure 3), and the dispersion of the SiO2-CeO2:Eu3+(1%) nanospheres refractive index is different compared to silica spheres (due to the nanocrystals).
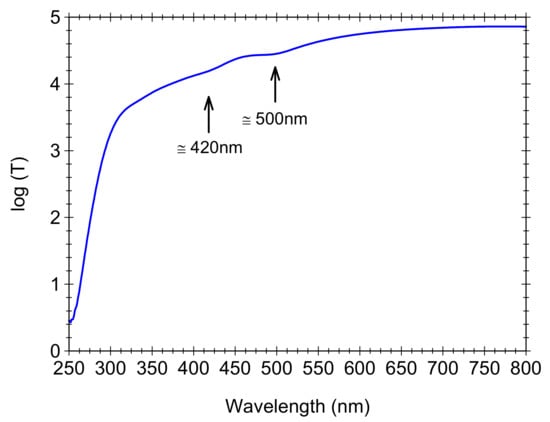
Figure 8.
The logarithm of the transmission T vs. the wavelength for SiO2-CeO2:Eu3+(1mol%) silica nanospheres deposited as thin films.
3.5. Magnetic Properties
The magnetic properties of the SiO2-CeO2:Eu3+(1%) spheres are revealed by the magnetization vs. applied magnetic field dependence which indicates a diamagnetic behavior up to higher magnetic fields (Figure 9). In general, the magnetic properties of CeO2 are influenced by the morphology, defect structure and impurities [15,16,17,18,19] through the oxygen vacancies and structural defects. Moreover, it was shown that the CeO2 magnetic behavior is strongly influenced by the nanocrystals’ dispersion in powders: the magnetism is reduced up to an order of magnitude and there is a characteristic length scale of the order of 100 nm for the magnetism to appear in CeO2 nanoparticle clusters [28]. In the present case, the diamagnetic behavior is dominantly given by the silica matrix, where the nanocrystals are incorporated and CeO2 magnetism is not observed. However, the presence of CeO2:Eu3+(1%) nanocrystals is revealed by a light open hysteresis loop observed at a very small magnetic field (about 0.005 Oe), which is due to the interaction between the two rare earths, Eu and Ce; the high number of 4f electrons causes an increase in the strength of the orbital couplings between the two ion sublattices.
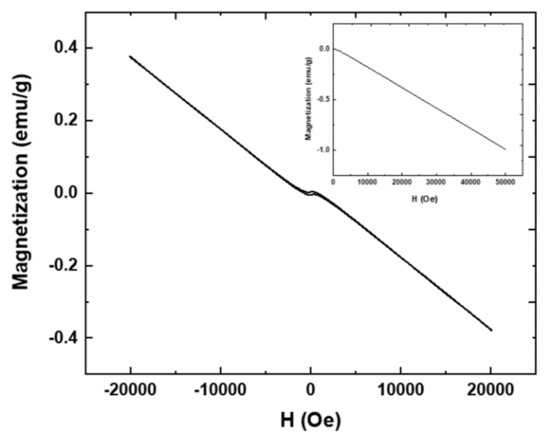
Figure 9.
The magnetization vs. applied magnetic field dependence recorded at room temperature on SiO2-CeO2:Eu3+ silica nanospheres.
4. Conclusions
Sol–gel technology was used to prepare monodisperse silica nanospheres embedded with Eu3+(1%)-doped CeO2 nanocrystals. The electron microscopy images showed CeO2 nanocrystals dispersed within the silica nanospheres. The fluorescence properties related to the Eu3+ luminescent ions in the CeO2 crystalline matrix and paramagnetic properties due to the cerium ions; the interaction between the two ions was revealed by a slight opening of the hysteresis loop observed at a very small magnetic field. The photonic crystal properties of the silica nanospheres deposited as films were revealed by weak optical absorption dips in the visible range.
Hence, the SiO2-CeO2:Eu3+(1 mol%) nanospheres structures can be used to host other high refractive index materials in order to obtain a full photonic band gap material. They are attractive potential candidates for photonics-related applications or for multifunctional bio-labels by combining the luminescence and magnetic properties of the nanocrystalline core, and the approach can be applied for other nanocomposites systems. However, further improvements to the optical properties and transparency through controlled deposition by using Langmuir Blodgett assembly, controlled evaporation or other techniques accompanied by a proper characterization of the magnetic behavior, i.e., the interaction between the ions, must be achieved.
Author Contributions
All the authors cooperated in the physical characterization and analysis of all the data: C.S. was involved in the sample preparation and XRD measurements; C.B. was responsible for the Rietveld refinement and magnetic measurements; M.S. was responsible for the optical properties (photoluminescence, efficiency and colorimetric analysis) and manuscript submission; E.M. was responsible with the morphological analysis by using scanning electron microscopy and C.R. was responsible for the morphological analysis by using transmission electron microscopy. All the authors contributed to discussions and reviewed the manuscript. All authors have read and agreed to the published version of the manuscript.
Funding
This research was funded by the Romanian Ministry of Research and Innovation (MCI) through the grant PN19-03 Core Program of NIMP (2020).
Institutional Review Board Statement
Not applicable.
Informed Consent Statement
Not applicable.
Data Availability Statement
Not applicable.
Acknowledgments
The authors acknowledge M Enculescu for the optical absorption measurements.
Conflicts of Interest
The authors declare no conflict of interest.
References
- Zhong, T.; Goldner, P. Emerging rare-earth doped material platforms. Nanophotonics 2019, 8, 2003–2015. [Google Scholar] [CrossRef]
- Escudero, A.; Becerro, A.I.; Carrillo-Carrión, C.; Núñez, N.O.; Zyuzin, M.V.; Laguna, M.; González-Mancebo, D.; Ocaña, M.; Parak, W.J. Rare earth based nanostructured materials: Synthesis, functionalization, properties and bioimaging and biosensing applications. Nanophotonics 2017, 6, 881–921. [Google Scholar] [CrossRef]
- Stober, W.; Fink, A.; Bohn, E. Controlled growth of monodisperse silica spheres in the micron size range. J. Colloid Interface Sci. 1968, 26, 62–69. [Google Scholar] [CrossRef]
- Van Hest, J.J.H.A.; Blab, G.A.; Gerritsen, H.C.; de Mello Donega, C.; Meijerink, A. Incorporation of Ln Doped LaPO4 Nanocrystals as Luminescent Markers in Silica Nanoparticles Nanoscale. Res. Lett. 2016, 11, 261. [Google Scholar]
- Zhang, Y.; Lu, M. Labelling of silica microspheres with fluorescent lanthanide-doped LaF3 nanocrystals. Nanotechnology 2007, 18, 275603. [Google Scholar] [CrossRef] [Green Version]
- Ando, M.; Li, C.; Yang, P.; Murase, N. Blue-Emitting Small Silica Particles Incorporating ZnSe-Based Nanocrystals Prepared by Reverse Micelle Method. J. Biomed. Biotechnol. 2007, 2007, 52971. [Google Scholar] [CrossRef]
- Hreniak, D.; Jasiorski, M.; Hreniak, A.; Dudzinski, W.; Maruszewski, K.; Stręk, W. Preparation and Optical Properties of Submicron SiO2 Spheres Doped with YAG:Nd3+ Nanocrystallites. J. Sol-Gel Sci. Technol. 2003, 26, 971–976. [Google Scholar] [CrossRef]
- Montini, T.; Melchionna, M.; Monai, M.; Fornasiero, P. Fundamentals and catalytic applications of CeO2-based materials. Chem. Rev. 2016, 116, 5987–6041. [Google Scholar] [CrossRef]
- Soni, S.; Chouhan, N.; Meena, R.K.; Kumar, S.; Dalela, B.; Mishra, M.; Meena, R.S.; Gupta, G.; Kumar, S.; Alvi, P.A.; et al. Electronic Structure and Room Temperature Ferromagnetism in Gd-doped Cerium Oxide Nanoparticles for Hydrogen Generation via Photocatalytic Water Splitting. Glob. Chall. 2019, 3, 1800090. [Google Scholar] [CrossRef]
- Balestrieri, M.; Colis, S.; Gallart, M.; Schmerber, G.; Ziegler, M.; Gilliot, P.; Dinia, A. Photoluminescence properties of rare earth (Nd, Yb, Sm, Pr)-doped CeO2 pellets prepared by solid-state reaction. J. Mater. Chem. C 2015, 3, 7014–7021. [Google Scholar] [CrossRef] [Green Version]
- Liu, X.; Chen, S.; Wang, X. Synthesis and photoluminescence of CeO2:Eu3+ phosphor powders. J. Lumin. 2007, 127, 650–654. [Google Scholar] [CrossRef]
- Li, L.; Yang, H.K.; Moon, B.K.; Fu, Z.; Guo, C.; Jeong, J.H.; Yi, S.S.; Jang, K.; Lee, H.S. Photoluminescence Properties of CeO2:Eu3+ Nanoparticles Synthesized by a Sol-Gel Method. J. Phys. Chem. C 2009, 113, 610–617. [Google Scholar] [CrossRef]
- Yu, Y.; Chen, D.; Huang, P.; Lin, H.; Yang, A.; Wang, Y. Sensitization and protection of Eu3+ luminescence by CeO2 in nano-composite. J. Alloys Compd. 2012, 513, 626–629. [Google Scholar] [CrossRef]
- D’Achille, A.E.; Wallace, R.M.; Coffer, J.L. Morphology-dependent fluorescence of europium-doped cerium oxide nanomaterials. Nanoscale Adv. 2021, 3, 3563–3572. [Google Scholar] [CrossRef]
- Ackland, K.; Coey, J.M.D. Room temperature magnetism in CeO2—A review. Phys. Rep. 2018, 746, 1–39. [Google Scholar] [CrossRef]
- Jiraskova, Y.; Bursik, J.; Janos, P.; Lunacek, J.; Chrobak, A.; Zivotsky, O. Effect of Iron Impurities on Magnetic Properties of Nanosized CeO2 and Ce-Based Compounds. Metals 2019, 9, 222. [Google Scholar] [CrossRef] [Green Version]
- Dimri, M.C.; Khanduri, H.; Kooskora, H.; Subbi, J.; Heinmaa, I.; Mere, A.; Krustok, J.; Stern, R. Ferromagnetism in rare earth doped cerium oxide bulk samples. Phys. Status Solidi A 2012, 209, 353–358. [Google Scholar] [CrossRef]
- Kolodiazhnyi, T.; Sakurai, H.; Belik, A.A.; Gornostaeva, O.V. Unusual lattice evolution and magnetochemistry of Nb doped CeO2. Acta Mater. 2016, 113, 116–123. [Google Scholar] [CrossRef]
- Phoka, S.; Laokul, P.; Swatsitang, E.; Promarak, V.; Seraphinc, S.; Maensiri, S. Synthesis, structural and optical properties of CeO2 nanoparticles synthesized by a simple polyvinyl pyrrolidone (PVP) solution route. Mater. Chem. Phys. 2009, 115, 423–428. [Google Scholar] [CrossRef]
- Rietveld, H.M. A profile refinement method for nuclear and magnetic structures. J. Appl. Cryst. 1969, 2, 65–71. [Google Scholar] [CrossRef]
- Lutterotti, L.; Matthies, S.; Wenk, H.-R. MAUD (Material Analysis Using Diffraction): A user friendly Java program for Rietveld Texture Analysis and more. In Proceedings of the Twelfth International Conference on Textures of Materials (ICOTOM-12), Montreal, QC, Canada, 9–13 August 1999; Volume 1, p. 1599. [Google Scholar]
- ICDD. Powder Diffraction File (PDF-4+ 2018 Software 4.18.0.2); International Centre for Diffraction Data: Newtown Square, PA, USA, 2011. [Google Scholar]
- Binnemans, K.; Görller-Walrand, C.J. Application of the Eu3+ ion for site symmetry determination. J. Rare Earths 1996, 14, 173–180. [Google Scholar]
- Li, L.; Zhang, S.Y. Dependence of Charge Transfer Energy on Crystal Structure and Composition in Eu3+-Doped Compounds. J. Phys. Chem. B 2006, 110, 21438–21443. [Google Scholar] [CrossRef] [PubMed]
- Fujihara, S.; Oikawa, M. Structure and luminescent properties of CeO2: Rare earth (RE = Eu3+ and Sm3+) thin films. J. Appl. Phys. 2004, 95, 8002–8006. [Google Scholar] [CrossRef]
- Mıguez, H.; Lopez, C.; Meseguer, F.; Blanco, A.; Vazquez, L.; Mayoral, R.; Ocana, M.; Fornes, V.; Mifsud, A. Photonic crystal properties of packed submicrometric SiO2 spheres. Appl. Phys. Lett. 1997, 71, 1148–1150. [Google Scholar] [CrossRef] [Green Version]
- Sinitskii, A.S.; Knoko, A.V.; Tretyakov, Y.D. Silica photonic crystals: Synthesis and optical properties. Solid State Ionics 2004, 172, 477–479. [Google Scholar] [CrossRef]
- Coey, M.; Ackland, K.; Venkatesan, M.; Sen, S. Collective magnetic response of CeO2 nanoparticles. Nat. Phys. 2016, 12, 694–699. [Google Scholar] [CrossRef]
Publisher’s Note: MDPI stays neutral with regard to jurisdictional claims in published maps and institutional affiliations. |
© 2022 by the authors. Licensee MDPI, Basel, Switzerland. This article is an open access article distributed under the terms and conditions of the Creative Commons Attribution (CC BY) license (https://creativecommons.org/licenses/by/4.0/).