Article

The Halogen Effect on the Magnetic Behaviour of Dimethylformamide Solvates in [Fe(halide-salEen)2]BPh4

by
Rafaela T. Marques
1,
Frederico F. Martins
2,†,
Deniz F. Bekiş
2,‡,
Ana I. Vicente
1,
Liliana P. Ferreira
2,3,
Clara S. B. Gomes
4,5,6,
Sónia Barroso
5,6,§,
Varun Kumar
7,
Yann Garcia
7,
Nuno A. G. Bandeira
2,
Maria José Calhorda
2 and
Paulo N. Martinho
1,*
1
Centro de Química Estrutural, Institute of Molecular Sciences, Departamento de Química e Bioquímica, Faculdade de Ciências, Universidade de Lisboa, Campo Grande, 1749-016 Lisboa, Portugal
2
BioISI—Biosystems & Integrative Sciences Institute, Departamento de Química e Bioquímia, Faculdade de Ciências, Universidade de Lisboa, Campo Grande, 1749-016 Lisboa, Portugal
3
Department of Physics, University of Coimbra, 3004-516 Coimbra, Portugal
4
LAQV-REQUIMTE, Departamento de Química, Faculdade de Ciências e Tecnologia, Universidade NOVA de Lisboa, 2829-516 Caparica, Portugal
5
UCIBIO, Departamento de Química, Faculdade de Ciências e Tecnologia, Universidade NOVA de Lisboa, 2829-516 Caparica, Portugal
6
i4HB, Faculdade de Ciências e Tecnologia, Universidade NOVA de Lisboa, 2829-516 Caparica, Portugal
7
Institute of Condensed Matter and Nanosciences, Molecular Chemistry, Materials and Catalysis (IMCN/MOST), Université Catholique de Louvain, Place L. Pasteur 1, 1348 Louvain-la-Neuve, Belgium
*
Author to whom correspondence should be addressed.
Current address: IQCC & Department Química, Universitat de Girona, Campus Montilivi (Ciències), 17003 Girona, Spain.
Current address: Anorganische Chemie, Fachbereich Chemie, Philipps-Universität Marburg, Hans-Meerwein-Straße 4, 35032 Marburg, Germany.
§
Current address: MARE—Marine and Environmental Sciences Centre/ARNET—Aquatic Research Network, Polytechnic of Leiria, Cetemares, 2520-620 Peniche, Portugal.
Magnetochemistry 2022, 8(12), 162; https://doi.org/10.3390/magnetochemistry8120162
Submission received: 31 October 2022 / Revised: 15 November 2022 / Accepted: 16 November 2022 / Published: 22 November 2022

Abstract

:
Complexes [Fe(X-salEen)2]BPh4·DMF, with X = Br (1), Cl (2), and F (3), were crystallised from N,N′-dimethylformamide with the aim of understanding the role of a high boiling point N,N′-dimethylformamide solvate in the spin crossover phenomenon. The counter ion was chosen for only being able to participate in weak intermolecular interactions. The compounds were structurally characterised by single crystal X-ray diffraction. Complex 1 crystallised in the orthorhombic space group P212121, and complexes 2 and 3 in the monoclinic space group P21/n. Even at room temperature, low spin was the predominant form, although complex 2 exhibited the largest proportion of the high-spin species according to both the magnetisation measurements and the Mössbauer spectra. Density Functional Theory calculations were performed both on the periodic solids and on molecular models for complexes 13 and the iodide analogue 4. While all approaches reproduced the experimental structures very well, the energy balance between the high-spin and low-spin forms was harder to reproduce, though some calculations pointed to the easier spin crossover of complex 2, as observed. Periodic calculations with the functional PBE led to very similar ΔEHS-LS values for all complexes but showed a preference for the low-spin form. However, the single-point calculations with B3LYP* showed, for the model without solvate, that the Cl complex should undergo spin crossover more easily. The molecular calculations also reflected this fact, which was more clearly defined when the cation–anion–solvate model was used. In the other models there was not much difference between the Cl, Br, and I complexes.

1. Introduction

The wide scope of applications of spin crossover (SCO), from the role of metal ions in biology to magnetic device applications, is responsible for its growing interest in research [1]. This property is displayed by 3d4–3d7 metal ions and relies on a delicate balance between the energy of the high-spin (HS) and low-spin (LS) states of their octahedral compounds, which depends strongly on the ligand field strength and structural effects [2]. One of the spin states may be stabilised by any little modification, considerably altering the magnetic behaviour of the SCO ion. This topic has been recently reviewed, keeping in mind the need to obtain systematic trends in properties, controlled by the metal ion, the ligands, the solvent, and the solid state structure [3]. The ligands were restricted to halogens or containing halogens. Density Functional Theory (DFT) calculations [4] have been performed, aiming at finding a reliable way to reproduce (and predict, if possible) the SCO behaviour and determining the relevance of the factors mentioned. The energy difference between the HS and the LS structure and the energy barrier for spin conversion (Minimum Energy Crossing Point, MECP) between the HS and LS isomers were correlated with T1/2 (temperature with 50% HS and 50% LS states) for a sample of compounds with available HS and LS experimental structures and T1/2 values. When structures are not known, can calculated structures be used? Energies of single-point calculations on the experimental geometries are not correlated. Energies of optimised structures seem to be better; the cluster models based on the cation–anion–solvent do not assign a fair weight to weak interactions in the solid. Attempts at introducing the effect of the crystal lattice have been reported and they should improve the description of the systems [5,6]. Supramolecular interactions may change with the adjustment of the geometry to a different spin state, as has been described, among others, for Fe(III) complexes of 5-X-N-quinolylsalicylaldimine, with X = F, Cl, Br, and I, where the SCO behaviour could be associated not only with CH⋯X and π⋯π, but also with X⋯π interactions [7,8,9]. Other authors came across similar effects when studying SCO and structural changes in Fe(III) complexes of H2-5-X-thsa = 5-halogensalicylaldehyde thiosemicarbazone, with X = Cl [10], or Br [11,12,13]. The magnetic and structural changes of neutral complexes [FeIII(qsal-X)(thsa)].nMeCN, where qsal-X = quinolylsalicylaldimine (X = F, Cl, Br and I), thsa2− = thiosemicarbazone–salicylaldiminate, upon SCO were studied in detail [14]. The F, Cl, and Br derivatives display incomplete SCO, while the I remains LS. Different patterns of halogen CX⋯H bonds are observed for X = F, Cl, and Br, while CI⋯π are present in the iodide complex, although several degrees of solvation are observed. Experiments and DFT calculations show the increasing SCO temperature (T1/2 = 290, 320, 340 for F, Cl, and Br; I remains LS) reflected in the calculated increasing ∆oct (6692, 7586, 8329, and 9984 cm−1, for F, Cl, Br and I) [3,14]. In this example, the calculations reproduced the experimental trends, despite the absence of crystal lattice effects.
The salEen = N-ethyl-N-(2-aminoethyl)salicylaldiminate frame has been used to synthesise cationic complexes, introducing into the crystal, besides the cation, the anion and eventually the solvent. Both the perchlorate (ethanol solvate) and the tetraphenylborate (N,N’-dimethylformamide (DMF) solvate) salts of the 3,5-Br2-salEen were prepared. The first remained in the LS state in the studied temperature range, while an incomplete and gradual SCO was observed for the BPh4 salt. As only the structure of the latter was known, no conclusions were reached [15]. More interesting results were found when examining the perchlorate complex of 5-Br-salEen, [Fe(5-Br-salEen)2]ClO4, which could be obtained in the form of two different polymorphs, neither of them solvated. The outcome was decided by the rate of crystallisation (or solvent evaporation). Slow crystallisation yielded an orthorhombic crystal, which, upon heating, exhibited an abrupt SCO with a thermosalient effect (crystals breaking), which was more gradual on cooling, with 30 K hysteresis [16]. On the other hand, fast crystallisation led to cubic crystals with an abrupt SCO (over 10 K) and 1 K hysteresis [17]. Interestingly, the anion–cation charge-assisted hydrogen bonds are not exactly the same in the two structures, being two simple NH⋯O bonds in the orthorhombic and two bifurcated bonds in the cubic crystal. As expected, the weak interactions in the solid differ, with stronger CH⋯Br and CH⋯π hydrogen bonds, π⋯π stacking, and CBr⋯π halogen appearing in the cubic species. The related 5-I-salEen gave rise to a perchlorate complex which displays SCO between 304 and 312 K with a thermosalient effect and 16 K hysteresis. However, after the first cycle and the bursting of the crystals, the hysteresis loop disappears. Phase transitions and structural changes could be monitored [18].
The previous results were extended by modifying the counter anion and adding solvent. Tetraphenylborate anions have the capability to form CH⋯π hydrogen bonds and π⋯π stacking, but they do not form charge assisted hydrogen bonds with the cationic complex. DMF is often used in the synthesis of SCO materials, as its role in hydrogen bonds and in van der Waals interactions promotes cooperativity and an increasing thermal stability of the crystals. Therefore, it usually remains in the crystal lattice up to 370 K. In this work, we presented the synthesis and characterisation of different mononuclear salEen Fe(III) Schiff base complexes bearing different halogen substituents in the aromatic aldehyde, which crystallise with the BPh4 anion and with DMF molecules in the crystal lattice. The effect of the halogens in the ligand on the magnetic behaviour of the compounds was also investigated and complemented with DFT computational studies. Both cluster model and extended solid approaches were discussed and the role of the counter anion and solvent analysed.

2. Materials and Methods

2.1. General Remarks
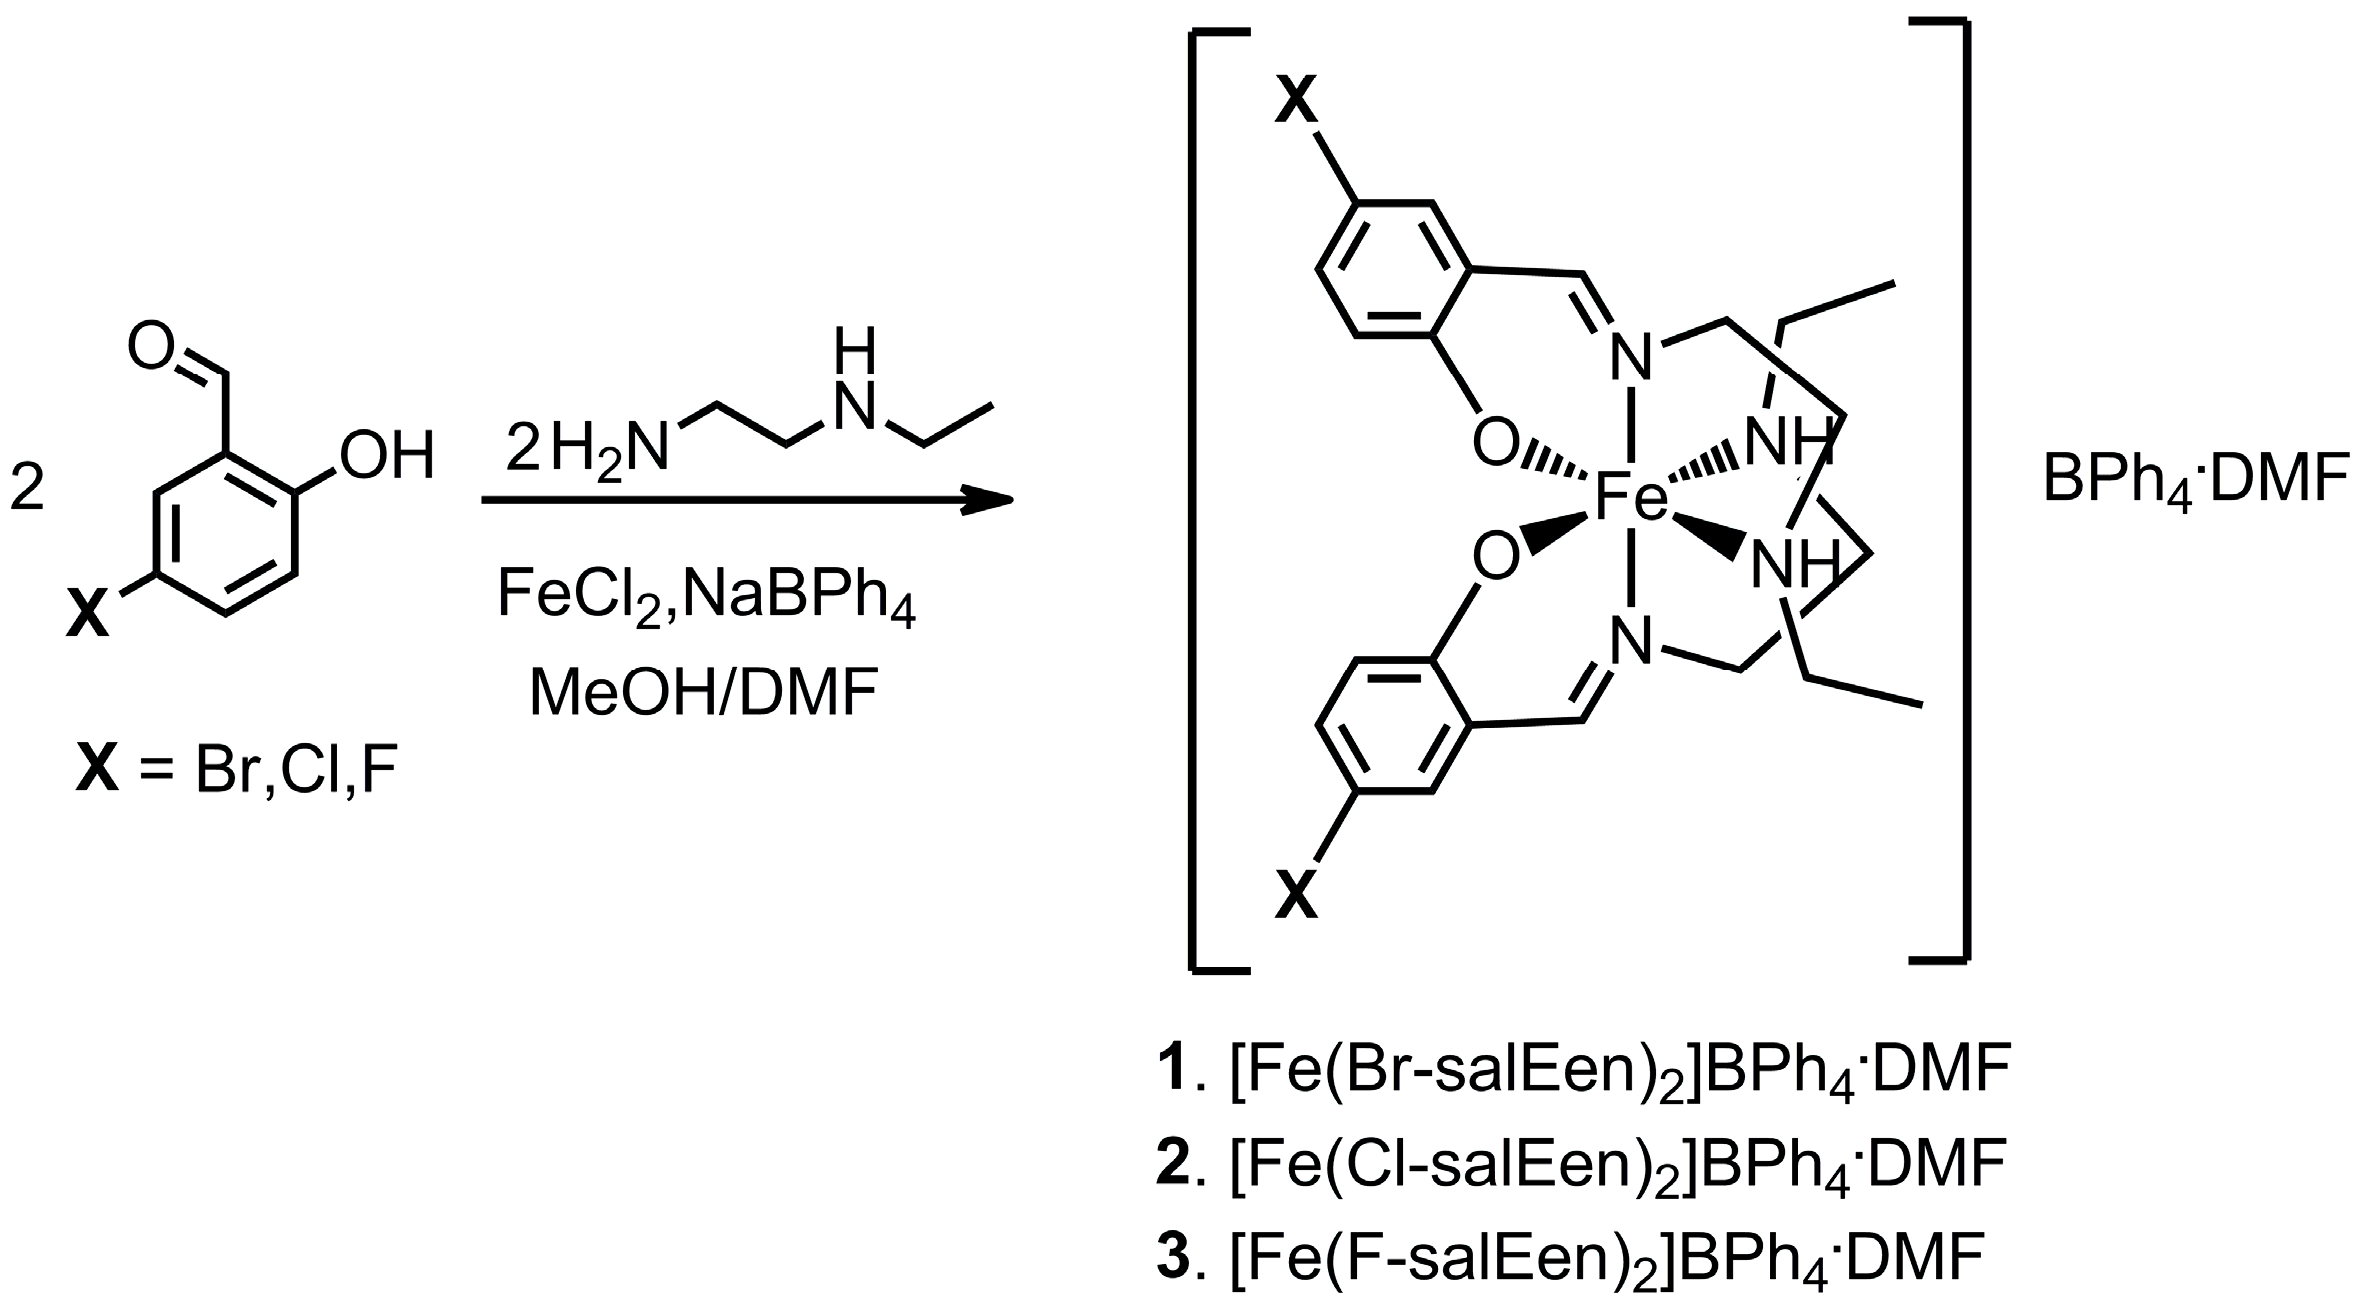
N-ethylethylenediamine, 5-fluorosalicylaldehyde, 5-chlorosalicylaldehyde, 5-bromosalicylaldehyde, sodium tetraphenylborate, Fe(II) chloride, and solvents were purchased and used without further purification. IR spectra were recorded on a Perkin Elmer FTIR spectrophotometer. Microanalyses (C, H, and N) were measured by elemental analysis service at the University of Vigo, Spain.
Magnetisation measurements as a function of temperature were performed using a SQUID magnetometer (Quantum Design MPMS). The curves were obtained at 1000 Oe for temperatures ranging from 10 to 370 K and the molar susceptibility (χM) values were corrected for diamagnetism. All compounds were measured using microcrystalline samples.

2.2. Syntheses

[Fe(5-Br-salEen)2]BPh4·DMF (1) 5-bromosalicylaldehyde (402 mg, 2 mmol) was added to a solution of N-ethylethylenediamine (210 µL, 2 mmol) in methanol (30 mL) and left under stirring for 15 min. to yield a yellow solution. Iron(II) chloride (127 mg, 1 mmol) and sodium tetraphenylborate (342 mg, 1 mmol) in methanol (15 mL) were added to the previous reaction mixture and left under stirring for 1 h. The solution immediately turned purple, and a dark purple solid was obtained after slow evaporation of the solvent. The deep dark purple solid obtained was recrystallised by slow evaporation in an ethanol/toluene/DMF mixture and crystals of the same colour were obtained. Yield: 11%. IR (KBr): νmax/cm−1 3213 (νNH, m), 3051 (νCH, m), 1663 (νDMF, s), 1633 (νC=N, s), 1591 (δC=C, w), 1299 (νC-N, s), 744 (νBPh4, s), 708 (νBPh4, s). Anal. calculated (%) for C49H55BBr2FeN5O3: C, 59.54; H, 5.61; N, 7.09; found: C, 59.60; H, 5.68; N, 7.28%.
[Fe(5-Cl-salEen)2]BPh4·DMF (2) N-ethylethylenediamine (0.50 mmol) was added to a DMF/acetonitrile solution (20 mL) of 5-chlorosalicylaldehyde (0.50 mmol) and stirred for 30 min. A DMF/acetonitrile solution (20 mL) of iron(II) chloride (0.25 mmol) and sodium tetraphenylborate (0.25 mmol) was filtered to the previously prepared solution, which was stirred for another 30 min, affording the [Fe(5-Cl-salEen)2]BPh4.DMF complex upon air oxidation. Black needle-shaped crystals were obtained after solvent evaporation at 313 K and recovered via filtration. Yield: 47%. IR (KBr): νmax/cm−1 3224 (νNH, m), 3053 (νCH, m), 1658 (νDMF, s), 1626 (νC=N, s), 1579 (δC=C, w), 1300 (νC-N, s), 730 (νBPh4, s), 706 (νBPh4, s). Anal. calculated (%) for C49H55BCl2FeN5O3: C 66.42, H 6.16, N 7.79; found: C 66.67, H 5.87, N 7.49.
[Fe(5-F-salEen)2]BPh4·DMF (3) N-ethylethylenediamine (0.50 mmol) was added to a DMF/acetonitrile solution (20 mL) of 5-fluorosalicylaldehyde (0.50 mmol) and stirred for 30 min. A DMF/acetonitrile solution (20 mL) of iron(II) chloride (0.25 mmol) and sodium tetraphenylborate (0.25 mmol) was filtered to the previously prepared solution, which was stirred for another 30 min, affording the [Fe(5-F-salEen)2]BPh4.DMF complex upon air oxidation. Black needle-shaped crystals were obtained after solvent evaporation at 313 K and recovered via filtration. Yield: 24%. IR (KBr): νmax/cm−1 3228 (νNH, m), 3050 (νCH, m), 1656 (νDMF, s), 1632 (νC=N, s), 1580 (δC=C, w), 1293 (νC-N, s), 731 (νBPh4, s), 707 (νBPh4, s). Anal. calculated (%) for C49H55BF2FeN5O3: C 67.91, H 6.40, N 8.08; found: C 67.60, H 5.95, N 7.85.

2.3. Crystallography

Crystals suitable for single-crystal X-ray analysis of complexes 1, 2, and 3 were selected and covered with Fomblin (polyfluoro ether oil) and mounted on a nylon loop. Crystallographic data (Table 1) were collected at room temperature or at 150 K for complexes 1 and 3 (Table S1 in Supplementary Information, SI) on a Bruker D8 Venture diffractometer equipped with a Photon 100 CMOS detector, and an Oxford Cryosystems Cooler, using graphite monochromated Mo-Kα radiation (λ = 0.71073 Å). The data were processed using the APEX3 suite software package, which includes integration and scaling (SAINT), absorption corrections (SADABS) [19] and space group determination (XPREP). Structure solution and refinement were carried out using direct methods with the programs SHELXT 2014/5 and SHELXL (version 2018/3) [20,21] inbuilt in APEX and WinGX-Version 2020.1 [22] software packages. Due to the impossibility to use the same crystals of complexes 1 and 3 for measurements at room temperature and 150 K, two different samples were employed. The crystal of complex 3, measured at 150 K, showed poorer quality and diffracting power, giving rise to low-quality data. Nevertheless, the structure refined to convergence and all results were consistent with the model reported herein. Crystals of 1 measured at 296 K presented racemic twining. The crystals of complexes 2 and 3 showed the presence of disordered DMF solvent molecules at room temperature, the PLATON/SQUEEZE [23] routine being applied as a good disorder model was impossible to attain. All non-hydrogen atoms were refined anisotropically. Except for NH, all hydrogen atoms were inserted in idealised positions and allowed to refine riding on the parent carbon atom. The molecular diagrams were drawn with ORTEP3 (version 2020.1) [22] and Mercury [24]. The data were deposited in CCDC under the deposit number 2209826 for 1, 2209827 for 1 (150 K), 2209828 for 2, 2209829 for 3, and 2209830 for 3 (150 K).

2.4. Mössbauer Studies

The Mössbauer measurements were performed at 77 K for 1 and at room temperature for complex 2 on a conventional constant-acceleration spectrometer equipped with a 57Co(Rh) radioactive source as 14.4 keV gamma rays provider, a proportional counter which detected the gamma rays passing through the sample, and a multichannel analyzer (CMCA-550) which kept the data counts and transferred data to the computer. To perform a measurement, the source was moved in a triangular waveform with a Doppler velocity of 1.0 mms−1 generated by a Mössbauer drive unit (MR-260A). The sample was kept stationary between the source and the detector. The spectrum was recorded using Wissoft 2003 software and fitted using Recoil software using Lorentzian site analysis method. The low-temperature measurements were performed using a liquid nitrogen flow cryostat with a temperature stability of ±0.5 K. The spectra were fitted to Lorentzian lines using the WinNormos software program. All isomer shifts (δ) in this work are given respective to the isomer shift of metallic α-Fe. All samples were ground before the measurement.

2.5. DFT Calculations

Density Functional Theory calculations [4] were carried out with the Amsterdam Density Functional program package (ADF) [26,27,28]. Gradient-corrected geometry optimisations, without symmetry constraints, were performed using the Local Density Approximation of the correlation energy (Vosko–Wilk–Nusair) [29], and the Generalized Gradient Approximation (B3LYP* exchange and correlation functional) [30,31]. Relativistic effects were treated with the ZORA approximation [32]. Unrestricted calculations were performed for S = 1/2 (LS) and S = 5/2 (HS) states. The core orbitals were frozen (fc) for C, N, O (1s), and Fe (1s-3p). Triple ζ Slater-type orbitals (TZP) were used to describe the valence shells B, C, and N (2s and 2p). One polarisation function was added to C, N, O, and Fe (single ζ, 3d, 4f). Triple ζ Slater-type orbitals (TZP) [33] were used to describe the valence shells of H (1s) augmented with one polarisation function (single ζ 2s, 2p). Three models were used based on the experimental structures described in this work: cation–anion–solvent (CAS), cation–anion (CA), and cation–solvent (CS). The ΔEHS-LS term was calculated as the difference between the energies of the optimised HS and LS species and Δoct as the energy difference between the highest t2g and the lowest eg orbitals from the virtual β spin set.
The plane-wave software package Quantum Espresso (QE) [34,35] was utilised, and a plane-wave basis set was used from the GBRV 1.5 [36] ultrasoft pseudo-potential library. The exchange and correlation generalised gradient approximations from Perdew, Burke, and Ernzerhof [37] (PBE) were utilised. Grimme’s third generation [38] dispersion correction with the Becke–Johnson [39] damping scheme was also employed [40]. The plane-wave kinetic energy cutoff of the basis set was set to 35 Ry. The charge density cutoff was set to eight times the kinetic energy cutoff due to the use of the ultrasoft pseudopotential. As the investigated compounds possess large volumes, 4500–5000 Å3, a single k-point (Γ) was chosen. The conventional unit cells, taken from the experimental structures at room temperature, were used for the calculations (Figure 1). Each carries four [Fe(5-X-salEen)2]+ (X = F, Cl, Br) and associated counter-ions in addition to a DMF per formula unit. Calculations using the same unit cell without DMF were also performed, as well as on the iodide analogue built with the structure of the bromide complex. The SCO energies were calculated as (EHS-ELS)/n where n is the number of iron sites in each unit cell (n = 4). The convergence criterion on the forces was the default value of 5 × 10⁻⁴ Ha Bohr−1. The spin polarisation was set to the corresponding electron configurations: 20 for four HS Fe(III) sites and 4 for four LS Fe(III) sites. For a more reliable estimate of the energies, a single-point run of the PBE-D3(BJ) minima was carried out with the B3LYP* functional and a kinetic energy cutoff of the basis set to 60 Ry [30].
A single ion pair comprised of the iron complex and the BPh4- anion was selected from the optimised solid-state structure, placed in a cubic lattice with cell parameters of 60 Bohr (31.8 Å) to ensure internuclear interactions were not present, and likewise optimised with fixed unit cell parameters (Figure 2). The convergence criterion on the forces was set to 2.5 × 10⁻³ Ha Bohr−1.

3. Results

3.1. Chemical Studies

Three Fe(III) 5-X-salEen (salEen = N-ethyl-N-(2-aminoethyl)salicylaldiminate, X = Br, Cl, F) complexes with tetraphenylborate as anion and DMF as solvate were synthesised. The complexes were prepared from condensation of N-ethylethylenediamine (Een) with different salicylaldehydes, in the presence of DMF, followed by metallation with Fe(II) chloride and anion metathesis with sodium tetraphenylborate, yielding the Fe(III) crystalline complexes (13, Scheme 1) after air oxidation and slow evaporation of the solvent. The complexes were characterised in the solid state by elemental analysis, IR spectroscopy, single-crystal X-ray diffraction, 57Fe Mössbauer spectroscopy, and SQUID magnetometry. All complexes showed a characteristic C=N stretching band at 1633 cm−1 (1), 1626 cm−1 (2), and 1632 cm−1 (3) characteristic of the Schiff base. Stretching bands were assigned to the BPh4 anions: 744 and 708 cm−1 (1), 730 and 706 cm−1 (2), and 731 and 707 cm−1 (3). A shifted C=0 (DMF) stretching band appeared at 1663 cm−1 (1), 1658 cm−1 (2), and 1656 cm−1 (3), confirming the hydrogen-bonded solvate molecule. DFT calculations using several models were performed to interpret the experimental results.

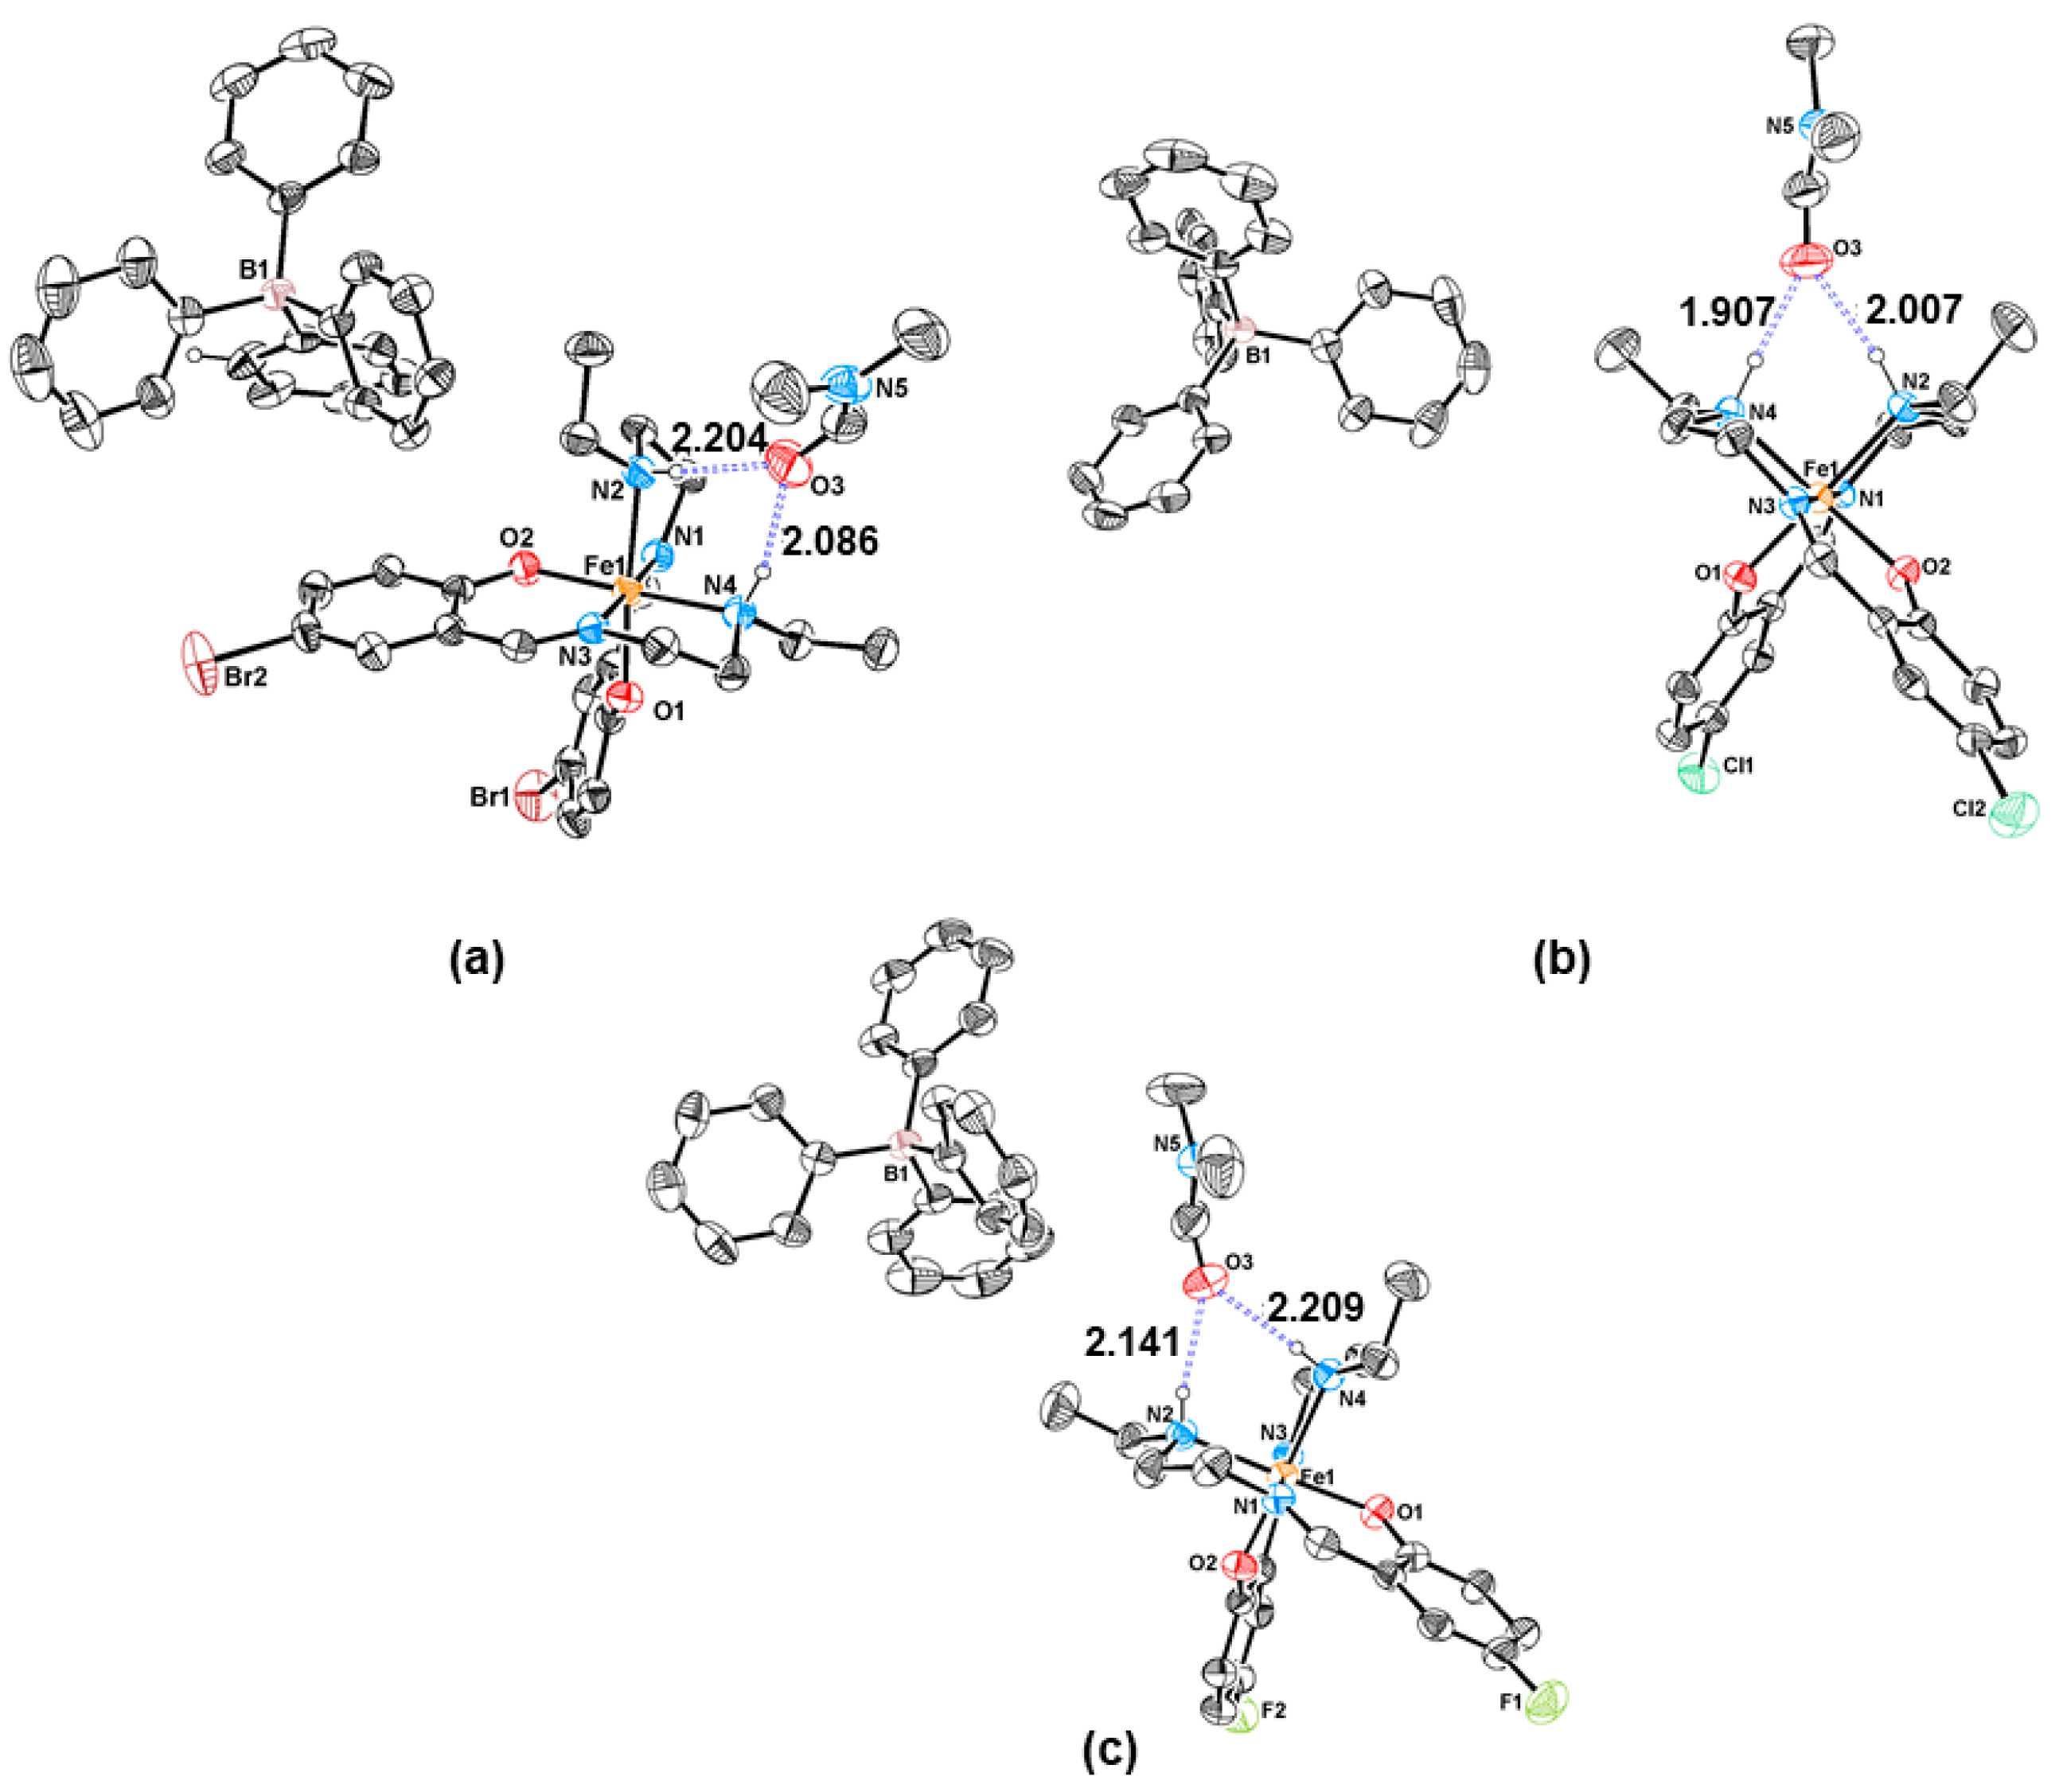
3.2. Structural Characterisation

The diffraction data of complex 2 were collected at room temperature, while those of complexes 1 and 3 were collected both at room temperature and at 150 K. Complex 1 crystallised in the orthorhombic space group P212121, and complexes 2 and 3 in the monoclinic space group P21/n. The asymmetric unit of 1, and of 1 (150 K), consisted of one [Fe(5-Br-salEen)2]+ cation, one well-ordered tetraphenylborate anion and one DMF solvent molecule. ORTEP views of complex 1 are depicted in Figure 3a, whereas those of 1 (150 K) are presented in Figure S1, in the SI. Complexes 2 (Figure 3b) and 3 (Figure 3c and 3 (150 K) Figure S2, SI) displayed one [Fe(5-Cl-salEen)2]+ cation (2) or one [Fe(5-F-salEen)2]+ cation (3), one tetraphenylborate anion, and one ordered DMF solvent molecule. A second highly disordered DMF solvent molecule was present in their asymmetric units. However, as a good disorder model was impossible to attain for complexes 2 and 3, the PLATON/SQUEEZE routine was applied, excluding its electron density from the model. Experimental constraints prevented the measurement of the initial crystal of complex 3 at both room temperature and 150 K. The sample of complex 3 measured at 150 K showed poorer quality and diffracting power, giving rise to low-quality data, refining nonetheless to convergence. However, at low temperature (150 K), due to vibration restrictions, the second DMF molecule was ordered, and it was possible to include it in the model. Interestingly, complexes 2 and 3 are isomorphous.
The Fe(III) metal centre in complexes 1, 2, and 3 is coordinated to two oxygen(phenolate), two nitrogen(amine) and two nitrogen(imine) atoms belonging to two 5-Br/Cl/F-salEen ligands defining a meridional octahedral geometry. Selected bond distances are listed in Table 2. The range of Fe–O, Fe–Nam, and Fe–Nim bond lengths (Table 2) suggests that in the four crystal structures the Fe(III) centre is mostly in the LS state [15,41].
The crystal packing of complexes 1, 2, and 3 at room temperature revealed that the oxygen atom of a DMF solvent molecule established two independent hydrogen bonds with the hydrogen atoms of the amine groups of both ligands as depicted in Figure 3 and Table S2 (SI). The N∙∙∙O distances were 2.942(7) and 2.947(8) Å, the H∙∙∙O distances were 2.09(6) and 2.20(5) Å, and the corresponding N-H∙∙∙O angles were 165(5)° and 177(5)°, respectively, for complex 1. In complex 2 the N∙∙∙O distances became 2.913(5) and 2.874(5) Å, the H∙∙∙O distances were 1.907 and 2.007 Å, and the corresponding N-H∙∙∙O angles were 156(4)° and 168(4)° respectively. Finally, in complex 3 the N∙∙∙O distances were 2.952(6) and 2.977(5) Å, the H∙∙∙O distances were 2.141 and 2.209 Å, and the corresponding N-H∙∙∙O angles were 169(3)° and 166(3)°, respectively. On the other hand, at 150 K (Figure S3, SI), besides the two independent H-bonds established by one of the DMF solvent molecules, which are equivalent to those observed in the remaining structures (N∙∙∙O distances of 2.882(8) and 2.870(10) Å and N-H∙∙∙O angles of 160(8) and 164(7)°), the second DMF molecule exhibited non-classical C-H∙∙∙O hydrogen bonds with C∙∙∙O distances of 3.406(14) and 3.108(15) Å and C-H∙∙∙O angles of 146° and 132°. Besides the classical and non-classical hydrogen bonds present in all derivatives, complexes 2, 3, and 3 (150 K) also displayed π–π stacking within the unit cell (Figures S4–S6, SI).
Moreover, the large BPh4 anions were assembled in rows. They were observed when the crystal packing was viewed along the a axis, as shown in Figures S7–S9. This arrangement necessarily creates a gap between metal centres, preventing efficient communication through the crystal structure.

3.3. Influence of the Halogen on the Magnetic Properties

The effect of the different halogen substituents, Br (1), Cl (2), and F (3) on the magnetic profile of the three complexes with the DMF solvate was studied. The relatively high boiling point of DMF allowed us to perform heating cycles during magnetic measurements without evaporating DMF. While complexes 1 and 3 are mostly in the LS state up to 300 K (above this temperature the χMT values were found to increase slightly), complex 2 showed gradual and incomplete SCO around room temperature, Figure 4. For all complexes, the temperature-dependent magnetic susceptibility data were obtained over the 10–370 K temperature range under a DC field of 0.1 T and a cooling/heating rate of 5 K min−1.
The χMT value for complex 1, at 10 K, was 0.44 cm3 mol−1 K, and corresponds to a distribution of approximately 100% LS Fe(III) centres. When the sample was warmed up, the χMT value remained constant until the sample reached a temperature of 270 K. Then χMT increased gradually until 1.24 cm3 mol−1 K at 370 K. The value at 370 K corresponds to a fraction of 79% LS, considering spin-only. Therefore, the complex mostly remained in the LS state over the temperature range measured. The same profile was obtained for complex 3, where at 10 K the χMT value was 0.37 cm3 mol−1 K and at 370 K the χMT value was 1.28 cm3 mol−1 K. At room temperature (295 K) the χMT value for complexes 1 (0.54 cm3 mol−1 K) and 3 (0.47 cm3 mol−1 K) showed that both compounds were mostly in the LS state (96% for 1 and 97% for 3), considering spin-only.
Complex 2 at 10 K displayed a χMT value of 0.48 cm3 mol−1 K assuming a spin distribution corresponding to LS. Increasing the temperature from 10 to 370 K resulted in a slow increase of the χMT value around 150 K with a sharper increase from 250 K onwards, reaching a χMT value of 2.98 cm3 mol−1 K at 370 K and adopting a predominantly HS configuration with a fraction of 65% (spin-only). At room temperature (295 K) the χMT value for complex 2 (1.745 cm3 mol−1 K) showed that the compound was mainly in the LS state (66%, considering spin-only), though with a higher fraction of HS state than complexes 1 and 3.

3.4. Mössbauer Studies

The Mössbauer spectra of complexes 1 (77 K) and 2 (room temperature) are shown in Figure 5 and isomer shift, quadrupole splitting, and line half widths in Table 3. The Mössbauer spectrum for 1 displayed a single quadrupole doublet well fitted with typical Fe(III) hyperfine parameters with δLS = 0.22(1) mms−1 and a large quadrupole splitting ΔEQLS = 2.93(1) mms−1, characteristic of the LS state, which fit well with crystallographic and SQUID data. A dissymmetry of the spectrum was observed, probably due to a texture effect.
The Mössbauer spectrum for complex 2 recorded at room temperature clearly showed two quadrupole doublets, indicating a possible spin state mixture, in agreement with SQUID measurements. The spectrum was fitted with two quadrupole doublets with identical isomer shifts δ = 0.12 mms−1 characteristic of Fe(III) ions. Analysis of quadrupole splitting values yielded ΔEQLS = 2.57(1) mms−1, which is characteristic of LS ions with a valence contribution to the electric field gradient which is cancelled in the HS state, as shown by ΔEQHS = 0.59(3) mms−1. The spin state HS/LS mixture was evaluated as 57%/43%. At the same temperature, SQUID results indicated around 35% of Fe(III) in HS state. The discrepancy between the results from the two techniques is due to the different time window of SQUID and Mössbauer techniques and, consequently, to time relaxation effects of the HS-state ions.

3.5. Computational Studies

DFT calculations were performed using both a molecular model and a solid-state periodic model approach to understand the magnetic behaviour of the compounds in further detail. In the first method (ADF, B3LYP*/TZP fc), geometry optimisations were carried out for the S = 1/2 (LS) and S = 5/2 (HS) spin states of the ion pair [Fe(5-X-L)2]BPh4 (model CA), the solvated cation [Fe(5-X-L)2]+⸱DMF (model CS), and the solvated ion pair [Fe(5-X-L)2] BPh4⸱DMF (model CAS, Figure 1), and their energies calculated. In previous work addressing similar complexes, the ion pair model was considered, but in several examples the anion and the cation were hydrogen bonded to each other [16,18]. In complexes 13, however, only the DMF was hydrogen bonded to the cation. The distances of the iron coordination sphere are collected in Table 4 for the complete CAS model of complexes 1 (Br), 2 (Cl), and 3 (F). All the distances for the three models of complexes 1, 2, and 3 and their iodide (4) analogues can be found in Table S3 (SI). Optimised structures of the three models of complex 3 are depicted in Figure S10 (SI).
As described above and can be seen in Table 4 (also in Tables S3 and S4, SI), the experimental Fe-O/N distances at room temperature and at 150 K were very similar for complexes 1 and 3, and were well reproduced (also for complex 2) by the calculated distances for a LS configuration. These values confirm that, even at room temperature the LS configuration dominates, as seen in the magnetisation curves. The calculated Fe–O/N distances for the HS spin state are longer, usually more than 0.5 Å, reflecting the occupation of metal–ligand antibonding eg* orbitals. Despite small differences, both the molecular (Table S3, SI) and solid-state (Table S4, SI) models appeared to reproduce the main trends found in Fe–O/N bond distances (Fe–O shortest, Fe–Nim intermediate, Fe–Nam longer). The solid state periodic optimisations were performed in three extended models. The normal cell contained the solvated ion pair (cation, anion, solvent, CAS, Figure 1) or the simple ion pair (cation, anion, CA), thereby allowing a test of the role of the DMF solvent in the spin-changing process. Both these two calculations and the corresponding ones in the molecular models indicated that the Fe–ligand distances do not depend on the presence of the DMF. This result is not surprising since this solvent molecule interacts with the cation through a bifurcated O⋯(H)N hydrogen bond (Table S2, SI). It differs significantly from previously described structures involving similar Fe complexes where the anion was acceptor in two charge-assisted F⋯(H)N hydrogen bonds [17]. The third extended model was a supercell (Figure 2) including the simple ion pair (CA) forced to stay very far away from its neighbours (cell parameters 30 Å). The distances shown in Table S4 are essentially the same, indicating the negligible role of the intermolecular interactions. Again, this is not unexpected, since only weak van der Waals interactions were observed between adjacent cells (see packing diagrams in Figures S7–S9, SI). At a first glance, these comments seem to explain the magnetisation curves of Figure 4, namely the similarity between the behaviour of the three complexes. This is a striking contrast with the properties of related complexes with other anions and co-crystallised molecules [15,16,17,18], reflecting how intermolecular interactions deeply affect the SCO phenomenon.
In a previous work [3], we tried to find a way to correlate the SCO with electronic parameters that could be calculated. As detailed in the introduction, it was found that the temperature of SCO in a family of complexes correlated in some families with the energy difference between the LS and HS states (ΔEHS-LS) and may be better with the splitting of the d levels by the octahedral field (Δoct). The values of ΔEHS-LS for all the models and conditions studied are collected in Figure S11. The energies obtained from the calculations with the PBE functional were in the range 94–98 kJ mol−1, for all the halogens and with or without DMF, not showing any difference for the chloride complex, which started to exhibit SCO at much lower temperatures than the other complexes. Additionally, the absence of DMF has no clear effect. The energy differences in the supercell calculations were smaller (58–80 kJ mol−1), reflecting a decrease in the energy gap between the HS and LS forms in general, but not the experimental trend. All these calculations revealed an overstabilisation of the LS forms, not consistent with the χMT increase with temperature (Figure 4 and Figure 5). It is well documented that intermolecular interactions deeply affect the SCO phenomenon and the complexes do not even crystalise in the same group. On the other hand, there is strong crystallographic evidence that a second molecule of DMF is present in the unit cell of complex 3 at 150 K (also of 1, but it was impossible to refine it; the structure of 2 was not studied at 150 K) indicating that the LS structure is not the one that was calculated, certainly for 3 and possibly for 1 and 2.
The energy differences obtained with the molecular and the periodic (B3LYP*) models discriminate more between complexes (Figure 6). Consider the red line: for the molecular Cl (2) complex the ΔEHS-LS energy difference was the smallest, suggesting that both HS and LS have comparable energies and SCO should be easier for this complex than for the F (3) and Br (1) analogues, while the not yet synthesised iodide should behave as the chloride. However, the low energy HS forms are not correctly preferred. The simpler CA and CS models (curves blue and brown on top) do not distinguish between Cl, Br, and I, while leading to a preferred HS form for F. Interestingly, the periodic (B3LYP*) curves also indicated more stable HS forms for F, and similar behaviour for Cl and I. Surprisingly, the model without DMF (blue line) reflects the easier SCO, not reproduced by the green curve with the DMF containing model.
It would seem that the DMF solvent molecule may have a small role to play in the SCO behaviour, but this effect is only perceptible on a molecule-by-molecule basis.

4. Conclusions

Understanding the magnetic behaviour of solvated forms of paramagnetic Fe(III) compounds with the ability to display the SCO phenomenon is very important as the majority of the compounds are found as solvates. The desolvation of SCO compounds is an issue when it comes to applications, as the process can irreversibly change the magnetic behaviour. Therefore, finding ways to stabilise the solvated forms of these compounds is still very relevant. Using DMF or other high-boiling-point molecules as the solvent is a strategy to overcome this issue. Therefore, we prepared three Fe(III) complexes with halogens (Br, Cl, and F) in the 5 position of the saleEn ligand. The BPh4 anion was selected to avoid competition in the formation of hydrogen-bonded species. The three complexes [Fe(X-salEen)2]BPh4·DMF, with X = 1 (Br), 2 (Cl), and 3 (F), did not show complete SCO at room temperature, although its onset was observed in the magnetisation curves at ~150 K for complex 2, and ~300 K for 1 and 3. It was therefore more advanced for complex 2, with 35% of the HS at room temperature. The Mössbauer spectrum of complex 1 at 78 K was characteristic of a LS species, while the spectrum of 2 at room temperature indicated a spin-state mixture. DFT molecular and periodic calculations well reproduced the structures and bond lengths found experimentally and showed the passive role of the DMF molecules in the magnetic behaviour for this family of compounds. The calculations also suggested that the [Fe(I-salEen)2]BPh4·DMF analogue should behave similarly to the chloride (2). It was therefore shown that stabilising solvate molecules with high boiling point is a strategy to consider when preparing SCO molecules for applications.

Supplementary Materials

The following supporting information can be downloaded at: https://www.mdpi.com/article/10.3390/magnetochemistry8120162/s1, Table S1: Crystallographic data and refinement details for structures 1 and 3 at 150(2) K; Table S2: Hydrogen bonds for complexes 1, 2 and 3 at room temperature [Å and °]; Table S3: Relevant distances (Å) calculated (ADF, B3LYP*/TZP) for the three molecular models (CA, CS, CAS) of complexes 1 (Br), 2 (Cl), 3 (F) and their iodine (4) analogue (Å) and experimental ones (bold); Table S4: Relevant distances (Å) for the calculated for the two periodic models (CAS, CA) and supercell (CA) of complexes 1 (Br), 2 (Cl), 3 (F) and their iodine (4) analogue (Å) and experimental ones (bold); Figure S1: ORTEP-3 diagram of 1 (150K), using 30% probability level ellipsoids. Hydrogen atoms are omitted for clarity; Figure S2: ORTEP-3 diagram of 3 (150K), using 30% probability level ellipsoids. Hydrogen atoms are omitted for clarity; Figure S3: Crystal packing of 3 displaying the hydrogen bonds between the DMF solvent molecule and the NH groups of the cation, observed at 150 K. Light-blue dashed lines and dark blue dashed lines represent N–H…O and C–H…O hydrogen bonds, respectively; Figure S4: Unit cell of complex 2 showing π–π stacking in a dashed blue line. Figure S5: Unit cell of complex 3 showing π–π stacking in a dashed blue line; Figure S6: Unit cell of complex 3 (150 K) showing π–π stacking in a dashed blue line; Figure S7: Crystal packing of 2—view along the crystallographic direction a with atoms of BPh4 anions drawn as spheres showing the formation of consecutive rows; Figure S8: Crystal packing of 3 at room temperature: view along the crystallographic direction a with atoms of BPh4 anions drawn as spheres showing the formation of consecutive rows; Figure S9: Crystal packing of 3 at 150 K: view along the crystallographic direction a with atoms of BPh4 anions drawn as spheres showing the formation of consecutive rows; Figure S10: Optimised molecular structures of the three models of 3: CAS (top), CS (middle), CA (bottom). Figure S11: Energy difference between spin states (ΔEHS-LS/kJ mol−1) for all the periodic and molecular DFT calculations of complexes 1 (Br), 2 (Cl), 3 (F), and 4 (I).

Author Contributions

Conceptualization, P.N.M. and M.J.C.; methodology, P.N.M. and N.A.G.B.; formal analysis, R.T.M., F.F.M., D.F.B., A.I.V., L.P.F., C.S.B.G., S.B. and V.K.; investigation, R.T.M., F.F.M., D.F.B., A.I.V. and V.K.; resources, L.P.F., C.S.B.G., S.B., Y.G., M.J.C. and P.N.M.; data curation, Y.G., M.J.C. and P.N.M.; writing—original draft preparation, R.T.M., F.F.M., A.I.V., L.P.F., C.S.B.G., M.J.C. and P.N.M.; writing—review and editing, D.F.B., S.B., Y.G. and N.A.G.B.; supervision, Y.G., N.A.G.B. and P.N.M.; project administration, P.N.M.; funding acquisition, P.N.M. All authors have read and agreed to the published version of the manuscript.

Funding

Research was funded by Fundação para a Ciência e a Tecnologia (FCT): projects UIDB/00100/2020, UIDP/00100/2020, LA/P/0056/2020, UIDB/04046/2020, UIDP/04046/2020, UIDB/50006/2020, UIDP/50006/2020 and LA/P/0008/2020, UIDB/04378/2020, UIDP/04378/2020, and LA/P/0140/2020, PTDC/QUI-QFI/29236/2017, PTDCQUI-QIN0252_2021, CEECIND/00509/2017; Fonds de la Recherche Scientifique (FNRS): PDR T.0095.21); Portugal2020: CENTRO-01-0145-FEDER-000018; Royal Society of Chemistry (RSC): R21-7511142525.

Institutional Review Board Statement

Not applicable.

Informed Consent Statement

Not applicable.

Data Availability Statement

Not applicable.

Acknowledgments

Centro de Química Estrutural (CQE) and Institute of Molecular Sciences (IMS) acknowledge the financial support of Fundação para a Ciência e a Tecnologia (FCT): Projects UIDB/00100/2020, UIDP/00100/2020, and LA/P/0056/2020, respectively. BioISI acknowledges FCT for financial support (UIDB/04046/2020, UIDP/04046/2020). This work was supported by the FNRS (PDR T.0095.21). Clara S. B. Gomes acknowledges the Associate Laboratory for Green Chemistry—LAQV, the Applied Molecular Biosciences Unit—UCIBIO and Associated Laboratory i4HB, which are financed by national funds from FCT (UIDB/50006/2020, UIDP/50006/2020 and LA/P/0008/2020, UIDB/04378/2020 and UIDP/04378/2020, and LA/P/0140/2020, respectively). Sónia Barroso thanks project SmartBioR for financial support (CENTRO-01-0145-FEDER-000018)and Centro de Química Estrutural for the access to crystallography facilities. Nuno A. G. Bandeira gratefully acknowledges the NanoBioSolutions FCT grant PTDC/QUI-QFI/29236/2017 for the computational infrastructure. Paulo N. Martinho thanks FCT and RSC for financial support (grants PTDCQUI-QIN0252_2021 and R21-7511142525). Paulo N. Martinho also thanks FCT for the contract CEECIND/00509/2017.

Conflicts of Interest

The authors declare no conflict of interest.

References

  1. Halcrow, M.A. Spin-Crossover Materials: Properties and Applications; Halcrow, M.A., Ed.; John Wiley & Sons Ltd.: Oxford, UK, 2013; ISBN 9781119998679. [Google Scholar]
  2. Gütlich, P.; Goodwin, H.A. Spin Crossover-An Overall Perspective. Top. Curr. Chem. 2004, 233, 1–47. [Google Scholar]
  3. Martinho, P.N.; Martins, F.F.; Bandeira, N.A.G.; Calhorda, M.J. Spin Crossover in 3d Metal Centers Binding Halide-Containing Ligands: Magnetism, Structure and Computational Studies. Sustainability 2020, 12, 2512. [Google Scholar] [CrossRef] [Green Version]
  4. Parr, R.G.; Yang, W. Density-Functional Theory of Atoms and Molecules; Oxford University Press: New York, NY, USA, 1989; ISBN 9780195092769. [Google Scholar]
  5. Vela, S.; Paulsen, H. Cooperativity in Spin Crossover Systems. An Atomistic Perspective on the Devil’s Staircase. Inorg. Chem. 2018, 57, 9478–9488. [Google Scholar] [CrossRef]
  6. Vela, S.; Paulsen, H. Deciphering Crystal Packing Effects in the Spin Crossover of Six [FeII(2-Pic)3]Cl2 Solvatomorphs. Dalton Trans. 2019, 48, 1237–1245. [Google Scholar] [CrossRef] [PubMed]
  7. Harding, D.J.; Phonsri, W.; Harding, P.; Gass, I.A.; Murray, K.S.; Moubaraki, B.; Cashion, J.D.; Liud, L.; Telfer, S.G. Abrupt Spin Crossover in an Iron(III) Quinolylsalicylaldimine Complex: Structural Insights and Solvent Effects. Chem. Commun. 2013, 49, 6340–6342. [Google Scholar] [CrossRef] [PubMed]
  8. Phonsri, W.; Harding, D.J.; Harding, P.; Murray, K.S.; Moubaraki, B.; Gass, I.A.; Cashion, J.D.; Jameson, G.N.L.; Adams, H. Stepped Spin Crossover in Fe(III) Halogen Substituted Quinolylsalicylaldimine Complexes. Dalton Trans. 2014, 43, 17509–17518. [Google Scholar] [CrossRef]
  9. Harding, D.J.; Phonsri, W.; Harding, P.; Murray, K.S.; Moubaraki, B.; Jameson, G.N.L. Abrupt Two-Step and Symmetry Breaking Spin Crossover in an Iron(III) Complex: An Exceptionally Wide [LS–HS] Plateau. Dalton Trans. 2015, 44, 15079–15082. [Google Scholar] [CrossRef]
  10. Li, Z.Y.; Dai, J.W.; Gagnon, K.J.; Cai, H.L.; Yamamoto, T.; Einaga, Y.; Zhao, H.H.; Kanegawa, S.; Sato, O.; Dunbar, K.R.; et al. A Neutral Fe(III) Compound Exhibiting a Two-Step Spin Transition and Dielectric Anomalies. Dalton Trans. 2013, 42, 14685–14688. [Google Scholar] [CrossRef]
  11. Zelentsov, V.V.; Mokshin, V.M.; Sobolev, S.S.; Shipilov, V.I. The Influence of Crystallization Water upon Magnetic Properties of Fe(III) Thiosemicarbazones. Dokl. Akad. Nauk. SSSR 1984, 277, 900. [Google Scholar]
  12. Floquet, S.; Guillou, N.; Négrier, P.; Rivière, E.; Boillot, M.L. The Crystallographic Phase Transition for a Ferric Thiosemicarbazone Spin Crossover Complex Studied by X-Ray Powder Diffraction. New J. Chem. 2006, 30, 1621–1627. [Google Scholar] [CrossRef] [Green Version]
  13. Kang, S.; Shiota, Y.; Kariyazaki, A.; Kanegawa, S.; Yoshizawa, K.; Sato, O. Heterometallic FeIII/K Coordination Polymer with a Wide Thermal Hysteretic Spin Transition at Room Temperature. Chem. Eur. J. 2016, 22, 532–538. [Google Scholar] [CrossRef] [PubMed]
  14. Phonsri, W.; Macedo, D.S.; Davies, C.G.; Jameson, G.N.L.; Moubaraki, B.; Murray, K.S. Heteroleptic Iron(III) Schiff Base Spin Crossover Complexes: Halogen Substitution, Solvent Loss and Crystallite Size Effects. Dalton Trans. 2017, 46, 7020–7029. [Google Scholar] [CrossRef] [PubMed]
  15. Martinho, P.N.; Vicente, A.I.; Realista, S.; Saraiva, M.S.; Melato, A.I.; Brandão, P.; Ferreira, L.P.; Carvalho, M.d.D. Solution and Solid State Properties of Fe(III) Complexes Bearing N-Ethyl-N-(2-Aminoethyl)Salicylaldiminate Ligands. J. Organomet. Chem. 2014, 760, 48–54. [Google Scholar] [CrossRef]
  16. Vicente, A.I.; Joseph, A.; Ferreira, L.P.; de Deus Carvalho, M.; Rodrigues, V.H.N.; Duttine, M.; Diogo, H.P.; Minas da Piedade, M.E.; Calhorda, M.J.; Martinho, P.N.; et al. Dynamic Spin Interchange in a Tridentate Fe( III ) Schiff-Base Compound. Chem. Sci. 2016, 7, 4251–4258. [Google Scholar] [CrossRef] [PubMed] [Green Version]
  17. Vicente, A.I.; Ferreira, L.P.; Carvalho, M.D.D.; Rodrigues, V.H.N.; Dîrtu, M.M.; Garcia, Y.; Calhorda, M.J.; Martinho, P.N. Selecting the Spin Crossover Profile with Controlled Crystallization of Mononuclear Fe(III) Polymorphs. Dalton Trans. 2018, 47, 7013–7019. [Google Scholar] [CrossRef]
  18. Martins, F.F.; Joseph, A.; Diogo, H.P.; Minas da Piedade, M.E.; Ferreira, L.P.; Carvalho, M.D.; Barroso, S.; Romão, M.J.; Calhorda, M.J.; Martinho, P.N. Irreversible Magnetic Behaviour Caused by the Thermosalient Phenomenon in an Iron(III) Spin Crossover Complex. Eur. J. Inorg. Chem. 2018, 2018, 2976–2983. [Google Scholar] [CrossRef]
  19. Krause, L.; Herbst-Irmer, R.; Sheldrick, G.M.; Stalke, D. Comparison of Silver and Molybdenum Microfocus X-Ray Sources for Single-Crystal Structure Determination. J. Appl. Crystallogr. 2015, 48, 3–10. [Google Scholar] [CrossRef] [Green Version]
  20. Sheldrick, G.M. Crystal Structure Refinement with SHELXL. Acta Crystallogr. C Struct. Chem. 2015, 71, 3–8. [Google Scholar] [CrossRef] [Green Version]
  21. Hübschle, C.B.; Sheldrick, G.M.; Dittrich, B. ShelXle: A Qt Graphical User Interface for SHELXL. J. Appl. Crystallogr. 2011, 44, 1281–1284. [Google Scholar] [CrossRef] [Green Version]
  22. Farrugia, L.J. WinGX and ORTEP for Windows: An Update. J. Appl. Crystallogr. 2012, 45, 849–854. [Google Scholar] [CrossRef]
  23. Spek, A.L. Structure Validation in Chemical Crystallography. Acta Crystallogr. D Biol. Crystallogr. 2009, 65, 148–155. [Google Scholar] [CrossRef] [PubMed] [Green Version]
  24. MacRae, C.F.; Sovago, I.; Cottrell, S.J.; Galek, P.T.A.; McCabe, P.; Pidcock, E.; Platings, M.; Shields, G.P.; Stevens, J.S.; Towler, M.; et al. Mercury 4.0: From Visualization to Analysis, Design and Prediction. J. Appl. Crystallogr. 2020, 53, 226–235. [Google Scholar] [CrossRef] [PubMed]
  25. Arroyo, M.I. (Ed.) International Tables for Crystallography, Volume A, 6th Edition, Space-group Symmetry; John Wiley & Sons Ltd.: Oxford, UK, 2017; ISBN 9780470974230. [Google Scholar]
  26. Fonseca Guerra, C.; Snijders, J.G.; te Velde, G.; Baerends, E.J. Towards an Order-N DFT Method. Theor. Chem. Acc. 1998, 99, 391–403. [Google Scholar] [CrossRef]
  27. van Gisbergen, S.J.A.; Snijders, J.G.; Ziegler, T. Chemistry with ADF. J. Comput. Chem. 2001, 22, 931–967. [Google Scholar] [CrossRef]
  28. ADF2013, SCM; Theoretical Chemistry. Vrije Universiteit: Amsterdam, The Netherlands. Available online: http://scm.com (accessed on 13 July 2021).
  29. Vosko, S.H.; Wilk, L.; Nusair, M. Accurate Spin-Dependent Electron Liquid Correlation Energies for Local Spin Density Calculations: A Critical Analysis. Can. J. Phys. 1980, 58, 1200–1211. [Google Scholar] [CrossRef] [Green Version]
  30. Reiher, M.; Salomon, O.; Hess, B.A. Reparameterization of Hybrid Functionals Based on Energy Differences of States of Different Multiplicity. Theor. Chem. Acc. 2001, 107, 48–55. [Google Scholar] [CrossRef]
  31. Salomon, O.; Reiher, M.; Hess, B.A. Assertion and Validation of the Performance of the B3LYP* Functional for the First Transition Metal Row and the G2 Test Set. J. Chem. Phys. 2002, 117, 4729–4737. [Google Scholar] [CrossRef]
  32. van Lenthe, E.; Ehlers, A.; Baerends, E.-J. Geometry Optimizations in the Zero Order Regular Approximation for Relativistic Effects. J. Chem. Phys. 1999, 110, 8943–8953. [Google Scholar] [CrossRef] [Green Version]
  33. van Lenthe, E.; Baerends, E.J. Optimized Slater-Type Basis Sets for the Elements 1-118. J. Comput. Chem. 2003, 24, 1142–1156. [Google Scholar] [CrossRef]
  34. Giannozzi, P.; Baroni, S.; Bonini, N.; Calandra, M.; Car, R.; Cavazzoni, C.; Ceresoli, D.; Chiarotti, G.L.; Cococcioni, M.; Dabo, I.; et al. QUANTUM ESPRESSO: A Modular and Open-Source Software Project for Quantum of Materials. J. Phys. Condens. Matter 2009, 21, 395502. [Google Scholar] [CrossRef]
  35. Giannozzi, P.; Andreussi, O.; Brumme, T.; Bunau, O.; Buongiorno Nardelli, M.; Calandra, M.; Car, R.; Cavazzoni, C.; Ceresoli, D.; Cococcioni, M.; et al. Advanced Capabilities for Materials Modelling with Quantum ESPRESSO. J. Phys. Condens. Matter 2017, 29, 465901. [Google Scholar] [CrossRef] [PubMed] [Green Version]
  36. Garrity, K.F.; Bennett, J.W.; Rabe, K.M.; Vanderbilt, D. Pseudopotentials for High-Throughput DFT Calculations. Comput. Mater. Sci. 2014, 81, 446–452. [Google Scholar] [CrossRef]
  37. Perdew, J.P.; Burke, K.; Ernzerhof, M. Generalized Gradient Approximation Made Simple. Phys. Rev. Lett. 1996, 77, 3865. [Google Scholar] [CrossRef] [PubMed] [Green Version]
  38. Grimme, S.; Antony, J.; Ehrlich, S.; Krieg, H. A Consistent and Accurate Ab Initio Parametrization of Density Functional Dispersion Correction (DFT-D) for the 94 Elements H-Pu. J. Chem. Phys. 2010, 132, 154104. [Google Scholar] [CrossRef] [PubMed] [Green Version]
  39. Becke, A.D.; Johnson, E.R. A Density-Functional Model of the Dispersion Interaction. J. Chem. Phys. 2005, 123, 154101. [Google Scholar] [CrossRef]
  40. Grimme, S.; Ehrlich, S.; Goerigk, L. Effect of the Damping Function in Dispersion Corrected Density Functional Theory. J. Comput. Chem. 2011, 32, 1456–1465. [Google Scholar] [CrossRef] [PubMed]
  41. Cardoso, B.D.P.; Vicente, A.I.; Ward, J.B.J.; Sebastião, P.J.; Chávez, F.V.; Barroso, S.; Carvalho, A.; Keely, S.J.; Martinho, P.N.; Calhorda, M.J. Fe(III) SalEen Derived Schiff Base Complexes as Potential Contrast Agents. Inorg. Chim. Acta 2015, 432, 258–266. [Google Scholar] [CrossRef]
Figure 1. The unit cell of [Fe(5-Br-salEen)2]BPh4⸱DMF (1) in the LS state. Cationic complex (green) and DMF (red) moieties are highlighted. Hydrogen atoms are omitted for clarity except those involved in internuclear interactions (black dotted). Carbon atoms are represented in the wireframe model. Color code: H—light grey, B—pale pink, N—blue, O—red, Br—dark red, Fe—orange.
Magnetochemistry 08 00162 g001
Figure 2. Supercell model of the ion pair [Fe(5-Br-salEen)2]BPh4 in the LS state.
Magnetochemistry 08 00162 g002
Scheme 1. Synthesis of the Fe(III) complexes 13.
Magnetochemistry 08 00162 sch001
Figure 3. ORTEP-3 diagrams of complexes 1 (a), 2 (b), and 3 (c), using 30% probability level ellipsoids. All calculated hydrogen atoms are omitted for clarity. Hydrogen bonds between the DMF solvent molecule and the NH groups of the cation are depicted as dashed blue bonds with distances of 2.086 and 2.204 Å for (a), 1.907 and 2.007 Å for (b), and 2.141 and 2.209 Å for (c).
Magnetochemistry 08 00162 g003
Figure 4. Temperature dependence of χMT for complexes 13, obtained under 0.1 T on cooling and warming (black squares for 1, red circles for 2, and blue triangles for 3).
Magnetochemistry 08 00162 g004
Figure 5. 57Fe Mössbauer spectra of complexes 1 (Br) at 78 K and 2 (Cl) at room temperature.
Magnetochemistry 08 00162 g005
Figure 6. Energy difference between spin states (ΔEHS-LS, kJ mol−1) for all the periodic (B3LYP* functional) and molecular DFT calculations of complexes 1 (Br), 2 (Cl), 3 (F), and 4 (I).
Magnetochemistry 08 00162 g006
Table 1. Crystallographic data and refinement details for structures 1, 2 and 3 at room temperature.
123
FormulaC49H55BBr2FeN5O3C52H62BCl2FeN6O4C52H62BF2FeN6O4
M988.46972.65939.74
λ (Å)0.710730.710730.71073
T (K)296(2)296(2)296(2)
Crystal systemOrthorhombicMonoclinicMonoclinic
Space group [25] P 212121P 21/nP 21/n
a (Å)15.0641(11)14.557(3)14.758(11)
b (Å)15.9098(10)18.870(4)19.005(16)
c (Å)19.9825(12)19.498(4)19.688(17)
β (°)90103.416(6)106.19(2)
V3)4789.1(5)5209.5(19)5303(7)
Z444
ρcalc (g.cm−3)1.3711.1471.086
µ (mm−1)2.0290.4340.331
Crystal size0.18 × 0.12 × 0.120.20 × 0.20 × 0.100.40 × 0.20 × 0.16
Crystal colourBrownRedRed
Crystal descriptionBlockPrismPrism
θmax (°)25.04825.85425.475
total data36794114,49186,088
unique data843499939745
Rint0.06740.13970.1497
R [I>2σ(I)]0.04090.06840.0612
Rw0.08870.19460.1789
GooF (all data)1.0531.0321.054
ρmin
ρmax
−0.497
0.427
−0.316
0.417
−0.430
0.318
Table 2. Selected bond lengths at room-temperature [Å] for complexes 1, 2, and 3 and at 150 K for complexes 1 and 3.
11 (150 K)233 (150 K)
Fe–O1.880(3)1.867(3)1.866(2)1.883(3)1.856(5)
1.870(3)1.878(3)1.866(3)1.891(3)1.873(5)
Fe–Nim1.923(4)1.919(4)1.926(3)1.950(3)1.897(6)
1.930(4)1.917(4)1.925(3)1.948(3)1.896(6)
Fe–Nam2.051(5)2.021(4)2.052(3)2.061(3)2.028(6)
2.020(5)2.049(4)2.031(3)2.083(3)2.019(6)
Table 3. Mössbauer parameters for complexes 1 and 2. δ—Isomer shift (with respect to metallic α-Fe); ΔEQ—quadrupole splitting; Γ/2 = lines half width.
ComplexTemperatureSitesδ
(mms−1)
ΔEQ
(mms−1)
Γ/2
(mms−1)
Fraction
(%)
1 (Br)77 KFe(III) LS0.22(1)2.93 (1)0.30(2)100
2 (Cl)Room temperatureFe(III) HS0.12(1)0.59(3)0.14(3)57
Fe(III) LS0.12(5)2.57(1)0.22(7)43
Table 4. Fe-O/N bond lengths (Å) of the DFT (ADF, B3LYP*) optimised structures (CAS models) for LS and HS states and crystallographic structures at room temperature and 150 K for complexes 1, 2, and 3.
ComplexBondLS150 KRTHS
1 (Br)Fe–O1.919, 1.9221.867, 1.8781.870, 1.8801.944, 1.948
Fe–Nim1.982, 1.9861.919, 1.9171.930, 1.9232.149, 2.163
Fe–Nam2.128, 2.1282.021, 2.0492.020, 2.0502.296, 2.296
2 (Cl)Fe–O1.918,1.922-1.866.1.8661.974, 1.979
Fe–Nim1.979,1.980-1.926.1.9252.174, 2.176
Fe–Nam2.120,2.131-2.052,2.0312.305, 2.313
3 (F)Fe–O1.914, 1.9171.856, 1.8721.883, 1.8911.963, 1.975
Fe–Nim1.977, 1.9781.897, 1.8971.950, 1.9492.159, 2.185
Fe–Nam2.121, 2.1292.028, 2.0192.061, 2.0832.274, 2.316
Publisher’s Note: MDPI stays neutral with regard to jurisdictional claims in published maps and institutional affiliations.

