Review

The Investigation of Spin-Crossover Systems by Raman Spectroscopy: A Review

1
Laboratory of Applied Molecular Spectroscopy, Institute of Chemical Engineering Sciences Foundation for Research and Technology Hellas (FORTH/ICE-HT), GR-26504 Patras, Greece
2
Department of Chemistry, University of Patras, GR-26504 Patras, Greece
Magnetochemistry 2022, 8(9), 108; https://doi.org/10.3390/magnetochemistry8090108
Submission received: 21 August 2022 / Revised: 9 September 2022 / Accepted: 16 September 2022 / Published: 18 September 2022

Abstract

:
Spin-crossover (SCO) is a well-documented phenomenon, being intensely investigated by a respectable number of researchers during the last decades. The conventional method for the investigation of SCO properties is by performing magnetic susceptibility measurements. On the other hand, Raman has also been proposed as a promising characterization method since it is a non-bulk technique and allows, along with the monitoring of the SCO behavior, the parallel deep characterization of structure and molecular structure modifications, while it can also facilitate the determination of the entropy change related to the SCO event. There are several review articles focused on the analysis of the SCO phenomenon, the emerging applications of SCO materials and the importance of SCO/polymer composites, and elaborating on the vibrational effects on the investigation of SCO complexes; however, there has been no attempt to review solely the existing research efforts of the investigation of SCO phenomenon based on Raman spectroscopy. The main scope of this review is to focus on the main features, the challenges, and the key role of Raman spectroscopy in the investigation of 3d mononuclear complexes (comprising mainly of iron(II) complexes) and Hofmann-type metal organic frameworks (MOFs) exhibiting the SCO behavior. In addition, special focus is devoted to the research studies in which in situ Raman measurements are performed for the investigation of SCO systems. Finally, novelties, current challenges, future perspectives, and the contribution of Raman spectroscopy toward the practical application of SCO complexes are discussed.

1. Introduction to Raman Spectroscopy: The Impact on Inorganic and Coordination Chemistry

Raman spectroscopy has been established as a valuable characterization method both in fundamental and applied science, being simultaneously one of the most valuable yet versatile tools for the analysis of the different types of materials in lab or on-site conditions [1]. Raman was introduced by the individual and independent research of Chandrasekhara Venkata Raman [2] and Grigorij Samuilovič Landsberg [3] in the first half of the 20th century, but it was established after the implementation of lasers at the end of the 20th century [4]. In the original experiment, sunlight was directed onto the sample (purified liquid or a dust-free vapor) through a telescope. Afterward, the scattered radiation was collected after passing through a second lens. The existence of scattered light exhibiting different frequencies from the incident light, which basically constitutes the Raman phenomenon principle, was verified by using a system of optical filters. When light interacts with matter, the photons that make up the light may be involved in several phenomena, the most typical of which are absorption and scattering. Raman scattering is classified as the main scattering technique used for molecular identification [5]. The basic principle of Raman includes the inelastic scattering of light after its interaction with matter. There are three possible ways of scattering for a photon from the visible region of spectrum (energetically low to cause a transition to an excited electronic state) after its interaction with a molecular species. In the first one, the incident photon can be elastically scattered without any energy gain or loss, referred to as Rayleigh scattering, or it can be in-elastically scattered by either gaining (anti-Stokes scattering) or losing energy (Stokes scattering) from the molecule (Figure 1a). The relative intensities of the two inelastic processes depend on the population of the various states of the molecule. Based on the Boltzmann equation, at room temperature, the number of molecules expected to be in an excited vibrational state is too small. Therefore, the anti-Stokes scattering is a weaker counterpart. It is also important to note that the Stokes/anti-Stokes intensity ratio is affected by temperature and is increased as the temperature increases since, under the same conditions, a bigger part of molecules will be placed in the vibrationally excited states. It is also a fact that Raman scattering is inherently a weak phenomenon, and only one in every 106–108 scattered photons is Raman scattered, and other processes such as sample degradation and fluorescence can readily occur. However, this does not make the process insensitive since, with modern lasers and microscopes, very high power densities can be delivered to very small samples. The establishment of this spectroscopic method opened the path to more detailed knowledge about materials, in particular with respect to carbonaceous materials playing a significant role until today [6]. Throughout the years, an intense growth of Raman analysis was noticed, reaching even engineering interest in several industrial fields, including pharmaceutical analysis, environmental analysis, medicine, food, and textiles industries [7]. This may also be attributed to the fact that Raman spectroscopy displays several advantages over other spectroscopic techniques such as infrared. For instance, the Raman signal is barely affected by water, allowing its use in a great number of applications [8,9]. In addition, from a scientific point of view, the analyzed molecules do not need to possess a permanent dipole moment in contrast with IR, while, from a technical point of view, a big advantage of using Raman over IR is the easier and less time-consuming sample preparation. Another important advantage of Raman spectroscopy is its flexibility since it does not require a reference light path being a scattering technique, allowing the remote analysis of a wide range of samples (even gases), which is further supported by the high spatial resolution of Raman and the capability to be combined with microscopy. It is noteworthy though that IR is a less expensive technique; increased cost is required for Raman for lasers and amplification sources to obtain sensitive results. The successive experimental setup improvements (lasers, improvements on instrumentation, detection systems and signal processing) taking place gradually the last 40 years promoted the further implementation of Raman (Figure 1b). As a consequence, Raman spectroscopy has become a versatile method for the study of vibrating “molecular” entities, providing information about the molecular structure and underlying inter/intramolecular interactions.
The contribution of Raman spectroscopy in inorganic and coordination chemistry is rich and decisive. The function of molecular modes would not be able to be understood without acknowledging the occurring interactions between the coordinated metals and ligands or through the detection of the structural changes leading to a particular functional geometry of the systems. For instance, in molten salt research, Raman spectra of oxide volatile halide melts have been investigated for temperatures up to 2200 °C, while in situ studies in melts of electrode surfaces have been also reported [10]. It is interesting to note that the first vibrational frequency assigned to a metal-metal stretch was observed through the Raman spectrum of the aqueous solution of mercurous nitrate by Woodward in the 1930s, providing a decisive contribution to the knowledge that all the univalent mercury compounds contain Hg22+ moieties and a Hg-Hg bond [11].
The importance of the meticulous study of coordination complexes with any possible characterization technique can be understood, considering that coordination complexes are a class of complexes involved in many fields; many coordination complexes are part of bioinorganic chemistry (i.e., enzymes), environmental chemistry, medicine (the chemotherapy medication cis-platin), material science (single-molecule magnets, SMMs), etc. For that reason, Raman spectroscopy could play a very important role in the cooperative and meticulous study of such complexes [12,13,14,15,16].
The Raman frequencies of isolated molecules are determined by the arrangement of the atoms in space and by the forces between the atoms. When a ligand is coordinated, these characteristics completely change. Hence, changes are to be expected both in the vibrational spectra features associated with the free ligand and in those of the system to which it becomes attached. For instance, in simple ionic thiocyanates, such as KCNS, a ν(C-N) stretching vibration at ~2060 cm−1, a ν(C-S) stretch at ~746 cm−1, and a δ(NCS) bend at ~480 cm−1 are noticed [17,18]. However, when the SCN- is N-bonded, such as in the anion [Co(NCS)4]2−, the ν(C-N) upshifts to ~2070 cm−1, and the ν(C-S) dramatically upshifts to ~815 cm−1, but the bending vibration only downshifts by ~5 cm−1. On the other hand, when the SCN anion is S-bonded, such as in the [Hg(SCN)4]2− anion, the ν(C-N) upshifts to ~2100 cm−1, and the ν(C-S) downshifts to ~710 cm−1, whereas the bending mode downshifts to ~450 cm−1 [18]. It is obvious that these different patterns could be used as a clarification way to determine the way the SCN ligand coordination mode.
In favorable cases, vibrational spectra can be used to determine the ligand geometry around a central metal atom. Best known is the fact a center of symmetry means that bands active in the infrared are not Raman active and vice versa, although this is just one of many symmetry-spectra relationships. Such correlations are not infallible. For that reason, a band may exist but be too weak to be observed separately from other bands in the same spectral region. Alternatively, vibrational couplings may be small. So, if two vibrations are uncoupled it is irrelevant that they happen to be related by a center of symmetry, a single band will appear, coincident in IR and Raman [19].
The M-donor atom of a certain ligand stretching vibrations can be thoroughly examined by Raman. Most of the M-X (X = any donor atom such as N, O, S) exhibit Raman active vibrations at the region of 50–2000 cm−1, but mostly in low-frequency regions (50–500 cm−1). Many reports are published referring to the Raman study of coordination complexes in all kind of coordination geometries [20]. In the case of the octahedral complexes, XY6, which is the geometry of most Fe(II) complexes there are six normal modes of vibration (Figure 1c).
Vibrations ν1, ν2, and ν5 are Raman active, while infrared active are ν3 and ν4. Since ν6 is both IR and Raman inactive, its frequency is estimated by several methods, including the analysis of non-fundamental frequencies and fine rotational structures of vibration spectra. Within the same family of the periodic table, the stretching frequencies decrease as the mass of the central atom increases. In addition, across the periodic table, the stretching frequencies increase as the oxidation state of the central atom becomes higher [20]. Other parameters can also affect the Raman spectrum of a coordination complex, i.e., the Jahn–Teller effect, the spin state (HS, LS) of a complex, or even the inter- or intramolecular hydrogen-bonding formation [21]. It is also worth mentioning that Raman spectroscopy under extreme conditions (variable-temperature values or under pressure) is also very useful for the structural alterations of many coordination complexes (Figure 1d) [22]. However, in recent years, Raman spectroscopy is an emerging research line for the investigation of coordination complexes exhibiting the spin-crossover (SCO) phenomenon providing important information about the structure of the molecules, their symmetry, the nature and the strength of bonds and most importantly about the SCO behavior [23,24,25].
At this point, we make a parenthesis to provide the basic information related to the spin-crossover phenomenon. Despite the fact that spin-crossover has been a well-known phenomenon for over a century, it still remains an alluring research topic for researchers from different research fields. The SCO phenomenon is defined by the exchange between two stable states, the high-spin (HS) and the low-spin (LS) states, mainly noticed in six-coordinate 3d metal complexes with d4–d7 configurations. The plot of high-spin fraction (γHS) as a function of temperature illustrates a typical spin-transition curve (Figure 2), which provides much information, including the number of forms for systems in the solid state. The most common curves have been presented by Gütlich and Goodwin [26].
SCO materials have been proposed to be suitable for various applications, for example, in sensors, memory storage units, displays or actuators [27,28,29,30]. Several research efforts are dedicated to SCO materials, since this behavior is a quite delicate process that is fairly affected by several influencing factors, including intraligand substitution, particle size, cooperativity/intermolecular interactions, and the presence of counter-anions/solvent molecules in the lattice [31,32,33,34]. The spin-state variation is accompanied by variation in most micro- and macroscopic properties, influencing therefore metal–ligand bond lengths/unit cell volume, electron density of states and subsequently magnetic moment and vibrational properties, making SCO an observable phenomenon by numerous and quite different characterization techniques [35,36]. Indicatively, temperature-induced SCO can be followed by variable-temperature magnetic susceptibility 57Fe Mössbauer (in the case of Fe complexes), UV/Vis, 1H NMR, IR, Raman and fluorescence spectroscopies, variable-temperature single-crystal and powder crystallographies, while DSC measurements are also invaluable [26,37]. Nevertheless, in order to explore thermal-, pressure- and light-induced spin-state transitions, appropriate carefully selected techniques, are demanded.
The most widely used method for examining the SCO phenomenon relies on magnetic susceptibility measurements, which could be considered a quite rapid though bulk technique. On the contrary, vibrational techniques are based on a more delicate process; especially in micro-Raman measurements, the data collection occurs in a specific spot of the sample. In general, in most studies, the dependence of the HS population as a function of the external stimulus is of interest. However, excludes the possibility of revealing the intermediate spin states (constituting the mixture of HS and LS species), which may also co-exist along with the two extreme states, a behavior most frequently occurring when cooperative interactions are present in the system. In these terms, spectroscopic studies play a crucial role in unveiling such features, allowing us to understand the mechanism of the spin transitions and, in parallel, the nature of the cooperative interactions. By following the spectroscopic approach, it becomes feasible not only to understand in depth the SCO process but in addition to obtain all the features of SCO materials that could be beneficial for their future applications. It is noteworthy that, in the transition coordination complexes, the driving force that governs the SCO phenomenon is directly associated with the entropy increase upon the LSHS transition [38]. The contribution deriving from spin multiplicity to the total ΔS is small (ΔS = Rln((HS-multiplicity)/(LS-multiplicity)), which means that for a d6 octahedral system is equal to Rln5), and the vibrational contribution (mostly related to intramolecular nature) is large, establishing vibrational spectroscopies as a valuable tool for the investigation of the SCO phenomenon. Taking into account that spin-state variations of the metal ion is reflected in ligand vibrational modes’ alterations, variable-temperature Raman spectroscopy could be considered unique for monitoring SCO [38,39,40,41,42]. By setting in more detail this potential, the vibrational modes most affected by the change in the spin state are the stretching and bending vibrations associated with the metal–ligand bonds. In Fe(II) SCO complexes, for example, the Fe-N bond lengths are about 10% longer in the HS than in the LS state; electrons exist in the antibonding eg orbitals only in the HS state (t2g4eg2). The resulting elongation on the metal–ligand bond lengths can be fairly monitored by low-frequency Raman spectroscopy. Therefore, in addition to the typical structural characterization of the materials, Raman spectroscopy may also indirectly provide insightful information related to the SCO transition and the HS species population as a function of an external stimulus. However, the relation between the shifts of the metal–ligand stretching vibrations and the observed spectral changes occurring during LS–HS transition is not a direct function due to the fact that there are cases where SCO materials do not exclusively exhibit a classical nonresonant Raman scattering behavior. In particular, a “preresonance effect” may occur depending on the wavelength of the exciting laser radiation, and therefore one may follow the amplification of the intensity of some bands that do not need to correspond to stretching vibrations, which reveal the highest shift on spin transition, and we may not see the stretching vibrations at all. For instance, in the complex [Fe(ptz)6](BF4)2, where ptz = 1-n-propyl-tetrazole, the LS spin marker bands are shown at 300 and 995 cm−1, which disappear upon switching to the HS state, with the latter state presenting a spin marker band only at 284 cm−1 [43]. In spite of these, the availability of metal–ligand stretching vibrations acting as Raman spin marker bands, as in the case of [Fe(pz){Pt(CN)4}] where peaks around 349 and 233 cm−1 (assigned to Pt-CN bending and Fe-N stretching modes, respectively) are associated with the HS state, provides the opportunity to investigate SCO systems through Raman [42,44]. It is also a fact that Raman instrumentation is more widespread than magnetic measuring devices, and, in addition, it allows to focus on single crystals giving the opportunity to provide specific and valuable related vibrational information. In this context, phase transitions taking place in a solid sample can be depicted through Raman due to the different vibrational modes accounted for pertinent crystals symmetry. An important point is that Raman scattered light can be collected upon in situ dynamic measurements, induced by different stimuli, such as pressure [42,45], temperature [46,47,48,49,50], light-induced [45], and magnetic induction, revealing at the same time the probed microstructure and spectral features. Moreover, recent advances in quantum chemical density functional theory (DFT) methods offer new important possibilities when correlated with experimental findings deriving from the vibrational analysis [51]. Therefore, the combination of the two is anticipated to provide a better understanding of the relationships between the microscopic effects expressed as molecular structural changes, energy variation, and macroscopic effects deriving from the phenomenological models.
There are many excellent recent reviews about the SCO phenomenon; however, there is no review referring specifically to research efforts for the Raman study of SCO systems. The main scope of this review is to discuss the current Raman-based studies of SCO compounds toward a detailed analysis of the SCO phenomenon and examine the several aspects and challenges of such a study. We hope that this review could be considered helpful for researchers involved in the field, being a motivation for the wider use of spectroscopy-based monitoring of SCO.

2. The Influence on Molecular Vibrations

As it has been previously reviewed vibrational spectroscopy, including infrared and Raman spectroscopy as well as nuclear inelastic scattering (NIS) can be used to follow spin-transition processes, induced by different stimuli (temperature, pressure, or irradiation with light) in spin-crossover (SCO) molecules [52,53,54]. In addition to that the complex lattice dynamical aspects of the spin-crossover phenomenon in molecular solids that are expressed by the intricate couplings between the electronic spin state of the molecules and the lattice properties have been examined in detailed through vibrational spectra analysis providing key properties, such as the heat capacity, vibrational entropy and enthalpy, lattice rigidity, elastic constants, and elastic interactions [55]. In general, vibrational spectroscopy relies on molecular vibrations based on chemical bonds and interactions, providing hence structural information of molecules. In terms of the SCO phenomenon, vibrational spectroscopy has been intensely considered following the shift occurring in molecular vibrational frequencies upon switching of the spin state and other spectral alterations [38,45,51,56,57,58,59,60]. During the LSHS transition in Fe(II) complexes, typically an elongation of the metal–ligand bonds occurs as a consequence of higher multiplicity in the HS state (electrons occupy the antibonding eg orbitals) than in the LS state in which only t2g orbitals are occupied. As a result, the metal–ligand vibrations, especially the ones with a stretching character, are forced to display a shift compared to the corresponding LS vibrational bands toward lower frequencies. This effect for elongation has been revealed to be more intense in d6 systems, especially in FeN6 coordination spheres exhibiting metal–ligand bond elongation ~0.2 Å and a shift on vibrational modes up to 200 cm−1. In general, in ML6 coordination spheres 15 normal vibrational modes with different symmetry properties exist. For a perfect octahedral symmetry there are anticipated six normal modes of vibration (three stretching and three bending). These modes are multiplied in SCO complexes where the symmetry of the octahedron is reduced. This simplified conceptualization could be further extended by taking into account site group or factor group analysis. Concerning d5 electronic configurations, the eg orbitals are also unoccupied in the LS state and an elongation of all metal–ligand bonds is noticed in the HS state caused by this symmetric distribution of electron density on antibonding molecular orbitals.
On the other hand, apart from the metal–ligand stretching vibrations that are directly affected, other significant alterations are also noticed to internal vibrations. These are most profound in the case of cyanide and thiocyanate terminal ligands, which have been used extensively as spin-state marker bands. Internal modes include both ligand vibrations, which are located in the high-frequency region (600–4000 cm−1), and metal–ligand vibrations, appeared below 600 cm−1; in the case of FeIIN6 complexes, metalo-ligand vibrations are present in the 50–450 cm−1 spectral region. External modes are located at the 50–100 cm−1 spectral region, being though difficult to be accurately detected by conventional IR and Raman techniques. Details on these observations are provided in the following sections.
As mentioned above, the driving force that governs the SCO transition in metal complexes is directly related to the entropy increase occurring during the LSHS transition [38]. Indicatively, for a complete LSHS transition in Fe(II) complexes, the spin multiplicity contribution to the total ΔS is only Rln(2 × 2 + 1) = 13.4 J K−1 mol−1 [38,61,62]. As it was pointed out by Bousseksou and coworkers [38] the vibrational contribution to the entropy increase during the LSHS transition constitutes the most critical factor, further supported by Sorai and Seki [61]. It is also noticeable that this trend has been also supported by Brehm et al. [63], where systematic DFT calculations were correlated to experimental findings.
In the following parts a brief discussion on the most intensely used method, the magnetic susceptibility measurements, will be provided, while selected studies of SCO systems referring to Raman will be elaborated. These studies are divided into those which refer to Fe(II) and 3d coordination complexes, and those of 3d/3d’ Metal Organic Frameworks (MOFs). In addition, the methodology that can be used to extract the SCO features (transition curve, HS/LS population, etc.) through Raman is elaborated along with the recent efforts for in situ temperature-dependent Raman measurements for the calculation of HS population. Finally, current challenges and future perspectives of vibrational techniques for the study of SCO processes are provided.

3. Conventional Methods for Exploring SCO: The Prevalence of Magnetic Susceptibility Measurements

Since its discovery eight decades ago, the spin-crossover phenomenon has been attempted to be monitored through various physical, crystallographic, and spectroscopic methods [64,65,66,67]. Among them, variable-temperature magnetic susceptibility measurements have been established as the prevailing characterization method [68]; however, 57Fe Mössbauer spectroscopy (in the case of Fe complexes), X-ray crystallography, differential scanning calorimetry (DSC), and vibrational and UV/Vis spectroscopies have also been proposed, bearing each of them specific advantages and limitations (Table 1).
This section may be divided by subheadings. It should provide a concise and precise description of the experimental results, their interpretation, as well as the experimental conclusions that can be drawn.
The typical determination method of the SCO phenomenon is based on magnetic susceptibility measurements where magnetic susceptibility is recorded as a function of temperature χΜ(T). Fe(II) complexes are the most widely examined; it should be reminded at this point that for octahedral Fe(II), the spin states are S = 0 and S = 2 for LS and HS, respectively. For the study of solid samples, SQUID magnetometers have progressively replaced the traditional balance methods in the case of solid samples with significantly higher sensitivity and accuracy, while ac/dc susceptibility magnetometers have been also considered. The successful character of this determination method relies on the fact that the drastic transition from a strongly paramagnetic HS state to a weakly paramagnetic or even diamagnetic LS state directly results in the alteration of the magnetic susceptibility. The χΜ(T) for a SCO material is determined according to the equation χΜ(T) = γHSχHS + (1 − γHS)χLS. Knowing the values of the susceptibilities of the pure HS and LS states we can satisfactorily determine the mole fraction of the two states (γHS or γLS) at various temperatures. It is noticeable that magnetic susceptibility measurements also offer the opportunity to determine the spin-state variations under various external perturbations such as hydrostatic pressure, light irradiation and application of high magnetic fields, which may be crucial in some cases.
In addition, comparing the two vibrational techniques that in many cases act complementary for the investigation of coordination complexes (IR and Raman), Raman and micro-Raman spectrometers makes this technique a versatile method to characterize SCO materials, while the main advantage compared with IR spectroscopy is that the far-IR region is immediately accessible. In addition, through IR analysis, there is a need for sample grinding and/or pelletizing for IR transmission studies, which are avoided for Raman measurements, requiring only small amounts of samples in any form without prior sample preparation. It is important to note, though, that the Raman technique has also issues to cope with. The main problem is the preresonant effect (mentioned above in Section 1), the laser-induced heat effects that promote a transition, and the boosting of laser induce LIEST, constituting the technique less straightforward and the analysis of the data challenging (see also discussion in Section 5).

4. The Investigation of SCO through Raman Spectroscopy in Selected Examples

4.1. Fe(II) and Other 3d Mononuclear and Polynuclear Complexes

Spin-crossover is intrinsic to all transition metal ions with an electron configuration d4–d7 (d8 may also be included if the symmetry of the molecule is below Oh). However, it is self-evident, that iron(II) SCO complexes, are by far the most commonly studied, usually with 6N donors, mainly due to the fact that it has the more intense change in magnetic response, from a diamagnetic LS state to a HS state with four unpaired electrons.
To the best of our knowledge, the first effort focused on the investigation of the HS and LS states through Raman spectroscopy has been attempted by Bousseksou et al. [38]. In this study, the Raman spectra of the spin-crossover complex [Fe(phen)2(NCS)2] (1), where phen = 1,10-phenathroline, were recorded with a 785 nm laser for three intermediate temperatures representative of the HS, an intermediate and LS states, while the contribution of intramolecular vibrations to the entropy change (ΔS), being associated with the spin-crossover phenomenon was also elaborated. In this context, selected peaks were used for the calculation of the frequency ratio in the two states ωLS/ωHS, which were subsequently associated with using the appropriate equations with the entropy of the system. This study was an important task since it demonstrated the utility of Raman spectroscopy as a unique alternative, with minimum sample preparation, for providing spectral information that can be used to clarify the vibrational contribution to the entropy change related to the spin-crossover phenomenon. The entropy difference between the two HS and LS isomers constitutes the driving force for the SCO phenomenon, associated with a downshift of vibrational frequencies upon spin-crossover. After this study, the same research group for the same complex (1) highlighted that a model of an idealized octahedron could explain the entropy difference qualitatively, while for analysis beyond this ideal model, it is necessary to use several complementary vibrational spectroscopies (i.e., IR, Raman, and nuclear inelastic scattering) combined with quantum mechanical calculations [51]. Approximately 20 years after the first study, the same SCO complex was further investigated [69]. In this second study, Collet et al. examined the crystal phonon modes of [Fe(phen)2(NCS)2] (1) by combining THz, IR, and Raman spectroscopies for sensitive modes in different frequency ranges (mostly breathing modes in the low-frequency region and the characteristic C≡N modes at the high-frequency region) and symmetries.
The experimental findings were also correlated with DFT calculations performed in a periodic 3D crystal in order to understand the phonon modes in the crystal. As it has been revealed, by taking into account molecular packing and symmetry a complete phonon mode description is feasible, in comparison with the simplified view of a single-molecule perspective.
The use of time-resolved vibrational spectroscopy as an alternative to conventional spectrophotometric probing of the spin-crossover relaxation process has been introduced by Garvey et al. [70,71]. Pulsed laser photoperturbation, coupled with time-resolved resonance Raman spectroscopy, has been used for the first time to investigate the relaxation dynamics in solution on nanosecond and picosecond time scales of LS (1A) HS (5T) electronic spin-state crossover in the spin-crossover systems [Fe(btpa)](PF6)2 (btpa = N,N,N′,N′-tetrakis(2-pyridylmethyl)-6,6′-bis(aminomethyl)-2,2′-bipyridine) and [Fe(b(bdpa))](PF6)2 ((b(bdpa)=N,N′-bis(benzyl)-N,N′-bis(2-pyridylmethyl)-6,6′-bis(aminomethyl)-2,2′-bipyridine) complexes. An insight has been also provided by McCusker et al. in a JACS communication reporting a femtosecond time-resolved Raman spectroscopic study of the photoinduced SCO mononuclear complexes containing the cations [Fe(tren(6-R-py)3)]2+ (R = H (2), CH3 (3), illustrated in Figure 3a) [72]. In this study, the HS and LS Raman spectra along with the femtosecond stimulated Raman spectra were provided (Figure 3b), which in a fundamental research point of view indicated that a ΔS conversion was able to be quantified, while providing also a perspective of spin-crossover systems on optical devices by the photoinduced interconversion occurring between the LS and HS states.
In analogous frame in the vision to understand the “Raman behaviour” of SCO systems, Raman spectra and nuclear inelastic scattering have been combined to investigate the lattice dynamics of the SCO complex [Fe(H2B(pz)2)2(phen)] (complex 4, Figure 4a) [73]. During the 1970s, the 54Fe–57Fe isotopic substitution was introduced for the well-known [Fe(phen)2(NCS)2] (1) SCO complex in order to propose an accurate peak assignment of the low-frequency vibrational modes [74,75]. Therefore, in this study, single metal isotope substitution effects were used to identify metal–ligand stretching modes in the HS/LS states and calculate the potential differences of lattice dynamical parameters upon SCO transition (Figure 4b).
Apart from the solely spectroscopic investigation of SCO complexes, Raman spectroscopy has been penetrated in general investigation studies of SCO systems. More specifically, currently, there is an intense research focus related to the control of the SCO behavior of systems. In this context, several efforts focus on tuning the SCO transition through structural or size dependence for numerous systems. In the following part, the studies in which Raman is involved will be discussed. Very recently, structurally dependent hysteric behavior was noticed in a set of iron(II)-2,6-bis(1H-pyrazol-1-yl)pyridine) complexes [76]. The Raman spectra of these complexes have been recorded at the HS (350 K) and LS (200 K) states, exhibiting several changes. It is also important to note that, in general, recording the Raman spectra in the ultra-low-frequency region is a challenging task due to practical issues related to Raman instrumentation. This study is among the few studies in which ultra-low-frequency modes below 150 cm−1 were detected; low-frequency modes are of particular interest due to the metal–ligand bond elongation upon LSHS switching, also previously indicated by Lada et al. [24].
In addition, the change in Fe(II)−nitrogen bond distances is known to affect the force constant (f) of the ν(FeII−N) vibrations, which can be further extended to an impact on the bending vibrations involving the FeII atom. This trend has been observed for example in the investigation of [Fe{N(CN)2}2(abpt)2], which exhibit a small Fe-N bond variation during the transition (<0.1 Å). The two normal modes of vibrations being characteristic of the LS {FeIIN6} coordination sphere associated mainly with the bending vibration of the NFeN group involving the axial coordination FeII–N dicyanamido bonds (at 168 cm−1) and a stretching vibration of the equatorial Fe–N bonds (at 463 cm−1), are affected during the transition [24]. The distorted high-spin and low-spin structure and the related structural insights contributed on the structurally dependent hysteretic spin-state switching that was observed. In the same vision of structurally induced tailoring of SCO behavior, Brooker and coworkers synthesized two new triazole ligands featuring long “tails” [40]. The two new “tailed” iron(II) complexes with the general formula [FeII(Rdpt)2(SCN)2], where Rdpt = N-4H-1,2,4-triazole-3,5-di(2-pyridyl)palmitamide for complex 5 and hpdpt (4-(4-heptadecafluoroctylphenyl)-3,5-bis(2-pyridyl)-4H-1,2,4-triazole for complex 6, exhibit complete and reproducible SCO transitions, with T1/2 values differing significantly, being 182 K and 248 K, respectively. As far as from the spectroscopic viewpoint, it is interesting that by monitoring the temperature-dependent Raman differences of the C≡N stretching of the thiocyanate ligand, a significant shift of the Raman peak is noticed (the related peaks are located at 2093/2134 cm−1 for complex 5, and 2062/2120 cm−1 for example 6), accompanied by a variation on the peak intensity, which is subsequently reflected on the difference of the Raman calculated T1/2 values. It is also noteworthy that by comparing the T1/2 values calculated by the conventional magnetic measurements with the corresponding values deriving from Raman analysis, those are very close (i.e., 182 and 190 K for complex 5, and 248 and 243 K for complex 6, respectively).
On the other hand, one of the most critical parameters for modulating the SCO behavior strongly depends on the efficient coupling expressed through covalent and/or supramolecular interactions. In this context, there is an enormous number of studies related to different synthetic approaches, both in mononuclear coordination complexes and coordination polymers [28,31,32,33,34,77,78,79,80]. The first example of a 1D Fe(II) 1,2,4-triazole chain compound displaying a two-step hysteretic transition was prepared 7 years ago [81]. Practically speaking, this was an important finding since the 1D complex [Fe(βAlatrz)3](BF4)2⋅2 H2O (complex 7) could be exploited as a sensor to detect two temperature thresholds using the same material (βAlatrz is 4H-1,2-4-triazol-4-yl-propionate). Temperature-dependent Raman study on this system revealed differences in Fe-N vibrations at the low-frequency region and of the βAlatrz organic ligand, which are indirectly affected by the SCO transition. The results were successfully associated with DFT calculations.
Another mononuclear Fe(II) complex that has been revealed to exhibit SCO phenomenon was [FeII(DAPP)(abpt)](ClO4)2 (complex 8, Figure 5A), where DAPP = bis(3-aminopropyl)(2-pyridylmethyl)amine and abpt = 4-amino-3,5-bis(pyridin-2-yl)-1,2,4-triazole, and the order-disorder phase transition presented by the ligand was determined among others through Raman [41]. Raman spectroscopy combined with normal vibrational mode calculation was used to elucidate the spin-crossover mechanism. The enthalpy and entropy of the transition were determined, while weak cooperativity (n = 14) was noticed despite the typical abrupt type of the SCO transition (Figure 5B). This was the first example of a spin-crossover system with the order-disorder transition involving the ligand directly coordinated to the iron(II) site. An important aspect of this study is that the authors determined the number of molecules n in a domain from the height of the ΔCp peak according to Sorai and Seki method [61]. However, the shortcoming of this domain model is the fact that it assumes a uniform size of the domain and the equilibrium distribution, and it does not refer to any interactions that inhibit the growth of the domain. When first-order phase transitions are accompanied by heterogeneous phase transformation related to domain growth mechanism, a variety of theoretical models with different degrees of complexity, such as the Slichter and Drickamer (SD) model, Everett theorems, the Preisach model, the first-order reversal curve (FORC) method, the kinetic Ising model and others have been proposed to describe the behavior of such systems [55,80]. However, models such as SD use very simple expressions, and the data obtained from the fit of experimental values are unable to predict the complexity of the cooperativity in SCO systems. To that end, Vela and Paulsen [33] developed an optimized protocol being able to capture the degree of cooperativity displayed by two solvatomorphs exhibiting a gradual and an abrupt two-step transition, respectively. The periodic dispersion corrected DFT model of Vela and Paulsen may be an appropriate DFT method for calculating the lattice Raman modes.
In addition to the investigation of temperature and pressure-induced SCO behavior, Raman spectroscopy has also been utilized for the investigation of light-induced (LIEST) spin-crossover systems [82,83]. Schmidt et al. have reported the synthesis of five new Fe(II) mononuclear complexes (Figure 6a). Evidence of the LIEST behavior was obtained by means of resonance Raman spectroscopy. More specifically, 514 nm was used as excitation light (the light wavelength was selected in order to ensure the existence of resonance Raman) in the temperature range of 40 K to 300 K. When the sample is excited by a 514 nm laser at 40 K (dark), the ν(C≡N) stretching vibration acting as marker peak, is located at ~2070 cm−1, which is associated with the light-induced metastable high-spin state; however not all molecules are excited to the high-spin state, since it is noticed that the low-spin vibrational mode at 2100 cm−1 is present albeit with low intensity. When the temperature is increased, the HS vibration band disappears, and the LS band becomes dominant. The latter is attributed to the faster relaxation at higher temperatures (Figure 6, right). Further increase in temperature (110 to 250 K) eliminates the light-induced transition, while a gradual increase in the HS state and a subsequent decrease in LS state is further noticed above 260 K.
Apart from Fe(II), which is the most well-studied metal ion in SCO systems, important research has also been performed on other systems, such as Fe(III) complexes [84]. FeIII complexes typically possess a {N4O2} coordination sphere to undergo spin-crossover and have the advantage over FeII complexes of being air stable. Indicatively, [Fe(qsal)2]NCSe, where qsal = quinolylsalicylaldiminate, is an example of Fe(III) exhibiting an abrupt spin-crossover transition with an impressive hysteresis of 70 K [85]. It is noteworthy that the first example of concerted SCO and symmetry breaking in a d5 ion was recorded for an FeIII complex [86]. In addition to that, the light-induced excited spin-state trapping (LIESST) dynamics of an FeIII spin-crossover material from low (S = 1/2) to high (S = 5/2) spin states have been also investigated [87]. The results of this study revealed similar dynamical features to those already reported for LIESST in FeII systems. The activation of coherent molecular vibrations is essential for rapidly reaching the HS potential on the timescale of molecular motions; however, a traping in the HS state occurs due to their fast damping. Raman spectroscopy at thermal equilibrium combined with DFT analysis revealed that the observed coherent oscillations are attributed to photoinduced molecules in the HS states. In contrast to Fe(II), there are few examples of Mn(III) SCO complexes, which could be particularly interesting considering that SCO could be gradually affected by the intense Jahn–Teller (JT) effect in the HS state. Variable-temperature Raman spectroscopy was used to characterize the vibrational features of the complex [MnL1](PF6) (complex 9, Figure 7A) in the HS and LS regimes, in particular in the hysteretic region [88]; L1 is presented in the coordinated form in Figure 7A. Extensive changes based on the temperature-dependent Raman were noticed. Exclusive LS and HS characteristics bands were clearly identified, while the recording of spectra was both in cooling/warming modes within the hysteresis loop, revealing bistability at 134 K. In the same context, a very recent study of Mn(III) complexes is by the same research group, where the importance of packing and lattice strain for the modulation of the spin-state preference has been revealed [89]. More specifically, the different crystal lattice is clearly connected with the ability of the system to undergo SCO switching. In addition to that, the alkylation of the ligand resulted in an increase in the inter-cation distances and quenching of the SCO behavior. Therefore, among the 15 complexes synthesized and studied in this study, some of them exhibit a SCO behavior, while others remain in the HS state. The role of Raman spectroscopy was to characterize in depth the structural features of the HS complexes and performing a detail peak assignment for both the low and high-frequency spectral region (Figure 7B).
Apart from the inter/intramolecular interactions as an important factor affecting the SCO behavior, size dependence has also been established as a key-role player [90,91]. The first results referring to the synthesis of SCO nanoparticles were reported by Létard et al. In these studies, a thermal hysteresis loop of the compound [Fe(NH2trz)3]Br2 (NH2trz = 4-amino-1,2,4-triazole) for an approximate particle size 70 nm was noticed. In another recent study the size dependence of the coordination polymer [Fe(Htrz)2(trz)](BF4) (10) has been investigated through magnetic susceptibility measurements [92]; the SCO features of the well-crystalline (crystal) sample (T1/2↑ = 338 K, T1/2↓ = 360 K and ΔT1/2 = 22 K) were different from those of the least-crystalline (powder) sample (T1/2↑ = 384 K, T1/2↓ = 351 K and ΔT1/2 = 33 K). Raman spectroscopy was used to detect the differentiation between the two different states (HS ad LS); however, it was not used to detect any differences due to the size effect.

4.2. 3d/3d’ Metal Organic Frameworks (MOFs)

Spin-crossover sites incorporated into metal organic frameworks (MOFs) have emerged as an interesting class of SCO complexes exhibiting a drastic spin transition due to the cooperativity between the SCO phenomenon and lattice elasticity, which is accompanied by a first-order structural transformation, change of volume and large hysteresis curve. These features, combined with the indigenous large volume/surface area of MOFs, have introduced promising spin-switching systems with high-density integration of functional modules, especially as sensors triggered by external perturbations such as temperature, pressure, light, or guest molecules [79,93].
In spite of the fact that more and more recent research focuses on the investigation of MOFs-SCO systems, there is a limited number of publications in which Raman analysis is involved. However, among these relatively few studies an intense effort is devoted in order to understand the structural behavior of these systems as expressed through Raman spectroscopy.
Approximately 20 years ago, the research group of Bousseksou investigated in detail in a “Raman point of view” a group of cyano-bridged, Hofmann-like, coordination polymer compounds; a representative representation of a cyano-bridged, Hofmann-like MOF is presented in Figure 8a. The main goal of this research was to address the shortcomings of the mean-frequency approach toward the estimation of the various contributions to the vibrational entropy change, which is strongly associated with the SCO phenomenon (Figure 8b) [44]. The complexes under study have the general formula Fe(py)2[M(CN)4] (M = Pd (11a) or Pt (11b); py = pyridine) and Fe(pz)[M(CN)4]·2H2O (M = Ni (12a), Pd (12b), or Pt (12c); pz = pyrazine), since they display a variety of Fe-ligand and other low-frequency vibrational modes, a spin transition occurring near room temperature and remarkable cooperativity, which may be induced by the network structure and result in a large hysteresis loop. The fact that they have chosen high-symmetry complexes allowed them to perform accurate analysis and peak assignment in the low-frequency and high-frequency regions. This was the first study where a detailed assignment of the different ligands (pz, py, CN) was proposed, examining in parallel the impact of the metal ion linked with the CN group (i.e., Ni, Pd, Pt). This may be considered the first time that the significance of Raman for the investigation of SCO systems has been clearly established. As the authors mentioned, “This study serves also to highlight the inherent advantage of modern Raman spectroscopy (involving no sample grinding) over IR spectroscopy for the study of spin-crossover phenomena and suggests that future spin-crossover research should focus more on this technique.”
In a further expansion of their research, the next research topic related to the Raman investigation of this class of compounds was dedicated to the isotope effect on the spin transition [94]. The isotope effect on the thermal spin-crossover behavior of the SCO compound Fe(py)2[Ni(CN)4] (11c) and its isotope-substituted analogs Fe(pyridine-D5)2[Ni(CN)4] and Fe(pyridine-15N)2[Ni(CN)4] has been examined using magnetic susceptibility measurements, Raman spectroscopy, 57Fe Mössbauer spectroscopy, and differential scanning calorimetry (DSC), all confirmed that upon isotope substitution the spin-transition temperature shifted downward, contrary to previous observations. This was attributed by the authors (based on theoretical analysis of the spectroscopic data) to a subtle balance between different vibrational and electronic factors.

5. In Situ Temperature-Dependent Raman Measurements for Recording the SCO Curve and Calculation of the HS Population

It is self-evident that HS and LS states have different physical properties, for example, optical, magnetic, and structural properties allowing subsequently their characterization by different methods. However, even though Raman vibrational data have been frequently used for the detection of HS and LS states or in addition to assess the vibrational contribution to the entropy change related to the SCO phenomenon, there are limited efforts describing the detailed quantification of HS/LS population as a function of an external stimulus. In situ dynamic measurements can be performed and Raman scattered light can be collected upon a different external stimulus such as pressure, [35,38] temperature, [32,39,40,41] light irradiation, [38] and magnetic induction, revealing at the same time the HS/LS population ratio and the probed microstructure of each sample.
The in situ measurements combing Raman with optical microscopy revealed an important contribution to the investigation of SCO systems [59]. A significant outcome of the research of Bousseksou’s team a decade ago was that nucleation and growth of domains displaying different molecular spin states were directly extracted from Raman spectroscopic images in the Fe(II) mononuclear complex [Fe(bapbpy)(NCS)2] (complex 13, Figure 9a), where bapbpy = N-(6-(6-(pyridin-2-ylamino)pyridin-2-yl)pyridin-2-yl)pyridin-2-amine [59]. The Raman spectral imaging of the single crystals provided clear spectroscopic evidence of the spin state of molecules. From this study, the Raman intensity ratio of the characteristic band of the CN group at ~2000 cm−1 was plotted as a function of temperature, imprinting thus the SCO transition curve based on the Raman intensity ratio, which clearly reflected the two-step spin transition (Figure 9b,c). An analogous investigation from the same research groups has also been implemented for single crystals of very similar complexes, and Raman microspectrometry measurements of single crystals of the samples revealed the two-step SCO transition [95].
But which is the main way to quantify the HS population as a function of temperature through the analysis of Raman data? In 2019, Lada et al. reported for the first time the use of Raman spectroscopy for the calculation of the HS population of temperature-induced SCO transition [24]. In this context, in an attempt to obtain quantitative measurements based on Raman spectra analysis, they have calculated the value of the intensity ratio, which is proportional to the HS/LS population. For the needs of the study, they have used the integrated intensity values of a characteristic HS (or LS) band and of an “SCO inactive” peak. In order to compensate for the Raman cross-section difference for the peaks used or the calculation, they introduced the proportionality constant k (Equation (1)).
L S = I L S   I L S + k   I S C O   i n a c t i v e  
In particular, for the calculation of the k constant, the integrated intensity of the two peaks at the temperature of the LS formation and the analogous intensity at the T1/2, where the LS/HS population ratio is equal to 0.5 (as indicated by the magnetic susceptibility measurements) were taken into account. Therefore, at the several temperatures that the Raman spectrum of the sample is recorded, the integrated intensity of two characteristic HS and LS peaks are determined, and taking into account the calculated k constant, the LS population derives from Equation (1). Afterwards, the overall HS population is calculated by HS R = 1 LS R and could be plotted as a function of temperature (Figure 10c).
In this research work, they have also synthesized a known iron(II) complex (complex 14, Figure 10a) with different nanosized particles. For the complex [Fe{N(CN)2}2(abpt)2], where abpt is 4-amino-3,5-bis(pyridin-2-yl)-1,2,4-triazole. The difference in the HS population as a function of temperature for the three different sizes of nanoparticles was reflected in the Raman data monitored through variable-temperature studies (300–80 K) mainly based on low-frequency ν(Fe–N) and δ(NFeN) modes (Figure 10b) and the typical spin-sensitive mode at ~2000 cm−1 (ν(C≡N)) of the axial dicyanamido groups. It is also important to note that the new peaks that appear in the low-temperature Raman spectra are in suitable agreement with the relevant data of the calculated spectrum of the LS state of the complex. The influence of the nanoparticle size on the SCO properties indicated a shift to higher T1/2 as the particle size decreased. By downsizing from 300 to 20 nm, a difference in T1/2 as high as ∼30 K was noticed (Figure 10c).
It is important to note at this point, firstly, that it is self-evident that the k constant is unique for each SCO sample, and secondly, that the methodology followed each time may require additional data analysis steps. In this context, when attempting quantitative evaluation of chemical species population through temperature-dependent Raman spectra, if the evaluation of the chemical species population involves both low- and high-frequency bands, the introduction of the reduced representation method is generally required [96]. The reduction procedure takes into account the fact that the relative intensities of the vibrational lines in a Raman spectrum depend—among other factors—on the population of the vibrational energy levels involved in the scattering process.
Since phonons obey the Boson-type statistics, their mean number at a particular temperature, T, and relative wavenumber, ν, is given by:
n ν , Τ = exp ν / k B T 1 1
where ħ and kB are the Planck and Boltzmann constants, respectively. The Stokes-side reduced Raman intensity, Ired, is related to the experimentally measured, Iexp, through the following equation:
I r e d ν = ν ο ν 4 ν n ν , Τ + 1 1 Ι e x p ν
Equation (3) indicates that if the population ratio is to be extracted through the corresponding peak intensity ratio, the reduced representation is a crucial factor that has to be taken into account in order to cast out the thermal factor in the measured peak intensities. Even though this is a general remark, the reduced representation of the Raman intensities may be tacitly ignored for the specific case of intensity ratios involving peaks positioned in roughly the same frequency [24]. On the other hand, if the intensity ratio involves peaks separated by several wavenumbers (especially if one of them is in the low-wavenumber region that is mostly affected), the reduced representation factor should be essentially introduced in the related calculations [25].
The analogous methodology was also extended for the calculation of the HS population through temperature-dependent Raman in the SCO transition of MOFs. More specifically, a detailed spectroscopic analysis of the [Fe(2-mpz)2Ni(CN)4] 2D Hofmann-type polymer (15) nanoparticles was performed via temperature-dependent Raman spectroscopy (Figure 11) [25]; 2-mpz is the ligand 2-methylpyrazine. The importance of Raman spectroscopy for the investigation of SCO materials was demonstrated since both structural characterization and detailed study of the transition were achieved. In the ultra-low-frequency region below ~100 cm−1, Raman peaks attributed mostly to external modes were detected, while the vibrational modes in the 100–600 cm−1 region were assigned to coupled vibrations due to Fe-ligand and metal–ligand modes [ν(Fe-N) and ν(M-C), δ(MCN)]. The vibrations attributed to the HS state of the Fe-ligand bonds were observed at lower frequencies than the corresponding ones of the LS state as anticipated; the Fe-N bond is stronger (shorter) in the LS formation possessing thus higher energy. Remarkable intensity alterations were noticed in vibrations related to the ligands; a noticeable upshift of the in-plane bending of the pyrazine ring was noticed from the HS to the LS state (i.e., from 653 to 665 cm−1 for the HS and LS species, respectively), while the intensity of the characteristic vibrations of the 2-methylpyrazine (2-mpz) ligand at 1024, 1159 and 1304 cm−1 increased in favor of the LS population. An upshift was also recorded for the stretching vibrations associated with the CN terminal ligand (ν(CN)A1g and ν(CN)B1g) located at 2171 and 2154 cm−1 for the HS and LS state, respectively. Among the properties of interest concerning the SCO behavior, it is remarkable that the hysteresis (shift of the transition temperature in a cooling and heating mode) indicated by the magnetic measurements could also be recorded by Raman spectroscopy; even the small step of the SCO transition detected by magnetic measurements was also noticed through Raman measurements. On the other hand, a proposed structure for the coordination polymer [FeII(2-mpz)2Ni(CN)4] (15) based on Raman analysis has been provided; the Raman peaks and the sum of entropy increase for four normal modes are analogous to the 2D network py system leading to the proposal of a 2D network for the 2-mpz analog.
Last year Attwood et al., who reported an exceptionally high-temperature SCO transition in an iron(II) complex with an amide-functionalized organic ligand (Figure 12a), exploited Raman spectroscopy to calculate the HS population, designing the subsequent SCO curve [97]. The complex is [Fe(bppCONH2)2](BF4)2 (16), where bppCONH2 is 2,6-bis(pyrazol-1-yl)pyridine-4-carboxamide. As they mentioned, they had initially attempted to perform variable-temperature powder XRD measurements; however, since the material eventually carbonizes over extended periods, they have chosen temperature-dependent Raman spectroscopy under a nitrogen atmosphere instead. An additional asset of Raman was the possibility to visualize the thermochromism that accompanies the SCO process. The HS state fraction (γHS) calculated by Raman data as a function of temperature (Figure 12b) was consistent with the DSC data, showing the initiation of the SCO process at 400 K and an approximate T1/2 of 475 K. Notwithstanding, Raman also indicated the existence of hysteresis between heating and cooling modes, in accordance with the DSC data.
Finally, a relevant effort in which the SCO phenomenon was induced through variation in pressure instead of temperature has been published [42]. 3 years after their initial publication on the Raman spectroscopic study for the estimation of vibrational contributions to the entropy change associated with the temperature-induced spin transition, the authors investigated the pressure-induced effects on the Fe(pz)[M(CN)4].2H2O systems (12), recording the first observation of a piezo-hysteresis loop at room temperature [42]. By obtaining solid-state Raman spectra at room temperature as a function of pressure, they noticed a reproducible piezo-hysteresis loop; spin transition at pressures P1/2↑ = 1350 bar and P1/2↓ = 650 bar for the Ni analog, and P1/2↑ = 1800 bar and P1/2↓ = 3500 bar for the Pd and Pt complexes (Figure 13).

6. Toward the Practical Application of SCO Complexes: Selected Studies in Which Raman Is Involved, Current Trends, Challenges, and Future Perspectives

The exploitation of the SCO phenomenon has been long considered. A respectable number of practical applications of spin-crossover materials have been demonstrated, which include sensors (i.e., temperature, pressure, or gas sensors), display and memory devices, MRI contrast agents, and electrical and electroluminescent devices. To that end, several novelties have been considered in order to improve the features of the SCO materials toward their convenient and easy implementation, such as controlled downsizing, incorporation into polymers, development of switchable liquid crystals, nanoparticles, and thin films of spin-crossover materials (Table 2). Depending on the preferable application, different SCO features are required. For instance, aiming at memory applications, complexes that exhibit abrupt transitions and thermal hysteresis at room temperature are needed (Table 2). On the other hand, there is a great number of materials displaying a smooth spin conversion curve without hysteresis, which could be useful for a pressure-sensing application. In addition, there are applications in which an irreversible transition is preferable, such as in temperature sensors or ergonomic applications. It is self-evident that the applications of SCO complexes depend mainly on the SCO properties (i.e., abrupt/gradual transition, T1/2 value, hysteresis). Thus, there have been several research efforts focusing on the tuning of the SCO properties (Table 2, [40,98,99]). In general, the SCO behavior is quite delicate and is significantly affected by the inherent properties of the complex, the size and shape of the material’s particles, and the inter/intramolecular interactions; the latter two characteristics are known as the cooperativity effect. Growing well-defined nanosized SCO materials with robust and reproducible SCO characteristics is an important challenge. Different synthetic parameters (e.g., synthetic approach, mixing rates, reactants concentration, etc.) are examined using the same synthetic method, and in the best-case scenario, a narrow range of particle size distribution can be obtained. However, with an attempt to tune the particle size, changes not only in size but also in its morphology, crystallinity, and composition may occur. Additional factors, such as defects, solvent lattice molecules, nonequilibrium phases, matrix effects, etc., may also interfere. Recently, more and more research efforts have been focused on the controlled synthesis of SCO nanomaterials, some of which require Raman characterization. Among them, there are research efforts in which Raman spectroscopy is involved in the context elaborated in the previous sections. As it is mentioned above in Section 5, Lada et al. reported the in situ Raman investigation of the SCO behavior and the calculation of the HS population as a function of temperature for complex [Fe{N(CN)2}2(abpt)2] (14) at different sizes of nanoparticles; a difference in the T1/2 value was recorded for different NPs size. A total of 2 years later, the same group reported the facile one-pot wet-chemistry synthesis of nanowires of the complex [Fe(abpt)2(NCS)2] (17) [96]. The SCO curve of the nanowires, as derived from Raman data, was significantly different compared to the corresponding microcrystals, exhibiting a rather gradual transition. This was mainly attributed to the existence of intra/intermolecular interactions existing in the molecule and lattice, which promote cooperativity effects. The importance of these interactions in SCO features has also been demonstrated for Hofmann-type MOFs [100]. On the other hand, among the most usual practices used for the controlled synthesis of SCO NPs is based on microemulsions using different surfactants and polymeric stabilizers. Among these studies, a significant difference in the SCO transition was noticed for the cyanide-bridged 3D [Fe(pz)Pt(CN)4]·2H2O (12c) complex, which has been prepared at three different sizes using a microemulsion method [101]. Upon a reduction in the size, the transition is more gradual, the transition temperature shifts downward (i.e., 240 K for the 7 nm particles instead of ~300 K for the bulk material), and the hysteresis loop almost vanishes for the smaller particles. Apart from the size and cooperativity effect, in order a SCO molecule to be beneficial as a switch, the self-assembly of amphiphilic complexes into larger, organized structures at an air–water interface and their immobilization onto solid support has been considered [40]. The modification of the nature of the organic ligand’s “tail” (i.e., complexes 5 and 6) allowed to tune the SCO transition temperature by over 100 K, as monitored by Raman spectroscopy. Another strategy to control the SCO properties is based on the development of thin films, which have been more intensely investigated for Hofmann-type MOFs. Taking into account that, in several cases, the downsizing may cause an incomplete and gradual transition, studies on Hofmann-type MOF thin films have indicated that the surface microstructure plays an important role in spin-state control [102,103]. For instance, thin films of [Fe(pz)Pt(CN)4] nanocrystalline particles (NPs) deposited on monocrystalline Si by laser-mediated evaporation of a cryogenically frozen suspension of the NPs have been very recently reported. Wanting to explain the role of laser deposition in relation to the cooperative character of the spin transition of [Fe(pz)Pt(CN)4] in order to understand and improve the thin film fabrication of this MOF material, they have used magnetic measrements and temperature-dependent Raman [103]. In the same context, Sakadida et al., using solely variable-temperature Raman spectroscopy, have investigated changes in the temperature-driven spin-transition property of [Fe(pz)Pt(CN)4] induced by a size reduction from a bulk polycrystalline powder to an ultrathin film (crystallite size, 15 nm) [31].
In addition, in the context of practical application, the incorporation of the materials into polymers may be inevitable. Depending on the incorporation process followed, the polymer matrix and the SCO materials, the SCO properties may or may not be affected [28]. Notwithstanding that in a recent effort toward the exploitation of SCO complexes as temperature markers in food safety, a significant impact was noticed in the transition of the SCO process after the incorporation [98]. As it was noticed through Raman measurements, an upshift of the transition and a hysteretic behavior were recorded, while no hysteretic behavior of the SCO pristine materials was detected. This study indicated that the strategy of developing specific interactions (i.e., H bonding, π-π stacking) between the SCO complex and the polymer seems to be an effective approach for the tuning of SCO behavior.
Having arrived at a relatively reasonable understanding of the control of the spin-transition processes and with the recognition that spin-crossover compounds may be exploited as switching and display devices, recent activities have been devoted to the design of new multifunctional materials in which SCO properties may be combined with other physical or chemical properties, e.g., magnetic exchange, host–guest chemistry, electrical conductivity, crystalline properties, non-linear optics, etc. [104]. For instance, the research group of Clérac described the preparation of physical gels exhibiting both magnetic and optical properties originating from SCO precursors. This system illustrated a method of processing SCO solids for their use in photofunctional and biocompatible organogels [105]. On the other hand, the same researchers have also introduced the potential of inducing thermally and photoreversible magnetic and optical properties by developing a coordination network in which a single-molecule magnet is linked with spin-crossover units [106]. In an analogous frame, the development of a two-component bifunctional system comprising of an SCO active entity being able to exist in two different spin states and at the same time with an emission signaling unit that can be affected upon SCO switching could be exploited as an SCO-based magneto-optical switch [107,108]. In these studies that promote the multifunctionality of materials that exhibit the SCO property, Raman has not been implemented; however, they are discussed here as representative examples of the multifunctional SCO materials. This does not exclude the fact that Raman could also be beneficial for the study of such multifunctional systems [109]. For instance, the research team of Molen revealed through temperature-dependent studies, combining Raman spectroscopy, magnetometry, and electrical transport measurement, that the functionality of the room-temperature spin-crossover molecules [Fe(AcS-BPP)2](ClO4)2, where AcS-BPP = (S)-(4-{[2,6-(dipyrazol-1-yl)pyrid-4-yl]ethynyl}phenyl)ethanethioate is preserved when they are assembled into an interfacial device structure comprising from gold nanoparticle arrays [110]. In another attempt, the integration of SCO nanoparticles with silver nanowires has been performed through an in situ growth approach toward the development of magnetic and conductive bifunctional materials [111]. The resulting composite bears a controllable size and morphology, which can be manipulated by the amount of iron(II) salt. In addition, the nanocomposite was transferred to a PET substrate to test the conductive properties, illustrating the successful preparation of nano-conductive composite films onto flexible substrates, and promoting the potential applicability of SCO conductive materials for magnetic and electronic devices.
Table 2. Representative applications and relevant research of SCO materials and the contribution (or not) of Raman in these studies.
Application Main FeaturesRamanRefs.
Memory Devices Hybrid thin films composed of spin-crossover NPs and CNTs for electrical memory devicesNO[112]
SensorsSpin-crossover MOFs as gas sensors; suitable reversibility, room-temperature operation, a low limit of detection and linear dynamic range of detection, selectivity YES[93]
Synergy between magnetic and color properties in spin-crossover material for usage as temperature sensor NO[113]
Spin-crossover material acting simultaneously as pressure and temperature sensor NO[104]
Incorporation of Spin-Crossover complexes into polymers for tuning of the SCO process and toward their applicability YES[28,98,99]
Size and morphology effect of SCO complexes on SCO behavior YES[24,96]
MRI Agents Water-soluble SCO iron(II) NPs with a polyethylene
glycol (PEG) coating exhibiting thermally responsive T1/2 values making them appropriate candidates for use as a MRI contrast agent
NO[114]
Silica hybrid, spin-crossover water-soluble nanoparticles as potential candidates for thermally responsive MRI agentsNO[115]
Multifunctional Materials Integration of SCO nanoparticles with silver nanowires toward the development of magnetic and conductive bifunctional materialsYES[111]
SCO-based magneto-optical switching materialsYES[109]
A coordination network comprising of spin-crossover and single-molecule magnet units inducing thermally and photoreversible magnetic and optical propertiesNO[106]
Physical gels exhibiting optical and magnetic properties originating from SCO precursors (photofunctional and biocompatible organogels)NO [105]
Despite the extensive exciting progress that has been accomplished in different directions, important challenges remain to be addressed. For instance, it will be crucial to enlarge the number of SCO molecules displaying robust, near room temperature switching properties. To that end, in order to tune the SCO behavior and develop high quality materials requires fundamental research on the understanding of the role of surface/interface properties for the desired functionality and at the same time rigorous applied materials studies for the evaluation of the technological aspects of the materials. After that, critical studies will be important in order to explore the capability of their integration, function, and reliability of these materials in “real world” requirements for commercial applications.
It is an undeniable fact that SCO event is an intriguing phenomenon, well documented, and attracting the intense interest of scientists all over the world for decades. The spectroscopic investigation of this phenomenon through Raman spectroscopy is an important part of the study of the SCO process. It offers a high sensitivity, non-bulk method for monitoring the SCO process and allows, in parallel, the in depth characterization of structure and molecular structure modifications, while can also facilitate the determination of physicochemical properties (calculation of ΔS of the system). The Raman analysis of different types of SCO materials and for different applications have been implemented, while the Raman-based analysis of SCO systems can be considered an emerging field with great potential.

Funding

This research received no external funding.

Conflicts of Interest

The author declares no conflict of interest.

References

  1. Orlando, A.; Franceschini, F.; Muscas, C.; Pidkova, S.; Bartoli, M.; Rovere, M.; Tagliaferro, A. A Comprehensive Review on Raman Spectroscopy Applications. Chemosensors 2021, 9, 262. [Google Scholar] [CrossRef]
  2. Raman, C.V. A new radiation. Proc. Indian Acad. Sci. Sect. A 1953, 37, 333–341. [Google Scholar] [CrossRef]
  3. Landsberg, G.S. Eine neue Erscheinung bei der Lichtzerstreuung in Krystallen. Naturwissenschaften 1928, 16, 557–558. [Google Scholar]
  4. Hendra, P.J.; Stratton, P.M. Laser-Raman spectroscopy. Chem. Rev. 1969, 69, 325–344. [Google Scholar] [CrossRef]
  5. Smith, E.; Dent, G. Introduction, Basic Theory and Principles. In Modern Raman Spectroscopy—A Practical Approach; John Wiley & Sons Ltd.: Chichester, UK, 2005; pp. 1–21. [Google Scholar]
  6. Thapliyal, V.; Alabdulkarim, M.E.; Whelan, D.R.; Mainali, B.; Maxwell, J.L. A concise review of the Raman spectra of carbon allotropes. Diam. Relat. Mater. 2022, 127, 109180. [Google Scholar] [CrossRef]
  7. Jones, R.R.; Hooper, D.C.; Zhang, L.; Wolverson, D.; Valev, V.K. Raman Techniques: Fundamentals and Frontiers. Nanoscale Res. Lett. 2019, 14, 231. [Google Scholar] [CrossRef]
  8. Farber, C.; Li, J.; Hager, E.; Chemelewski, R.; Mullet, J.; Rogachev, A.Y.; Kurouski, D. Complementarity of Raman and Infrared Spectroscopy for Structural Characterization of Plant Epicuticular Waxes. ACS Omega 2019, 4, 3700–3707. [Google Scholar] [CrossRef]
  9. Auer, B.M.; Skinner, J.L. IR and Raman spectra of liquid water: Theory and interpretation. J. Chem. Phys. 2008, 128, 224511. [Google Scholar] [CrossRef]
  10. Voyiatzis, G.A.; Kalampounias, A.G.; Papatheodorou, G.N. The structure of molten mixtures of iron (III) chloride with caesium chloride. Phys. Chem. Chem. Phys. 1999, 1, 4797–4803. [Google Scholar] [CrossRef]
  11. Stammreich, H.; Sans, T.T. Hg-Hg stretching frequencies and bond lengths in mercurous compounds. J. Mol. Struct. 1967, 1, 55–60. [Google Scholar] [CrossRef]
  12. Tsantis, S.T.; Lada, Z.G.; Tzimopoulos, D.I.; Bekiari, V.; Psycharis, V.; Raptopoulou, C.P.; Perlepes, S.P. Two different coordination modes of the Schiff base derived from ortho-vanillin and 2-(2-aminomethyl)pyridine in a mononuclear uranyl complex. Heliyon 2022, 8, e09705. [Google Scholar] [CrossRef]
  13. Routzomani, A.; Lada, Z.G.; Angelidou, V.; Raptopoulou, C.P.; Psycharis, V.; Konidaris, K.F.; Chasapis, C.T.; Perlepes, S.P. Confirming the Molecular Basis of the Solvent Extraction of Cadmium (II) Using 2-Pyridyl Oximes through a Synthetic Inorganic Chemistry Approach and a Proposal for More Efficient Extractants. Molecules 2022, 27, 1619. [Google Scholar] [CrossRef]
  14. North, J.M.; van de Burgt, L.J.; Dalal, N.S. A Raman study of the single molecule magnet Mn12-acetate and analogs. Solid State Commun. 2002, 123, 75–79. [Google Scholar] [CrossRef]
  15. Browne, W.R. Chapter 8—Resonance Raman spectroscopy and its application in bioinorganic chemistry. In Practical Approaches to Biological Inorganic Chemistry, 2nd ed.; Crichton, R.R., Louro, R.O., Eds.; Elsevier: Amsterdam, The Netherlands, 2020; pp. 275–324. [Google Scholar]
  16. Choo-Smith, L.P.; Edwards, H.G.M.; Endtz, H.P.; Kros, J.M.; Heule, F.; Barr, H.; Jr, J.S.R.; Bruining, H.A.; Puppels, G.J. Medical applications of Raman spectroscopy: From proof of principle to clinical implementation. Biopolymers 2002, 67, 1–9. [Google Scholar] [CrossRef]
  17. Baddiel, C.B.; Janz, G.J. Molten thiocyanates: Raman spectra and structure. Trans. Faraday Soc. 1964, 60, 2009–2012. [Google Scholar] [CrossRef]
  18. Tramer, A. Spectra and structure of thiocyanate complexes. In Theory and Structure of Complex Compounds; JeŻOwska-Trzebiatowska, B., Ed.; Pergamon Press, The Macmillan Company: New York, NY, USA, 1964; pp. 225–228. [Google Scholar]
  19. Kettle, S.F.A. Physical Inorganic Chemistry: A Coordination Chemistry Approach; Oxford University Press: Oxford, UK, 1998. [Google Scholar]
  20. Nakamoto, K. Infrared and Raman Spectra of Inorganic and Coordination Compounds Part A, Theory and Applications in Inorganic Chemistry; John Wiley & Sons: Hoboken, NJ, USA, 2009; p. 1. [Google Scholar]
  21. Drago, R.S. Physical Methods in Inorganic Chemistry; Reinhold Pub. Corp.: New York, NY, USA, 1965. [Google Scholar]
  22. Suffren, Y.; Rollet, F.-G.; Reber, C. Raman spectroscopy of transition metal complexes: Molecular vibrational frequencies, phase transitions, isomers, and electronic structure. Comments Inorg. Chem. 2011, 32, 246–276. [Google Scholar] [CrossRef]
  23. Hadjiivanov, K.I.; Panayotov, D.A.; Mihaylov, M.Y.; Ivanova, E.Z.; Chakarova, K.K.; Andonova, S.M.; Drenchev, N.L. Power of Infrared and Raman Spectroscopies to Characterize Metal-Organic Frameworks and Investigate Their Interaction with Guest Molecules. Chem. Rev. 2021, 121, 1286–1424. [Google Scholar] [CrossRef]
  24. Lada, Z.G.; Andrikopoulos, K.S.; Chrissanthopoulos, A.; Perlepes, S.P.; Voyiatzis, G.A. A Known Iron (II) Complex in Different Nanosized Particles: Variable-Temperature Raman Study of Its Spin-Crossover Behavior. Inorg. Chem. 2019, 58, 5183–5195. [Google Scholar] [CrossRef]
  25. Lada, Z.G.; Andrikopoulos, K.S.; Polyzou, C.D.; Tangoulis, V.; Voyiatzis, G.A. Monitoring the spin crossover phenomenon of [Fe(2-mpz)2Ni(CN)4] 2D Hofmann-type polymer nanoparticles via temperature-dependent Raman spectroscopy. J. Raman Spectrosc. 2020, 51, 2171–2181. [Google Scholar] [CrossRef]
  26. Gütlich, P.; Goodwin, H.A. Spin Crossover—An Overall Perspective. In Spin Crossover in Transition Metal Compounds I; Gütlich, P., Goodwin, H.A., Eds.; Springer: Berlin/Heidelberg, Germany, 2004; pp. 1–47. [Google Scholar]
  27. Brooker, S. Spin crossover with thermal hysteresis: Practicalities and lessons learnt. Chem. Soc. Rev. 2015, 44, 2880–2892. [Google Scholar] [CrossRef]
  28. Enriquez-Cabrera, A.; Rapakousiou, A.; Bello, M.P.; Molnár, G.; Salmon, L.; Bousseksou, A. Spin crossover polymer composites, polymers and related soft materials. Coord. Chem. Rev. 2020, 419, 213396. [Google Scholar] [CrossRef]
  29. Molnár, G.; Rat, S.; Salmon, L.; Nicolazzi, W.; Bousseksou, A. Spin Crossover Nanomaterials: From Fundamental Concepts to Devices. Adv. Mater. 2018, 30, 1703862. [Google Scholar] [CrossRef]
  30. Li, H.; Peng, H. Recent advances in self-assembly of spin crossover materials and their applications. Curr. Opin. Colloid Interface Sci. 2018, 35, 9–16. [Google Scholar] [CrossRef]
  31. Sakaida, S.; Otsubo, K.; Maesato, M.; Kitagawa, H. Crystal Size Effect on the Spin-Crossover Behavior of {Fe(py)2[Pt(CN)4]} (py = Pyridine) Monitored by Raman Spectroscopy. Inorg. Chem. 2020, 59, 16819–16823. [Google Scholar] [CrossRef]
  32. Reeves, M.G.; Tailleur, E.; Wood, P.A.; Marchivie, M.; Chastanet, G.; Guionneau, P.; Parsons, S. Mapping the cooperativity pathways in spin crossover complexes. Chem. Sci. 2021, 12, 1007–1015. [Google Scholar] [CrossRef]
  33. Vela, S.; Paulsen, H. Cooperativity in Spin Crossover Systems. An Atomistic Perspective on the Devil’s Staircase. Inorg. Chem. 2018, 57, 9478–9488. [Google Scholar] [CrossRef]
  34. Kipgen, L.; Bernien, M.; Ossinger, S.; Nickel, F.; Britton, A.J.; Arruda, L.M.; Naggert, H.; Luo, C.; Lotze, C.; Ryll, H.; et al. Evolution of cooperativity in the spin transition of an iron (II) complex on a graphite surface. Nat. Commun. 2018, 9, 2984. [Google Scholar] [CrossRef]
  35. Gütlich, P.; Goodwin, H.A. (Eds.) Spin Crossover in Transition Metal Compounds; Springer: Berlin/Heidelberg, Germany, 2004. [Google Scholar]
  36. Halcrow, M.A. (Ed.) Spin-Crossover Materials; John Wiley & Sons: Hoboken, NJ, USA, 2013. [Google Scholar]
  37. Gütlich, P.; Garcia, Y.; Goodwin, H.A. Spin crossover phenomena in Fe (II) complexes. Chem. Soc. Rev. 2000, 29, 419–427. [Google Scholar] [CrossRef]
  38. Bousseksou, A.; McGarvey, J.J.; Varret, F.; Real, J.A.; Tuchagues, J.-P.; Dennis, A.C.; Boillot, M.L. Raman spectroscopy of the high- and low-spin states of the spin crossover complex Fe(phen)2(NCS)2: An initial approach to estimation of vibrational contributions to the associated entropy change. Chem. Phys. Lett. 2000, 318, 409–416. [Google Scholar] [CrossRef]
  39. Batschelet, W.H.; Rose, N.J. Laser Raman spectroscopic studies of metal.alpha.-diimine complexes. 1. Imine stretching frequencies and bonding implications. Inorg. Chem. 1983, 22, 2078–2083. [Google Scholar] [CrossRef]
  40. Feltham, H.L.C.; Johnson, C.; Elliott, A.B.S.; Gordon, K.C.; Albrecht, M.; Brooker, S. “Tail” Tuning of Iron (II) Spin Crossover Temperature by 100 K. Inorg. Chem. 2015, 54, 2902–2909. [Google Scholar] [CrossRef] [PubMed]
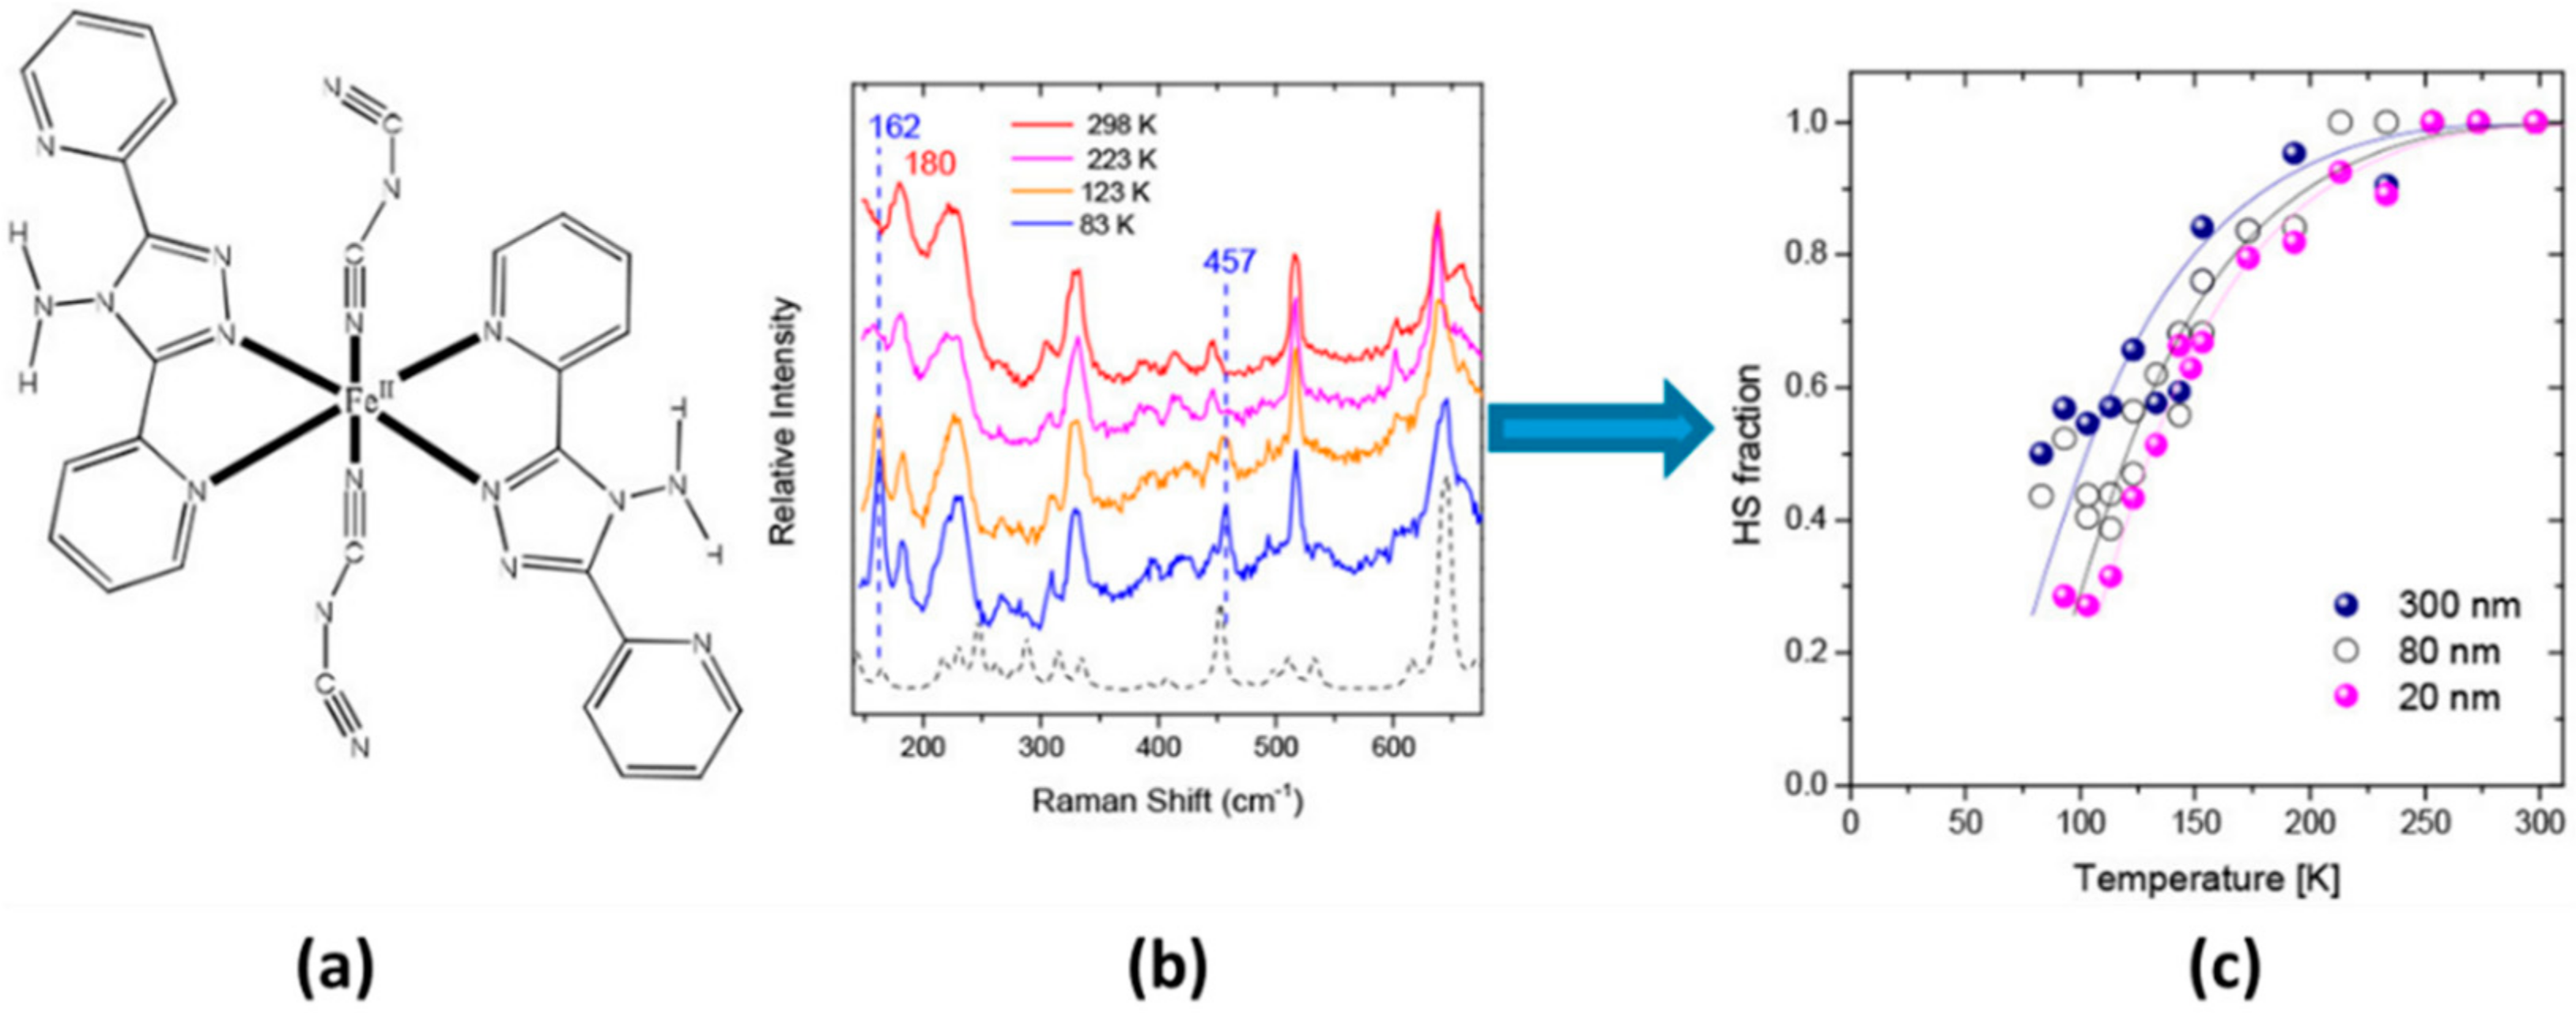
  41. Miyazaki, Y.; Nakamoto, T.; Ikeuchi, S.; Saito, K.; Inaba, A.; Sorai, M.; Tojo, T.; Atake, T.; Matouzenko, G.S.; Zein, S.; et al. Spin Crossover Phenomenon Accompanying Order−Disorder Phase Transition in the Ligand of [FeII(DAPP)(abpt)](ClO4)2 Compound (DAPP = Bis(3-aminopropyl)(2-pyridylmethyl)amine, abpt = 4-Amino-3,5-bis(pyridin-2-yl)-1,2,4-triazole) and Its Successive Self-Grinding Effect. J. Phys. Chem. B 2007, 111, 12508–12517. [Google Scholar] [PubMed]
  42. Molnár, G.; Niel, V.; Real, J.-A.; Dubrovinsky, L.; Bousseksou, A.; McGarvey, J.J. Raman Spectroscopic Study of Pressure Effects on the Spin-Crossover Coordination Polymers Fe(Pyrazine)[M(CN)4]·2H2O (M = Ni, Pd, Pt). First Observation of a Piezo-Hysteresis Loop at Room Temperature. J. Phys. Chem. B 2003, 107, 3149–3155. [Google Scholar] [CrossRef]
  43. Moussa, N.O.; Molnár, G.; Ducros, X.; Zwick, A.; Tayagaki, T.; Tanaka, K.; Bousseksou, A. Decoupling of the molecular spin-state and the crystallographic phase in the spin-crossover complex [Fe(ptz)6](BF4)2 studied by Raman spectroscopy. Chem. Phys. Lett. 2005, 402, 503–509. [Google Scholar] [CrossRef]
  44. Molnár, G.; Niel, V.; Gaspar, A.B.; Real, J.-A.; Zwick, A.; Bousseksou, A.; McGarvey, J.J. Vibrational Spectroscopy of Cyanide-Bridged, Iron(II) Spin-Crossover Coordination Polymers:  Estimation of Vibrational Contributions to the Entropy Change Associated with the Spin Transition. J. Phys. Chem. B 2002, 106, 9701–9707. [Google Scholar] [CrossRef]
  45. Craig, G.A.; Costa, J.S.; Roubeau, O.; Teat, S.J.; Shepherd, H.J.; Lopes, M.; Molnár, G.; Bousseksou, A.; Aromí, G. High-temperature photo-induced switching and pressure-induced transition in a cooperative molecular spin-crossover material. Dalton Trans. 2014, 43, 729–737. [Google Scholar] [CrossRef]
  46. McAllen Public Utility Water Plants. Available online: https://mcallenpublicutility.com/departments/water-systems/water-plants/ (accessed on 2 March 2022).
  47. Larionova, J.; Salmon, L.; Guari, Y.; Tokarev, A.; Molvinger, K.; Molnár, G.; Bousseksou, A. Towards the Ultimate Size Limit of the Memory Effect in Spin-Crossover Solids. Angew. Chem. Int. Ed. 2008, 47, 8236–8240. [Google Scholar] [CrossRef]
  48. Raza, Y.; Volatron, F.; Moldovan, S.; Ersen, O.; Huc, V.; Martini, C.; Brisset, F.; Gloter, A.; Stéphan, O.; Bousseksou, A.; et al. Matrix-dependent cooperativity in spin crossover Fe(pyrazine)Pt(CN)4 nanoparticles. Chem. Commun. 2011, 47, 11501–11503. [Google Scholar] [CrossRef]
  49. Tokarev, A.; Long, J.; Guari, Y.; Larionova, J.; Quignard, F.; Agulhon, P.; Robitzer, M.; Molnár, G.; Salmon, L.; Bousseksou, A. Spin crossover polysaccharide nanocomposites. New J. Chem. 2013, 37, 3420–3432. [Google Scholar] [CrossRef]
  50. Available online: https://ec.europa.eu/environment/soil/soil_policy_en.htm (accessed on 11 June 2020).
  51. Ronayne, K.L.; Paulsen, H.; Höfer, A.; Dennis, A.C.; Wolny, J.A.; Chumakov, A.I.; Schünemann, V.; Winkler, H.; Spiering, H.; Bousseksou, A.; et al. Vibrational spectrum of the spin crossover complex [Fe(phen)2(NCS)2] studied by IR and Raman spectroscopy, nuclear inelastic scattering and DFT calculations. Phys. Chem. Chem. Phys. 2006, 8, 4685–4693. [Google Scholar] [CrossRef]
  52. Wolny, J.A.; Diller, R.; Schünemann, V. Vibrational Spectroscopy of Mono- and Polynuclear Spin-Crossover Systems. Eur. J. Inorg. Chem. 2012, 2012, 2635–2648. [Google Scholar] [CrossRef]
  53. Tuchagues, J.-P.; Bousseksou, A.; Molnár, G.; McGarvey, J.J.; Varret, F. The Role of Molecular Vibrations in the Spin Crossover Phenomenon. In Spin Crossover in Transition Metal Compounds III; Gütlich, P., Goodwin, H.A., Eds.; Springer: Berlin/Heidelberg, Germany, 2004; pp. 84–103. [Google Scholar]
  54. Wolny, J.A.; Schünemann, V.; Németh, Z.; Vankó, G. Spectroscopic techniques to characterize the spin state: Vibrational, optical, Mössbauer, NMR, and X-ray spectroscopy. Comptes Rendus Chim. 2018, 21, 1152–1169. [Google Scholar] [CrossRef]
  55. Molnár, G.; Mikolasek, M.; Ridier, K.; Fahs, A.; Nicolazzi, W.; Bousseksou, A. Molecular Spin Crossover Materials: Review of the Lattice Dynamical Properties. Ann. Phys. 2019, 531, 1900076. [Google Scholar] [CrossRef]
  56. Enamullah, M.; Linert, W.; Gutmann, V. Vibrational spectroscopy on iron (II) spin-crossover complexes with 4-substituted 2,6-bis (benzimidazol-2′-yl) pyridine. Vib. Spectrosc. 1995, 9, 265–271. [Google Scholar] [CrossRef]
  57. Wolny, J.A.; Paulsen, H.; Trautwein, A.X.; Schünemann, V. Density functional theory calculations and vibrational spectroscopy on iron spin-crossover compounds. Coord. Chem. Rev. 2009, 253, 2423–2431. [Google Scholar] [CrossRef]
  58. Urakawa, A.; van Beek, W.; Monrabal-Capilla, M.; Galán-Mascarós, J.R.; Palin, L.; Milanesio, M. Combined, Modulation Enhanced X-ray Powder Diffraction and Raman Spectroscopic Study of Structural Transitions in the Spin Crossover Material [Fe(Htrz)2(trz)](BF4). J. Phys. Chem. C 2011, 115, 1323–1329. [Google Scholar] [CrossRef]
  59. Bedoui, S.; Molnár, G.; Bonnet, S.; Quintero, C.; Shepherd, H.J.; Nicolazzi, W.; Salmon, L.A. Bousseksou, Raman spectroscopic and optical imaging of high spin/low spin domains in a spin crossover complex. Chem. Phys. Lett. 2010, 499, 94–99. [Google Scholar] [CrossRef]
  60. Guillaume, F.; Tobon, Y.A.; Bonhommeau, S.; Létard, J.-F.; Moulet, L.; Freysz, E. Photoswitching of the spin crossover polymeric material [Fe(Htrz)2(trz)](BF4) under continuous laser irradiation in a Raman scattering experiment. Chem. Phys. Lett. 2014, 604, 105–109. [Google Scholar] [CrossRef]
  61. Sorai, M.; Seki, S. Phonon coupled cooperative low-spin 1A1high-spin 5T2 transition in [Fe(phen)2(NCS)2] and [Fe(phen)2(NCSe)2] crystals. J. Phys. Chem. Solids 1974, 35, 555–570. [Google Scholar] [CrossRef]
  62. Roubeau, O.; Castro, M.; Burriel, R.; Haasnoot, J.G.; Reedijk, J. Calorimetric Investigation of Triazole-Bridged Fe (II) Spin-Crossover One-Dimensional Materials: Measuring the Cooperativity. J. Phys. Chem. B 2011, 115, 3003–3012. [Google Scholar] [CrossRef]
  63. Brehm, G.; Reiher, M.; Schneider, S. Estimation of the Vibrational Contribution to the Entropy Change Associated with the Low- to High-Spin Transition in Fe(phen)2(NCS)2 Complexes:  Results Obtained by IR and Raman Spectroscopy and DFT Calculations. J. Phys. Chem. A 2002, 106, 12024–12034. [Google Scholar] [CrossRef]
  64. Collet, E.; Guionneau, P. Structural analysis of spin-crossover materials: From molecules to materials. C. R. Chim. 2018, 21, 1133–1151. [Google Scholar] [CrossRef]
  65. Craze, A.R.; Marjo, C.E.; Li, F. A complementary characterisation technique for spin crossover materials; the application of X-ray photoelectron spectroscopy for future device applications. Dalton Trans. 2022, 51, 428–441. [Google Scholar] [CrossRef] [PubMed]
  66. Chong, C.; Berini, B.; Boukheddaden, K.; Codjovi, E.; Linarès, J.; Garcia, Y.; Naik, A.D.; Varret, F. Characterization of spin crossover crystal surface by AFM. Phys. Status Solidi a 2010, 207, 1227–1231. [Google Scholar] [CrossRef]
  67. Cini, A.; Poggini, L.; Chumakov, A.I.; Rüffer, R.; Spina, G.; Wattiaux, A.; Duttine, M.; Gonidec, M.; Fittipaldi, M.; Rosa, P.; et al. Synchrotron-based Mössbauer spectroscopy characterization of sublimated spin crossover molecules. Phys. Chem. Chem. Phys. 2020, 22, 6626–6637. [Google Scholar] [CrossRef]
  68. Gütlich, P. Spin Crossover—Quo Vadis? Eur. J. Inorg. Chem. 2013, 2013, 581–591. [Google Scholar] [CrossRef]
  69. Collet, E.; Azzolina, G.; Ichii, T.; Guerin, L.; Bertoni, R.; Moréac, A.; Cammarata, M.; Daro, N.; Chastanet, G.; Kubicki, J.; et al. Lattice phonon modes of the spin crossover crystal [Fe(phen)2(NCS)2] studied by THz, IR, Raman spectroscopies and DFT calculations. Eur. Phys. J. B 2019, 92, 12. [Google Scholar] [CrossRef]
  70. Brady, C.; Callaghan, P.L.; Ciunik, Z.; Coates, C.G.; Døssing, A.; Hazell, A.; McGarvey, J.J.; Schenker, S.; Toftlund, H.; Trautwein, A.X.; et al. Molecular Structure and Vibrational Spectra of Spin-Crossover Complexes in Solution and Colloidal Media:  Resonance Raman and Time-Resolved Resonance Raman Studies. Inorg. Chem. 2004, 43, 4289–4299. [Google Scholar] [CrossRef]
  71. Brady, C.; McGarvey, J.J.; McCusker, J.K.; Toftlund, H.; Hendrickson, D.N. Time-Resolved Relaxation Studies of Spin Crossover Systems in Solution. In Spin Crossover in Transition Metal Compounds III; Gütlich, P., Goodwin, H.A., Eds.; Springer: Berlin/Heidelberg, Germany, 2004; pp. 1–22. [Google Scholar]
  72. Smeigh, A.L.; Creelman, M.; Mathies, R.A.; McCusker, J.K. Femtosecond Time-Resolved Optical and Raman Spectroscopy of Photoinduced Spin Crossover: Temporal Resolution of Low-to-High Spin Optical Switching. J. Am. Chem. Soc. 2008, 130, 14105–14107. [Google Scholar] [CrossRef]
  73. Rat, S.; Mikolasek, M.; Costá, J.S.; Chumakov, A.I.; Nicolazzi, W.; Molnár, G.; Salmon, L.; Bousseksou, A. Raman and nuclear inelastic scattering study of the lattice dynamics of the [Fe(H2B(pz)2)2(phen)] spin crossover complex. Chem. Phys. Lett. 2016, 653, 131–136. [Google Scholar] [CrossRef]
  74. Takemoto, J.H.; Hutchinson, B. Low-frequency infrared spectra of complexes which exhibit magnetic crossover. I. Iron (II) complexes of 1,10-phenanthroline and 2,2′-bipyridine. Inorg. Chem. 1973, 12, 705–708. [Google Scholar] [CrossRef]
  75. Pálfi, V.K.; Guillon, T.; Paulsen, H.; Molnár, G.; Bousseksou, A. Isotope effects on the vibrational spectra of the Fe(Phen)2(NCS)2 spin-crossover complex studied by density functional calculations. C. R. Chim. 2005, 8, 1317–1325. [Google Scholar] [CrossRef]
  76. Suryadevara, N.; Mizuno, A.; Spieker, L.; Salamon, S.; Sleziona, S.; Maas, A.; Pollmann, E.; Heinrich, B.; Schleberger, M.; Wende, H.; et al. Structural Insights into Hysteretic Spin-Crossover in a Set of Iron(II)-2,6-bis(1H-Pyrazol-1-yl)Pyridine) Complexes. Chem. A Eur. J. 2022, 28, e202103853. [Google Scholar]
  77. Garcia, Y.; Niel, V.; Muñoz, M.C.; Real, J.A. Spin Crossover in 1D, 2D and 3D Polymeric Fe (II) Networks. In Spin Crossover in Transition Metal Compounds I; Gütlich, P., Goodwin, H.A., Eds.; Springer: Berlin/Heidelberg, Germany, 2004; pp. 229–257. [Google Scholar]
  78. Ni, Z.-P.; Liu, J.-L.; Hoque, M.N.; Liu, W.; Li, J.-Y.; Chen, Y.-C.; Tong, M.-L. Recent advances in guest effects on spin-crossover behavior in Hofmann-type metal-organic frameworks. Coord. Chem. Rev. 2017, 335, 28–43. [Google Scholar] [CrossRef]
  79. Bartual-Murgui, C.; Akou, A.; Thibault, C.; Molnár, G.; Vieu, C.; Salmon, L.; Bousseksou, A. Spin-crossover metal–organic frameworks: Promising materials for designing gas sensors. J. Mater. Chem. C 2015, 3, 1277–1285. [Google Scholar] [CrossRef]
  80. Bousseksou, A.; Molnár, G.; Salmon, L.; Nicolazzi, W. Molecular spin crossover phenomenon: Recent achievements and prospects. Chem. Soc. Rev. 2011, 40, 3313–3335. [Google Scholar] [CrossRef]
  81. Dîrtu, M.; Schmit, F.; Naik, A.D.; Rusu, I.; Rotaru, A.; Rackwitz, S.; Wolny, J.A.; Schünemann, V.; Spinu, L.; Garcia, Y. Two-Step Spin Transition in a 1D FeII 1,2,4-Triazole Chain Compound. Chem. A Eur. J. 2015, 21, 5843–5855. [Google Scholar] [CrossRef]
  82. Bousseksou, A.; Molnár, G.; Real, J.A.; Tanaka, K. Spin crossover and photomagnetism in dinuclear iron (II) compounds. Coord. Chem. Rev. 2007, 251, 1822–1833. [Google Scholar] [CrossRef]
  83. Schmidt, S.O.; Naggert, H.; Buchholz, A.; Brandenburg, H.; Bannwarth, A.; Plass, W.; Tuczek, F. Thermal and Light-Induced Spin Transitions of FeII Complexes with 4- and 5-(Phenylazo)-2,2′-bipyridine Ligands: Intra- vs. Intermolecular Effects. Eur. J. Inorg. Chem. 2016, 2016, 2175–2186. [Google Scholar] [CrossRef]
  84. Harding, D.J.; Harding, P.; Phonsri, W. Spin crossover in iron (III) complexes. Coord. Chem. Rev. 2016, 313, 38–61. [Google Scholar] [CrossRef]
  85. Hayami, S.; Gu, Z.-z.; Yoshiki, H.; Fujishima, A.; Sato, O. Iron (III) Spin-Crossover Compounds with a Wide Apparent Thermal Hysteresis around Room Temperature. J. Am. Chem. Soc. 2001, 123, 11644–11650. [Google Scholar] [CrossRef] [PubMed]
  86. Griffin, M.; Shakespeare, S.; Shepherd, H.J.; Harding, C.J.; Létard, J.-F.; Desplanches, C.; Goeta, A.E.; Howard, J.A.K.; Powell, A.K.; Mereacre, V.; et al. A Symmetry-Breaking Spin-State Transition in Iron (III). Angew. Chem. Int. Ed. 2011, 50, 896–900. [Google Scholar] [CrossRef] [PubMed]
  87. Bertoni, R.; Lorenc, M.; Laisney, J.; Tissot, A.; Moréac, A.; Matar, S.F.; Boillot, M.L.; Collet, E. Femtosecond spin-state photo-switching dynamics in an FeIII spin crossover solid accompanied by coherent structural vibrations. J. Mater. Chem. C 2015, 3, 7792–7801. [Google Scholar] [CrossRef]
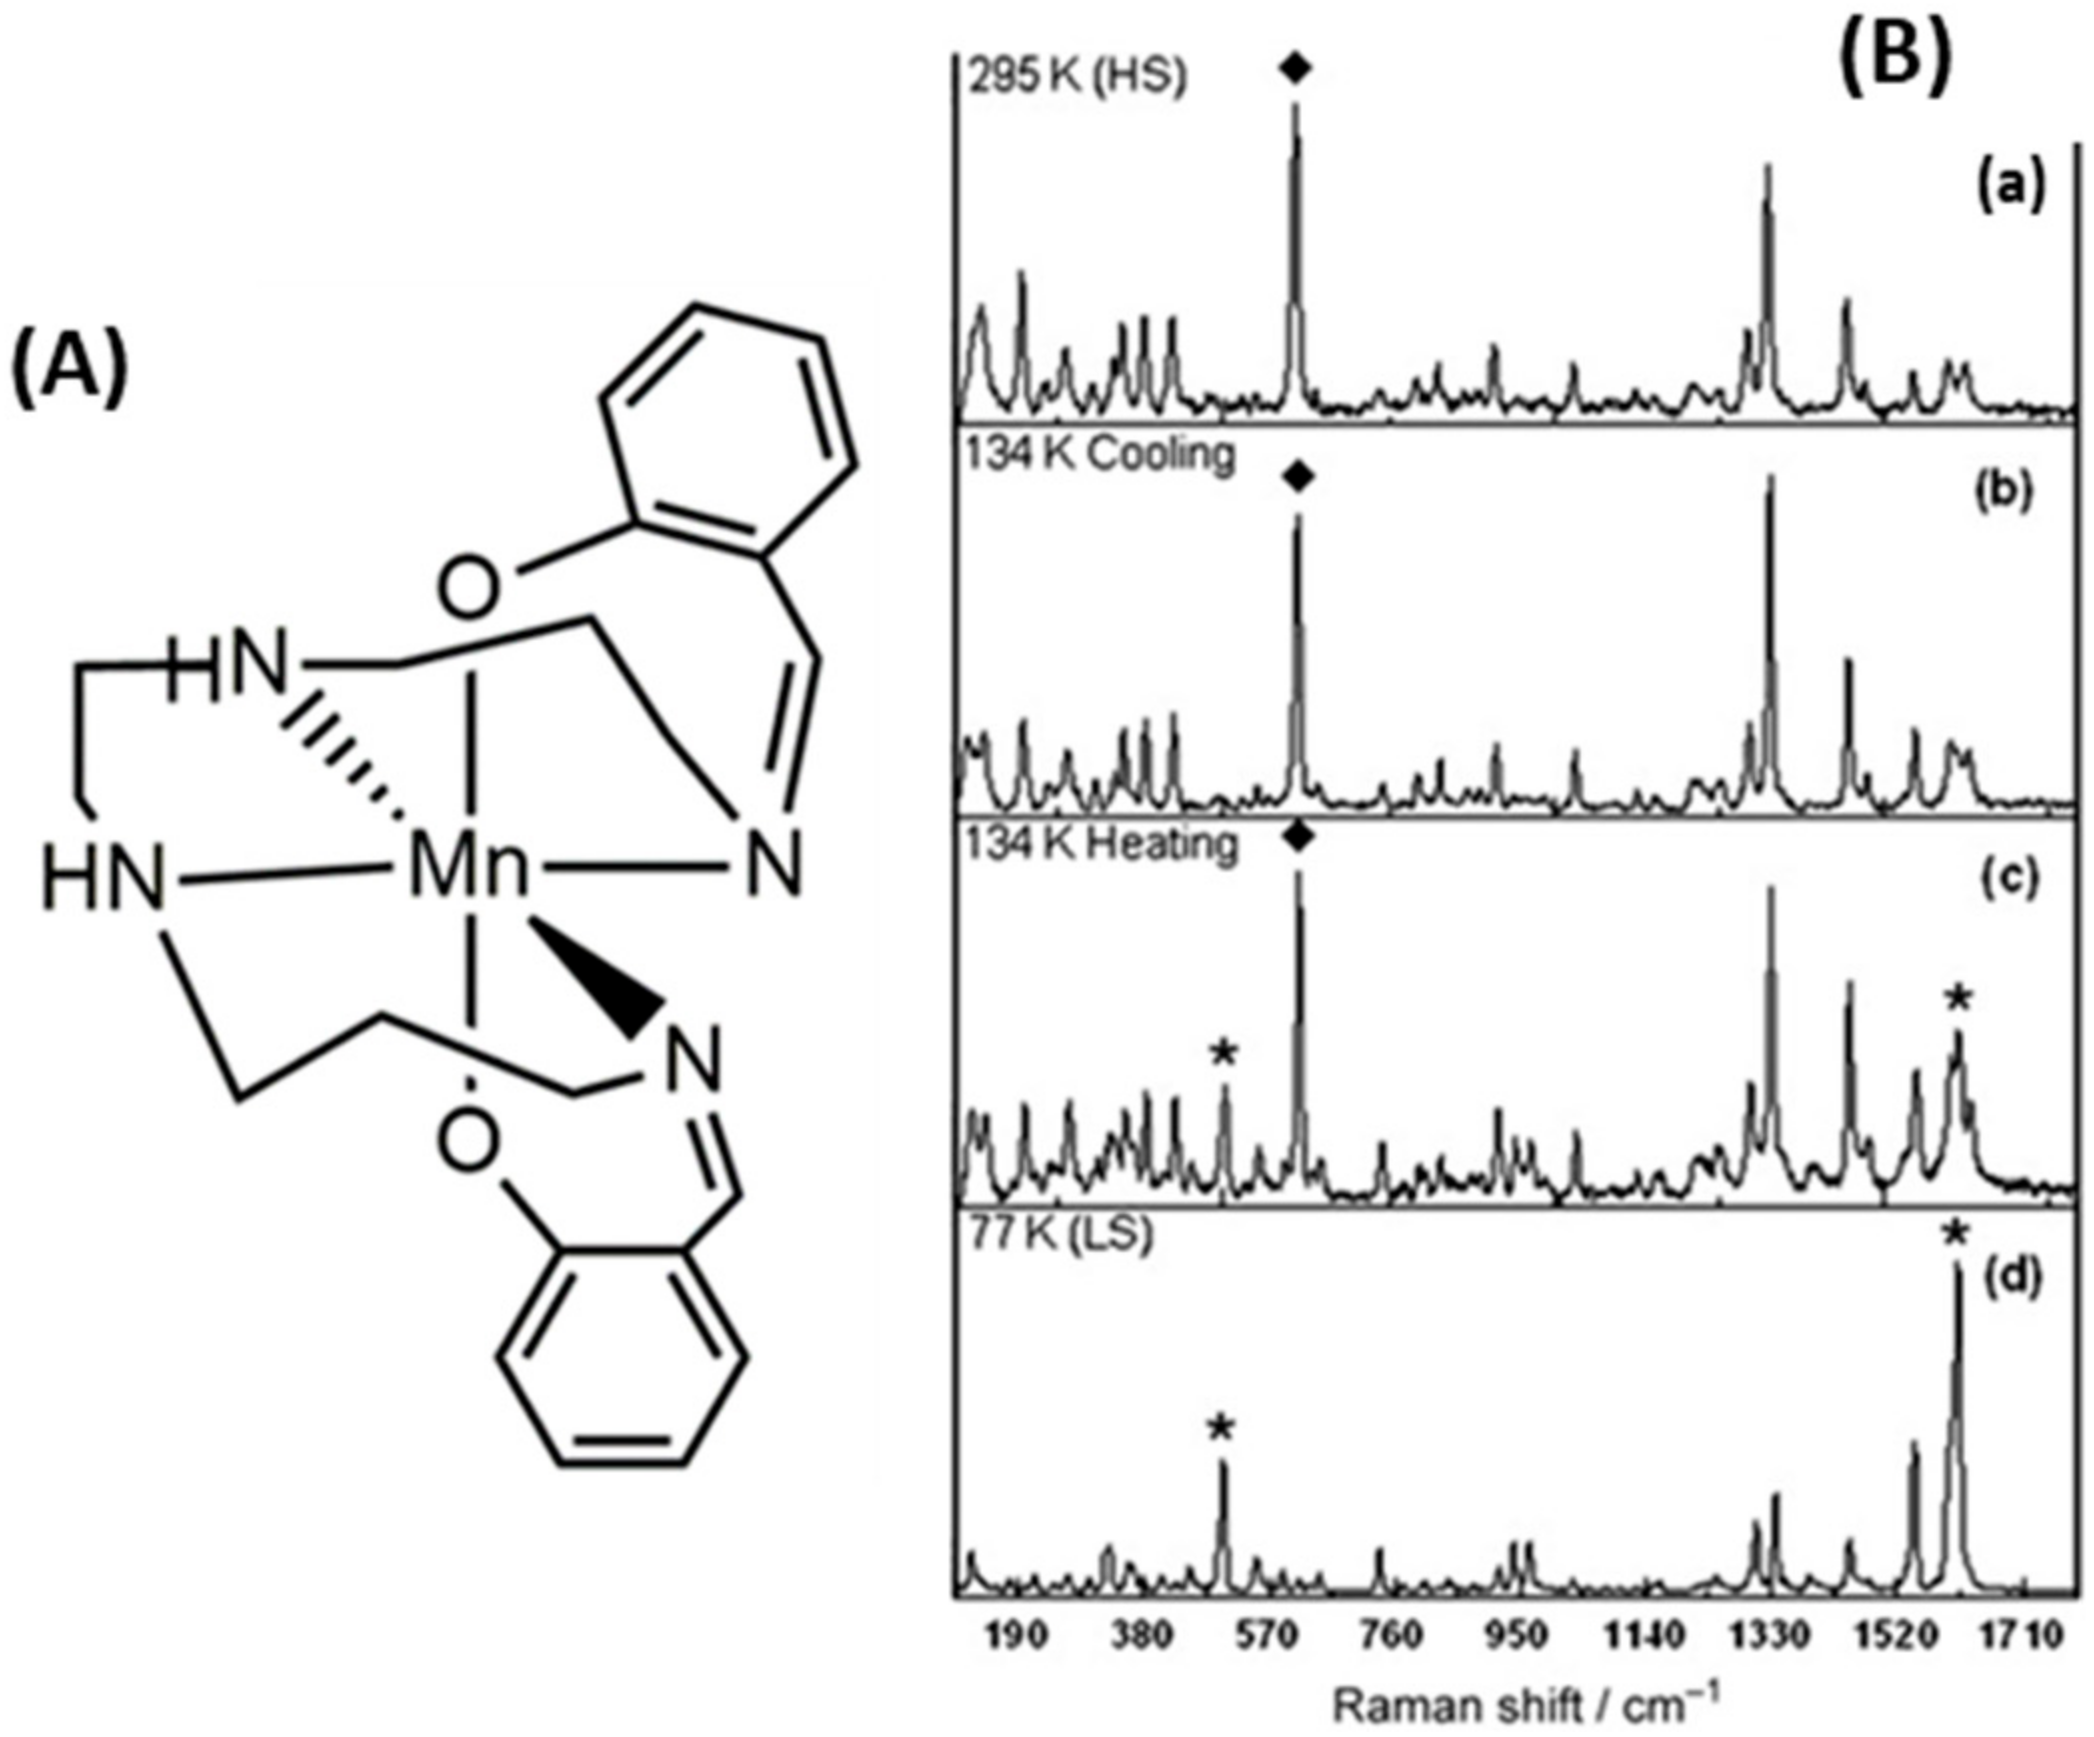
  88. Martinho, P.N.; Brendan, G.; Harris, M.M.; Lemma, T.; Naik, A.D.; Müller-Bunz, H.; Keyes, T.E.; Garcia, Y.; Morgan, G.G. Cooperative Spin Transition in a Mononuclear Manganese(III)Complex. Angew. Chem. Int. Ed. 2012, 124, 12765–12769. [Google Scholar] [CrossRef]
  89. Pandurangan, K.; Carter, A.B.; Martinho, P.N.; Gildea, B.; Lemma, T.; Shi, S.; Sultan, A.; Keyes, T.E.; Müller-Bunz, H.; Morgan, G.G. Steric Quenching of Mn (III) Thermal Spin Crossover: Dilution of Spin Centers in Immobilized Solutions. Magnetochemistry 2022, 8, 8. [Google Scholar] [CrossRef]
  90. Létard, J.-F.; Guionneau, P.; Goux-Capes, L. Towards Spin Crossover Applications. In Spin Crossover in Transition Metal Compounds III; Gütlich, P., Goodwin, H.A., Eds.; Springer: Berlin/Heidelberg, Germany, 2004; pp. 221–249. [Google Scholar]
  91. Forestier, T.; Mornet, S.; Daro, N.; Nishihara, T.; Mouri, S.-i.; Tanaka, K.; Fouché, O.; Freysz, E.; Létard, J.-F. Nanoparticles of ironm (II) spin-crossover. Chem. Commun. 2008, 4327–4329. [Google Scholar] [CrossRef]
  92. Siddiqui, S.A.; Domanov, O.; Schafler, E.; Vejpravova, J.; Shiozawa, H. Synthesis and size-dependent spin crossover of coordination polymer [Fe(Htrz)2(trz)](BF4). J. Mater. Chem. C 2021, 9, 1077–1084. [Google Scholar] [CrossRef]
  93. Tissot, A.; Kesse, X.; Giannopoulou, S.; Stenger, I.; Binet, L.; Rivière, E.; Serre, C. A spin crossover porous hybrid architecture for potential sensing applications. Chem. Commun. 2019, 55, 194–197. [Google Scholar] [CrossRef]
  94. Hosoya, K.; Kitazawa, T.; Takahashi, M.; Takeda, M.; Meunier, J.-F.; Molnár, G.; Bousseksou, A. Unexpected isotope effect on the spin transition of the coordination polymer Fe(C5H5N)2[Ni(CN)4]. Phys. Chem. Chem. Phys. 2003, 5, 1682–1688. [Google Scholar] [CrossRef]
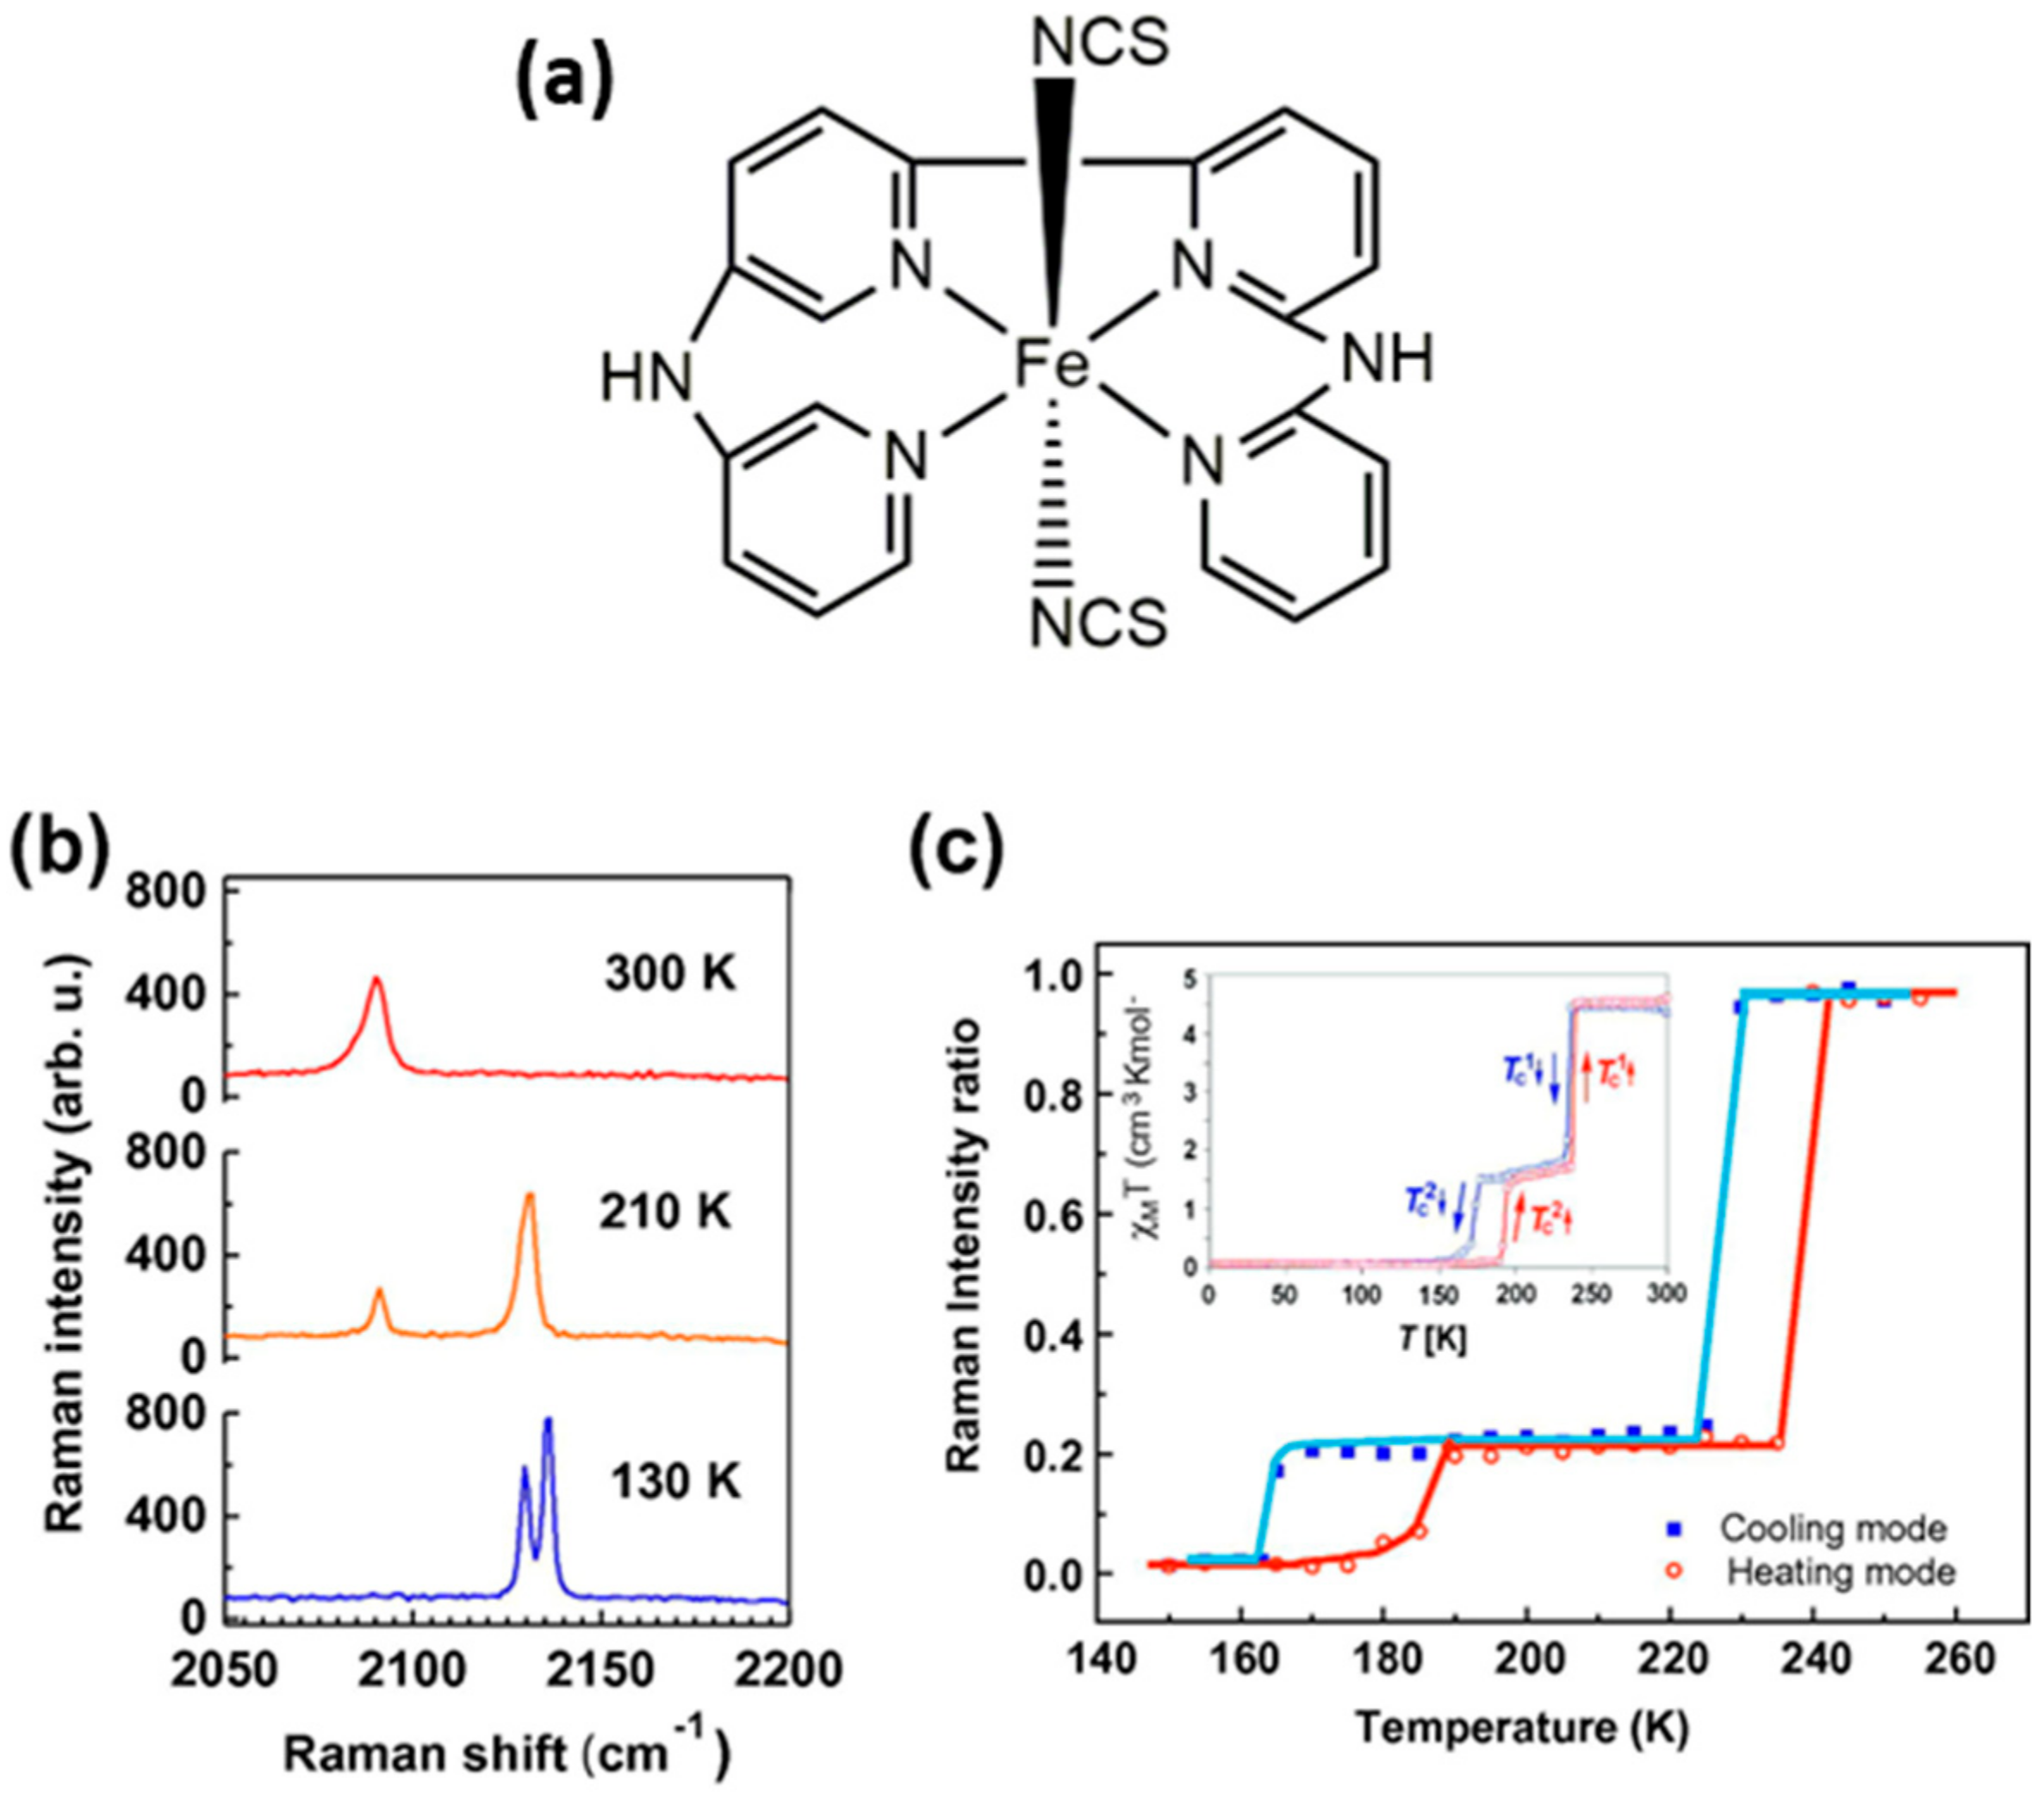
  95. Hernández, E.M.; Zheng, S.; Shepherd, H.J.; Yufit, D.S.; Ridier, K.; Bedoui, S.; Nicolazzi, W.; Velázquez, V.; Bonnet, S.; Molnár, G.; et al. Spatially Resolved Investigation and Control of the Bistability in Single Crystals of the [Fe(bbpya) (NCS)2] Spin Crossover Complex. J. Phys. Chem. C 2016, 120, 27608–27617. [Google Scholar] [CrossRef]
  96. Lada, Z.G.; Chrissanthopoulos, A.; Perlepes, S.P.; Andrikopoulos, K.S.; Voyiatzis, G.A. Wet-chemistry assembly of one-dimensional nanowires: Switching characteristics of a known spin-crossover iron (II) complex through Raman spectroscopy. Chem. Commun. 2022, 58, 521–524. [Google Scholar] [CrossRef] [PubMed]
  97. Attwood, M.; Akutsu, H.; Martin, L.; Blundell, T.J.; le Maguere, P.; Turner, S.S. Exceptionally high temperature spin crossover in amide-functionalised 2,6-bis(pyrazol-1-yl)pyridine iron (II) complex revealed by variable temperature Raman spectroscopy and single crystal X-ray diffraction. Dalton Transact. 2021, 50, 11843–11851. [Google Scholar] [CrossRef] [PubMed]
  98. Lada, Z.G.; Andrikopoulos, K.S.; Mathioudakis, G.N.; Piperigkou, Z.; Karamanos, N.; Perlepes, S.P.; Voyiatzis, G.A. Tuning the Spin-Crossover Behaviour in Fe(II) Polymeric Composites for Food Packaging Applications. Magnetochemistry 2022, 8, 16. [Google Scholar] [CrossRef]
  99. Lada, Z.G.; Beobide, A.S.; Mathioudakis, G.N.; Voyiatzis, G.A. Fe (II) Spin Crossover/Polymer Hybrid Materials: Investigation of the SCO Behavior via Temperature-Dependent Raman Spectroscopy, Physicochemical Characterization and Migration Release Study. Molecules 2021, 26, 201. [Google Scholar] [CrossRef] [PubMed]
  100. Hiiuk, V.M.; Shylin, S.I.; Barakhtii, D.D.; Korytko, D.M.; Kotsyubynsky, V.O.; Rotaru, A.; Shova, S.; Gural’skiy, I.y.A. Two-Step Spin Crossover in Hofmann-Type Coordination Polymers [Fe(2-phenylpyrazine)2{M(CN)2}2] (M = Ag, Au). Inorg. Chem. 2022, 61, 2093–2104. [Google Scholar] [CrossRef]
  101. Volatron, F.; Catala, L.; Rivière, E.; Gloter, A.; Stéphan, O.; Mallah, T. Spin-Crossover Coordination Nanoparticles. Inorg. Chem. 2008, 47, 6584–6586. [Google Scholar] [CrossRef]
  102. Sakaida, S.; Otsubo, K.; Otake, K.-i.; Kawaguchi, S.; Maesato, M.; Kitagawa, S.; Kitagawa, H. Surface morphology-induced spin-crossover-inactive high-spin state in a coordination framework. Chem. Commun. 2021, 57, 1462–1465. [Google Scholar] [CrossRef]
  103. Maskowicz, D.; Sawczak, M.; Ghosh, A.C.; Grochowska, K.; Jendrzejewski, R.; Rotaru, A.; Garcia, Y.; Śliwiński, G. Spin crossover and cooperativity in nanocrystalline [Fe(pyrazine)Pt(CN)4] thin films deposited by matrix-assisted laser evaporation. Appl. Surface Sci. 2021, 541, 148419. [Google Scholar] [CrossRef]
  104. Jureschi, C.-M.; Linares, J.; Boulmaali, A.; Dahoo, P.R.; Rotaru, A.; Garcia, Y. Pressure and Temperature Sensors Using Two Spin Crossover Materials. Sensors 2016, 16, 187. [Google Scholar] [CrossRef]
  105. Roubeau, O.; Colin, A.; Schmitt, V.; Clérac, R. Thermoreversible Gels as Magneto-Optical Switches. Angew. Chem. Int. Ed. 2004, 43, 3283–3286. [Google Scholar] [CrossRef]
  106. Ababei, R.; Pichon, C.; Roubeau, O.; Li, Y.-G.; Bréfuel, N.; Buisson, L.; Guionneau, P.; Mathonière, C.; Clérac, R. Rational Design of a Photomagnetic Chain: Bridging Single-Molecule Magnets with a Spin-Crossover Complex. J. Am. Chem. Soc. 2013, 135, 14840–14853. [Google Scholar] [CrossRef] [PubMed]
  107. Gaspar, A.B.; Ksenofontov, V.; Seredyuk, M.; Gütlich, P. Multifunctionality in spin crossover materials. Coord. Chem. Rev. 2005, 249, 2661–2676. [Google Scholar] [CrossRef]
  108. Ge, J.-Y.; Chen, Z.; Zhang, L.; Liang, X.; Su, J.; Kurmoo, M.; Zuo, J.-L. A Two-Dimensional Iron (II) Coordination Polymer with Synergetic Spin-Crossover and Luminescent Properties. Angew. Chem. Int. Ed. 2019, 58, 8789–8793. [Google Scholar] [CrossRef]
  109. Kumar, K.S.; Ruben, M. Emerging trends in spin crossover (SCO) based functional materials and devices. Coord. Chem. Rev. 2017, 346, 176–205. [Google Scholar] [CrossRef]
  110. Devid, E.J.; Martinho, P.N.; Kamalakar, M.V.; Šalitroš, I.; Prendergast, Ú.; Dayen, J.-F.; Meded, V.; Lemma, T.; González-Prieto, R.; Evers, F.; et al. Spin Transition in Arrays of Gold Nanoparticles and Spin Crossover Molecules. ACS Nano 2015, 9, 4496–4507. [Google Scholar] [CrossRef] [PubMed]
  111. Li, Z.-H.; Wang, Y.-X.; Han, W.-K.; Zhu, W.; Li, T.; Li, Z.; Ren, X.; Gu, Z.-G. Integrating spin-crossover nanoparticles with silver nanowires: Toward magnetic and conductive bifunctional nanomaterials. New J. Chem. 2017, 41, 10062–10068. [Google Scholar] [CrossRef]
  112. Tanaka, D.; Aketa, N.; Tanaka, H.; Horike, S.; Fukumori, M.; Tamaki, T.; Inose, T.; Akai, T.; Toyama, H.; Sakata, O.; et al. Facile preparation of hybrid thin films composed of spin-crossover nanoparticles and carbon nanotubes for electrical memory devices. Dalton Trans. 2019, 48, 7074–7079. [Google Scholar] [CrossRef] [PubMed]
  113. Lapresta-Fernández, A.; Titos-Padilla, S.; Herrera, J.M.; Salinas-Castillo, A.; Colacio, E.; Vallvey, L.F.C. Photographing the synergy between magnetic and colour properties in spin crossover material [Fe(NH2trz)3](BF4)2: A temperature sensor perspective. Chem. Commun. 2013, 49, 288–290. [Google Scholar] [CrossRef]
  114. Tsukiashi, A.; Min, K.S.; Kitayama, H.; Terasawa, H.; Yoshinaga, S.; Takeda, M.; Lindoy, L.F.; Hayami, S. Application of spin-crossover water soluble nanoparticles for use as MRI contrast agents. Sci. Rep. 2018, 8, 14911. [Google Scholar] [CrossRef]
  115. Gkolfi, P.; Tsivaka, D.; Tsougos, I.; Vassiou, K.; Malina, O.; Polaskova, M.; Polyzou, C.D.; Chasapis, C.T.; Tangoulis, V. A facile approach to prepare silica hybrid, spin-crossover water-soluble nanoparticles as potential candidates for thermally responsive MRI agents. Dalton Trans. 2021, 50, 13227–13231. [Google Scholar] [CrossRef]
Figure 1. (a) Diagram of the Rayleigh and Raman scattering processes, (b) Illustration of a typical Raman setup operating either with a mono- or triple configuration, (c) Normal modes of vibration of octahedral XY6 molecules, (d) Sketch image of the main compartments for temperature-dependent micro-Raman experiments.
Magnetochemistry 08 00108 g001
Figure 2. Sketch drawing of a typical gradual (a), two-step (b), with a hysteresis loop (c), abrupt (d), incomplete (e), and temperature-induced spin-crossover transition.
Magnetochemistry 08 00108 g002
Figure 3. (a) Structural drawing of the complex cations [Fe(tren(6-R-py)3)]2+ (R = H (2), CH3 (3)). Complex 2 is a poorly LS complex, while complex 3 is poorly HS. (b) Time dependence of the energy change (A) and spectral amplitude (C=N stretching vibration of [Fe(tren(py)3)](PF6)2) based on the femtosecond stimulated Raman data (B). (b) is reprinted with permission from ref. [72], copyright 2008, American Chemical Society.
Magnetochemistry 08 00108 g003
Figure 4. (a) Structural drawing of the complexes [Fe(H2B(pz)2)2(phen)] (4). (b) Raman spectra of the HS and LS states for the Fe and 57Fe samples (up); * indicate the modes with significant isotopic shift and magnified Raman spectral window displaying isotopic shifts (down). (b) is reprinted with permission from ref. [73], copyright 2016, Elsevier.
Magnetochemistry 08 00108 g004
Figure 5. (A) Structural drawing of the complex [FeII(DAPP)(abpt)](ClO4)2 (7), (B) Plots of transition temperature (a), full width half maximum (fwhm) of the ∆Cp peak of the phase transition (b), transition enthalpy (c), transition entropy (d), and the number of molecules per domain by the domain model against number of experience of phase transition (e). (B) is reprinted with permission from ref. [41], copyright 2007, American Chemical Society.
Magnetochemistry 08 00108 g005
Figure 6. (a) Structural drawing of the iron spin-crossover complexes with phenylazo-functionalized 2,2′-bipyridine ligands (PAbipy); [Fe(bpz)2(4-PAbipy)], [Fe(bpz)2(5-PAbipy)], [Fe(bpz)2(5-tBuPAbipy)], [Fe(4-PAbipy)2(NCS)2], [Fe(5-PAbipy)2(NCS)2]. (b) Intensity of the C=N stretching vibration of the LS (black) and HS (red) stares as extracted from the resonance Raman spectra at various temperatures for complexes [Fe(4-PAbipy)2(NCS)2] (up) and [Fe(5-PAbipy)2(NCS)2] (down). The gray circles correspond to the relative susceptibility data. (b) is reprinted with permission from ref. [83], copyright 2016, Wiley.
Magnetochemistry 08 00108 g006
Figure 7. (A) Structural drawing of the [MnL1]PF6 (complex 9); the PF6 counter lattice ions are not presented. (B) Raman spectra in (a) fully HS (295 K) and (d) fully LS (77 K) states and at T = 134 K for the cooling (b) and heating (c) mode. HS-associated modes are indicated by ♦ and LS by *. (B) is reprinted with permission from ref. [88], copyright 2012, Wiley.
Magnetochemistry 08 00108 g007
Figure 8. (a) General representation of the 3D structure of cyano-bridged Hofmann-type Fe(pz)[M(CN)4]·2H2O (12) coordination complexes. (a) is reprinted with permission from Inorganic Chemistry 2018, 57, 14, 8458–8464, copyright 2018, American Chemical Society. (b) Vibrational entropy change as a function of the relative frequency change occurring during the spin transition. (b) is reprinted with permission from ref. [44], copyright 2002, American Chemical Society.
Magnetochemistry 08 00108 g008
Figure 9. (a) Structural drawing of [Fe(bapbpy)(NCS)2] (complex 13). (b) Raman spectra in the region 2050–2200 cm−1 of [Fe(bapbpy)(NCS)2] at 130, 210, and 300 K. (c) Raman intensity ratio as a function of temperature. (b,c) are reprinted with permission from ref. [59], copyright 2010, Elsevier.
Magnetochemistry 08 00108 g009
Figure 10. (a) Structural drawing of [Fe{N(CN)2}2(abpt)2] (complex 14). (b) Raman spectra at the low-frequency region of the complex with particle size of 300 nm at room temperature (red line), 223 K (pink line), 123 K (orange line), and 83 K (blue line); the calculated Raman spectrum of the LS species is presented with a dashed line at 130, 210, and 300 K. (c) Temperature dependence of the HS population for complex 14 at samples of different particle sizes (i.e., ~300 nm, ~80 nm, and ~20 nm). The figure is reprinted with permission from ref. [24], copyright 2019, American Chemical Society.
Magnetochemistry 08 00108 g010
Figure 11. (a) Temperature-dependent Raman spectra of the [Fe(2-mpz)2Ni(CN)4] (15) coordination complex in the region of pyrazine ring in-plane bending mode (~660 cm−1). The 653 cm−1 and 665 cm−1 bands correspond to the HS and LS modes, respectively (the inset depicts the Lorentzian fitting used). (b) Calculated HS population as a function of temperature for the micro/nanosized systems (top/bottom) extracted by Raman spectroscopy. The figure is reprinted with permission from ref. [25], copyright 2020 John Wiley & Sons, Ltd.
Magnetochemistry 08 00108 g011
Figure 12. (a) Structural drawing of [Fe(bppCONH2)2](BF4)2 (16), where bppCONH2 is 2,6-bis(pyrazol-1-yl)pyridine-4-carboxamide; the BF4 anions existing in the lattice are eliminated. (b) Calculated HS population as a function of temperature for both heating (red scatter points) and cooling (blue scatter points) modes extracted by Raman spectroscopy. (b) is reproduced from Ref. [97] with permission from the Royal Society of Chemistry.
Magnetochemistry 08 00108 g012
Figure 13. (a) Raman spectra of Fe(pz)[Pt(CN)4]·2H2O at different pressures. (b) HS fraction as a function of pressure as extracted from Raman analysis; arrows indicate the increase/decrease in pressure. The figure is reprinted with permission from ref. [42], copyright 2003, American Chemical Society.
Magnetochemistry 08 00108 g013
Table 1. Main features, advantages and disadvantages of selected methods for the monitoring of the spin-crossover phenomenon.
MethodMain FeaturesAdvantagesDisadvantages SCO Characteristics Being Recorded
Magnetic susceptibility (Principal technique)Variation of magnetic susceptibility as a function of temperature due to drastic transition from a strongly paramagnetic HS state to a weakly paramagnetic or even diamagnetic LS state High sensitivity and accuracy, spin-state variations under various external perturbations (pressure, temperature, light irradiation)Operation at cryogenic temperatures, bulk techniqueT1/2 values, curve of SCO transition, calculation of HS population
57Fe MössbauerEvaluate separate spin states during the SCO process based on spectral parametersHigh sensitivity, characterization of electronic structure, and molecular structure modifications Only for iron SCO complexes being limited to the 57-Fe isotope leading to necessicity of istopic enrichment in some cases, bulk techniqueT1/2 values, curve of SCO transition, calculation of HS population
X-rays Peak splitting for HS/LS components and intensities increase/decrease proportionally to the macroscopic spin conversion levelInsight on electronic and molecular structureLimitation to study crystals that do not decompose upon transition, bulk techniqueT1/2 values, curve of SCO transition, calculation of HS population
DSC Monitoring of the phase transition taking place during the SCO process Can also facilitate the determination of the ΔH and ΔS occurring during SCO eventLimited to temperature-induced SCO, can be utilized in a specific temperature window, bulk techniqueT1/2 values, ΔS, ΔH calculation of the phase transition
UV/VisVisible
change in color due to the usual shift of the charge transfer transition during the SCO to lower energy at low temperatures
Ultrafast time-dependent UV–vis spectroscopy together with X-rays–has been used to characterize the photoinduced kinetics, comparing the dynamical processes in solid to that observed in solutionUsually small changes in UV/Vis band during SCO T1/2 values, curve of SCO transition, calculation of HS population
Infrared Vibrational pattern upon spin switching A quick and efficient way of monitoring LIESST effect, time-dependent IR may provide unique information on the dynamics of SCO systemsSpin marker bands of metal–ligand stretchings require spectra in the far-IR region (<400 cm−1); not easily accessible T1/2 values, curve of SCO transition, calculation of HS population, dynamic properties
RamanMonitoring of the structural differentiations and phase transition taking place during the SCO processHigh sensitivity, characterization of structure, and molecular structure modifications can also facilitate the determination of ΔS occurring during SCO event; μ-Raman allows the study of a specific spot of sample (non-bulk)Preresonant Raman effect, laser-induced heat effects (induce of transition), laser induce LIEST T1/2 values, curve of SCO transition, calculation of HS population, ΔS, ΔH calculation of the phase transition
Publisher’s Note: MDPI stays neutral with regard to jurisdictional claims in published maps and institutional affiliations.

