Article

Neutron Studies of a High Spin Fe19 Molecular Nanodisc

1
ISIS Neutron and Muon Source, STFC Rutherford Appleton Laboratory, Didcot OX11 0QX, UK
2
Institute of Inorganic Chemistry, Karlsruhe Institute of Technology, D76131 Karlsruhe, Germany
3
Changchun Institute of Applied Chemistry, Changchun 130022, China
4
Department of Physics, University of Oxford, Clarendon Laboratory, Oxford OX1 3PU, UK
*
Author to whom correspondence should be addressed.
Magnetochemistry 2021, 7(6), 74; https://doi.org/10.3390/magnetochemistry7060074
Submission received: 20 April 2021 / Revised: 13 May 2021 / Accepted: 18 May 2021 / Published: 21 May 2021

Abstract

:
The molecular cluster system [Fe 19 (metheidi) 10 (OH) 14 O 6 (H 2 O) 12 ]NO 3 ·24H 2 O, abbreviated as Fe 19 , contains nineteen Fe(III) ions arranged in a disc-like structure with the total spin S = 35/2. For the first order, it behaves magnetically as a single molecule magnet with a 16 K anisotropy barrier. The high spin value enhances weak intermolecular interactions for both dipolar and superexchange mechanisms and an eventual transition to antiferromagnetic order occurs at 1.2 K. We used neutron diffraction to determine both the mode of ordering and the easy spin axis. The observed ordering was not consistent with a purely dipolar driven order, indicating a significant contribution from intermolecular superexchange. The easy axis is close to the molecular Fe1–Fe10 axis. Inelastic neutron scattering was used to follow the magnetic order parameter and to measure the magnetic excitations. Direct transitions to at least three excited states were found in the 2 to 3 meV region. Measurements below 0.2 meV revealed two low energy excited states, which were assigned to S = 39/2 and S = 31/2 spin states with respective excitation gaps of 1.5 and 3 K. Exchange interactions operating over distances of order 10 Å were determined to be on the order of 5 mK and were eight-times stronger than the dipolar coupling.

1. Introduction

Coupled clusters of transition metal ions can provide examples of high-spin single molecule magnets (SMMs) [1,2]. Since the field of SMMs opened with the discovery of the slow relaxation of the magnetisation in the Mn12 molecule Mn 12 O 12 (CH 3 COO) 16 (H 2 O) 4 [3], a large number of further Mn(III)-based SMMs have been discovered, among them the high anisotropy system Mn6 [4] and the high-spin system Mn17 with S = 37 [5]. In addition to further examples based on other 3d metals, such as Fe(III), the incorporation of 4f ions has also proven a useful strategy for introducing large anisotropy to high spin systems in 3d–4f molecules, mostly utilising Mn(III) or Fe(III) [6,7].
These SMM systems attract interest both from the viewpoint of fundamental science and in terms of their potential applications in areas, such as data storage and quantum computing. One of the key factors for such applications is the effect of finite intermolecular interactions that can lead to decoherence of the spin state [8] and, hence, a loss of information. While careful chemical control of the intermolecular environment can, in principle, reduce the contribution of exchange interactions to the decoherence, dipolar interactions are always present for such molecules and depend only on the spin orientation and the geometry of the lattice. Weak residual dipolar interactions between the spins on different molecules can, therefore, ultimately lead to dipolar ordering in SMM systems at low temperatures [9,10].
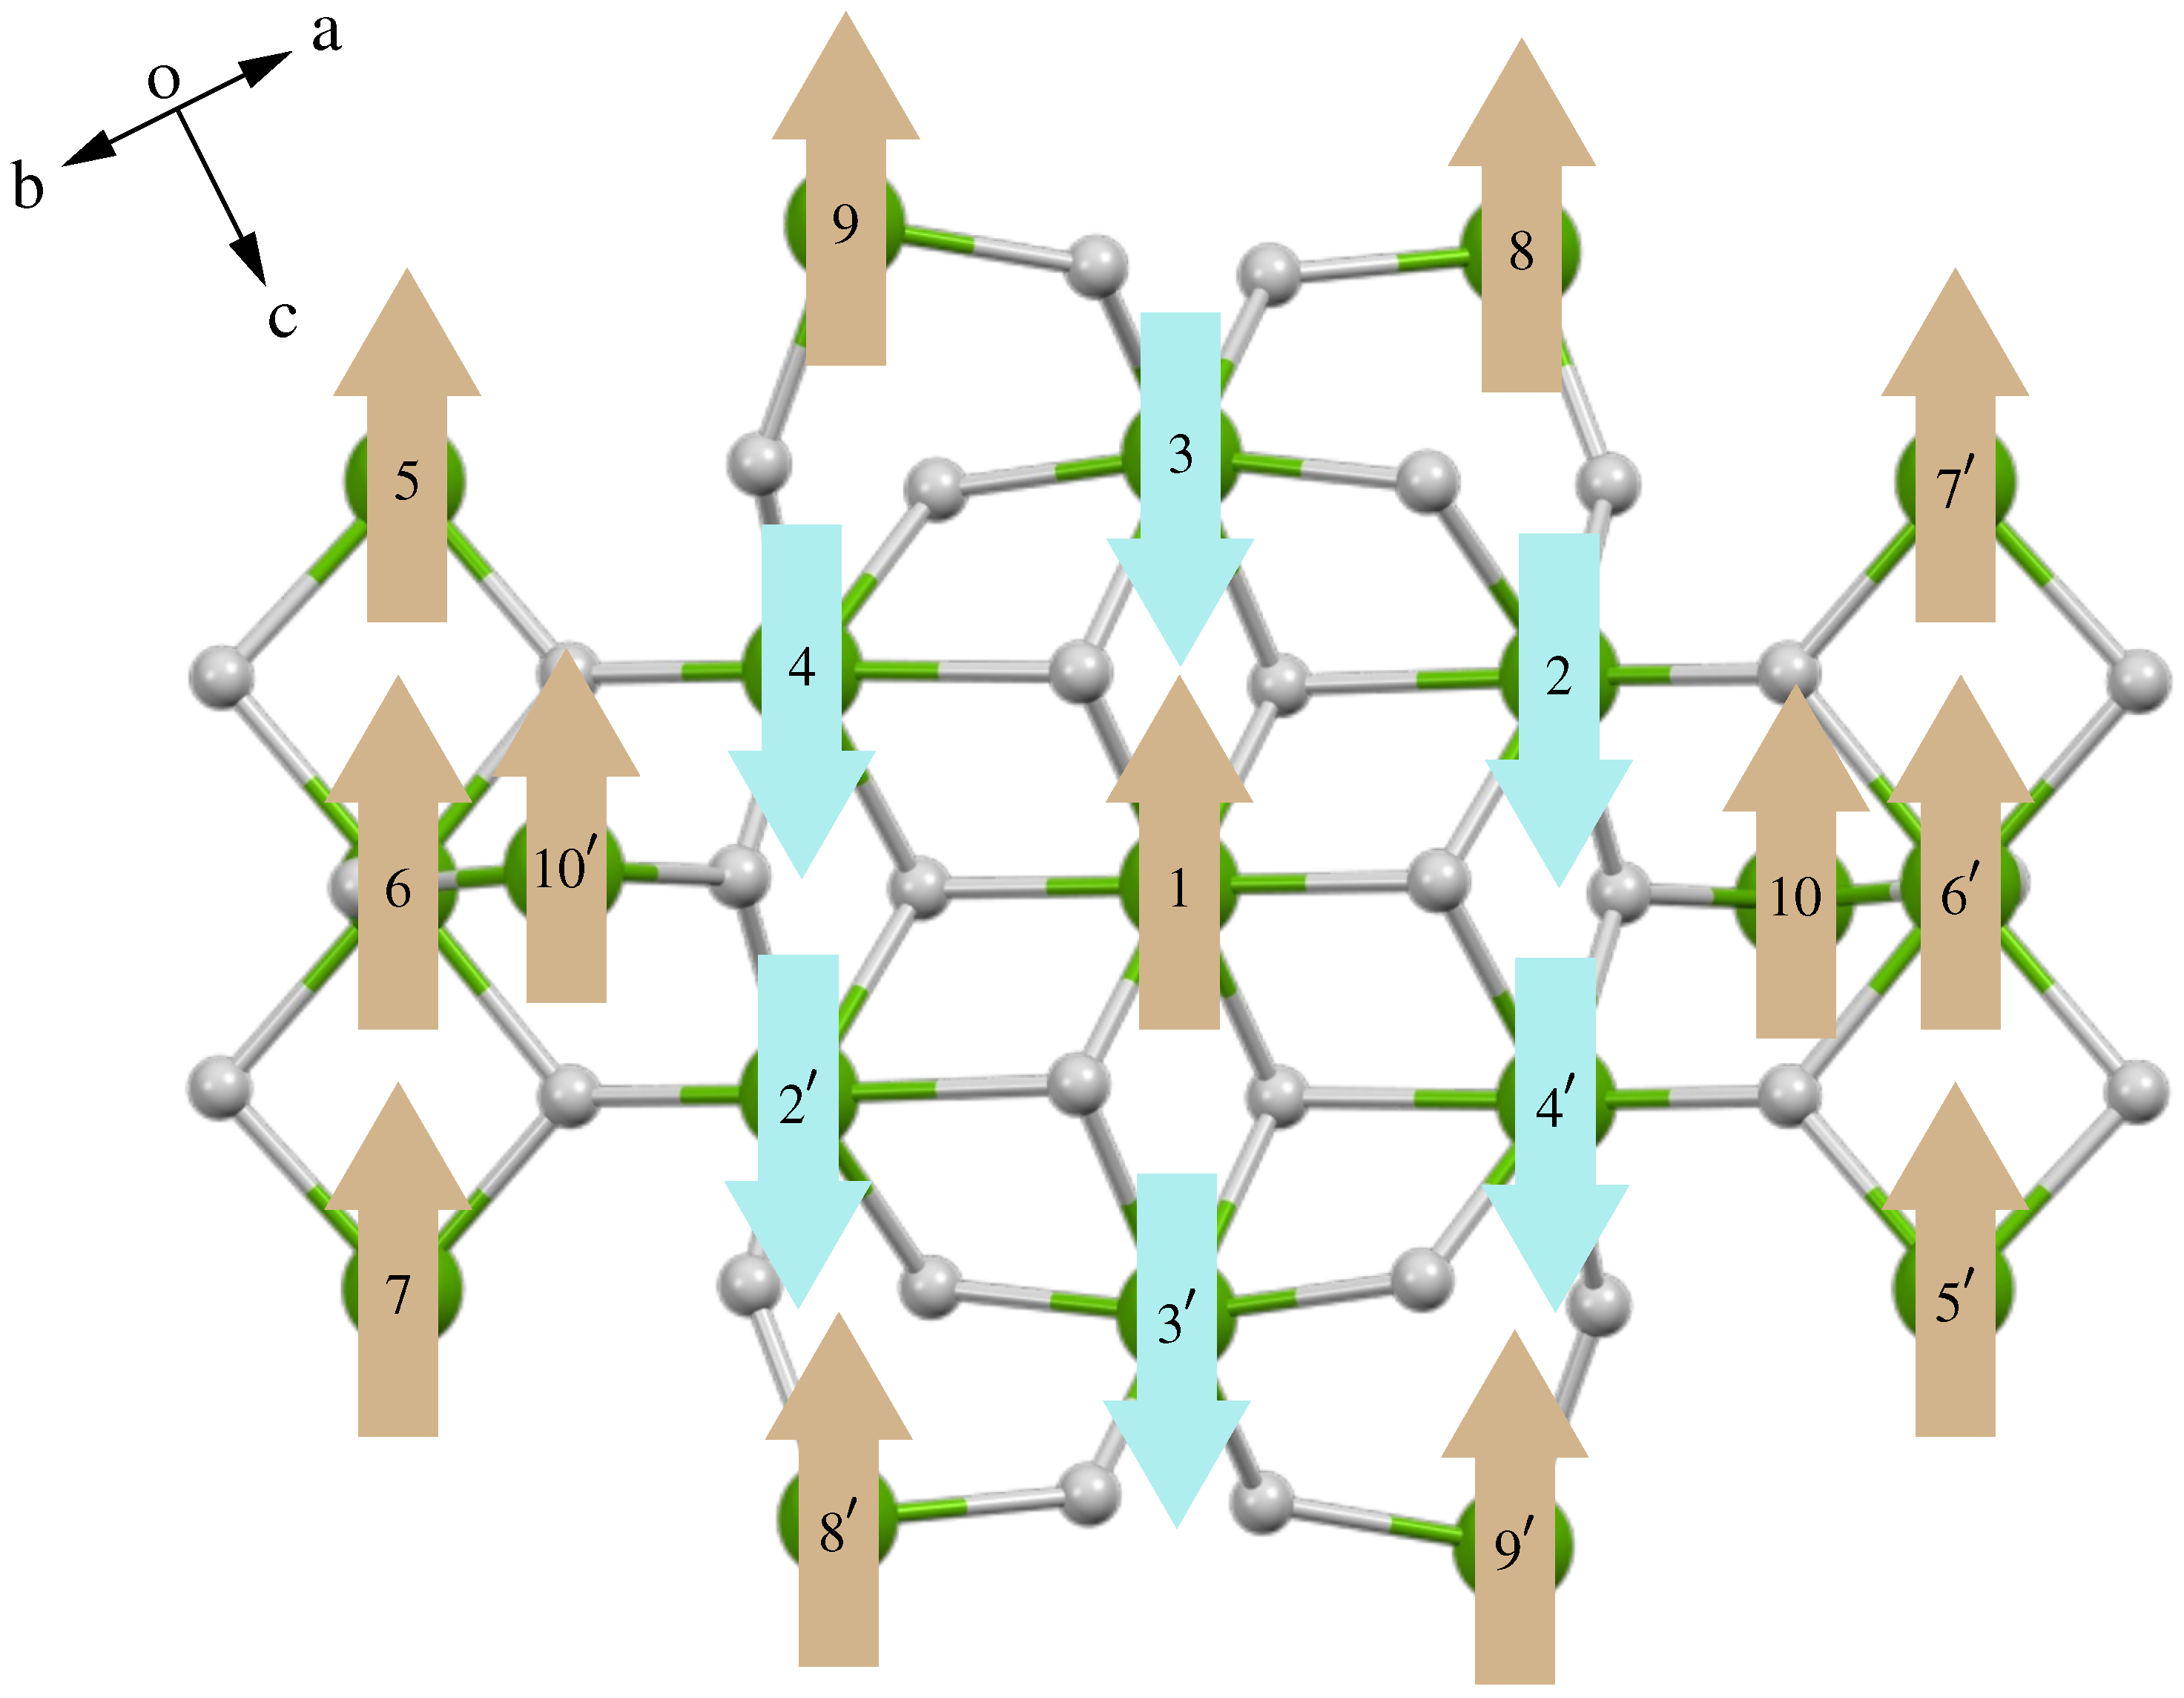
The Fe 19 molecular cluster SMM system [11], which is studied here, has the full formula [Fe 19 (metheidi) 10 (OH) 14 O 6 (H 2 O) 12 ]NO 3 ·24H 2 O. This provides an interesting example combining high spin with moderate anisotropy. The high spin makes it a good candidate to observe dipolar-driven long range magnetic ordering. The magnetic core of the molecule (Figure 1) has a disc-like geometry; therefore, it can be described as a magnetic nanodisc. The spin state has been identified as 35/2 [12,13], resulting from a ferrimagnetic intramolecular arrangement of the S = 5/2 spins from the Fe sites, with thirteen of the spins pointing in one direction and the remaining six spins antiparallel to these thirteen.
Two variants of Fe 19 have been reported [11], both having the same core structure, but with slightly different ligands. We study here the metheidi form. Antiferromagnetic (AF) ordering at T N = 1.19 K for this material was previously observed with the specific heat [14,15], and this was confirmed by μ SR [16]. Evidence was also found for a static internal field and AF spin waves below 1 K using proton NMR [17].
Previous single crystal EPR studies [13] obtained anisotropy parameters for the spin Hamiltonian and identified an easy spin axis pointing in the Fe1–Fe2 direction; however, that study also found evidence for the presence of excited states that could not be fully characterised. On the basis of these reported ground state properties, it was shown that the observed ordering temperature was consistent with a predominantly dipolar driven scenario, and this produced a clear prediction that the ordering mode would have the wave vector k = (0 0 0.5) [16]. The present studies were carried out firstly to test this prediction using neutron diffraction and secondly to determine the spectrum of excited spin states using inelastic neutron scattering.

2. Materials and Methods

Samples were prepared using the method given in the report of Goodwin et al. [11] using either H 2 O or D 2 O in the synthesis. The sample identity and purity was checked using powder X-ray diffraction at 300 K and confirmed to be consistent with the structure reported at 150 K [11]. The neutron diffraction measurements were carried out on the WISH instrument at the ISIS Neutron and Muon Source [18].
This instrument is optimised for the powder diffraction of systems with large unit cells, such as the molecular magnet studied here. Some of the particular features of the neutron powder diffraction for molecule-based systems were previously reviewed by Peter Day [19]. The sample was 750 mg of polycrystalline powder, and it was cooled in a helium-3 sorption cryostat, which allowed measurements to be made down to a temperature of 0.4 K. Data collection was made in a 5 Hz double frame mode, allowing access to a d spacing range up to 100 Å.
For the inelastic neutron scattering measurements, a partially deuterated sample was used in which the lattice water and hydroxide groups were deuterated but not the metheidi ligands. In this case, 86 out of 186 hydrogen atoms were replaced by deuterium, thus, producing the formula [Fe 19 (metheidi) 10 (OD) 14 O 6 (D 2 O) 12 ]NO 3 ·24D 2 O, where metheidi is C 7 H 10 NO 5 . The partial deuteration of the molecule allowed us to considerably reduce the incoherent scattering and to clearly observe the magnetic excitations up to a 5 meV energy transfer with only a small contribution from the vibrational modes at high Q.
The spectra were measured on the LET instrument at ISIS using a helium dilution refrigerator, which enabled measurements to be made in temperatures down to 35 mK. The LET instrument is a multi-chopper cold neutron spectrometer [20]. Data were taken with the focusing of the instrument centred on an incident energy of 2 meV with choppers operating at speeds of 280 Hz (chopper 5) and 70 Hz (chopper 3) and using the high resolution disk slot.
This configuration allows the simultaneous collection of data with incident energies E i and nominal resolutions at the elastic line of 5.15 meV (90 μeV), 2 meV (24 μeV), and 1.06 meV (10 μeV). Energy transfer spectra were obtained by integrating over the momentum range 0 to 1.4 Å 1 for E i = 1.06 meV, 0 to 1.8 Å 1 for E i = 2.00 meV and 0 to 2.5 Å 1 for E i = 5.15 meV. Data reduction was done using Mantid [21], and Wimda [22] was used for the global fitting of the data via its user modelling feature.

3. Results

The results are presented in two parts. First, we report the neutron diffraction results determining the low temperature cell parameters, the mode of magnetic ordering, and the orientation of the easy spin axis. The second part of the data reports the inelastic neutron results, which allow us to determine the internal magnetic field in the ordered state and the anisotropy parameters for the spin states. In addition to the S = 35/2 ground state multiplet, six excited state multiplets were identified from the data with spin values ranging from 31/2 to 39/2.

3.1. Diffraction

Cell parameters were obtained from the neutron data at 1.5 K and were found to be broadly consistent with those reported at 150 K with X-rays [11], after allowing for a modest thermal contraction that reduces the cell volume by around 2% (Table 1).
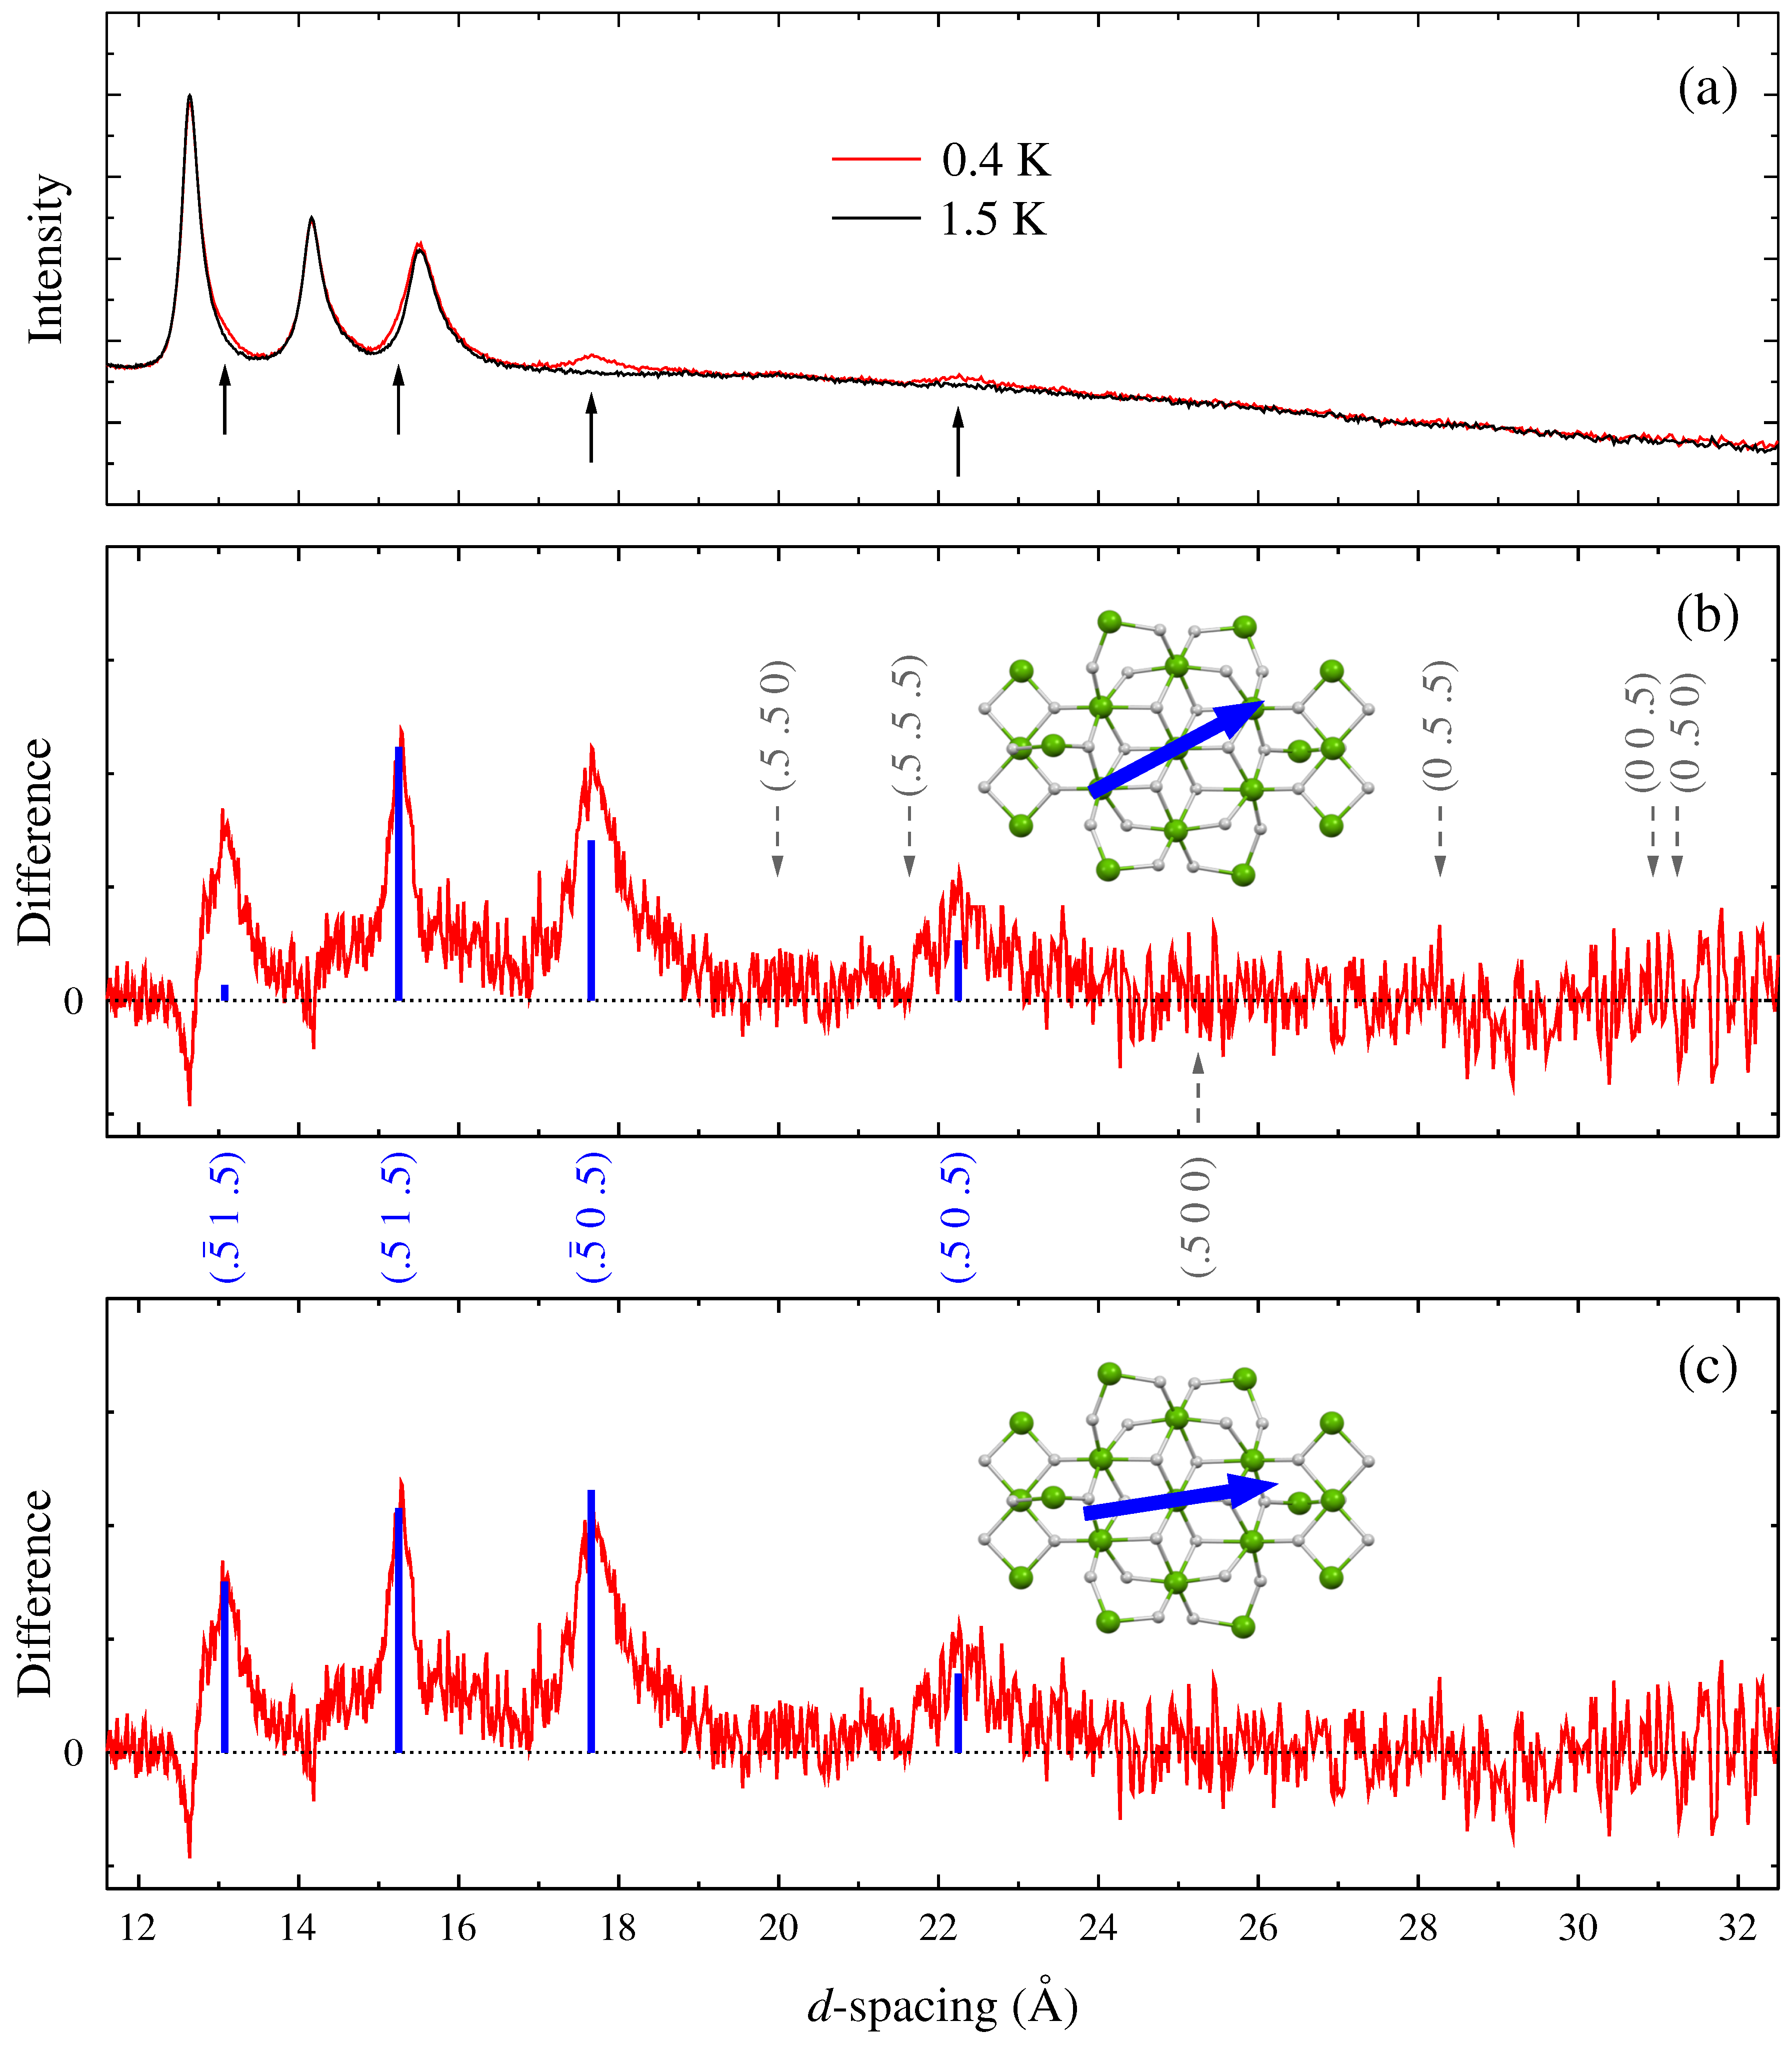
New magnetic diffraction peaks appeared below the AF ordering transition, as can be seen in Figure 2a, where four extra peaks are seen, and these are made clearer in the difference plots of Figure 2b,c. Information about the spin structure and the easy axis orientation may be obtained from the relative intensities of these magnetic peaks. The intensity of the magnetic peaks can be written here as a product of three terms
I ( Q ) ( 1 ( Q ^ · m ^ ) 2 ) | F M cell ( Q ) | 2 | F M mol ( Q ) | 2 .
The first term in Equation (1) is a factor from the component of the scattering vector Q that is perpendicular to the magnetic moment axis m ^ . The second term in Equation (1) is the structure factor for magnetic ordering, which is summed over the lattice vectors L i defining the magnetic cell, i.e.,
F M cell ( Q ) = cell e i Q · L i .
The third term in Equation (1) is the structure factor for the spatial arrangement of the up and down magnetic moments of the Fe sites within the molecule, as shown in Figure 1, i.e.,
F M mol ( Q ) = e i Q · r i e i Q · r i .
Note that no atomic form factors are needed in Equation (3), as we only have one type of magnetic site, and the Q values are too low to produce any difference in form factor between the magnetic peaks. The low symmetry triclinic cell also ensures that the magnetic peaks correspond to unique scattering planes, rather than to a superposition of magnetically inequivalent symmetry-related planes as is often found in higher symmetry structures.
The four magnetic peaks were found to be consistent only with an AF ordering whose propagation wave vector was (0.5 0 0.5). Thus, the (0 0 0.5) mode and all other modes that might be associated with purely dipolar-driven ordering are excluded (see Table 2). This indicates that there is a significant contribution from superexchange to the magnetic coupling between the molecules. The relative scale of the interactions will be discussed in Section 4.
The calculated intensities for the magnetic peaks are shown in Figure 2b for the S = 35/2 arrangement of spins in the molecule as defined in Figure 1, with the ordering mode set to (0.5 0 0.5) and m ^ aligned in the Fe1–Fe2 easy axis direction, which was reported in a previous EPR study [13]. These intensities are seen to be a relatively poor overall match to the measured data with the intensity of the (−0.5 1 0.5) peak being strongly underestimated. A significant improvement was obtained by allowing the easy axis to rotate toward the long axis of the molecule, and this provided a very good match with the intensities, as shown in Figure 2c.
Table 2. Dipolar stabilisation energies for the S = 35/2 ground state of Fe 19 calculated for different modes of magnetic ordering using, firstly, the previously proposed Fe1-Fe2 easy spin axis, for which (0 0 0.5) is the most stable mode, and secondly the axis determined from this study. A spherical sample is assumed for the case of the (0 0 0) ferromagnetic ordering mode. Negative values are unstable.
Ordering ModeDipolar Energy (K)Dipolar Energy (K)
(−1.12, 1, 0.06) Easy Axis(−0.45, 1, −0.34) Easy Axis
000.50.8090.436
0.50.500.5750.219
0000.5610.662
0.50.50.50.5150.533
0.500.5−0.271−0.337
00.50−0.425−1.028
00.50.5−0.556−0.024
0.500−0.792−0.144
The easy axis vector obtained from fitting the data is shown in Table 3. We found this to be quite close to the Fe1–Fe10 axis and making an angle of 12° to that axis, whereas it is at 26° to the originally proposed Fe1–Fe2 axis. Although the molecule only has crystallographic inversion symmetry, the molecular symmetry conforms closely to 2/m, with the twofold axis defined by Fe3–Fe1–Fe3 . It is, thus, very likely that the orientation of the easy axis also conforms to this symmetry (either parallel to the twofold axis or perpendicular to it). The axis orientation found here, lying close to the molecular mirror plane (defined by Fe10–Fe2–Fe1–Fe2 –Fe10 ) is, thus, more consistent with this expectation than that suggested by the earlier EPR study.
Table 3. For an easy axis vector specified in cell units ( S a S b S c ), the direction is fully determined by two parameters. The orientation obtained here is compared with the Fe1–Fe10 direction and also the Fe1–Fe2 direction suggested by the previous EPR study [13]. The fitted orientation is close to the plane formed by the Fe1, Fe2, and Fe10 sites and is close to the Fe1–Fe10 axis as shown by the angle given in the final column.
S a S b S c Angle (°)
This study−0.45(2)1−0.34(2)
Fe1–Fe10−0.181−0.4212
Fe1–Fe2 (EPR)−1.1210.0626

3.2. Inelastic Neutron Scattering

In addition to the appearance of new magnetic diffraction peaks, the magnetic phase transition can also be observed via changes in the low energy inelastic neutron scattering spectra with temperature. This provides a measurement of the effective internal field that appears below the transition. Using measurements at low energies, taken just above the transition at 1.2 K, the low lying excitations are determined. Further excitations are also found at higher energies, and the combined measurements allow the seven lowest energy spin states to be identified. The data obtained are analysed with a spin Hamiltonian for each spin state S taking the form
H = D S z 2 + E ( S x 2 S y 2 ) + g μ B ( S x B x + S y B y + S z B z ) ,
where D and E are axial and rhombic anisotropy parameters defining the zero field splitting (z is the direction of the anisotropy axis) and B is a spontaneous static internal magnetic field that is only present in the magnetically ordered state. The energy levels E S , S z are determined by the eigenvalues of each spin state, offset by Δ , the energy gap of the lowest level of the spin state multiplet with respect to the S = 35/2, S z = 35/2 ground state. When B is present, a shift in the energy levels occurs, which is mainly determined by the z component of the field, which we will label B 0 .
For the current simplified model, we have treated each S-state independently within the Giant-Spin-Approximation using Equation (4). We note that, besides the anisotropy contribution from crystal field and dipole–dipole interactions, S-state mixing [23] can also contribute to the effective D and E terms in the Spin Hamiltonian.

3.2.1. Internal Field

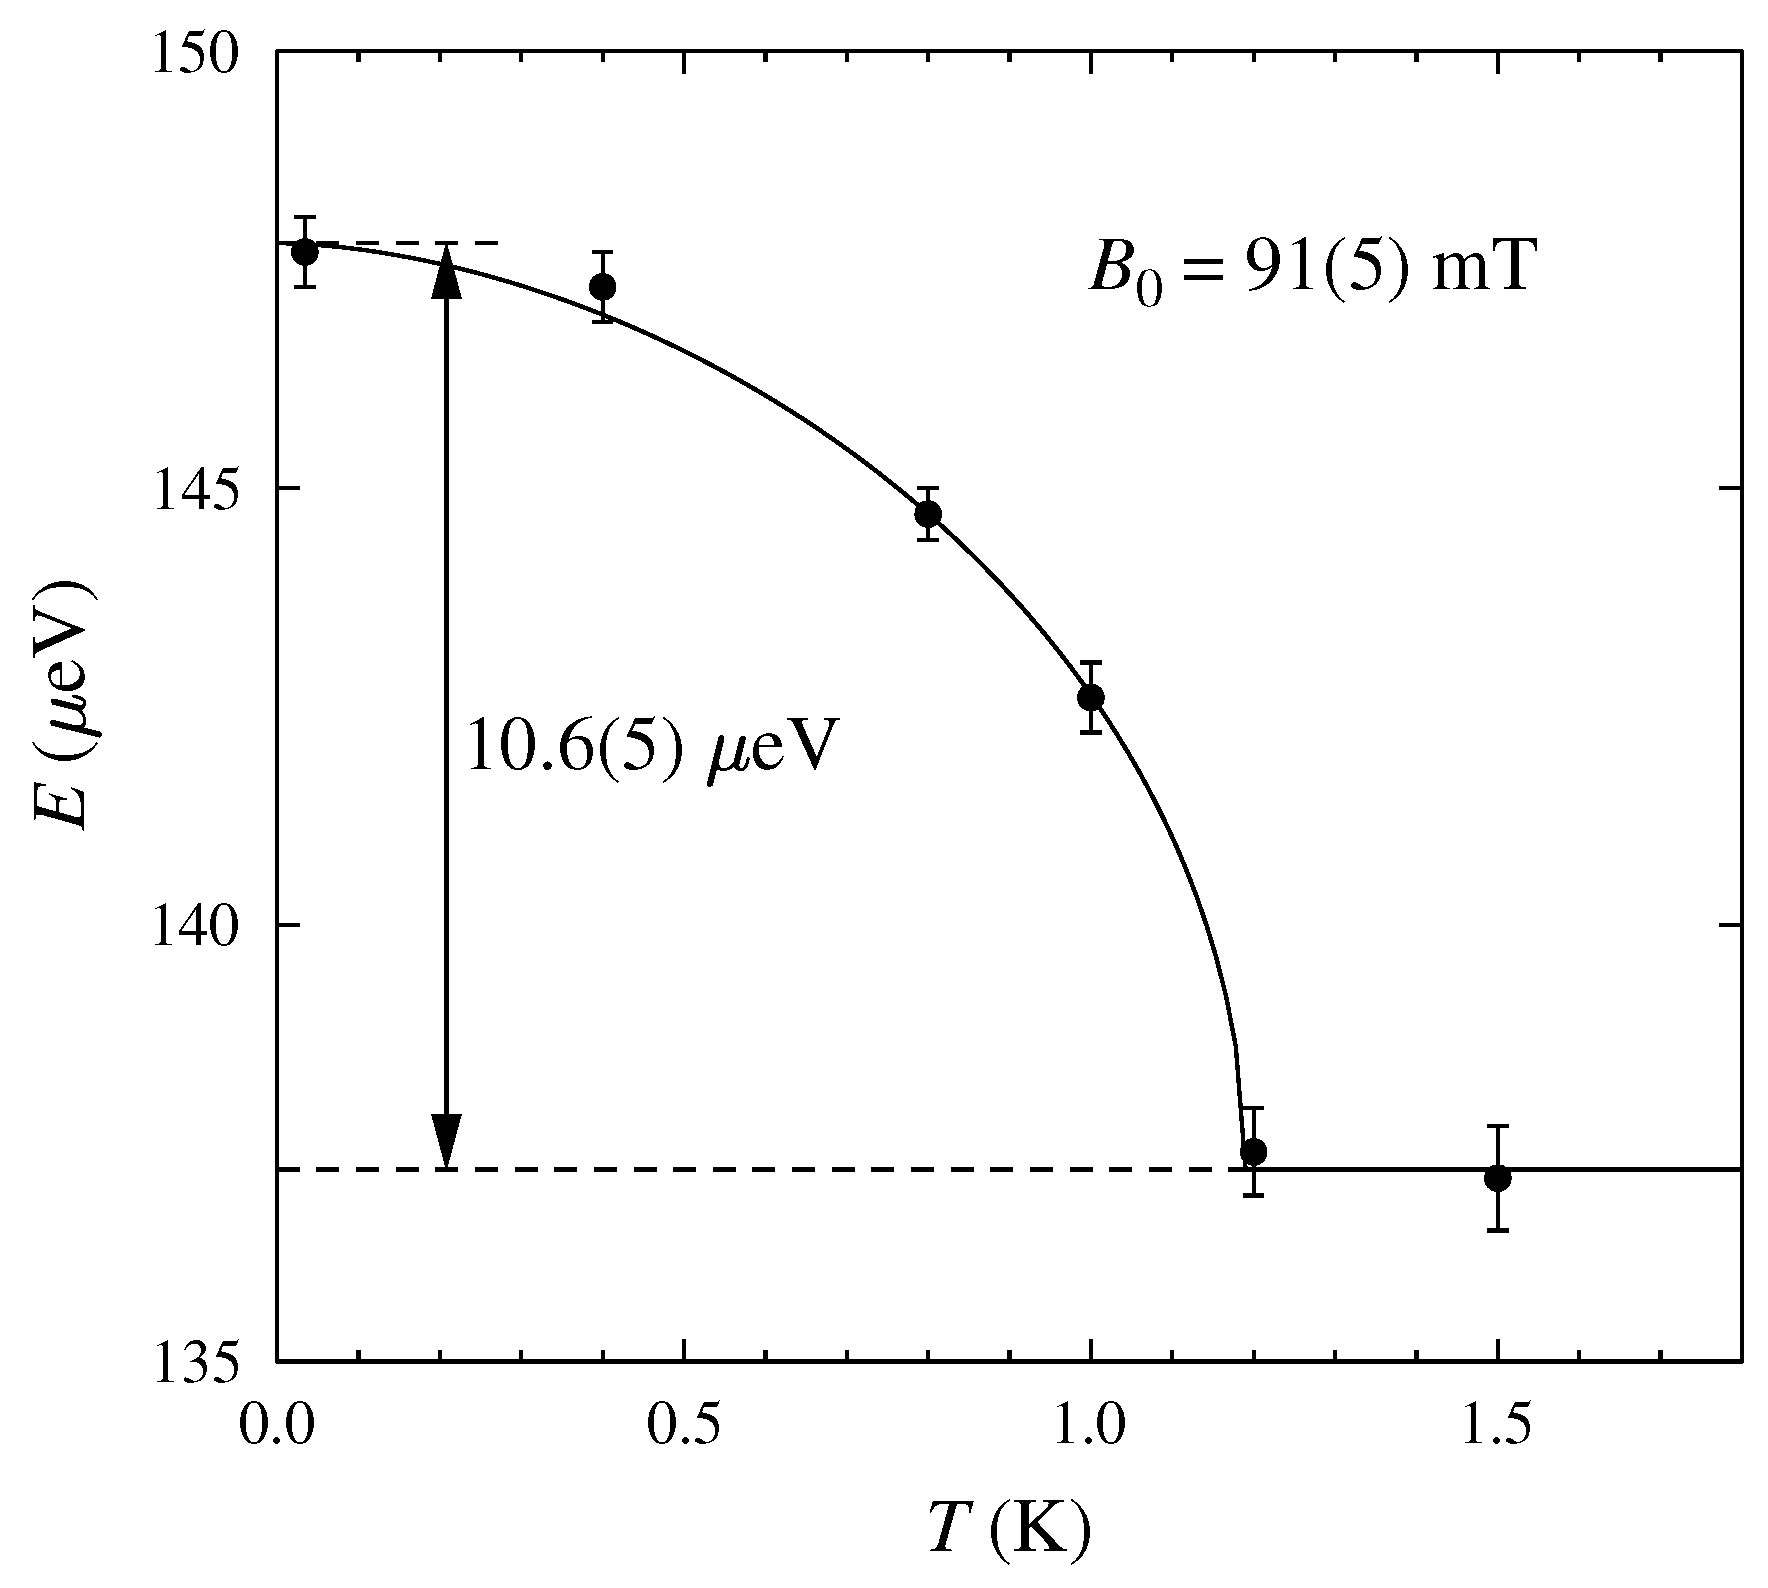
The temperature dependence of the position of the lowest energy transition is shown in Figure 3. The magnetic transition just below 1.2 K is clearly seen in this data as an upward shift in the excitation energy. This shift is due to the different splittings of the S z = 35/2 and S z = 33/2 levels in the effective internal field of the ordered state B 0 , which is obtained from the energy shift as
B 0 = Δ E g μ B .
The energy shift reflects intermolecular interactions that can have contributions from both dipolar and exchange mechanisms. Since the dipolar contribution can be determined exactly from knowledge of the spin structure, the measured value of B 0 allows the exchange contribution to be precisely quantified. This will be explored further in Section 4.

3.2.2. Low Temperature Excitation Spectrum

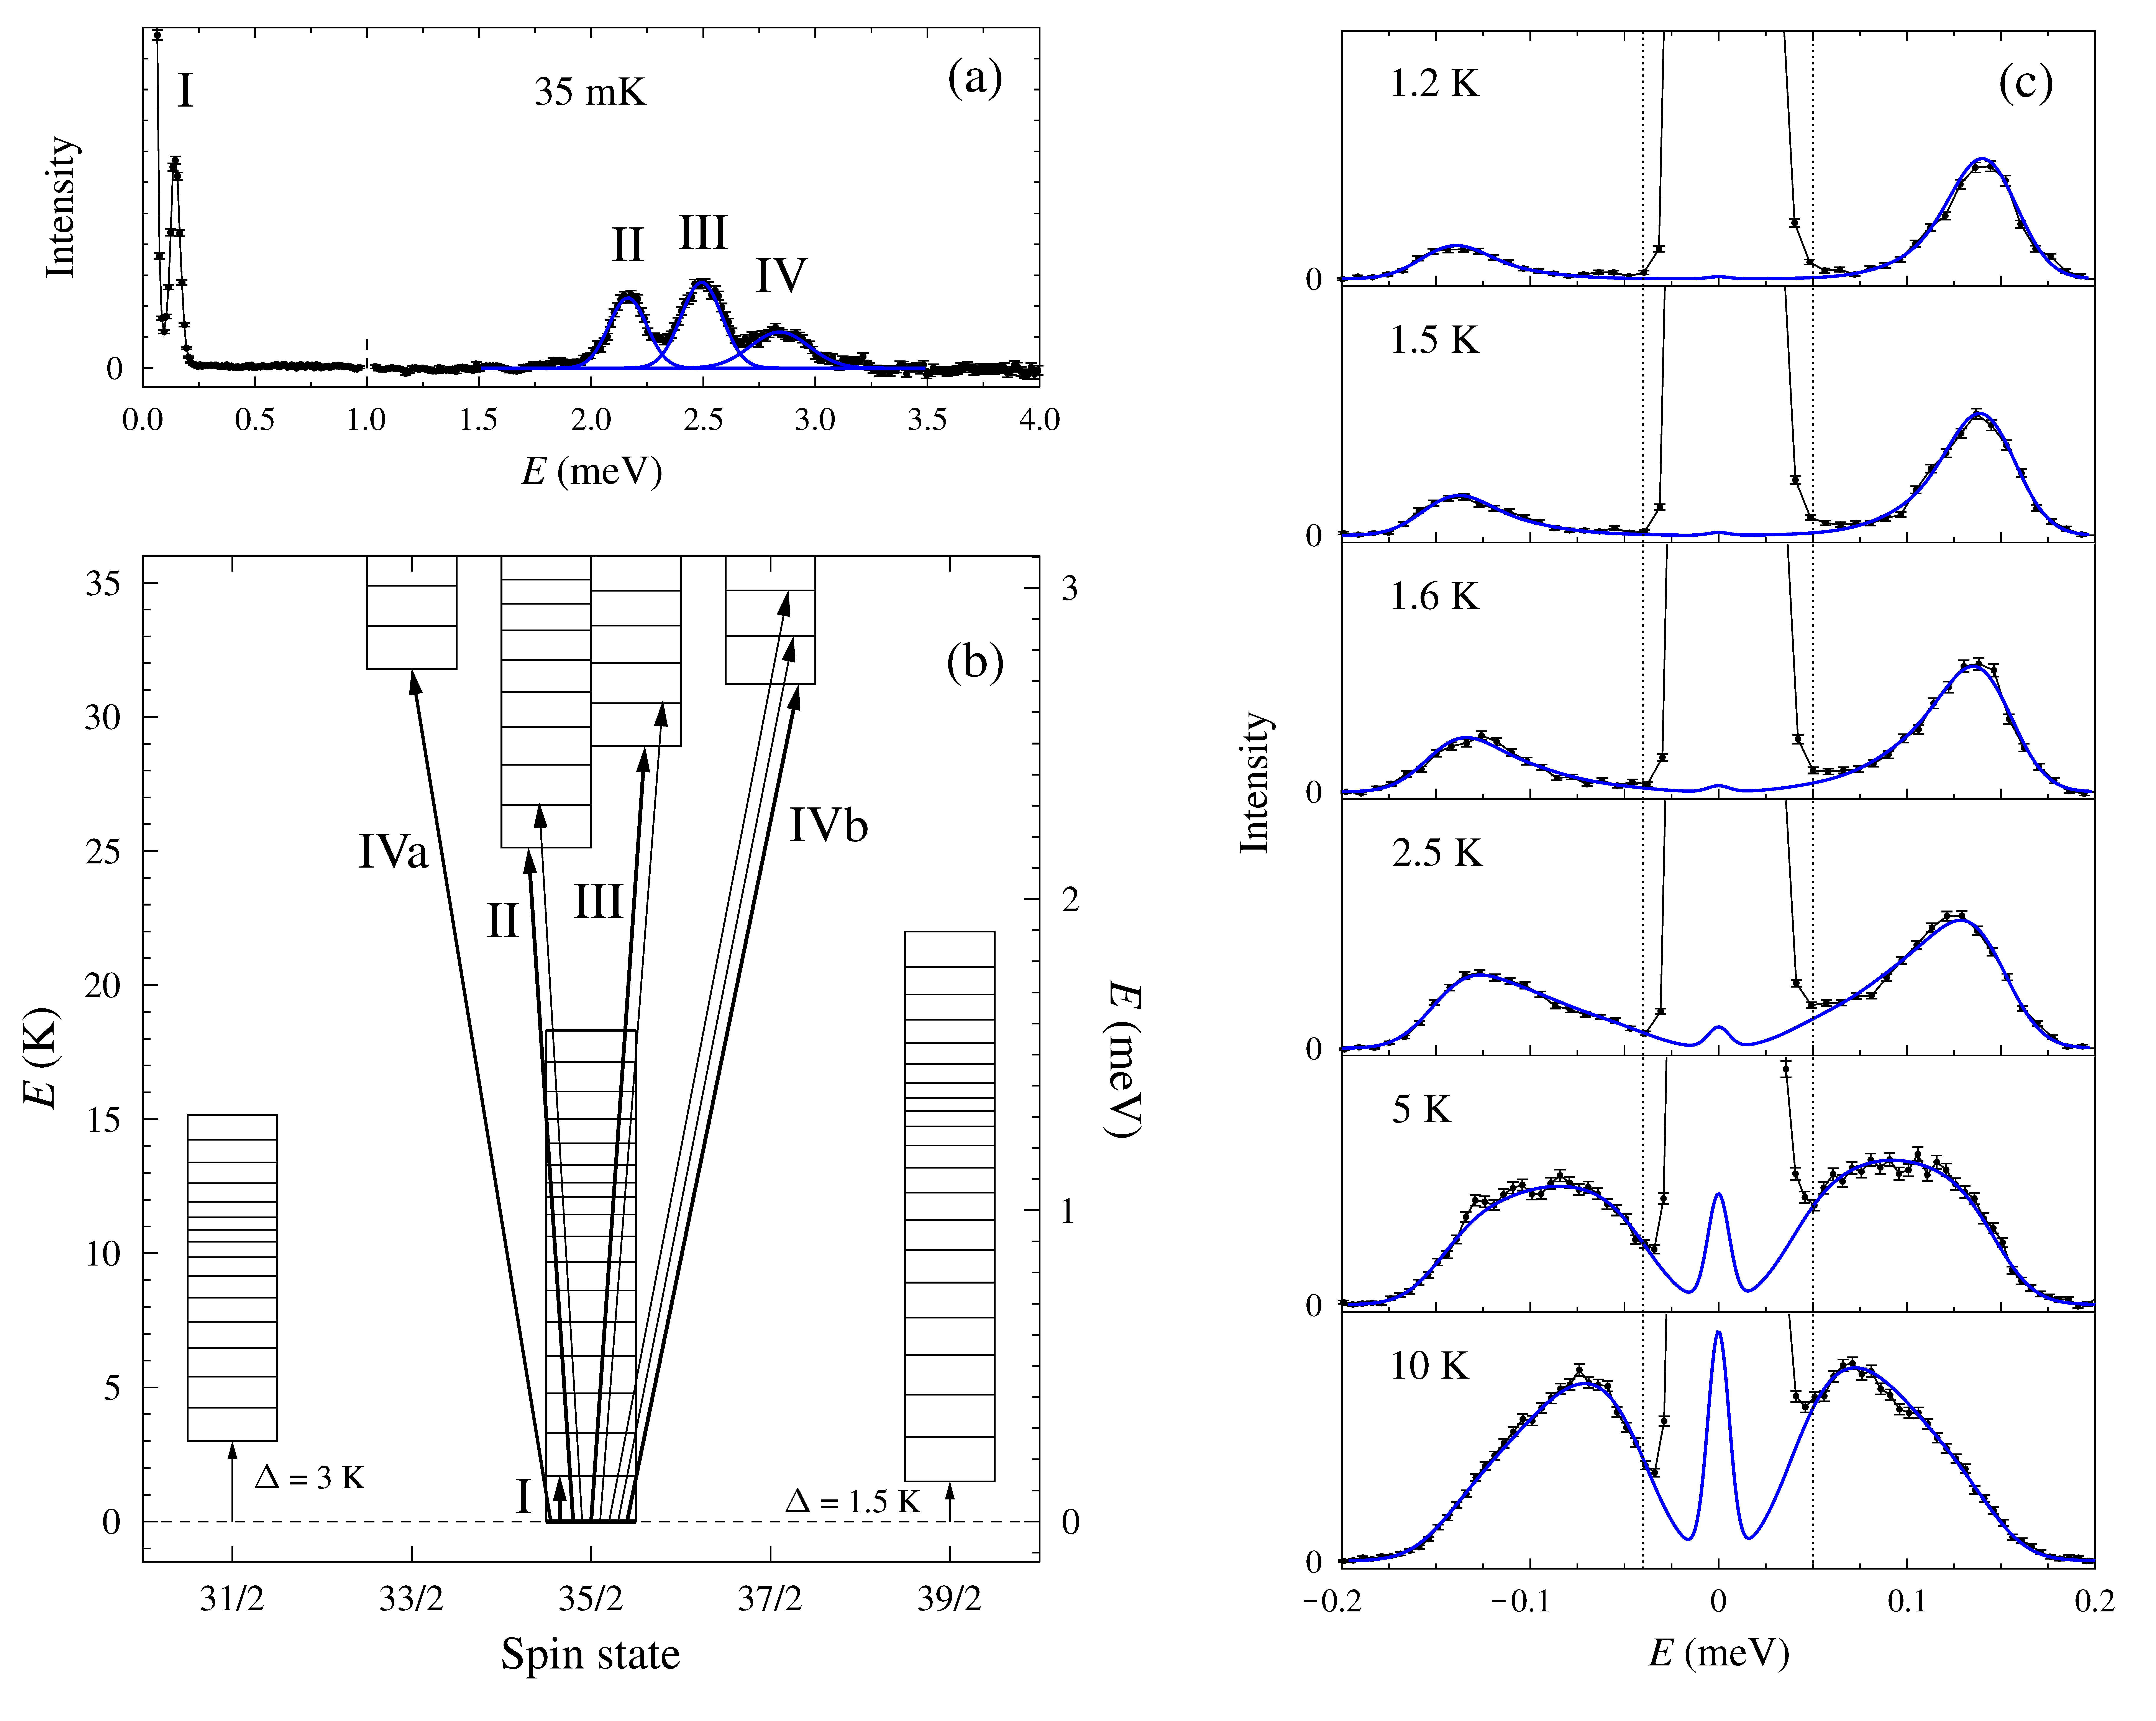
The excitation spectrum measured at a temperature of 35 mK is shown in Figure 4a. This plot combines data for E i = 2.00 meV and E i = 5.15 meV. At this low temperature, all of the excitations originate from the ground state. There are four excitation bands labelled I to IV in Figure 4a. Labelling the states as (S, S z ), band I is assigned to the transition from the (35/2, 35/2) ground state to the next level in the 35/2 spin state, i.e., (35/2, 33/2) (Figure 4b). Gaussian fits of bands II to IV are shown in Figure 4a, with the parameters listed in Table 4.
Consideration of the selection rules for allowed magnetic dipole transitions can assist in the assignment of these bands. These are Δ S = 0 ± 1 and Δ S z = 0 ± 1. Hence, a single transition is expected for Δ S = −1, whereas two closely spaced transitions would be expected for Δ S = 0 and three closely spaced transitions for Δ S = +1. The relative intensities within the sets of closely spaced transitions depend on matrix elements whose ratios within a given multiplet can be determined via the Wigner–Eckart theorem, leading to the following expression for the intensity
I ( Δ S , Δ S z ) 35 / 2 1 35 / 2 + Δ S 35 / 2 Δ S z 35 / 2 Δ S z 2 ,
where the six element array is the Wigner 3-j symbol. The relative intensity values are shown in Table 5, where it can be seen that the lowest energy transition within the set is always the strongest. The second transition, when allowed, is reduced from the first transition by a factor of S f and the third transition, when allowed, is smaller than the first transition by a factor of S f 2 . The transitions with high intensity according to Equation (6) and Table 5 are signified by the thicker lines in Figure 4b.
Since the fitted widths of the Gaussians are comparable for bands II and III and 50% larger for band IV, we take this as an indication of unresolved multiple transitions in band IV, leading to the assignments shown in Table 4 and Figure 4b with bands II and III corresponding to transitions to two S = 35/2 excited states and band IV corresponding to a superposition of two transitions having Δ S = ±1. In Figure 4b, we illustrate one possibility for band IV with transitions to S = 33/2 (IVa) and to S = 37/2 (IVb). The four states associated with bands II to IV span a region of 25 to 33 K above the ground state.
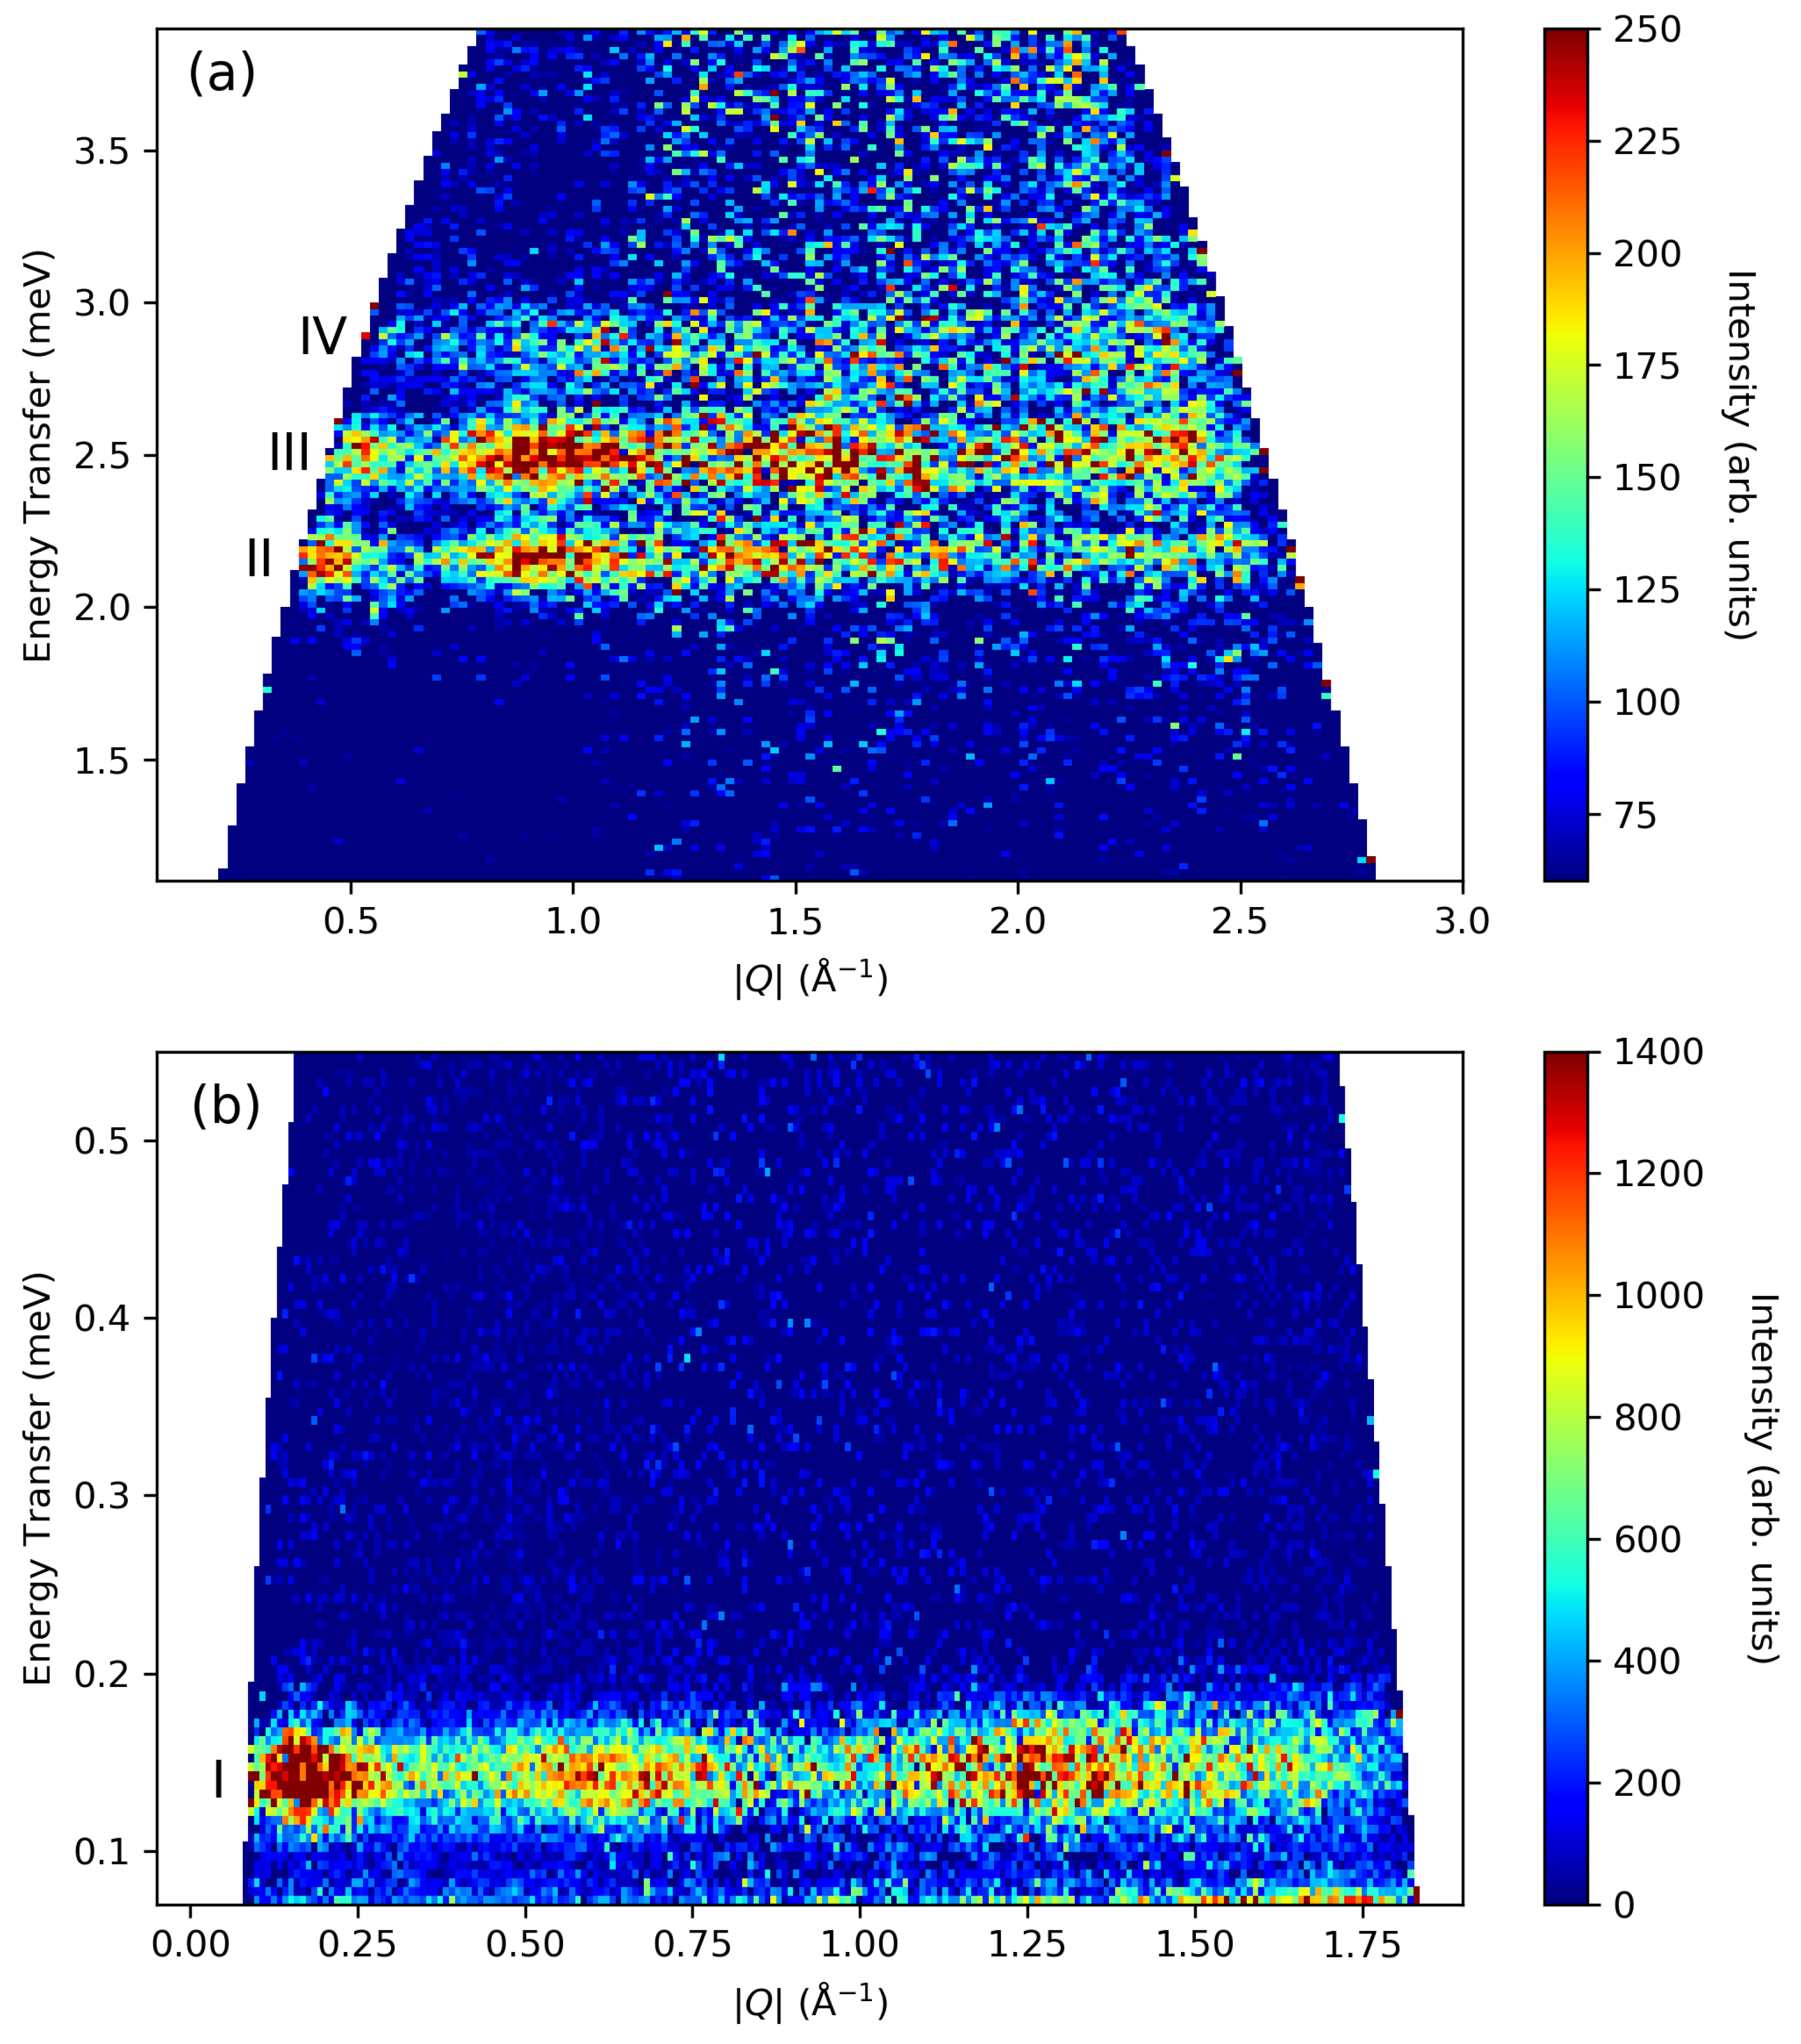
The Q dependence (Figure 5) provides further support for this assignment [24,25,26], with the intensities of bands II and III tracking each other and remaining large at low Q, consistent with Δ S = 0, whereas band IV is weaker at low Q, consistent with Δ S = ±1. We also considered whether bands II and III could be two transitions into a single S = 35/2 excited state; however, their separation would require the magnitude of the D parameter to be more than double that of the ground state, which we believe to be less likely than having two separate S = 35/2 excited states.

3.2.3. Low Lying Thermally Accessible Spin Excitations

An EPR study [13] suggested the presence of an excited spin state at 8 K rather than at 25 K; however, we observed here no direct transitions in the associated 0.7 meV spectral region (Figure 4a). A thermal population of low lying excited states will produce additional low energy transitions, which allows such states to be identified, even when direct transitions from the ground state are not allowed.
Further information is contained in the relative intensities of the transitions, which are determined by the matrix elements for magnetic dipole transitions under Equation (4). The temperature dependence of the spectra in the band I region are shown in Figure 4c. These spectra were analysed using the energy levels and matrix elements derived from Equation (4), taking into account the thermal occupancies of the levels given by
n S , S z = e β E S , S z S , S z e β E S , S z ,
where β = 1 / k B T . The relatively low anisotropy of the Fe 19 system prevents us from being able to resolve the individual transitions within a spin state multiplet in the way that was possible for previous inelastic neutron studies on systems with larger anisotropy, such as Fe 8 [27] and Mn 12 [28]. Nevertheless, the characteristic asymmetric shape of the broadened scattering profile still enables us to extract important parameters from the data.
A global fit of the spectra obtained between 1.2 and 10 K below 0.2 meV (Figure 4c) assigns the spectral features to the superposition of internal transitions within three spin states corresponding to the S = 35/2 ground state and two low lying states for which direct transitions from the S = 35/2 ground state are forbidden—namely S = 31/2 and S = 39/2. The spectral fits are shown as the blue curves in Figure 4c, and the parameters obtained from this analysis are shown in Table 6. The gaps obtained for these two states are 1.5 and 3 K, significantly lower than the 8 K gap to the S = 33/2 state suggested from the EPR data. The D parameter of the ground state at −51 mK is a little larger in magnitude than the value of −43 mK obtained from the EPR.
The E / | D | ratios here were found to be around 0.2, four times larger than the ratio of 0.05 that was suggested in the EPR study. The primary effect of a large E / | D | ratio is to increase the minimum level separation in the upper levels of the spin multiplet (Figure 4b). This shows up most clearly in the data as a relatively pronounced low energy cutoff for the 5 and 10 K spectra (Figure 4c). The value of χ 2 per degree of freedom for the global fit shown in Figure 4c is 1.65. If the excited states are not included at all, then the χ 2 value becomes increased by a factor of 8 compared to the two excited state fit. If only one excited state is included, then the χ 2 value increases by a factor of 1.5 compared to the two excited state fit.
Figure 4. (a) Inelastic spectra measured on LET at 35 mK. Data below 1 meV are for incident energy E i = 2.00 meV and data above 1 meV are for E i = 5.15 meV (with a linear background subtracted). Gaussian fits to bands II to IV are indicated, with fit parameters given in Table 4. (b) The assignment of band I is the lowest Δ S = 0 transition of the S = 35/2 multiplet. Bands II to IV are due to magnetic-dipole-allowed transitions with Δ S = 0, +1, or −1. On the basis of width, amplitude, and Q dependence, bands II and III are assigned to two distinct S = 35/2 excited states and band IV to unresolved transitions into excited states with Δ S = ±1. One possibility is shown here for band IV with transitions to the S = 33/2 and S = 37/2 states. (c) The temperature dependence of the low energy spectral region allows two low lying excited spin states to be identified. The blue lines show the fitted thermal dependence that is well described by three spin states, with the corresponding fit parameters given in Table 6.
Magnetochemistry 07 00074 g004
Figure 5. The Q dependence of the scattering intensity measured at 35 mK with an incident neutron energy of (a) 5.15 meV, showing bands II, III, and IV, and (b) 2.00 meV, showing band I.
Magnetochemistry 07 00074 g005

4. Discussion

Having established the key properties of the Fe 19 system, namely the mode of ordering, the easy spin axis, the internal field in the ordered state, the ground state, and the spectrum of excited spin states, we are now in a good position to assess the intermolecular magnetic interactions leading to the magnetic ordering. In particular, we can determine the relative importance of dipolar and superexchange interactions for this high spin system.

Dipolar Interactions versus Superexchange

The relative stabilities of different modes of magnetic ordering originating from only dipolar interactions are compared in Table 2. For an easy spin axis in the Fe1–Fe2 direction, the ordering mode with wave vector (0 0 0.5) would be expected for a transition driven purely by dipolar interactions [16]. The observation of the (0.5 0 0.5) ordering mode in this study however rules out that scenario, and the easy axis orientation was also found to be different. For the newly found easy axis, ferromagnetic ordering is the most stable dipolar driven mode (assuming a spherical sample) and the (0.5 0.5 0.5) mode is the most stable AF state (Table 2). The observed (0.5 0 0.5) mode is unstable for the revised easy axis with dipolar interactions alone. This points clearly towards the presence of significant AF superexchange interactions between the molecules.
To assess which interaction paths are the most likely to contribute, we identified the shortest Fe–Fe distances between adjacent molecules, and the six closest interactions are listed in Table 7. These are in a range from just below 9 Å to around 10 Å. The magnitude of the coupling will ultimately depend on the detailed electronic structure of the exchange path; however, the weakest link is most likely to be the hydrogen bond within the exchange path.
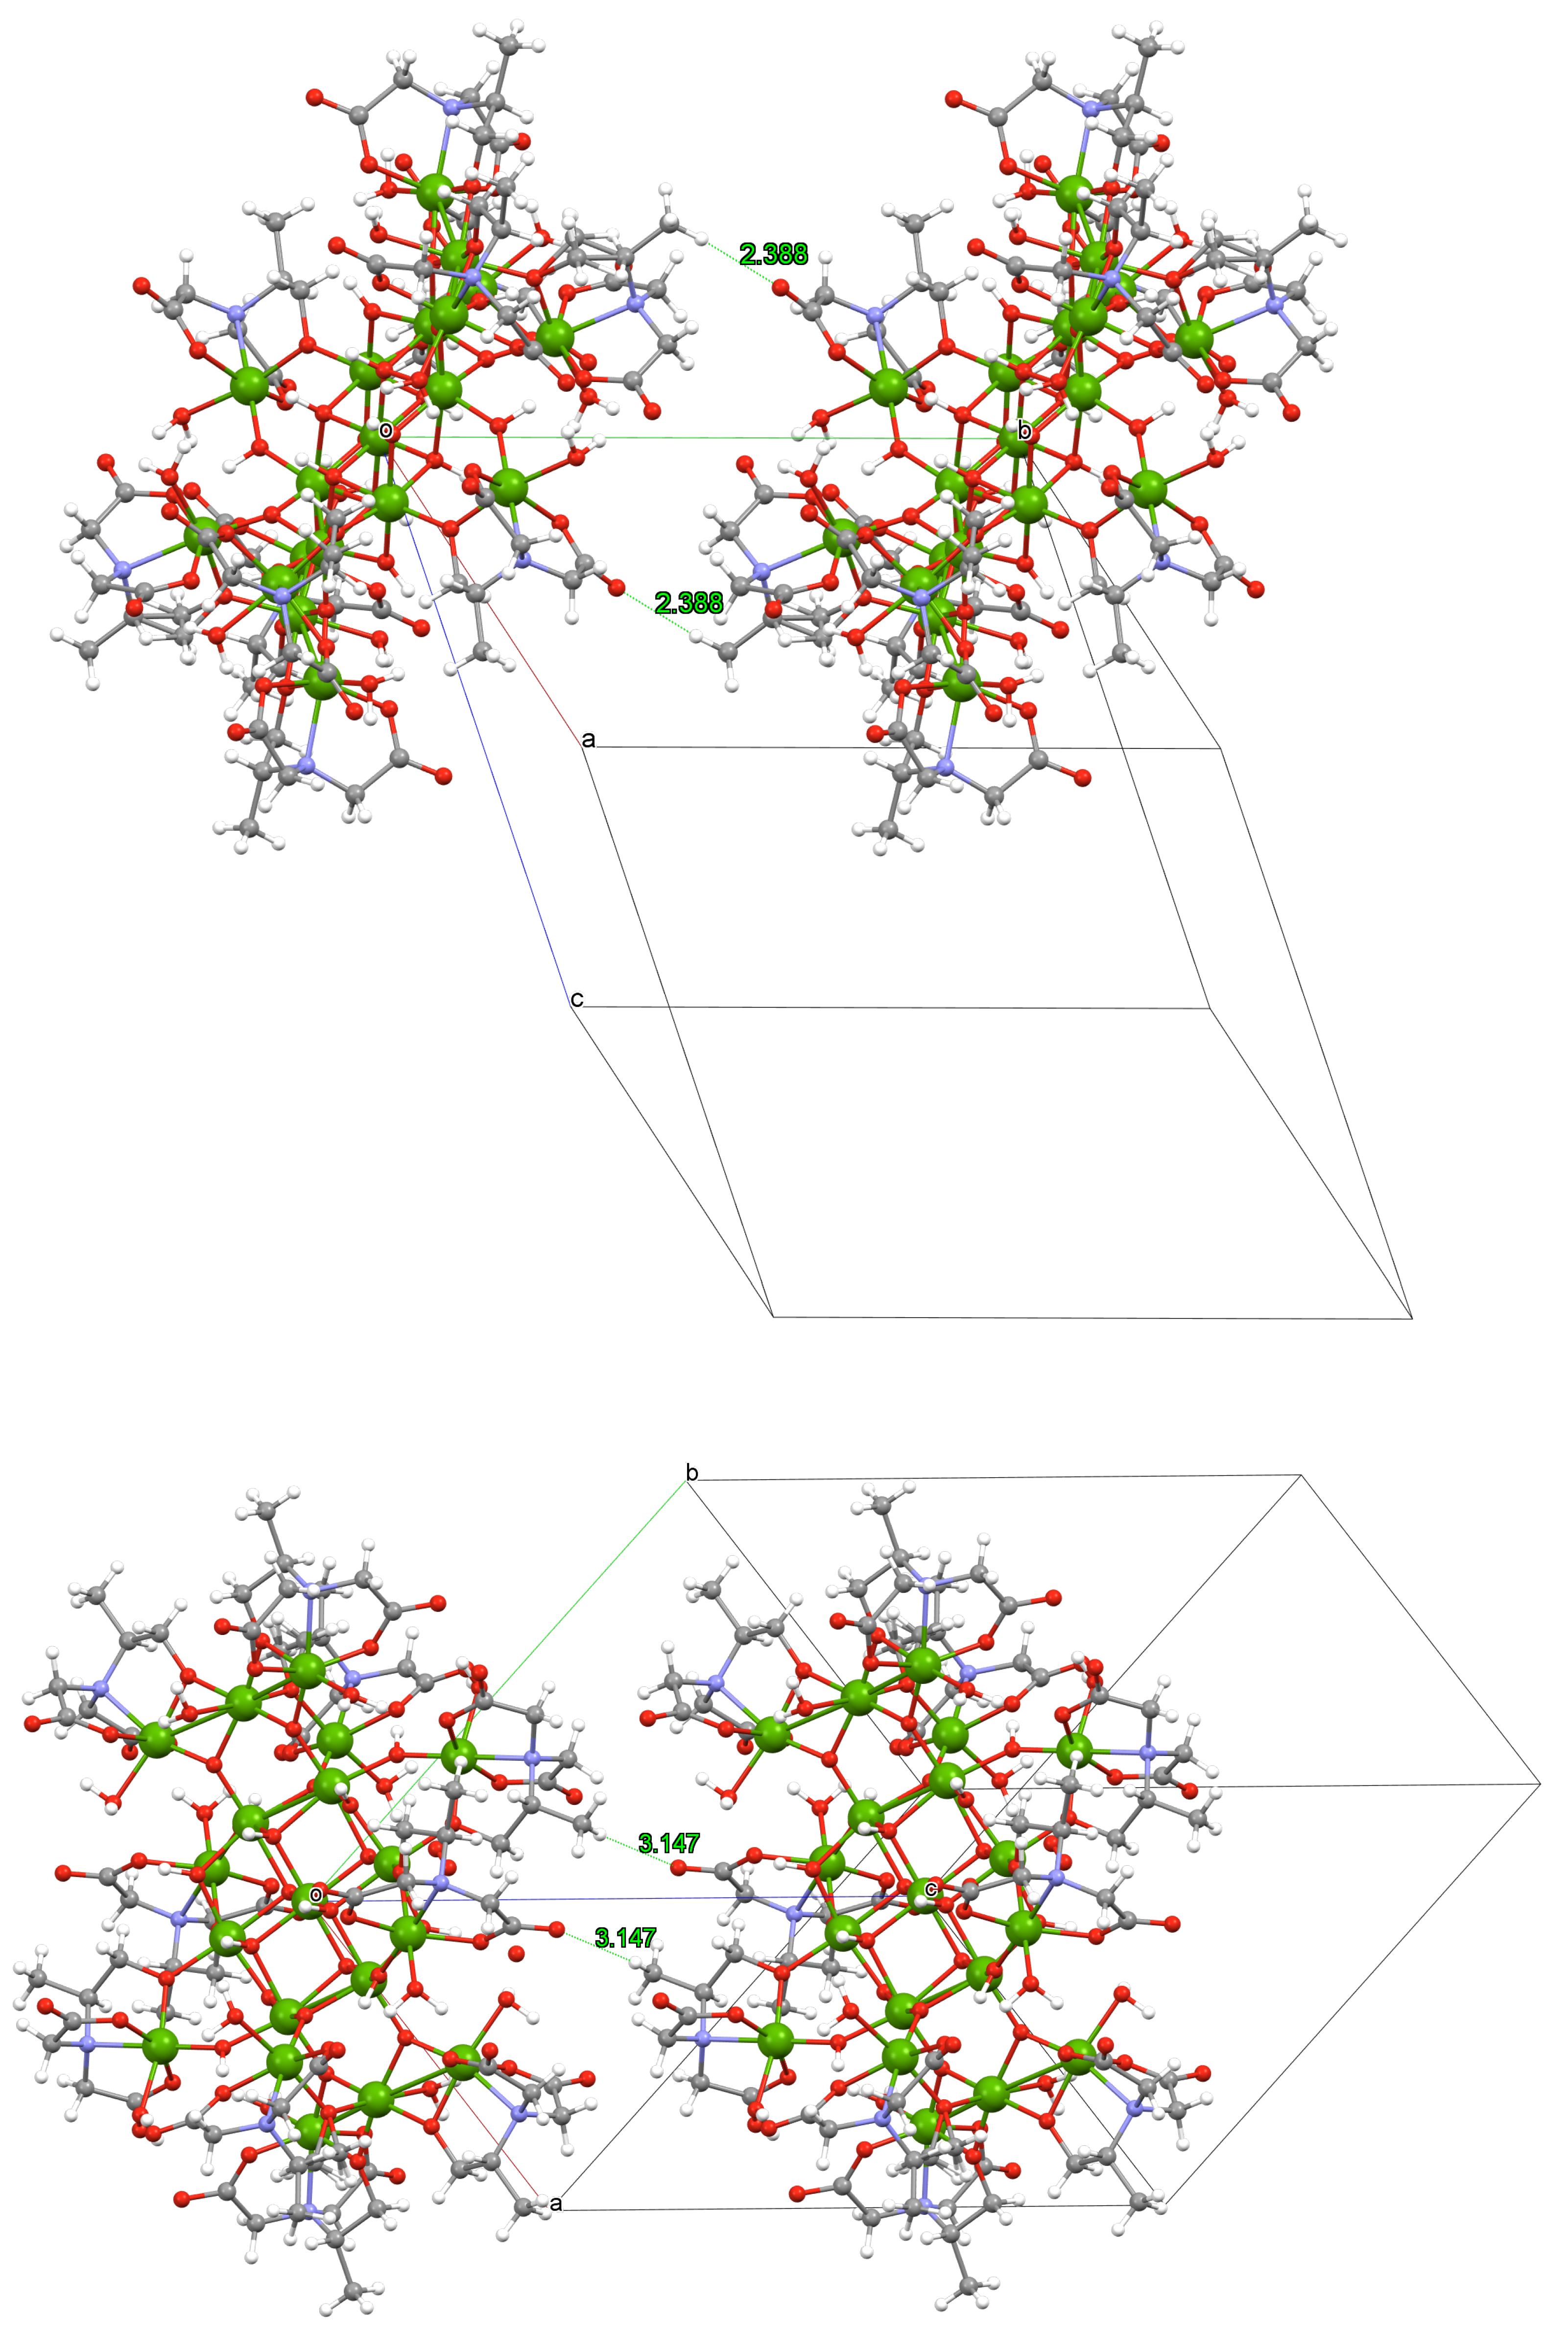
The shortest length for these direct intermolecular hydrogen bonds is given in the final column of Table 7, and these links are illustrated in Figure 6 for the b and c axes. From this, it can be seen that the c axis interaction is expected to be the weakest. In order to estimate the strength of the exchange interactions in relation to the dipolar coupling, we used a simple empirical method. This involves tuning the interactions to match the three experimental characteristics that we obtained, namely the internal field, the mode of ordering, and the transition temperature.
As a starting point, we consider the five interactions with an overall Fe–Fe distance around 9 Å or less (Table 7) and set them all to the same value of AF exchange coupling. The scaling factor of the coupling J 0 is then tuned so that the B 0 value of the internal field from the sum of the dipolar field in the easy axis direction and the exchange field matches the experimental value.
When this initial uniform exchange coupling model is used, we confirmed that the magnetic ordering mode (0.5 0 0.5) was the most stable. The ordering temperature with this set of interactions was then estimated from a Monte Carlo simulation (see the fifth column in Table 8). The T N found in this case at 2.7 K was more than two times larger than that observed experimentally. A high ratio of T N to the characteristic coupling energy was found when the network of interactions had a three dimensional nature. The lower experimental value for this ratio for Fe 19 , therefore, suggests that the interactions are actually weaker in at least one of the crystal axes.
As noted earlier, the direct H-bonded coupling along the c axis is particularly weak, and Appendix A shows that the indirect coupling via lattice water was also absent for the c axis. Consequently, we explore the effect of reducing the exchange interactions for directions involving the c axis in the second and third rows of Table 8. Reducing the interactions in both the c and b c directions by a factor of four is seen to bring T N much closer to the experimental value; however, this also has the effect of making the (0.5 0.5 0.5) mode more stable than the (0.5 0 0.5) mode. By making J c slightly smaller than J b - c , the experimentally observed ordering mode of (0.5 0 0.5) is however restored (fourth row in Table 8). An additional relative strengthening of J b and J a - b versus J a brings T N down to the experimental value of 1.2 K (last row in Table 8).
Bearing in mind the large parameter space for the set of exchange couplings, the final parameters in Table 8 are not expected to be unique, but they provide a representative set that is consistent with the experimental data and they serve to give a good estimate of the order of magnitude of the exchange coupling in this system. The final result is that the stabilising contribution of the exchange terms to the magnetic energy was found to be eight-times larger in magnitude compared with the destabilising term from the dipolar coupling.

5. Conclusions

Finding two spin states that are 1.5 and 3 K above the ground state energy is an important result of this study. The presence of such low lying states was suspected in previous studies, and their existence has complicated the interpretation of previous data on this system, leading to inconsistent conclusions from different studies that were measured with different techniques and at different temperatures. The present results should enable some clarification and reinterpretation of the properties of Fe 19 .
Whilst the high spin value of Fe 19 originally suggested that it was a strong candidate for having its AF ordering below 1.2 K driven by dipolar interactions, the present results clearly show that the magnetic ordering is primarily due to intermolecular exchange interactions on the order of 5 mK. These exchange interactions between neighbouring molecules operate via superexchange paths operating through ligands and hydrogen bonds. The hydrogen bonds reflect both direct intermolecular contacts and also lattice water mediated paths. The dipolar interactions in this case act to destabilise the ordering, and the magnitude of the dipolar energy is smaller than the magnitude of the exchange energy by around a factor of eight.
When considering the use of SMMs for quantum information processing, weak intermolecular interactions contribute to decoherence. The results of this study show that the exchange contribution to the intermolecular interaction can be surprisingly robust in this type of system even when the magnetic atoms of different molecules are well separated in the crystal structure by bulky spacer ligands and water molecules.
The present study also demonstrates that low temperature neutron scattering studies of high spin molecular systems provide a unique opportunity to study very weak residual superexchange interactions that can act over distances of order 10 Å. A better understanding of the subtleties of interactions in such molecule based system can be obtained via long range magnetic ordering. This understanding may also allow us to steer the organisation of molecular magnets into arrays that have sufficiently weak coupling to allow information processing.

Author Contributions

Sample preparation and characterisation J.T., C.E.A., and A.K.P.; neutron measurements and analysis F.L.P., T.G., and P.M.; writing—original draft preparation, F.L.P.; writing—review and editing, F.L.P., T.G., P.M., J.T., C.E.A., S.J.B. and A.K.P. All authors have read and agreed to the published version of the manuscript.

Funding

This research was supported by STFC via beam time allocations at the ISIS Neutron and Muon Source.

Institutional Review Board Statement

Not applicable.

Informed Consent Statement

Not applicable.

Data Availability Statement

Neutron diffraction data from the WISH instrument is available from https://doi.org/10.5286/ISIS.E.RB1510283 (accessed on 20 May 2021). Inelastic neutron data from the LET instrument is available from https://doi.org/10.5286/ISIS.E.RB1620177 (accessed on 20 May 2021).

Acknowledgments

We dedicate this paper to the memory of Peter Day, who was an early advocate of using neutrons to learn about molecular magnets and a great supporter of collaboration between physicists and chemists.

Conflicts of Interest

The authors declare no conflict of interest.

Abbreviations

The following abbreviations are used in this manuscript:
SMMSingle molecule magnet
AFAntiferromagnetic
EPRElectron paramagnetic resonance
μ SRMuon spin rotation
NMRNuclear magnetic resonance

Appendix A. Hydrogen-Bonded Exchange Network through the Lattice Water Sites

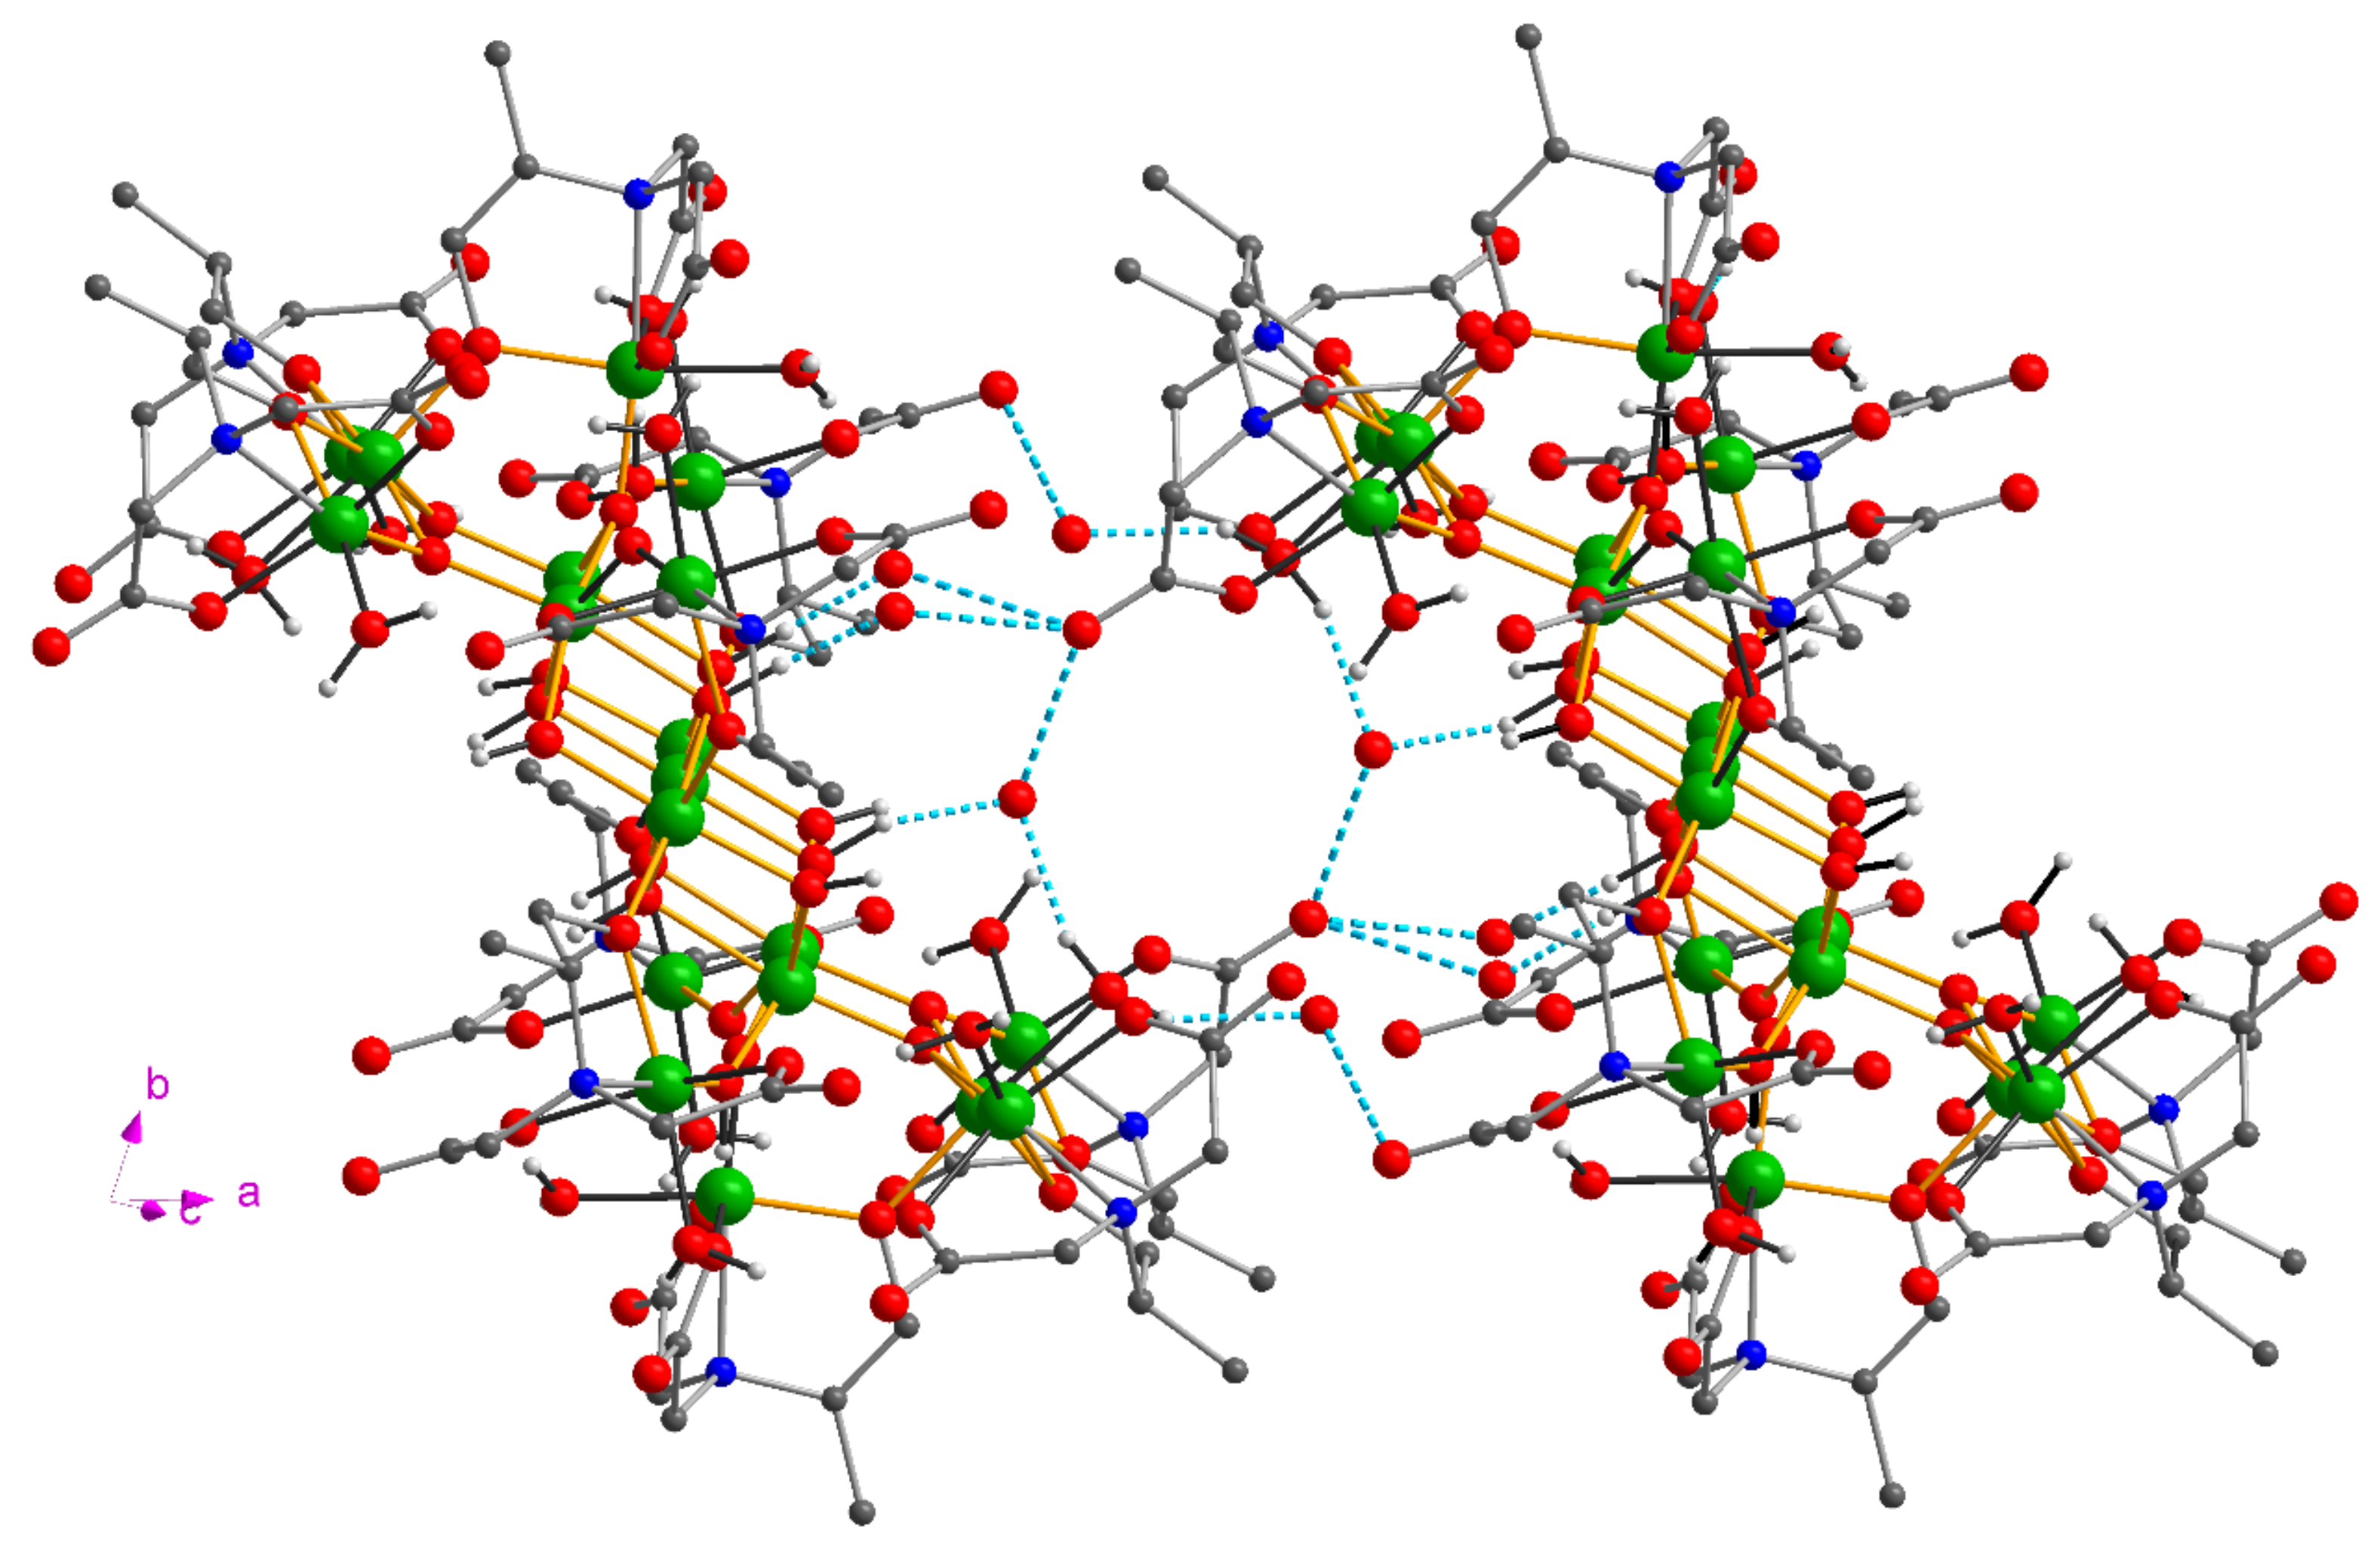
A likely scenario to consider is that AF intercluster interactions could be mediated by hydrogen bonding involving lattice water. Although each Fe 19 cluster has several nearest neighbours in the crystal lattice, we are concerned here with those neighbours to which there is a clear pathway that can mediate such interactions. Inspection of the crystal structure shows that the shortest hydrogen-bonded pathways are of the types Fe 3 ( μ 3 –OH)···OH 2 ···O carb or Fe–OH 2 ···OH 2 ···O carb , in which either a triply-bridging hydroxo or a singly-bound aquo ligand makes a hydrogen bond to a lattice water, which, in turn, makes a further hydrogen bond to the outer oxygen (O carb ) of a carboxylate group coordinated to an iron centre in an adjacent cluster.
Three such pathways were identified. The first of these links a cluster with its symmetry equivalent at {1 + x, y, z} corresponding to an interaction in the a-direction (Figure A1). The three ( μ 3 –OH) ligands on one face of the disc each make hydrogen bonds to one lattice water, and each of these forms a hydrogen bond to the same outer carboxylate oxygen on the next molecule. A further such system of hydrogen bonds, related to the first by inversion, links the two clusters to two further clusters in the opposite direction along a with the overall effect being to link cluster molecules into chains running parallel to the a direction through the crystal.
Figure A1. Intercluster hydrogen-bonding (shown as light blue dashed lines) between the Fe 19 cluster and its symmetry-equivalent at {x + 1, y, z}. Note that H-atoms on the lattice waters were not located in the structural determination.
Magnetochemistry 07 00074 g0a1
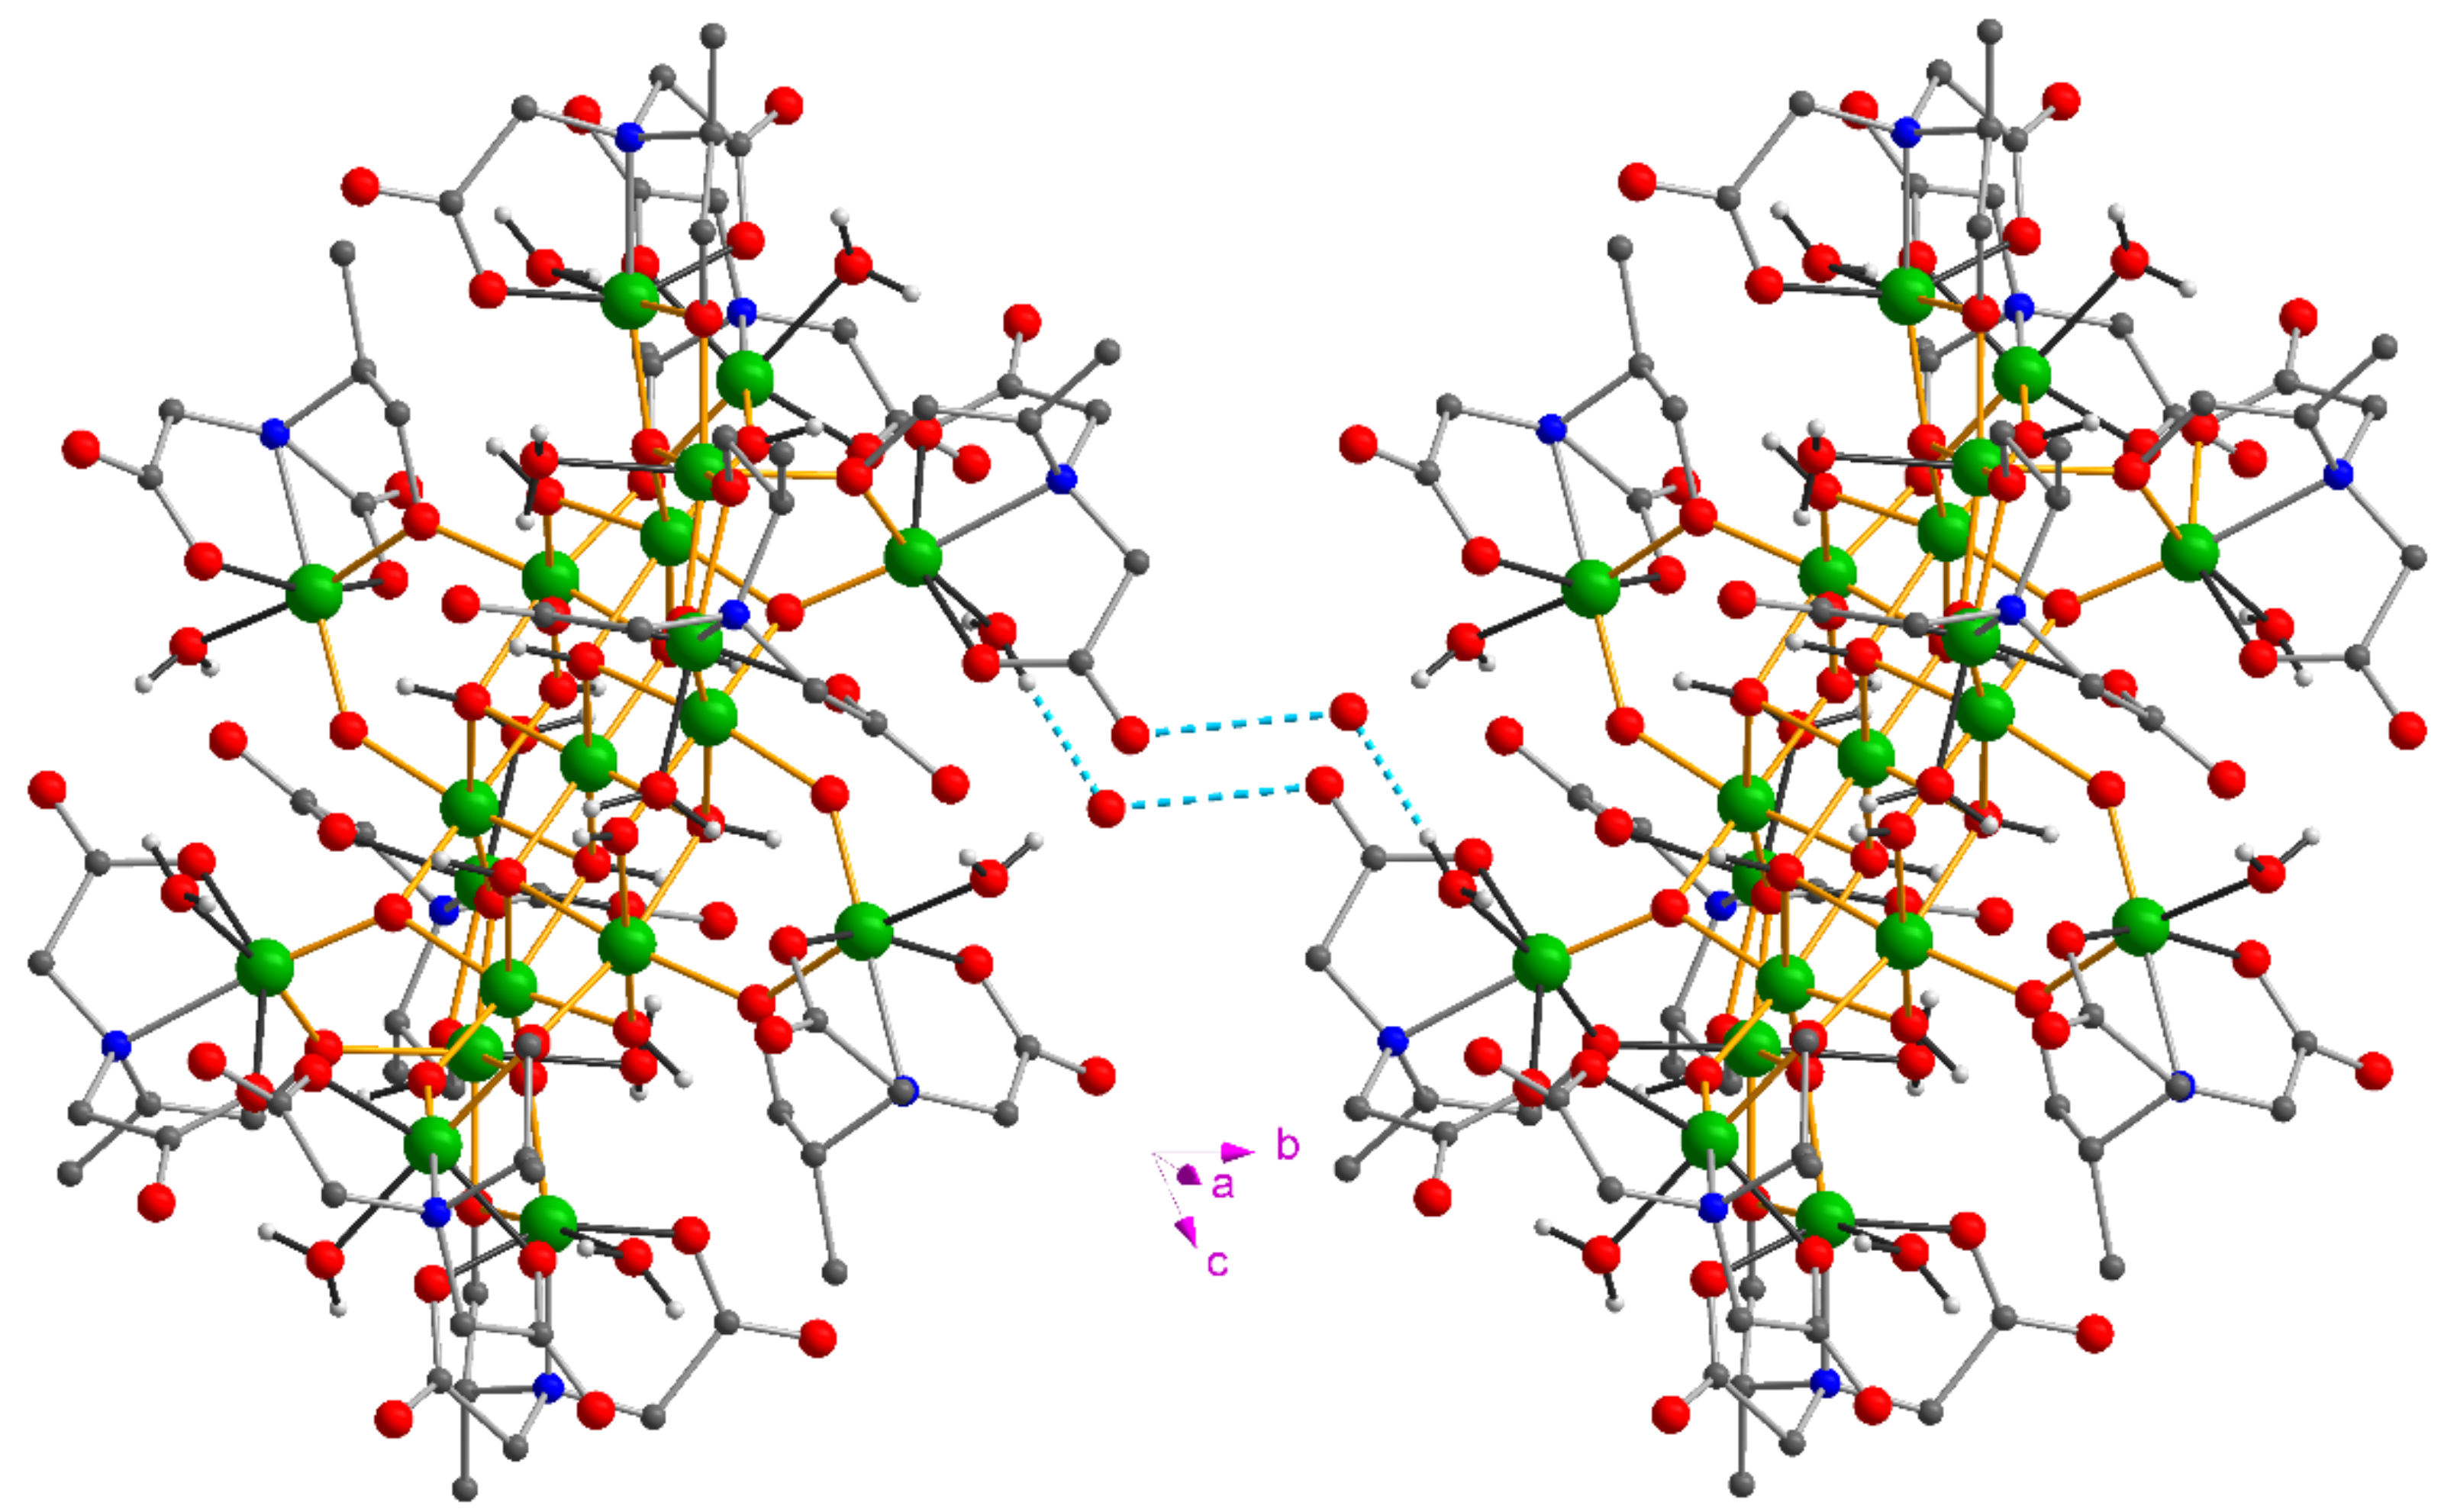
Two further pathways involve aquo ligands. The pathway between a cluster and its neighbour at {x, y + 1, z}, mediating interactions in the b direction, is much simpler than the a-axis case; two inversion-related lattice waters each accept a hydrogen bond from an aquo ligand while making a further hydrogen bond to a carboxylate oxygen of the adjacent cluster (Figure A2).
Figure A2. Intercluster hydrogen-bonding (shown as light blue dashed lines) between the Fe 19 cluster and its symmetry-equivalent at {x, y + 1, z}.
Magnetochemistry 07 00074 g0a2
The interaction between a cluster and its equivalent at {x + 1, y, z − 1}, corresponding to the vector a - c , is also simple (Figure A3), with two inversion-related lattice waters each forming hydrogen bonds to carboxylate oxygens from adjacent clusters. The relative magnitudes of the AF superexchange interactions mediated by these three pathways are, thus, expected to be J a J b > J a - c .
Figure A3. Intercluster hydrogen-bonding (shown as light blue dashed lines) between the Fe 19 cluster and its symmetry-equivalent at {x + 1, y, z − 1}.
Magnetochemistry 07 00074 g0a3
The simple picture that is explored here of lattice water paths dominating the intermolecular exchange is not, however, consistent with the observed ordering. The strong AF interactions along the a direction, when taken in combination with the dipolar coupling, stabilise the (0.5 0.5 0.5) mode of ordering rather than the observed (0.5 0 0.5) mode. Introducing the weaker lattice-water-mediated interactions along the b and a-c directions further stabilises the (0.5 0.5 0.5) mode against the actual (0.5 0 0.5) mode. We, therefore, conclude that additional direct intermolecular interactions that do not involve the lattice water also provide a significant contribution to the exchange couplings.

References

  1. Gatteschi, D.; Sessoli, R.; Villain, J. Molecular Nanomagnets; Oxford University Press: New York, NY, USA, 2006. [Google Scholar]
  2. Blundell, S.J.; Pratt, F.L. Organic and molecular magnets. J. Phys. Condens. Matter 2004, 16, R771–R828. [Google Scholar] [CrossRef]
  3. Sessoli, R.; Gatteschi, D.; Caneschi, A.; Novak, M.A. Magnetic bistability in a metal-ion cluster. Nature 1993, 365, 141–143. [Google Scholar] [CrossRef]
  4. Milios, C.J.; Vinslava, A.; Wernsdorfer, W.; Moggach, S.; Parsons, S.; Perlepes, S.P.; Christou, G.; Brechin, E.K. A Record Anisotropy Barrier for a Single-Molecule Magnet. J. Am. Chem. Soc. 2007, 129, 2754–2755. [Google Scholar] [CrossRef]
  5. Moushi, E.E.; Stamatatos, T.C.; Wernsdorfer, W.; Nastopoulos, V.; Christou, G.; Tasiopoulos, A.J. A Mn17 Octahedron with a Giant Ground-State Spin: Occurrence in Discrete Form and as Multidimensional Coordination Polymers. Inorg. Chem. 2009, 48, 5049–5051. [Google Scholar] [CrossRef]
  6. Mishra, A.; Wernsdorfer, W.; Abboud, K.A.; Christou, G. Initial Observation of Magnetization Hysteresis and Quantum Tunneling in Mixed Manganese-Lanthanide Single-Molecule Magnets. J. Am. Chem. Soc. 2004, 126, 15648–15649. [Google Scholar] [CrossRef]
  7. Ghulam Abbas, G.; Lan, Y.; Mereacre, V.; Wernsdorfer, W.; Clerac, R.; Buth, G.; Sougrati, M.T.; Grandjean, F.; Long, G.J.; Anson, C.E.; et al. Magnetic and 57Fe Mössbauer Study of the Single Molecule Magnet Behavior of a Dy3Fe7 Coordination Cluster. Inorg. Chem. 2009, 48, 9345–9355. [Google Scholar] [CrossRef]
  8. Wedge, C.J.; Timco, G.A.; Spielberg, E.T.; George, R.E.; Tuna, F.; Rigby, S.; McInnes, E.J.L.; Winpenny, R.E.P.; Blundell, S.J.; Ardavan, A. Chemical engineering of molecular qubits. Phys. Rev. Lett. 2012, 108, 107204. [Google Scholar] [CrossRef] [PubMed]
  9. Morello, A.; Mettes, F.L.; Luis, F.; Fernández, F.J.; Krzystek, J.; Aromí, G.; Christou, G.; de Jongh, L.J. Long-range dipolar ferromagnetic ordering of high-spin molecular clusters. Phys. Rev. Lett. 2003, 90, 017206. [Google Scholar] [CrossRef] [PubMed] [Green Version]
  10. Burzuri, E.; Luis, F.; Barbara, B.; Ballou, R.; Ressouche, E.; Montero, O.; Campo, J.; Maegawa, S. Magnetic dipolar ordering and quantum phase transition in an Fe8 molecular magnet. Phys. Rev. Lett. 2011, 107, 097203. [Google Scholar] [CrossRef] [PubMed] [Green Version]
  11. Goodwin, J.C.; Sessoli, R.; Gatteschi, D.; Wernsdorfer, W.; Powell, A.K.; Heath, S.L. Towards nanostructured arrays of single molecule magnets: New Fe19 oxyhydroxide clusters displaying high ground state spins and hysteresis. J. Chem. Soc. Dalton Trans. 2020, 1835–1840. [Google Scholar] [CrossRef]
  12. Ruiz, E.; Rodríguez-Forte, A.; Cano, J.; Alvarez, S. Theoretical study of exchange coupling constants in an Fe19 complex. J. Phys. Chem. Sol. 2004, 65, 799–803. [Google Scholar] [CrossRef]
  13. Castelli, L.; Fittipaldi, M.; Powell, A.K.; Gatteschi, D.; Sorace, L. Single crystal EPR study at 95 GHz of a large Fe based molecular nanomagnet: Toward the structuring of magnetic nanoparticle properties. Dalton Trans. 2011, 40, 8145–8155. [Google Scholar] [CrossRef] [PubMed]
  14. Affronte, M.; Lasjaunias, J.C.; Wernsdorfer, W.; Sessoli, R.; Gatteschi, D.; Heath, S.L.; Fort, A.; Rettori, A. Magnetic ordering in a high-spin Fe19 molecular nanomagnet. Phys. Rev. B 2002, 66, 064408. [Google Scholar] [CrossRef]
  15. Affronte, M.; Sessoli, R.; Gatteschi, D.; Wernsdorfer, W.; Lasjaunias, J.C.; Heath, S.L.; Powell, A.K.; Fort, A.; Rettori, A. Effects of intercluster coupling in high spin molecular magnets. J. Phys. Chem. Sol. 2004, 65, 745–748. [Google Scholar] [CrossRef]
  16. Pratt, F.L.; Micotti, E.; Carretta, P.; Lascialfari, A.; Arosio, P.; Lancaster, T.; Blundell, S.J.; Powell, A.K. Dipolar ordering in a molecular nanomagnet detected using muon spin relaxation. Phys. Rev. B 2014, 89, 144420. [Google Scholar] [CrossRef] [Green Version]
  17. Belesi, M.; Borsa, F.; Powell, A.K. Evidence for spin-wave excitations in the long-range magnetically ordered state of a Fe19 molecular crystal from proton NMR. Phys. Rev. B 2006, 74, 184408. [Google Scholar] [CrossRef]
  18. Chapon, L.C.; Manuel, P.; Radaelli, P.G.; Benson, C.; Perrott, L.; Ansell, S.; Rhodes, N.J.; Raspino, D.; Duxbury, D.; Spill, E.; et al. Wish: The New Powder and Single Crystal Magnetic Diffractometer on the Second Target Station. Neutron News 2011, 22, 22–25. [Google Scholar] [CrossRef]
  19. Day, P. Neutron powder diffraction in molecule-based magnetic materials: Long and short-range magnetic order. Inorg. Chim. Acta 2008, 361, 3365–3370. [Google Scholar] [CrossRef]
  20. Bewley, R.I.; Taylor, J.W.; Bennington, S.M. LET, a cold neutron multi-disk chopper spectrometer at ISIS. Nucl. Instrum. Methods Phys. Res. A 2011, 637, 128–134. [Google Scholar] [CrossRef]
  21. Arnold, O.; Bilheux, J.C.; Borreguero, J.M.; Buts, A.; Campbell, S.I.; Chapon, L.; Doucetc, M.; Draperab, N.; Leald, R.F.; Gigg, M.A.; et al. Mantid—Data analysis and visualization package for neutron scattering and μSR experiments. Nucl. Instrum. Methods Phys. Res. Sect. A Accel. Spectrometers Detect. Assoc. Equip. 2014, 764, 156–166. [Google Scholar] [CrossRef] [Green Version]
  22. Pratt, F.L. WIMDA: A muon data analysis program for the Windows PC. Physica B 2000, 289–290, 710–714. [Google Scholar] [CrossRef]
  23. Liviotti, E.; Carretta, S.; Amoretti, G. S-mixing contributions to the high-order anisotropy terms in the effective spin Hamiltonian for magnetic clusters. J. Chem. Phys. 2002, 117, 3361–3368. [Google Scholar] [CrossRef]
  24. Chaboussant, G.; Sieber, A.; Ochsenbein, S.; Güdel, H.-U.; Murrie, M.; Honecker, A.; Fukushima, N.; Normand, B. Exchange interactions and high-energy spin states in Mn12-acetate. Phys. Rev. B 2004, 70, 104420. [Google Scholar] [CrossRef] [Green Version]
  25. Furrer, A.; Güdel, H.U. Neutron inelastic scattering from isolated clusters of magnetic ions. J. Magn. Magn. Mater. 1979, 14, 256–264. [Google Scholar] [CrossRef]
  26. Chiesa, A.; Guidi, T.; Carretta, S.; Ansbro, S.; Timco, G.A.; Vitorica-Yrezabal, I.; Garlatti, E.; Amoretti, G.; Winpenny, R.E.P.; Santini, P. Magnetic Exchange Interactions in the Molecular Nanomagnet Mn12. Phys. Rev. Lett. 2017, 119, 217202. [Google Scholar] [CrossRef] [Green Version]
  27. Caciuffo, R.; Amoretti, G.; Murani, A.; Sessoli, R.; Caneschi, A.; Gatteschi, D. Neutron spectroscopy for the Magnetic Anisotropy of Molecular Clusters. Phys. Rev. Lett. 1998, 81, 4744–4747. [Google Scholar] [CrossRef]
  28. Mirebeau, I.; Hennion, M.; Casalta, H.; Andres, H.; Güdel, H.U.; Iridova, A.V.; Caneschi, A. Low-Energy Magnetic Excitations of the Mn12-Acetate Spin Cluster Observed by Neutron Scattering. Phys. Rev. Lett. 1999, 83, 628–631. [Google Scholar] [CrossRef] [Green Version]
Figure 1. The core of the Fe 19 molecule viewed along the (110) crystal axis, showing only the Fe atoms and the bridging O atoms. The site labels for the Fe atoms are shown, and site 1 is a centre of inversion. The S = 35/2 ground state of the molecule is the result of strong intramolecular exchange interactions that place the six Fe sites surrounding the central Fe on one spin sublattice with the remaining thirteen Fe sites, including the central site on a second sublattice with opposite spin. The easy axis is shown as vertical in this figure for clarity, the direction previously suggested by EPR [13] is a vector from site 1 to site 2, whereas, in this study, we found a direction closer to the site 1 to site 10 vector.
Magnetochemistry 07 00074 g001
Figure 2. Neutron powder diffraction spectra measured on the WISH instrument. (a) Comparison of the data above and below the 1.2 K magnetic ordering temperature. The arrows highlight four new peaks that appear with d spacings in the region between 13 and 23 Å. (b) The difference spectrum shows the magnetic peaks more clearly. These new peaks are only consistent with an ordering that has the propagation vector (0.5 0 0.5). The positions of absent peaks that would be present for other modes of ordering are marked in grey. The predicted relative intensities of the observed peaks for (0.5 0 0.5) ordering are marked with blue lines, taking the Fe1–Fe2 orientation of the easy axis that was suggested by EPR [13] (shown as the blue arrow). (c) An improved match to the measured intensities is obtained with a revised spin orientation that is close to the Fe1–Fe10 axis of the molecule (see Table 3).
Magnetochemistry 07 00074 g002
Figure 3. Temperature dependence of the lowest energy excitation of the S = 35/2 ground state (from S z = 35/2 to S z = 33/2). The measurements were made on the LET instrument with an incident energy of 1.06 meV, and the line is a guide to the eye. The internal field in the ordered state splits the levels and shifts the transition energy. The maximum value of the internal field B 0 was determined to be 91(5) mT.
Magnetochemistry 07 00074 g003
Figure 6. The shortest direct hydrogen bonds between molecules shown as green dotted lines for molecules displaced in the b direction (top) and the c direction (bottom). Oxygen atoms are shown as red and hydrogen atoms as light grey. The lengths are marked in Å (see Table 7).
Magnetochemistry 07 00074 g006
Table 1. The cell parameters obtained with neutrons at 1.5 K compared with those previously obtained at 150 K with X-rays [11].
150 K (X-rays)1.5 K (Neutrons)
a (Å)   13.309 (3)13.116 (1)
b (Å)17.273 (5)17.189 (1)
c (Å)17.600 (4)17.503 (2)
α (°)65.201 (10)65.397 (8)
β (°)74.514 (16)74.300 (8)
γ (°)81.30 (2)81.753 (7)
space groupP 1 - P 1 -
Table 4. Parameters obtained for fitting the inelastic neutron transitions observed in the 2 to 3 meV region with Gaussian peaks. The final column provides the assignment for the transition band.
BandPosition (meV)Width (meV)Assignment
II2.163(2)0.120(3) Δ S = 0
III2.492(3)0.129(4) Δ S = 0
IV2.841(7)0.185(10) Δ S = ±1
Table 5. Intensity ratios for the magnetic dipole transitions from a ground state level ( S , S z ) = (35/2, −35/2) to the three possible excited spin states with spin S f . Note that the intensity ratios only apply to the different Δ S z transitions within a given multiplet. Comparing the intensities between different multiplets requires knowledge of their respective reduced matrix elements.
Δ S z
Δ S S f −101
−133/2 1
035/2 0.94590.0541
137/20.94740.05120.0014
Table 6. Parameters for the ground state and two lowest lying excited states obtained from a global fit of the temperature dependent inelastic neutron spectra (Figure 4c). The data were analysed with the zero field version of the model Hamiltonian, Equation (4). The offset of the minimum energy of the excited state with respect to the S = 35/2 ground state is shown in the final column as the excitation gap Δ .
Spin State SD (mK)E/|D| Δ (K)
35/2−51.0 (1)0.20 (1)0
39/2−44.3 (2)0.16 (1)1.5 (2)
31/2−42.6 (3)0.22 (2)3.0 (1)
Table 7. The short overall Fe–Fe distances between neighbouring molecules in the lattice and the shortest intermolecular H-bonds not involving lattice water.
Intermolecular Vector d Fe - Fe (Å)Linked SitesShortest H-Bond (Å)
b  8.655Fe8–Fe10 , Fe10–Fe8 2.388
b-c8.741Fe5–Fe9, Fe9–Fe52.387
a-b8.798Fe7–Fe7 2.533
c8.846Fe5–Fe8 , Fe8–Fe5 3.147
a9.047Fe7–Fe7 2.344
a-c10.081Fe8–Fe92.481
Table 8. The ordering temperature obtained from Monte Carlo simulation versus superexchange couplings between the nearest neighbour molecules. J 0 is obtained from the requirement to match the observed B 0 in the ordered state.
J a (J 0 ) J a - b , J b (J 0 )J c , J b - c (J 0 )J 0 (mK)T N (K)Ordering Mode
1112.62.7(0.5 0 0.5)
110.54.02.0(0.5 0 0.5)
110.255.21.4(0.5 0.5 0.5)
110.22, 0.285.41.4(0.5 0 0.5)
11.180.22, 0.285.41.2(0.5 0 0.5)
Publisher’s Note: MDPI stays neutral with regard to jurisdictional claims in published maps and institutional affiliations.