Article

New Spin-Crossover Compounds Containing the [Ni(mnt)] Anion (mnt = Maleonitriledithiolate)

1
Department of Chemistry, University of Surrey, Guildford GU2 7XH, UK
2
Department of Chemistry, Graduate School of Science, Osaka University, 1-1 Machikaneyama, Toyonaka, Osaka 560-0043, Japan
3
EPSRC National Crystallographic Service, School of Chemistry, Faculty of Engineering and Physical Sciences, University of Southampton, Southampton SO17 1BJ, UK
4
Technische Universität Kaiserslautern, Erwin Schrödinger-Str 46, D-67663 Fachbereich Physik, Germany
*
Author to whom correspondence should be addressed.
Magnetochemistry 2021, 7(5), 72; https://doi.org/10.3390/magnetochemistry7050072
Submission received: 26 April 2021 / Revised: 13 May 2021 / Accepted: 14 May 2021 / Published: 19 May 2021

Abstract

:
Two novel salts containing the anion [Ni(mnt)2] (mnt = maleonitriledithiolate) have been synthesized. The counter-ions, [Fe(II)(L1 or L2)2], are cationic complexes where L1 and L2 are methylated derivatives of 2,6-bis(pyazolyl)pyridine or pyrazine, which are similar to ligands found in a series of spin-crossover (SCO) complexes. Both salts are characterized by variable temperature single crystal X-ray diffraction and bulk magnetization measurements. Compound 1, [Fe(II)(L1)2][Ni(mnt)2]2 displays an incomplete and gradual SCO up to 300 K, followed by a more rapid increase in the high-spin fraction between 300 and 350 K. Compound 2, [Fe(II)(L2)2][Ni(mnt)2]2.MeNO2, shows a gradual, but more complete SCO response centered at 250 K. For compound 2, the SCO is confirmed by variable temperature Mössbauer spectroscopy. In both cases, the anionic moieties are isolated from each other and so no electrical conductivity is observed.

Graphical Abstract

1. Introduction

The phenomenon of spin-crossover (SCO) has been known since the 1930s, following the serendipitous work by Cambi et al. [1,2]. Contemporary interest in SCO is due to potential applications in data storage devices [3], sensors and displays. Their utility relies on electronic instability between high-spin (HS) and low-spin (LS) configurations in transition metal complexes with octahedral geometries and 4 to 7 valence d-electrons. Exploitable switching properties can be associated with SCO, for example color, magnetization [4,5], dielectric constant [6,7], photo-physical properties [8,9,10], electrical conductivity [11] and structural parameters [12]. The most studied complexes contain Fe(II) and N-donor heterocyclic ligands, since spin state conversion in these compounds tend to give relatively large changes in properties [13,14]. In these cases, HS-LS switching also involves the maximal change in electron multiplicity, S = 0 (LS) to S = 2 (HS). A popular series of ligands in Fe(II) complexes, relevant to this work, has been 2,6-bis(pyrazol-1-yl)pyridine (dpp) and its derivatives, pioneered by Halcrow et al. [15,16,17].
In addition, SCO cationic complexes are attractive components of multifunctional hybrid salts when combined with anions that bring other properties, such as electrical conductivity or magnetic ordering [18]. This goes together with the development of molecular conductors where the conducting network is made from anionic moieties [19,20,21]. The goal is to obtain a molecular conductor that also exhibits SCO, such that the induced structural changes affect the materials ability to conduct electricity. Indeed, it is well-known that the electrical properties of molecular conductors are sensitive to small modifications of their crystal structure. There have been some successes in this area. For example, Fe(III) complexes of salycyl-type ligands [Fe(III)(sal2-trien)][Ni(dmit)2]n with n = 1 [22,23,24] were the first materials to contain [Ni(dmit)] anions and SCO cations, although the compound did not conduct electricity, and when n = 3 SCO, it disappears with the appearance of semiconductivity [25]. The same group also made [Fe(III)(salten)-Mepepy][Ni(dmit)2]3, which had a gradual SCO associated with photoisomerization of the Mepepy ligand and moderated conductivity [26]. Takahashi et al. first observed a clear synergy between SCO and electrical conduction [27] in the related compound [Fe(III)(qsal)2][Ni(dmit)2]3.CH3CN.H2O, qsalH = N-(8-quinolyl)-salicyladimine. Generally, these early approaches focused on dmit-based anionic components with Fe(III) SCO complex cations, whereas, more recently, mnt-based anions (Scheme 1) have been used. Most notably, a compound closely related to those in this work, [Fe(II)(dpp)2][Ni(III)(mnt)2]2.MeNO2 [28] was characterized by multi-stage spin-state conversions with mixed HS-LS states. A related Fe(II)/Ni(III) compound, [Fe(dppTTF)2][Ni(mnt)2]2(BF4)2.PhCN, included a derivatized dpp with tetrathifulvalene (TTF) resulting in synergy between SCO and electrical conductivity [29]. In the current work, we focus on Ni(III) mnt-based anions with Fe(II) complex cations with methylated derivatives of dpp (Scheme 1, X = C) and the related pyrazine (X = N). This expansion is useful to investigate if the chemical flexibility, when derivatizing the dpp ligand, allows or disrupts SCO when metal complex anions are used.

2. Results and Discussion

2.1. Description of Structures of Compounds 1 and 2

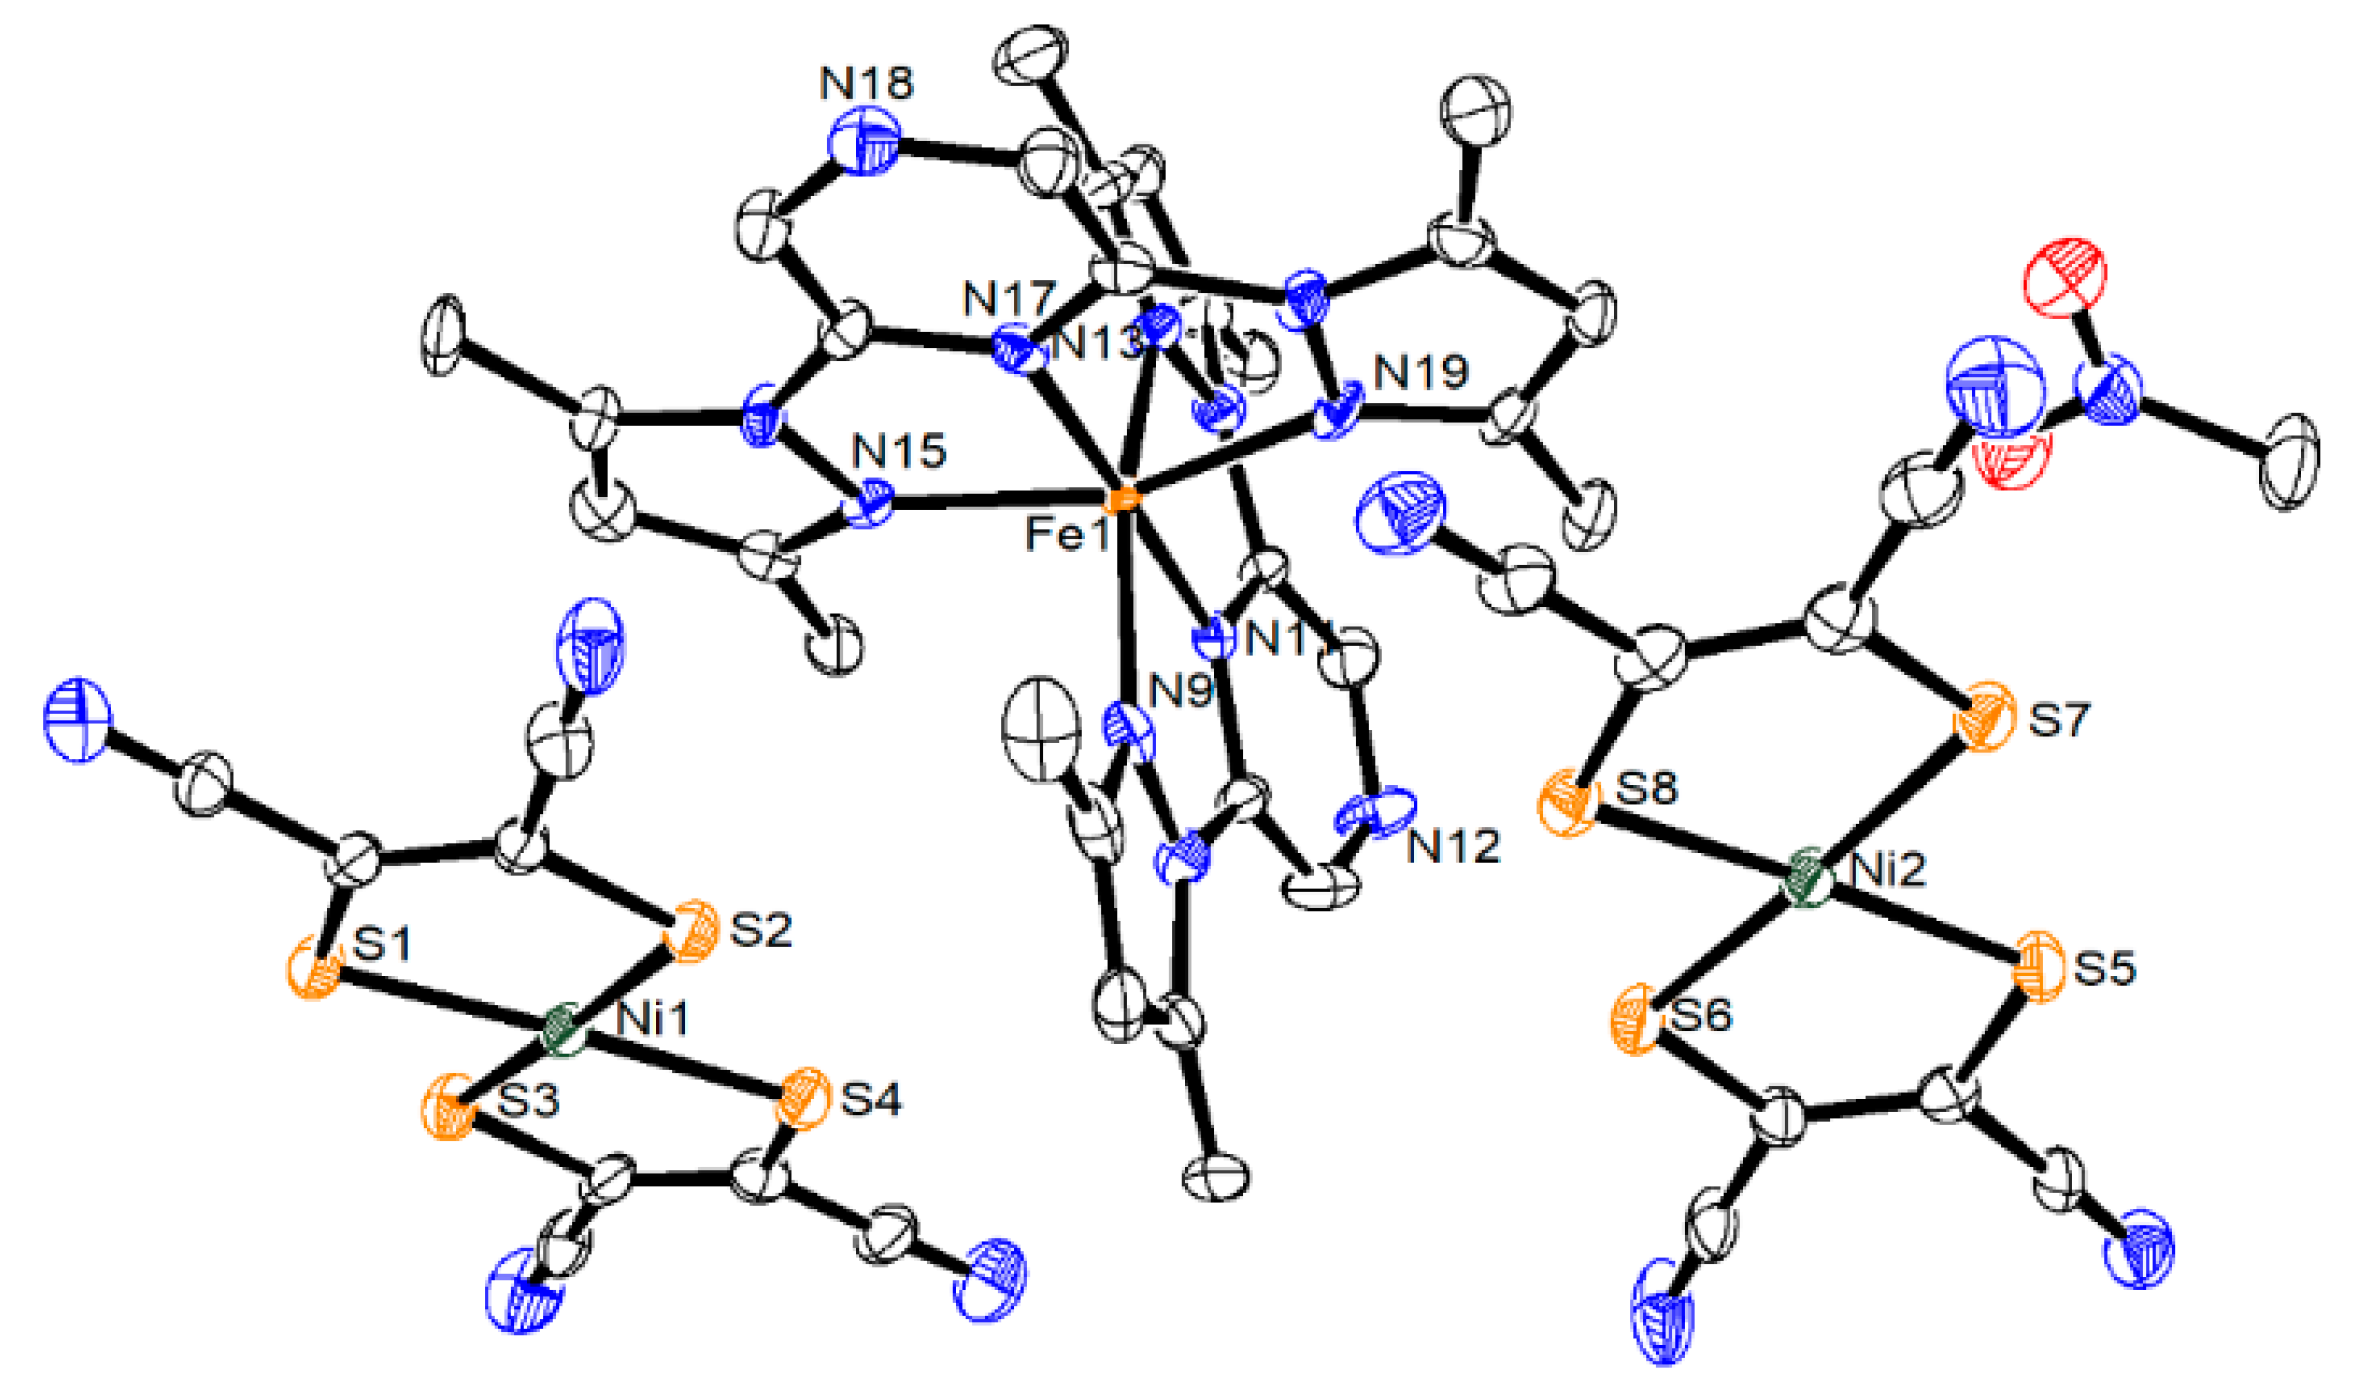
Crystals amenable to single X-ray diffraction were obtained of compound 1, [Fe(II)(L1)2][Ni(mnt)2]2 and compound 2, [Fe(II)(L2)2][Ni(mnt)2]2.MeNO2, as detailed in Section 3.1 and Section 3.2. For both compounds, the structures were solved at 100 and ca. 290 K. Both compounds crystalize in the P-1 (No. 2) space group. Table 1 contains the relevant crystallographic data and collection parameters. Figure 1 and Figure 2 show the molecular structures of both compounds at 100 K, with thermal ellipsoids and the atom numbering scheme referred to in the text. The asymmetric unit of compound 1 contains one crystallographically independent Fe(II) cation, two [Ni(mnt)2] anions and no included solvent. By contrast, compound 2 contains the same 1:2 Fe(II): Ni(III) metal complex ratio with the additional inclusion of one CH3NO2 molecule.
For compound 1, the coordination geometry about the Fe(II) cation has a distorted octahedral FeN6 environment. From the point of view of SCO, it is important to look at the Fe-N bond lengths, which reflect the spin-state [12]. In compound 1, at 100 K, these bond lengths range from 1.889 to 1.987 Å (average 1.957 Å). At 293 K, there is little change, with the bond lengths varying between 1.891 and 1.987 Å (average 1.954 Å). At both temperatures, this is indicative of a LS-state Fe(II) center. In addition, a change in the distortion from ideal local octahedral geometry can indicate a spin-state change. The OctoDist program [30] was used to determine the distortion parameters. The first parameter, Σ, is the sum of the deviations from 90° of the twelve cis N-Fe-N angles. A second parameter, Θ, is the sum of the deviations from 60° of the twenty-four N-Fe-N angles, six per pseudo three-fold axis, measured on a projection of opposite triangular faces of the FeN6 octahedron, orientated by superimposing the face centroids. Typically, Σ and Θ are lower for LS and higher for more distorted HS complexes [12]. For compound 1, Σ is 87.09° at 100 K and 87.16° at 293 K, essentially unchanged. Similarly, Θ is 287.00° at 100 K and 285.14° at 293 K is also unchanged. These structural parameters indicate LS complexes at both temperatures and do not reflect the SCO found from magnetization data (Section 2.2), most likely due to the substantially incomplete nature of the transition.
At both temperatures, the overall structure of compound 1 consists of alternating layers of cations and anions when viewed down the crystallographic ab plane, as seen in Figure 3. The anionic Ni layer consists of discrete dimers that occupy cavities created by the cations, with close S…S contacts between dimers. At 100 K, these are 3.393 Å between S1 and S11, and 3.526 Å between S6 and S16 with significantly longer distances to the next nearest dimer. The anionic charge, and by extension the Ni oxidation state, can be correlated with the geometry, specifically the Ni-S bond lengths since these are affected by the electron population of the molecular orbitals. For compound 1, the two crystallographically independent anions have similar bond lengths that are compatible with mono-anions and Ni(III). The bond lengths range from 2.135 to 2.143 Å at 293 K and 2.139 to 2.151 Å at 100 K, whereas large bond lengths of ca. 2.17 Å are found for [Ni(II)(mnt)2]2− [31].
For compound 2, the complex geometry about Fe(II) is also a distorted octahedron, but in this case, there is a variation in Fe-N bond lengths as a function of temperature. At 100 K, the bond lengths vary from 1.967 to 2.070 Å with an average of 2.030 Å. However, there is an increase at 290 K to an average of 2.102 Å with a minimum bond length of 2.047 and a maximum of 2.136 Å. This change reflects the spin-state change that is seen in the bulk magnetism and Mössbauer data vide infra. In addition, there is a clear distortion of the octahedral geometry between the two temperatures. The parameter Σ is 109.14° at 100 K, meaning that the LS state of compound 2 has an intrinsically more distorted geometry than the LS state of compound 1. However, at 290 K, this significantly increases to 132.94°, which is indicative of a spin-state change. Additionally, an increase was seen in the distortion parameter Θ of 354.66° at 100 K, but is 428.34° at 290 K. Furthermore, Halcrow suggested that whole molecule deviation from ideal D2d symmetry in HS [Fe(dpp)2]2+-like cations indicates a propensity to undergo SCO [12]. The contention is that HS structures that deviate too much from the typical distortion seen at LS are unable to undergo SCO, although this analysis is not definitive. The distortion from D2d is parametized by the trans-N(pyridyl)-Fe-N(pyridyl) angle (θ) and the dihedral angle between ligand mean planes (ϕ). For compound 2, parameter θ is 178.43 (100 K) and 178.11° (293 K), whereas ϕ is 84.84° (100 K) and 85.20° (24 = 93 K). The HS and LS values do not deviate far from each other, and therefore compound 2 is not an outlier in undergoing SCO [11].
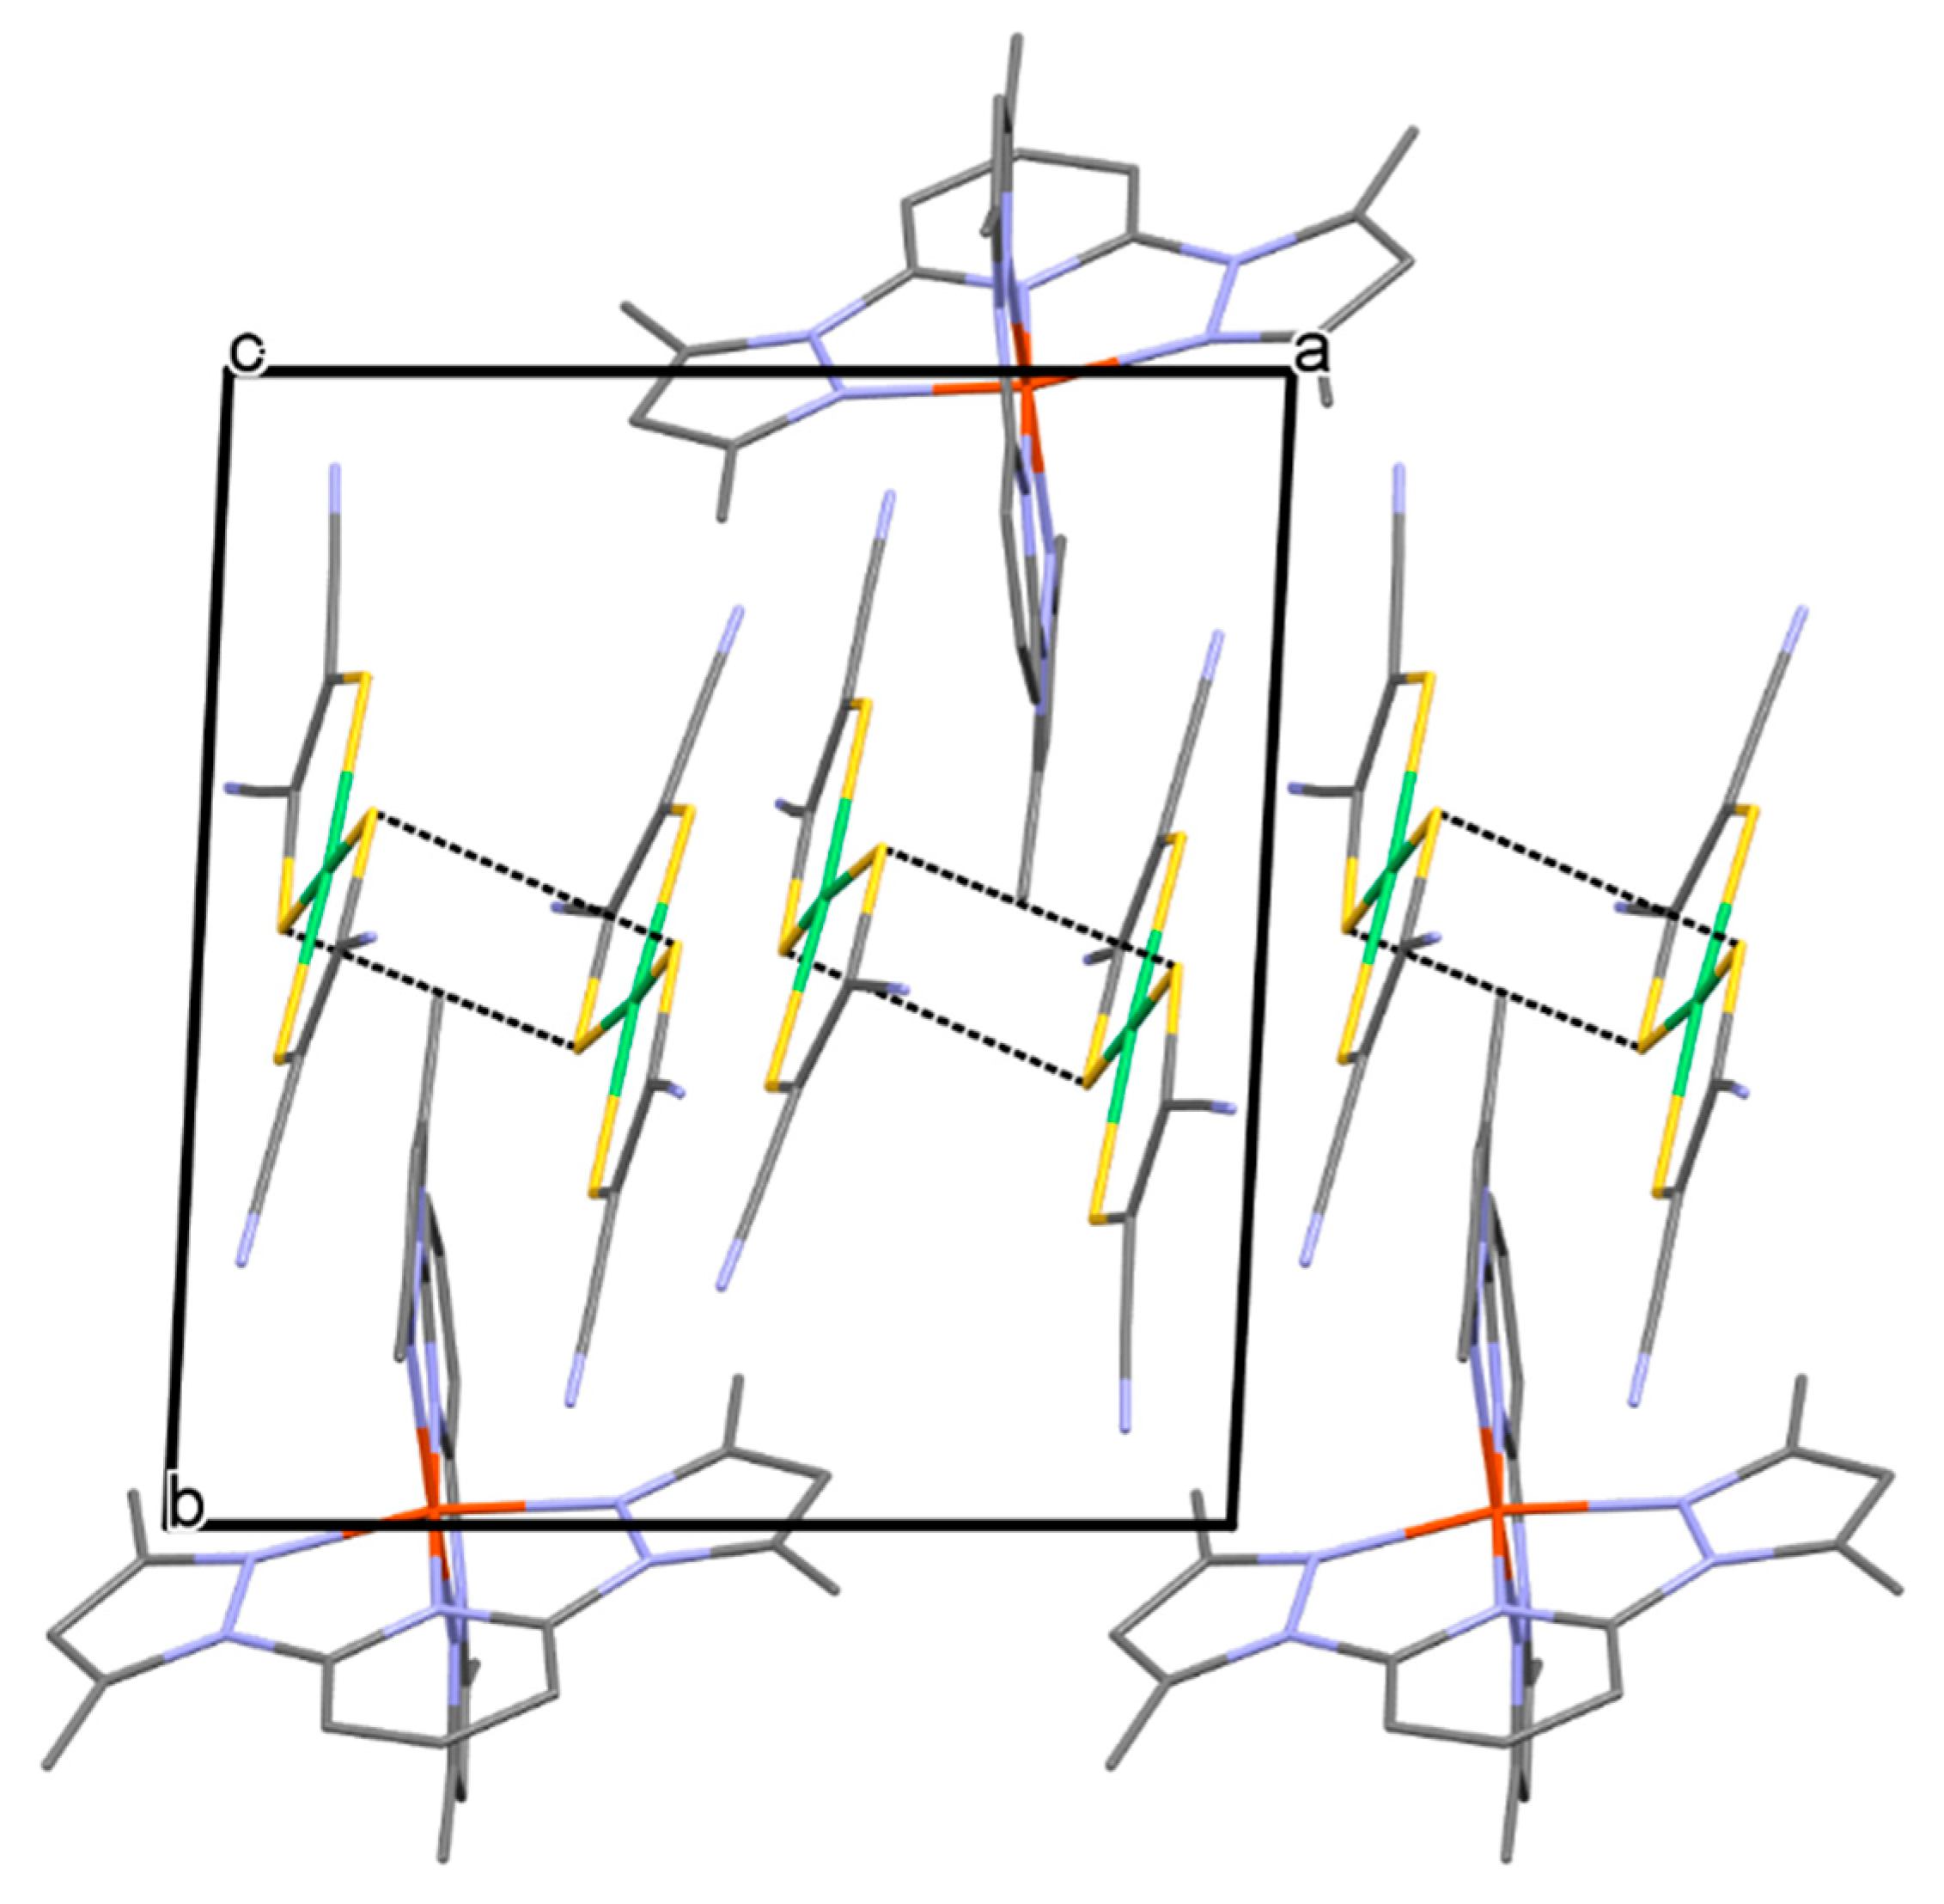
In comparison to compound 1, the anions and cations of compound 2 are not clearly separated into layers, since the two ions tend to interdigitate with each other. Correspondingly, there are no short S…S contacts between anions, the shortest S…S distance being 3.926 Å, so that each Ni anion is isolated from the nearest neighbor (Figure 4). The Ni-S bond lengths are similar for both crystallographically independent anions, indicating that they have the same charge and metal oxidation state. The values range from 2.138 to 2.155 Å at 290 K and 2.141 to 2.161 Å at 100 K, typical for a Ni(III) monoanion [31].
In both compound 1 and 2, the arrangement and isolation of the anions means that it is unlikely that these compounds would display electrical conduction, as observed in some mnt-containing structures with more evenly distributed layering. This is evident from preliminary 2-probe resistance measurements, which give values above the limit of our equipment (1 M ohm) in three perpendicular directions through the crystals at 300 K.

2.2. Magnetic Properties

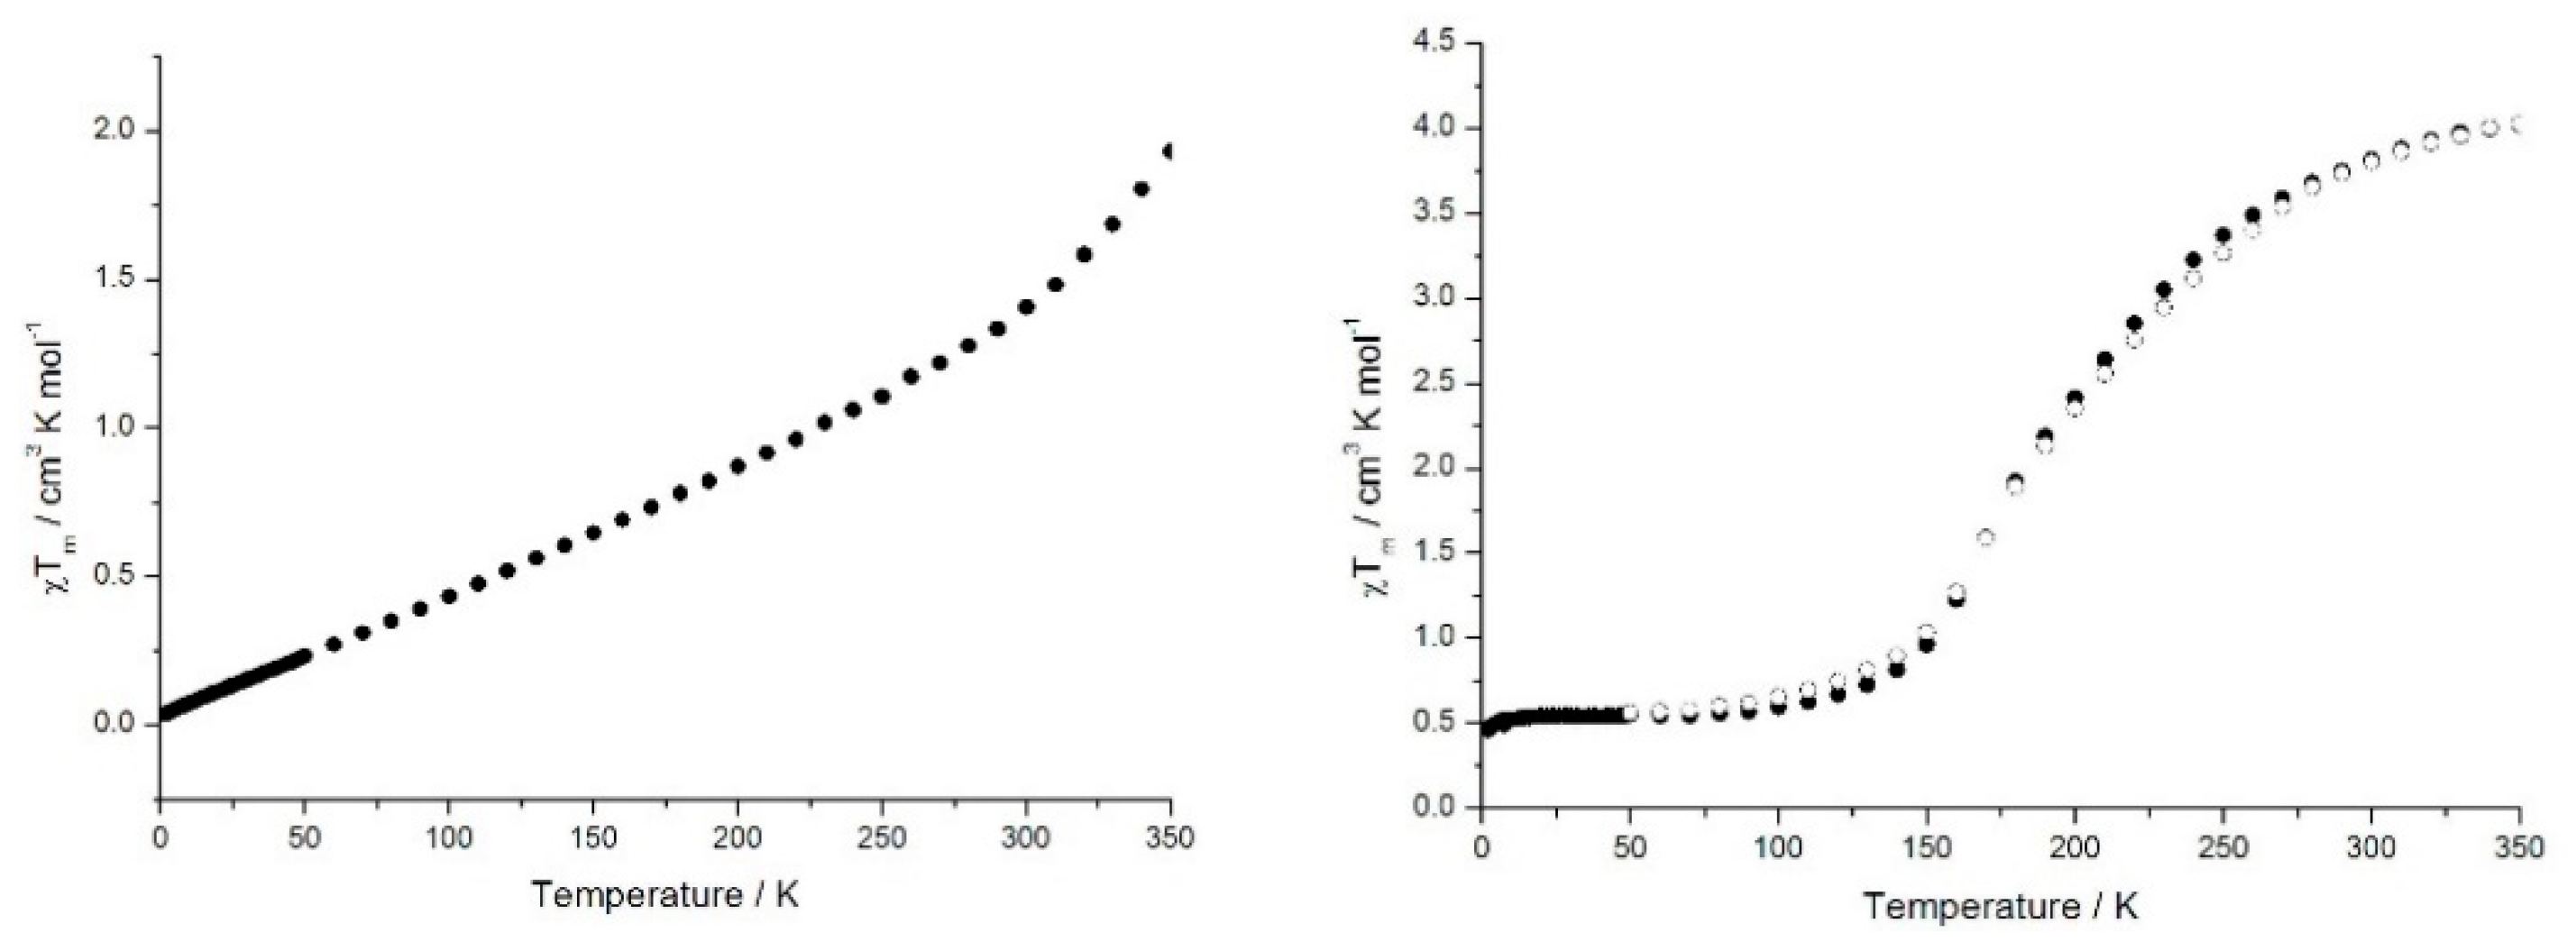
Figure 5 shows the magnetic data for compound 1, [Fe(L1)2][Ni(mnt)2]2 and 2, [Fe(L2)2][Ni(mnt)2]2.MeNO2, expressed as the temperature (T) dependence of the product χmT, where χm is the molar magnetic susceptibility. An initial analysis of the data can assume no magnetic exchange at higher temperatures. The magnetic data would then be a summation of contributions from HS Fe(II) (S = 2), LS Fe(II) (S = 0) and two [Ni(III)(mnt)2] anions (S = 1/2 each). At lower temperatures there may also be a magnetic exchange that reduces or increases the contribution.
For compound 1, at 2 K the value of χmT is 0.04 cm3 K mol−1, which implies that Fe(II) is in the LS state and there is also little contribution from the Ni anionic moieties. The reason for the small contribution from the anions is most likely linked to their dimerization and subsequent antiferromagnetic coupling. On warming, there is a steady, almost linear increase in χmT up to about 300 K (1.41 cm3 K mol−1), followed by a more rapid rise to 350 K where the maximum χmT is 1.93 cm3 K mol−1. These higher values cannot be achieved by a simple loss of antiferromagnetic coupling between anions, which would lead to a maximum χmT value of 0.75 cm3 K mol−1. Therefore, there must be an increased contribution from HS Fe(II) as the temperature rises. Nevertheless, this is an incomplete SCO and is not reflected in the variable temperature structural data of compound 1. Such behavior has been previously seen in [FeL2](ClO4)2, where L = 2,6-bis(3-methylpyrazol-1-yl)pyrazine [32].
Compound 2 distinctly shows different behavior. At 2 K, the value of χmT is 0.46 cm3 K mol−1, which rises slightly and reaches 0.5 cm3 K mol−1 after 100 K, after which there is a more rapid rise to a maximum value of 4.02 cm3 K mol−1 at 350 K. We can estimate the g-value for the Fe complex using the Mossbauer data and bulk magnetic data at 300 K. The Mossbauer data (Section 2.3) indicates that 83% of the Fe(II) complex is in the HS state at 300 K, whereas the bulk magnetic data gives a total χmT of 3.82 cm3 K mol−1 at the same temperature. Assuming this high temperature χmT value also includes contributions from two independent [Ni(mnt)2] anions (total 0.75 cm3 K mol−1), then 3.07 cm3 K mol−1 is the contribution from 83% of a S = 2 HS Fe(II) and 17% S = 0 LS Fe(II). This gives an estimate of g of 2.2 using χmT = 0.83 × 0.12505 g2S(S + 1). Using this g value and the same calculation, with the % fraction HS as the unknown, we can estimate the HS fraction to be 90% at 350 K and 46% at 200 K. Below about 100 K, the Fe(II) centers are mostly in the LS state and this does not contribute to the magnetism. The small value of χmT further implies an antiferromagnetic coupling between [Ni(mnt)2] anions, albeit weaker than that shown by compound 1. Indeed, the data below 80 K follows a Curie-Weiss law, with a negative Weiss constant of -0.6 K. However, bulk magnetization data is not an ideal method of decoupling the contributions from the Ni and Fe ions, but the above calculation of the HS fraction at 200 K agrees well with Mössbauer data vida infra. Finally, on measuring while cooling and warming the curves for compound 2 are essentially identical with no hysteresis, it reflects the lack of inter-cation short contacts in the structure. We can make some speculations as to the origin of the difference in abruptness of the SCO between the two salts. The compounds have cations with a very small molecular change; a CH in compound 1 is replaced by a N atom in compound 2. This is unlikely to be directly responsible for such a difference in SCO, where more abrupt transitions are correlated to increased intermolecular interactions. However, the inclusion of the solvent in compound 2, along with the overall change in packing, is likely to be more relevant. Compound 1, with a much more gradual SCO, has a clear 2D layered structure, but the more abrupt SCO for compound 2 is associated with a more 3D structure, although both do not have any substantive inter-cation interactions. It is suggested that the more abrupt SCO for compound 2 is a result of the 3D organization, whereas the very gradual SCO for compound 1 is a response to more isolation of cations into layers.

2.3. Mössbauer Spectroscopy

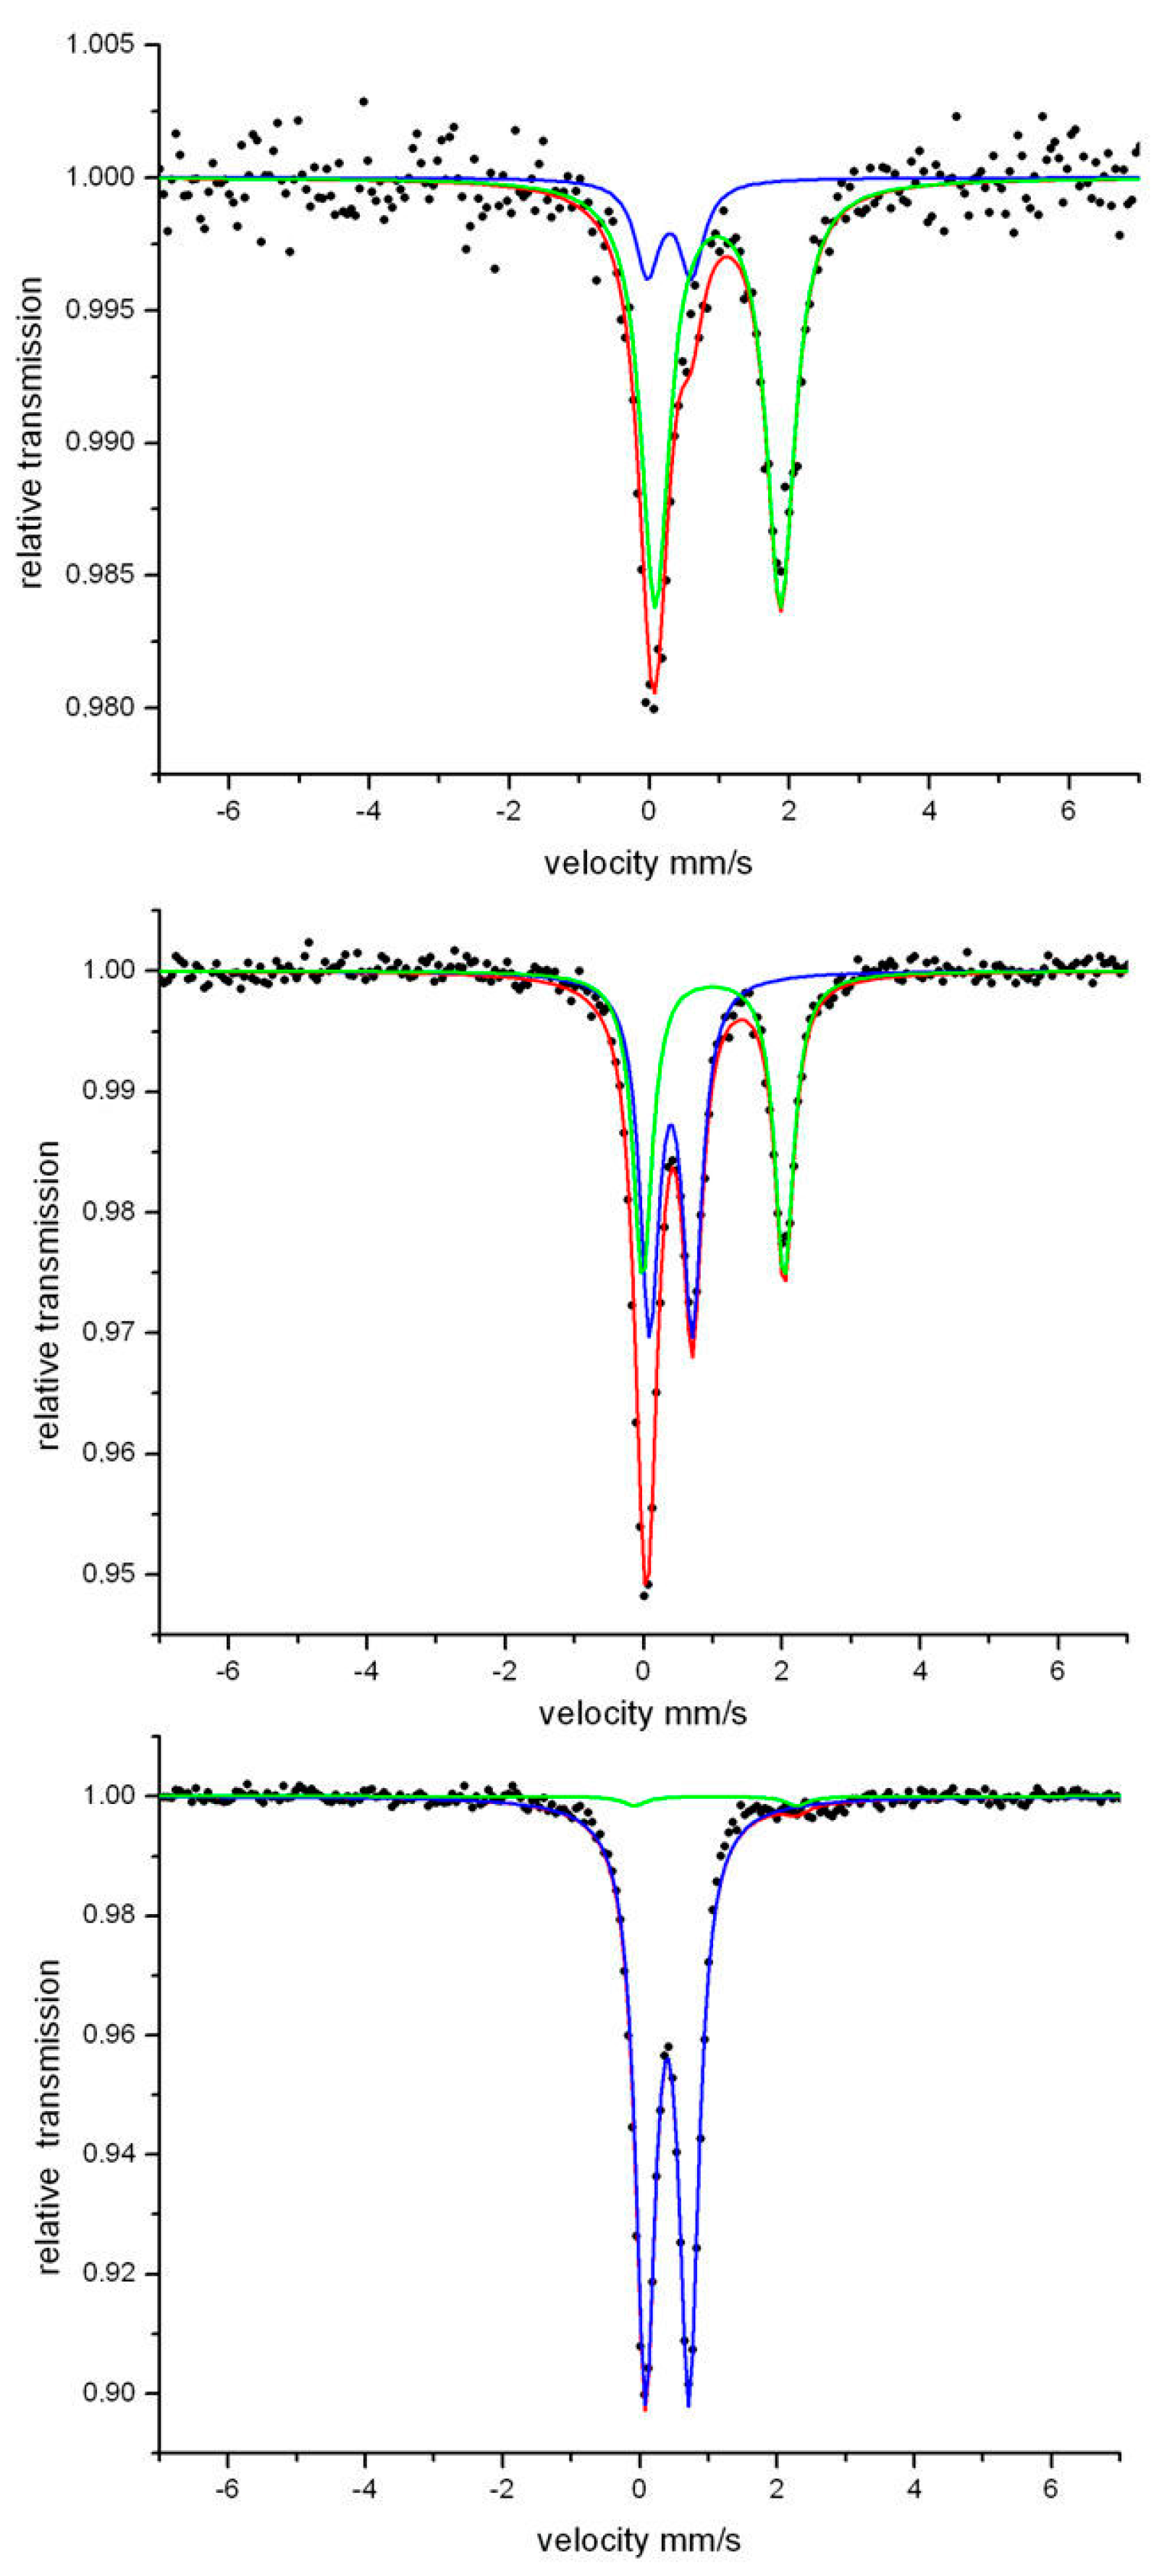
The variable temperature 57Fe Mössbauer data for compound 2 is presented in Figure 6. The associated hyperfine parameters were found by a least-squares fit, assuming Lorentzian shaped peaks, and are given in Table 2. Measurements were taken at several temperatures between 300 and 100 K but Figure 6 shows the fitted data at 300 K, 200 K and 100 K. All spectra were found to have signals that are attributable to both HS and LS Fe(II) complexes.
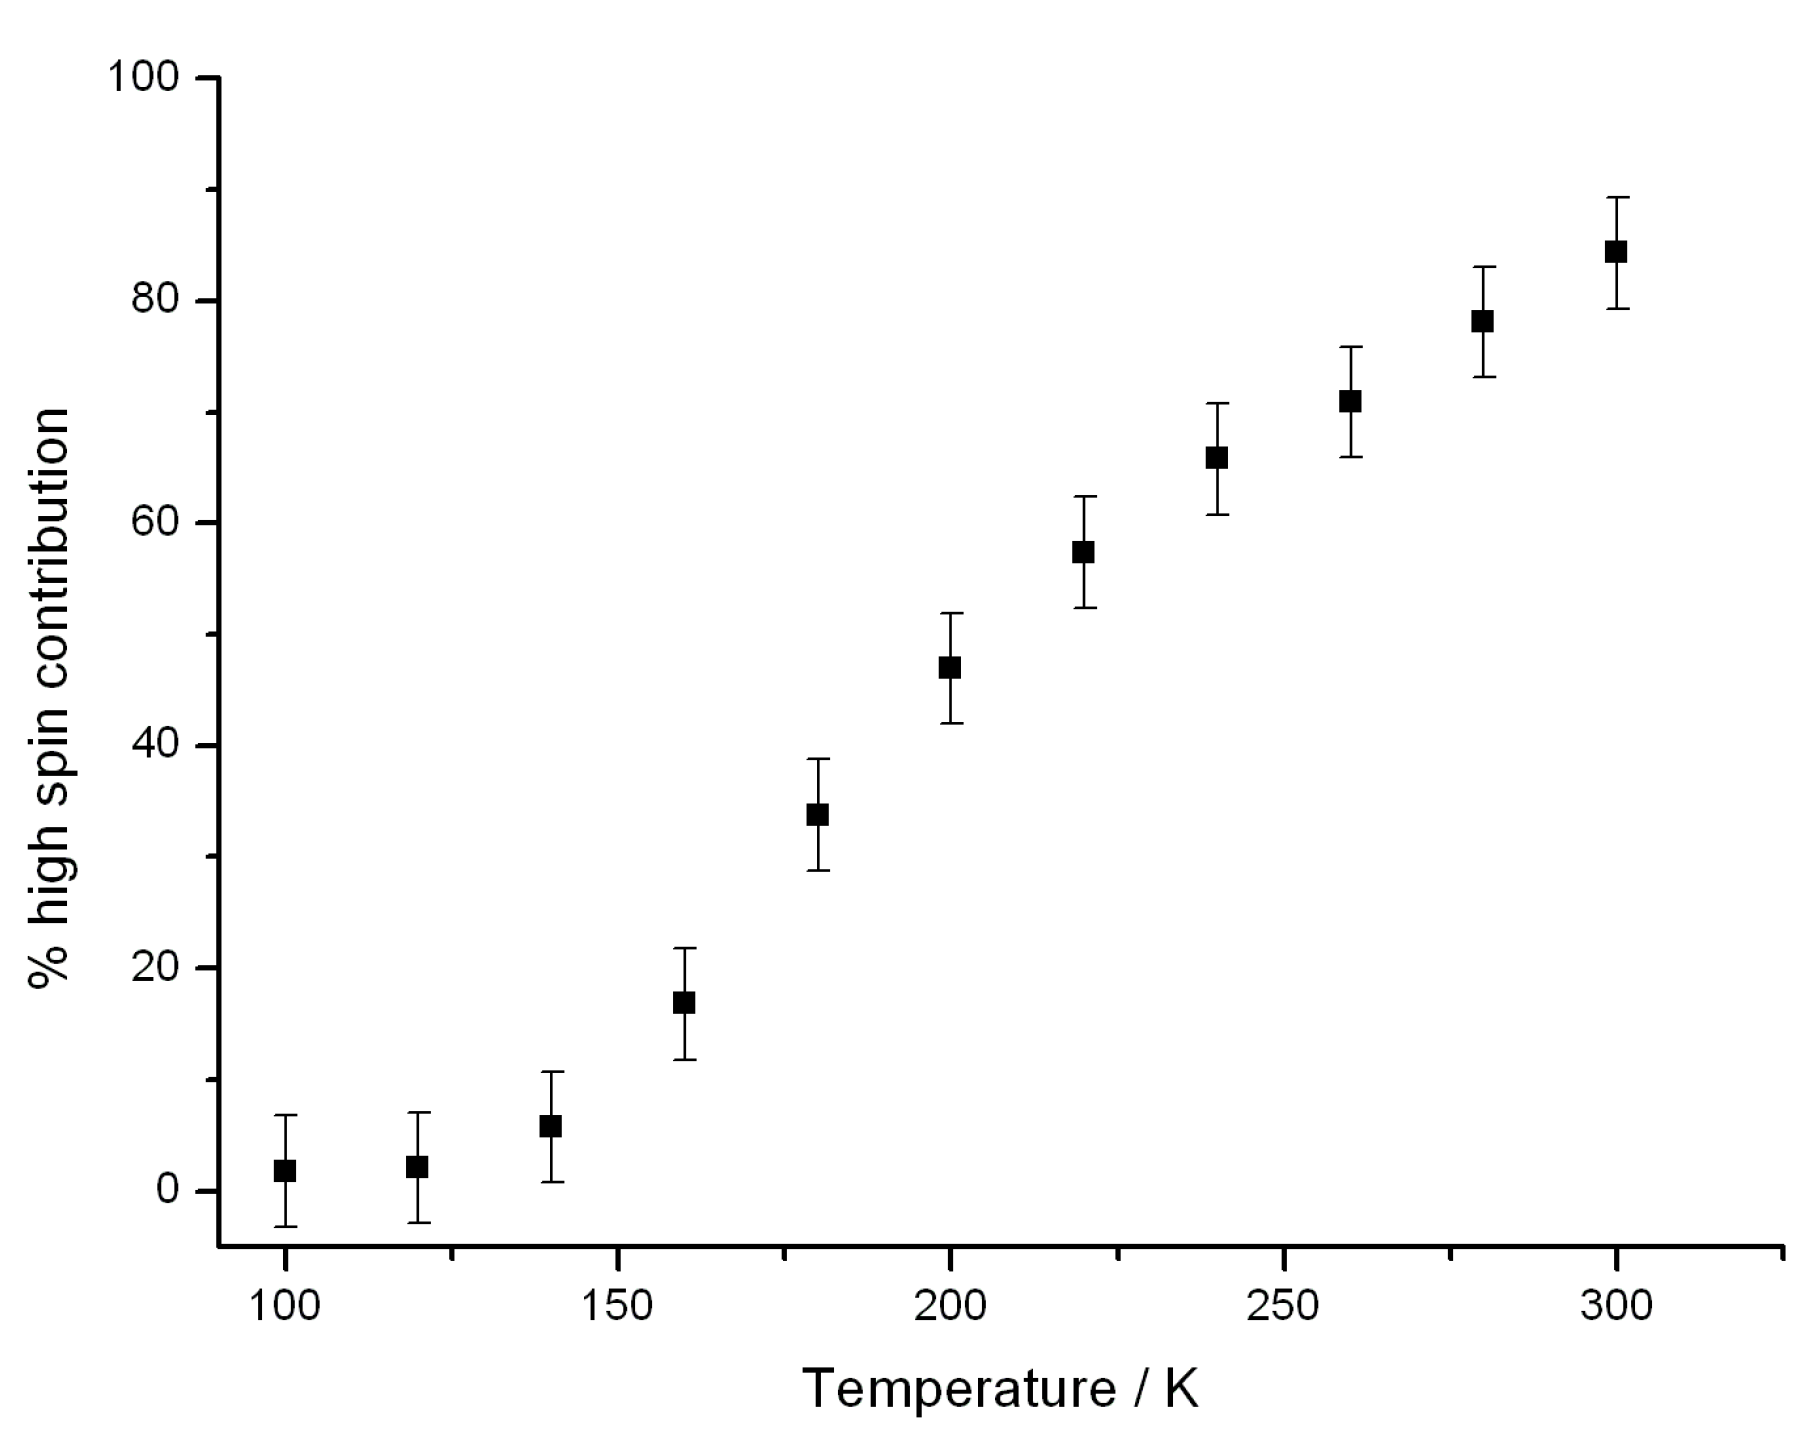
The experimental data is given as black dots. The signal for the HS Fe(II) having the largest quadrupole splitting (Table 2) is modelled by the green curve. The signal for the LS Fe(II) with the smallest quadrupole splitting is modelled by the blue curve. In each case, the hyperfine parameters compare well with the expected values. The red curve is the sum of the contributions from both the HS and LS Fe(II) curves and maps well onto the experimental data. The portion of the HS and LS complexes vary, as expected from the SQUID magnetic data. The measurements at 300 and 200 K clearly show two quadrupole doublets, indicating the presence of significant quantities of both HS and LS Fe(II) centers. An analysis of the integrals of the modelled curves indicates, at 300 K, that there is 83% of the HS fraction and 17% of the LS fraction. At 200 K, there is approximately 50% of each, and only 1.8% of the HS complex remains at 100 K. These percentage fractions are very close to those proposed from bulk magnetic data. Figure 7 shows all the Mössbauer data replotted to show the temperature variation of the HS fraction. This data confirms the conversion from almost complete LS Fe(II) at 100 K to a HS/LS mixture at 300 K, albeit with an excess of HS Fe(II). The transition temperature seen in Figure 7 also compares well with the bulk magnetic data in Figure 5.

3. Materials and Methods

All reactions were completed in air, unless otherwise stated, using commercial grade chemicals. (C4H9)4N[Ni(mnt)2] was purchased from Tokyo Chemicals Industry (TCI) and was used as received. All other chemicals were purchased from Sigma-Aldrich and used as received. Magnetization measurements were completed using a MPMS-5 SQUID magnetometer (Quantum Design, CA, USA) with powdered samples held in gelatin capsules in an external field of 0.1 T. Each sample was cooled to 2 K and measured while being warmed to 300 K. Since compound 2 had a more abrupt SCO, this sample was also measured while cooling in order to determine hysteresis. Diamagnetic corrections were made for the sample holder and for the compound, the latter estimated using Pascals constants [33]. Resistance measurements were made using a two-probe method, at ambient temperature, with gold wire (diam 1 μm) attached to the opposite sides of a crystal with carbon paste. This was measured using a Keithley Instruments 6517A multimeter (Tektronics, UK). For compound 1, single crystal X-ray diffraction was performed using a Rigaku AFC12 goniometer and enhanced sensitivity Saturn724+ detector with Superbright Mo rotating anode generator. Structure refinement was completed using SHELXL [34]. For compound 2, single crystal X-ray diffraction was performed using a Rapid II imaging plate system with MicroMax-007 HF/VariMax rotating anode X-ray generator and confocal monochromated Mo-Ka radiation. Structure refinement was completed with SHELXL [34] or CRYSTALS [35] software. All non-hydrogen atoms were refined anisotropically. Hydrogen atom positions were calculated geometrically and refined using the riding model. Mössbauer spectra were recorded using a conventional spectrometer in the constant-acceleration mode. Isomer shifts are given relative to α-Fe. Temperature dependent Mössbauer spectra were recorded with a closed-cycle cryostat (CRYO Industries of America Inc., USA) and were analyzed by the least-square fits using Lorentzian line shapes. CHN elemental analysis was performed using an CE-440 Elemental Analyzer (Exeter Analytical Inc., Coventry, UK).

3.1. Synthesis of Ligands and Fe(II) Complexes

The ligand L1 was prepared by the literature procedure [36], although using the work-up methods later described by Halcrow et al [15]. The ligand L2 was prepared following the procedure by Halcrow et al. [32]. The reaction of Fe(BF4)2.6H2O was done by stirring for two hours in acetone with two equivalents of L1 or L2, followed by precipitation by adding diethyl ether yielded brown solids. The color indicates that both [Fe(L1)2](BF4)2 and [Fe(L2)2](BF4)2 are in the LS state at ambient temperature.

3.2. Synthesis of Compounds 1 and 2

Compounds 1 and 2 were produced using a moderated procedure from Oshio et al. [11]. For compound 1, [Fe(L1)2](BF4)2 (38.2 mg, 0.05 mmol) in MeNO2 (5 mL) was added dropwise to a solution of (C4H9)4N[Ni(mnt)2] (69.7 mg, 0.12 mmol) in MeNO2 (10 mL). The resulting dark green/brown solution was kept at −20 °C overnight to yield a dark brown microcrystalline powder, which was collected and washed with cold MeNO2. Recrystallisation was achieved by redissolving the solid in hot MeNO2, followed by cooling at −20 °C to give thin brown plate-like crystals. Yield 64%. Found C, 43.18; H, 2.02; N, 19.42. Calcd for [Fe(L1)2][Ni(mnt)2]2, C46H34N18S8FeNi2: C, 43.55; H, 2.00; N, 19.87.
Compound 2 was prepared by a similar procedure except using [Fe(L2)2](BF4)2 in place of [Fe(L1)2](BF4)2. In this case, small black prism-shaped crystals precipitated after standing for 2 hours, without the need for cooling. Yield 58%. Found C, 40.85; H, 2.60; N, 22.19. Calcd for [Fe(L2)2][Ni(mnt)2]2.MeNO2, C45H35N21S8O2FeNi2: C, 40.59; H, 2.65; N, 22.09.

4. Conclusions

Two novel salts have been synthesized: compound 1 with formula [Fe(L1)2][Ni(mnt)2]2 and compound 2 with formula [Fe(L2)2][Ni(mnt)2]2.MeNO2. L1 and L2, which are methylated derivatives of a series of ligands that are present in several Fe(II) complexes that exhibit SCO, albeit such salts typically have simple counterions such as BF4 and ClO4. Bulk magnetization studies indicate that both compounds 1 and 2 show SCO. However, for compound 1, the SCO is incomplete up to 350 K and only represents a small conversion from the LS to HS state. Consequently, there is little evidence from variable temperature single crystal structural data that the typical structural transitions that accompany SCO are fully developed. By contrast, bulk magnetization measurements on compound 2 show that the compound is in the LS state below 100 K and almost completely HS at 350 K. The associated Fe-ligand bond length changes and geometry distortions are clearly observed even at 290 K, when most of the Fe complexes are in the HS state. Furthermore, the SCO in compound 2 is confirmed using Mossbauer spectroscopy. The introduction of the [Ni(mnt)2] anion illustrates the chemical flexibility and robust nature of SCO in these types of Fe(II) complexes. It also points to the possibility of incorporating secondary functionality into SCO materials.

Author Contributions

Conceptualization, methodology, analysis and article preparation S.S.T.; synthesis and magnetization measurements J.D.; X-ray crystallography (compound 1) P.N.H. & S.J.C. X-ray crystallography (compound 2) and discussions on magnetic data H.A.; Mössbauer spectroscopy V.S. All authors have read and agreed to the published version of the manuscript.

Funding

V.S. acknowledges the support of the research initiative NANOKAT. The PhD studies of J.D. were supported by the University of Surrey and EPSRC.

Data Availability Statement

Data available on request from the corresponding author. Data available includes raw SQUID magnetization and Mössbauer data. The crystallographic data has been submitted to the Cambridge Crystallographic Data Centre. The deposition references are CCDC 2080108 (cpd 1 100 K), 2080109 (cpd 2 293 K). 2080110 (cpd 2 100 K) and 2080111 (cpd 2 290 K) Available online: http://www.ccdc.cam.ac.uk/conts/retrieving.html.

Acknowledgments

S.S.T. would like to express his gratitude to Peter Day FRS with whom he worked for 10 years at the Royal Institution of Great Britain. Peter’s passion, drive and scientific insight continues to provide inspiration to study the fascinating topic of molecular materials.

Conflicts of Interest

The authors declare no conflict of interest. The funders had no role in the design of the study; in the collection, analyses, or interpretation of data; in the writing of the manuscript, or in the decision to publish the results.

References

  1. Cambi, L.; Szegö, L. The magnetic susceptibility of complex compounds. Ber. Deutsch. Chem. Ges. 1931, 64, 2591–2598. [Google Scholar] [CrossRef]
  2. Cambi, L.; Malatesta, L. Magnetism and polymorphy of internal complex salts—Iron salts ofdithio-carbonicamide acids. Ber. Deutsch. Chem. Ges. 1937, 70, 2067–2078. [Google Scholar] [CrossRef]
  3. Kahn, O.; Martinez, C.J. Spin transition polymers: From materials towards memory devices. Science 1998, 179, 44–48. [Google Scholar] [CrossRef]
  4. Hayami, S.; Holmes, S.M.; Halcrow, M.A. Spin-state switching in molecular materials. J. Mater. Chem. C. 2015, 3, 7775–7778. [Google Scholar] [CrossRef]
  5. Gütlich, P.; Gaspar, A.B.; Garcia, Y. Spin-state switching in iron coordination compounds. Beilstein J. Org. Chem. 2013, 9, 342–381. [Google Scholar] [CrossRef] [Green Version]
  6. Bonhommeau, S.; Guillon, T.; Daku, L.M.L.; Demont, P.; Costa, J.S.; Létard, J.F.; Molnár, G.; Bousseksou, A. Photoswitching of the dielectric constant of the spin-crossover complex [Fe(L)(CN)2].H2O. Angew. Chem. Int. Ed. 2006, 45, 1625–1629. [Google Scholar] [CrossRef] [Green Version]
  7. Guilon, T.; Bonhommeau, S.; Costa, J.S.; Zwick, A.; Létard, J.F.; Demont, P.; Molnár, G.; Bousseksou, A. On the dielectric properties of the spin-crossover complex [Fe(bpp)2][BF4]2. Phys. Status Solidi A Appl. Mat. Sci. 2006, 203, 2974–2980. [Google Scholar] [CrossRef]
  8. Schäfer, B.; Bauer, T.; Faus, I.; Wolny, J.A.; Dahms, F.; Fuhr, O.; Lebedkin, S.; Wille, H.C.; Schlage, K.; Chevalier, K.; et al. A luminescent Pt2Fe spin-crossover complex. Dalton Trans. 2017, 46, 2289–2302. [Google Scholar] [CrossRef]
  9. Wang, C.F.; Li, R.F.; Chen, X.Y.; Wei, R.J.; Zheng, L.S.; Tao, J. Synergistic spin-crossover and fluorescence in one-dimensional hybrid complexes. Angew. Chem. Int. Ed. 2015, 54, 1574–1577. [Google Scholar] [CrossRef]
  10. Jiao, Y.; Zhu, J.P.; Guo, Y.; He, W.J.; Guo, Z.J. Synergetic effect between spin-crossover and luminescence in the [Fe(bpp)2][BF4]2 (bpp=2,6-bis(pyrazol-1-yl)pyridine complex. J. Mater. Chem. C 2017, 5, 5214–5222. [Google Scholar] [CrossRef]
  11. Nihei, M.; Takahashi, H.; Nishikawa, H.; Oshio, H. Spin-crossover behavior and electrical conduction property in iroj(II) complexes with tetrathiafulvalene derivatives. Dalton Trans. 2011, 40, 2154–2156. [Google Scholar] [CrossRef] [Green Version]
  12. Halcrow, M.A. Structure-function relationships in molecular spin-crossover complexes. Chem. Soc. Rev. 2011, 40, 4119–4142. [Google Scholar] [CrossRef] [PubMed]
  13. Boillot, M.L.; Weber, B. Mononuclear ferrous and ferric complexes. Compte. Rendus. Chim. 2018, 1196–1208. [Google Scholar] [CrossRef]
  14. Kumar, K.S.; Ruben, M. Emerging trends in spin-crossover (SCO) based functional materials. Coord. Chem. Rev. 2017, 346, 176–205. [Google Scholar] [CrossRef]
  15. Halcrow, M.A. The synthesis and coordination chemistry of 2, 6-bis(pyrazolyl)pyridines and related ligands—Versatile terpyridine analogues. Coord. Chem. Rev. 2005, 249, 2880–2908. [Google Scholar] [CrossRef]
  16. Halcrow, M.A. Iron(II) complexes of 2,6-di(pyrazol-1-yl)pyridines—A versatile system for spin-crossover research. Coord. Chem. Rev. 2009, 253, 2493–2514. [Google Scholar] [CrossRef]
  17. Cook, L.J.K.; Mohammed, R.; Sherborne, G.; Roberts, T.D.; Alvarez, S.; Halcrow, M.A. Spin state behavior of iron(II)/dipyrazolylpyridine complexes. New insights from crystallographic and solution measurements. Coord. Chem. Rev. 2015, 289, 2–12. [Google Scholar] [CrossRef]
  18. Coronado, E.; Galán-Mascarós, J.R.; Giménez-López, M.C.; Almeida, M.; Waerenborgh, J.C. Spin-crossover Fe(II) complexes as templates for bimetallic oxalate-based 3D magnets. Polyhedron 2007, 26, 1838–1844. [Google Scholar] [CrossRef]
  19. Cassoux, P.; Valade, L.; Kobayashi, H.; Kobayashi, A.; Clark, R.A.; Underhill, A.E. Molecular metals and superconductors derived from metal complexes of 1,3-dithiol-2-thione-4,5-dithiolate (dmit). Coord. Chem. Rev. 1991, 110, 115–160. [Google Scholar] [CrossRef]
  20. Robertson, N.; Cronin, L. Metal bis-1,2-dithiolene complexes in conducting or magnetic crystalline assemblies. Coord. Chem. Rev. 2002, 227, 93–127. [Google Scholar] [CrossRef]
  21. Cassoux, P. Molecular (super)conductors derived from bis-dithiolate metal complexes. Coord. Chem. Rev. 1999, 185, 213–232. [Google Scholar] [CrossRef]
  22. Dorbes, S.; Valade, L.; Real, J.A.; Faulmann, C. [Fe(sal2-trien)][Ni(dmit)2]; towards switchable spin crossover molecular conductors. Chem. Comm. 2005, 69–71. [Google Scholar] [CrossRef] [PubMed] [Green Version]
  23. Szilágyi, P.A.; Dorbes, S.; Molnár, G.; Real, J.A.; Homonnay, Z.; Faulmann, C.; Bousseksou, A. Temperature and pressure effects on the spin state of ferric ions in the [Fe(sal2-trien)][Ni(mnt)2] spin crossover complex. J. Phys. Chem. Solids 2008, 69, 2681–2686. [Google Scholar] [CrossRef] [Green Version]
  24. Faulmann, C.; Szilágyi, P.A.; Jacob, K.; Chahine, J.; Valade, L. Polymorphism and its effects on the magnetic behaviour of the [Fe(sal2-trien)][Ni(dmit)2] spin-crossover complex. New J. Chem. 2009, 33, 1268–1276. [Google Scholar] [CrossRef]
  25. Faulmann, C.; Dorbes, S.; Real, J.A.; Valade, L. Electrical conductivity and spin crossover: Towards the first achievement with a metal bis-dithiolene complex. J. Low Temp. Phys. 2006, 142, 261–266. [Google Scholar] [CrossRef]
  26. Faulmann, C.; Dorbes, S.; de Bonneval, W.G.; Molnár, G.; Bousseksou, A.; Gomez-Garcia, C.J.; Coronado, E.; Valade, L. Towards molecular conductors with a spin-crossover phenomenon: Crystal structures, magnetic properties and Mössbauer spectra of [Fe(salten)Mepepy][M(dmit)2]. Eur. J. Inorg. Chem. 2005, 16, 3261–3270. [Google Scholar] [CrossRef]
  27. Takahashi, K.; Cui, H.B.; Okano, Y.; Kaboyashi, H.; Einaga, Y.; Sato, O. Electrical conductivity modulation coupled to a high-spin-low-spin conversion in the molecular system [Fe-III(qsal)2][Ni(dmit)2]3.CH3CN.H2O. Inorg. Chem. 2006, 45, 5739–5741. [Google Scholar] [CrossRef] [PubMed]
  28. Nihei, M.; Tahira, H.; Takahashi, N.; Otake, Y.; Yamamura, Y.; Saito, K.; Oshio, H. Multiple bistability and tristability with dual spin-state conversions in [Fe(dpp)2][Ni(mnt)2].MeNO2. J. Am. Chem. Soc. 2010, 132, 3553–3560. [Google Scholar] [CrossRef]
  29. Farrugia, L.J. WinGX and ORTEP for Windows: An update. J. Appl. Cryst. 2012, 45, 849–854. [Google Scholar] [CrossRef]
  30. Ketkaew, R.; Tabtirungrotechai, Y.; Harding, P.; Chastanet, G.; Guionneau, P.; Machivie, M.; Harding, D.J. OctaDist: A tool for calculating distortion parameters in spin crossover and coordination complexes. Dalton Trans. 2021, 50, 1086–1096. [Google Scholar] [CrossRef]
  31. Ribera, A.; Rovira, C.; Veciana, J.; Tarrés, J.; Canadell, E.; Rousseau, R.; Molins, E.; Mas, M.; Schoeffel, J.P.; Pouget, J.P.; et al. The [(DT-TTF)2M(mnt)2] family of radical ion salts: From a spin ladder to delocalized conduction electrons that interact with localized magnetic moments. Chem. Eur. J. 1999, 5, 2025. [Google Scholar] [CrossRef]
  32. Elhaїk, J.; Money, V.A.; Barrett, S.A.; Kilner, C.A.; Evans, I.R.; Halcrow, M.A. The spin states and spin-crossover behaviour of iron(II) complexes of 2,6-dipyrazol-1-ylpyrazine derivatives. Dalton Trans. 2003, 10, 2053–2060. [Google Scholar] [CrossRef]
  33. Bain, G.A.; Berry, J.F. Diamagnetic corrections and Pascal’s constants. J. Chem. Educ. 2008, 85, 532–536. [Google Scholar] [CrossRef]
  34. Sheldrick, G.M. Crystal structure refinement with SHELXL. Acta. Cryst. C 2015, 71, 3–8. [Google Scholar] [CrossRef] [PubMed]
  35. Betteridge, P.W.; Carruthers, J.R.; Cooper, R.I.; Prout, K.; Watkin, D.J. CRYSTALS version 12: Software for guided crystal structure analysis. J. Appl. Cryst. 2003, 36, 1487. [Google Scholar] [CrossRef]
  36. Jameson, D.L.; Goldsby, K.A. 2,6-bis(N-pyrazolyl)pyridines—The convenient synthesis of a family of planar tridentate N3 ligands that are terpyridine analogs. J. Org. Chem. 1990, 55, 4992–4994. [Google Scholar] [CrossRef]
Scheme 1. Ligands (left) used in this work, where X = C (ligand L1) and X = N (L2). Mono-anionic complex, [Ni(III)(mnt)2], (right) used in this work.
Magnetochemistry 07 00072 sch001
Figure 1. The molecular structure of compound 1 at 100 K, in the ORTEP [29] style with 50% thermal ellipsoids and atom numbering scheme. H atoms have been omitted for clarity.
Magnetochemistry 07 00072 g001
Figure 2. The molecular structure of compound 2 at 100 K, in the ORTEP [29] style with 50% thermal ellipsoids and atom numbering scheme. H atoms have been omitted for clarity.
Magnetochemistry 07 00072 g002
Figure 3. The crystal packing of compound 1 at 100 K. Short contacts between S atoms are indicated by black dotted lines. H atoms have been omitted for clarity.
Magnetochemistry 07 00072 g003
Figure 4. The crystal packing of compound 2 at 100 K. H atoms have been omitted for clarity.
Magnetochemistry 07 00072 g004
Figure 5. Temperature dependence of the product χmT for compound 1 (left) and compound 2 (right). Full circles are measurements of warmings from 2 to 350 K, while open circles are measurements and there is cooling across the same temperature range.
Magnetochemistry 07 00072 g005
Figure 6. Mössbauer spectra of compound 2, at 300 K (top), 200 K (middle) and 100 K (bottom). Experimental data are in black dots and the lines are data fitted, giving the parameters listed in Table 2. Fitting curves are low-spin (blue), high-spin (green) and total (red).
Magnetochemistry 07 00072 g006
Figure 7. Graph derived from integral analysis of the Mössbauer data, showing temperature variation of the high-spin Fe(II) fraction in compound 2.
Magnetochemistry 07 00072 g007
Table 1. Crystallographic data and collection parameters for compounds 1 and 2.
ParameterCompound 1Compound 2
Empirical formulaC46H34N18S8FeNi2C45H35N21S8O2FeNi2
Molecular Mass1268.661331.64
T/K100(2)293(2)100(2)290(2)
CCDC number2080108208010920801102080111
Crystal color & shapeBrown PlateBlack Prism
Crystal systemTriclinicTriclinic
Space GroupP-1 (2)P-1 (2)
a/Å11.1318(3)11.2229(5)13.3643(6)13.4983(8)
b/Å12.1322(4)12.3046(6)14.7900(6)15.1017(10)
c/Å19.4594(6)19.6208(7)14.9875(8)15.1633(9)
α/°94.543(2)93.625(3)79.731(6)79.756(6)
β/°90.216(2)89.349(3)81.844(6)81.882(6)
γ/°92.986(2)90.932(4)69.962(5)68.796(3)
Volume/Å32616.16(14)2703.6(2)2728.01(15)2825.8(3)
Wavelength/Å0.710750.71075
Radiation TypeMo KαMo Kα
Z2222
μ/mm−11.3601.3161.3121.267
Measured reflections33346356192632127746
Independent reflections11866123261241812853
Reflections I ≥ 2 σ(I)7764698277096893
wR1 (all data)0.09560.11090.08280.1435
R1, I ≥ 2 σ(I)0.04960.05280.04560.0772
Table 2. Fitting parameters for variable temperature Mössbauer spectra 1 for compound 2.
Temperature/KSpin State δΔEQΓ
300HS0.981.780.49
LS0.290.640.42
200HS1.012.050.34
LS0.390.630.34
100HS1.102.380.40
LS0.400.640.35
1 δ is the isomer shift (±0.02 mm s−1), ΔEQ is the quadrupole splitting (±0.02 mm s−1) and Γ is the full width and has the maximum of the peaks (±0.03 mm s−1). HS = high spin. LS = low spin.
Publisher’s Note: MDPI stays neutral with regard to jurisdictional claims in published maps and institutional affiliations.