Article

Assessment of Fatty Acid Composition, Bioactive Compounds, and Mineral Composition in Hazelnut Genetic Resources: Implications for Nutritional Value and Breeding Programs

1
Faculty of Agriculture, Department of Horticulture, Erciyes University, 38280 Kayseri, Türkiye
2
Faculty of Agriculture, Department of Horticulture, Ordu University, 52200 Ordu, Türkiye
3
Faculty of Agriculture, Department of Horticulture, Sakarya University of Applied Sciences, 54187 Sakarya, Türkiye
4
Faculty of Agriculture, Department of Horticulture, Igdır University, 76000 Igdır, Türkiye
5
Faculty of Horticulture, Department of Fruit Science, Mendel University, 61300 Lednice, Czech Republic
6
Faculty of Agriculture, Department of Agricultural Biotechnology, Erciyes University, 38280 Kayseri, Türkiye
*
Authors to whom correspondence should be addressed.
Horticulturae 2023, 9(9), 1008; https://doi.org/10.3390/horticulturae9091008
Submission received: 17 August 2023 / Revised: 1 September 2023 / Accepted: 5 September 2023 / Published: 7 September 2023
(This article belongs to the Section Genetics, Genomics, Breeding, and Biotechnology (G2B2))

Abstract

:
This study was carried out to determine the fatty acid composition, bioactive compounds, and mineral element content of standard hazelnut cultivars and accessions from the Eastern Black Sea region. A wide variation was determined in terms of the traits examined between hazelnut accessions and cultivars. Most of the accessions investigated had higher values of bioactive compounds, oleic acid, stearic acid, Na, and Ca than the standard cultivars. Among accessions investigated, S-1 had the highest total phenolics and antioxidants (557.3 mg/100 g and 0.53 mmol/100 g) while P-4 had the lowest (307.3 mg/100 g and 0.22 mmol/100 g). The highest oleic acid content was determined in P-2 (87.16%); the lowest was in H-1 (71.24%). Linoleic acid ranged from 4.35% (P-1) to 18.06% (H-1). P-2 (3349 mg/kg and 2464 mg/kg, respectively) had the highest K and P contents. The highest Mg content was found in S-1 (1787 mg/kg). The highest value of Ca and Na was determined in P-1 (2701 mg/kg and 412 mg/kg, respectively). Principal component analysis revealed that the traits studied could effectively explain the variability among hazelnut genetic sources. First, three components explained about 60% of total variation. PC1 was related to arachidonic acid and most of the mineral elements (P, K, Mg, Ca, Fe, Mn, Zn, Cu, B, Cd, Ni, and S), and explained 27.6% of the total variation. PC2 explained 18.3% of the total variation, and was mainly related to oleic, linoleic, and linolenic acid, as well as Ca. PC3 was related to total phenolics, total flavonoids, antioxidant activity, and palmitic acid, and explained 14.5% of total variation. The oleic acid had a strong negative correlation with linoleic acid (−0.99 ***) and linolenic acid (−0.95 ***). A strong positive correlation was determined between antioxidant activity and total flavonoids (r = 0.95 ***). K content showed a strong positive correlation with P (r = 0.92 ***) and Mg (r = 0.82 ***) contents. A strong positive correlation was also determined between P and Mg (r = 0.91***). These findings revealed that many of the accessions investigated were a good source of fatty acids and bioactive compounds. As a conclusion, most accessions with superior nutritional content can be evaluated as genetic material for the development of new cultivars in hazelnut breeding programs.

1. Introduction

Hazelnut (Corylus L.) is a popular tree fruit belonging to the Betulaceae family of the order Fagales [1]. There are about 13 different species in the genus Corylus, some of which are shrubs and some of which are trees. For example, species such as Corylus avellana L., C. americana Marshall, C. cornuta Marshall, C. heterophylla Fischer, and C. sieboldiana Blume grow as high shrubs, while species such as C. colurna L, C. jacquemontii Decaisne, C. chinensis Franchet, and C. ferox Wallich exhibit tree form [2]. Among the most preferred commercial species in cultivation are Corylus avellana L. and Corylus colurna L., the latter of which is known for its strong root structure and is used as rootstock in breeding studies. Hazelnut trees grow wild, especially in the temperate regions of the northern hemisphere, and these wild species have spread over a wide geography, including Japan, China, Turkey, European countries, and the USA [3]. The origins of this spread can be traced back to Anatolia, Central Asia, and the Caucasus, and the Eastern Black Sea region of Anatolia is known as the first place where hazelnuts were cultivated, and this region offers an ecology highly favorable to the cultivation of hazelnuts. Therefore, this region is considered the homeland of hazelnut and the first place where it was cultivated [4,5].
The Black Sea Region, which has an important potential in terms of hazelnut production areas and production in Turkey, is among the four main hazelnut gene centers in the world [6]. In addition, it is one of the regions with the largest hazelnut collection among the regions with hazelnut genetic resources in the world [7]. In the region, which has a rich potential in terms of hazelnut genetic resources, Tombul, Palaz, Çakıldak, Mincane, and Foşa hazelnut varieties are widely grown. Within the populations of these varieties, there is a unique genetic diversity with different characteristics [8].
In 2021, world hazelnut production is approximately 1.1 million tons. Turkey is the leading producer country, with 684 thousand tons, and accounts for about 62% of world production [9]. Hazelnut is one of the most produced nuts worldwide, and most of this production takes place in the Eastern Black Sea Region. Turkey is followed by Italy, the United States of America, Iran, China, and Spain [10]. Turkey is also considered one of the places where hazelnuts naturally spread, as well as the area with the most valuable wild species and a source of cultural diversity [11,12].
Hazelnut fruit is a plant with a very high economic value and is widely used in the food, pharmaceutical, and cosmetic industries. Hazelnut, which is an important part of the daily diet in both developed and developing countries, is widely used in many areas from confectionery to ice cream, bakery products to chocolate [13]. It can be consumed roasted or raw, chopped, or whole; hazelnut oil is also used in cooking and is often integrated into food products. For example, various processed food products contain hazelnuts, such as spreadable chocolate, cereals, cookies, nougat, pastry, ice cream, and cooking oil [14,15].
Hazelnuts are also rich in lipids, fatty acids, dietary fiber, vitamins, phenolic compounds, and micro-macro mineral elements. Thanks to these compounds, it stands out as a source of antioxidants in the prevention of diseases such as neurodegenerative diseases, inflammation, cardiovascular diseases, colon cancer and diabetes [16,17]. The outer shell of hazelnuts accounts for 50% to 70% of its total weight. Chemically, it contains compounds such as hemicelluloses (22–30% a/a), cellulose (25–28% a/a) and lignin (40–50% a/a) [18,19].
Hazelnuts are a promising source of raw materials for bioactive compounds. However, there is a lack of information on their chemical composition. Moreover, the demand for substitutes for synthetic products is increasing. There is a need to replace non-renewable resources with renewable ones. For example, while most consumed products contain antioxidant compounds, the demand for natural antioxidants has recently increased, replacing artificial ones. Antioxidant activity is associated with bioactive components such as phenolic compounds, which have positive effects on human health, such as reducing oxidative stress and inhibiting macromolecular oxidation [20,21,22].
Furthermore, phenolic compounds have antiallergenic, antiatherogenic, anti-inflammatory, antimicrobial, and antithrombotic properties. Many industrial sectors require active chemical compounds for use in their final products [23]. The beneficial properties contained in natural products are critical for cosmetics, health care products, pharmaceuticals, and food industries. This has increased research interest in developing efficient extraction techniques, increasing product yields while reducing time and solvent consumption [24]. There are many studies on the nutrient content of hazelnut in Turkey. There are studies in the literature in terms of fatty acid composition [25,26,27], bioactive compounds [17,28,29], and mineral contents [30,31,32].
However, there is no comprehensive study on the evaluation of the high hazelnut variation of the Eastern Black Sea region in terms of fatty acid composition, bioactive compounds, and mineral contents. This study was carried out to determine the fatty acid composition, bioactive compounds, and mineral contents of hazelnut germplasm from the Eastern Black Sea region.

2. Materials and Methods

2.1. Plant Materials

The research material consists of thirteen hazelnut accessions (Ç-1, Ç-2, Ç-3, H-1, H-2, H-3, P-1, P-2, P-3, P-4, S-1, T-1, and T-2) from different provinces [(40°46′32″ N 38°39′45″ E, 591 m (Giresun); 40°55′58″ N 37°25′48″ E, 553 m (Ordu); 41°11′25″ N 36°36′40″ E, 22 m (Samsun)] in the East Black Sea Region, and five standard hazelnut cultivars (Çakıldak, Mincane, Palaz, Sivri, and Tombul).

2.2. Sample Preparation

Randomly selected hazelnuts from hazelnut orchards were manually picked in the second week of August after the green shells turned yellow and the moisture content dropped to 30%. Hazelnut samples were harvested to represent (from part of bottom, middle, and top) the whole plant. After separation from the green shells, the hazelnuts were sun-dried for 3 days until their moisture content dropped to 6%. The 300 g sample from each plant was stored at +4 °C until the day of analysis. Before analysis, the nuts were cracked, shelled, and ground. The oil of hazelnut samples was extracted using the Soxhlet extraction method. Obtained oil was used for fatty acid analysis, and defatted hazelnut sample was used for bioactive compounds.

2.3. Fatty Acids Composition

A total of 0.1 g of hazelnut oil was carefully placed in a test tube and weighed on a precision balance, and 1 mL of potassium methoxide and 4 mL of hexane was added. The final mixture was shaken for 30 s. The final supernatants were diluted with hexane and filtered using a 0.45 micron filter. A gas chromatography system (GC) (Shimadzu, Kyoto, Japan) was used to analyze the fatty acid compositions. This system had a flame ionization detector (FID) and a fine capillary column (0.25 mm × 0.20 micron, 100 m).
The temperature of the column was programmed to 140 °C for 5 min, then increased to 240 °C at 4 °C/min and held at 240 °C for 15 min. Injector and detector temperatures were set to 250 °C. Nitrogen was used as carrier gas and the flow rate was set at 3 mL/min. The injection volume was determined as 1 mL according to a 1:100 split ratio. Fatty acid compositions were characterized according to standards based on fatty acid methyl esters (FAMEs), and peaks and retention times were compared. The results obtained were reported as relative area percentages of the indicated fatty acids [33]. The resulting fatty acid composition was used for calculations of saturated fatty acids (palmitic, stearic, and arachidic), monounsaturated fatty acids (palmitoleic, oleic and 11-eicosenoic), and polyunsaturated fatty acids (linoleic and linolenic).

2.4. Bioactive Compounds

Bioactive compounds were determined in hazelnut samples in terms of total phenolics, total flavonoids and antioxidant activity (using FRAP and DPPH methods). For the determination of bioactive compounds, 1 g of defatted hazelnut sample was weighed on a precision balance and dissolved with 10 mL methanol. The resulting solution was centrifuged at 12,000 rpm for 30 min at 4 °C. The supernatant obtained was used to determine total phenolics, total flavonoids, and antioxidant activity.

2.4.1. Total Phenolics

Total phenolic content was determined using Folin–Ciocalteu reagent supplied by Merck (Darmstadt, Germany). Samples were measured in a spectrophotometer at a wavelength of 760 nm. The results obtained were expressed as gallic acid equivalent (GAE) in mg/100 g [16].

2.4.2. Total Flavonoids

Total flavonoid content was determined according to the method of Chang et al. [34]. Absorbance values were measured in a Shimadzu spectrophotometer at a wavelength of 415 nm. The results were reported as mg/100 g in quercetin equivalents (QE).

2.4.3. Antioxidant Activity

Antioxidant activity was evaluated by DPPH (2,2-diphenyl-1-picryl-hydrazyl-hydrazyl-hydrate) assays. The prepared samples were measured in a Shimadzu spectrophotometer at wavelengths of 517 nm for DPPH assay. The results were expressed as trolox equivalents (TE) in mmol/100 g [35].

2.5. Mineral Composition

Macro- and micro-element compositions of hazelnut samples were determined according to the method described by Ustaoğlu and Tepe (2019) [36]. Briefly, 0.5 g of ground hazelnut sample was dissolved with 6 mL of pure nitric acid (NHO3) and 2 mL of hydrogen peroxide (H2O2) (30% w/v) in a microwave digestion system (Milestone Start D 260, Sorisole, Italy). The residue was then diluted with deionized water in 10 mL volumetric flow-through. Samples were filtered through a 0.45 mm filter before analysis. Calibration standards were prepared from a multielement standard (Merck, Germany). Samples were analyzed on ICP-MS (Agilent, Santa Clara, CA, USA), and the results were given in mg/kg sample.

2.6. Statistical Analysis

JMP 14.0 (trial) statistical package program was used to analyze the data. Differences in means were determined using the LSD multiple comparison method at a 5% significance level. Principal component analysis was performed to investigate the relation hazelnut accessions and cultivars. Heatmap analysis and grouping of investigated hazelnut cultivars and accessions were performed based on fatty acids, bioactive compounds, and mineral contents. Cluster analysis of investigated traits was performed to a hierarchical clustering method based on Euclidean distances and using Ward’s method. Correlations between investigated traits were determined using Spearman correlation coefficients.

3. Results and Discussion

3.1. Fatty Acid Composition

Hazelnuts are rich in oil and fatty acids. The composition of fatty acids is a crucial characteristic related to the nutritional value and quality of oils. Oleic acid is the most abundant fatty acid in hazelnuts, accounting for 70–80% of the fatty acid composition [37,38]. In the study, significant differences were determined between standard hazelnut cultivars and hazelnut accessions in terms of fatty acids (p < 0.05), except for arachidonic acid. The major fatty acid found in the standard hazelnut cultivars and hazelnut accessions studied was oleic. It was followed by linoleic, palmitic, and stearic acid. Most of the accessions investigated had higher percentages of oleic acid than the standard cultivars (Table 1). Similarly, Özdemir et al. (2001) reported higher percentages of oleic acid in hazelnut accessions than in cultivars [39]. In the hazelnut accessions, the highest percentage of oleic acid was determined in P-2 (87.16%). This was followed by P-1, Ç-2, and P-3 (86.88%, 86.85%, and 86.59%, respectively). The lowest percentage of oleic acid was found in H-1 (71.24%). H-1 (18.6%) had the highest percentage of linoleic acid, while P-1 (4.35%) had the lowest. The highest percentage of palmitic acid was detected in Ç-3 (5.75%), the lowest was in S-1 (4.68%). The highest level of stearic acid was found in P-1 (3.26%), the lowest in T-1 (0.76%). The highest percentages of linolenic, palmitoleic, arachidonic, and myristic acid were determined in H-1 (2.08%), T-1 (0.06%), H-3 (0.06% and 0.09%, respectively). The standard hazelnut cultivars had a range of 70.47% (Palaz) to 83.97% (Mincane) for oleic acid, 7.64% (Mincane) to 19.19% (Palaz) for linoleic acid, 5.42% (Mincane) to 6.09% (Çakıldak) for palmitic acid, 2.17% (Tombul) to 2.85% (Palaz) for stearic acid, and 0.11% (Mincane) to 1.86% (Palaz) for linoleic acid. Palmitoleic, arachidonic, and myristic acids were found in trace amounts (Table 1). In previous studies, Granata et al. (2017) reported that some cultivated and wild hazelnuts grown in Italy had a range of 81 to 84% for oleic acid and 4.8–10.9% for linoleic acid [40].
Król et al. (2019) recorded a range of 78.61 to 82.01% for oleic acid, 10.29 to 12.67% for linoleic acid, 4.66 to 6.01% for palmitic acid, 1.65 to 2.27% for stearic acid, and 0.14 to 0.19% for linolenic acid in different hazelnut cultivars grown in Poland [38]. Rezaei et al. (2014) stated that six hazelnut cultivars grown in Italy had a range of 64.2 to 81.3% for oleic acid and 10.0 to 21.1% for linoleic acid, 0.49 to 9.6% for palmitic acid, 3.5 to 7.8% for stearic acid, 0.6 to 1.6% for palmitoleic acid, and 0.1 to 0.5% for myristic acid [41]. Çetin et al. (2020) recorded a range of 80.36 to 85.11% for oleic acid, 6.04 to 12.17% for linoleic acid, 5.01 to 7.07% for palmitic acid, 1.76 to 6.33% for stearic acid, and 0.12 to 0.28% for palmitoleic acid in different hazelnut cultivars grown in Poland [42]. The results obtained in terms of fatty acids were among the reference values reported by the researchers. However, P-2, P-1, Ç-2, and P-3 had higher oleic acid content than the researchers reported. The oleic acid-rich foods reduce the risk of coronary heart disease by lowering LDL, VLDL, and TAG levels while increasing HDL levels, and promote human health [43]. Furthermore, oleic acid and linoleic acid have a negative relationship [44]. A similar result was recorded in the current study. Except for H-1, H-3, and Ç-1, the linoleic acid content of the other accessions was less than 9% [45], which is a critical value for the food industry. The high stability of accessions with low linoleic acid content indicates that they have a high storage capacity [46]. These accessions (P-2, P-1, Ç-2, and P-3) with high oleic acid and low linoleic acid content can be used as genetic resources in hazelnut breeding programs to develop new cultivars with high oleic acid content and long storage life.

3.2. Bioactive Compounds

Phenolics in hazelnut kernels affect the flavor of the fruit and protect the seed from oxidation during storage [47]. Many researchers have reported on the beneficial effects of phenolic compounds on human health [48,49]. There were significant differences in terms of total phenolics and total flavonoids contents between hazelnut accessions and standard hazelnut cultivars (p < 0.05). Among accessions, S-1 (557.3 mg/100 g) had the highest total phenolics. It was followed by P-1, H3, and T-2 (503.1 mg/100 g, 477.1 mg/100 g, and 451.6 mg/100 g, respectively). P-4 (307.3 mg/100 g) had the lowest total phenolics. In the standard hazelnut cultivars, total phenolics were found between 299.1 mg/100 g (Sivri) and 546.2 mg/100 g (Mincane). Also, the highest total flavonoids were determined in S-1 (17.0 mg/100 g). It was followed by H-3, H-2, and Ç-2 (15.7 mg/100 g, 15.2 mg/100 g, and 14.6 mg/100 g, respectively). P-4 (8.1 mg/100 g) had the lowest total flavonoids. In the standard hazelnut cultivars, total flavonoids ranged from 10.5 mg/100 g (Çakıldak) to 13.7 mg/100 g (Tombul) (Table 2). In previous studies, total phenolics was reported from 157 to 632 mg/100 g in some hazelnut cultivars in Italy [44], and 640 to 1640 mg/100 g in different hazelnut varieties grown in Iran [41]. Total flavonoids were noted between 1.25 and 1.49 mg/100 g in six hazelnut varieties in southeastern Poland [50]. Balık (2021) also reported a total phenolics of 280.3–1130 mg/100 g and total flavonoids of 7.3–65 mg/100 g in standard hazelnut cultivars in Türkiye. The results obtained in terms of total phenolics, and total flavonoids were among the reference values reported by the researchers [26]. However, the total phenolics and total flavonoids values obtained were lower than those reported by Rezaei et al. (2014) and Balık (2021), respectively [26,41]. Genetic structure, ecological conditions, cultural practices, and harvest time all influence phenolics and flavonoids in hazelnut [8,51]. S-1 accession had higher total phenolics and total flavonoids content than both cultivars and accessions studied in this study. Therefore, S-1 accession could contribute to breeding efforts as a source of total phenolics and total flavonoids. Foods high in phenolic content protect against the harmful effects of cancer and oxidative stress, and also promote human health [17].
Significant differences were determined in term of antioxidant activity between hazelnut accessions and standard hazelnut cultivars (p < 0.05). In the accessions, the highest antioxidant activity was found in S-1 (0.53 mmol/100 g). It was followed by T-2, H-3, and T-1 (0.51 mmol/100 g, 0.49 mmol/100 g, and 0.48 mmol/100 g, respectively). The lowest antioxidant activity was determined in P-4 (0.22 mmol/100 g). In the standard hazelnut cultivars, antioxidant activity ranged from 0.29 mmol/100 g (Çakıldak) to 0.42 mmol/100 g (Tombul) (Table 2). According to the DPPH assay, antioxidant activity was reported from 0.12 to 0.24 mmol/100 g in standard hazelnut cultivars grown in Türkiye [26], while it was determined between 0.07 and 0.10 mmol/100 g in hazelnut accessions and cultivars grown in Slovenia [52]. Karakaya (2023) also reported an antioxidant activity of 1.35–1.91 mmol/100 g in important hazelnut cultivars grown in Türkiye. While the antioxidant activity values were lower than those of Karakaya (2023), it was considerably higher than those of other researchers. Antioxidant activity varies depending on genetic structure and environmental factors, cultural practices, harvest time, and stress factors (low and high temperature, drought, diseases, and pests) [8,53,54]. Many of the accessions investigated (particularly S-1 and T-2) were found to possess high antioxidant activity. Antioxidant-rich foods have important effects in reducing the risk of chronic diseases such as cardiovascular, inflammatory, and neurodegenerative disorders, as well as colon cancer [17]. These accessions can be used as genetic material in hazelnut breeding programs as a crucial source of antioxidant activity.

3.3. Mineral Composition

There were significant differences in terms of mineral composition between hazelnut accessions and standard hazelnut cultivars (p < 0.05). Fourteen mineral elements were detected in the hazelnut accessions and cultivars investigated, and K was predominant. It was followed by P, Ca, and Mg. Among accessions, P-2 (3349 mg/kg) had the highest K content. It was followed by P-1, H-3, and Ç-2 (2773 mg/kg, 2732 mg/kg, and 2655 mg/kg, respectively). The highest P content was determined in P-2 (2464 mg/kg); the lowest was in P-4 (1252 mg/kg). P-2 was followed by Ç-2, S-1, and H-3 (2412 mg/kg, 2166 mg/kg, and 2062 mg/kg, respectively). The highest level of Ca was found in P-1 (2701 mg/kg); the lowest was in H-1 (1142 mg/kg). S-1 (1787 mg/kg) had the highest Mg content, while T-2 (1050 mg/kg) had the lowest. The highest Na and S contents were found in P-1 (412 mg/kg) and H-1 (184 mg/kg); the lowest were in T-2 (218 mg/kg) and H-3 (147 mg/kg), respectively. Mn, Zn, Fe, Cu, B, Ni, Pb, and Cd were found in trace amounts. The standard hazelnut cultivars had a range of 1637 mg/kg (Sivri) to 3383 mg/kg (Palaz) for K, 1479 mg/kg (Sivri) to 2281 mg/kg (Palaz) for P, 1689 mg/kg (Sivri) to 2207 mg/kg (Mincane) for Ca, 1188 mg/kg (Sivri) to 1778 mg/kg (Palaz) for Mg, 242 mg/kg (Çakıldak) to 261 mg/kg (Sivri) for Na, 178 mg/kg (Sivri) to 220 mg/kg (Mincane) for S. Other mineral elements (Mn, Zn, Fe, Cu, B, Ni, Pb, and Cd) were found in trace amounts (Table 3). Similarly, many researchers reported that K, P, Ca, and Mg elements predominate in hazelnut, while Mn, Zn, Fe, Cu, B, Ni, Pb, and Cd elements are minor [30,39,42]. In previous studies, in the predominant nutrient elements, Özdemir et al. (2001) reported a range of 4150–5300 mg/kg for K, 1150–2440 mg/kg for Ca, 1670–2250 mg/kg for Mg, and 18.5–39 mg/kg for Na in hazelnut accessions and cultivars grown in Türkiye [39]. Özdemir ve Akıncı (2004) reported that hazelnut cultivars grown in Türkiye had a range of 5516–6637 mg/kg for K, 3358–2788 mg/kg for P, 2228–2665 mg/kg for Ca, 1588–1867 mg/kg for Mg, and 379.5–508.5 mg/kg for Na [55]. Cosmulescu et al. (2013) recorded that different hazelnut cultivars grown in Romania had a range of 5917–6391 mg/kg for K, 3006–4550 mg/kg for P, 720–1309 mg/kg for Ca, 2050–3355 mg/kg for Mg, and 3.6–9.7 mg/kg for Na [56]. Müller et al. (2020) reported that different hazelnut cultivars grown in Germany had a range of 1400–2470 mg/kg for Ca and 1480–2130 mg/kg for Mg [30]. The findings obtained in the current study in terms of K and P content were lower than the researchers’ results, whereas the findings obtained in terms of other mineral elements were among the previously reported reference values. Mineral element composition in hazelnut varies depending on genetic structure, environmental conditions, and harvest time [30,39]. Furthermore, the presence of Fe, Zn, and Cu in hazelnut, as well as its high K/Na ratio, make it interesting for human nutrition [57]. Zn and Cu are critical components for vital metabolic functions and overall health [56]. In the current study, Ç-2 stood out for Fe content, Ç-1 for Zn content, H-1 for Cu content, and P-2 for K/Na. P-2 was also remarkable in terms of P and K content. Accessions, with high levels of crucial minerals, can be used as genetic material in hazelnut breeding efforts.

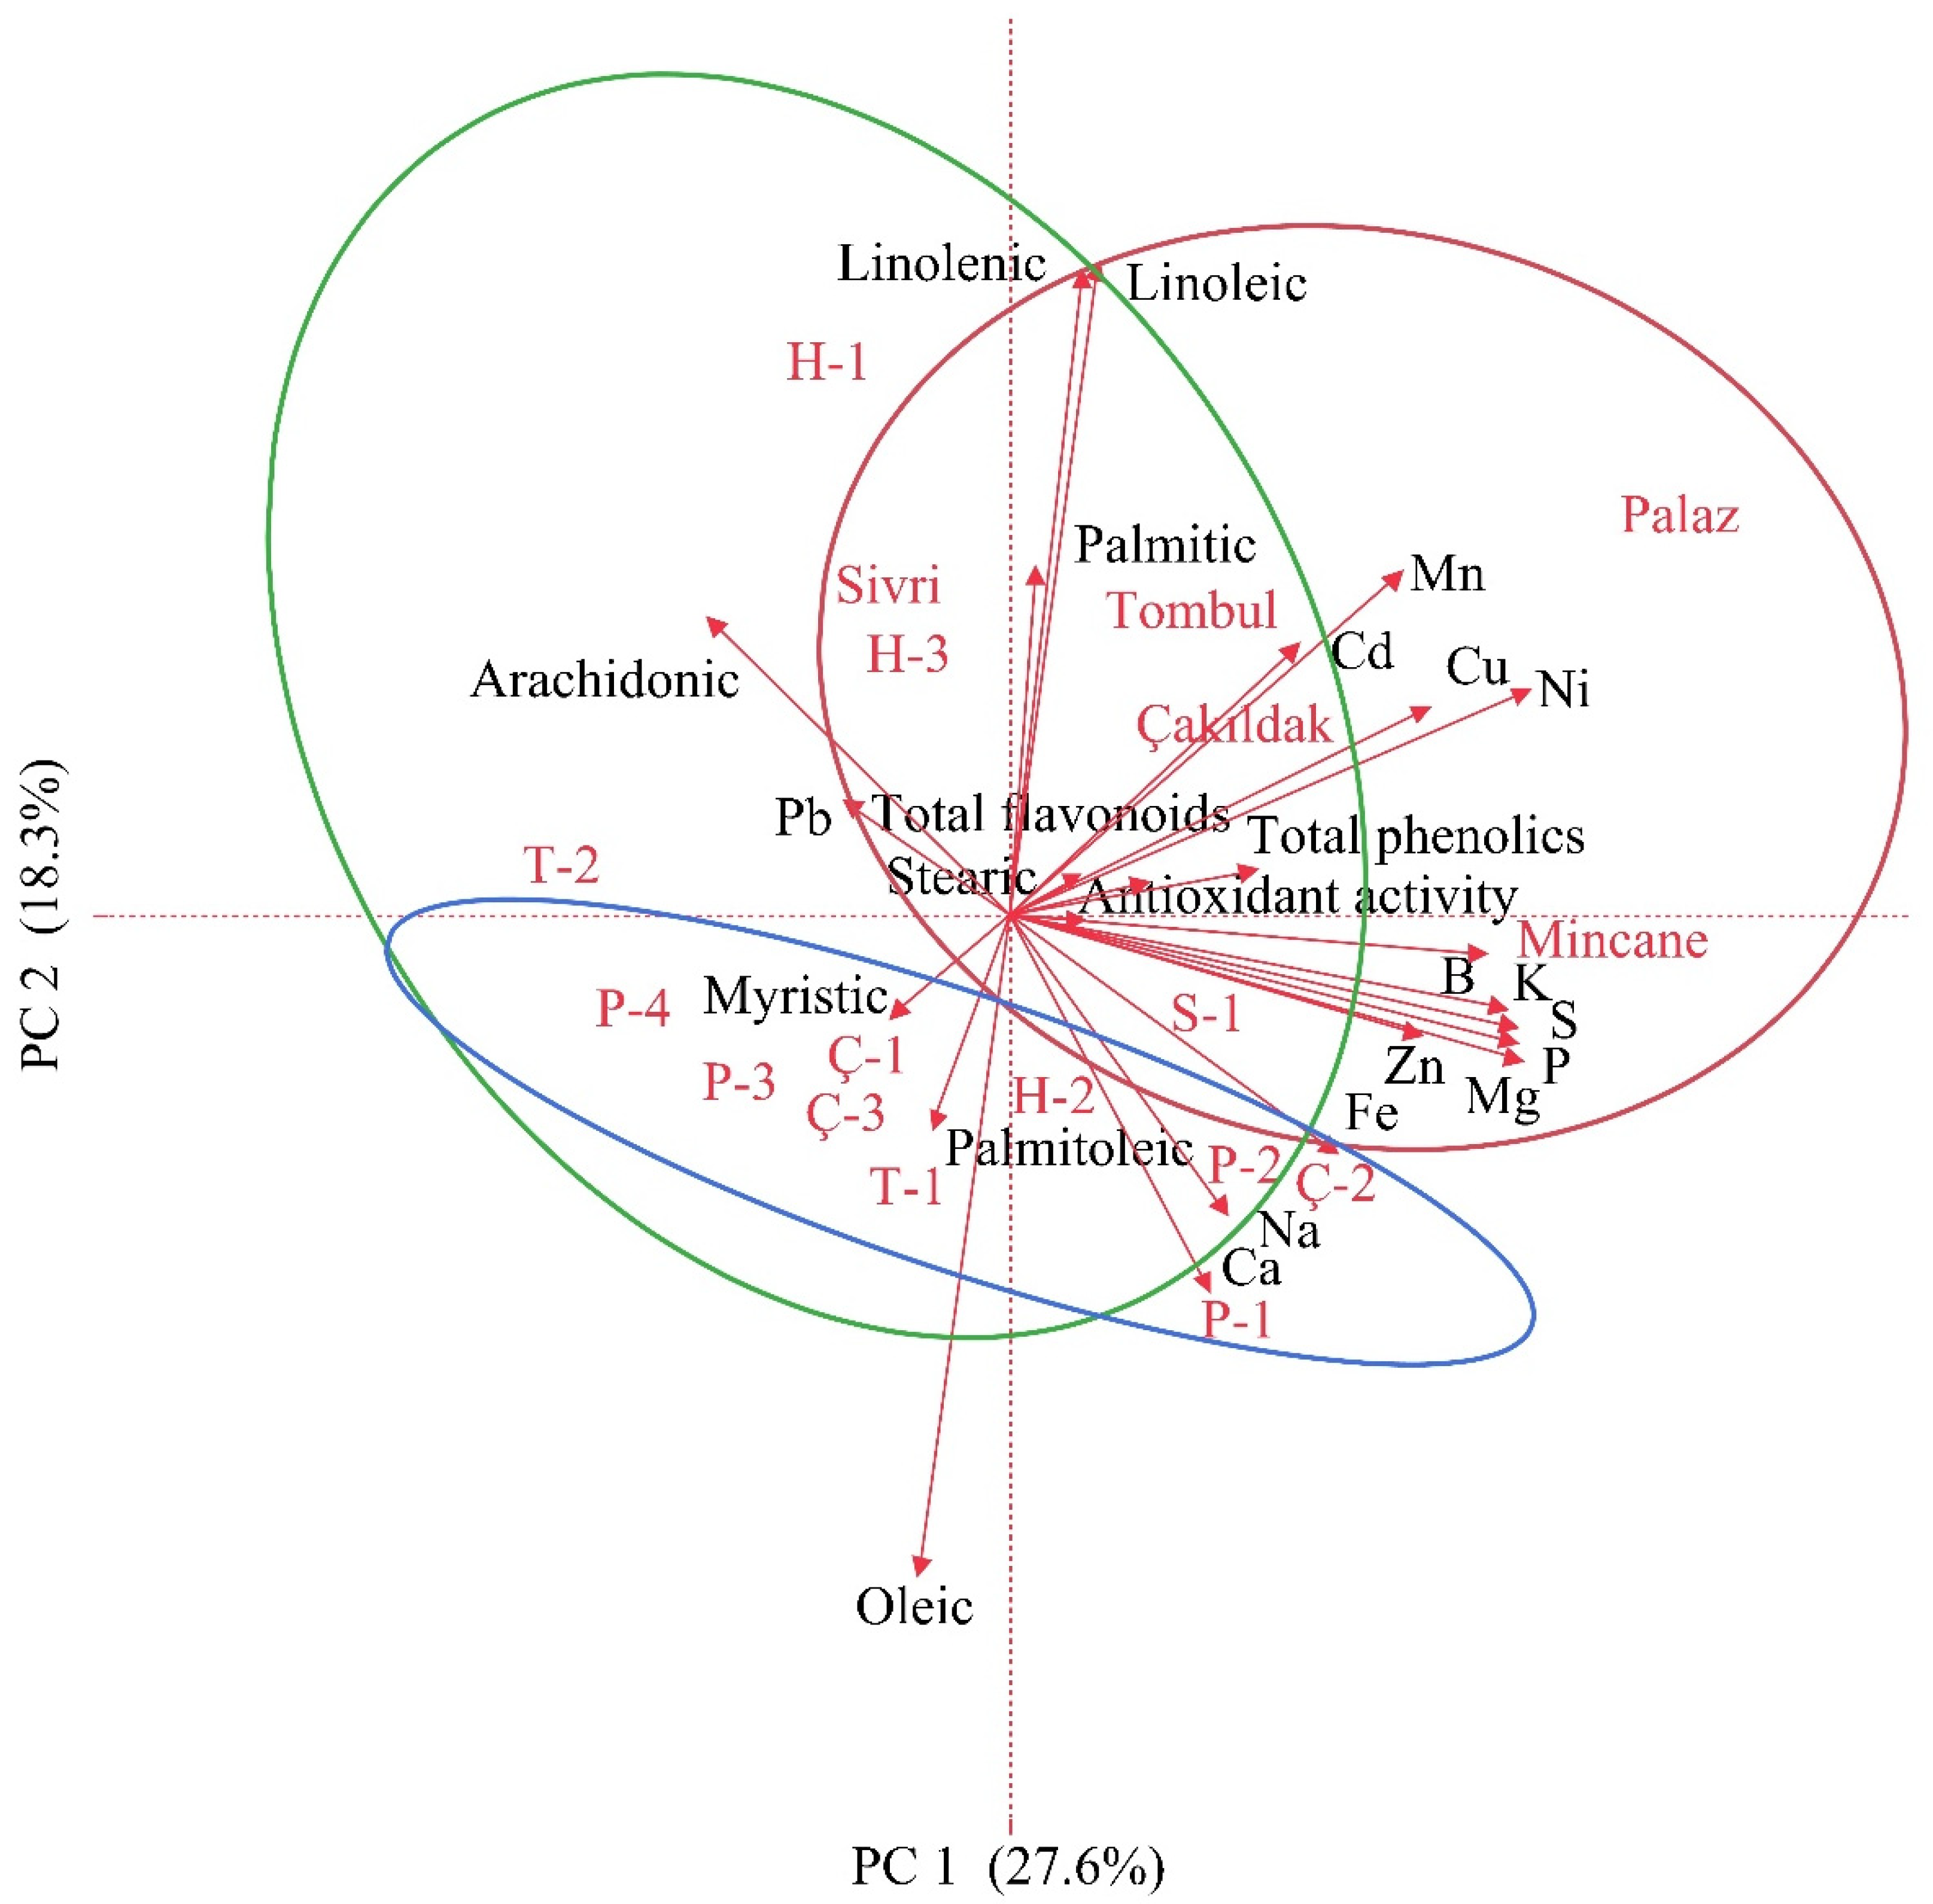
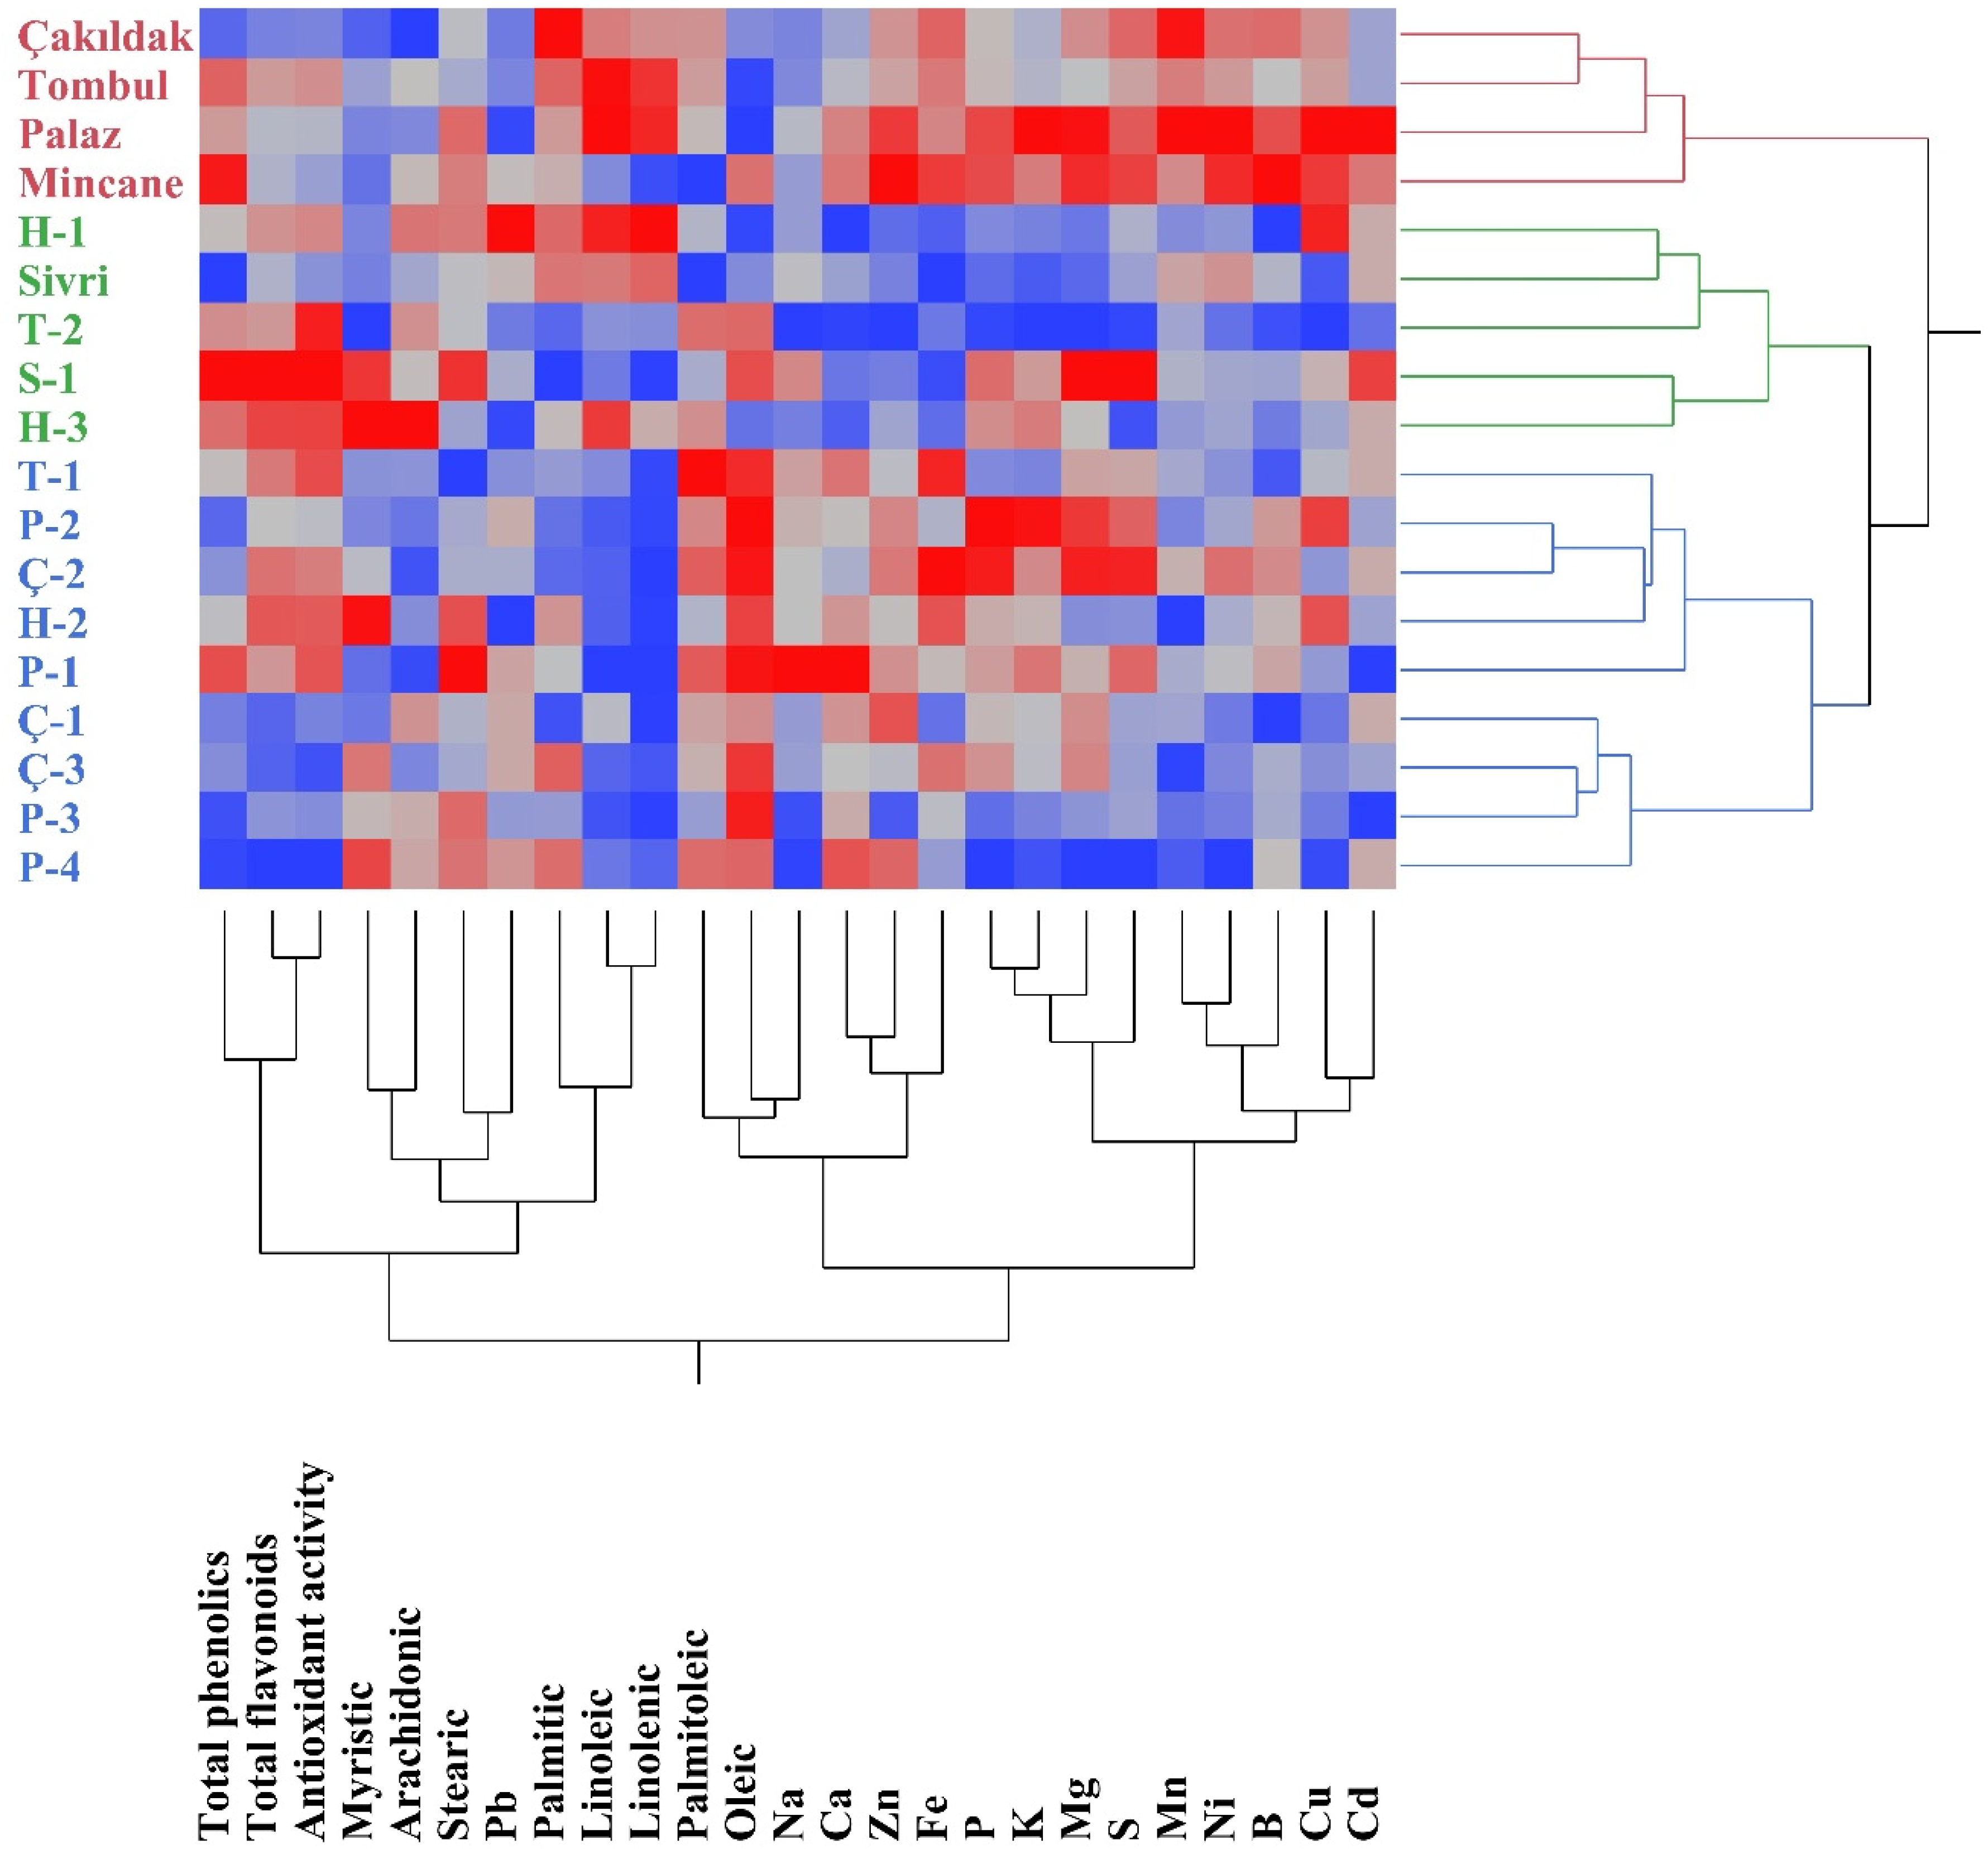
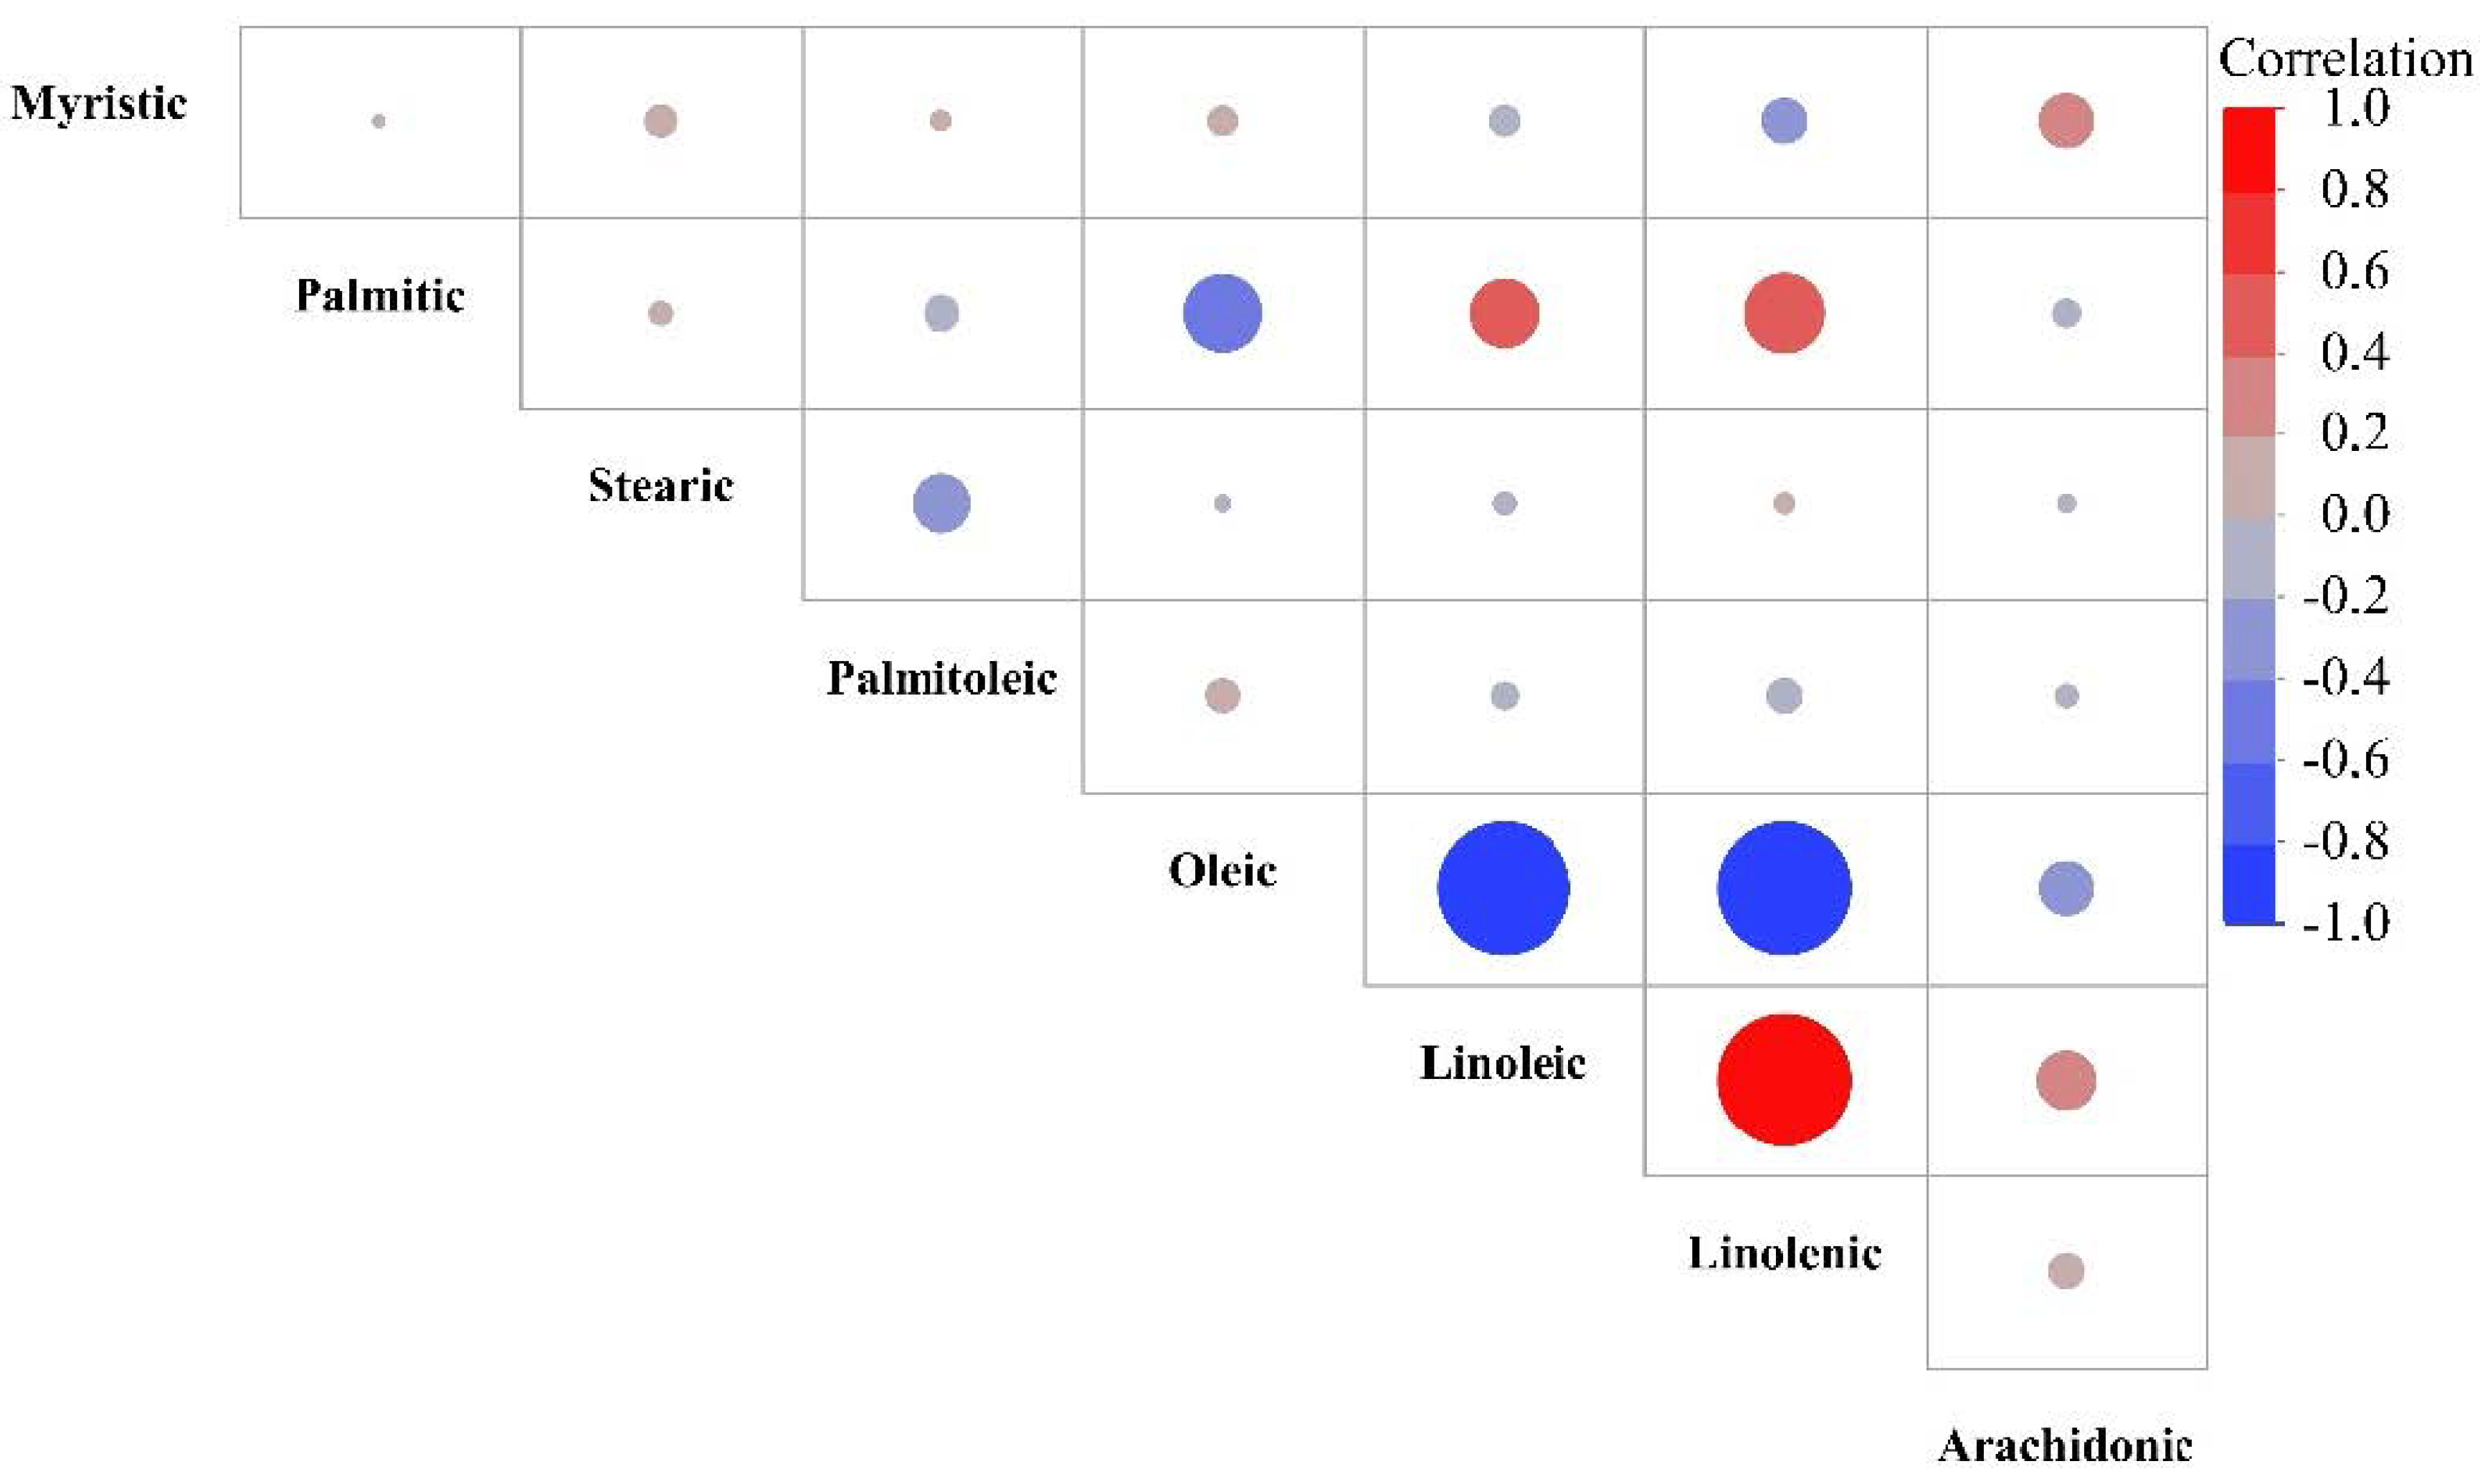
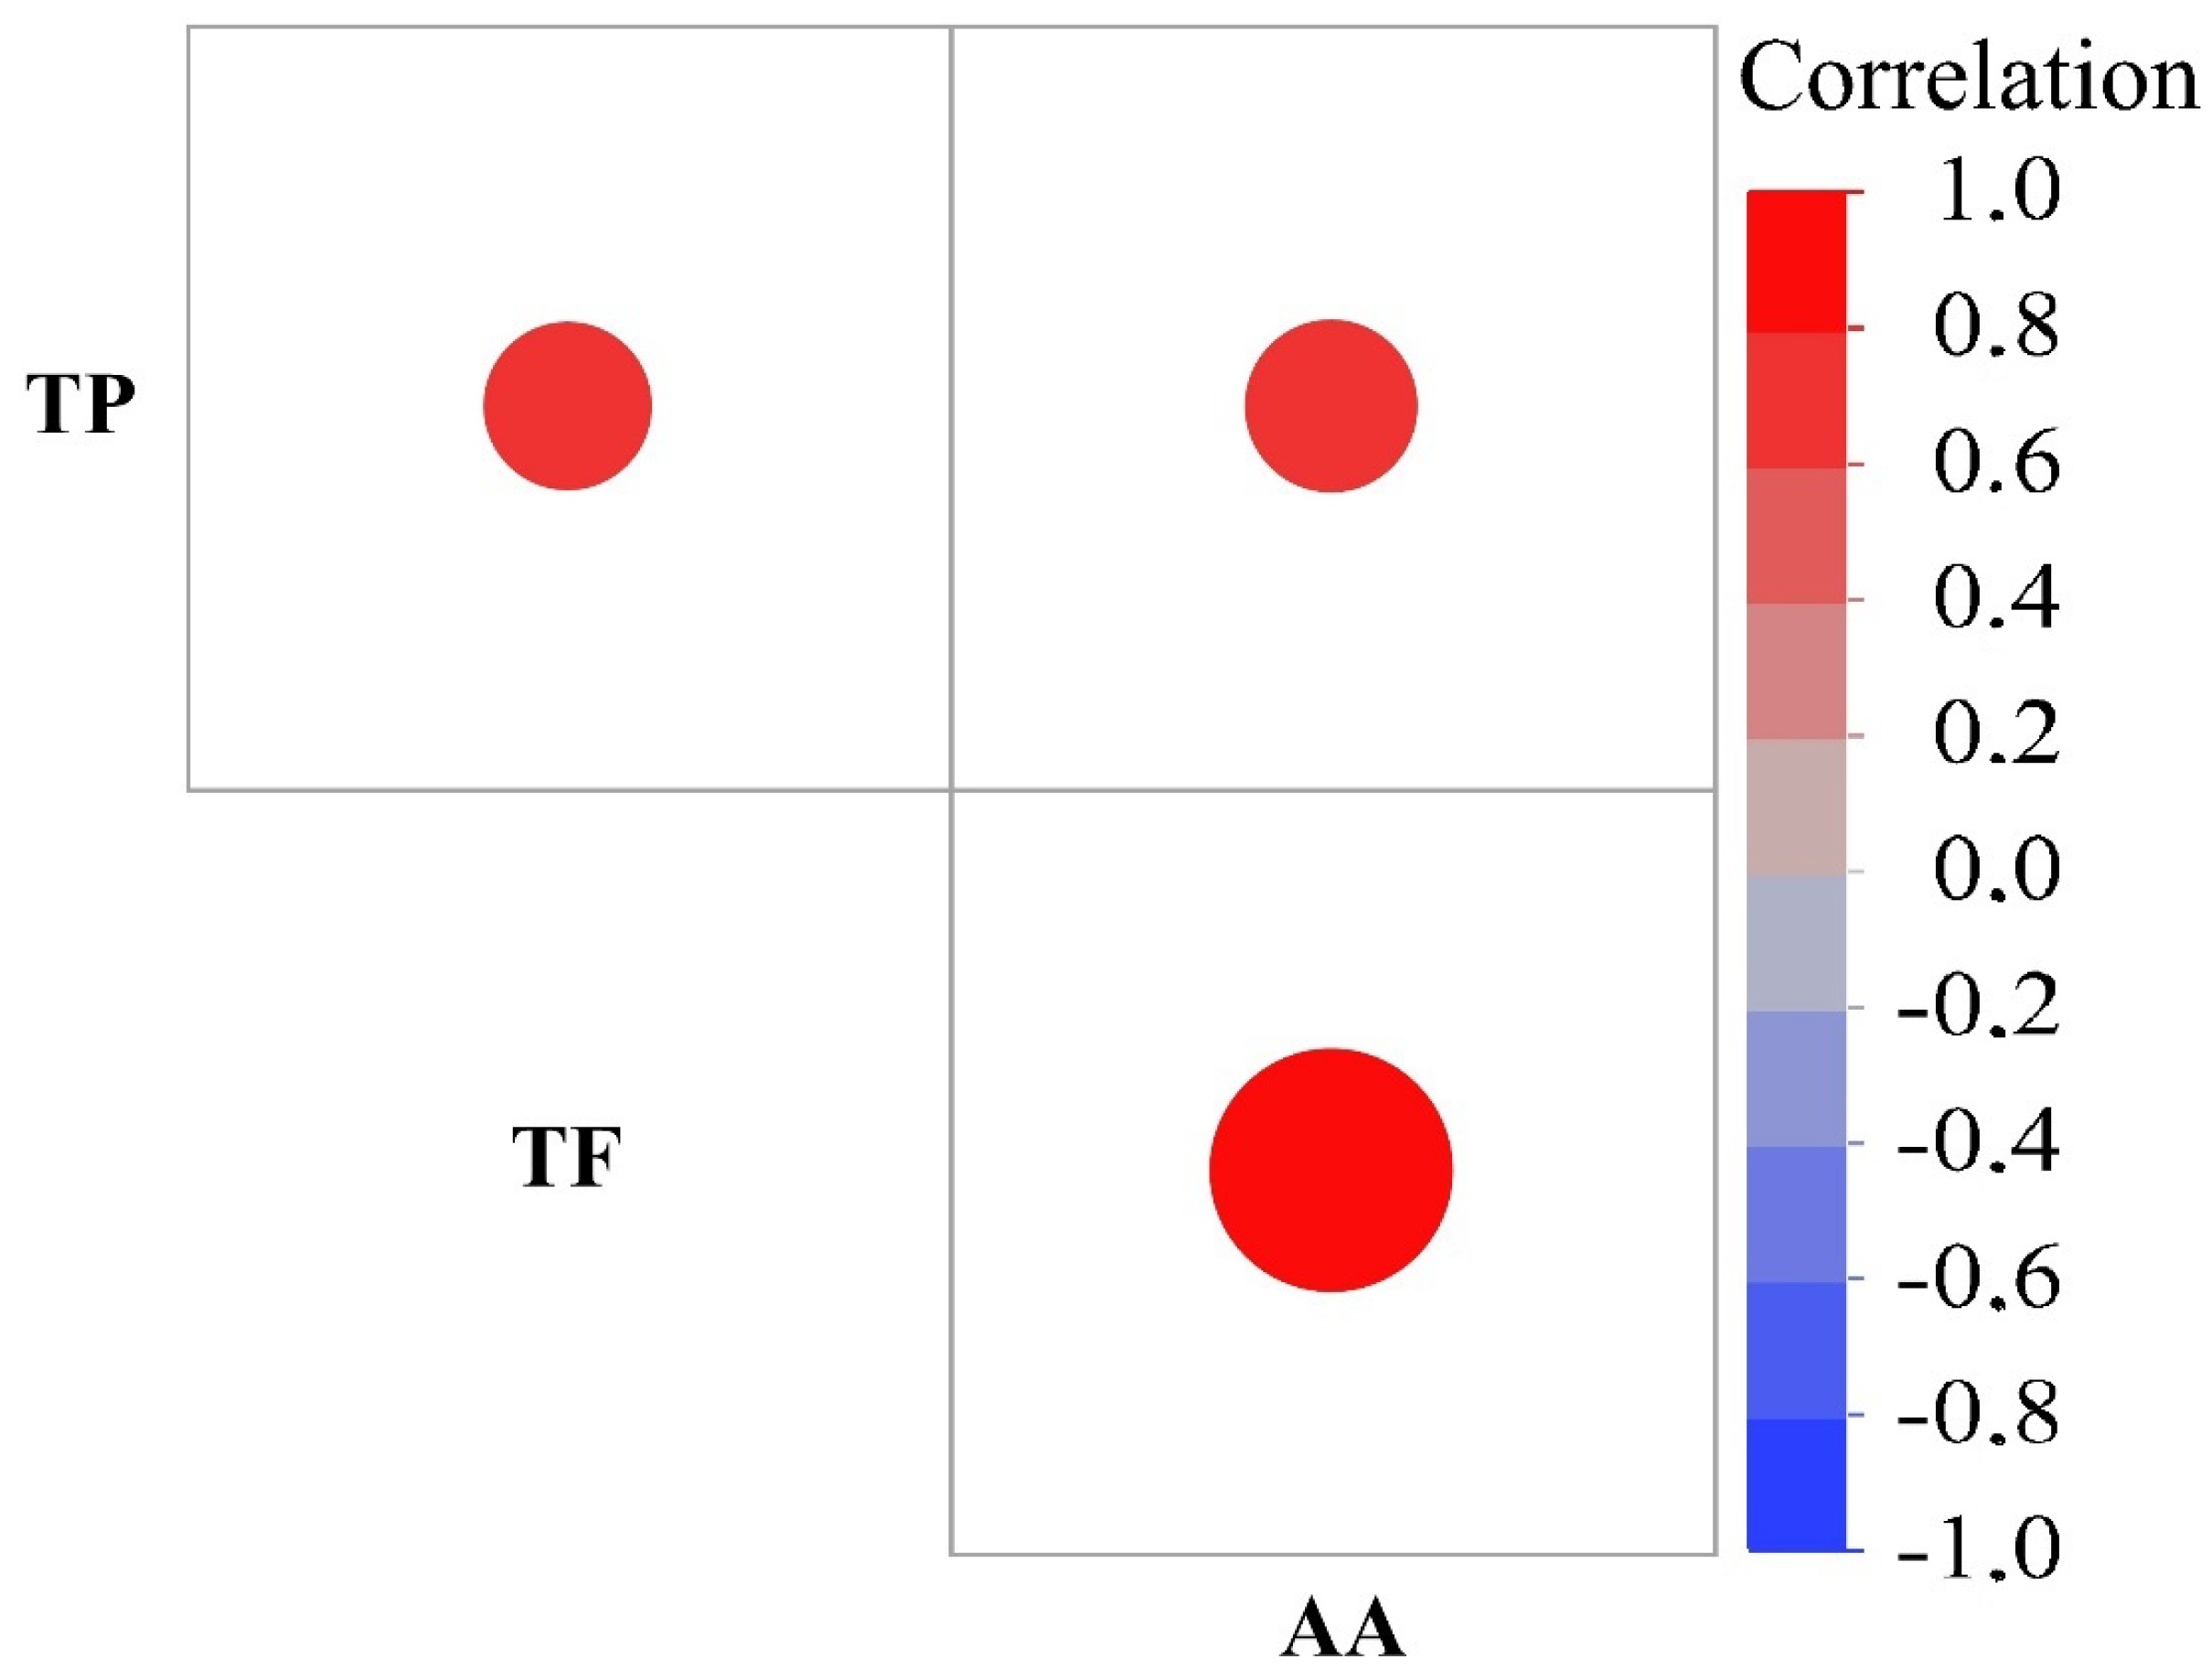
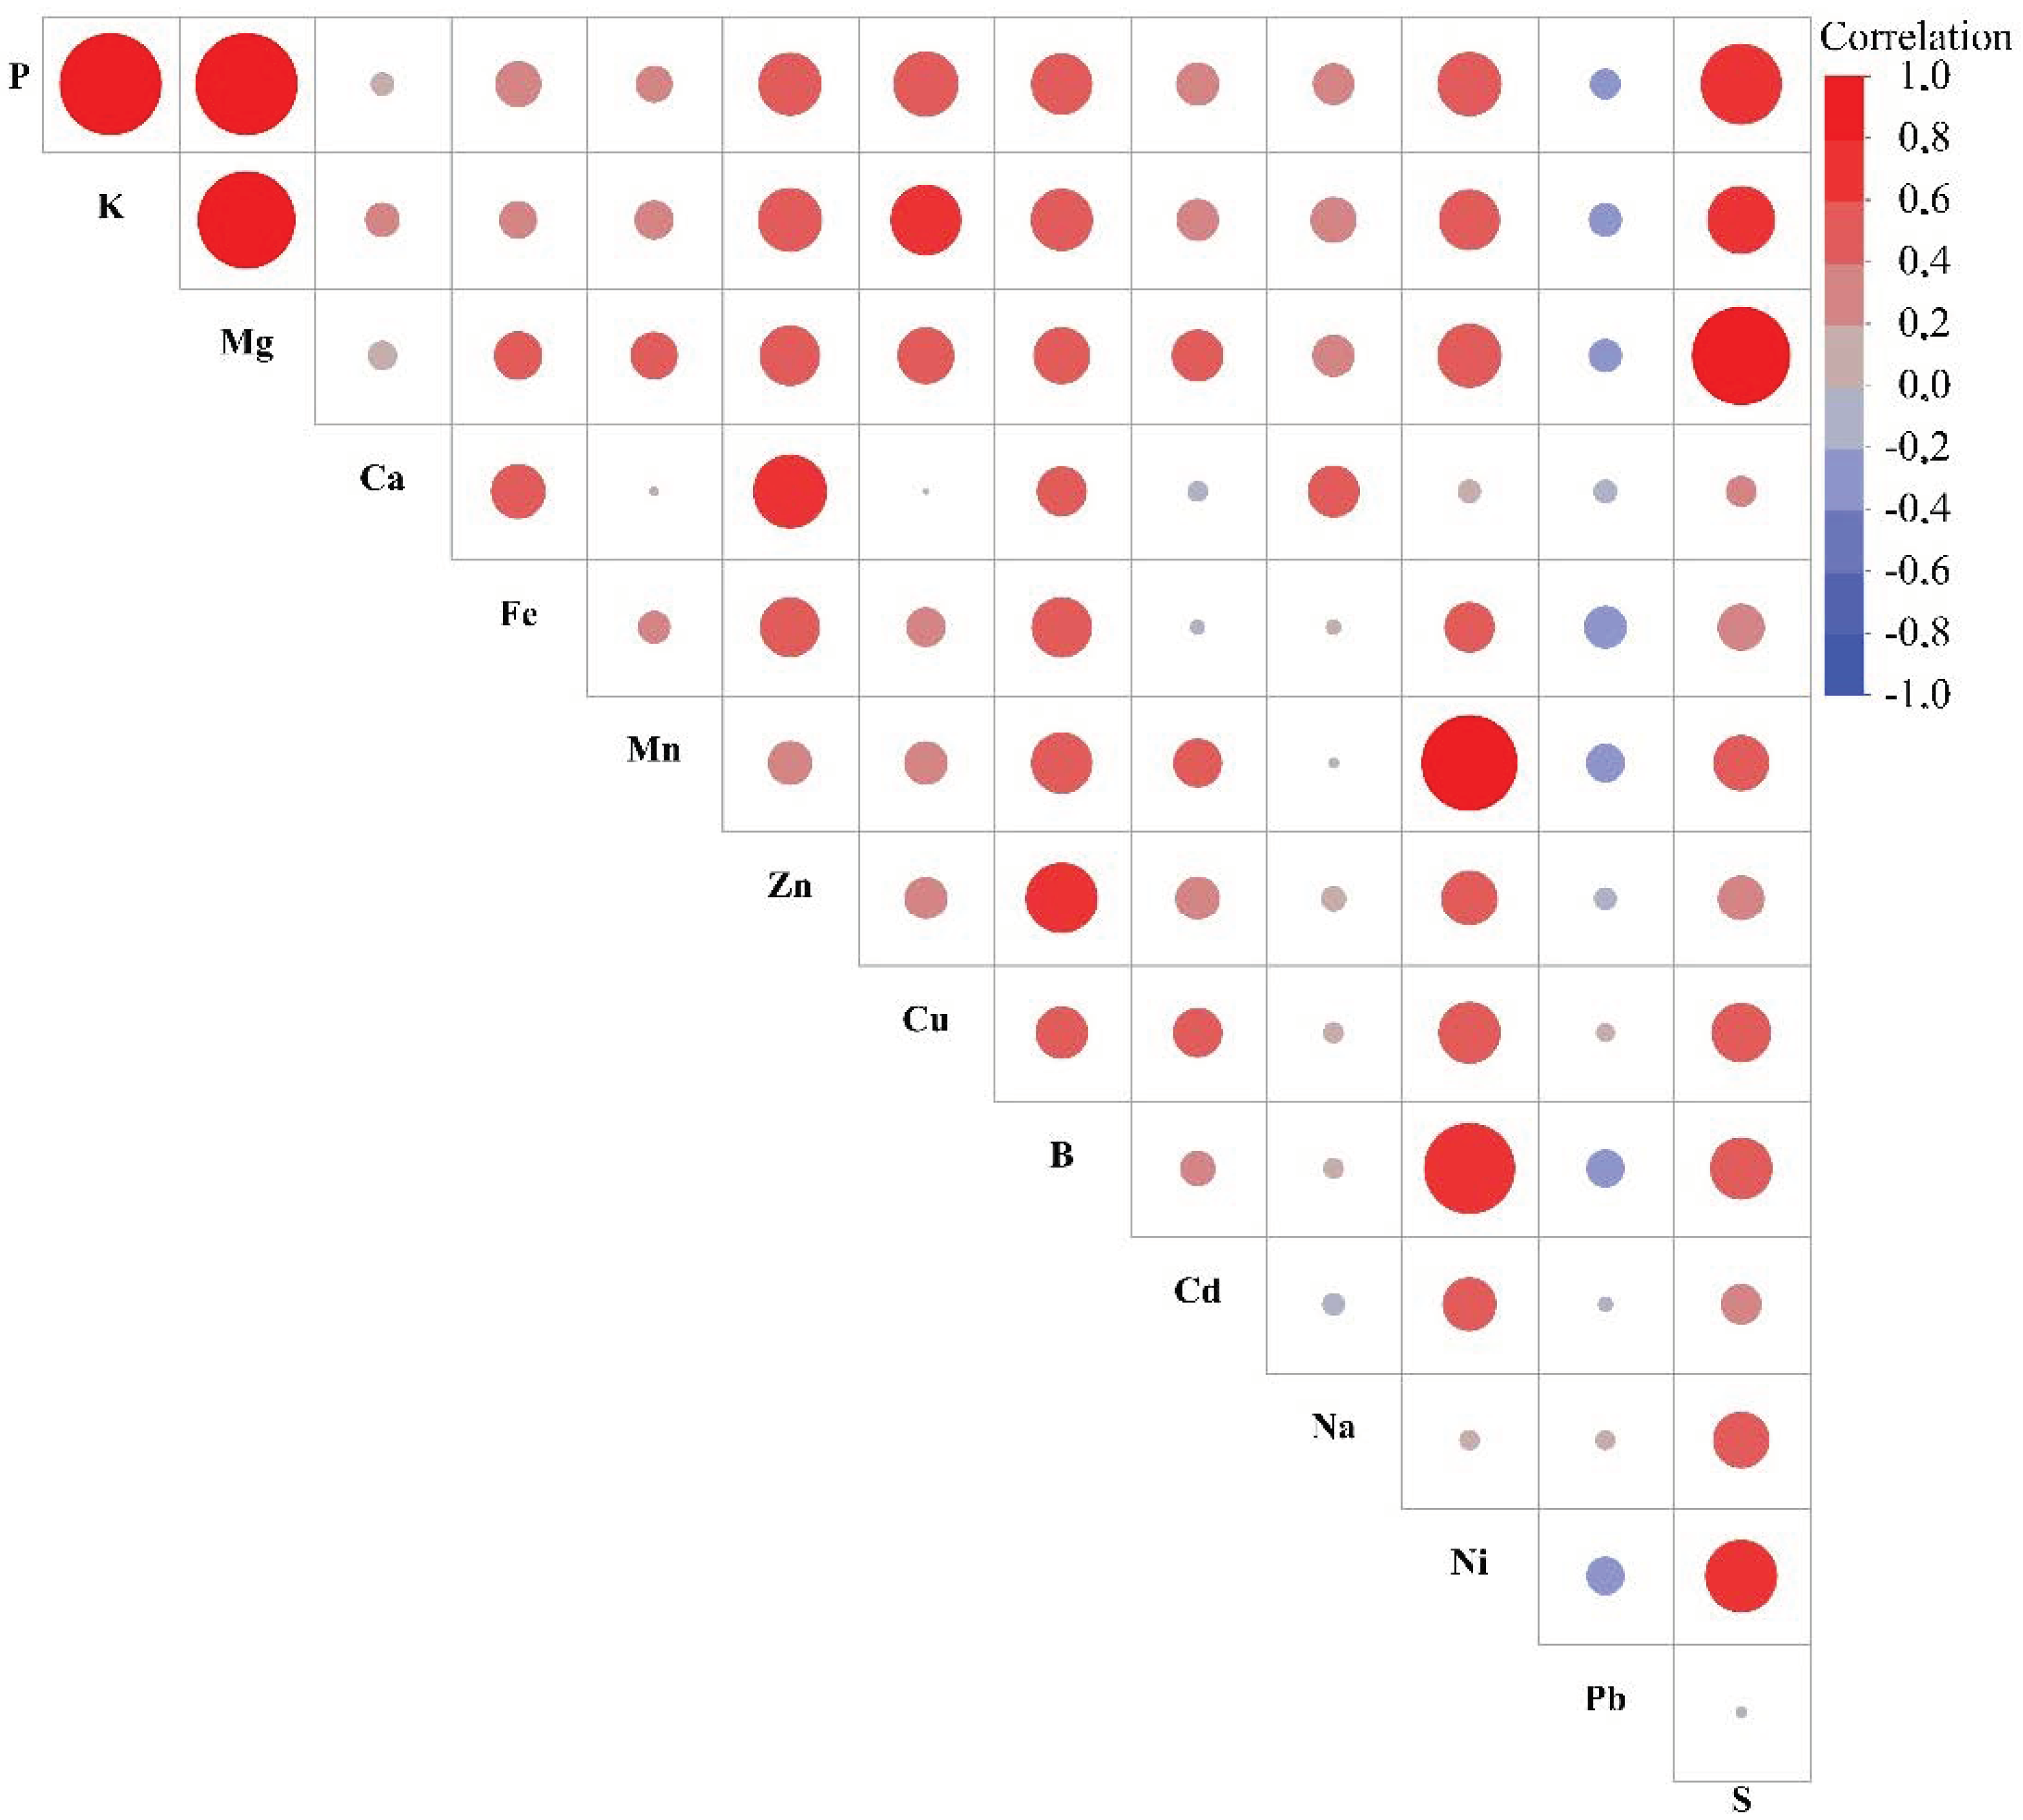
3.4. Principal Component and Correlation Analysis

Twenty-five traits were used for principal components analysis. Seven PCs had eigenvalue above 1.0, an explained 85.2% of total variation. First, three components explained about 60% of total variation. PC1 was related to arachidonic acid and most of the mineral elements (P, K, Mg, Ca, Fe, Mn, Zn, Cu, B, Cd, Ni, and S), and explained 27.6% of the total variation. Ni (0.86) was the most effective on PC1. It was followed by Mg (0.85) and P (0.84). PC2 explained 18.3% of the total variation; is mainly related to oleic, linoleic, and linolenic, as well as Ca. Oleic acid (-0.96) was the most effective on PC2, but negatively correlated. PC3 was related to total phenolics, total flavonoids, antioxidant activity, and palmitic acid, and explained 14.5% of the total variation. Antioxidant activity (0.90) was the most effective on PC3. Many of the traits in the components have a strong positive association with one another (Table 4; Figure 1). Similarly, according to the PCA analysis results in some local and standard hazelnut cultivars, the first two components explained 52% of the total variation. It was also found that fatty acids clustered in distinct points on the biplot graph while mineral elements clustered in the same places [42]. Karakaya et al. (2023) recorded similar results for fatty acids. They also stated that bioactive compounds are clustered in the same place [8].
According to PCA results, hazelnut accessions and cultivars were divided into two groups. The first group (A) included the standard hazelnut cultivars, except for Sivri. The second group (B) was divided into two subclusters. The first subcluster (B-1) consisted of one standard cultivar (Sivri) and four accessions (H-1, T-2, S-1, and H-3). Total phenolics, total flavonoids, antioxidant activity, and stearic acid content of hazelnut accessions in this subcluster were higher than the other groups’ means. The second subcluster (B-2) included nine hazelnut accessions (T-1, P-2, Ç-2, H-2, P-1, Ç-1, Ç-3, P-3, and P-4). The means of oleic acid, Ca, and Na contents in the hazelnut accessions in this subcluster were higher than the other groups’ means (Figure 2).
Correlations between the traits examined are presented in Figure 3, Figure 4 and Figure 5. The oleic acid had a strong negative correlation with linoleic acid (−0.99 ***) and linolenic acid (−0.95 ***). On the contrary, a strong positive relationship was found between linoleic and linolenic acid (0.93 ***). Among the other fatty acids, a weak correlation was determined (Figure 3; Table S1). Similarly, many studies reported a significant negative correlation between oleic and linoleic acid in hazelnuts [42,43,44]. A strong positive correlation was determined between antioxidant activity and total flavonoids (r = 0.95 ***). A moderate positive association was found between total phenolics and antioxidant activity (r = 0.65 **). Similar results were noted between total phenolics and total flavonoids (r = 0.63 **) (Figure 4; Table S2). Yılmaz et al. (2019) reported a moderately positive correlation between total phenolics and total flavonoids, as well as a strong positive correlation between total phenolics and antioxidant activity. He also found a similar correlation between total flavonoids and antioxidants [16]. K content showed a strong positive correlation with P (r = 0.92 ***) and Mg (r = 0.82 ***) contents, while it showed a moderate correlation with Cu (r = 0.64 **) and S (r = 0.61 **) contents. A strong positive correlation was determined between P and Mg (r = 0.91 ***). A positive relation was determined between P and S (r = 0.72 **). Ni content showed a strong positive correlation with Mn (r = 0.81 ***) and B (r = 0.79 ***) contents, while it showed a moderate correlation with Cu (r = 0.64 **) and S (r = 0.65 **) contents. A strong positive correlation was found between S and Mg (r = 0.83 **). Zn content showed a moderate association with Ca (r = 0.66 **) and B (r = 0.65 **) contents (Figure 5; Table S3). In previous studies, positive significant correlations were reported between K and P, K and Na, K and Zn, Ca and Zn, Ca and Mn, Zn and Mn, Cu and Zn, Na and Zn, Na and Cu, while the correlations between K and Mg, K and Cu, Mn and Cu, Mn and Fe were insignificant [39,42,58]. In general, the correlation results between mineral element contents were consistent with the researchers’ findings.

4. Conclusions

A wide variation was determined in fatty acids, bioactive compounds, and mineral contents among the hazelnut accessions investigated. Most of the accessions had higher levels of bioactive compounds than standard cultivars. In particular, S-1 (557.3 mg/100 g total phenolics and 0.53 mmol/100 g antioxidant activity), T-2 (0.51 mmol/100 g antioxidant activity), P-1 (503.1 mg/100 g total phenolics), and H-3 (15.7 mg/100 g total flavonoids) produced remarkable results in terms of these traits. Similarly, P-2 (87.16% oleic acid and 2.17% stearic acid), P-1 (86.88% oleic acid and 3.26% stearic acid), and S-1 (85.09% oleic acid and 3.09% stearic acid) were found to be remarkable in terms of oleic and stearic acid. These findings revealed that many of the accessions studied are a good source of fatty acids and bioactive compounds. As a result, these accessions that stand out in terms of crucial traits can be used as genetic material in hazelnut breeding programs to develop new hazelnut cultivars with enhanced health benefits.

Supplementary Materials

The following supporting information can be downloaded at: https://www.mdpi.com/article/10.3390/horticulturae9091008/s1, Table S1: Correlations the among the fatty acids composition of investigated hazelnut cultivars and accessions. Table S2: Correlations the among the bioactive compounds of investigated hazelnut cultivars and accessions. Table S3: Correlations the among the mineral contents of investigated hazelnut cultivars and accessions.

Author Contributions

Conceptualization, M.Y. and O.K.; methodology, E.Y.; software, M.F.B. and M.Y.; validation, O.K.; formal analysis, T.K. and T.N.; investigation, M.Y. and E.Y.; resources, M.F.B. and T.K.; data curation, T.N.; writing—original draft preparation, O.K., M.F.B., T.N. and E.D.; writing—review and editing, O.K., T.N. and E.D.; visualization, T.K.; supervision, M.Y. and M.F.B.; project administration, E.Y.; funding acquisition, T.N. All authors have read and agreed to the published version of the manuscript.

Funding

This research received no external funding.

Data Availability Statement

All data are included in the article.

Conflicts of Interest

The authors declare no conflict of interest. The funders had no role in the design of the study; in the collection, analyses, or interpretation of data; in the writing of the manuscript; or in the decision to publish the results.

References

  1. Özbek, S. Fındık Yetiştiriciliği. Özel Meyvecilik. Çukurova Üniversitesi Ziraat Fakültesi Yayınları 1978, 128, 286–321. [Google Scholar]
  2. Whitcher, I.N.; Wen, J. Phylogeny and biogeography of Corylus (Betulaceae): Inferences from ITS sequences. Syst. Bot. 2001, 26, 283–298. [Google Scholar]
  3. İslam, A. Fındık ıslahında gelişmeler. Akad. Ziraat Derg. 2019, 8, 167–174. [Google Scholar] [CrossRef]
  4. Balta, F.; Balta, M.F.; Karadeniz, T. The evaluations on preselection of the hazelnut ‘Tombul’and ‘Palaz’cultivars grown in Carsamba and Terme (Samsun) districts. Acta Hortic. 1997, 445, 109–118. [Google Scholar] [CrossRef]
  5. Karadeniz, T.; Bostan, S.Z.; Tuncer, C.; Tarakçıoğlu, C. Fındık Yetiştiriciliği. In Ziraat Odası Başkanlığı Bilimsel Yayınlar Serisi; Ofset Matbaa: Ordu, Türkiye, 2009; p. 126. [Google Scholar]
  6. Gökirmak, T.; Mehlenbacher, S.A.; Bassil, N.V. Characterization of European hazelnut (Corylus avellana) cultivars using SSR markers. Genet. Resour. Crop. Evol. 2009, 56, 147–172. [Google Scholar] [CrossRef]
  7. Mehlenbacher, S.A.; Molnar, T.J. Hazelnut breeding. Plant Breed. Rev. 2021, 45, 9–141. [Google Scholar]
  8. Karakaya, O.; Yaman, İ.; Kırkaya, H.; Uzun, S.; Kaya, T.; Balta, M.F. Effect of cluster drop intensity on nut traits, biochemical properties, and fatty acids composition in the ‘Çakıldak’ hazelnut cultivar. Erwerbs Obstbau 2023, 65, 785–793. [Google Scholar] [CrossRef]
  9. FAOSTAT—Food and Agricultural Organization of the United Nations. Hazelnuts—Production Statistics in 2021. Available online: https://fao.org (accessed on 11 August 2023).
  10. Bacchetta, L.; Rovira, M.; Tronci, C.; Aramini, M.; Drogoudi, P.; Silva, A.P.; Solar, A.; Avanza, D.; Botta, R.; Valentini, N.; et al. A multidisciplinary approach to enhance the conservation and use of hazelnut Corylus avellana L. genetic resources. Genet. Resour. Crop Evol. 2015, 62, 649–663. [Google Scholar] [CrossRef]
  11. Demir, T.; Beyhan, N. Samsun ilinde yetiştirilen fındıkların seleksiyonu üzerine bir araştırma. Turk. J. Agric. For. 2000, 24, 173–183. [Google Scholar]
  12. Turan, A.; İslam, A. Fındığın ekolojik istekleri. In Fındık Yetiştiriciliği, 1st ed.; İslam, A., Ed.; Yeşiller grafik tasarım reklam ve matbaacılık, Fatsa: Ordu, Türkiye, 2020; pp. 27–29. [Google Scholar]
  13. Alasalvar, C.; Pelvan, E.; Topal, B. Effects of roasting on oil and fatty acid composition of Turkish hazelnut varieties (Corylus avellana L.). Int. J. Food Sci. Nutr. 2010, 61, 630–642. [Google Scholar] [CrossRef]
  14. Platteau, C.; De Loose, M.; De Meulenaer, B.; Taverniers, I. Quantitative detection of HN (Corylus avellana) in cookies: ELISA versus real-time PCR. J. Agric. Food Chem. 2011, 59, 11395–11402. [Google Scholar] [CrossRef] [PubMed]
  15. Moscetti, R.; Frangipane, M.T.; Monarca, D.; Cecchini, M.; Massantini, R. Maintaining the quality of unripe, fresh hazelnuts through storage under modified atmospheres. Postharvest Biol. Technol. 2012, 65, 33–38. [Google Scholar] [CrossRef]
  16. Yılmaz, M.; Karakaya, O.; Balta, M.F.; Balta, F.; Yaman, İ. Çakıldak fındık çeşidinde iç meyve iriliğine bağlı olarak biyokimyasal özelliklerin değişimi. Akad. Zir. Derg. 2019, 8, 61–70. [Google Scholar] [CrossRef]
  17. Di Nunzio, M. Hazelnuts as source of bioactive compounds and health value underestimated food. Curr. Res. Nutr. Food Sci. 2019, 7, 17–28. [Google Scholar] [CrossRef]
  18. Zhao, L.; Li, X.; Ye, Z.Q.; Zhang, F.; Han, J.J.; Yang, T.; Wang, Z.Z.; Zhang, Y. Nutshell Extracts of Xanthoceras sorbifolia: A New Potential Source of Bioactive Phenolic Compounds as a Natural Antioxidant and Immunomodulator. J. Agric. Food Chem. 2018, 66, 3783–3792. [Google Scholar] [CrossRef] [PubMed]
  19. Hasan, M.H.; Adzib, M.S.M.; Ilham, Z. Potential antioxidants from crude extracts of roselle seeds and cashew nut shells for biodiesel storage stability improvement. In Proceedings of the AIP Conference, Jawa Barat, Indonesia, 29–30 April 2019; American Institute of Physics Inc.: Bandung, Indonesia, 2019; Volume 2129, p. 020087. [Google Scholar]
  20. Yashin, A.; Yashin, Y.; Xia, X.; Nemzer, B. Antioxidant activity of spices and their impact on human health: A review. Antioxidants 2017, 6, 70. [Google Scholar] [CrossRef]
  21. Khan, M.K.; Paniwnyk, L.; Hassan, S. Polyphenols as natural antioxidants: Sources, extraction and applications in food, cosmetics and drugs. In Plant Based “Green Chemistry 2.0”; Li, Y., Chemat, F., Eds.; Springer Nature: Singapore, 2019; pp. 197–235. [Google Scholar]
  22. Kamala Kumari, P.V.; Akhila, S.; Srinivasa Rao, Y.; Rama Devi, B. Alternative to artificial preservatives. Syst. Rev. Pharm. 2019, 10, 99–102. [Google Scholar]
  23. Minatel, I.O.; Borges, C.V.; Ferreira, M.I.; Gomez, H.A.G.; Chen, C.Y.O.; Lima, G.P.P. Phenolic compounds: Functional properties, impact of processing and bioavailability. Phenolic Compd. Biol. Act 2017, 8, 1–24. [Google Scholar]
  24. Luo, S.; Lenon, G.B.; Gill, H.; Yuen, H.; Yang, A.W.; Hung, A.; Nguyen, L.T. Do the natural chemical compounds interact with the same targets of current pharmacotherapy for weight management? A review. Curr. Drug Targets 2019, 20, 399–411. [Google Scholar] [CrossRef]
  25. Duman, E.; Özcan, M.M. The influence of industrial refining stages on the physico-chemical properties, fatty acid composition and sterol contents in hazelnut oil. J. Food Sci. Technol. 2020, 57, 2501–2506. [Google Scholar] [CrossRef]
  26. Balık, H.İ. Bioactive Compounds and Fatty Acid Composition of New Turkish Hazelnut Cultivars. Int. J. Fruit Sci. 2021, 21, 106–114. [Google Scholar] [CrossRef]
  27. Gülsoy, E.; Kaya, E.D.; Türkhan, A.; Bulut, M.; Koyuncu, M.; Güler, E.; Sayın, F.; Muradoglu, F. The Effect of Altitude on Phenolic, Antioxidant and Fatty Acid Compositions of Some Turkish Hazelnut (Coryllus avellana L.) Cultivars. Molecules 2023, 28, 5067. [Google Scholar] [CrossRef] [PubMed]
  28. Herrera, R.; Hemming, J.; Smeds, A.; Gordobil, O.; Willför, S.; Labidi, J. Recovery of bioactive compounds from hazelnuts and walnuts shells: Quantitative–qualitative analysis and chromatographic purification. Biomolecules 2020, 10, 1363. [Google Scholar] [CrossRef] [PubMed]
  29. Lelli, V.; Molinari, R.; Merendino, N.; Timperio, A.M. Detection and Comparison of Bioactive Compounds in Different Extracts of Two Hazelnut Skin Varieties, Tonda Gentile Romana and Tonda Di Giffoni, Using a Metabolomics Approach. Metabolites 2021, 11, 296. [Google Scholar] [CrossRef]
  30. Müller, A.K.; Helms, U.; Rohrer, C.; Möhler, M.; Hellwig, F.; Glei, M.; Schwerdtle, T.; Lorkowski, S.; Dawczynski, C. Nutrient Composition of Different Hazelnut Cultivars Grown in Germany. Foods 2020, 9, 1596. [Google Scholar] [CrossRef]
  31. Azizov, F.; Atayeva, V.; Khalilov, Z.; Mustafayev, N.; Imanlı, H. Chemical Composition and Biological Active Substances from Hazelnut Green Leafy Covers. JOTCSA 2022, 9, 999–1006. [Google Scholar] [CrossRef]
  32. Karaosmanoğlu, H. Lipid characteristics, bioactive properties, and mineral content in hazelnut grown under different cultivation systems. J. Food Process. Preserv. 2022, 46, 16717. [Google Scholar] [CrossRef]
  33. Sengul, S. The Effect of Different Harvest Date and Altitude on Chemical Composition, Antioxidant Capacity and Quality Parameters of Hazelnut Oil. Master’s Thesis, Ordu University, Institute of Science, Ordu, Türkiye, 2019. [Google Scholar]
  34. Chang, C.C.; Yang, M.H.; Wen, H.M.; Chern, J.C. Estimation of total flavonoid content in propolis by two complementary colorimetric methods. J. Food Drug Anal. 2002, 10, 178–182. [Google Scholar]
  35. Blois, M.S. Antioxidant determinations by the use of a stable free radical. Nature 1958, 181, 1199–1200. [Google Scholar] [CrossRef]
  36. Ustaoğlu, F.; Tepe, Y. Water quality and sediment contamination assessment of Pazarsuyu stream, Turkey using multivariate statistical methods and pollution indicators. ISWCR 2019, 7, 47–56. [Google Scholar] [CrossRef]
  37. Balta, M.F.; Yarılgaç, T.; Aşkın, M.A.; Kuçuk, M.; Balta, F.; Özrenk, K. Determination of fatty acid compositions, oil contents and some quality traits of hazelnut genetic resources grown in eastern Anatolia of Turkey. J. Food Compos. Anal. 2006, 19, 681–686. [Google Scholar] [CrossRef]
  38. Król, K.; Gantner, M.; Piotrowska, A. Morphological traits, kernel composition and sensory evaluation of hazelnut (Corylus avellana L.) cultivars grown in Poland. Agronomy 2019, 9, 703. [Google Scholar] [CrossRef]
  39. Özdemir, M.; Açkurt, F.; Yildiz, M.; Biringen, G.; Gürcan, T.; Löker, M. Effect of roasting on some nutrients of hazelnuts (Corylus avellena L.). Food Chem. 2001, 73, 185–190. [Google Scholar] [CrossRef]
  40. Granata, M.U.; Bracco, F.; Gratani, L.; Catoni, R.; Corana, F.; Mannucci, B.; Sartori, F.; Martino, E. Fatty acid content profile and main constituents of Corylus avellana kernel in wild type and cultivars growing in Italy. Nat. Pro. Res. 2017, 31, 204–209. [Google Scholar] [CrossRef] [PubMed]
  41. Rezaei, F.; Bakhshi, D.; Ghazvini, R.F.; Majd, D.J.; Pourghayoumi, M. Evaluation of fatty acid content and nutritional properties of selected native and imported hazelnut (Corylus avellana L.) varieties grown in Iran. J. App. Bot. Food Qual. 2014, 87, 104–107. [Google Scholar]
  42. Çetin, N.; Yaman, M.; Karaman, K.; Demir, B. Determination of some physicomechanical and biochemical parameters of hazelnut (Corylus avellana L.) cultivars. Turk. J. Agric. For. 2020, 44, 439–450. [Google Scholar] [CrossRef]
  43. Hicks, K.B.; Moreau, R.A. Phytosterols and phytostanols: Functional food cholesterol busters. Food Technol. 2001, 55, 63–67. [Google Scholar]
  44. Cristofori, V.; Ferramondo, S.; Bertazza, G.; Bignami, C. Nut and kernel traits and chemical composition of hazelnut (Corylus avellana L.) cultivars. J. Sci. Food Agric. 2008, 88, 1091–1098. [Google Scholar] [CrossRef]
  45. Arcoleo, G. Caratteristiche e composizione di nocciole di alcune varietà coltivate in Sicilia. (Characteristics and composition of some varieties of hazelnuts cultivate in Sicily, The Italian magazine of fatty substances). Riv. Ital. Sostanze Grasse 1991, 68, 257–260. [Google Scholar]
  46. Serra Bonvehí, J.; Ventura Coll, F. A chemical study of the mineral fraction of Tarragona hazelnuts (Corylus avellana L.). Acta Aliment. 1997, 26, 243–253. [Google Scholar]
  47. Cristofori, V.; Bertazza, G.; Bignami, C. Changes in kernel chemical composition during nut development of three Italian hazelnut cultivars. Fruits 2015, 70, 311–322. [Google Scholar] [CrossRef]
  48. Salas-Salvadò, J.; Megias, I. Health and tree nuts: Scientific evidence of disease prevention. Acta Hortic. 2005, 686, 507–514. [Google Scholar] [CrossRef]
  49. Karaosmanoğlu, H.; Ustun, N.S. Fatty acids, tocopherol and phenolic contents of organic and conventional grown hazelnuts. J. Agric. Sci. Technol. 2021, 23, 167–177. [Google Scholar]
  50. Król, K.; Gantner, M.; Piotrowska, A.; Hallmann, E. Effect of climate and roasting on polyphenols and tocopherols in the kernels and skin of six hazelnut cultivars (Corylus avellana L.). Agriculture 2020, 10, 36. [Google Scholar] [CrossRef]
  51. Sali, K.; Öztürk, B.; Akgün, M.; Ateş, U. Effect of drying methods on the sensory attributes of hazelnut cultivars in different sizes throughout the storage. Turk. J. Food Agric. Sci. 2022, 4, 69–75. [Google Scholar] [CrossRef]
  52. Schmitzer, V.; Slatnar, A.; Veberic, R.; Stampar, F.; Solar, A. Roasting affects phenolic composition and antioxidative activity of hazelnuts (Corylus avellana L.). J. Food Sci. 2011, 76, S14–S19. [Google Scholar] [CrossRef]
  53. Özdemir, I.O.; Tuncer, C.; Solmaz, F.G.; Ozturk, B. The impact of green shield bug (Palomena prasina [Hemiptera: Pentatomidae]) infestation on antioxidant enzyme activities in hazelnut (Corylus avellana L. cvs. ‘Tombul, ‘Palaz ’and ‘Çakıldak’). Erwerbs Obstbau 2023, 65, 767–773. [Google Scholar] [CrossRef]
  54. Jaćimović, S.; Kiprovski, B.; Ristivojević, P.; Dimić, D.; Nakarada, Đ.; Dojčinović, B.; Sikora, V.; Teslić, N.; Pantelić, N.Đ. Chemical composition, antioxidant potential, and nutritional evaluation of cultivated Sorghum Grains: A combined experimental, theoretical, and multivariate analysis. Antioxidants 2023, 12, 1485. [Google Scholar] [CrossRef]
  55. Ozdemir, F.; Akinci, I. Physical and nutritional properties of four major commercial Turkish hazelnut varieties. J. Food Eng. 2004, 63, 341–347. [Google Scholar] [CrossRef]
  56. Cosmulescu, S.; Botu, M.; Trandafir, I. The mineral source for human nutrition of nuts in different hazelnut (Corylus avellana L.) cultivars. Not. Bot. Hortic. Agrobot. 2013, 41, 250–254. [Google Scholar] [CrossRef]
  57. Fennema, O.R. Food Chemistry, 2nd ed.; Marcel Dekker, Inc.: New York, NY, USA, 1985; p. 991. [Google Scholar]
  58. Wei, L.; Zhai, Q. The dynamics and correlation between nitrogen, phosphorus, potassium and calcium in a hazelnut fruit during its development. Front Agric. China 2010, 4, 352–357. [Google Scholar] [CrossRef]
Figure 1. Biplot graph of the first two principal components in the investigated hazelnut cultivars and accessions.
Horticulturae 09 01008 g001
Figure 2. Heatmap analysis and grouping of investigated hazelnut cultivars and accessions based on fatty acids, bioactive compounds, and mineral contents.
Horticulturae 09 01008 g002
Figure 3. Correlations the among the fatty acid compositions of investigated hazelnut cultivars and accessions.
Horticulturae 09 01008 g003
Figure 4. Correlations among the bioactive compounds of investigated hazelnut cultivars and accessions.
Horticulturae 09 01008 g004
Figure 5. Correlations among the mineral contents of investigated hazelnut cultivars and accessions.
Horticulturae 09 01008 g005
Table 1. Fatty acid composition (%) of hazelnut cultivars and accessions investigated.
Cultivars/
Accessions
OleicLinoleicPalmiticStearicLinolenicPalmitoleicArachidonicMyristicSFAPUFAMUFA
Çakıldak77.10 h z13.33 d6.09 a2.41 e0.96 d0.05 b0.03 b0.04 f8.54 ab14.32 e77.14 h
Mincane83.97 fg7.64 f5.42 cde2.76 d0.11 gh0.02 d0.04 ab0.04 f8.22 a–d7.79 h83.99 fg
Palaz70.47 j19.19 a5.51 bcd2.85 cd1.86 b0.05 b0.03 ab0.04 f8.40 abc21.08 a70.52 j
Sivri76.92 h13.56 d5.66 bc2.44 e1.33 c0.02 d0.04 ab0.04 f8.14 bcd14.93 d76.94 h
Tombul71.18 j19.03 a5.73 b2.17 fg1.75 b0.05 b0.04 ab0.05 e7.95 de20.82 a71.23 j
Ç-183.10 g9.67 e4.78 g2.27 ef0.05 h0.05 b0.04 ab0.04 f7.09 g9.76 f83.14 g
Ç-286.85 ab5.85 hi4.90 fg2.22 fg0.05 h0.05 b0.03 ab0.05 e7.17 fg5.93 jk86.90 ab
Ç-385.79 bcd6.02 h5.75 b2.16 fg0.14 gh0.05 b0.03 ab0.07 c7.97 cde6.19 j85.83 bcd
H-171.24 j18.06 b5.71 b2.78 d2.08 a0.04 c0.05 ab0.04 f8.53 ab20.19 b71.28 j
H-285.46 cde5.83 hi5.53 bcd2.96 bc0.06 h0.04 c0.03 ab0.09 a8.58 a5.92 jk85.50 cde
H-374.83 i16.80 c5.37 de2.08 g0.72 e0.05 b0.06 a0.09 a7.55 ef17.57 c74.88 i
P-186.88 ab4.35 k5.34 de3.26 a0.05 h0.05 b0.03 ab0.04 f8.64 a4.43 m86.93 ab
P-287.16 a5.52 ij4.94 fg2.17 fg0.08 gh0.05 b0.03 ab0.04 f7.15 fg5.64 kl87.21 a
P-386.59 abc5.21 j5.16 ef2.85 cd0.06 h0.04 c0.04 ab0.06 d8.06 cd5.31 l86.63 abc
P-484.37 ef6.77 g5.69 b2.80 cd0.20 g0.05 b0.04 ab0.08 b8.57 ab7.00 i84.42 ef
S-185.09 def6.92 g4.68 g3.09 ab0.06 h0.04 c0.04 ab0.08 b7.85 de7.02 i85.13 def
T-186.19 a–d7.66 f5.16 ef0.76 h0.09 gh0.06 a0.03 ab0.05 e5.96 h7.79 h86.25 a–d
T-284.27 efg7.93 f4.88 g2.42 e0.36 f0.05 b0.04 ab0.03 g7.34 fg8.33 g84.33 efg
Significance******************ns************
LSD (0.05)1.220.370.270.170.130.0090.0290.0090.440.501.23
z The differences between mean values shown on the same line with the same letter is not significant (p < 0.05). ***: significant at p < 0.001.
Table 2. Bioactive compounds of hazelnut cultivars and accessions investigated.
Cultivars/
Accessions
Total Phenolics
(mg/100 g)
Total Flavonoids
(mg/100 g)
Antioxidant Activity
(mmol/100 g)
Çakıldak333.3 h z10.5 h0.29 j
Mincane546.2 a12.3 g0.33 h
Palaz440.8 d12.5 g0.37 g
Sivri299.1 j12.3 g0.31 i
Tombul486.7 c13.7 f0.42 f
Ç-1354.3 g9.5 i0.29 j
Ç-2370.1 f14.6 cd0.44 e
Ç-3365.9 fg9.4 i0.22 k
H-1413.8 e13.9 ef0.43 ef
H-2407.3 e15.2 bc0.47 d
H-3477.1 c15.7 b0.49 c
P-1503.1 b13.8 ef0.47 d
P-2333.2 h12.8 g0.38 g
P-3314.2 i11.2 h0.31 i
P-4307.3 ij8.1 j0.19 l
S-1557.3 a17.0 a0.53 a
T-2451.6 d13.8 f0.51 b
Significance*********
LSD (0.05)13.820.670.01
z The differences between mean values shown on the same line with the same letter are not significant (p < 0.05). ***: significant at p < 0.001.
Table 3. Mineral contents (mg/kg) of hazelnut cultivars and accessions investigated.
Cultivars/
Accessions
KPCaMgNaSMnZnFeCuBNiPbCd
Çakıldak2226 e z1922 g1707 j1567 bc242 fg211 c154 b20.0 ef23.2 cde10.4 d4.90 c1.83 c0.10 fg0.02 de
Mincane2730 bc2268 b2207 c1732 a250 efg220 bc89 d25.5 a24.5 bc12.1 bc7.06 a2.45 b0.18 cde0.04 bc
Palaz3383 a2281 b2152 d1778 a259 def214 c158 a23.7 b22.1 e13.0 a5.60 b2.72 a0.05 gh0.06 a
Sivri1637 g1479 i1689 j1188 fg261 de178 ef75 e14.3 j14.6 j6.8 j2.81 gh1.53 d0.19 cd0.03 cd
Tombul2256 e1929 g1820 h1476 cd243 fg197 d95 c19.5 fg22.6 de10.0 de3.03 fg1.48 d0.11 f0.02 de
Ç-12321 e1934 fg2071 e1567 bc249 efg178 ef48 h22.6 bc16.8 h7.5 i0.68 l0.52 ij0.22 bc0.03 cd
Ç-22654 bc2412 a1766 i1752 a262 de227 ab68 f21.2 de25.9 a8.3 h4.24 d1.85 c0.15 def0.03 cd
Ç-32302 e2048 de1865 g1579 bc250 efg177 ef9 m17.8 h22.8 de8.1 hi2.69 hi0.63 hi0.22 bc0.02 de
H-11906 f1624 h1142 m1236 ef250 efg184 e38 j12.9 k16.0 hi12.6 ab0.66 l0.76 gh0.54 a0.03 cd
H-22417 de1967 efg2066 e1311 ef263 de171 f7 m18.4 gh23.7 cd11.7 c3.27 f0.95 f0.04 h0.02 de
H-32732 bc2062 d1317 l1483 c240 gh147 g43 i16.5 i16.7 h8.7 gh1.78 j0.88 fg0.05 gh0.03 cd
P-12773 b2016 def2701 a1507 c412 a211 c51 gh20.2 ef20.6 f8.4 h3.66 e1.10 e0.23 bc0.00 f
P-23349 a2464 a1884 g1710 ab275 cd212 c35 j20.6 ef19.6 fg12.0 bc3.92 e0.90 f0.21 bc0.02 de
P-31919 f1488 i1966 f1334 de223 hi178 ef27 k11.7 l20.0 fg7.7 i2.63 hi0.55 ij0.13 ef0.00 f
P-41583 g1252 j2375 b1053 g219 i140 g18 l21.9 cd18.7 g6.5 j3.11 f0.01 k0.26 b0.03 cd
S-12561 cd2166 c1452 k1787 a308 b232 a53 g14.0 jk15.2 ij9.7 ef2.52 i0.90 f0.15 def0.05 ab
T-11923 f1626 h2220 c1531 c289 c196 d50 gh17.9 h25.2 ab9.2 fg1.11 k0.72 h0.12 f0.03 cd
T-21444 g1292 j1172 m1050 g218 i143 g48 h9.9 m17.1 h6.2 j0.98 k0.44 j0.10 fg0.01 ef
Significance******************************************
LSD (0.05)198.886.5034.8143.918.09.534.081.241.370.640.290.130.050.015
z The differences between mean values shown on the same line with the same letter are not significant (p < 0.05). ***: significant at p < 0.001.
Table 4. Principal component of hazelnut cultivars and accessions investigated.
VariablesComponents
PC 1PC 2PC 3PC 4PC 5PC 6PC 7
Total phenolics0.39890.06270.6466 *0.1560−0.0471−0.19070.1765
Total flavonoids0.21860.04550.8946 *−0.0713−0.1080−0.21970.0992
Antioxidant activity0.1129−0.00640.9018 *−0.1907−0.2370−0.18720.1122
Myristic−0.1899−0.14160.27190.23520.7003 *−0.13560.3938
Palmitic0.04310.4993−0.5786 *0.0158−0.0496−0.16430.5016 *
Stearic0.10670.0511−0.00950.8215 *−0.1413−0.23230.1558
Palmitoleic−0.1269−0.30020.1675−0.6328 *−0.02150.32100.3923
Oleic−0.1503−0.9552 *0.00180.08020.0074−0.0579−0.1713
Linoleic0.14560.9425 *0.0489−0.17400.03650.09230.1220
Linolenic0.12030.9302 *−0.0554−0.0589−0.21250.08830.1480
Arachidonic−0.4951 *0.42640.39670.11940.43810.09340.0052
P0.8373 *−0.18490.22470.04740.21970.2135−0.0333
K0.8198 *−0.13430.20120.09300.21580.22170.1044
Mg0.8466 *−0.20940.1832−0.06930.16620.2417−0.1929
Ca0.3278−0.5393 *−0.48620.0640−0.0503−0.00640.3375
Fe0.5374 *−0.3425−0.3119−0.45130.0535−0.19880.2173
Mn0.6469 *0.4952−0.2054−0.2467−0.1910−0.1817−0.1928
Zn0.6779 *−0.1726−0.4328−0.01860.28010.21770.1531
Cu0.6903 *0.29850.13160.11620.02750.19010.2204
B0.7844 *−0.0568−0.38260.21930.0787−0.3276−0.0208
Cd0.4756 *0.38850.13910.10270.41800.2002−0.2262
Na0.3574−0.43180.30450.1856−0.5128 *0.11900.3318
Ni0.8597 *0.3253−0.1276−0.0121−0.0766−0.2582−0.1580
Pb−0.26840.1606−0.10540.4139−0.36850.6635 *0.0576
S0.8372 *−0.16310.12030.0537−0.30400.1283−0.2074
Eigen value6.94.63.61.81.71.31.3
Variance (%)27.618.314.57.37.05.45.0
Cumulative (%)27.646.060.567.874.880.185.2
* Factor loading ≥ |0.47|.
Disclaimer/Publisher’s Note: The statements, opinions and data contained in all publications are solely those of the individual author(s) and contributor(s) and not of MDPI and/or the editor(s). MDPI and/or the editor(s) disclaim responsibility for any injury to people or property resulting from any ideas, methods, instructions or products referred to in the content.

