Article

Comparative Transcriptome Analysis Identified Genes Associated with Fruit Size in Pepper (Capsicum annuum L.)

Engineering Research Center of Education Ministry for Germplasm Innovation and Breeding New Varieties of Horticultural Crops, Key Laboratory of Vegetable Biology of Hunan Province, College of Horticulture, Hunan Agricultural University, Changsha 410128, China
*
Author to whom correspondence should be addressed.
Horticulturae 2023, 9(9), 1009; https://doi.org/10.3390/horticulturae9091009
Submission received: 28 July 2023 / Revised: 18 August 2023 / Accepted: 3 September 2023 / Published: 7 September 2023
(This article belongs to the Section Genetics, Genomics, Breeding, and Biotechnology (G2B2))

Abstract

:
Pepper (Capsicum annuum L.) is one of the most widely grown vegetable crops in China, with widespread cultivation worldwide. Fruit weight (size) is a complex trait controlled by multiple factors and is an essential determinant of pepper yield. In this study, we analyzed the transcriptome of two pepper recombinant lines with different fruit weights, ‘B302’ and ‘B400’, at five developmental stages to reveal some of the differentially expressed genes and mechanisms controlling fruit weight. The results showed that 21,878 differential genes were identified between the two specimens. Further analysis of the differentially expressed genes revealed that Boron transporter 4 was significantly highly expressed in the large-fruited pepper and almost not expressed at all in the small-fruited pepper. CaAUX1, CaAUX/IAA, CaGH3, CaSAUR, and other related genes in the Auxin signal transduction pathway were highly expressed in the large-fruited pepper but significantly reduced in the small-fruited pepper. In addition, a comparison of differentially expressed transcription factors at different times revealed that transcription factors such as CaMADS3, CaAGL8, CaATHB13, and CaATHB-40 were highly differentially expressed in the large-fruited pepper, and these transcription factors may be related to pepper fruit expansion. Through weighted gene co-expression network analysis (WGCNA), the MEorangered4 module was shown to have a highly significant correlation with fruit weight, and the key modules were analyzed by constructing the hub core gene network interactions map and core genes regulating fruit weight such as APETALA 2 were found. In conclusion, we find that the expression of relevant genes at different developmental stages was different in ‘B302’ and ‘B400’, and it was hypothesized that these genes play essential roles in the development of fruit size and that the interactions occurring between transcription factors and phytohormones may regulate the development of fruit size.

1. Introduction

Pepper is a crop of the Solanaceae family, which originated in the South American region more than 6000 years ago [1]. As a globally important vegetable crop, pepper is in demand in food, medicine, and industrial production. The global pepper cultivation area in 2020 was 31,049,900 acres and production was 36,137,000 tons (https://www.fao.org/faostat/en/#data/FBS (accessed on 5 July 2023)). Different pepper varieties are adapted to different processing as food, such as the small-fruited pod pepper being suitable for producing dried pepper [2]. In addition, market preference is an essential factor influencing the fruit size of selected peppers due to different consumption habits of people. Fruit size is a complex trait controlled by a combination of factors, both by cultivation conditions and the external environment, but it is also still determined by genetic traits [3,4]. The cells actively divide from the start of ovule development to fruiting and continue until the fruit reaches maturity [5]. Moreover, cell expansion begins at the fruit set and is accompanied by cell division until fruit formation of final size [6]. Thus, the more active the cell division, the more rapid the increase in cells within the fruit, and the larger the fruit [5]. Several genes associated with promoting cell enlargement and proliferation have been reported to regulate the growth and size of plant organs, such as EBP1, AtTOR, and the growth hormone response factor ARF2 [7,8,9,10]. Current research has also revealed that phytohormones are widely involved in the regulation of various aspects of plant growth, development, and environmental stress [11,12,13]. In particular, growth hormones are essential for plants as a central and most common plant growth regulator.
Transcription factors can regulate gene expression, MADS-box and HD-ZIP can interact with YABBY to regulate plant organ development, BHLH can regulate target gene expression, and has phytohormone biosynthesis function [14]. MADS-box is essential in floral organ formation and fruit size development [15,16,17,18]. AGAMOUS (AG), an influential factor of the MADS-box family, was first found to be necessary for the development of reproductive organs, and the loss of AG does not enable the formation of complete floral organs [19]. AG is also an indispensable regulatory gene for the control of floral meristem organization [20]. Flower organ development is mainly related to auxin, which is necessary for the initial development of the floral primordium, and it has been revealed that the AG gene (RhAGL24) can affect floral development through the regulation of auxin-related genes (RhARF18) [21]. In addition, FUL, a more studied MADS-box gene, can regulate cell differentiation in fruit development, and the mutation of this gene caused abnormal fruit dehiscence due to the inability of fruit to grow normally, presumably due to the variation in the FUL gene that prevents the outer wall cells from expansion and differentiation [22,23]. Recently, PFAG1 and PFAG2, two genes of the MADS-box, were found to have multiple functions in flower and fruit development, but their roles in fruit size development need further validation [24]. Plants develop in response to changing environmental conditions, and the HD-Zip family can regulate plant development in response to environmental stimuli; HD-Zip I and HD-Zip II transcription factors regulate maturation and organ adaptation by inhibiting or promoting cell proliferation, differentiation, and amplification [25,26]. In addition, members of the HD-ZIP transcriptional family play a regulatory function in the regulatory network of proximal–distal polarity in lateralized plant organs, such as the carpels, leaves, and ovules [27,28,29]. A range of genes are required to regulate development from flower to fruit formation, and they all influence the final fruit size.
In previous studies, SUN, SlKLUH, Ovate, LC, FAS, and many QTL loci have been investigated in tomatoes to control fruit shape or size [30,31,32,33,34]. Since pepper and tomato belong to the same genus Solanum and have high genetic similarity, comparisons revealed the presence of genes in pepper that are homologous to tomato and regulate fruit shape, such as CaOvate, which negatively regulates fruit length [35,36]. Similarly, Chunthawodtiporn et al. identified candidate genes (Big Brother, Ovate, and KLUH/CYP78A5) in chromosomes 1, 2, and 3 of pepper that control the fruit shape [37]. CaPOS1 in pepper, a direct homolog of trichomes POS1, has been shown to control fruit size, and this function is achieved by positively regulating cell size [38]. However, fewer genes have been identified in pepper than in other crops to control fruit size, and there are many genes whose functions have been shown in other crops but have yet to be reported in pepper, as well as there being no transparent molecular regulatory network. Therefore, in this study, we chose two pepper recombinant lines with different fruit sizes as specimens, and analyzed the changes in gene transcription levels in fruit development using RNA-seq.

2. Materials and Methods

2.1. Plant Materials

Two pepper recombinant lines, ‘B302’ and ‘B400’, selected by the College of Horticulture, Hunan Agricultural University were used as the specimens. Spring sowing was carried out in the greenhouse of Hunan Agricultural University with conventional water management and fertilizer in March 2022. The bloom period was in 4 May. Pepper is a self-pollinating plant, so we collected at 0 days after pollination of the flowers (5 May 2022, 0 DAP), 15 days after pollination (20 May 2022, 15 DAP), 20 days after pollination (25 May 2022, 20 DAP), 30 days after pollination (30 May 2022, 30 DAP), and 40 days after pollination (9 June 2022, 40 DAP). There were three replicates per group and samples were frozen at −80 °C for RNA extraction.

2.2. Fruit Development Investigation

The fruits were sampled to measure the growth index. Three fruits with similar nodal position and consistency were randomly selected at different time intervals according to the developmental stages: 15 DAP, 20 DAP, 30 DAP, and 40 DAP, and photographs were taken to record the phenotypes. The weight of the fruit was measured using an electronic balance, and vernier calipers were used to measure the transverse and longitudinal diameters of the fruit, flesh thickness, shoulder width, and tip width, which were recorded and averaged separately.

2.3. Histological Sections of the Fruit

The paraffin sections were used to observe the tissue structure at five growth periods: 0 DAP, 15 DAP, 20 DAP, 30 DAP, and 40 DAP. Ovaries or fruits collected at each developmental stage were cut into small pieces and fixed with FAA fixative. Tissue sections of the material were sequentially washed with xylene, anhydrous ethanol with 75% alcohol in dewaxed water, dehydrated, then stained with toluidine blue. Finally, the tissue sections were sealed after the steps of wax dipping, embedding, and paraffin removal. Paraffin blocks were sectioned with a slicer RM2016 (Leica, Wetzlar, Germany). Anatomical images of tissue sections were observed using a microscope, the ECLIPSE E100 (Nikon, Tokyo, Japan).

2.4. RNA Extraction, Library Preparation, and Sequencing

A total of 30 samples were sequenced from 0 DAP ovaries, 15 DAP, 20 DAP, 30 DAP, and 40 DAP fruits of “B302” and “B400”. The total RNA of all samples was extracted and tested for RNA quality by spectrophotometer and Agient2100; the qualified samples were enriched for eukaryotic mRNA by magnetic beads with Oligo (dT), and the mRNA was randomly interrupted by adding fragmentation buffer; the mRNA was used as a template for synthesizing the first and second strand of cDNA and purifying it; and the first cDNA was then synthesized and sequenced in the second strand. The first cDNA strand and the second strand were synthesized and purified using mRNA as a template; then, end repair was performed, A-tail was added, sequencing junctions were connected, and the fragment size was selected by AMPure XP beads; finally, the cDNA library was enriched by PCR. After the library was constructed, the Qubit 3.0 fluorescence quantification instrument, Qsep400 high-throughput analysis system, and Q-PCR method were used for the quality control of the library, and the PE150 mode sequencing was carried out using the Illumina NovaSeq6000 sequencing platform after passing the qualification.

2.5. Identification and Functional Annotation of Differentially Expressed Genes (DEGs)

Zunla-1_v2.0 was used as the reference genome to uncover new transcripts and genes of the species by using Hisat 2 software for comparison, StringTie to assemble the reads on the comparison, and comparing with the original genome to find the unannotated transcribed regions [39]. The RNA-seq sequencing results were the sequence fragments of expressed transcripts, and the expression level of the gene was calculated based on the sequencing reads ratio to the number in each transcript, and FPKM was used as a measure of the expression level of the transcript or gene. Differential expression in the gene expression data was determined using DESeq 2, and the resulting p-values were adjusted using the Benjamini and Hochberg algorithm, with Fold Change ≥ 2 and FDR < 0.01 as the DEGs’ screening criteria [40]. Gene function was annotated by sequence comparison based on the following databases: nr, p fam, KOG/COG, Swiss-Prot, KO, and GO.

2.6. WGCNA Analysis

WGCNA is a method that aggregates gene expression data into co-expression modules and is able to identify core genes associated with phenotypes in key modules [41]. Taking each node as a gene, we considered genes with expression commonality in different samples as being in the same gene network, and the expression correlation coefficient metric between genes in the same gene network indicated their co-expression relationship. WGCNA was analyzed on the Beamac Cloud Platform (www.biocloud.net (accessed on 1 October 2022)). WGCNA is a method for aggregating gene expression data into co-expression modules, thereby exploring the association relationship between the modules and the target phenotype and identifying core genes within key modules associated with the phenotype [41]. With each node as a gene, we consider genes with expression commonality in different samples to be in the same gene network, and the expression correlation coefficient measure between them indicates the co-expression relationship between the genes. In addition, there was a high degree of co-expression of genes within modules and a low degree of co-expression of genes belonging to different modules. WGCNA was analyzed on the Bemac Cloud Platform (www.biocloud.net (accessed on 1 October 2022)).

2.7. Expression Analysis of Quantitative Real-Time PCR

A total of 30 samples were subjected to qRT-PCR on 0 DAP ovaries, 15 DAP, 20 DAP, 30 DAP and 40 DAP fruits of ‘B302’ and ‘B400’. The qRT-PCR method was referenced by Taylor et al. [42]. The cDNA was used as a template for qRT-PCR validation using the Vazyme fluorescence quantification kit (ChamQTM SYBR ® qPCR Master Mix, Jiangsu, China). Gene-specific primers for qPCR were designed according to the sequences selected in the RNA-seq (Table S1). Relative gene expression was normalized using the 2−ΔΔCt method [43].

2.8. Statistical Analysis

One-way analysis of variance (ANOVA) was carried out using IBM SPSS Statistics 22.0 software to analyze the significance analysis [44]. Microsoft Excel 2010, Originpro 2018, and Adobe Photoshop 2020 were used to make charts. Three biological replicates were used for each sample in transcriptome sequencing and qRT-PCR.

3. Results

3.1. Physiological Investigation of Fruit Development in Pepper

Large-fruited ‘B400’ and small-fruited ‘B302’ generally mature 30–45 days after flowering. To study the fruit growth characteristics of pepper of different sizes, the physiological characteristics of the fruits of the two specimens at different developmental stages within 40 DAP were measured, and their flowers, ovaries, and seeds were also compared (Figure 1A). The results showed that the phenotypes of flowers, ovaries, and seeds of the large-fruited and small-fruited pepper were significantly different, and the two specimens had significant differences in six traits, namely, single fruit weight, flesh thickness, transverse diameter, longitudinal meridian, shoulder width, and tip width. Fruit weight was the most different between the two specimens, with ‘B302’ having a mature single fruit weight of 10.35 g and ‘B400’ having a mature single fruit weight of 37.05 g (Figure 1B). In addition, except for the fruit longitudinal, which was significantly greater in ‘B302’ than in ‘B400’, ‘B400’ was considerably higher than ‘B302’ in the other five traits; the phenotypic values of B400 reached a high level of significance at each developmental stage in relation to that of the small-fruited pepper (Figure 1B–G).
Cell tissue were stained in paraffin of ovaries and fruits at different developmental stages of the two specimens to study the role of cell expansion and proliferation in fruit size (Figure 2). At 0 DAP, the exocarp and mesocarp cells in the ovaries of both specimens were similar in size and nearly round in shape. Moreover, there was no significant difference in cell size between the two specimens except for the apparent difference in ovule size and number. During the fruit development stage, the fruit cells of ‘B302’ compared with those of ‘B400’ were relatively compact and neatly arranged. Still, the two specimens had no significant difference in cell size. In addition, cell expansion was apparent from 15 DAP to 20 DAP, indicating that fruit growth was accompanied by cell expansion and proliferation.

3.2. Overview of RNA-Sequence Results and Analysis of Differentially Expressed Genes (DEGs)

By sequencing the eukaryotic reference transcriptome of ‘B302’ and ‘B400’ specimens of five developmental stages, the RNA-seq analysis of 30 samples was completed, and a total of 229.89 Gb of lean data were obtained. The clean data of each piece reached 6.28 Gb, the percentage of Q30 bases was 91.59% and above, and the GC content was 42.48% and above. The clean reads of each sample were compared with the pepper genome (Zunla-1), and the comparison efficiency ranged from 90.06% to 95.07%. These results indicate that the RNA-seq results are of high quality and provide a basis for the reliability of subsequent data analysis. Based on the results, 50,020 genes were identified, 14,684 novel genes were placed, and 7721 were functionally annotated.
To investigate DEGs associated with the development of pepper fruit size, fold change ≥ 2 and FDR < 0.01 were used as the DEGs screening criteria to analyze the DEGs, and a total of 21,878 DEGs were obtained in this study. To find the DEGs related to fruit size development in different developmental stages, five comparison groups (0 DAP, 15 DAP, 20 DAP, 30 DAP, 40 DAP) were constructed according to the ‘B302’ vs. ‘B400’ model for different developmental stages, and a total of 11,028 DEGs were obtained, of which 519 DEGs were identified in all five developmental stages (Figure 3A,B). The analysis revealed that the two specimens had the least number of DEGs at 20 DAP, with a total of 2658 DEGs obtained, including 1377 up-regulated genes and 1281 down-regulated genes; and the highest number of DEGs was obtained at 40 DAP, with 6577 DEGs obtained, including 3841 up-regulated genes and 2736 down-expressed genes. The above data showed that both the small-fruited material ‘B302’ and the large-fruited material ‘B400’ had more DEGs at different developmental stages. In addition, Boron transporter 4 (Capana03g000352), Zinc finger BED domain-containing protein RICESLEEPER 1 (newGene_2736), Fasciclin-like arabinogalactan protein 11 (Capana10g001842, FLA11), and F-box/kelch-repeat protein At1g80440 (Capana03g00-0318) were significantly differentially expressed at different times in the two specimens (Table S2). Except for the Capana03g000318, the other genes were significantly highly expressed in large-fruited pepper. In contrast, Boron transporter 4, Zinc finger BED domain-containing protein RICESLEEPER 1, FLA11, and At1g80440 were all essential in plant growth and development. Therefore, they may positively or negatively regulate the development of pepper fruit size.

3.3. GO Enrichment Analysis of DEGs

GO enrichment allows functional annotation and enrichment analysis of DEGs and analyzes the function of DEGs by annotating DEGs into branches under three significant functions: cellular components, molecular functions, and biological processes. GO functional enrichment analyses were performed on 11,028 DEGs from the five comparison groups. The results showed that 7312 genes were annotated to GO functions, and these genes were enriched in 50 GO terms for cellular components, biological processes, and molecular functions. The analysis of the top 40 items with the highest enrichment of DEGs revealed that the primary molecular functions were catalytic activity, binding, transporter activity, nucleic acid-binding transcription factor activity, a regulator of molecular function, and antioxidant activity (Figure 4). Among the molecular functions, the DEGs in catalytic activity, binding, and transport activities were the most aggregated. They aggregated to 2135, 2065, and 240 at 40 DAP, which was up to twice as many as the comparison group at other stages, indicating that the catalytic activity, the binding effect, and the transport activity were highly significant at the late stage of fruit growth; in biological processes, the GO items with the most DEGs enriched were metabolic processes, cellular processes, single organism processes, biological regulation; DEGs in cellular fractions were mainly enriched in membranes, membrane fractions, cells, cellular fractions. Thus, DEGs may be associated with catalytic activity, metabolic processes, and membrane occurrence with fruit enlargement during fruit development.

3.4. KEGG Pathway Analysis of DEGs

The KEGG pathway reveals the function of DEGs that may be related to fruit size development in pepper. KEGG analysis was performed on the comparison group at different developmental stages, and 134 KEGG pathways were enriched. We mapped and analyzed the top 20 pathways screened for the highest enrichment of DEGs (Figure 5A). The results showed that DEGs were significantly enriched in plant hormone signal transduction, MAPK signaling pathway-plant, starch, and sucrose metabolism pathways. Among them, more genes were enriched in the plant hormone signal transduction pathway, accounting for 9.22% of the total DEGs in all the pathways. It was also found that among the top three pathways that were most enriched in DEGs, the number of DEGs was the lowest at 20 DAP, while the number of DEGs was the highest in 40 DAP fruits, with a 2-3-fold difference between the two. These data suggest that differences in fruit size become more pronounced later in fruit development, when the number of DEGs increases.
In the “Plant hormone signal transduction” pathway, ten genes encoding six proteins of the Auxin signal transduction pathway were significantly differentially expressed in the large-fruited pepper and small-fruited pepper at different times (Figure 5B). Among these genes, we found that the expression of CaAUX1 (Capana04g001744), CaGH3 (Capana08g002278), and CaSAUR (Capana06g001979) was significantly elevated in the large-fruited pepper at the time of the ovary stage and was 2.87-fold, 2.44-fold, and 2.84-fold higher compared with that of the small-fruited pepper, respectively. In addition, the expression of CaAUX/IAA (Capana09g000285) was higher in the large-fruited pepper than in the small-fruited pepper at all five developmental stages and was significantly up-regulated at 20 DAP and 40 DAP. The expression of CaTIR1 (Capana06g-000011), CaAUX/IAA (Capana08g001238), and CaSAUR (Capana03g001921) was significantly higher in the large-fruited pepper than in the small-fruited pepper at the later developmental stages of the fruit (30 DAP, 40 DAP).

3.5. Weighted Gene Co-Expression Network Analysis(WGCNA)

To screen gene modules related to the development of pepper fruit size, explore the co-expression network of fruit size-related genes based on expression patterns, and filter the core genes in the fundamental modules, WGCNA analyzed 21,878 DEGs. The results showed that the TOM dendrogram and heatmap of correlation between genes and samples were clustered in a cluster dendrogram divided into 16 co-expression modules (Figure 6A). Among them, the most significant number of genes was pressed in the MEbrown module, which was 3680; and the smallest number was in the MEsaddlebrown module, which was 77. Module-trait correlation heat maps were analyzed after correlating the co-expression network with the statistical values of weight traits of samples from different developmental stages of the two fruit specimens (Figure 6B). The results showed that the MEorangered4 module was highly significantly and positively correlated with the weight trait of pepper fruits with a correlation coefficient of 0.93, and 140 genes were highly accumulated in this module (Figure 6C; Table S3). Secondly, 1107 genes in the MEcyan module and 458 genes in the MEblack module were also positively correlated with the fruit weight trait, with correlation coefficients of 0.71 and 0.67, respectively. In contrast, the MEmidnightblue module was negatively associated with the fruit weight trait.
The analysis revealed that the MEorangered4 module had the most significant positive correlation with fruit weight. To screen the core genes within the fundamental modules, Cytoscape software was used to filter the core genes and visualize their interaction networks. The results showed that Floral homeotic protein APETALA 2 (Capana04g-002188), Nuclear transcription factor Y subunit C-2 (Capana11g000869), Eukaryotic translation initiation factor isoform 4G-1 (newGene_16303), Fasciclin-like arabinogalactan protein 9 (Capana07g001777), Serine/threonine-protein kinase PBS1 (Capana02g003676) are core genes within the MEorangered4 module. Core genes such as APETALA 2, EIF4G1, and NF-Y C-2 have been found to play roles in flower development, mitosis, and plant growth and development. All these genes were significantly elevated in the large-fruited pepper in this study, so it is hypothesized that they also contribute to fruit size.

3.6. Expression Analysis of DEGs Associated with Fruit Weight in Pepper (Capsicum annuum)

3.6.1. Genes Associated with Cell Division, Changes in Cell Cycle Control, and Cell Wall

In ALL DEGs, genes with unknown function and low expression were identified by first deleting genes with unknown function and that were low regulated, then excluding genes not related to plant growth and development by annotation, and searching for genes related to fruit expansion. The results revealed eight DEGs, specifically in cell division and cell cycle control, and six genes related to cell walls, membranes, and envelopes (Figure 7). Among them, CaCullin-1 (Capana11g002239), CaSKD1 (Protein SUPPRESSOR OF K(+) TRANSPORT GROWTH DEFECT 1, Capana00g004069), and Cwf15/Cwc15 cell cycle control protein (Capana01g001023) were significantly up-regulated throughout the developmental stage from ovary stage to fruit ripening in large-fruited pepper, and their expression differed considerably from that in small-fruited pepper, where CaSKD1 was also annotated to be associated with the cell wall; putative RING-H2 finger protein ATL71-like (Capana00g004824) gene was significantly elevated at 30 DAP in large-fruited pepper and was higher but not up-regulated compared to small-fruited pepper in other developmental stages; L-ascorbate oxidase (Capana12g001690) was significantly up-regulated at 0 DAP, 15 DAP, and 30 DAP in large-fruited pepper, and the expression of these was 6-0-8.6-fold higher in 15 DAP and 30 DAP compared to small fruits; presumably, these genes all play a role in promoting cell division. In addition, we found that three genes, Sucrose synthase 2 (Capana03g003656), CaExpansin-A1 (Capana04g000153), and Probable arabinosyltransferase ARAD1 (Capana11g002074), were highly expressed in the whole developmental stage (0DAP to 40DAP) of the small-fruited pepper. They were significantly higher in the small-fruited pepper, except for CaExpansin-A1 (Capana04g000153), which showed no difference between the large-fruited pepper and small-fruited pepper at 0 DAP. In contrast, CDT1-like protein a (Capana01g001717) was significantly down-regulated in expression throughout the developmental stages (0 DAP to 40 DAP) in large-fruited pepper compared to small-fruited pepper. In addition, the expression of putative glycine-rich cell wall structural protein 1 (Capana03g002560), Pistil-specific extensin-like protein (Capana02g001935), and Fasciclin-like arabinogalactan protein 1 (Capana10g000176) were three genes whose expression was significantly elevated in large-fruited pepper.

3.6.2. Transcription Factors Associated with Fruit Size Regulation

Transcription factors are a class of proteins that regulate gene expression, and transcription families such as MADS-box, BHLH, and HD-ZIP have been shown to play essential roles in plant growth and development by previous studies [14,17,45]. In our research, transcription factor analysis using ALL DEGs from different developmental stages of large- and small-fruited pepper revealed a total of 1758 differentially expressed transcription factors, and the most representative and gene-rich TF families were MYB, AP2, BHLH, C2H2, MADS, WRKY, GRAS, HB-HD-ZIP, and OFP, with 189, 162, 131, 120, 109, 69, 58, 38, and 24 genes (Table S4).
Through gene annotation and expression screening, 11 significantly specifically expressed transcription factors were identified in three transcription families, MADS-box, BHLH, and HD-ZIP (Figure 8). Among them, five transcription factors were significantly differentially expressed in the pepper ovary stage: CaATHB-40 (Capana02g002657), CaATHB-16 (Capana04g000966), Agamous-like MADS-box protein MADS3 (Capana01g-001334), CabHLH137 (Capana03g001619), and CabHLH62 (Capana06g000216), and they were significantly up-regulated in the large-fruited pepper compared to small-fruited pepper, whereas they were under-expressed or non-expressed at all other developmental stages, which is hypothesized that these genes regulate fruit expansion at the time of ovary stage. During the fruit development stages, CabHLH35 (Capana01g000441), CaMYC1 (Capana01g004352), CaPRE6 (newGene_4731), CaATHB-13 (Capana11g001647), and CaHAT22 (Capana02g002922) were highly expressed in large-fruited pepper along with the Agamous- like MADS-box protein AGL8 homolog (Capana00g004709) were highly regulated in large fruits, in which newGene_4731 was significantly up-regulated in large-fruited pepper of 30 DAP and 40 DAP, with higher regulation than that in small-fruited pepper by over 4.3-fold. And two genes, Capana11g001647 and Capana00g004709, were highly regulated in the entire developmental stage of large-fruited pepper, ‘B400’. Among them, the CaATHB-13 (Capana11g001647) gene expression was slightly higher in ‘B302’ than in ‘B400’ at 15 DAP but not yet to a significantly up-regulated level. Still, it reached a considerable level in all other developmental stages.

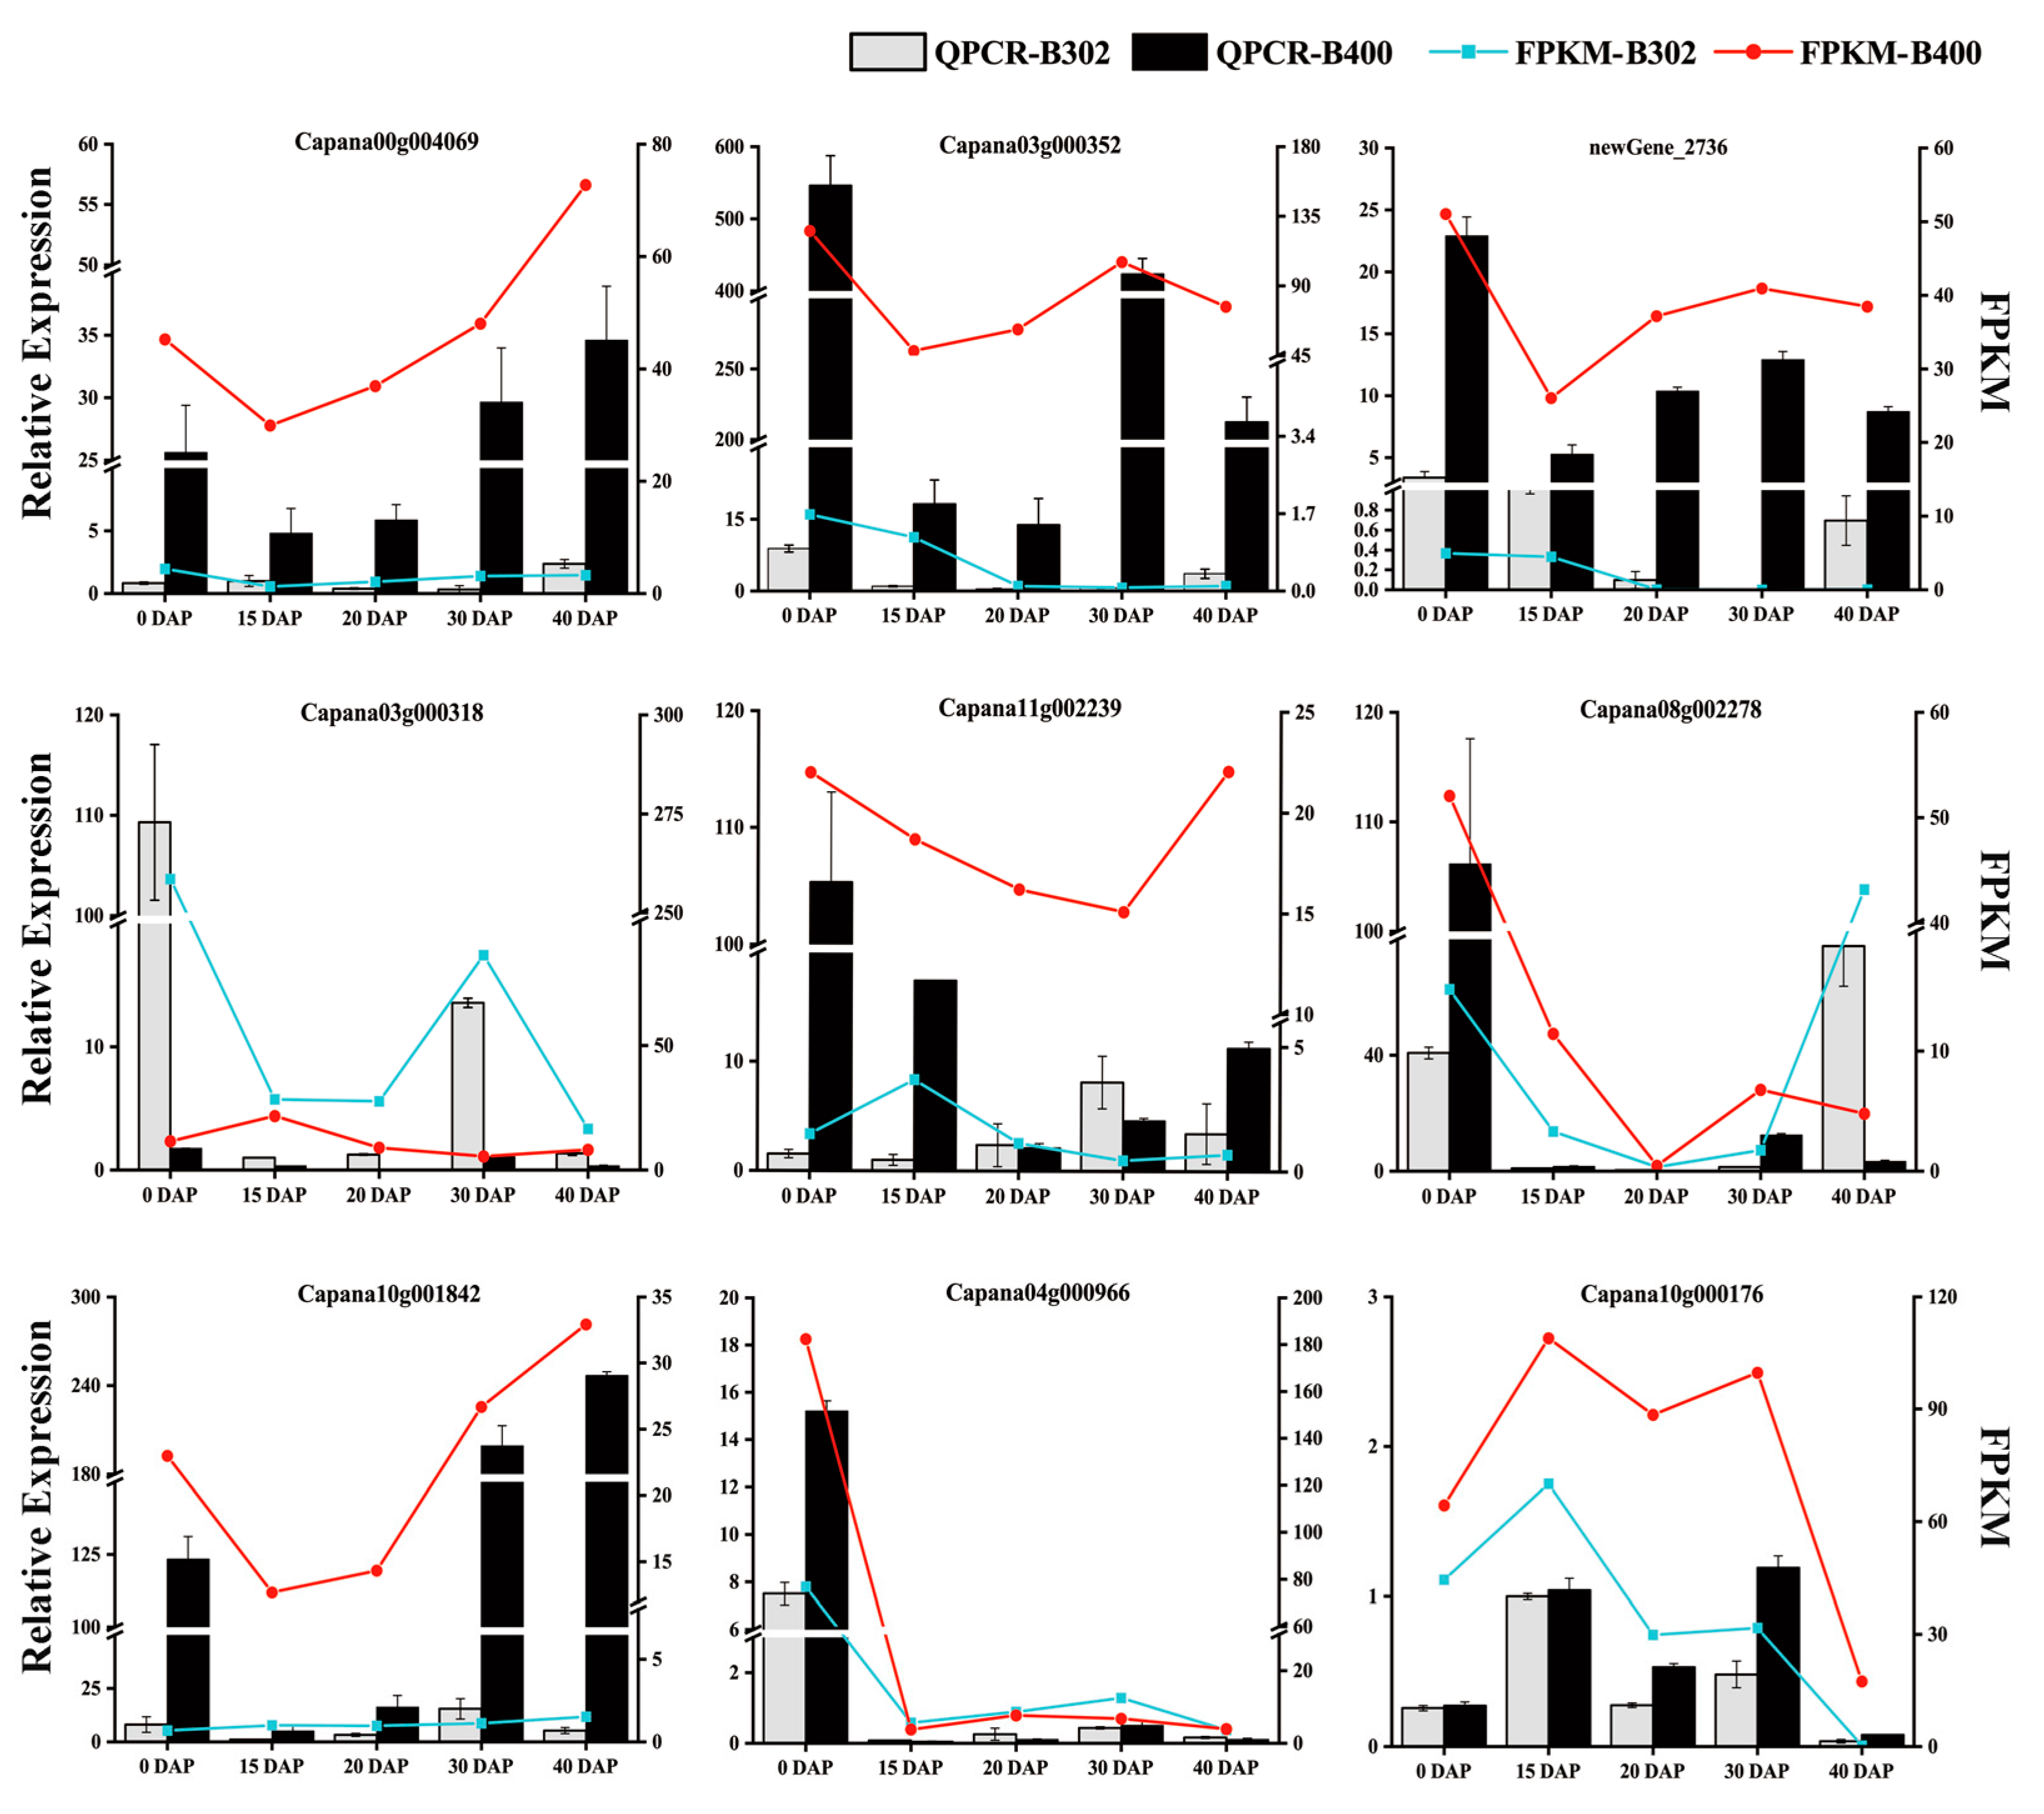
3.7. Verification of Gene Expression Pattern by qRT-PCR

Based on the sequencing results of the transcriptome, we validated the qRT-PCR for nine significantly differentially regulated genes. The results are shown in Figure 9. By detecting the expression levels of these genes, it was found that the (FPKM) results obtained from their transcriptome sequencing in different developmental stages of large- and small-fruited pepper were consistent with the results of the fluorescence qRT-PCR trend, which indicated that the results of the data in this study were reliable.

4. Discussion

Currently, there are fewer studies on the molecular regulation of pepper fruit size formation and no complete regulatory mechanism has been developed. In this study, a total of 11,028 DEGs obtained by transcriptome sequencing were used to investigate the regulatory mechanisms controlling fruit weight in pepper. Boron is a micronutrient required for plant growth, development and yield enhancement, and its deficiency during the reproductive period can lead to poor fruit growth. [46,47,48]. Boron uptake from the soil into the roots occurs mainly through several proteins that form boric acid channels [49,50]. BOR1 is an efflux boron transporter protein necessary for efficient loading of B xylem, and in Arabidopsis, the overexpression of BOR1 acts to increase seed yield when boron is deficient [51]. BOR2 is also an efflux boron transporter protein, and cell elongation in BOR2 mutant roots is inhibited under low boron conditions [52]. Boron functional genes have been studied more, but mostly in relation to plant growth, especially flower development, while less research exists in relation to fruit weight. Recently, a spike development-deficient mutant, sibor1, was identified in wheat, and sibor1 has a reduced spike weight per kernel compared to the wild type [53]. In our study, Boron transporter 4 (Capana03g000352) was highly expressed throughout the developmental stages of item ‘b400’. In contrast, it was hardly expressed in ‘B302’, suggesting that boron transporter 4 promotes the development of ‘B400’. Therefore, it is speculated that Boron Transporter 4 has the function of making fruit enlargement based on the function of boron, but further verification is needed.
Fruit development is controlled by cell division and cell proliferation, and the cell wall also stretches as the pulp increases in size. Cheniclet found that the temporal and spatial coordination of cell division and amplification and the onset, rate, and duration of their occurrence in tomatoes constitute the final fruit size [54]. Cullin proteins can assemble into different Cullin-RING ubiquitin ligases (CRL) complexes. CRLs have been found to influence many biological processes involved in cell growth and development and signal transduction [55]. For example, in human cells, overexpression of Cullin-1 significantly increases cell growth rate and increases tumor size and weight, and it has been presumed that Cullin-1 acts by promoting cell proliferation [56]. L-ascorbate oxidase (AO) acts as an inducer of cell proliferation in pea root cells [57]. Recently, significant reductions in fruit weight and size were found after silencing AO in melon, suggesting that AO can positively regulate fruit weight or size [58]. In our study, the expression of CaCullin-1 (Capana11g002239) and L-ascorbate oxidase (Capana12g001690) was significantly higher in ‘B400’ than in ‘B302’. Therefore, it is speculated that CaCullin-1 and L-ascorbate oxidase positively regulate the size of the fruits in the growth of plants such as pepper. This effect is most likely achieved by promoting cell proliferation and expansion.
Growth hormone is a significant coordinating signal for phytohormones, which can be involved in cell division, elongation, and differentiation and interact with other signaling pathways in plant development. In plant hormone signal transduction, the process of growth hormone signal transduction is divided into two steps, firstly, the tryptophan metabolism pathway synthesizes AUX1 and activates the transport inhibitor response protein (TIR1); then, the transport inhibitor response protein mediates ubiquitylation and inhibits the growth hormone response factor ARF, which is released from the dissociation of AUX/IAA, to activate the transcription process [59,60]. Growth hormone acts as a “molecular glue” that enhances the interaction of Aux/IAA with TIR1 [61]. TIR1 recognizes and is induced by AUX1 [62]. It has been demonstrated that in Arabidopsis root systems, TIR1-mediated processes cause growth hormone inhibition [63,64]. ARF is the last key step in the AUX1 transcriptional system, which determines the ability of Aux/IAA to regulate transcription by interacting with the AREs, in order to regulate gene expression [59]. In our study, two genes of CaAUX1, Capana04g001744 and Capana00g003418, were expressed in all five developmental stages of pepper, suggesting that in pepper, the fruits’ tryptophan (Trp) can synthesize relatively sufficient AUX1 and activate transcription. In addition, the expression of Capana04g001744 was significantly higher in the 0 DAP, 20 DAP, and 40 DAP stages in the large-fruited pepper. In contrast, the expression level was lower in the small-fruited pepper, suggesting that the transcriptional level of CaAUX1 was enhanced in large-fruited pepper. The expression of CaAUX/IAA (Capana09g000285, Capana08g001238) and CaARF (Capana00g000130, Capana04g000259) was elevated in the large-fruited pepper in the ovary stage, and the expression of CaGH3 (Capana08g002278) and CaSAUR (Capana06g001979, Capana03g001921) was significantly up-regulated in large-fruited pepper. It indicates that ARF activates three response factors, CaSAUR (Capana06g001979, Capana03g001921), CaAUX/IAA (Capana09g000285, Capana08g-001238), and CaGH3 (Capana08g002278), through the interaction of DNA. SAUR has been shown to be a positive regulator of cell expansion in a variety of plants. For example, in Arabidopsis, over-repression of SAUR19 in Arabidopsis lines results in cell expansion [65]. In our study, two genes of CaSAUR (Capana06g001979, Capana03g001921), had elevated expression in the large-fruited pepper compared to small-fruited pepper for almost all the developmental stages. Meanwhile, SAUR, AUX/IAA, and GH3 ultimately led to cell enlargement and plant growth. In addition, most of the genes in the Auxin signal transduction pathway were highly expressed in the large-fruited pepper, suggesting that the growth hormone pathway genes may have an effect on fruit size.
The MADS-box, BHLH, and HD-ZIP transcription families play essential roles in plant growth and development. In previous studies, MADS-box was first found to have a regulatory function in plant flowers, and AGAMOUS (AG) was one of the first MADS-box factors identified [66,67]. In Arabidopsis fruit, AGL23 was found to regulate female gamete and embryo formation by controlling organ biosynthesis [68,69]. The basic helix-loop-helix (bHLH) is one of the most prominent families of transcription factors in Arabidopsis thaliana. bHLH is usually involved in many physiological processes in plants by regulating the expression of target genes and has synthetic, metabolic, and transduction functions in phytohormone [14]. In our study, we found that the transcription factors CaMADS3 (Capana01g001334), CaAGL8 (Capana00g004709), CaATHB13 (Capana11g001647), CaATHB-40 (Capana02g002657), CaATHB-16 (Capana04g000966), and transcription factor PRE6 (newGene_4731) were significantly more highly expressed in the large-fruited pepper compared to small-fruited pepper. Among them, the MADS-box genes (Capana01g001334 and Capana00g004709) were highly and consistently expressed in large-fruited pepper at the ovary stage and at 20 DAP-40 DAP, indicating that the MADS-box acts in fruit from the beginning of the ovary stage to the subsequent development and positively regulates the size of the fruit. In conclusion, most of the transcription factors were clearly expressed in large-fruited pepper, and therefore it is hypothesized that they contribute to some extent to fruit enlargement. In addition, the analyses revealed that the expression of some of the transcription factors that were clearly expressed in this study was significantly elevated at the ovary stage. In contrast, they were barely expressed at other developmental stages, which may also be related to the organizational and structural differences during ovary and fruit development. The transcription factors ATHB13, ATHB-40, and ATHB-16 are transcription factors of the HD-Zip family. In several species of black pepper, AtHB-13 is highly expressed during early fruit development [70]. In addition, Arabidopsis studies have confirmed that ATHB-13 plays an important role in pollen germination [71]. In tomato, ATHB-40 was found to be induced by growth factors to be expressed in fruits [72,73]. ATHB-16 regulates Arabidopsis leaf development and is a negative regulator of leaf cell expansion [74]. At present, except for ATHB-16, which has not been found to play a role in plant fruits, both ATHB13 and ATHB-40 have been reported. In our study, CaATHB13 (Capana11g001647), CaATHB-40 (Capana02g002657), and CaATHB-16 (Capana04g-000966) were consistently highly expressed in the large-fruited pepper, suggesting that the transcription factors ATHB13, ATHB-40, and ATHB-16 are essential for fruit expansion and development. In addition to ATHB-40, which is associated with growth hormone regulation, the transcription factor PRE6 (newGene_4731) was found to be a structural domain protein of HLH (helix-loop-helix DNA-binding domain) in the BHLH family of transcripts, which has functions related to cell growth, cell division and growth hormone metabolism [75]. In conclusion, the transcription factor PRE6 gene, which has a similar role to BHLH, regulates the expression of target genes by acting as a homodimer or heterodimer during the expression of transcription factors and then mediates growth hormone biosynthesis, which occurs through the induction of a series of genes with CaATHB-40 and other genes and functions, and finally reveals the phenotype on the plant.

5. Conclusions

In this study, five developmental stages of transcriptome sequencing were performed using two pepper recombinant lines with different fruit sizes to reveal critical genes and pathways associated with regulating fruit size. A total of 21,878 DEGs were identified, and the number of up-regulated genes was more significant than down-regulated genes in ‘B400’ compared to ‘B302’. Functional analysis of these DEGs revealed that the expression of boron transporter 4 was significantly higher in the large-fruited pepper, and boron genes play a role in the formation of fruit size.
The genes AUX1, ARF, SAUR, and Aux/IAA in the Auxin signal transduction hormone pathway as well as the transcription factors PRE6, ATHB-40, and AGL8 were significantly overexpressed in the large-fruited pepper. Phytohormones, especially auxin, influence fruit development. Furthermore, it was speculated that transcription factor PRE6 and AGL8 have the functions of mediating growth hormone synthesis and regulating growth hormone-related genes, whereas ATHB-40 is induced to exercise its function by growth hormone, suggesting that the interactions between the transcription factors and phytohormones regulate the development of the fruit size. The results of this study revealed transcription factors with the function of synthesizing or regulating phytohormones, which may induce the function of functional genes by regulating the expression of target genes and provide a reference value and theoretical basis for clarifying the molecular regulation mechanism of pepper fruit size.

Supplementary Materials

The following supporting information can be downloaded at: https://www.mdpi.com/article/10.3390/horticulturae9091009/s1, Table S1: Primers used for qRT-PCR in this study; Table S2: All genes identified in the study.; Table S3: Co-expression of core genes for key modules within the network; Table S4: Representative transcription family factors (TFs).

Author Contributions

Conceptualization, B.Y.; methodology, Y.Z.; software, Q.M.; validation, Y.Z., L.M. and Q.M.; formal analysis, Y.Z.; investigation, L.M. and Z.W.; resources, X.Z.; data curation, Y.Z.; writing—original draft preparation, Y.Z.; writing—review and editing, B.Y.; visualization, Y.Z.; supervision, Z.L.; project administration, Z.L.; funding acquisition, Z.L. All authors have read and agreed to the published version of the manuscript.

Funding

This work was financially supported by the Natural Science Foundation of Hunan Province (Grant No. 2021JJ40240) and the Special Project of Biological Seed Industry and Fine and Deep Processing of Agricultural Products (Grant No. 202202AE090031).

Data Availability Statement

The data presented in this study are available on request from the corresponding author. RNA-Seq data generated in this study are available from the SRA-Archive (http://www.ncbi.nlm.nih.gov/sra (accessed on 18 July 2023)) with accession number PRJNA989755.

Acknowledgments

We thank Biomarker Technologies Co., Ltd. (Beijing, China) for assisting in the sequencing and bioinformatics analysis.

Conflicts of Interest

The authors declare no conflict of interest.

References

  1. Li, G.; Xu, H.; Liu, Z.; Zhu, F.; Zou, X. The Global Dissemination of Capsicum. Chin. J. Trop. Crops 2023, 44, 1307–1316. [Google Scholar] [CrossRef]
  2. Lin, Q.; Xin, Z.; Kong, L.; Wang, X.; Yang, X.; He, W. Current situation of pepper industry development and breeding countermeasures in China. J. China Agric. Univ. 2023, 5, 82–95. [Google Scholar] [CrossRef]
  3. He, H.; Yamamuro, C. Interplays between auxin and GA signaling coordinate early fruit development. Hortic. Res. 2022, 9, uhab078. [Google Scholar] [CrossRef] [PubMed]
  4. Wang, X.; Wu, Y.; Hu, L.; Zhang, C.; Wu, W.; Li, W.; Fang, J. Elucidation of the mechanism underlying seedless blueberry formation after GA3 treatment based on the phenotype, physiology, metabolism and transcriptome. Sci. Hortic. 2023, 311, 111781. [Google Scholar] [CrossRef]
  5. Mu, Q.; Huang, Z.; Chakrabarti, M.; Illa-Berenguer, E.; Liu, X.; Wang, Y.; Ramos, A.; van der Knaap, E. Fruit weight is controlled by Cell Size Regulator encoding a novel protein that is expressed in maturing tomato fruits. PLoS Genet. 2017, 13, e1006930. [Google Scholar] [CrossRef] [PubMed]
  6. Cheniclet, C.; Rong, W.Y.; Causse, M.; Frangne, N.; Bolling, L.; Carde, J.-P.; Renaudin, J.-P. Cell expansion and endoreduplication show a large genetic variability in pericarp and contribute strongly to tomato fruit growth. Plant Physiol. 2005, 139, 1984–1994. [Google Scholar] [CrossRef] [PubMed]
  7. Schruff, M.C.; Spielman, M.; Tiwari, S.; Adams, S.; Fenby, N.; Scott, R.J. The Auxin Response Factor 2 gene of Arabidopsis links auxin signalling, cell division, and the size of seeds and other organs. Development 2006, 133, 251–261. [Google Scholar] [CrossRef] [PubMed]
  8. Deprost, D.; Yao, L.; Sormani, R.; Moreau, M.; Leterreux, G.; Nicolaï, M.; Bedu, M.; Robaglia, C.; Meyer, C. The Arabidopsis TOR kinase links plant growth, yield, stress resistance and mRNA translation. EMBO Rep. 2007, 8, 864–870. [Google Scholar] [CrossRef] [PubMed]
  9. Krizek, B.A. Making bigger plants: Key regulators of final organ size. Curr. Opin. Plant Biol. 2009, 12, 17–22. [Google Scholar] [CrossRef] [PubMed]
  10. Horváth, B.M.; Magyar, Z.; Zhang, Y.; Hamburger, A.W.; Bakó, L.; Visser, R.G.F.; Bachem, C.W.B.; Bögre, L. EBP1 regulates organ size through cell growth and proliferation in plants. EMBO J. 2006, 25, 4909–4920. [Google Scholar] [CrossRef] [PubMed]
  11. Rachappanavar, V.; Padiyal, A.; Sharma, J.K.; Gupta, S.K. Plant hormone-mediated stress regulation responses in fruit crops—A review. Sci. Hortic. 2022, 304, 111302. [Google Scholar] [CrossRef]
  12. Santner, A.; Calderon-Villalobos, L.I.A.; Estelle, M. Plant hormones are versatile chemical regulators of plant growth. Nat. Chem. Biol. 2009, 5, 301–307. [Google Scholar] [CrossRef] [PubMed]
  13. Waadt, R.; Seller, C.A.; Hsu, P.-K.; Takahashi, Y.; Munemasa, S.; Schroeder, J.I. Plant hormone regulation of abiotic stress responses. Nat. Rev. Mol. Cell Biol. 2022, 23, 680–694. [Google Scholar] [CrossRef] [PubMed]
  14. Hao, Y.; Zong, X.; Ren, P.; Qian, Y.; Fu, A. Basic Helix-Loop-Helix (bHLH) Transcription Factors Regulate a Wide Range of Functions in Arabidopsis. Int. J. Mol. Sci. 2021, 22, 7152. [Google Scholar] [CrossRef] [PubMed]
  15. Huang, B.; Hu, G.; Wang, K.; Frasse, P.; Maza, E.; Djari, A.; Deng, W.; Pirrello, J.; Burlat, V.; Pons, C.; et al. Interaction of two MADS-box genes leads to growth phenotype divergence of all-flesh type of tomatoes. Nat. Commun. 2021, 12, 6892. [Google Scholar] [CrossRef] [PubMed]
  16. Becker, A.; Theissen, G. The major clades of MADS-box genes and their role in the development and evolution of flowering plants. Mol. Phylogenet. Evol. 2003, 29, 464–489. [Google Scholar] [CrossRef]
  17. Shore, P.; Sharrocks, A.D. The MADS-box family of transcription factors. Eur. J. Biochem. 1995, 229, 1–13. [Google Scholar] [CrossRef]
  18. Guo, X.H.; Li, H.; Yin, L.L.; Liu, W.Y.; Naeem, M.; Guo, M. The Mechanism of MADS-box Gene SlMBP3 Modulating Tomato Fruit Size. Russ. J. Plant Physiol. 2022, 69, 63. [Google Scholar] [CrossRef]
  19. Mizukami, Y.; Ma, H. Ectopic expression of the floral homeotic gene AGAMOUS in transgenic Arabidopsis plants alters floral organ identity. Cell 1992, 71, 119–131. [Google Scholar] [CrossRef]
  20. Mizukami, Y.; Ma, H. Determination of Arabidopsis floral meristem identity by AGAMOUS. Plant Cell 1997, 9, 393–408. [Google Scholar] [CrossRef]
  21. Cheng, Y.; Zhao, Y. A Role for Auxin in Flower Development. J. Integr. Plant Biol. 2007, 49, 99–104. [Google Scholar] [CrossRef]
  22. Liljegren, S.J.; Ditta, G.S.; Eshed, Y.; Savidge, B.; Bowman, J.L.; Yanofsky, M.F. SHATTERPROOF MADS-box genes control seed dispersal in Arabidopsis. Nature 2000, 404, 766–770. [Google Scholar] [CrossRef] [PubMed]
  23. Gu, Q.; Ferrándiz, C.; Yanofsky, M.F.; Martienssen, R. The FRUITFULL MADS-box gene mediates cell differentiation during Arabidopsis fruit development. Development 1998, 125, 1509–1517. [Google Scholar] [CrossRef] [PubMed]
  24. Zhao, J.; Gong, P.; Liu, H.; Zhang, M.; He, C. Multiple and integrated functions of floral C-class MADS-box genes in flower and fruit development of Physalis floridana. Plant Mol. Biol. 2021, 107, 101–116. [Google Scholar] [CrossRef]
  25. Sessa, G.; Carabelli, M.; Possenti, M.; Morelli, G.; Ruberti, I. Multiple Links between HD-Zip Proteins and Hormone Networks. Int. J. Mol. Sci. 2018, 19, 4047. [Google Scholar] [CrossRef] [PubMed]
  26. Harris, J.C.; Hrmova, M.; Lopato, S.; Langridge, P. Modulation of plant growth by HD-Zip class I and II transcription factors in response to environmental stimuli. New Phytol. 2011, 190, 823–837. [Google Scholar] [CrossRef] [PubMed]
  27. Rodriguez, R.E.; Debernardi, J.M.; Palatnik, J.F. Morphogenesis of simple leaves: Regulation of leaf size and shape. Wiley Interdiscip. Rev. Dev. Biol. 2014, 3, 41–57. [Google Scholar] [CrossRef] [PubMed]
  28. Sablowski, R. Control of patterning, growth, and differentiation by floral organ identity genes. J. Exp. Bot. 2015, 66, 1065–1073. [Google Scholar] [CrossRef]
  29. Khan, M.; Xu, H.; Hepworth, S.R. BLADE-ON-PETIOLE genes: Setting boundaries in development and defense. Plant Sci. 2014, 215–216, 157–171. [Google Scholar] [CrossRef] [PubMed]
  30. Rodríguez, G.R.; Muños, S.; Anderson, C.; Sim, S.-C.; Michel, A.; Causse, M.; Gardener, B.B.M.; Francis, D.; van der Knaap, E. Distribution of SUN, OVATE, LC, and FAS in the tomato germplasm and the relationship to fruit shape diversity. Plant Physiol. 2011, 156, 275–285. [Google Scholar] [CrossRef] [PubMed]
  31. Wu, S.; Xiao, H.; Cabrera, A.; Meulia, T.; van der Knaap, E. SUN regulates vegetative and reproductive organ shape by changing cell division patterns. Plant Physiol. 2011, 157, 1175–1186. [Google Scholar] [CrossRef]
  32. Chakrabarti, M.; Zhang, N.; Sauvage, C.; Muños, S.; Blanca, J.; Cañizares, J.; Diez, M.J.; Schneider, R.; Mazourek, M.; McClead, J.; et al. A cytochrome P450 regulates a domestication trait in cultivated tomato. Proc. Natl. Acad. Sci. USA 2013, 110, 17125–17130. [Google Scholar] [CrossRef] [PubMed]
  33. Liu, J.; Van Eck, J.; Cong, B.; Tanksley, S.D. A new class of regulatory genes underlying the cause of pear-shaped tomato fruit. Proc. Natl. Acad. Sci. USA 2002, 99, 13302–13306. [Google Scholar] [CrossRef] [PubMed]
  34. Huang, Z.; van der Knaap, E. Tomato fruit weight 11.3 maps close to fasciated on the bottom of chromosome 11. Theor. Appl. Genet. 2011, 123, 465–474. [Google Scholar] [CrossRef]
  35. Chaim, A.; Borovsky, Y.; Rao, G.; Gur, A.; Zamir, D.; Paran, I. Comparative QTL mapping of fruit size and shape in tomato and pepper. Isr. J. Plant Sci. 2006, 54, 191–203. [Google Scholar] [CrossRef]
  36. Tsaballa, A.; Pasentsis, K.; Darzentas, N.; Tsaftaris, A.S. Multiple evidence for the role of an Ovate-like gene in determining fruit shape in pepper. BMC Plant Biol. 2011, 11, 46. [Google Scholar] [CrossRef] [PubMed]
  37. Chunthawodtiporn, J.; Hill, T.; Stoffel, K.; Van Deynze, A. Quantitative Trait Loci Controlling Fruit Size and Other Horticultural Traits in Bell Pepper (Capsicum annuum). Plant Genome 2018, 11, 160125. [Google Scholar] [CrossRef] [PubMed]
  38. Wang, L.; Liu, X.; Li, Q.; Xu, N.; He, C. A lineage-specific arginine in POS1 is required for fruit size control in Physaleae (Solanaceae) via gene co-option. Plant J. 2022, 111, 183–204. [Google Scholar] [CrossRef] [PubMed]
  39. Davidson, N.M.; Oshlack, A. Corset: Enabling differential gene expression analysis for de novo assembled transcriptomes. Genome Biol. 2014, 15, 410. [Google Scholar] [CrossRef] [PubMed]
  40. Love, M.I.; Huber, W.; Anders, S. Moderated estimation of fold change and dispersion for RNA-seq data with DESeq2. Genome Biol. 2014, 15, 550. [Google Scholar] [CrossRef]
  41. Langfelder, P.; Horvath, S. WGCNA: An R package for weighted correlation network analysis. BMC Bioinform. 2008, 9, 559. [Google Scholar] [CrossRef] [PubMed]
  42. Taylor, S.C.; Nadeau, K.; Abbasi, M.; Lachance, C.; Nguyen, M.; Fenrich, J. The ultimate qPCR experiment: Producing publication quality, reproducible data the first time. Trends Biotechnol. 2019, 37, 761–774. [Google Scholar] [CrossRef] [PubMed]
  43. Mestdagh, P.; Van Vlierberghe, P.; De Weer, A.; Muth, D.; Westermann, F.; Speleman, F.; Vandesompele, J. A novel and universal method for microRNA RT-qPCR data normalization. Genome Biol. 2009, 10, R64. [Google Scholar] [CrossRef] [PubMed]
  44. Singh, A. SPSS—An Overview; Institute of Agricultural Sciences: Zürich. Switzerland. 2015.
  45. Ariel, F.D.; Manavella, P.A.; Dezar, C.A.; Chan, R.L. The true story of the HD-Zip family. Trends Plant Sci. 2007, 12, 419–426. [Google Scholar] [CrossRef] [PubMed]
  46. Dell, B.; Huang, L. Physiological response of plants to low boron. Plant Soil. 1997, 193, 103–120. [Google Scholar] [CrossRef]
  47. Da Silva, M.P.S.; Mendonça Freitas, M.S.; Cesar Santos, P.; De Carvalho, A.J.C.; Jorge, T.S. Capsicum annuum var. annuum under macronutrients and boron deficiencies: Leaf content and visual symptoms. J. Plant Nutr. 2019, 42, 417–427. [Google Scholar] [CrossRef]
  48. Sarafi, E.; Tsouvaltzis, P.; Chatzissavvidis, C.; Siomos, A.; Therios, I. Melatonin and resveratrol reverse the toxic effect of high boron (B) and modulate biochemical parameters in pepper plants (Capsicum annuum L.). Plant Physiol. Biochem. 2017, 112, 173–182. [Google Scholar] [CrossRef] [PubMed]
  49. Miwa, K.; Fujiwara, T. Boron transport in plants: Co-ordinated regulation of transporters. Ann. Bot. 2010, 105, 1103–1108. [Google Scholar] [CrossRef] [PubMed]
  50. Tanaka, M.; Wallace, I.S.; Takano, J.; Roberts, D.M.; Fujiwara, T. NIP6;1 is a boric acid channel for preferential transport of boron to growing shoot tissues in Arabidopsis. Plant Cell 2008, 20, 2860–2875. [Google Scholar] [CrossRef] [PubMed]
  51. Miwa, K.; Takano, J.; Fujiwara, T. Improvement of seed yields under boron-limiting conditions through overexpression of BOR1, a boron transporter for xylem loading, in Arabidopsis thaliana. Plant J. 2006, 46, 1084–1091. [Google Scholar] [CrossRef] [PubMed]
  52. Miwa, K.; Wakuta, S.; Takada, S.; Ide, K.; Takano, J.; Naito, S.; Omori, H.; Matsunaga, T.; Fujiwara, T. Roles of BOR2, a boron exporter, in cross linking of rhamnogalacturonan II and root elongation under boron limitation in Arabidopsis. Plant Physiol. 2013, 163, 1699–1709. [Google Scholar] [CrossRef]
  53. Wang, H.; Tang, S.; Zhi, H.; Xing, L.; Zhang, H.; Tang, C.; Wang, E.; Zhao, M.; Jia, G.; Feng, B.; et al. The boron transporter SiBOR1 functions in cell wall integrity, cellular homeostasis, and panicle development in foxtail millet. Crop J. 2022, 10, 342–353. [Google Scholar] [CrossRef]
  54. Mauxion, J.-P.; Chevalier, C.; Gonzalez, N. Complex cellular and molecular events determining fruit size. Trends Plant Sci. 2021, 26, 1023–1038. [Google Scholar] [CrossRef]
  55. Sarikas, A.; Hartmann, T.; Pan, Z.-Q. The Cullin Protein Family. Genome Biol. 2011, 12, 220. [Google Scholar] [CrossRef]
  56. Zhou, Y.-H.; Xia, J.; Xu, W.-H.; Zhu, X.; Wu, X.-H.; Hua, D.; Xing, C. Cullin-1 promotes cell proliferation in human breast cancer and is related to diabetes. Int. J. Biol. Markers 2016, 31, e375–e381. [Google Scholar] [CrossRef]
  57. Citterio, S.; Sgorbati, S.; Scippa, S.; Sparvoli, E. Ascorbic acid effect on the onset of cell proliferation in pea root. Physiol. Plant 1994, 92, 601–607. [Google Scholar] [CrossRef]
  58. Chatzopoulou, F.; Sanmartin, M.; Mellidou, I.; Pateraki, I.; Koukounaras, A.; Tanou, G.; Kalamaki, M.S.; Veljović-Jovanović, S.; Antić, T.C.; Kostas, S.; et al. Silencing of ascorbate oxidase results in reduced growth, altered ascorbic acid levels and ripening pattern in melon fruit. Plant Physiol. Biochem. 2020, 156, 291–303. [Google Scholar] [CrossRef]
  59. Feng, L.; Li, G.; He, Z.; Han, W.; Sun, J.; Huang, F.; Di, J.; Chen, Y. The ARF, GH3, and Aux/IAA gene families in castor bean (Ricinus communis L.): Genome-wide identification and expression profiles in high-stalk and dwarf strains. Ind. Crops Prod. 2019, 141, 111804. [Google Scholar] [CrossRef]
  60. Leyser, O. Auxin Signaling. Plant Physiol. 2018, 176, 465–479. [Google Scholar] [CrossRef]
  61. Devos, S.; Laukens, K.; Deckers, P.; Van Der Straeten, D.; Beeckman, T.; Inzé, D.; Van Onckelen, H.; Witters, E.; Prinsen, E. A Hormone and Proteome Approach to Picturing the Initial Metabolic Events During Plasmodiophora brassicae Infection on Arabidopsis. MPMI 2006, 19, 1431–1443. [Google Scholar] [CrossRef] [PubMed]
  62. Zhao, Y. Auxin Biosynthesis: A Simple Two-Step Pathway Converts Tryptophan to Indole-3-Acetic Acid in Plants. Mol. Plant 2012, 5, 334–338. [Google Scholar] [CrossRef] [PubMed]
  63. Tan, X.; Calderon-Villalobos, L.I.A.; Sharon, M.; Zheng, C.; Robinson, C.V.; Estelle, M.; Zheng, N. Mechanism of auxin perception by the TIR1 ubiquitin ligase. Nature 2007, 446, 640–645. [Google Scholar] [CrossRef]
  64. Kepinski, S.; Leyser, O. The Arabidopsis F-box protein TIR1 is an auxin receptor. Nature 2005, 435, 446–451. [Google Scholar] [CrossRef] [PubMed]
  65. Marchant, A.; Kargul, J.; May, S.T.; Muller, P.; Delbarre, A.; Perrot-Rechenmann, C.; Bennett, M.J. AUX1 regulates root gravitropism in Arabidopsis by facilitating auxin uptake within root apical tissues. EMBO J. 1999, 18, 2066–2073. [Google Scholar] [CrossRef] [PubMed]
  66. Fendrych, M.; Akhmanova, M.; Merrin, J.; Glanc, M.; Hagihara, S.; Takahashi, K.; Uchida, N.; Torii, K.U.; Friml, J. Rapid and reversible root growth inhibition by TIR1 auxin signalling. Nat. Plants 2018, 4, 453–459. [Google Scholar] [CrossRef]
  67. Spartz, A.K.; Lee, S.H.; Wenger, J.P.; Gonzalez, N.; Itoh, H.; Inzé, D.; Peer, W.A.; Murphy, A.S.; Overvoorde, P.J.; Gray, W.M. The SAUR19 subfamily of SMALL AUXIN UP RNA genes promote cell expansion. Plant J. 2012, 70, 978–990. [Google Scholar] [CrossRef]
  68. Wang, Y.; Zhang, J.; Hu, Z.; Guo, X.; Tian, S.; Chen, G. Genome-Wide Analysis of the MADS-Box Transcription Factor Family in Solanum lycopersicum. Int. J. Mol. Sci. 2019, 20, 2961. [Google Scholar] [CrossRef]
  69. Theissen, G. Development of floral organ identity: Stories from the MADS house. Curr. Opin. Plant Biol. 2001, 4, 75–85. [Google Scholar] [CrossRef]
  70. Khew, C.Y.; Harikrishna, J.A.; Wee, W.Y.; Lau, E.T.; Hwang, S.S. Transcriptional Sequencing and Gene Expression Analysis of Various Genes in Fruit Development of Three Different Black Pepper (Piper Nigrum L.) Varieties. Int. J. Genom. 2020, 2020, 1540915. [Google Scholar] [CrossRef]
  71. Ribone, P.A.; Capella, M.; Chan, R.L. Functional Characterization of the Homeodomain Leucine Zipper I Transcription Factor AtHB13 Reveals a Crucial Role in Arabidopsis Development. J. Exp. Bot. 2015, 66, 5929–5943. [Google Scholar] [CrossRef] [PubMed]
  72. Mora, C.C.; Perotti, M.F.; González-Grandío, E.; Ribone, P.A.; Cubas, P.; Chan, R.L. AtHB40 Modulates Primary Root Length and Gravitropism Involving CYCLINB and Auxin Transporters. Plant Sci. 2022, 324, 111421. [Google Scholar] [CrossRef] [PubMed]
  73. Tang, N.; Deng, W.; Hu, G.; Hu, N.; Li, Z. Transcriptome Profiling Reveals the Regulatory Mechanism Underlying Pollination Dependent and Parthenocarpic Fruit Set Mainly Mediated by Auxin and Gibberellin. PLoS ONE 2015, 10, e0125355. [Google Scholar] [CrossRef] [PubMed]
  74. Wang, Y.; Henriksson, E.; Söderman, E.; Henriksson, K.N.; Sundberg, E.; Engström, P. The Arabidopsis Homeobox Gene, ATHB16, Regulates Leaf Development and the Sensitivity to Photoperiod in Arabidopsis. Dev. Biol. 2003, 264, 228–239. [Google Scholar] [CrossRef] [PubMed]
  75. Richter, R.; Rossmann, S.; Gabriel, D.; Töpfer, R.; Theres, K.; Zyprian, E. Differential expression of transcription factor- and further growth-related genes correlates with contrasting cluster architecture in Vitis vinifera “Pinot Noir” and Vitis spp. genotypes. Theor. Appl. Genet. 2020, 133, 3249–3272. [Google Scholar] [CrossRef]
Figure 1. Phenotypic analysis of pepper fruits at different developmental stages in two specimens. (A) Pepper flowers, ovaries, seeds, and fruits at each developmental stage; (B) fruit weight; (C) fruit longitudinal; (D) fruit transverse diameter; (E) flesh thickness; (F) fruit tip width; (G) fruit shoulder width. *, p-value < 0.05; **, p-value < 0.01 (Test).
Horticulturae 09 01009 g001
Figure 2. Microscopic anatomical images of pepper fruits: (A) imaging the organization of the ovary; (B) 15 DAP Fruit tissue imaging; (C) 20 DAP Fruit tissue imaging; (D) 30 DAP Fruit tissue imaging; (E) 40 DAP Fruit tissue imaging.
Horticulturae 09 01009 g002
Figure 3. Statistical analysis of DEGs identified in the two specimens at different developmental stages: (A) histogram of up-regulated and down-regulated DEGs in the comparison groups at different developmental stages; (B) Veen plot of DEGs statistics in the comparison groups at different developmental stages. The comparison group is set to ‘B302’/’B400’.
Horticulturae 09 01009 g003
Figure 4. Summary map of the GO enrichment pathway of DEGs. Each row represents a GO project, and the number of genes in each module is shown above. The comparison group is set to ‘B302’/’B400’.
Horticulturae 09 01009 g004
Figure 5. KEGG enrichment analysis of DEGs and comparative analysis of plant hormone signal transduction genes: (A) the top 20 KEGG pathways with the highest concentration of deg were found in the control group of 5 developmental stages; (B) comparative analysis of DEGs expression in the “Plant hormone signal transduction” pathway between the two specimens at different times. The comparison group is set to ‘B302’/’B400’.
Horticulturae 09 01009 g005
Figure 6. Weighted gene co-expression network analysis (WGCNA): (A) clustering tree of gene systems based on TOM and the division of modules; (B) correlation analysis of different modules with fruit weight; (C) interaction network of core genes in the MEorangered4 module with the highest correlation with fruit weight. Note: red represents core genes, blue represents genes co-expressed with core genes.
Horticulturae 09 01009 g006
Figure 7. Heatmap of DEGs associated with cell division, cell cycle control changes, and the cell wall.
Horticulturae 09 01009 g007
Figure 8. Heatmap of transcription factor expression associated with fruit weight.
Horticulturae 09 01009 g008
Figure 9. Validation and expression analysis of selected genes using qRT-PCR. The x-axis is the fruit samples under different developmental stages; the left y-axis is the expression level (2−ΔΔCt) of the relative gene fluorescence quantitative qRT-PCR; the right y-axis indicates the FPKM value obtained after RNA-seq sequencing.
Horticulturae 09 01009 g009
Disclaimer/Publisher’s Note: The statements, opinions and data contained in all publications are solely those of the individual author(s) and contributor(s) and not of MDPI and/or the editor(s). MDPI and/or the editor(s) disclaim responsibility for any injury to people or property resulting from any ideas, methods, instructions or products referred to in the content.

