Article

Mapping of the Susceptibility of Colombian Musaceae Lands to a Deadly Disease: Fusarium oxysporum f. sp. cubense Tropical Race 4

by
Gustavo Rodríguez-Yzquierdo
1,*,
Barlin O. Olivares
2,*,
Oscar Silva-Escobar
3,
Antonio González-Ulloa
4,
Mauricio Soto-Suarez
1 and
Mónica Betancourt-Vásquez
1
1
Corporación Colombiana de Investigación Agropecuaria, AGROSAVIA, CI Tibaitatá, Sede Central, Km 14 vía Mosquera-Bogotá, Mosquera 250047, Colombia
2
Biodiversity Management Research Group (GESBIO-UCO), Rabanales Campus, University of Córdoba (UCO), Carretera Nacional IV, km 396, 14014 Córdoba, Spain
3
Facultad de Agronomía, Universidad Central de Venezuela, Prolongación Avenida 19 de Abril, Maracay 02105, Venezuela
4
Grupo Agrovid SAS, Avenida Libertador, Santa Marta 470001, Colombia
*
Authors to whom correspondence should be addressed.
Horticulturae 2023, 9(7), 757; https://doi.org/10.3390/horticulturae9070757
Submission received: 5 June 2023 / Revised: 23 June 2023 / Accepted: 28 June 2023 / Published: 30 June 2023
(This article belongs to the Section Fruit Production Systems)

Abstract

:
Fusarium oxysporum f. sp. cubense Tropical Race 4 (Foc TR4) (Syn. Fusarium odoratissimum) is a devastating soil-borne pathogen that infects the roots of banana plants and causes Fusarium wilt disease. Colombia is one of the world’s leading banana producers; therefore, new uncontrolled outbreaks could have serious consequences. Despite this, little is known about the susceptibility of Musaceae lands in Colombia to Foc TR4. This work presents a pioneering study on the susceptibility of Colombian soils to Foc TR4. For this, a study was carried out to characterize climatic, edaphic, and density factors of Musaceae productive systems at the Colombian level, articulated with expert criteria to map and define areas with different levels of susceptibility to Foc R4T. These criteria are typically selected based on the existing scientific literature, consultation with domain experts, and consideration of established methods for assessing soil health and disease susceptibility in Musaceae plantations. By joining the analyzed susceptibility factors, differentiated areas were generated that imply a greater or lesser predisposition to the disease. Subsequently, a validation of the classification was made with Random Forest. The results indicate that at the level of climate, soil, and farm density as a fit factor, practically 50% of the cultivated territory of Musaceae are areas high and very highly susceptible to the pathogen (572,000 km2). The results showed that from the total Musaceae area, Antioquia, Bolívar, Chocó, and Santander turned out to be the departments with the highest proportion of very high susceptibility class of the production farms. The analysis of Random Forest classification performance shows that the model has a relatively low out-of-bag (OOB) error rate (0.023). The study on the susceptibility is highly novel and original, as it represents the first systematic investigation of Foc TR4 susceptibility in Colombian soils. This paper provides important insights into the susceptibility of Musaceae lands in Colombia to Foc TR4. The study highlights the need for ongoing monitoring, containment, and control measures to prevent the spread of this deadly pathogen and protect Colombia’s important banana industry.

1. Introduction

The Musaceae family is one of the most important and economically valuable plant families in the world [1]. Colombia is one of the top ten banana producers globally, and the industry is critical to the country’s economy [2,3]. According to Agronet [4], Musaceae production (bananas and plantains) in Colombia recorded a harvested area of approximately 530,117 hectares. The production is 1,994,723 tons, and the yield is 37.4 tons/ha for export bananas. The department’s main producing regions for Musaceae are Antioquia, Magdalena, and La Guajira for export bananas; Nariño, Valle del Cauca, Chocó, and Cundinamarca for traditional bananas; and Antioquia, Arauca, Valle del Cauca, Córdoba, Meta, Quindío, and Caldas for plantains. Furthermore, the country’s Musaceae production is characterized by the cultivation of various varieties, including in the case of bananas the popular Cavendish and Gros Michel banana types.
However, the Colombian banana industry is facing a severe threat from Fusarium oxysporum f. sp. cubense Tropical Race 4 (Foc TR4) (syn. Fusarium odoratissimum) [5], a soil-borne fungus that causes Fusarium wilt in banana plants [6,7]. Currently, the state of the disease in Colombia is present, with restricted distribution and official control by the Colombian Agricultural Institute (ICA). There are 17 farms in quarantine, of which 11 are in La Guajira and 6 in Magdalena. The area under quarantine corresponds to 0.5% of the total area of Musaceae in the country [8]. The first confirmation of the pathogen occurred in 2019 in the department of La Guajira [6], and in 2021 the presence was confirmed in the department of Magdalena [9]. Foc TR4 is considered one of the most destructive banana plant pathogens globally and has caused significant economic losses in countries such as China, Indonesia, and the Philippines [10,11]. Therefore, it is crucial to understand the susceptibility of Colombian Musaceae lands to this deadly disease.
Climate, soil, and agronomic management practices play a crucial role in the susceptibility of Colombian Musaceae lands to Foc TR4. The environmental conditions in which the banana plants are grown can affect their susceptibility to the disease [12,13]. For instance, temperature and humidity levels can impact the fungus’s growth and spread [14,15], while soil characteristics such as pH, texture, and organic matter content can affect the plant’s ability to uptake nutrients and resist infection [16,17]. Agronomic management practices, such as the use of irrigation systems, fertilizers, and pesticides, can also influence disease incidence and severity [18,19,20]. For example, improper use of pesticides can lead to the development of pesticide-resistant strains of Foc TR4, while excessive fertilization can promote the growth of susceptible banana plants [7,21,22]. Therefore, understanding the influence of climate, soil, and agronomic management practices on Foc TR4 susceptibility is critical to developing effective disease management strategies for the Colombian banana industry.
Despite the significant economic and social importance of the Colombian banana industry, there is still limited scientific knowledge regarding the susceptibility of Musaceae lands in Colombia to Foc TR4. While some studies have been conducted on the disease in other countries [23,24,25], the specific environmental and cultural conditions in Colombia and Latin America require further investigation [11]. Therefore, there is a critical information gap that needs to be addressed to develop effective prevention and management strategies. The need for novel findings in this area is crucial, as the spread of Foc TR4 could have severe implications for the Colombian economy and global food security with emphasis on Latin American farmers who are economically dependent on banana production [26,27,28].
This scientific paper addresses the research hypothesis: Musaceae lands with certain environmental characteristics will exhibit greater susceptibility to Foc TR4. Therefore, it is expected to map and determine the percentage of lands with different degrees of susceptibility. To answer this question, this paper explores the susceptibility of Foc TR4 in Colombia and the impact of environmental factors such as soil type and climate on the predisposition of Musaceae lands, as a base study to avoid and control the spread of Foc TR4.
The solution alternatives to address the problem of Foc TR4 in Colombian Musaceae lands and the world include improving biosecurity measures [13,29,30], developing resistant banana cultivars [31,32], and implementing sustainable farming practices [14,17,22,33]. These strategies can reduce the spread and severity of Foc TR4 and help prevent economic losses and impacts on food security [34]. This study aims to investigate the susceptibility of Colombian Musaceae lands to Foc TR4 based on expert knowledge which refers to the specialized and in-depth understanding possessed by people who have extensive experience, knowledge, and qualifications in a specific field or topic and identify agri-environmental factors that influence the potential predisposition of Musaceae lands sensitive to developing the disease.
The findings of this scientific paper have significant implications for the Colombian banana industry and global food security. Understanding the susceptibility of Colombian Musaceae lands to Foc TR4 can inform the development of effective strategies for disease management and prevention according to the biophysical characteristics of those farms. Additionally, this study can contribute to the global knowledge base on the epidemiology and control of the spread of Foc TR4, which can help other countries facing similar challenges in the banana industry.

2. Materials and Methods
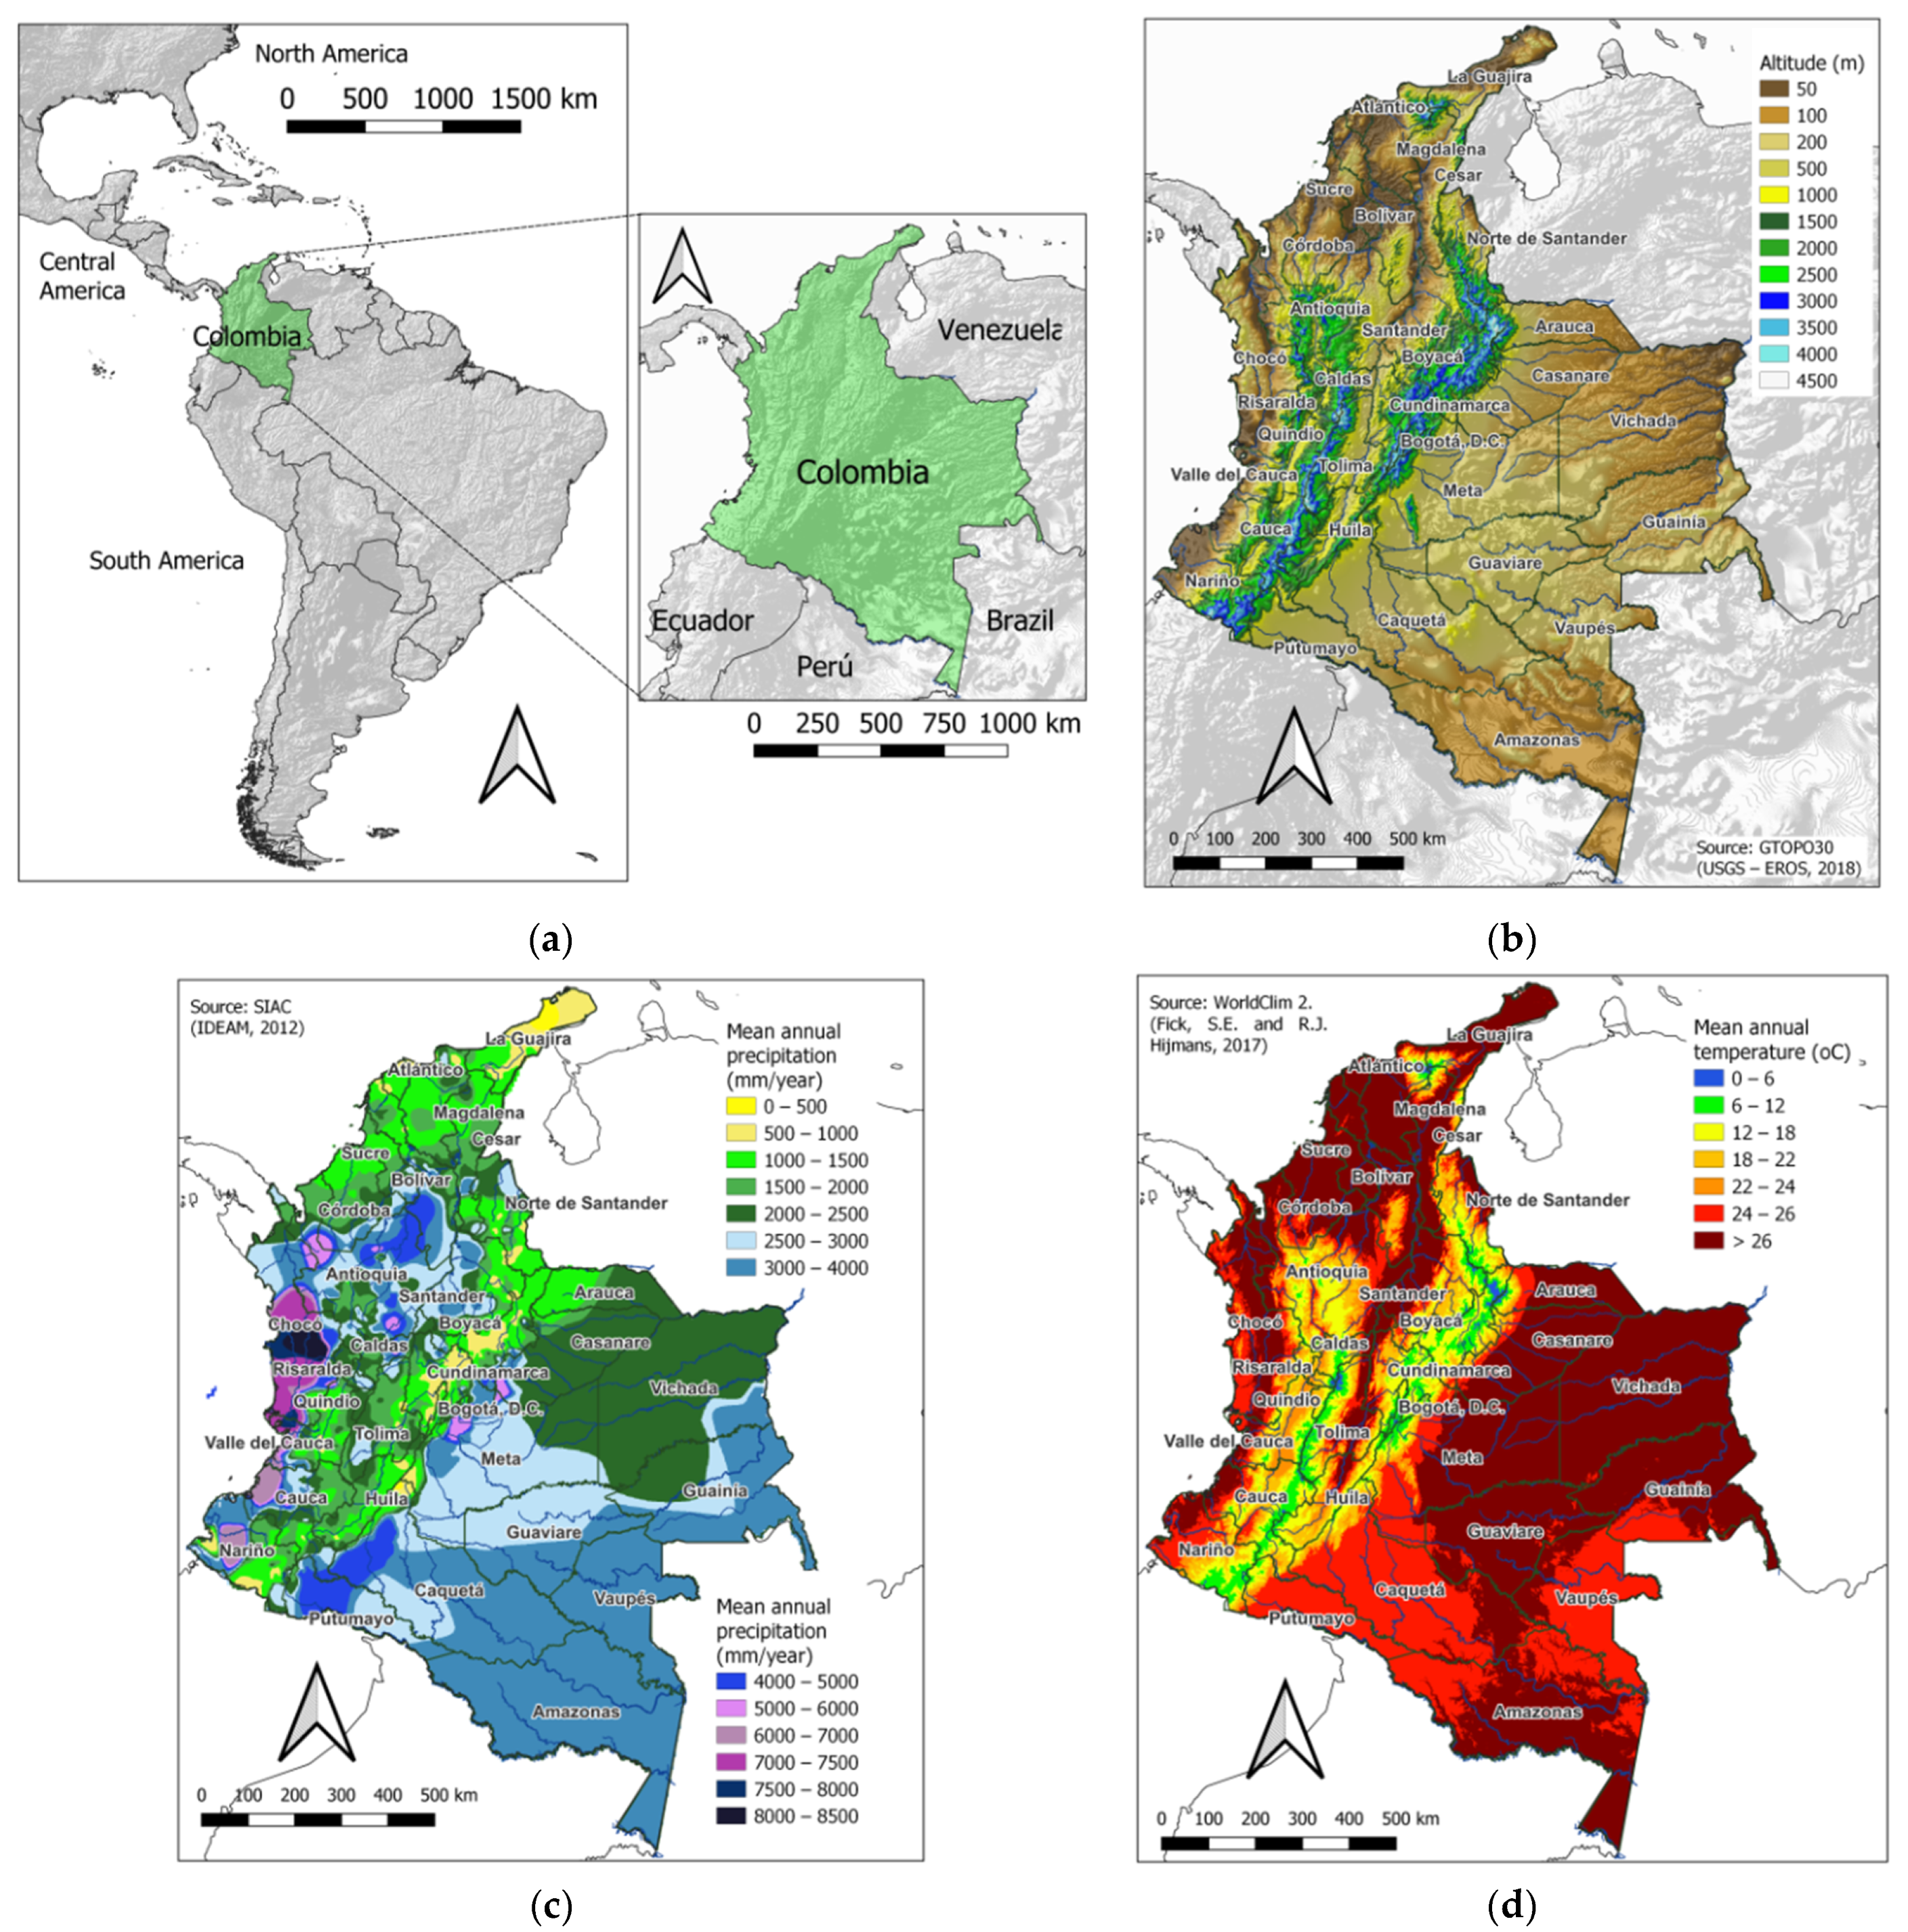
2.1. Study Area

The study was carried out over the continental territory of Colombia (1,141,748 km2), located in the northwestern part of South America, bordered by the Caribbean Sea to the north, Panama to the northwest, Venezuela to the east, Brazil to the southeast, Peru, and Ecuador to the south, and the Pacific Ocean to the west (Figure 1a). The height above sea level in Colombia varies dramatically, contributing to the country’s climatic diversity. From the coastal plains, which lie at sea level, to the towering peaks of the Andes, Colombia’s altitude ranges from 0 to over 4500 m (Figure 1b) [35]. This diversity results in microclimates that support an array of ecosystems, from the hot and humid rainforests at lower altitudes to the chilly paramo ecosystems at higher elevations. The vast range in altitude, combined with Colombia’s geographical location near the equator, offers an extraordinary variety of climates and landscapes within its borders.
The mean annual precipitation in Colombia showcases a remarkable contrast across its regions (Figure 1c). The western part, along the Pacific coast, experiences high levels of precipitation, often exceeding a 3000 mm annual average [36]. The Andean region receives moderate rainfall, creating a perfect environment for coffee plantations and fertile agricultural lands. On the other hand, the eastern plains, known as the Orinoco region, have a drier climate with rainfall averaging around 500–1000 mm annually, fostering unique savannas and grasslands.
Regarding mean annual temperatures, Colombia’s elevation plays a significant role. As one ascends in altitude, temperatures decrease. In the lowland regions, such as the Caribbean coast, Average mean annual temperatures range from a tropical 25 to 30 °C throughout the year [37]. The Andean highlands, characterized by cities like Bogota and Medellin, exhibit a more temperate climate with average temperatures ranging from 14 to 19 °C (Figure 1d). The higher mountain ranges, including the Sierra Nevada de Santa Marta and the Sierra Nevada del Cocuy, experience cooler conditions, with temperatures falling below freezing points in some areas.
The spatial distribution of edaphic elements in Colombia reveals a mosaic of soil characteristics across the country. The pH distribution map (Figure 2a) showcases a wide range of acidity levels throughout Colombia. Acidic soils dominate in some regions, particularly in the western areas along the Pacific coast and parts of the Amazon rainforest. Meanwhile, more neutral to alkaline soils can be found in the central and eastern parts of the country [38].
The soil organic carbon distribution map (Figure 2b) highlights varying levels of organic matter content in Colombian soils [38]. Higher percentages of soil organic carbon are typically found in areas with dense vegetation cover, such as the Amazon rainforest and the Andean regions. In contrast, lower organic carbon content is observed in drier regions such as the northern coast and eastern plains. The soil drainage map (Figure 2c) indicates diverse soil drainage classes across Colombia [38]. Well-drained soils are predominant in the highlands and areas with steep slopes, while poorly drained soils are more common in lowland regions, wetlands, and floodplains.
The soil clay content distribution map (Figure 2d) illustrates variations in clay content throughout the country [38]. Soils with higher clay percentages are found in the Andean regions and some parts of the Caribbean coast, contributing to their fertility and water retention capabilities. Areas with lower clay content are observed in the drier regions of the northern coast and eastern plains. The soil silt content distribution map (Figure 2e) reveals the prevalence of silt in many regions of Colombia [38]. Silt-rich soils can be found in the river valleys, floodplains, and deltas, particularly along major rivers such as the Magdalena and Cauca. These areas often exhibit fertile soils suitable for agriculture. The slope distribution map (Figure 2f) reflects the diverse topography of Colombia, with a range of slope percentages observed across the country [35]. Steep slopes are predominant in the mountainous regions, particularly in the Andes, while flatter terrains are present in the coastal plains and some lowland areas.

2.2. Data, Criteria, and Standardization

The geographic data, the format, and the resolution, as well as the sources that were used to create the criteria for the susceptibility of Musaceae lands to Foc TR4, are shown in Table 1. The raster maps of (a) mean annual precipitation published by the Institute of Hydrology, Meteorology and Environmental Studies (IDEAM) [36], available on the portal of the Environmental Information System of Colombia (SIAC), and (b) mean annual air temperature of 30 s of the resolution were used, available on WorldClim [37]. The latter was preferred, instead of the one published by IDEAM, given the similarity between the two and because the one provided by WorldClim is in raster format without reclassification (each pixel represents a value), while the IDEAM is in vector format with values of temperature grouped by classes.
Land susceptibility maps were obtained using direct approach methods based on expert knowledge of the target area. The direct approach is based on expert knowledge about the relationship between the occurrence of a phenomenon and its hypothesized predisposing factors. This approach requires the definition of expert rules that lead to different degrees of susceptibility [40].
The methodology for preparing a document on the susceptibility of land to plant pathogens based on expert knowledge generally involves a multidisciplinary approach [41,42,43,44]. A team of experts, including agronomists, plant pathologists, environmental scientists, and soil scientists, analyzed available data on the agricultural area in question, including climate, soil characteristics, and Musaceae cultivation history. The team then identified and evaluated the potential impacts of these factors on the growth and spread of this plant pathogen in the study area. Based on their analysis, the team identified areas of increased susceptibility to Foc TR4.
The mean precipitation and temperature values were classified according to the following table produced according to expert criteria (Table 2). To evaluate the characteristics of the soil, given the exploratory nature of the study, the map of the FAO harmonized world soil database was used (FAO–HWSD) [38]. The selected characteristics corresponded to those relevant to the Foc TR4 and which, at the same time, were included in the database. A prior soil map processing was required to replace the name of each soil delineation with the proper soil feature contained in an external database. Therefore, one raster map per soil feature was obtained. The values of soil characteristics were classified according to expert criteria (Table 3).

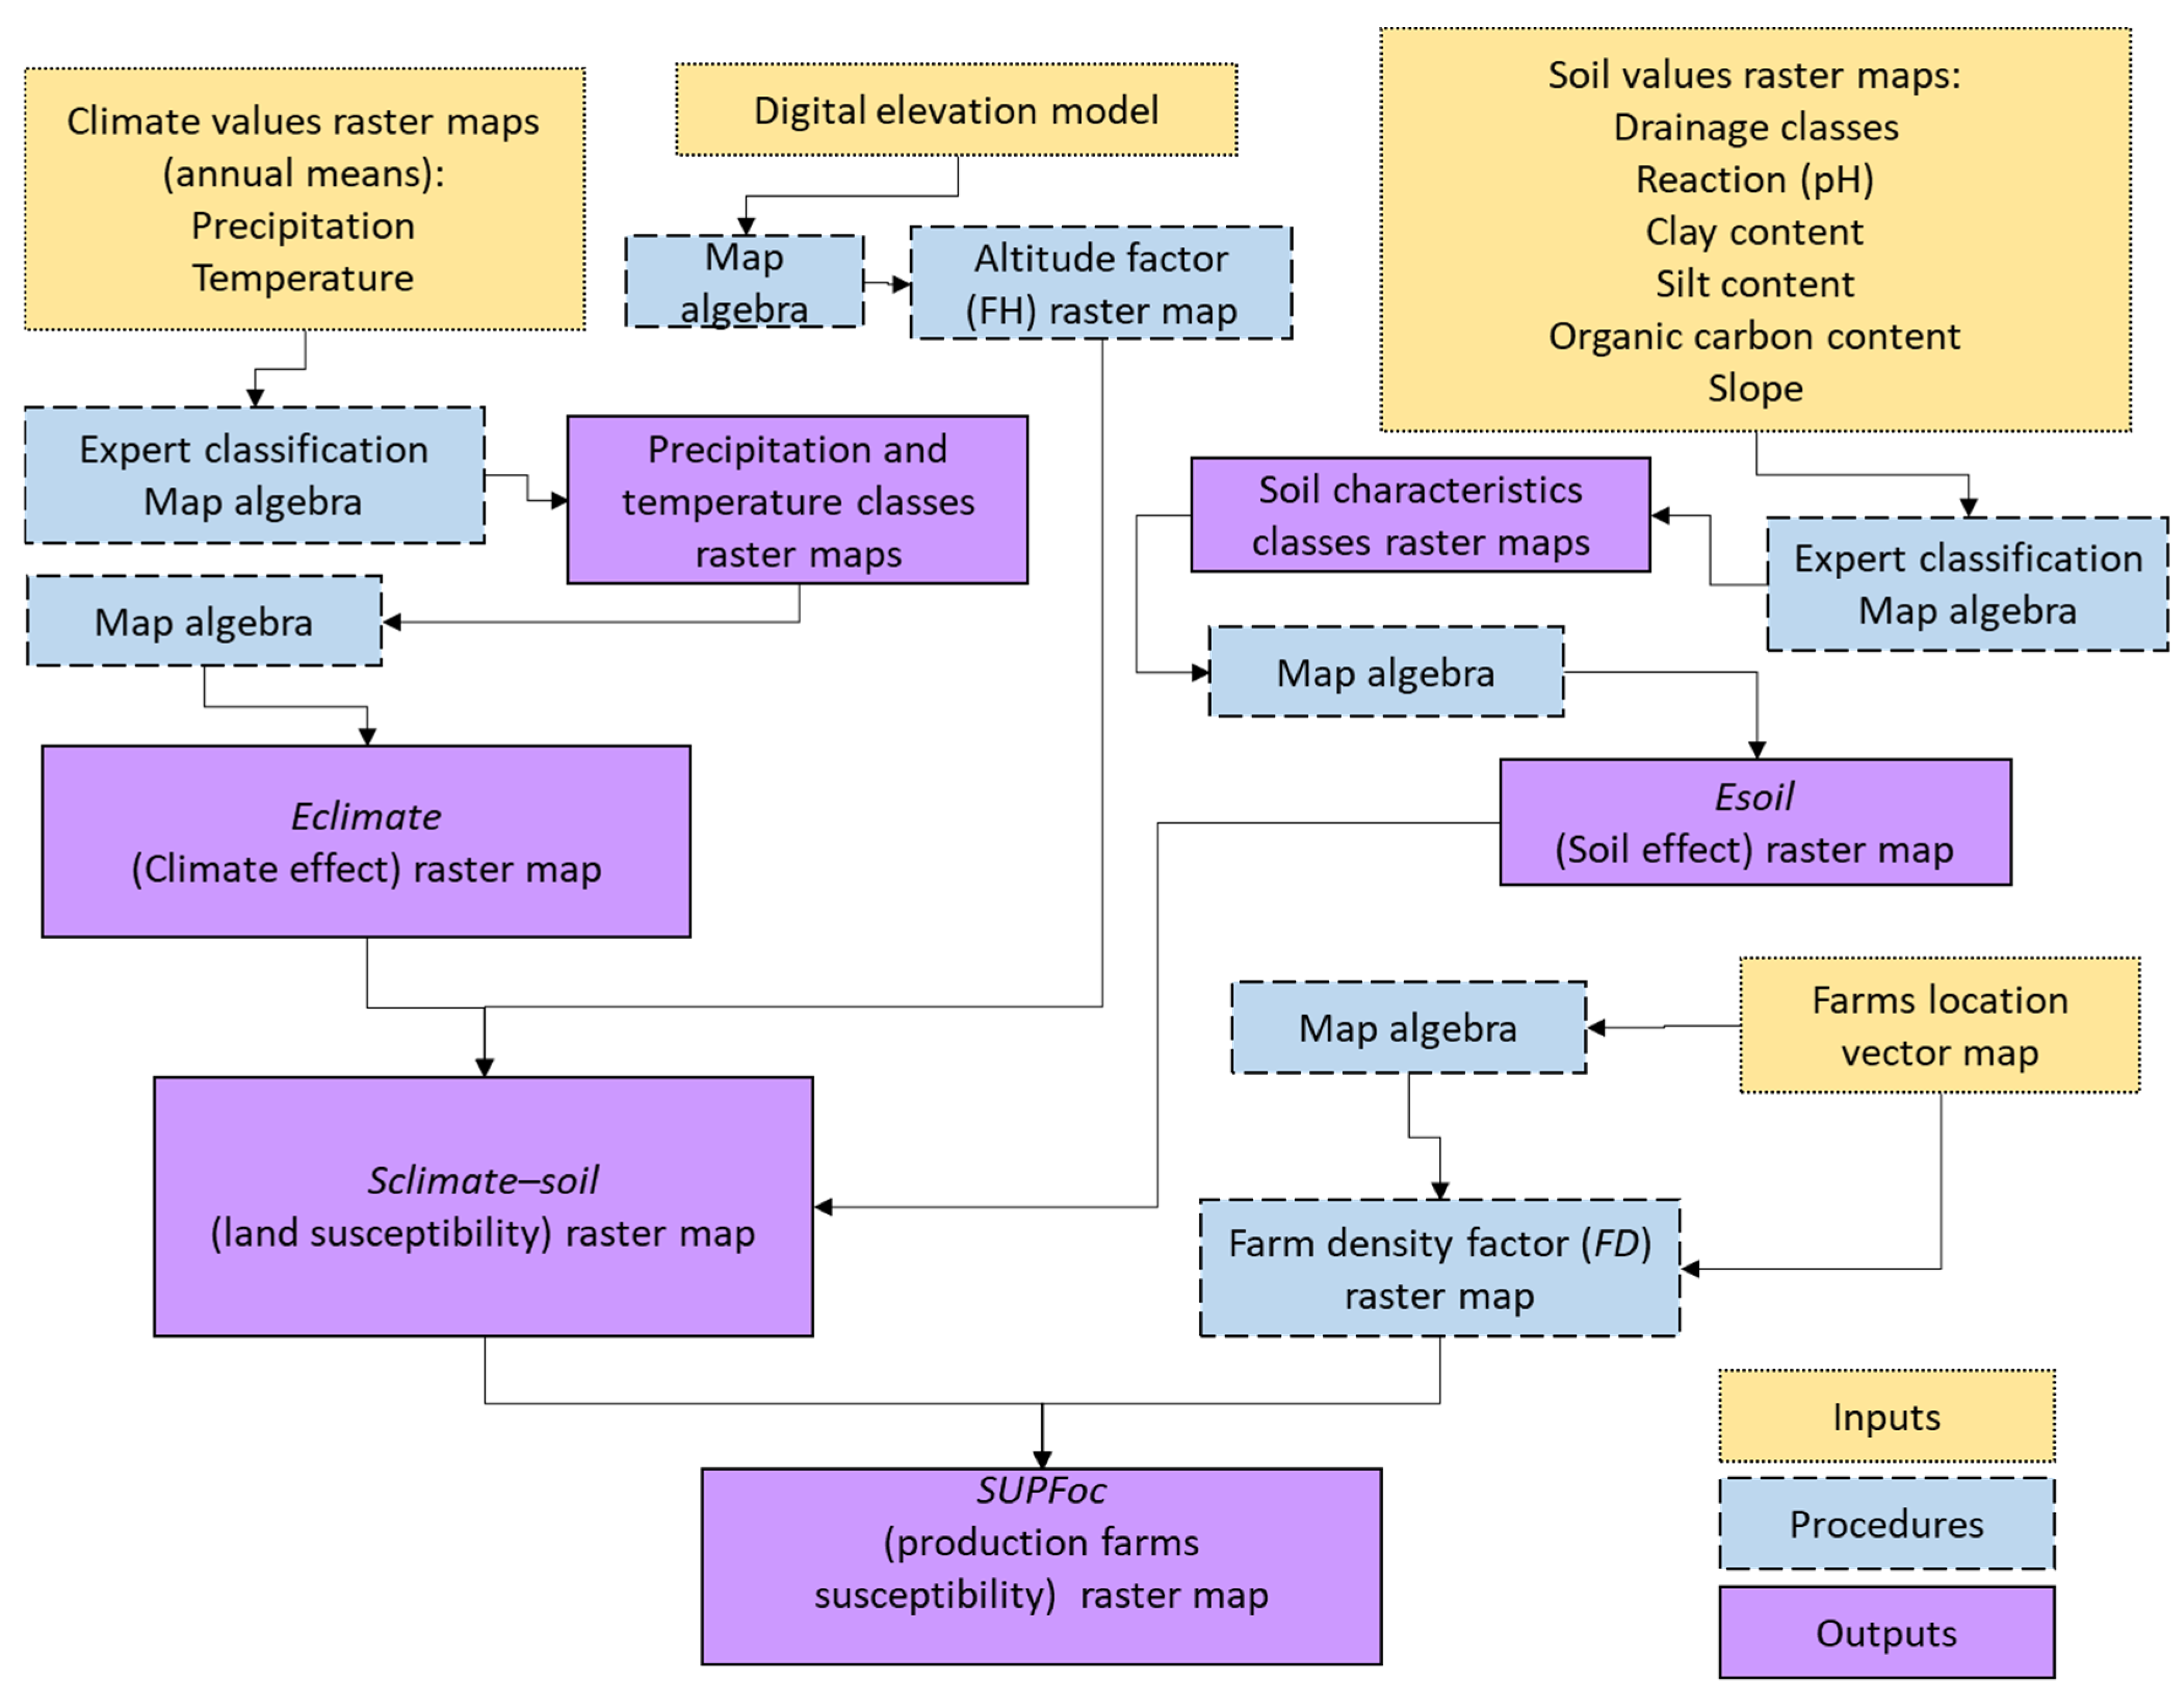
2.3. Determination of the Susceptibility Index of the Farm’s Production to the Foc TR4 (SUPFoc)

In this study, the susceptibility of the land will be evaluated, understood as the degree to which environmental conditions (climate, soil, and altitude) potentially predispose areas for infection with Foc TR4 together with the susceptibility of the production farms, understood as the degree in that both the environmental conditions together with the location (spatial density) of the banana and plantain production farms condition the possibility of infection. The methodological scheme for the determination of the susceptibility index of the farm’s production to the Foc TR4 (SUPFoc) is shown in Figure 3.
An index that qualifies the susceptibility of production farms (SUPFoc) (Equation (1)) was developed and applied. This index is based on the weighting of climatic elements and soil characteristics according to expert criteria (Sclimate-soil), adjusted by altitude functions (FH) and the density of Musaceae production farms (FD) [43,45,46]. The calculation of the index was carried out for the continental territory of Colombia using the algebra of raster layers of 30 s of the resolution, corresponding to the classification of (a) climate elements (annual mean precipitation and temperature), (b) soil characteristics (pH, drainage class, clay, silt, organic carbon, and slope of the land), and (c) adjustment factors for altitude and density of production farms.
S U P F o c = S c l i m a t e s o i l   H   F D  
where SUPFoc is the susceptibility index of the farm’s production to the Foc TR4, Sclimate–soil is the subindex that qualifies the susceptibility of lands according to climatic elements and soil characteristics (Equation (2)), fit factor according to altitude (FH), and density of Musaceae production farms (FD)
S c l i m a t e s o i l = 0.6 E c l i m a t e + 0.4 E s o i l
The Sclimate–soil subindex is made up of the weighed sum of the valuation of the indicator of the effect of climatic elements (Eclimate) which is expressed as a weighting of the annual mean precipitation and temperature (P y T, respectively) according to the importance of each of them (Equation (3)) and the assessment of the indicator of the effect of soil characteristics (Esoil) (Equation (4)).
E c l i m a t e = V P I P + V T I T i = 1 2 I c i
where VP is the valuation corresponding to the annual mean precipitation, VT is the valuation corresponding to the annual mean temperature, and Ic is the expert-assigned importance of each climatic element i. ESoil is expressed as a weighting of the evaluations corresponding to the reaction of the soil (VpH), drain class (VDr), clay content (Vclay), silt content (VSilt), organic carbon (VOC), and land slope (VPen), according to the expert-assigned importance of each (Isi, the subscript (i) refers to each characteristic of the soil according to the case).
E s o i l = V p H I p H + V D r I D r + V C l a y   I C l a y + V S i l t   I S i l t + V O C   I O C + V P e n   I P e n i = 1 6 I s i

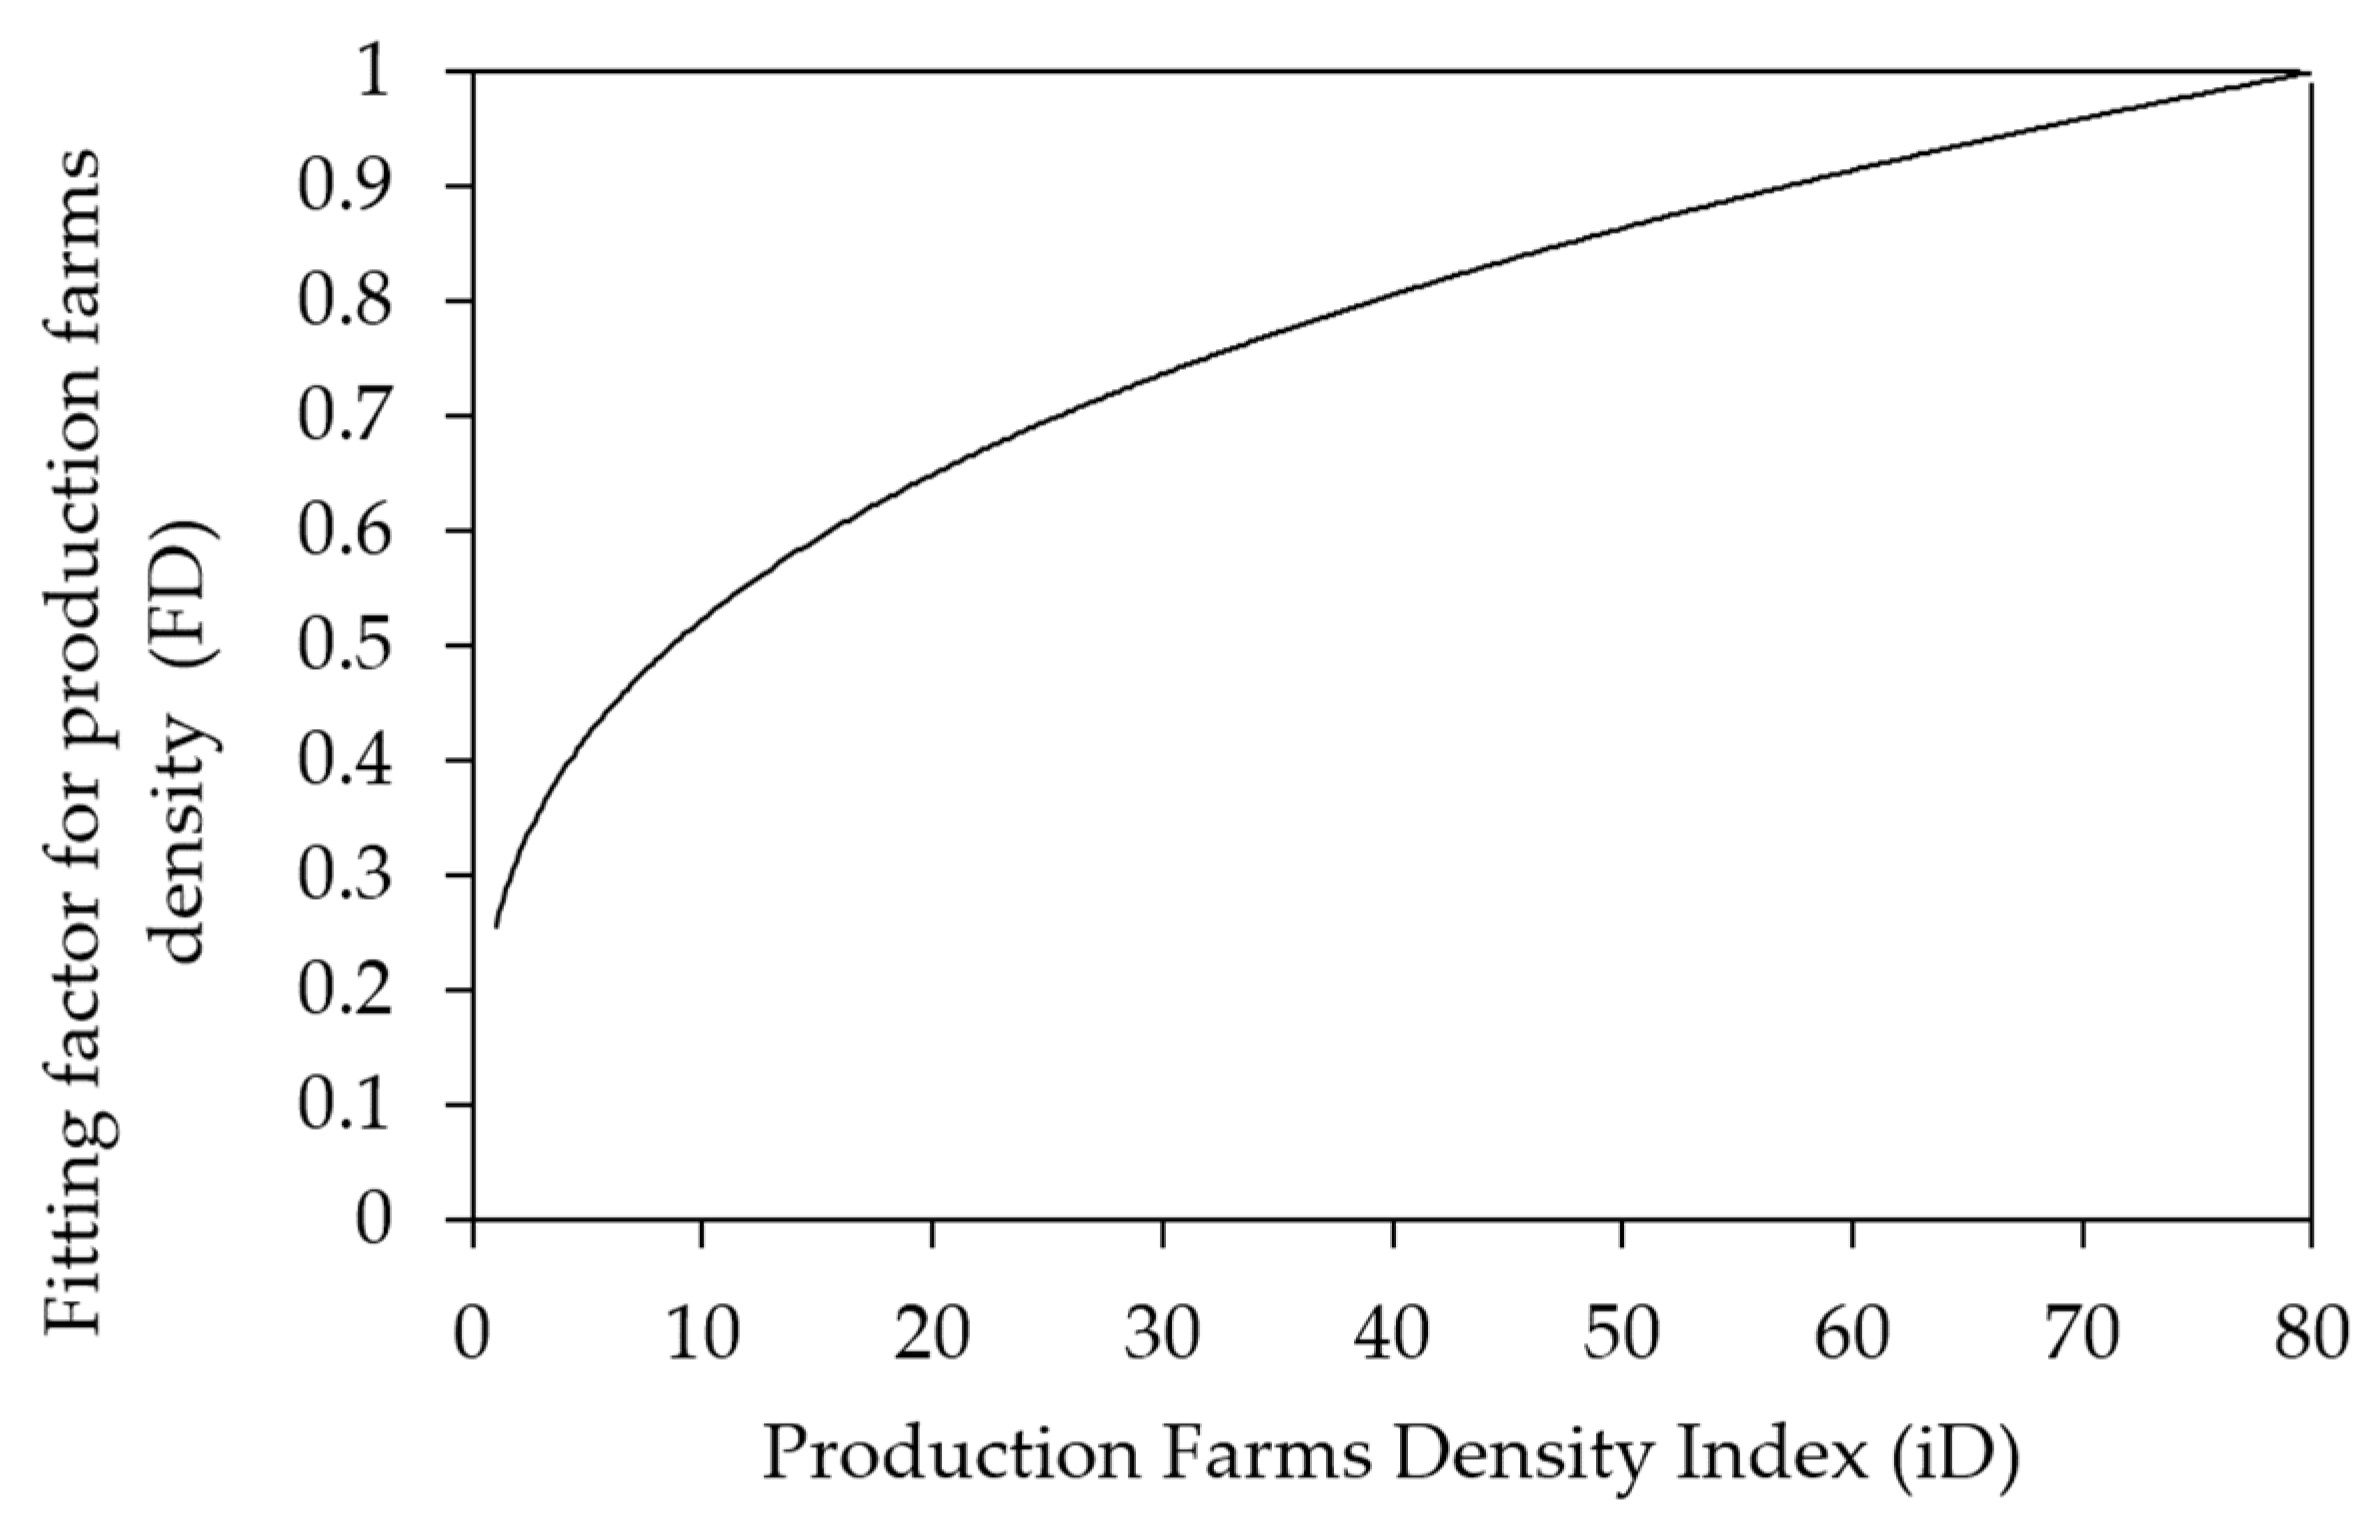
2.4. The Fit Factor According to Altitude (FH) and Density of Musaceae Production Farms (FD)

The fit factor FH was obtained as a function of altitude (h). Above 2000 m, this function gradually reduces the value of FH and, consequently, the previous result of the product of Equation (5). In this way, from 2000 m, the altitude adjustment factor decreases asymptotically as the altitude approaches infinity.
E c l i m a t e s o i l F H
If h < 2000 m, FH = 1, the value of the product of Equation (5) is not affected.
If h ≥ 2000 m, FH will be determined by Equation (6).
F H = 54.55   e 0.002 h
The altitude value of each pixel was obtained from a 30 s resolution digital elevation model GTOPO30 [35]. Figure 4 shows the curve defined by the fit function according to altitude. Consequently, as each pixel’s altitude is higher, the susceptibility of the lands to Foc TR4 decreases. The use of this negative exponential function allows the rate of change near 2000 m altitude to decrease rapidly but allows the rate of change to slow down as the altitude increases. To do this, we started from the principle that, up to 2000 m, altitude is still relevant in terms of predisposition in favor of the Foc TR4, but once this threshold is exceeded, with altitude the predisposition is rapidly reduced due to (a) reasons for access and the varieties of crops used in the very few and scattered production farms and (b) precipitation loses importance and temperature is privileged as an influential factor.
Regarding the fit factor FD, it was obtained from a farm density index (iD) calculated from the sampling points reported throughout the country. In this case, a database of 1441 points was obtained, corresponding to production farms not infected by the fungus in all departments, except the departments of Magdalena and La Guajira. For these last two departments, a database of 1010 points was available, of which only a proportion was used according to the density of non-infected points in the surroundings. This was necessary to homogenize the sampling intensity in both databases.
Once all the points over the territory of continental Colombia were obtained, a density raster map was generated considering a radius of 3° geographic from each point. The system, for each point, determines the density of the points included within that radius. Then, there is an interpolation between the density values obtained through the various circles. The result is distributed, continuously, with higher values in the areas with a higher concentration of points or farms and lower values in the areas with a lower concentration.
The expression to fit the indicator for climate elements and soil characteristics through the density factor of production farms (Equation (7)) was the following:
If iD > 80, FD = 1, with which the Eclimate–soil index is not affected
If iD ≤ 80, then FD will be determined by Equation (7)
F D = 0.2554   i D 0.314  
FD is the density of Musaceae production farms. The value of iD = 80 was taken as the limit of the fit function given the peripheral character of this value about the general distribution of the points (Figure 5).
Figure 6 shows the curve that represents the function used. Consequently, to the extent that in each pixel the density of production farms is lower, the value of EClimate–soil is reduced. The use of a potential type of function allows the value of the adjustment factor, below a certain density index threshold (in this case, 80), to be asymptotically reduced to zero as the density index approaches zero.

2.5. SUPFoc Index Classification

Finally, the value obtained in each pixel of the susceptibility index of the production farms before Foc TR4 (SUPFoc) was reclassified according to the following scale (Table 4). This met the classification criteria between 1 and 4 of the climatic elements and soil characteristics. In this way, the classes between low and very high are associated with rounded values of the SUPFoc index. The class “very low or not considerable” was added given the reduction caused by the adjustment factors for altitude and density of the production farms.

2.6. Results Analysis

For modeling, maps of susceptibility of the land of Musaceae to Foc TR4 were elaborated; this refers to the process of creating maps that show the probability that a given area is susceptible to Foc TR4. This was achieved by using The Quantum GIS Geographic Information System software (version 3.22.12) [47] to analyze data on the various factors considered, such as soil properties and climate. By overlaying this data on a map, the areas that are most susceptible to Foc TR4 can be identified and prioritized for further investigation or targeted management strategies. This approach turns out to be a useful tool for farmers, researchers, and policymakers to prevent the spread of the disease and manage its impacts on banana and plantain production.

Classifier Performance and Accuracy Assessment

For this step, the selection of a representative sample of geographic points of Musaceae in Colombia for analysis of soil susceptibility to Fusarium wilt required several steps. The first step was to identify the geographic range of Musaceae in Colombia, including the different varieties grown in the region. Subsequently, the sampling frame was defined, which sought to include all geographic points within the geographic range of Musaceae in Colombia. The third step was to establish the sample size, which was large enough to provide a representative sample of the region, but not so large that it becomes unmanageable, being n = 1029 sampling points or observations. A stratified sampling approach was used to ensure that the sample represented the different soil types, climates, and topographic conditions within the region. Likewise, the random sampling method was used within each stratum to select the specific geographic points that will be included in the sample.
The data matrix X was constituted by the set of vectors of the observations X[ij], j = 1, ..., p, and where each vector X[ij] presented the jth variable for all the observations and where X the data matrix was formed by “n = 1029” observations with 10” variables. A total of 10 predictor variables were considered in this study, being the following: Altitude (Alt), Annual Mean Precipitation (P), Annual Mean Temperature (T), pH, Organic Carbon (OC), Drainage Class (DC), Clay, Silt, Land slope, and Farms Density Index (DI).
The climate, soil, and farms database underwent a rigorous data verification process to ensure that the data is reliable, consistent, and complete. Data normalization was then performed to allow comparison and analysis of the data. Normalization techniques, such as the geometric mean and a generalized logarithmic transformation using the “glog” function in R software version 4.0.2 (R Core Team, Vienna, Austria) [48], were performed to make the variables comparable due to differences in the units to measure them [49,50] and are applied to standardize the data. After normalization, an unsupervised analysis was carried out using principal component analysis (PCA) to extract patterns and relationships from the data using the prcomp package, and the calculation is based on singular value decomposition.
The next step consisted of applying the supervised analysis. The Partial Least Squares-Discriminant Analysis (PLS-DA) was applied to classify the data into different groups based on predefined categories [51,52], using the “plsr” function provided by the R pls package [53]. The classification and cross-validation are performed using the corresponding wrapper function offered by the caret package [54]. The variable importance in projection (VIP) > 1 and the corresponding |loading values| > 0.30, in the PCA and PLS-DA model, were used to identify the variables responsible for distinguishing. Furthermore, a permutation test with 100 permutations was employed to validate the performance of the PLS-DA model. For the quality criterion, we chose PLS-DA, R2Y (goodness of fit parameter), and Accuracy > 0.5.
Finally, Musaceae zones with different levels of Foc TR4 susceptibility are classified with the Random Forest algorithm (RF) using the Random Forest package [55], with a number of trees: 2000, number of predictors: 5, and Randomness: Fix current random seed. RF is a popular machine-learning algorithm that uses decision trees to classify data based on multiple input variables [55,56,57]. RF also provides other useful information such as OOB (out-of-bag) error, variable importance measure, and outlier measures. During tree construction, about one-third of the instances are left out of the bootstrap sample. This OOB data are then used as a test sample to obtain an unbiased estimate of the classification error (OOB error). This process would make it possible to validate that identifying areas with different levels of susceptibility through expert judgment is adequate and would help develop appropriate management strategies to address these differences.

3. Results

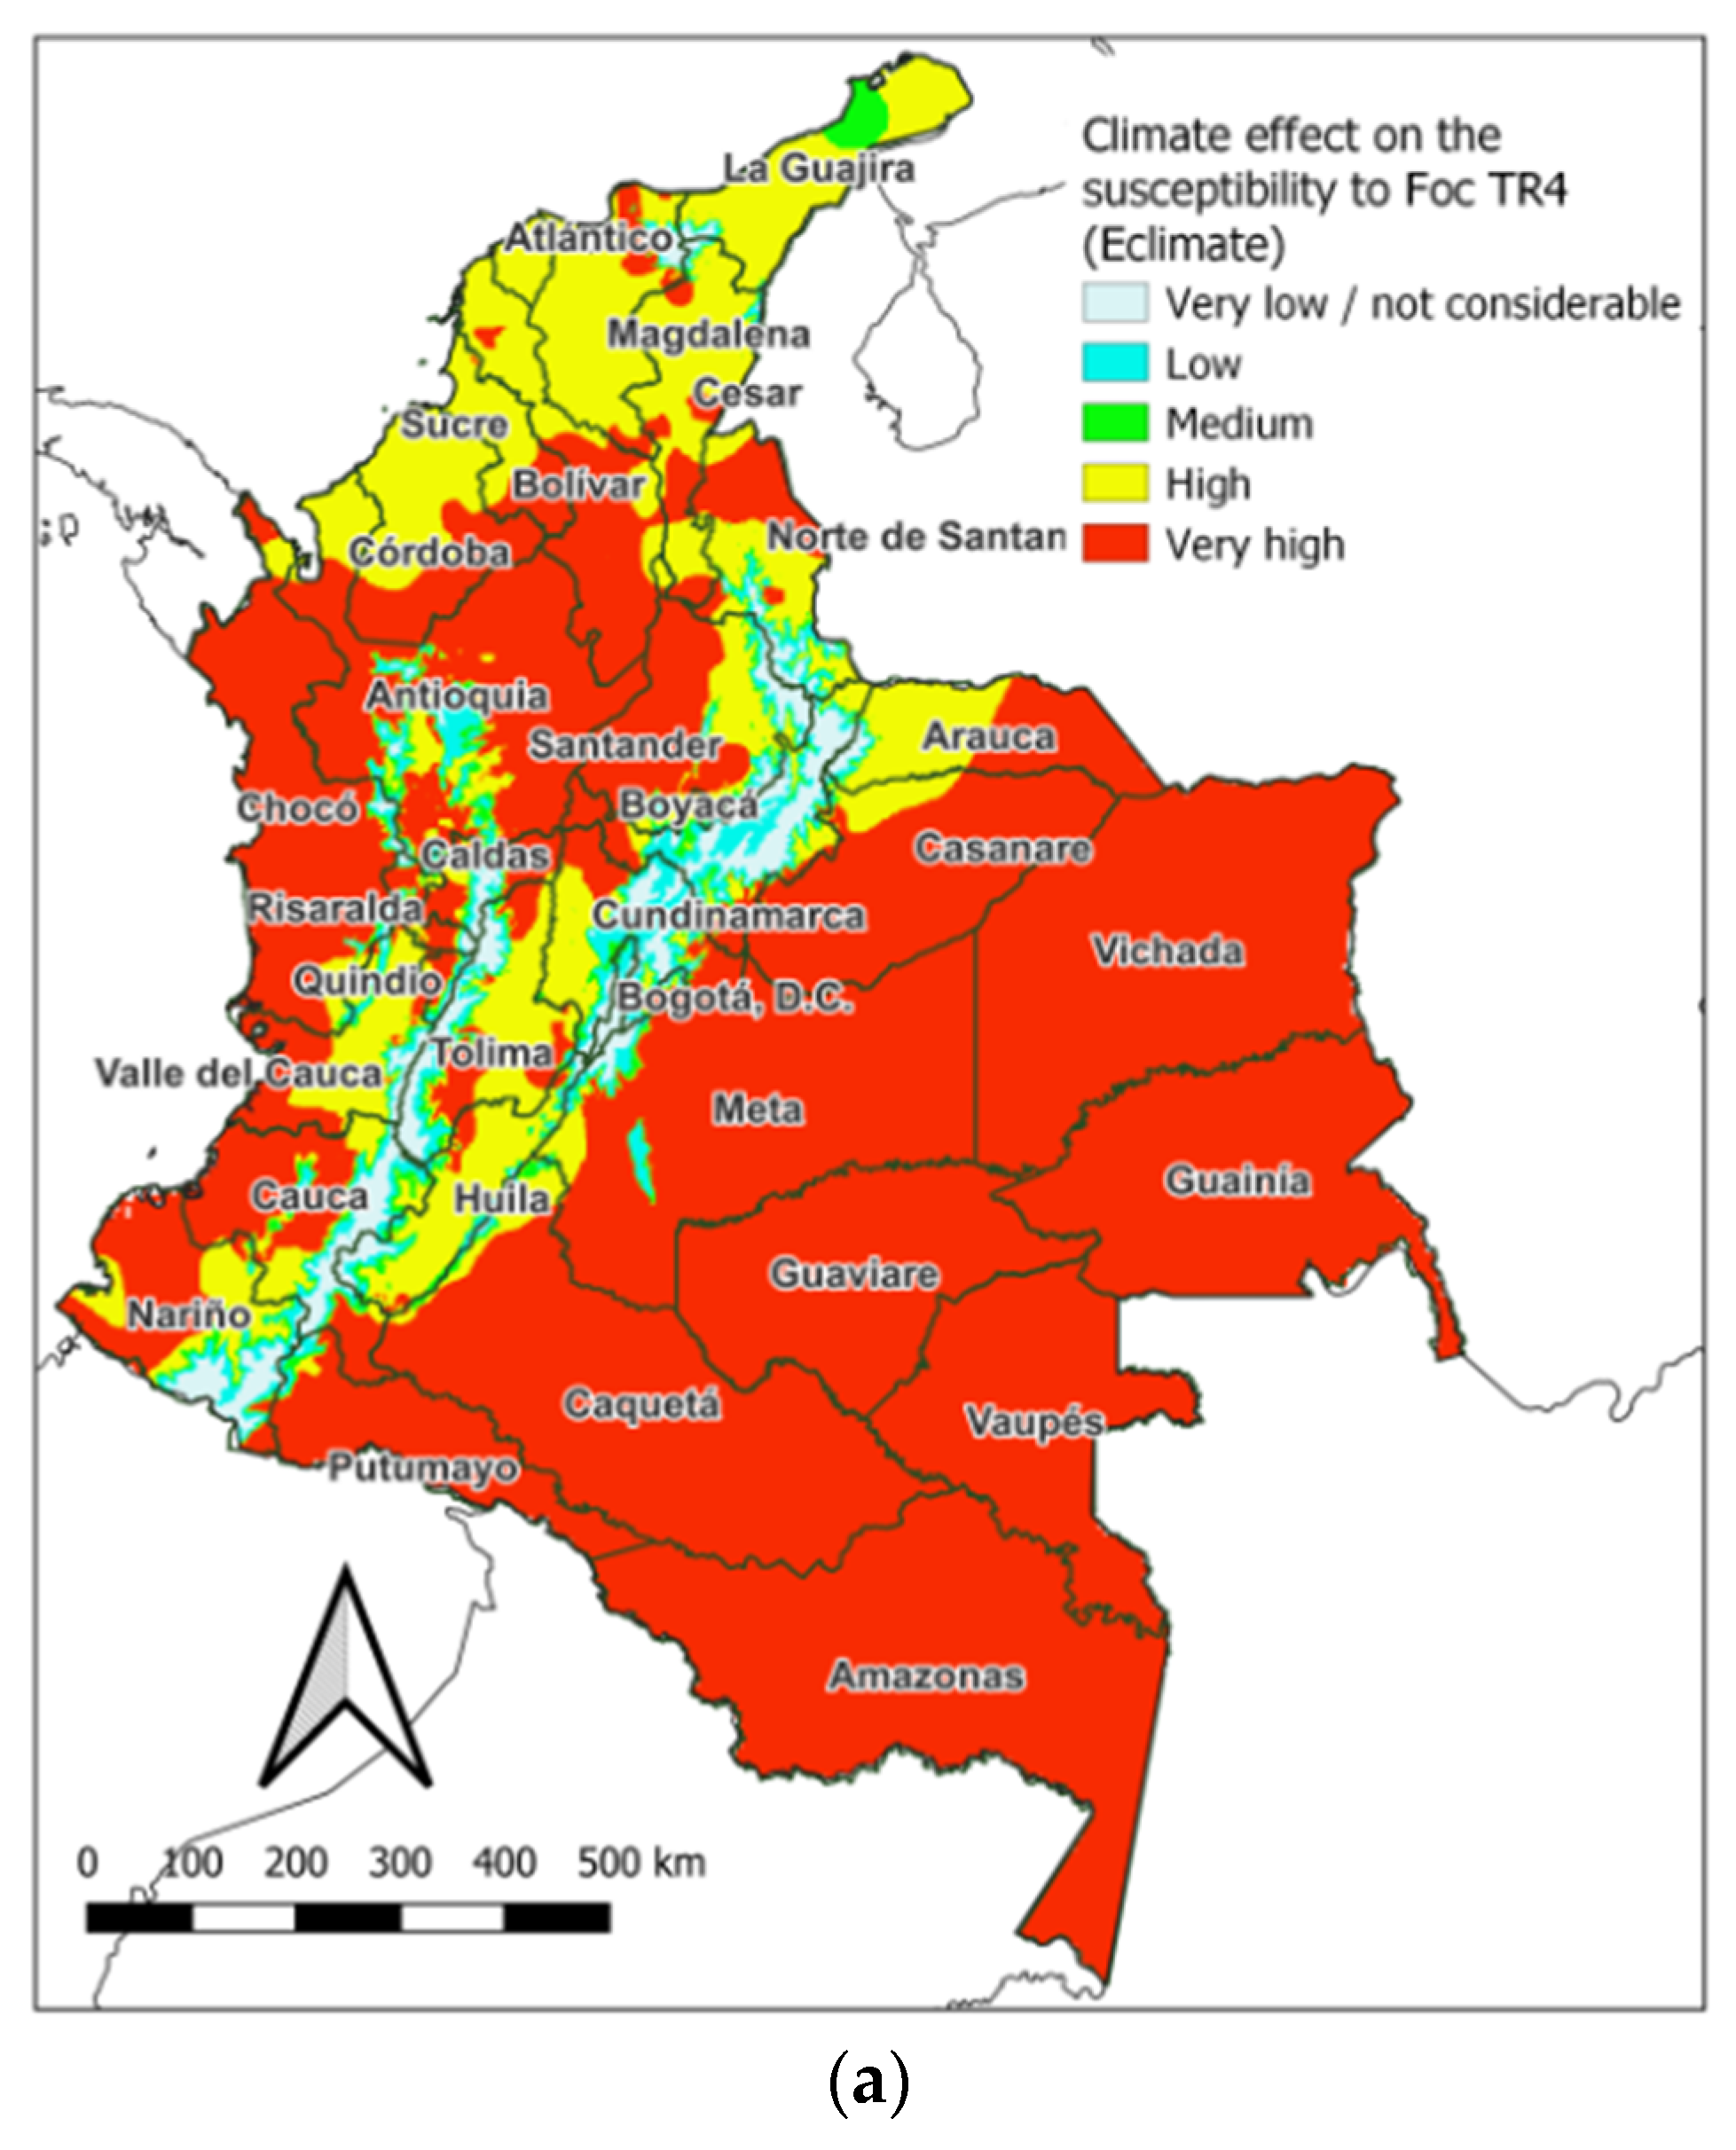
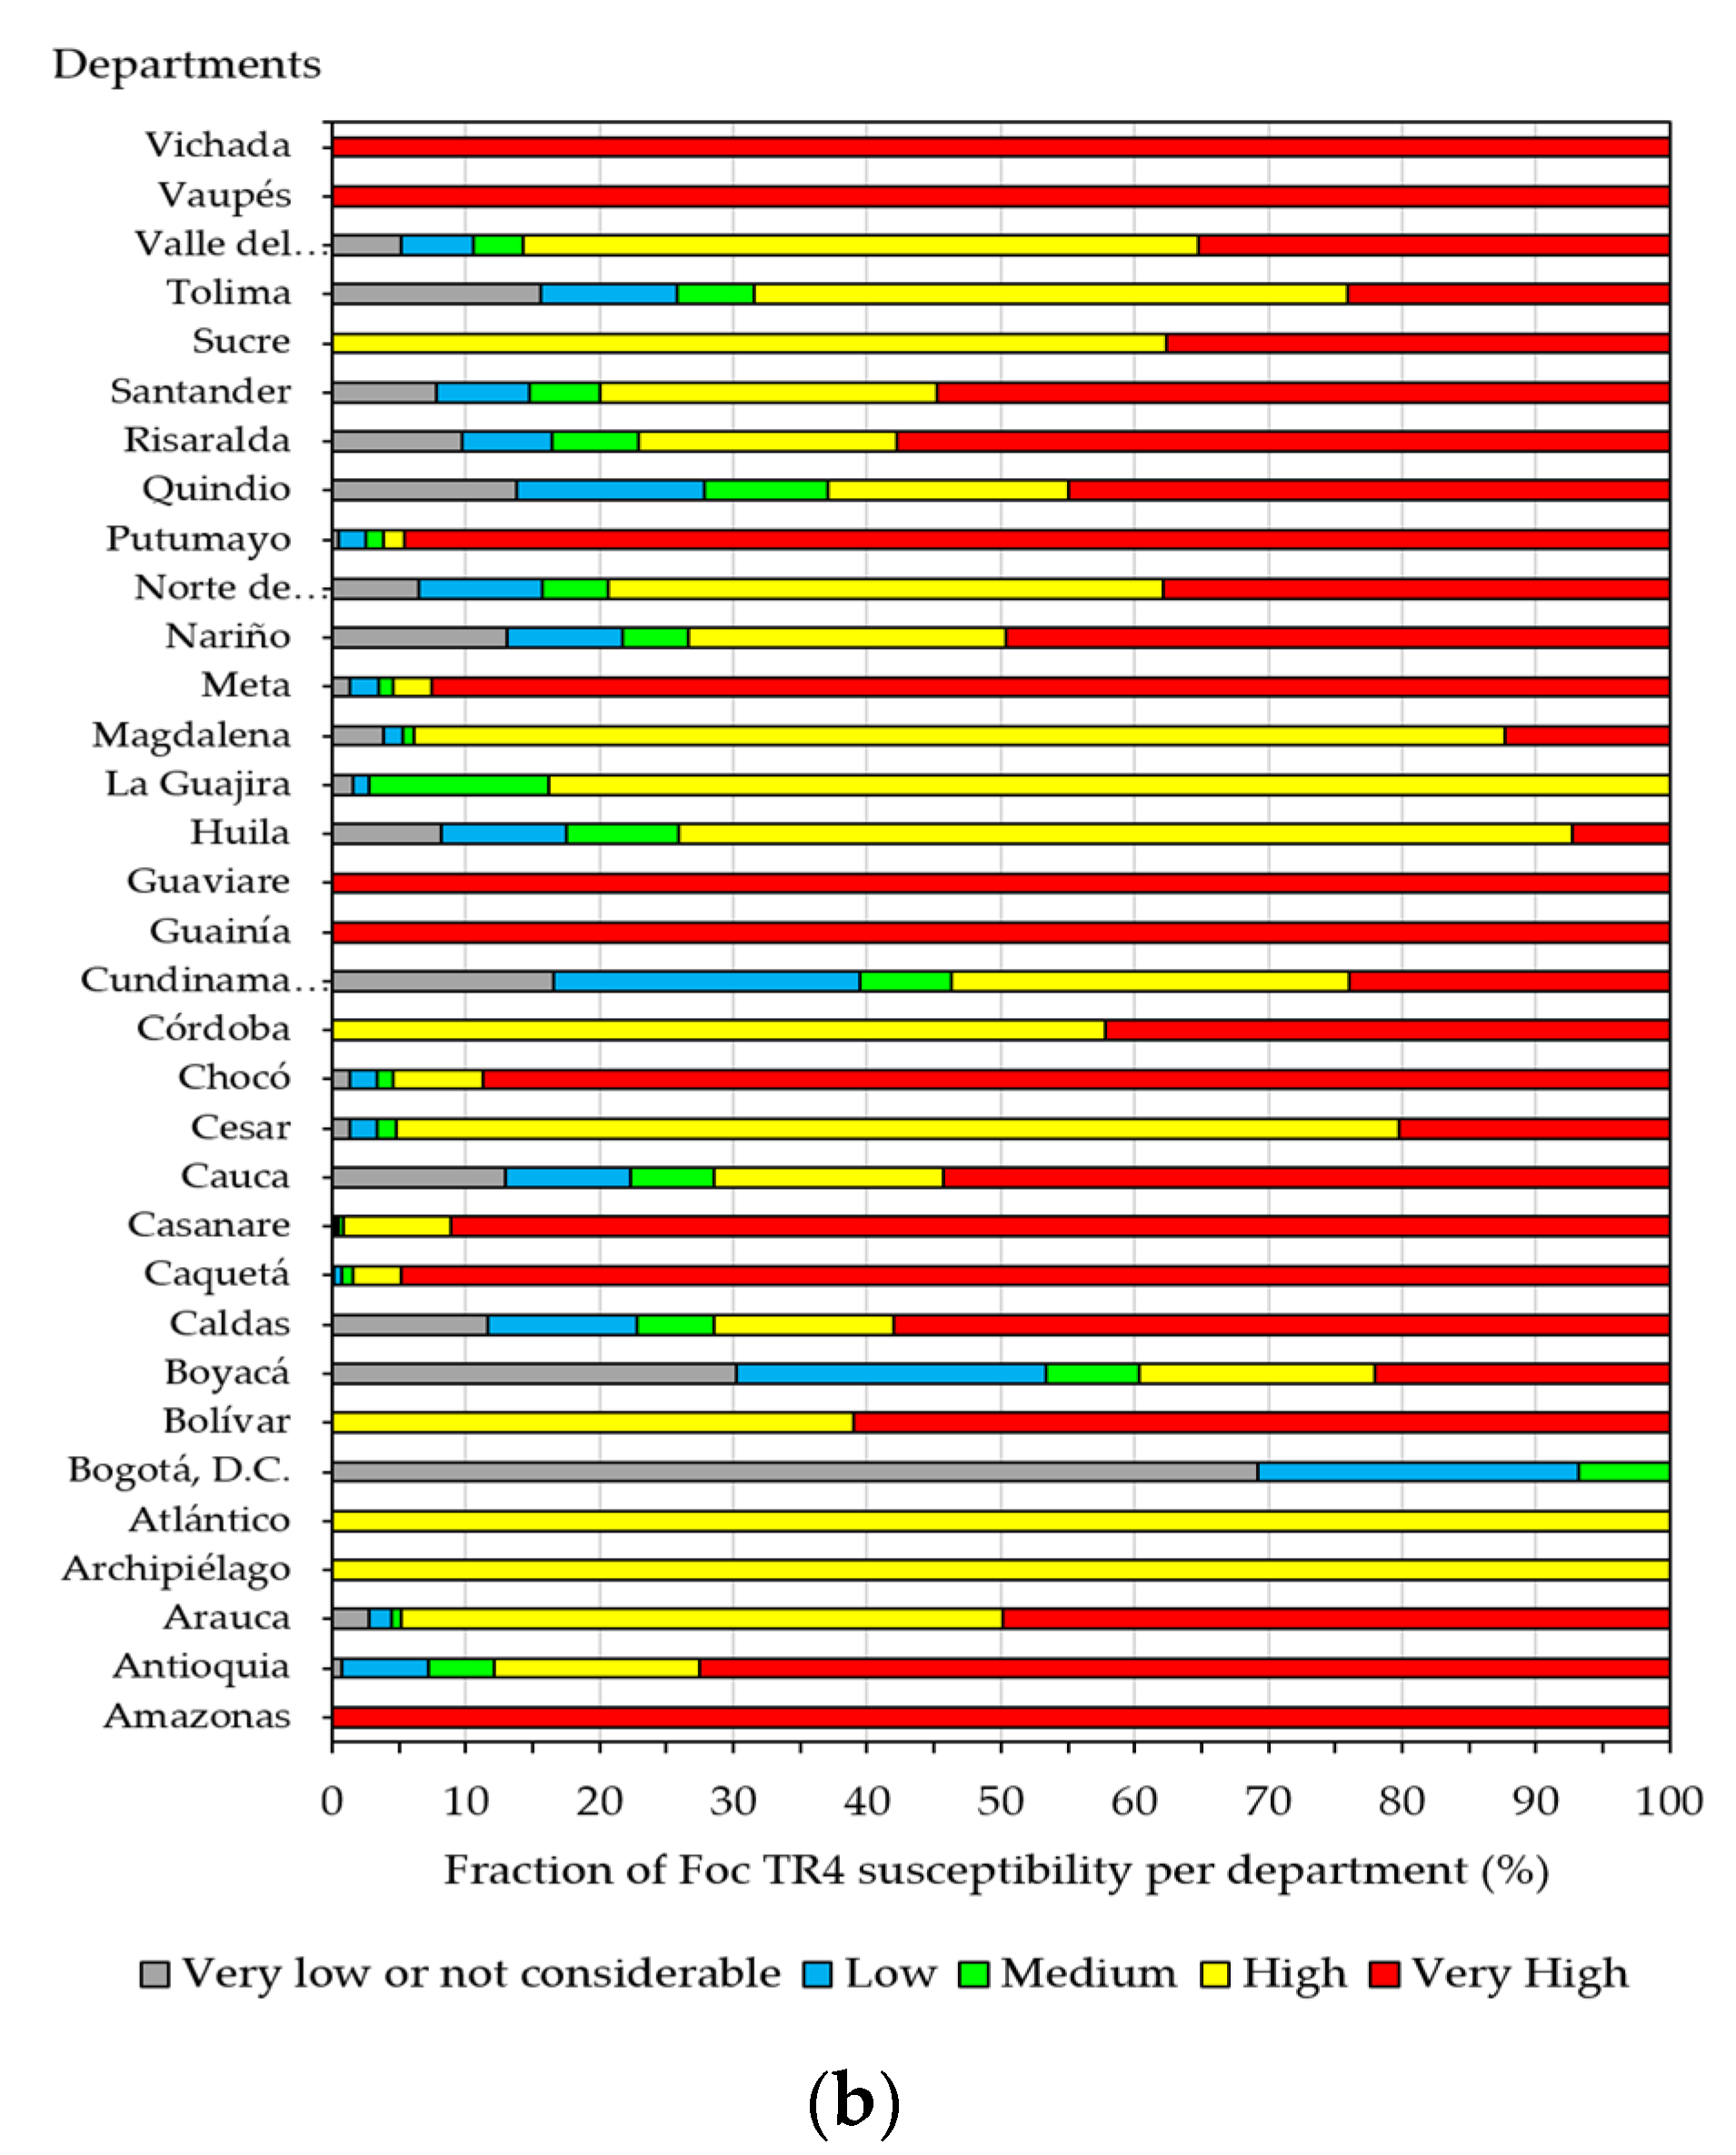
3.1. Effect of Climate (EClimate)

The climate turned out to be a very important predisposing factor for infection with Foc TR4 in almost the entire territory of Colombia (Figure 7a). It was estimated that 91.5% of the surface qualifies as highly and very highly susceptible due to the effect of precipitation and temperature. Only a smaller fraction (8.5%) resulted in average and lower ratings. It is worth noting that, if only the effect of precipitation and temperature is considered, in Colombia, the entire territory would correspond to medium to very high classes. The low and not considerable classes result from the effect of altitude as a factor that adds the particular conditions of climate, access, and relief and that dominates over the effect of precipitation. In this case, the lands that, due to the effect of the climate, are classified as low and less susceptible correspond to 6.4%.
The departments with the greatest susceptibility of the lands to infection with Foc TR4 for climatic reasons were Amazonas, Guainía, Guaviare, Vaupés, and Vichada, all of them with 100% of their surface with very high susceptibility. It is followed by the departments of Caquetá, Casanare, Putumayo, Meta, Chocó, Bolívar, and Antioquia, with more than 60% of their surfaces with very high susceptibility. The departments with the least susceptibility due to the effect of climate were Bogotá D.C, Boyacá, and Cundinamarca, with more than 40% of their surface with susceptibility between very low and medium. The rest of the departments presented high and very high susceptibility in at least 85% of their surface (Figure 7b).

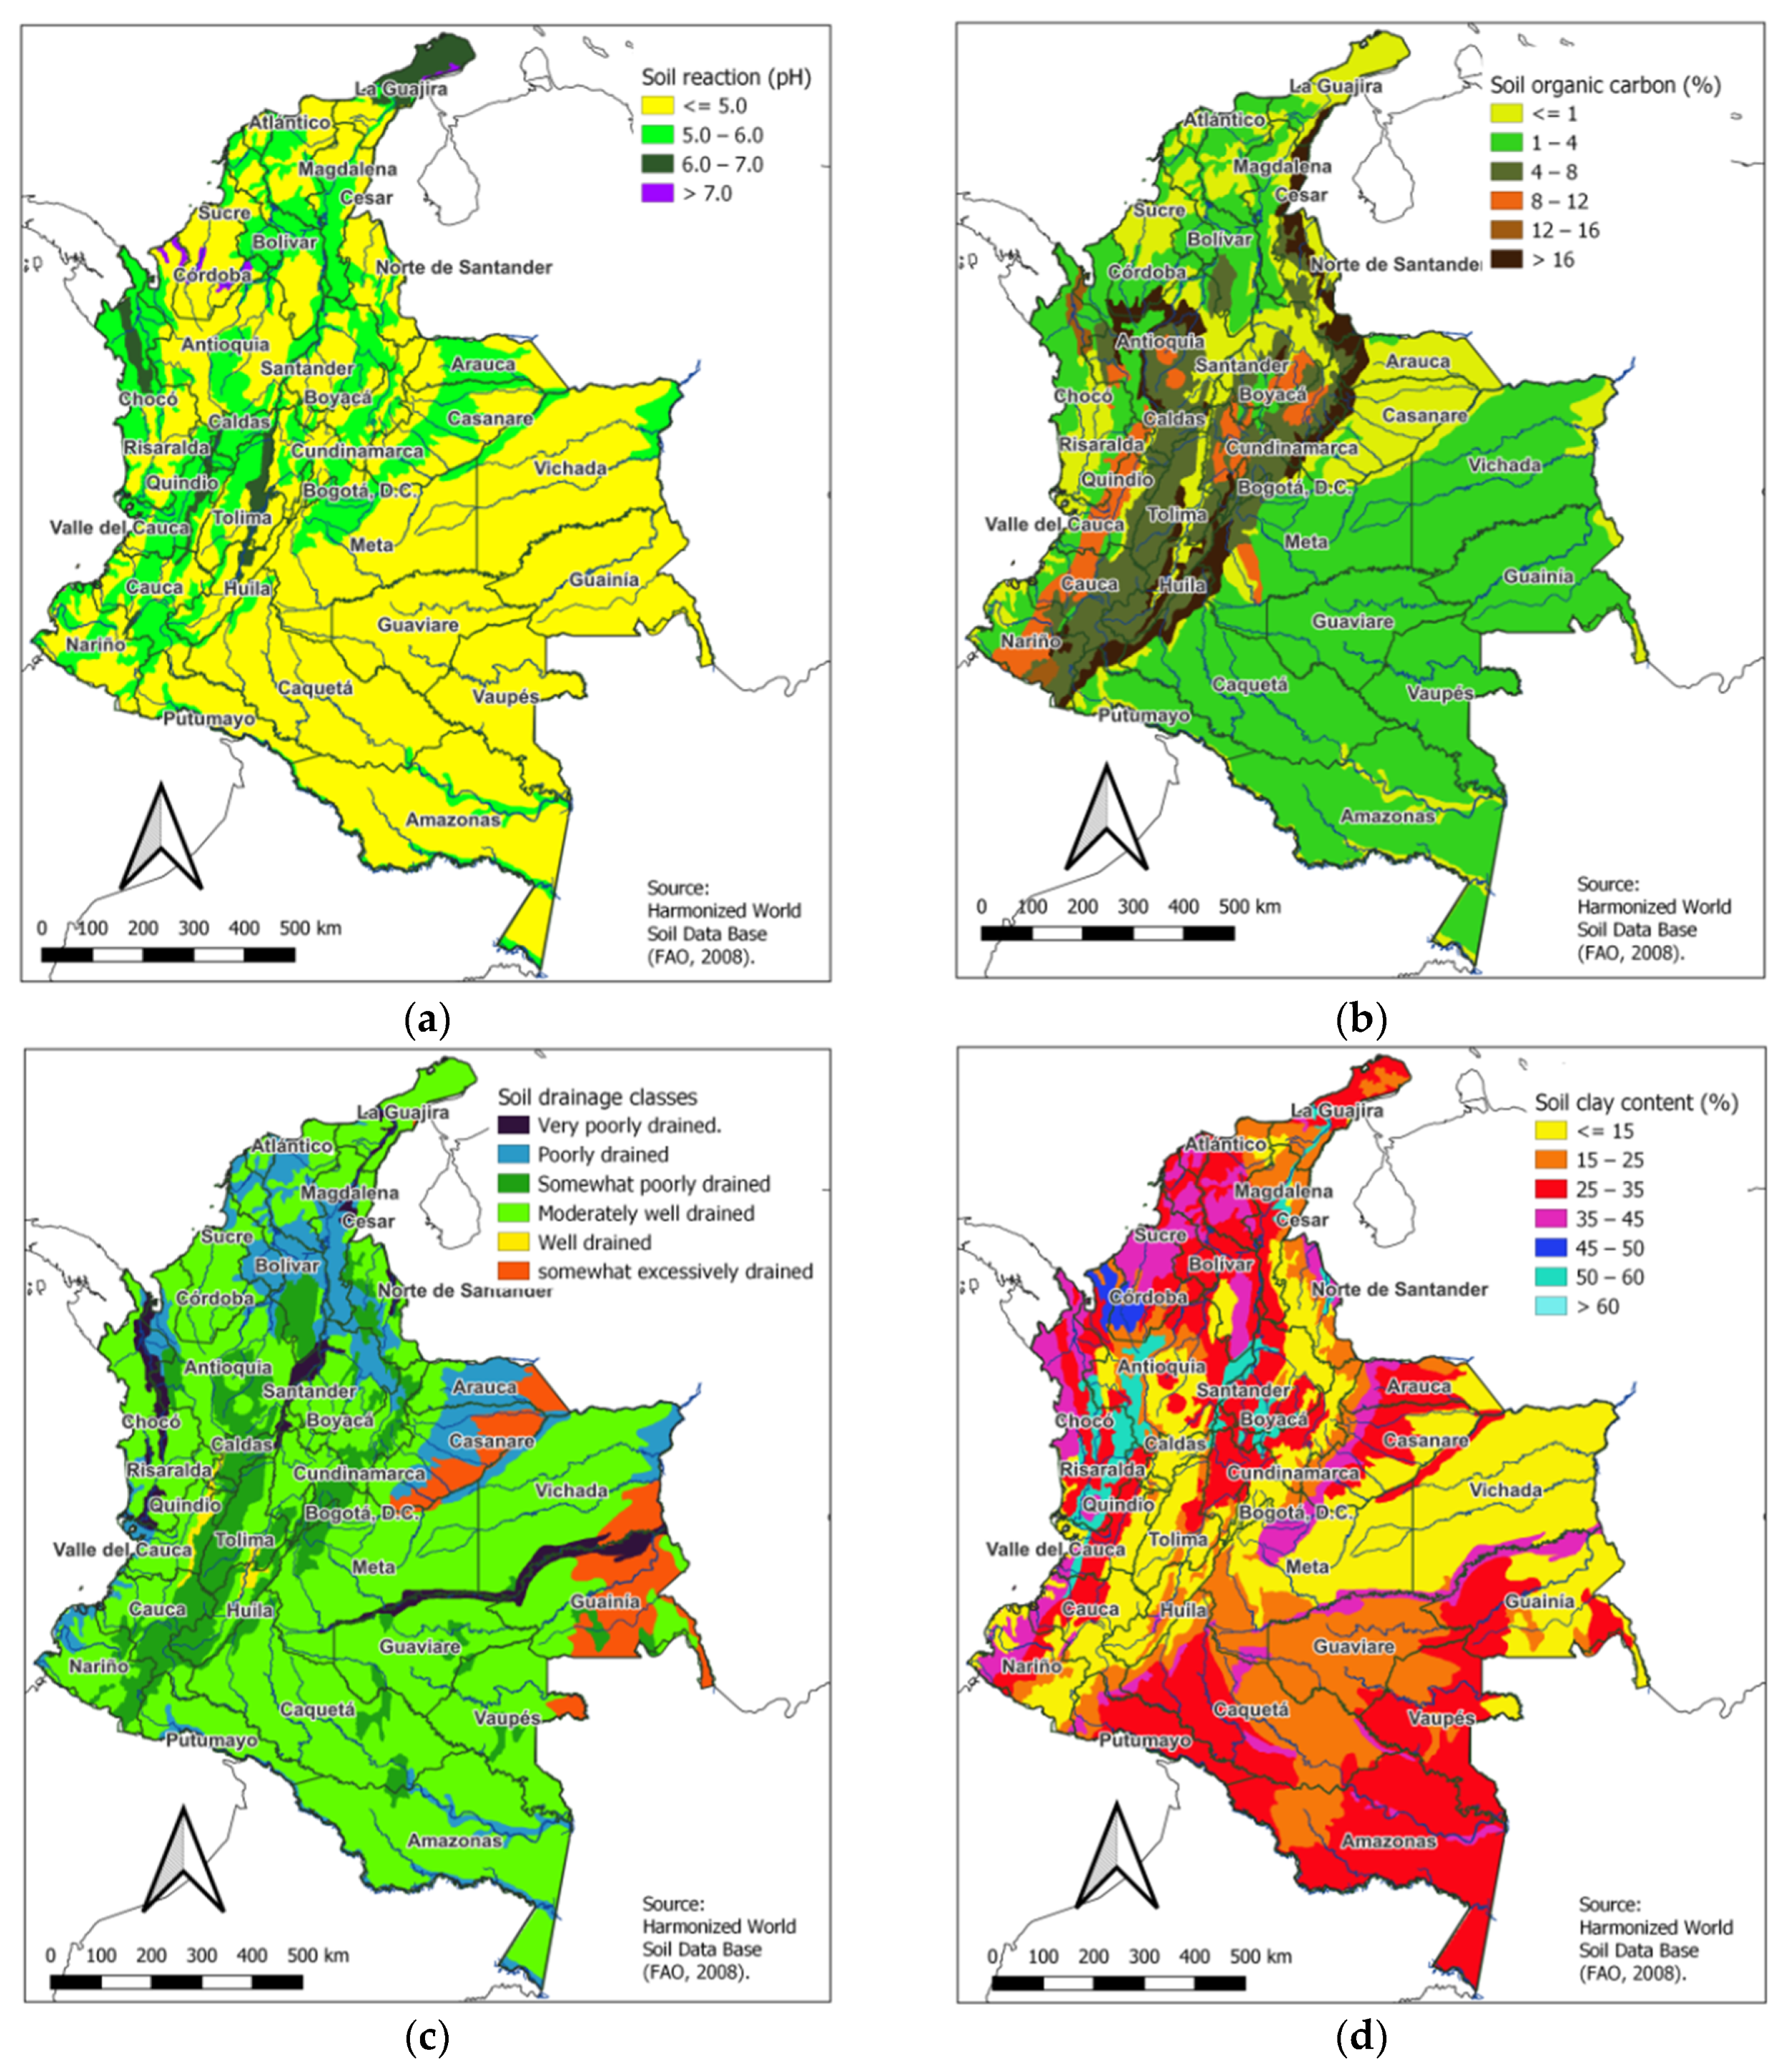
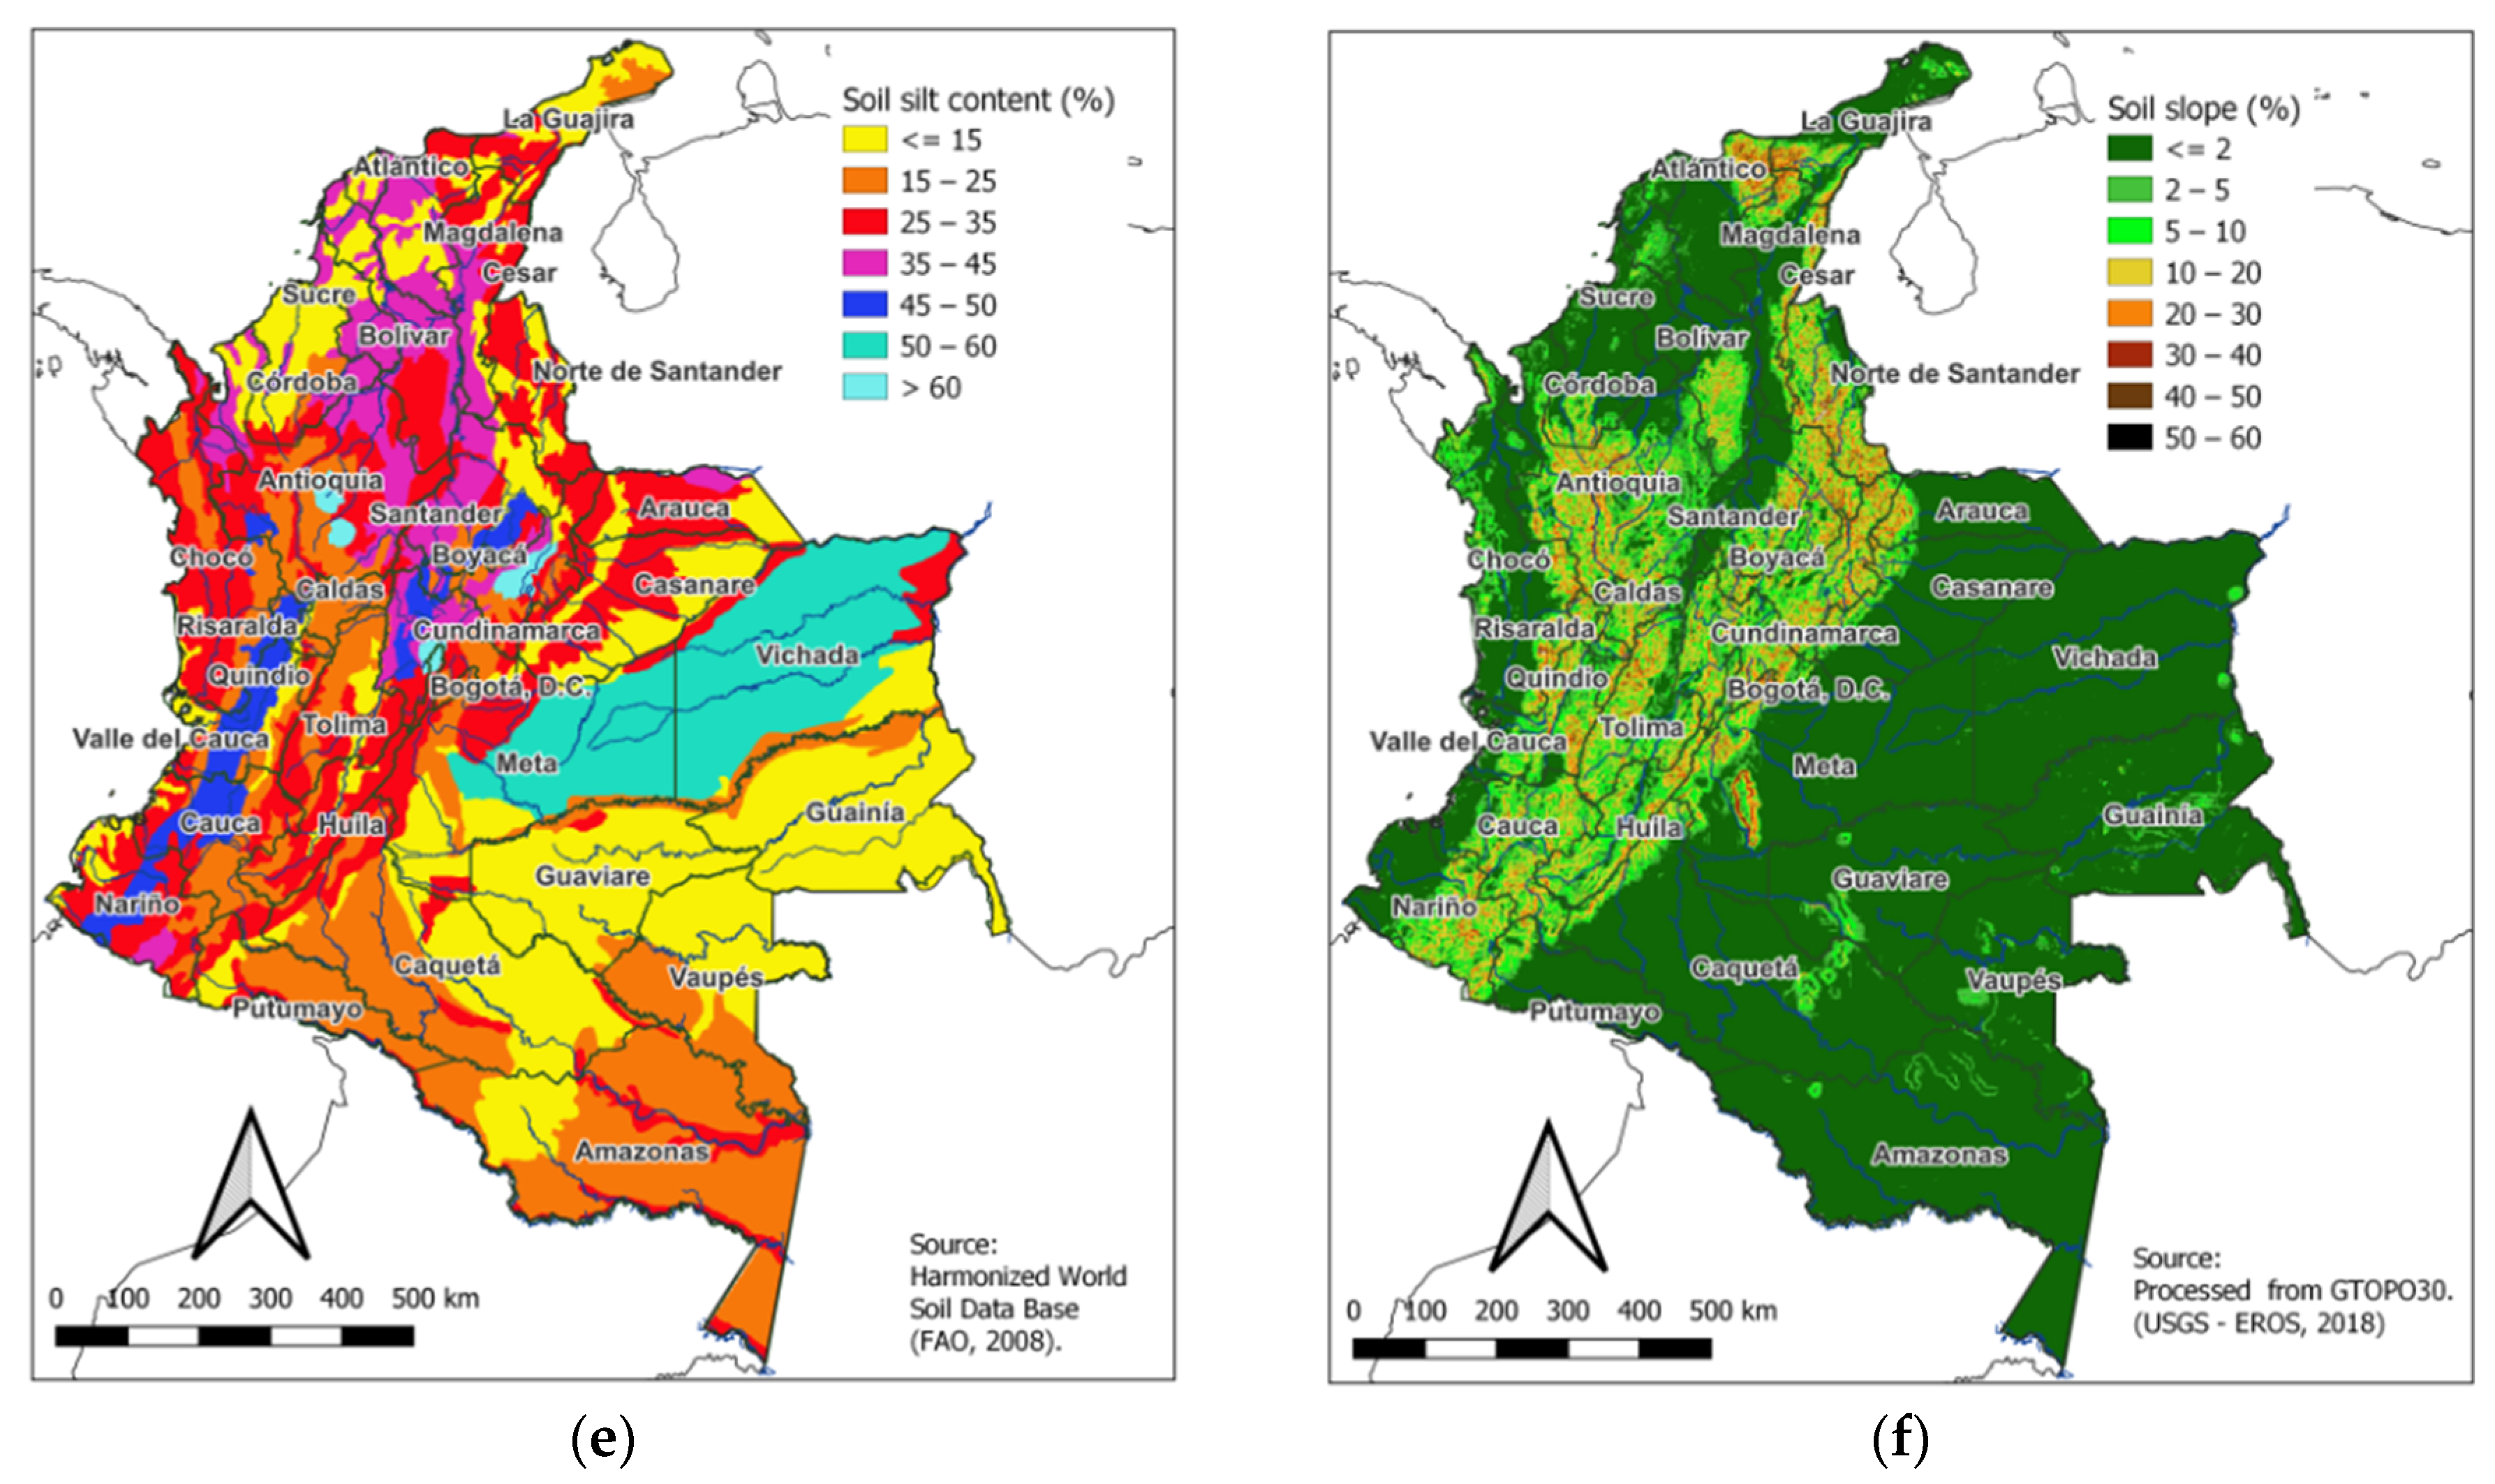
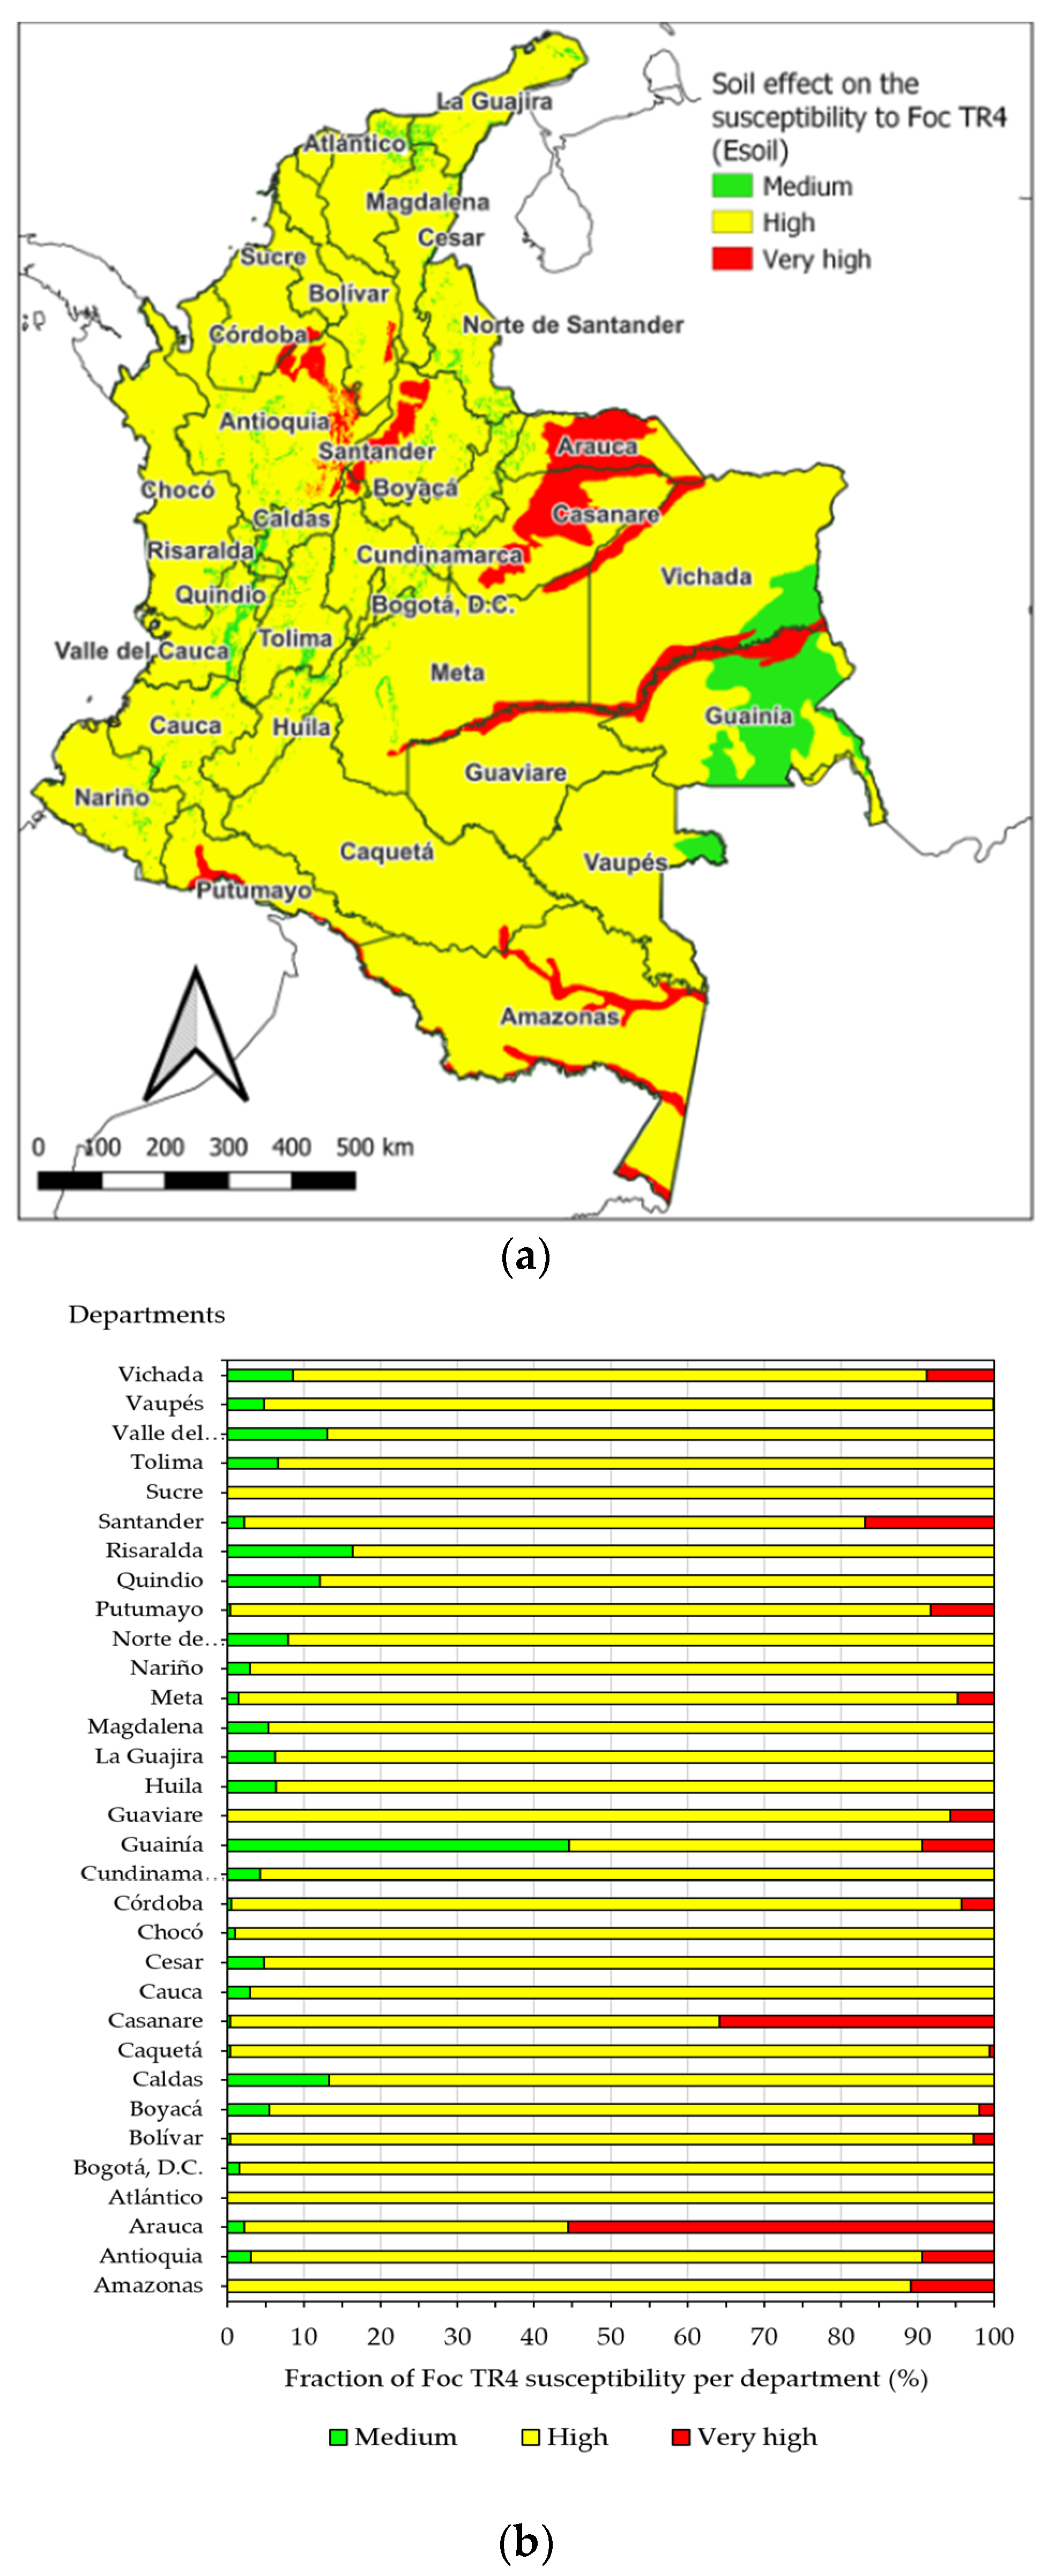
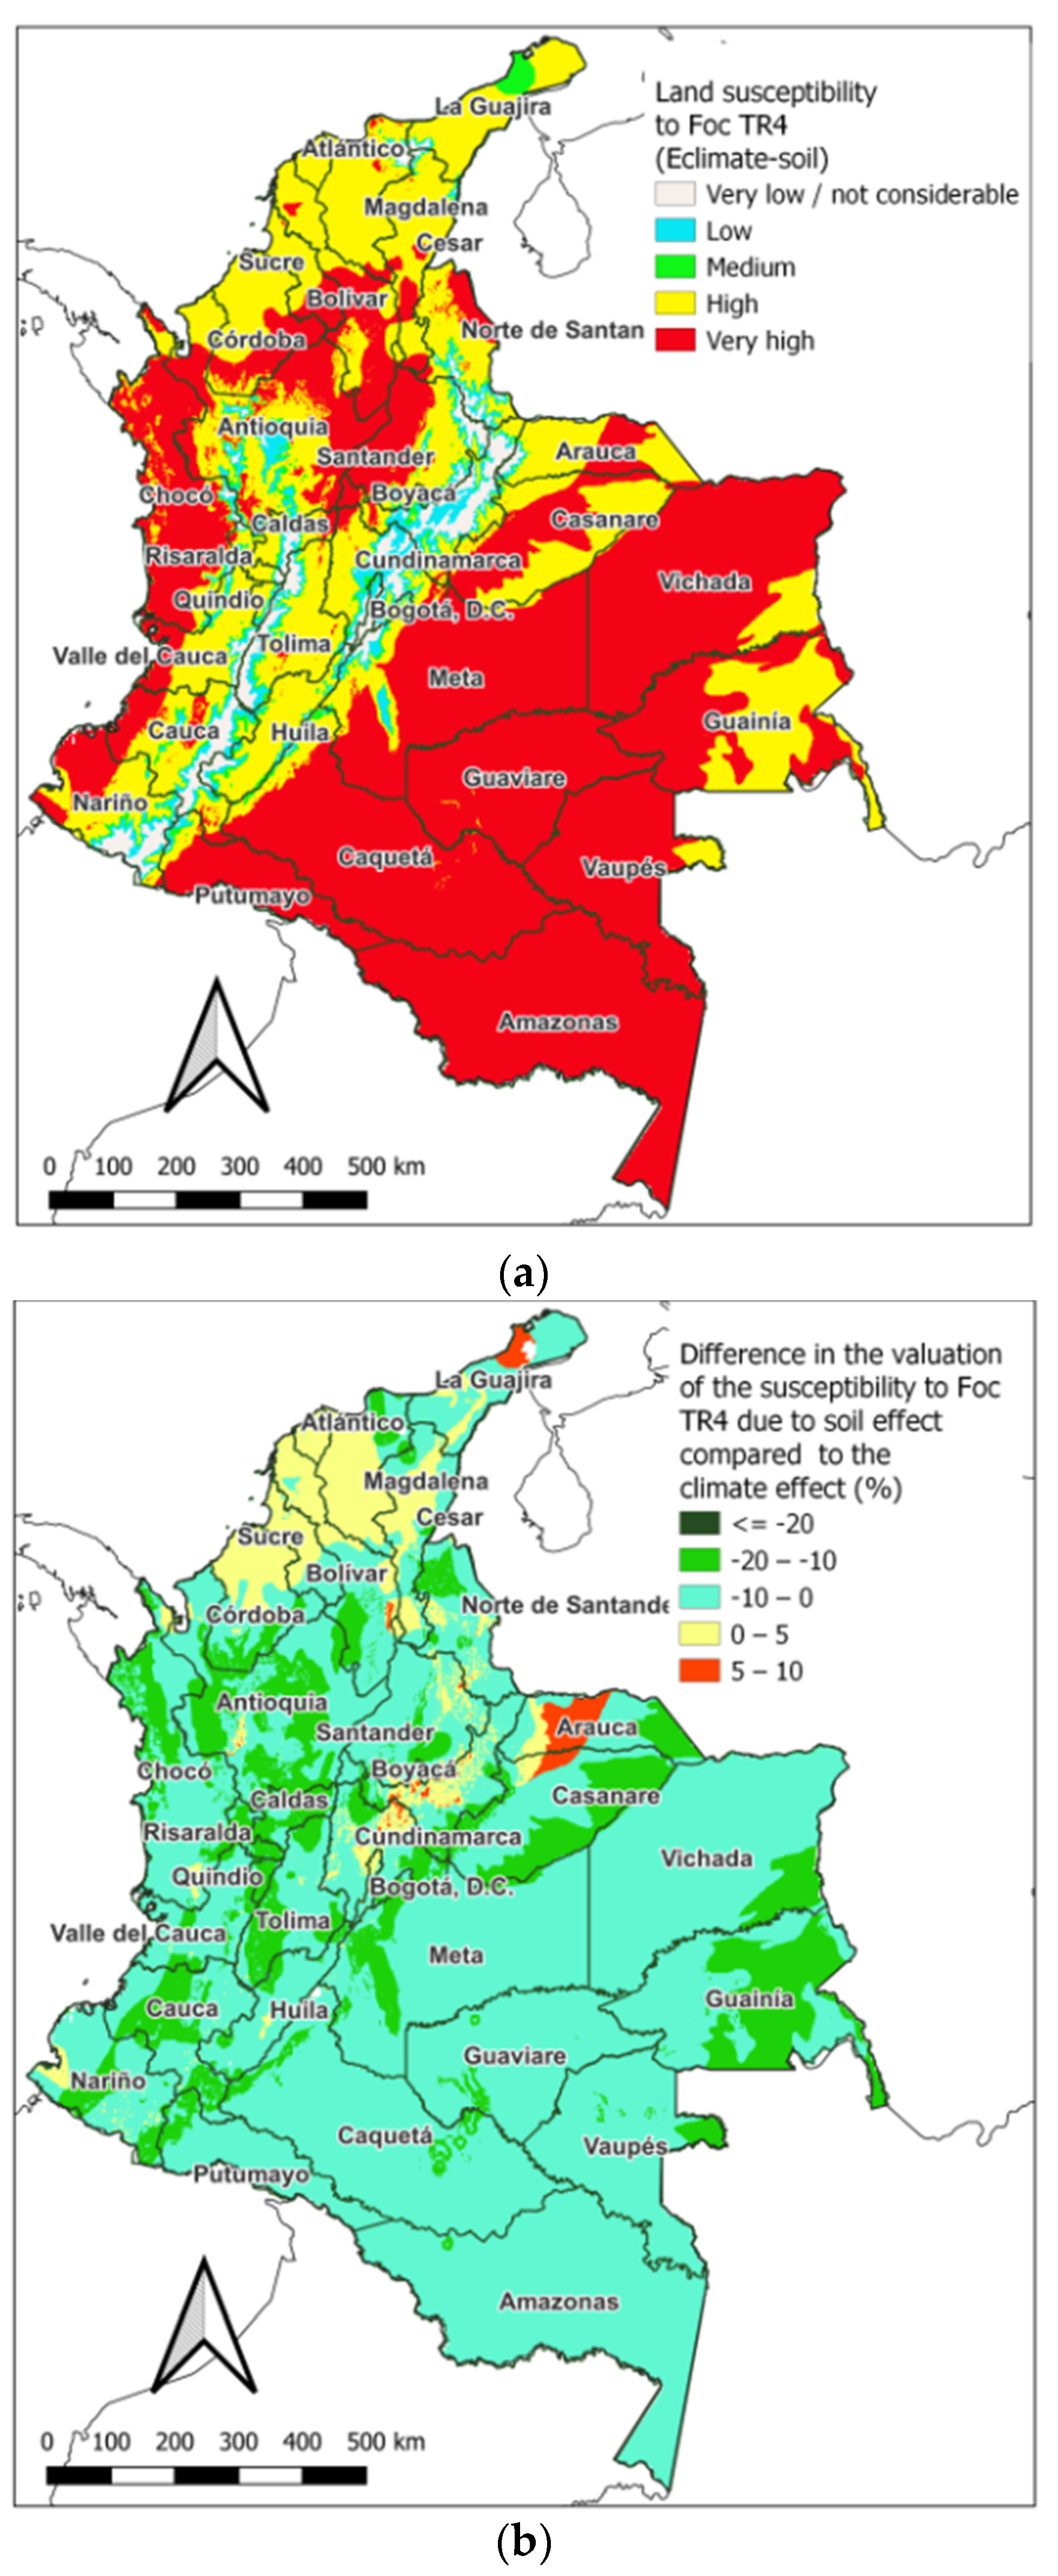
3.2. Effect of Soil (Esoil)

According to the general scale of the soil cartography used, most of the territory of continental Colombia (87.3%) corresponds to soils with high susceptibility to infection by Foc TR4. With this, 94.3% of the surface corresponds to soils with high and very high susceptibility to infection. A small fraction of the country (5.7%) corresponds to medium susceptibility soils (Figure 8a). The very high susceptibility of the soils is associated, in general, with the low slope and, in addition, to poor drainage (along the fluvial axes of the east of the country) and the acid reaction of the soil in part of the Santander, Antioquia, Cordoba, and Bolivar departments. Areas of medium susceptibility located to the east of the country, even with a low slope and acid reaction, are associated with rapid drainage, due to the low content of sand and silt (departments of Guainía and Vichada). Other areas with soils of medium susceptibility, located in the north of the country (departments of La Guajira, Magdalena, and Cesar), are associated with a certain slope, moderate to fast drainage, and low clay content. Additionally, they are soils with high pH (generally higher than 6.5) that are considered less predisposing to the disease. Finally, central-western areas, at the Andean foothills (above 1000 m in the departments of Cauca, Valle del Cauca, Risaralda, Caldas, Quindío, and Antioquia), are associated with moderate and faster drainage, low clay contents, and less acidic soil reaction (pH higher than 5.0, generally around 6.0).
The departments with the highest proportion of soils with very high susceptibility to infection with Foc TR4 are Arauca and Casanare, with more than 35% in proportion to the area of each one. The department of Guainía stands out with a high proportion of soils that confer medium susceptibility to infection (45%). Most of the departments have medium susceptibility soils of around 5% and up to 16%. Likewise, in most departments, the surface occupied by soils that confer high susceptibility to infection with Foc TR4 is greater than 80% (Figure 8b).

3.3. The Joint Effect of Climate and Soil (Sclimate–soil)

When incorporating the effect of the soil and the spatial occupation of the susceptibility classes conferred by the climate, variations are shown in the high and very high classes, particularly in the extreme east of the country and in the Andean Mountain range (Figure 9a). Even though with the effect of the soil, these classes occupy a similar fraction (91.3%) to that corresponding to the effect of the climate (91.5%), it is observed that the class of high susceptibility increases from 17.3 to 30.5%, at the expense of the very upper class, which decreased from 74.2 to 60.8%. The rest of the classes show variations of less than 0.2%.
The effect of the soil caused variations in the assessment of the susceptibility of the lands concerning the assessments by the climate alone (Figure 9b). In general, towards the east, it caused a reduction in valuation (between 10% and 20%), while in the Andean zone, a heterogeneous variation is observed in the direction, with small increases (not greater than 5%) in the courses of the intervalley’s mountains and reductions (between 10% and 20%) in the highest areas. Towards the Caribbean side (north, except for the peninsula), there is a slight increase (around 5%). These variations are a sign of the sensitivity of the valuations to the distribution of soil characteristics. However, these variations were sometimes not large enough to cause class changes.

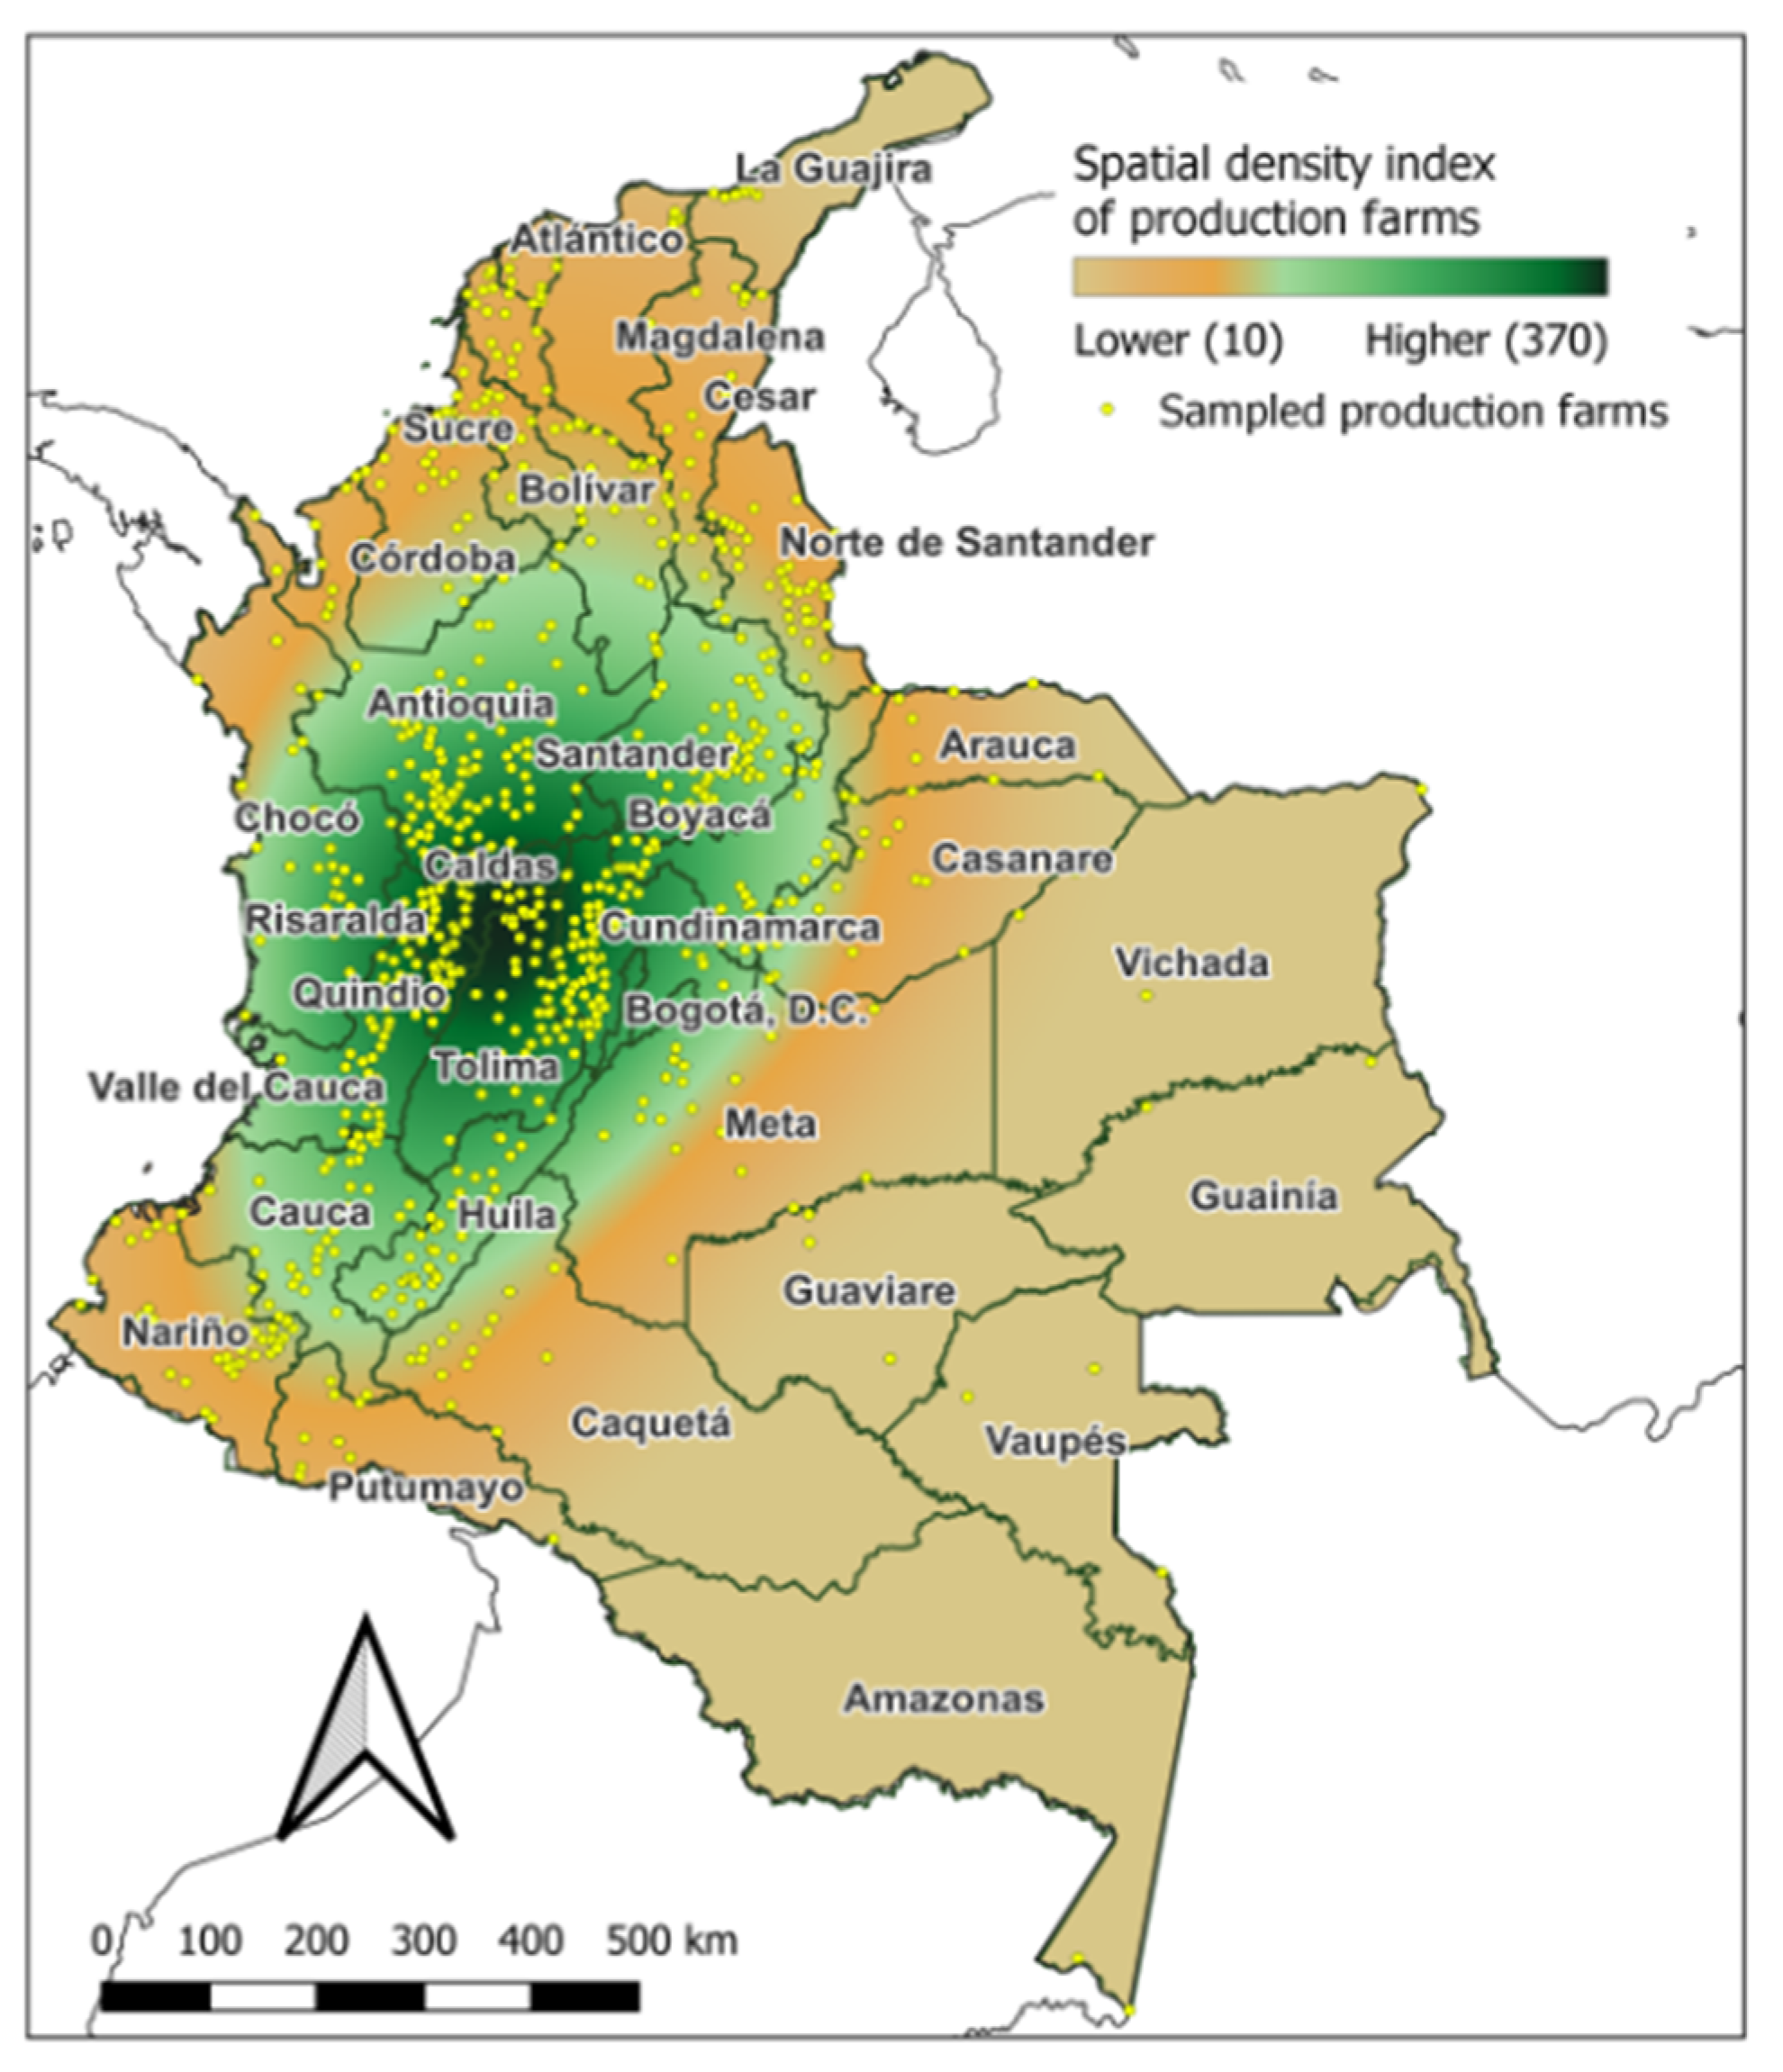
3.4. The Density of Farms (iD)

The density of production farms (expressed as the iD index) shows a concentric distribution from a “nucleus” around the departments of Caldas and Risaralda (Figure 10). Given the location of production farms along the valleys and Andean foothills, a lengthening of the density pattern is observed to the south and north. The transition to density index values to apply the correction function (FD) can be located, to the north, in the southern limits of Córdoba and northern Bolívar, to the south in the northern limit of Nariño, to the west between Córdoba and Antioquia, and the east on the western limits of Arauca and Casanare. In a southeasterly direction, this transition is located in the western areas of Meta and Caquetá. It is estimated that the area with significant density (iD values greater than 80, where the density function does not apply) is approximately 327,000 km2.

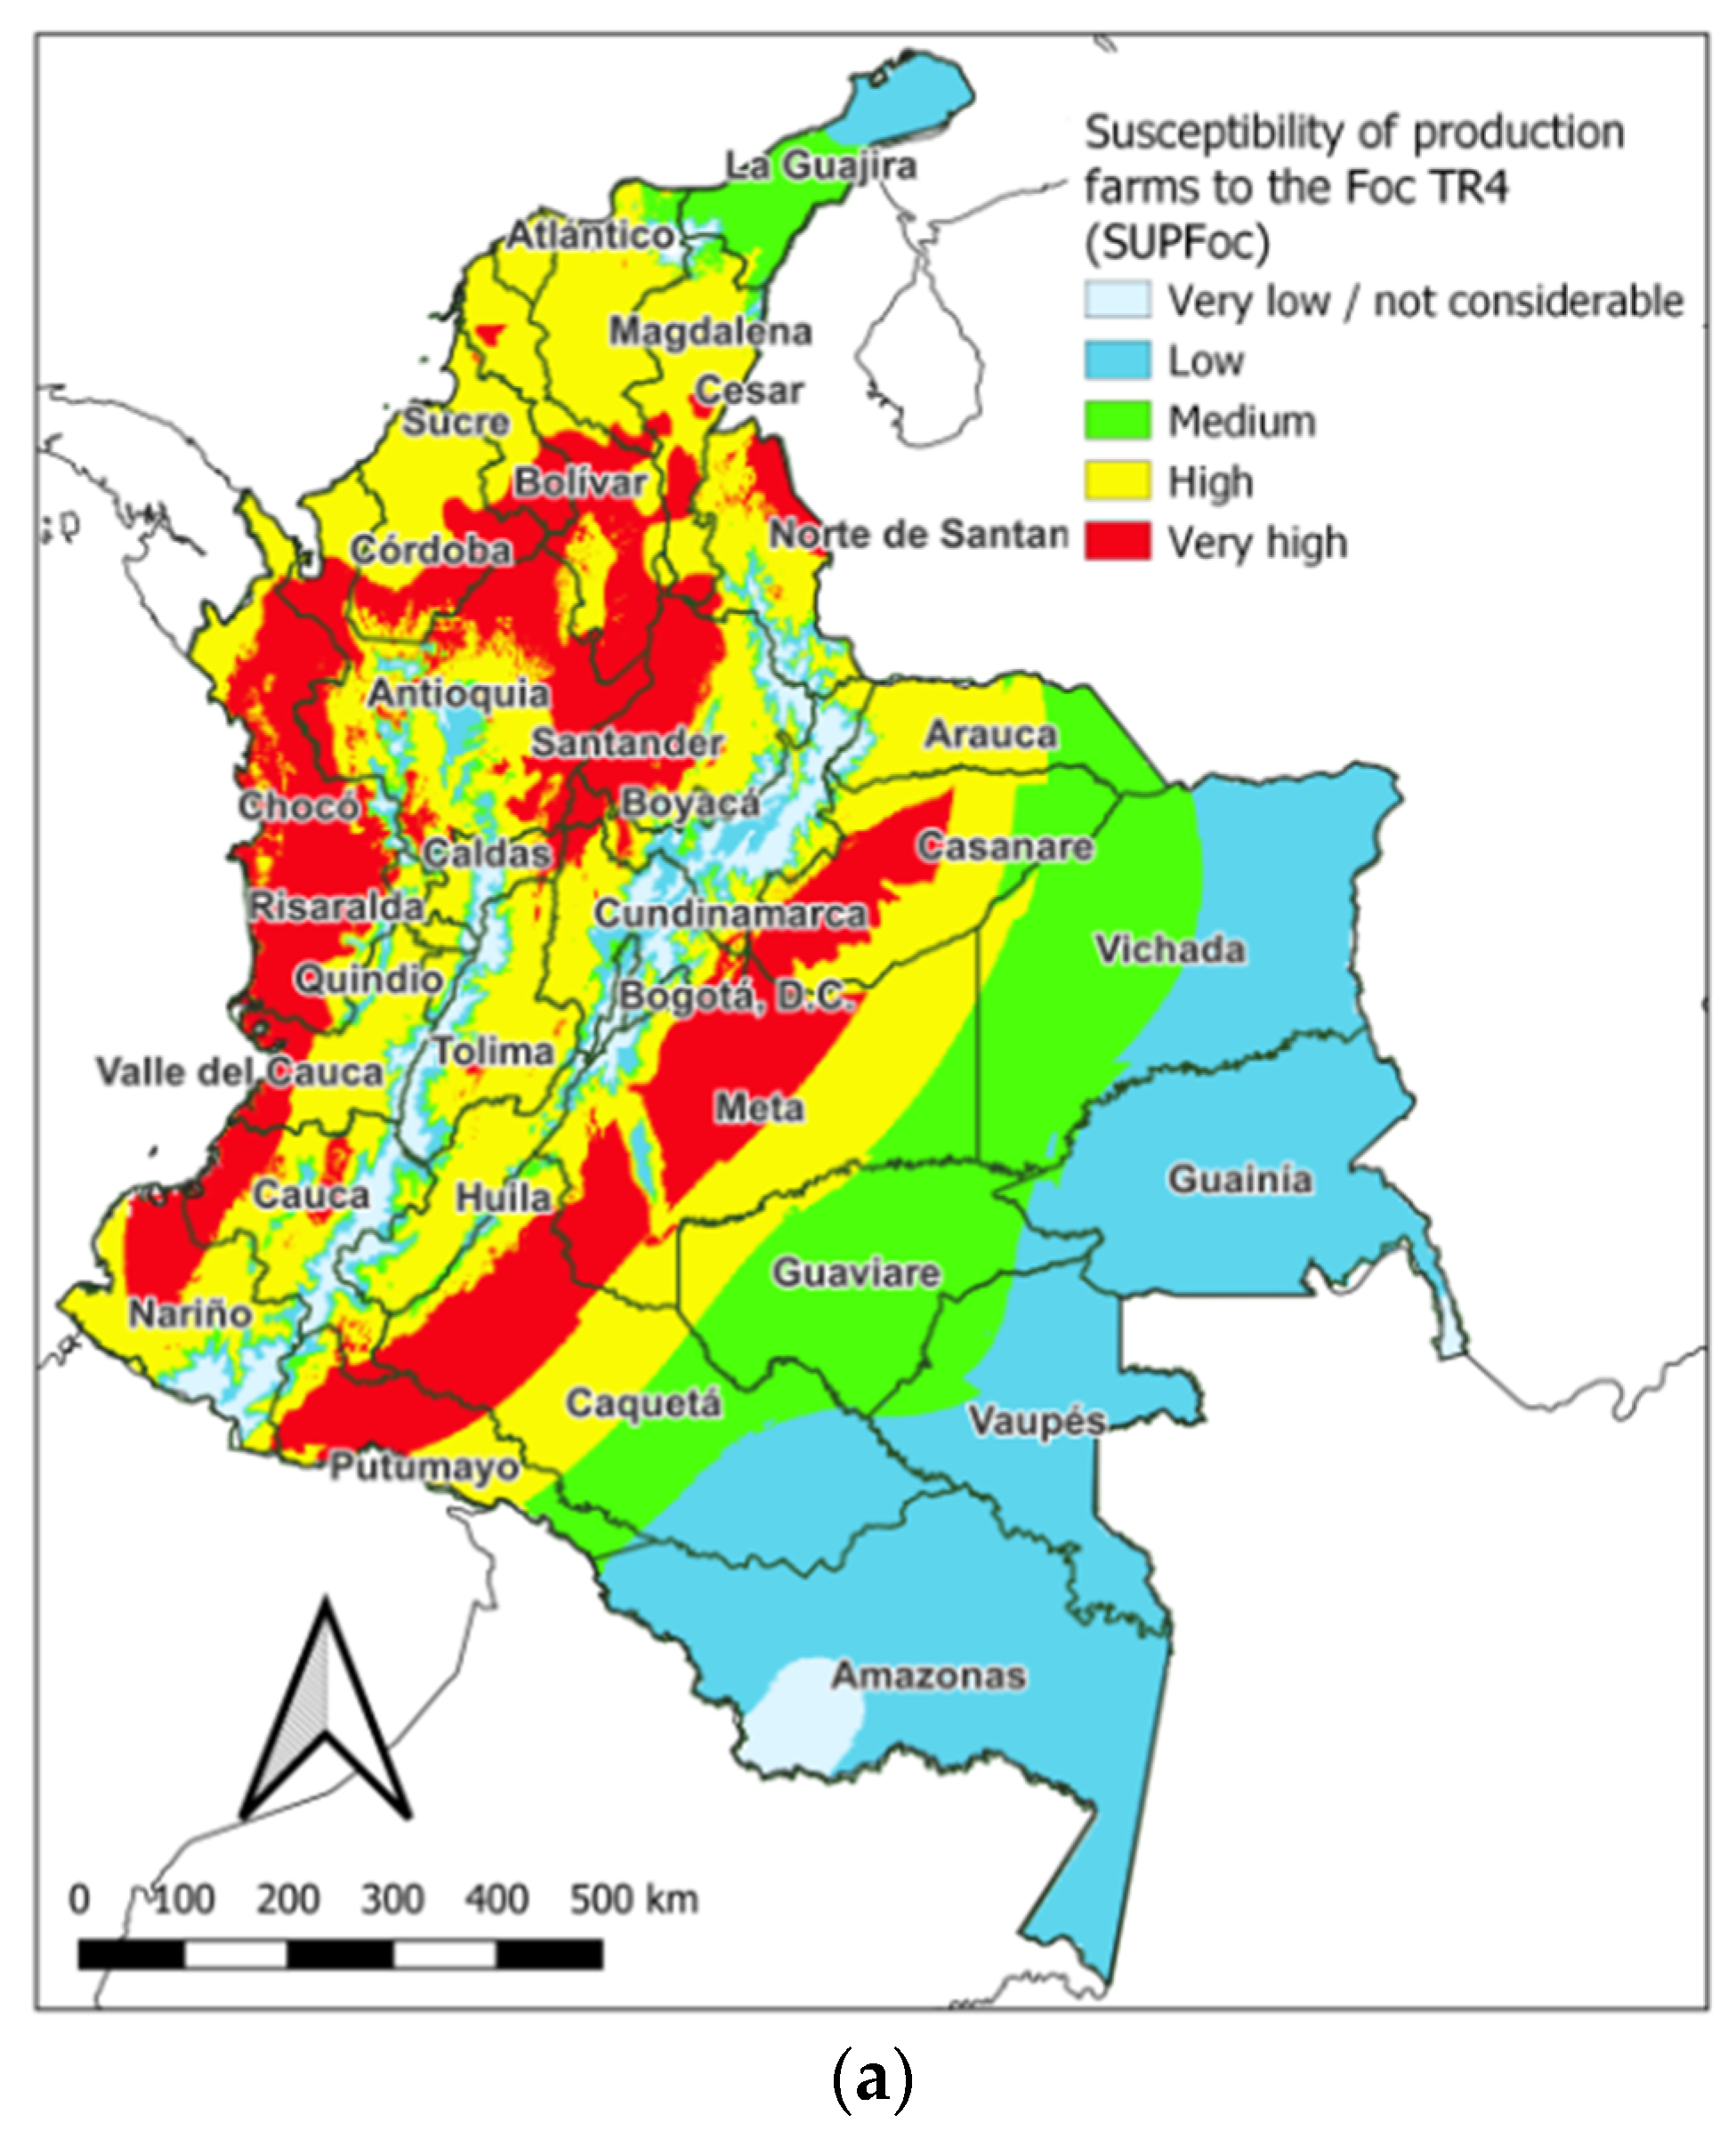
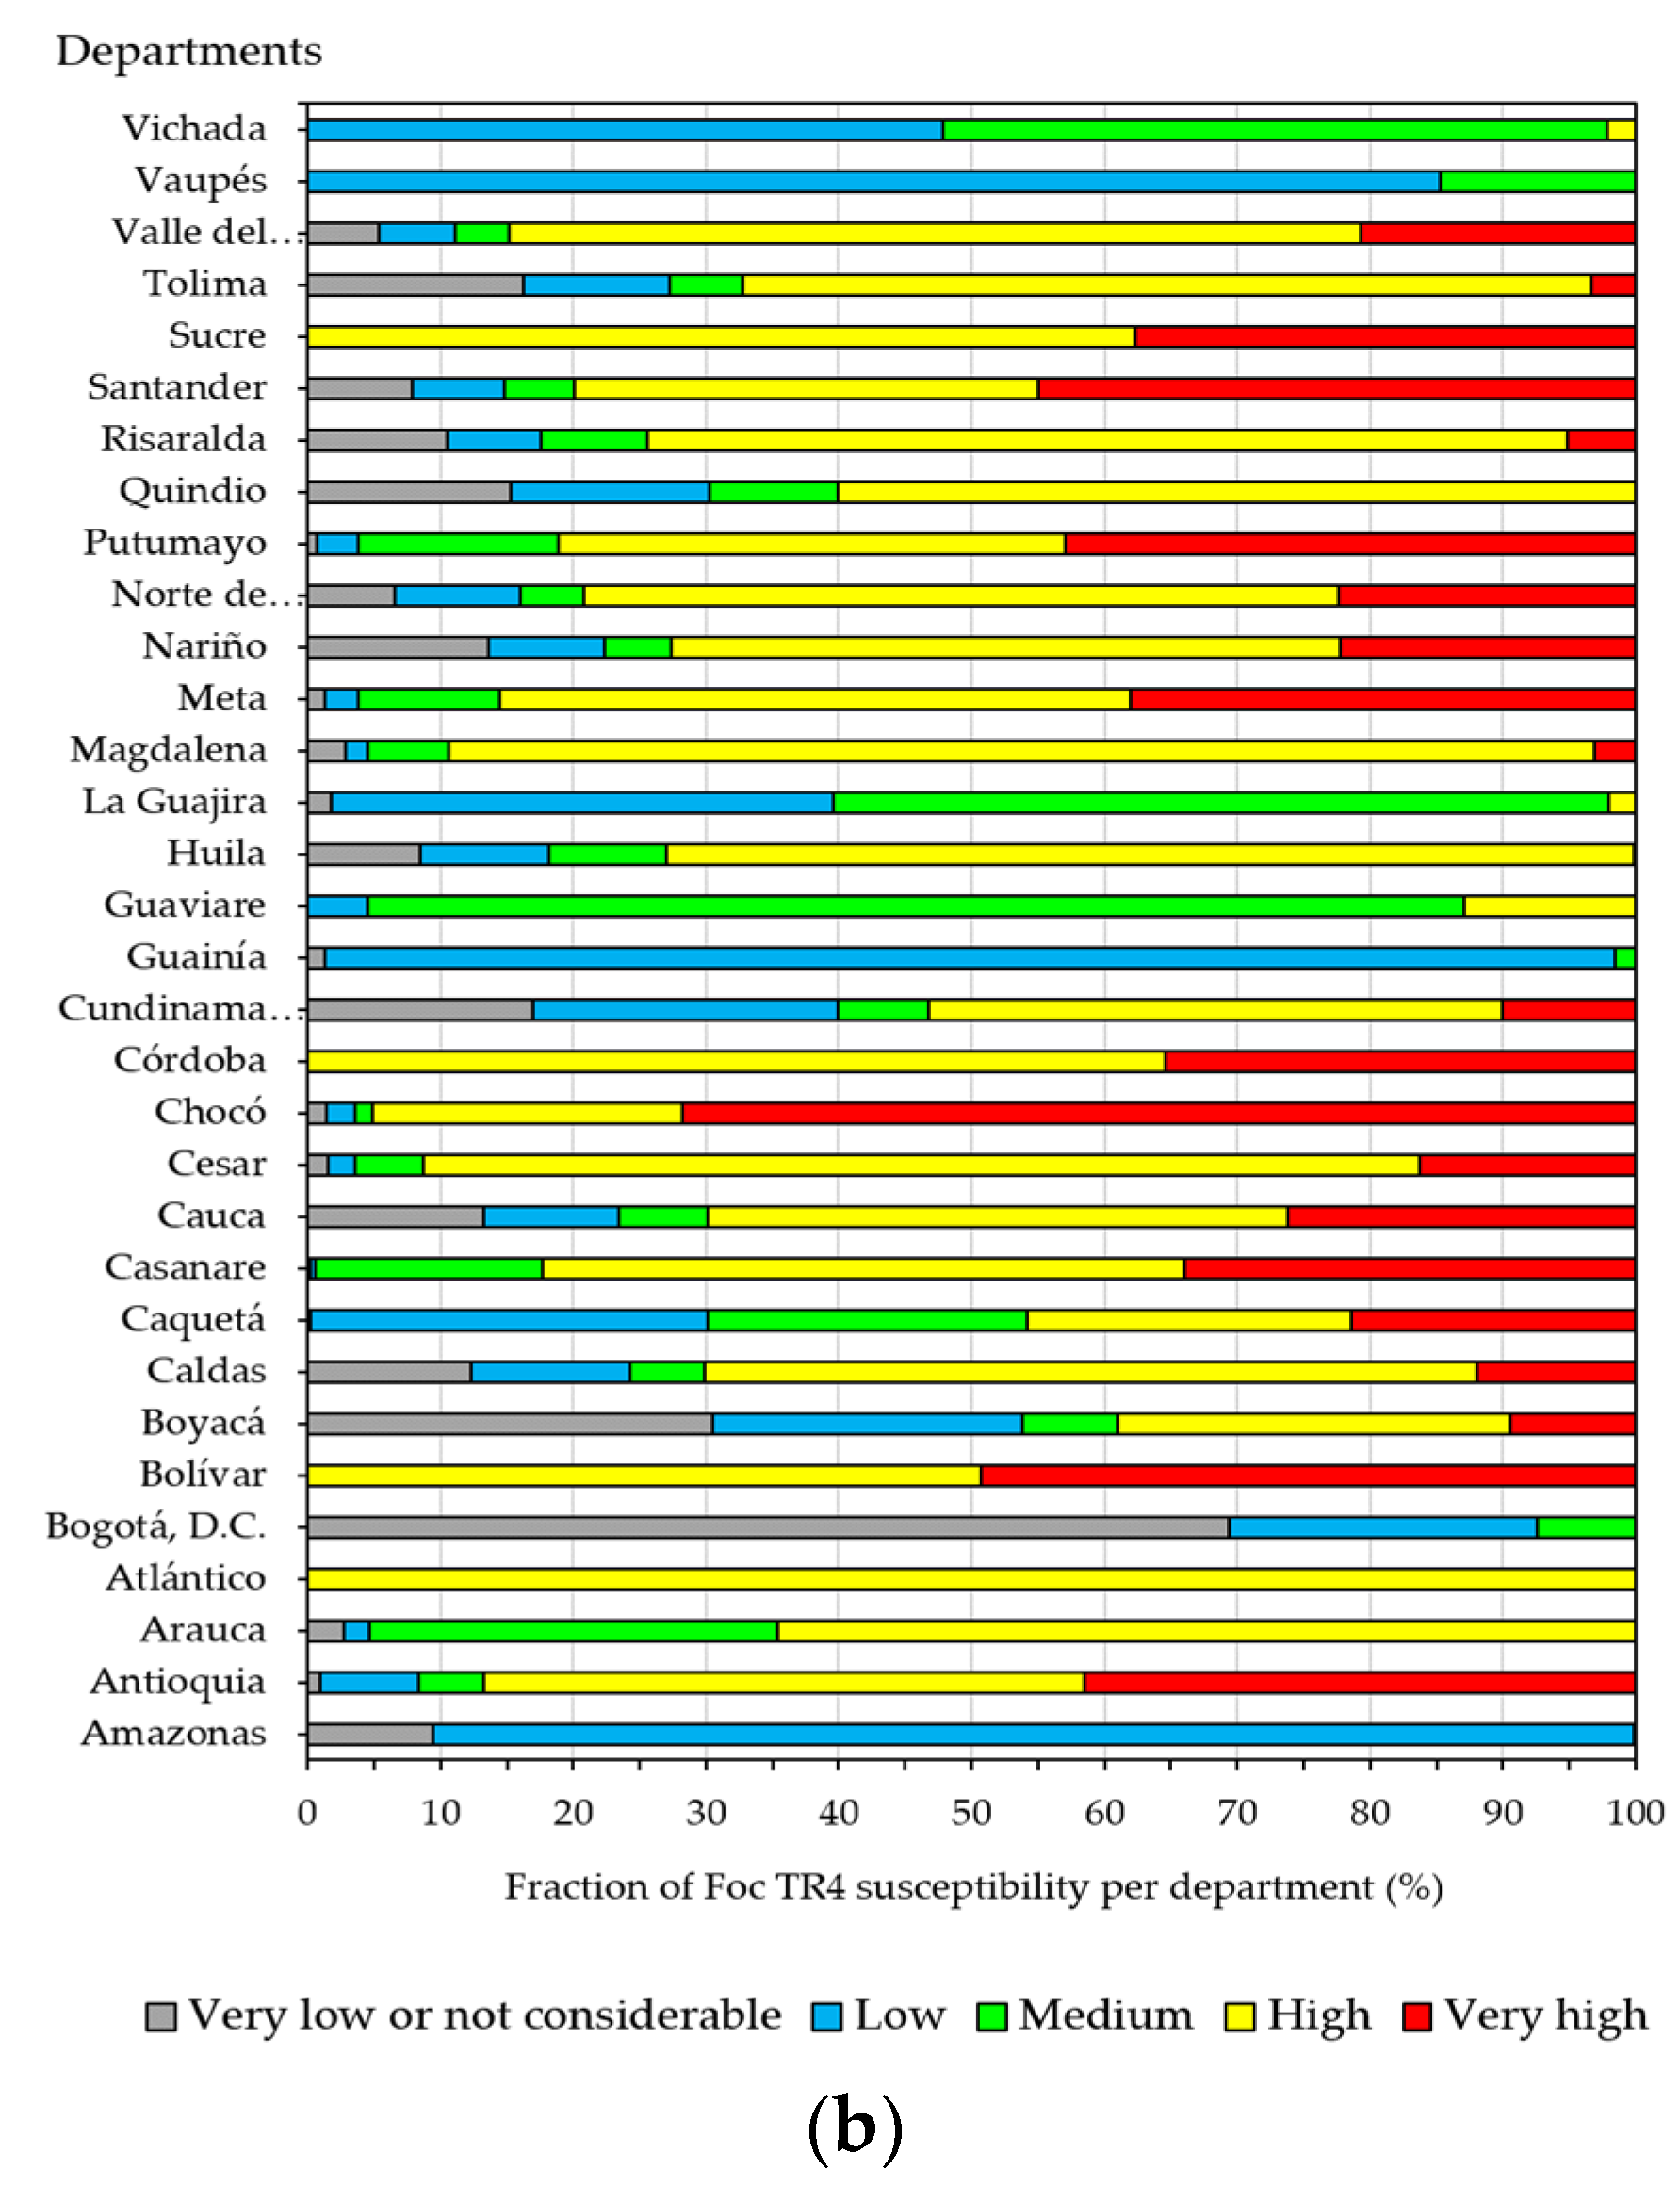
3.5. Susceptibility of Production Farms to Foc TR4 (SUPFoc)

When considering the density of Musaceae (banana and plantain) production farms, it is obtained that the high and very high susceptibility classes occupy around 50% of the continental Colombian territory (572,000 km2). This is because as one moves towards the east, the density index of production farms decreases substantially given the dispersion and very low number of these (Figure 11a). In these areas, although the susceptibility for environmental reasons (land susceptibility) may be very high, the very low occupation by Musaceae production farms means that the possibility of infection may be low. As a consequence, in general, the lower and middle classes increase their proportion (29.3 and 16.4%) at the expense of the more susceptible classes. The very low or not considerable class maintains a very low proportion, corresponding to lands that due to their altitude (and associated factors such as access and temperature) are not suitable for production systems in low-lying areas and also “remote lands” with a very low density of production farms (as in the department of Amazonas).
Regarding the proportions of the susceptibility classes of the production farms to infection with Foc TR4 by department (Figure 11b), only nine of them presented less than 50% of high and very high susceptibility classes of the production farms (Vichada, Vaupés, La Guajira, Guaviare, Guainía, Caquetá, Boyacá, Bogotá D.C, and Amazonas), while the departments of Antioquia, Atlántico, Bolívar, César, Chocó, Córdoba, Magdalena, Meta, and Sucre presented more than 85% of their surface with high (and very high) susceptibility of the production farms. In addition, Antioquia, Bolívar, Chocó, and Santander turned out to be the departments with the highest proportion of very high-class susceptibility of the production farms.

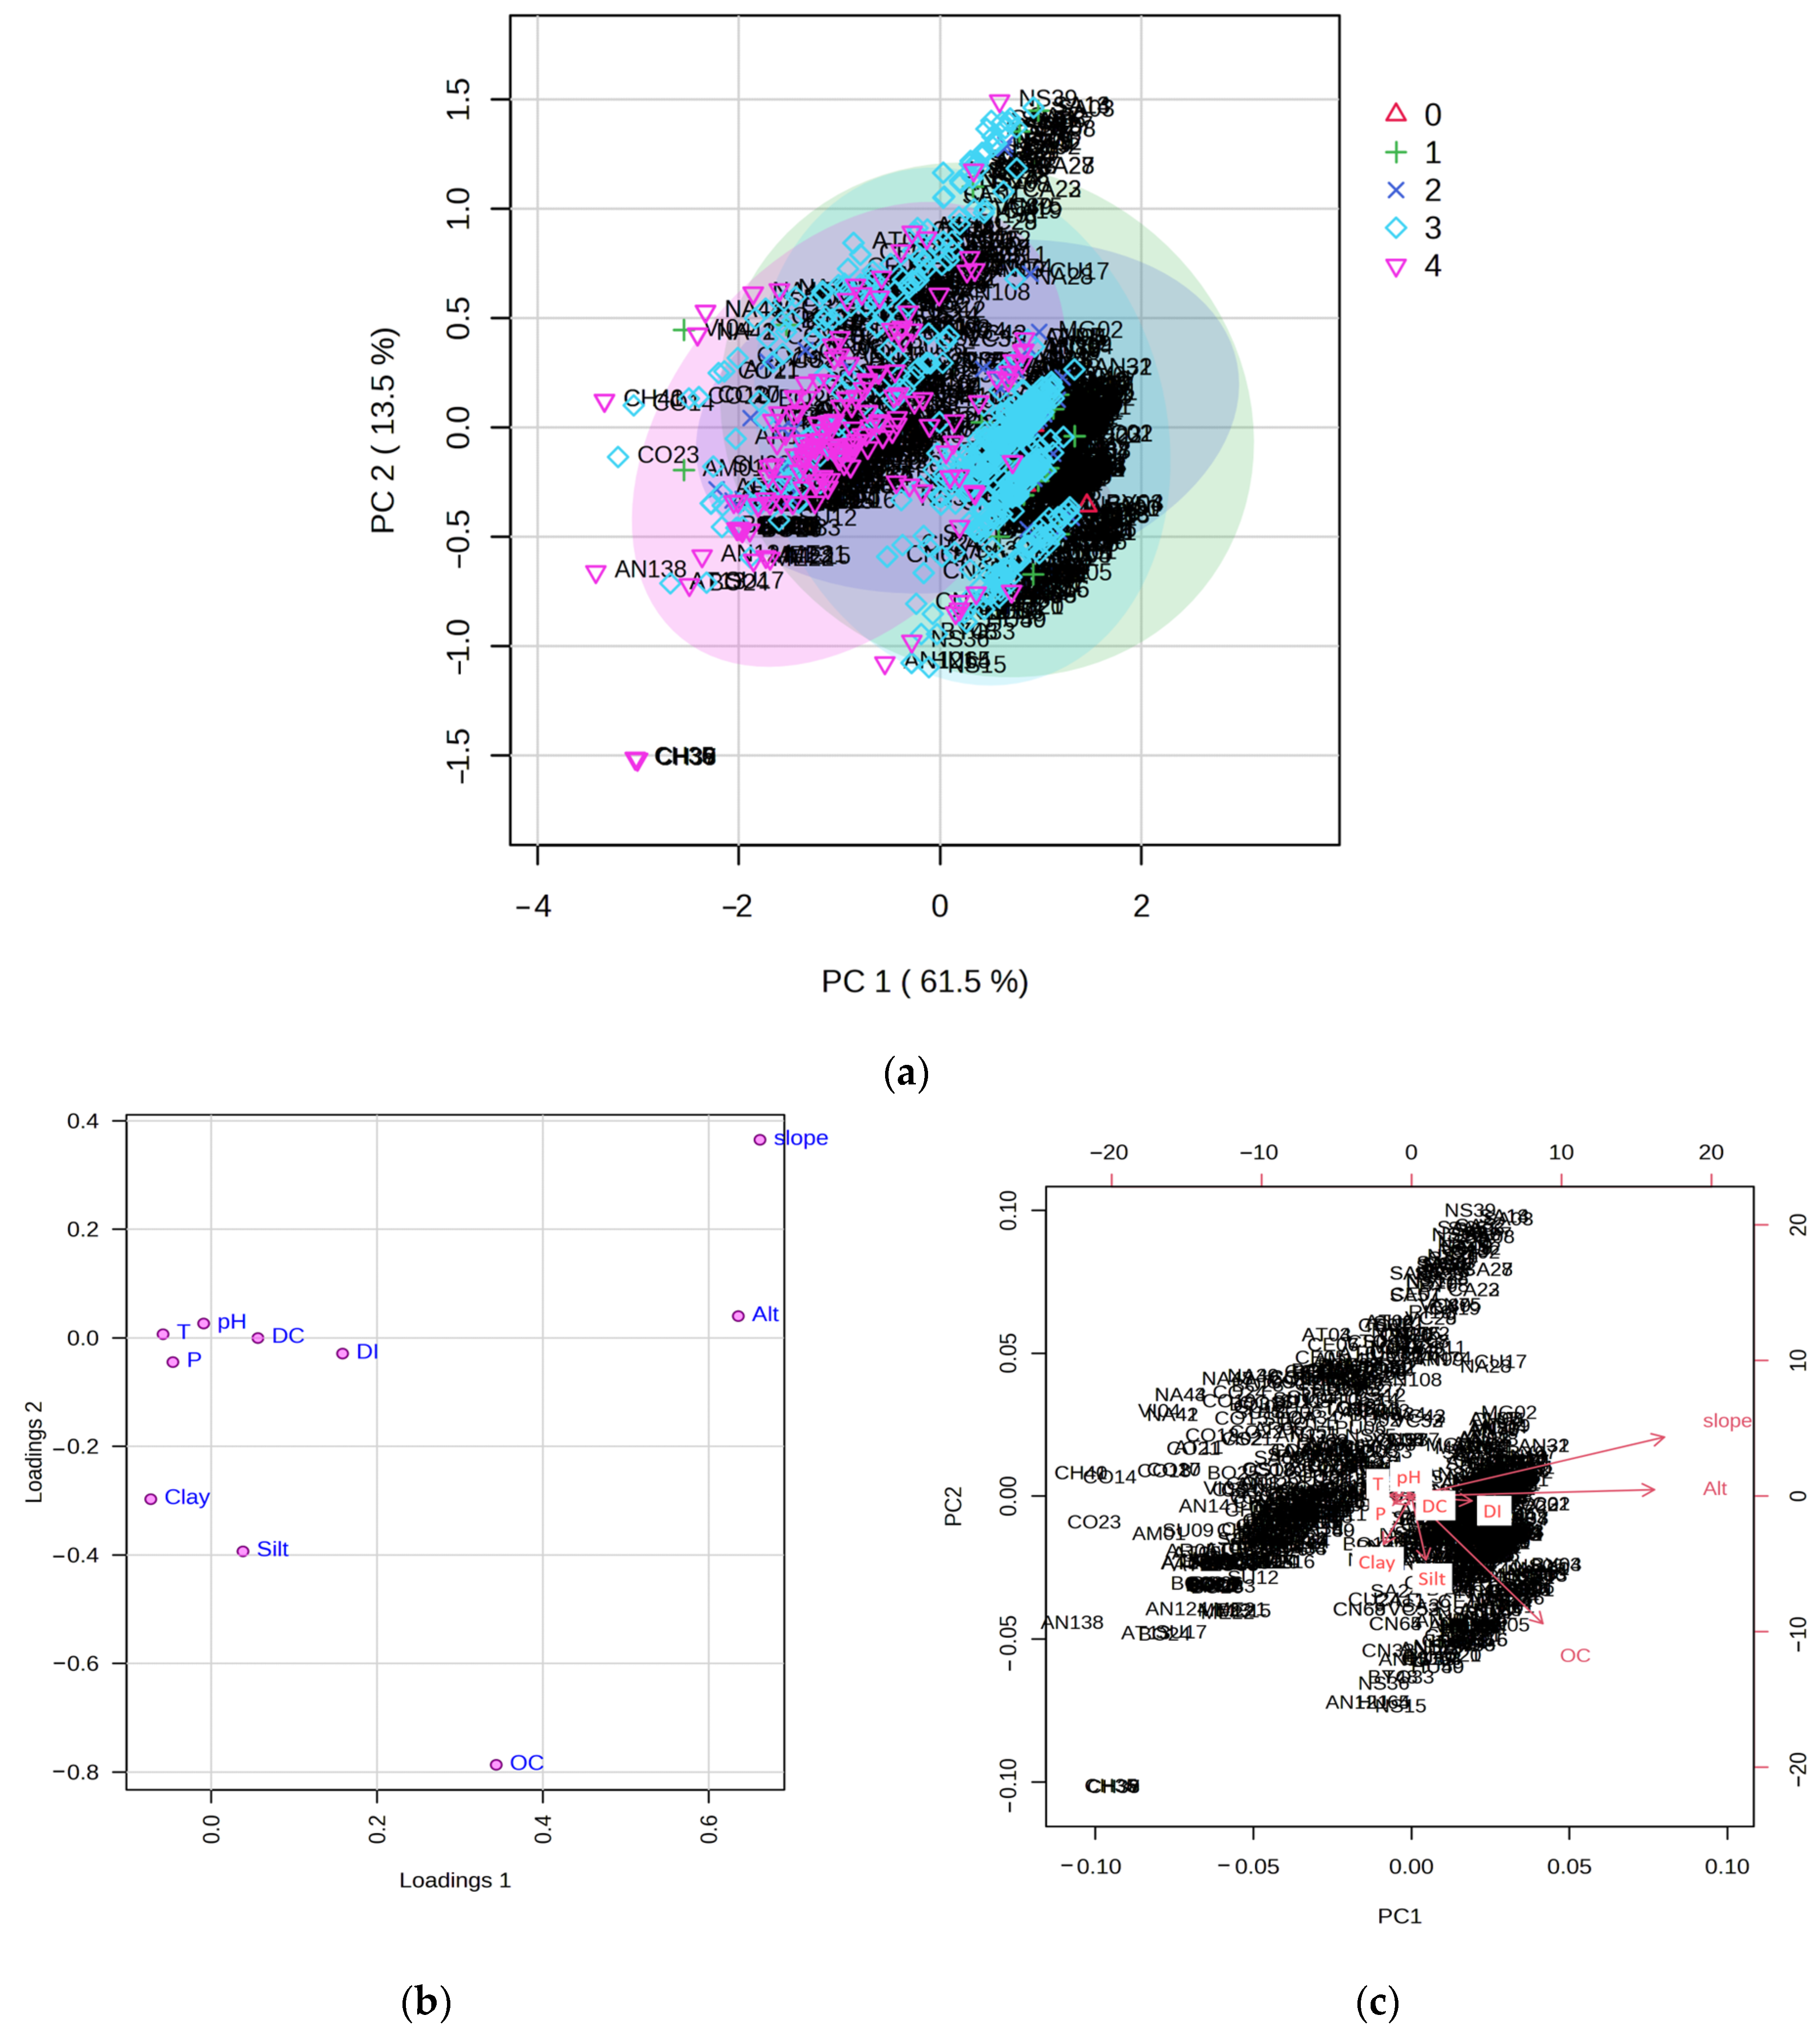
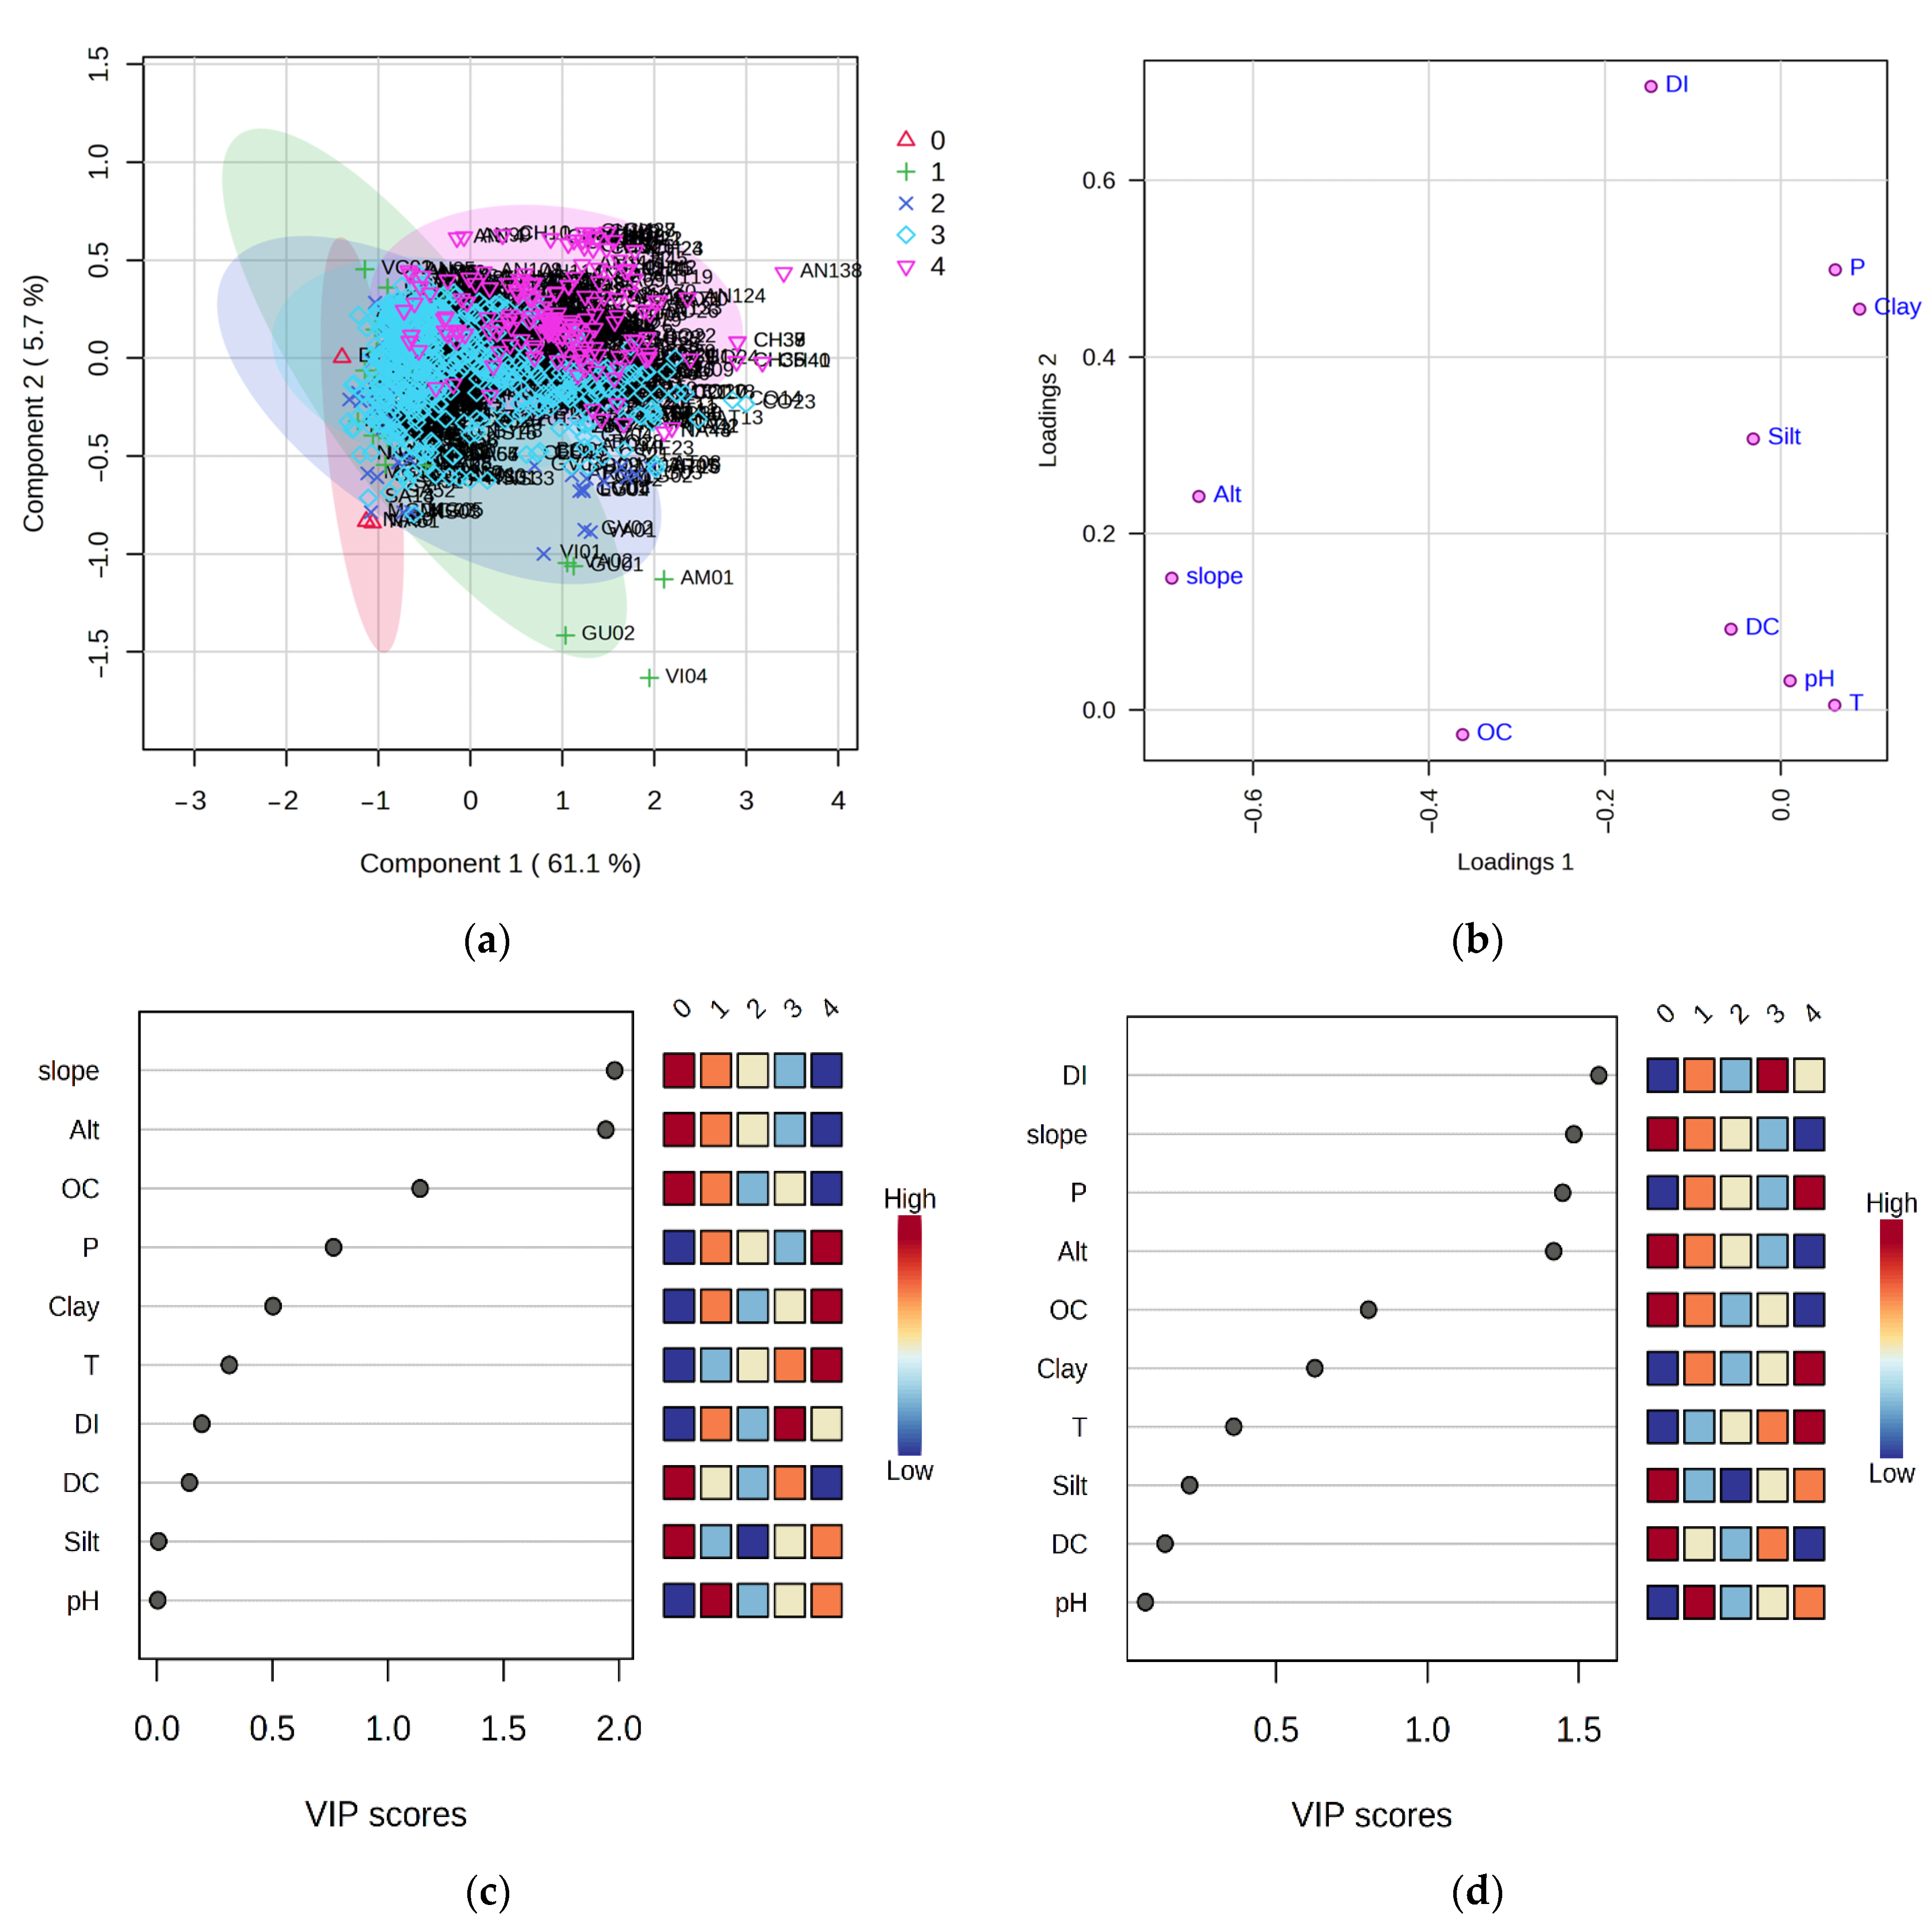
3.6. Exploratory Multivariate Analysis

Using PCA, the susceptibility classes were not distinguishable (Figure 12a). The first two principal components (PC) explained 75.0% of the variance; however, no trends in differences were detected (Figure 12c). Based on the contribution value |loading values| > 0.30, we obtained the top five variables, including slope (0.66), altitude (0.63), and OC (0.34) in the first component and the silt (0.39) and clay (0.30) in the second component (Figure 12b).
When using the PLS-DA as a classification model, a moderate tendency to distinguish susceptibility classes was found (Figure 13a). In this model, the first two principal components explained 66.8% of the variance. Based on the |load values| > 0.2, seven significant variables were found: slope (0.69), altitude (0.66), OC (0.36) in the first component and DI (0.70), precipitation (0.49), clay (0.45), and silt (0.30) (Figure 13b). In addition, the performance of PLS-DA was assessed using the accuracy of 0.84 and goodness of fit R2Y = 0.43. This result indicated good predictive power and moderate class separation. The important features identified by (VIP) > 1 in component 1 were slope (1.98), altitude (1.94), and OC (1.14) (Figure 13c), and two important variables were identified as DI (1.56) and precipitation (1.44) in component 2 (Figure 13d).

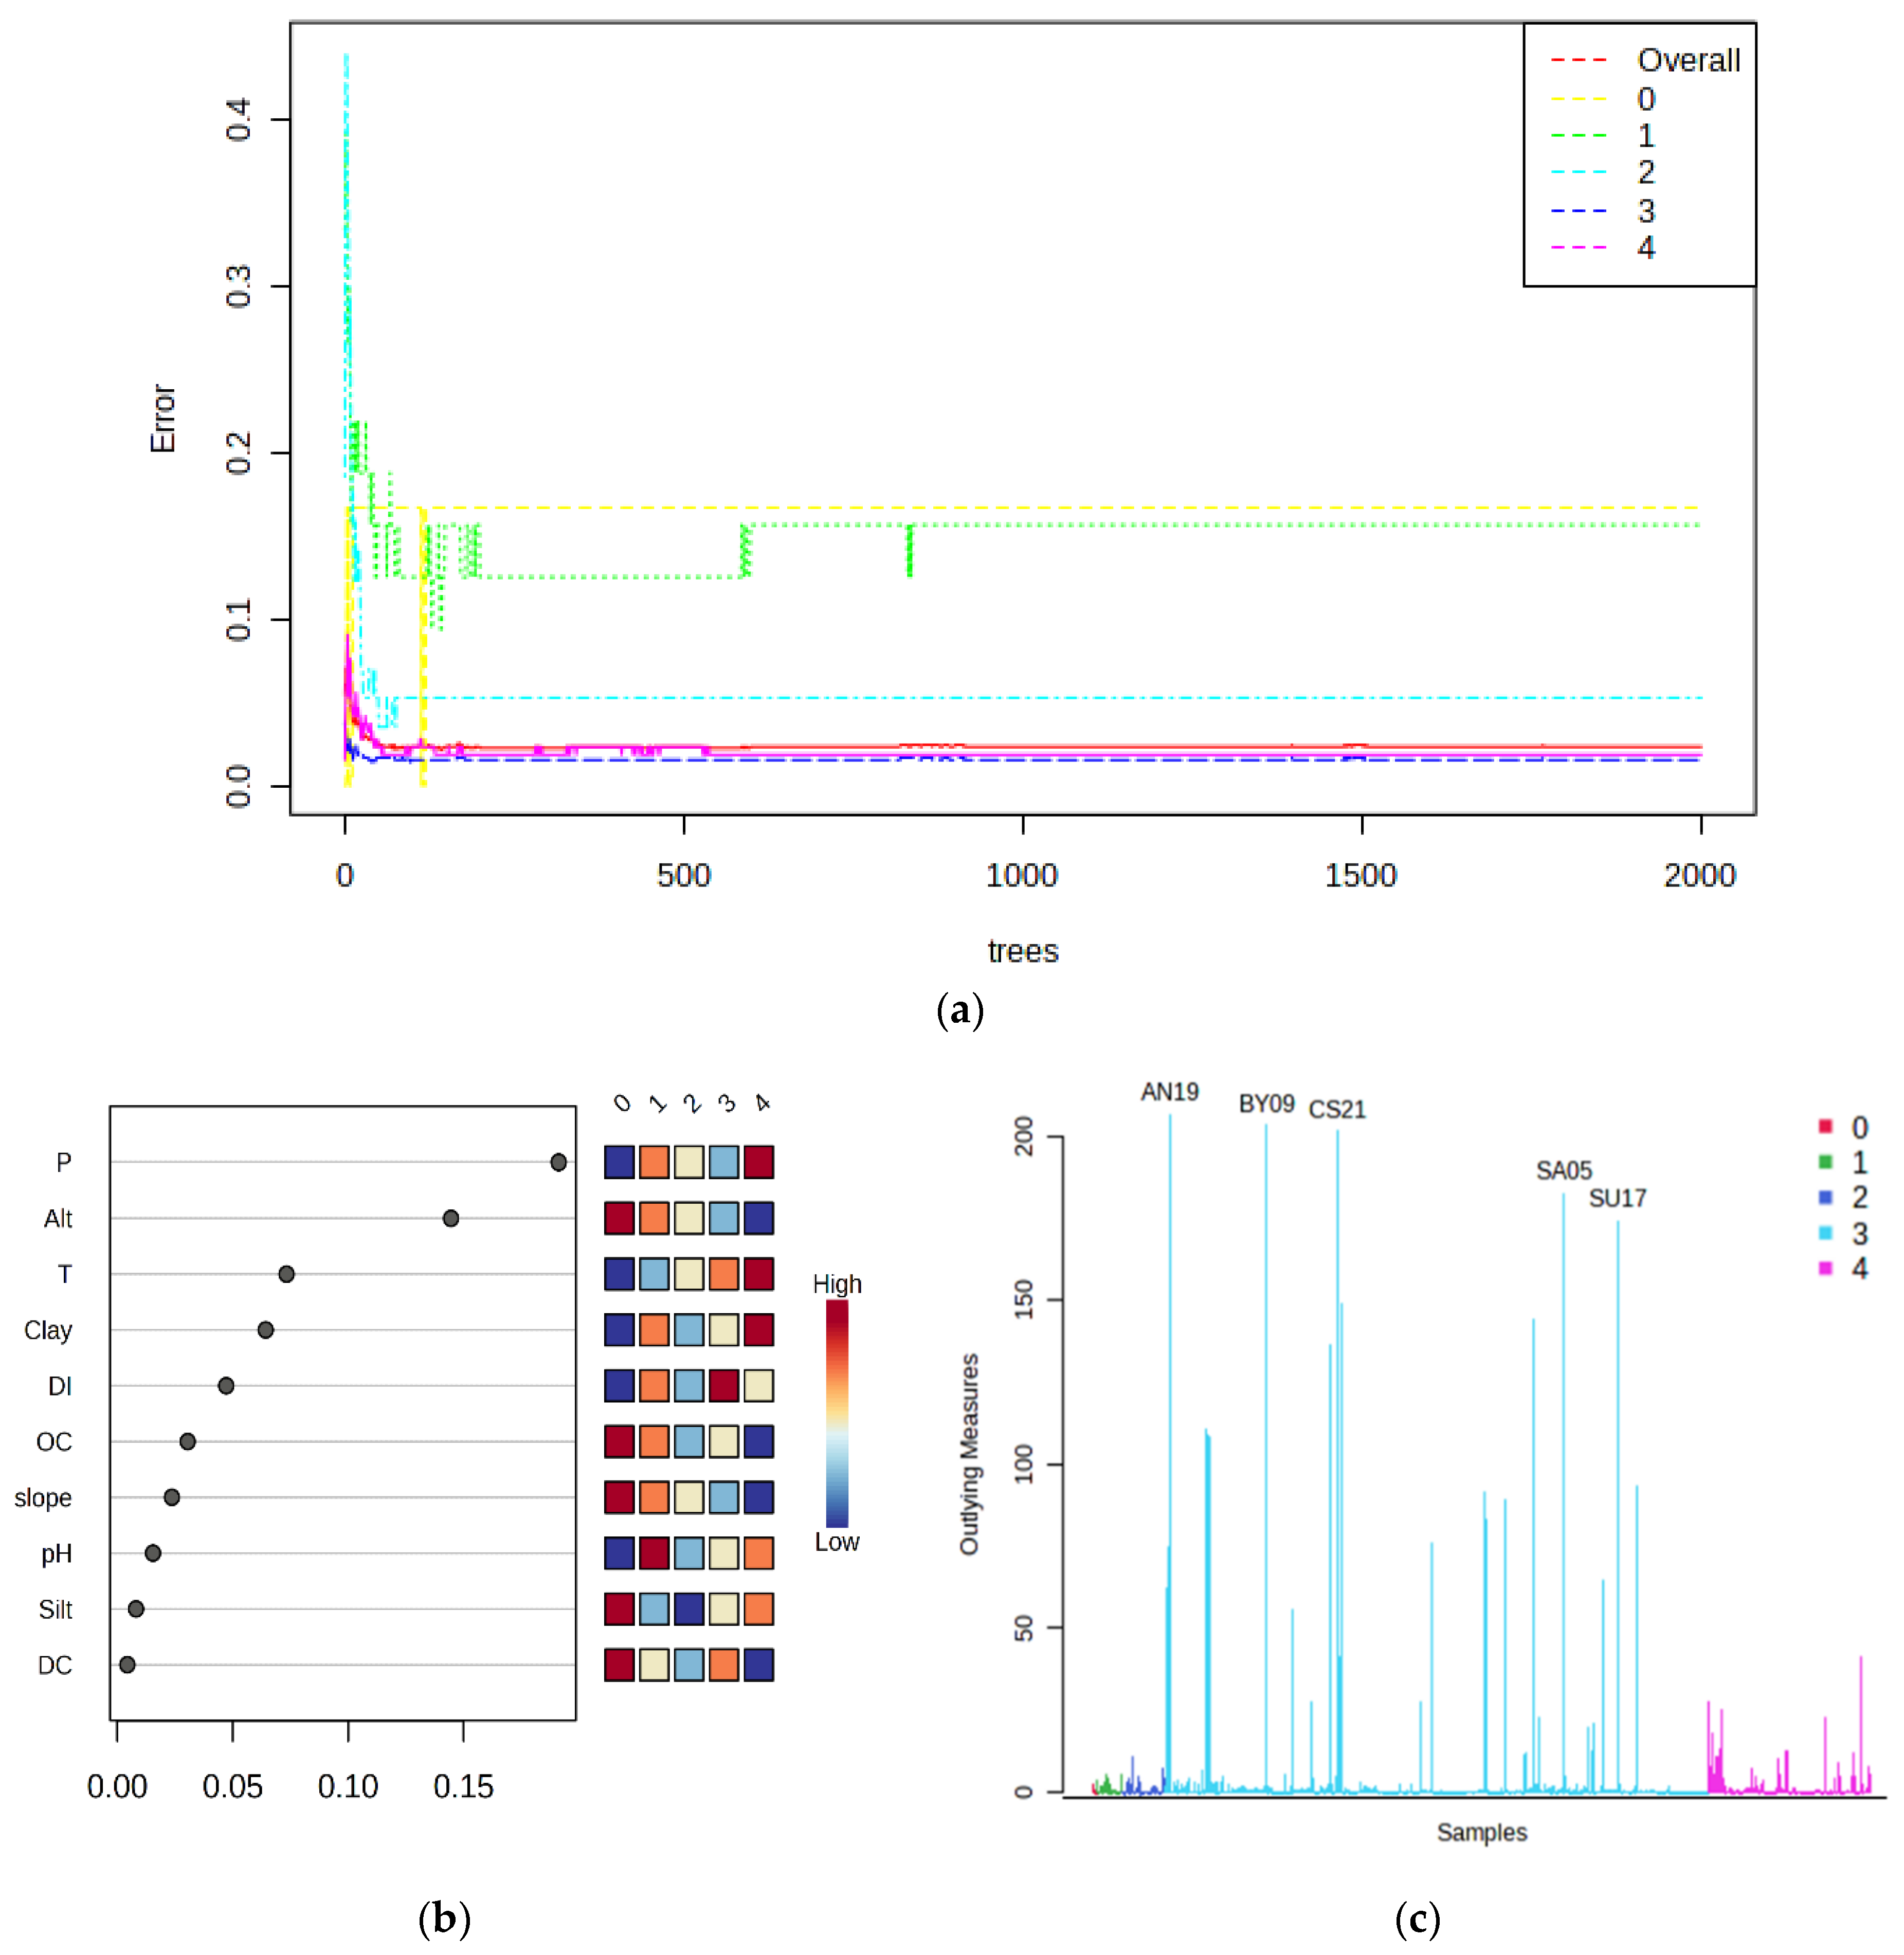
3.7. Classifier Performance of Random Forest

The analysis of Random Forest Classification Performance shows that the model has an out-of-bag (OOB) error rate of 0.023, which is relatively low (Table 5). OOB error rate is a metric used to evaluate the performance of Random Forest models. It measures the error rate of the model on the data that were not used during training (out-of-bag data). A low OOB error rate indicates that the model has good predictive accuracy and is less likely to overfit the data.
Figure 14a displays the cumulative error rates for each of the five classes, with the x-axis representing the number of trees in the model and the y-axis representing the cumulative error rate. Interpreting the graph involves analyzing the trend of the cumulative error rates for each class as the number of trees in the model increases. A decreasing trend indicates that the model is improving in its ability to accurately classify the different susceptibility classes. Ideally, the cumulative error rates decreased with an increasing number of trees in the model (2000) until it leveled off, indicating that the model has reached optimal performance. Figure 14a allows us to compare the performance of the model for different susceptibility classes. If a class has a consistently higher cumulative error rate compared to others, such as class 0 (very low susceptibility) and 1 (low susceptibility), it may suggest that the model is having difficulty classifying those classes accurately in particular. This can be used to identify areas where the model needs improvement, such as collecting more data for that specific class or adjusting the features used in the model.
Figure 14b is an important tool for understanding the factors that influence the disease. The graph ranks the features by the mean decrease in classification accuracy when they are permuted. The higher the mean decrease in classification accuracy, the more important the feature is for predicting susceptibility to Foc TR4 in Musaceae. In this particular figure, the top five significant features are precipitation (0.19), altitude (0.15), temperature (0.07), clay (0.06), and farm density index (0.05).
Precipitation is ranked as the most important feature, with a mean decrease in classification accuracy of 0.19. Classes 0 and 1 are the ones with the least influence of this variable, and classes 3 and 4 are the ones with the greatest influence of precipitation, similar to the behavior of temperature in those classes. Otherwise, the influence of altitude is greater in classes 0 and 1 and less in the last classes of susceptibility. This suggests that precipitation, altitude, and temperature have the greatest influence on the susceptibility of Musaceae to Foc TR4, and changes in precipitation levels can significantly affect disease susceptibility. Figure 14c shows the outlier measures of all samples for the given parameters.

4. Discussion

Regarding the climatic variables analyzed, it becomes evident that most of the Colombian territory presents a very high assessment of susceptibility to the pathogen, with around 80% of the total land, followed by land with high susceptibility located in the vicinity of the eastern, central, and western cordilleras and inter-Andean valleys and, finally, areas of low or very low susceptibility that correspond to the highest lands of the mountains, above 2000 masl. In the latter case, these areas with less susceptibility are colder and have less favorable conditions for the pathogen and its characteristics associated with greater pathogenicity in warm tropical areas [13], as well as because these cold climate regions have fewer Musaceae production areas [58,59] which represent the exclusive host of this pathogen in terms of productive systems [14].
The regions that have a very high susceptibility classification correspond mostly to climates according to the Holdridge classification [36] as warm humid, warm very humid, and warm rainy, while the areas with high susceptibility correspond to climates with less precipitation, indicating as hot dry, very dry, and arid. Finally, the regions classified as low susceptibility due to the effect of the climatic condition correspond to cold climate regions with classifications of temperate (very humid, humid, and rainy) and cold (very dry, dry, humid, and very humid). The areas of very high and high susceptibility correspond in the same way to areas of high precipitation, which represent a factor for the dispersion of the pathogen [60,61] and for the generation of conditions of excess soil humidity that are favorable for its higher incidence on the crop [62,63].
On the other hand, regarding the edaphic factors, it becomes evident that most of the Colombian territory is classified as high risk (around 90% of the total land), followed by small proportions of high-risk areas located in the Inter-Andean Valleys, foothills plains, and regions of the Colombian Orinoquía and Amazonas. Finally, a few areas of medium risk correspond to savannah soils in the Orinoquía. This classification of areas of high and very high susceptibility is due to the predominance of soils with acidic pH, low organic matter content, and low to medium natural fertility of the soils of the Colombian in the case of Orinoquía [64]. In the Andean zone, the soils are characterized by having acidic pH, low P, Ca, S, and Mg contents, and medium K and B, which tend to nutritionally affect banana or plantain crops [65]. Likewise, soils in the Caribbean region present acidic to strongly acidic pH conditions, salinity problems, low to medium natural fertility, as well as low cation exchange capacity [66]. In the case of the Urabá region, which has the largest export banana production area in the country, they generally have acidic pH soils, with low P and Ca content, low natural fertility, low cation exchange capacity, and low values of organic matter [67]. In this way, these studies of soils from different regions of production of banana and plantain have edaphic factors predisposing to Foc TR4 based on chemical properties of the soil that have been indicated for this pathogen in different productive systems of Musaceae in the world [21,62,68,69,70].
The areas classified as high and very high susceptibility to Foc TR4 correspond to soils that have drainage limitations, compaction in the superficial layers of the soil, and high clay contents that promote water saturation in the soil profile [71] which are favorable for the pathogen [60,62,72] and hinder the development of banana and plantain crops [73,74,75]. On the other hand, the areas classified as medium susceptibility are well-drained soils, with predominantly sandy textures with better soil drainage conditions [64].
The new configuration of zones with different degrees of susceptibility to Foc TR4 when crossing the climate and soil maps generates a smaller proportion of areas with very high susceptibility made up of the Orinoquía and Amazon regions to the south of the country, as well as the regions of the entire coast of the Pacific Ocean and certain regions of inter-Andean zones towards the north of the country. The areas around the three Colombian mountain ranges represent, in general terms, high susceptibility zones, while the highest parts of these mountainous regions represent low susceptibility. It is necessary to highlight that the current areas with confirmation of the pathogen are located in the northern part of the country in the Caribbean region (departments of La Guajira and Magdalena), which on this map represent areas of high susceptibility; however, the areas of influence of these departments also have banana production systems (Cesar, Sucre, Córdoba, and Antioquia departments) and plantain production systems (Atlántico, Bolívar, Sucre, Córdoba, Cesar, Antioquia, and Chocó), which represents a significant risk to prevent the spread of the pathogen and reinforce the containment, biosecurity, and integrated management measures of the pathogen in those areas present and, therefore, reinforce the exclusion measures in absent areas.
Figure 11a shows the map that includes the climate x soil interaction and the density function of areas cultivated with bananas and plantains in Colombia, which generates a segmentation of all the formulated categories (from very high to very low susceptibility) of the Musaceae production farms about Foc TR4. In this way, the southern region of the country represented by the Orinoquía and the Amazon begins to have a low and medium susceptibility because in these regions the production of bananas or plantains is more limited in terms of their areas and representativeness in those territories. This contrasts with the previous categories of climate and soil in those same regions that classified them as having very high susceptibility. In this sense, the importance of including the Musaceae-producing areas within the susceptibility index of production farms is observed, which differentiates it from the previous categories of land susceptibility which did not take banana or plantain cropping systems into account.
On the other hand, in the categories of very high and high risk, the entire coast of the Pacific Ocean persists, which grows both traditional bananas and plantains, and includes the region of the foothills in which plantains predominate, regions of the inter-Andean valleys that grow traditional bananas and plantains, and the entire production area of the Colombian Caribbean Coast where export bananas, export plantains, and traditional bananas are grown. Finally, the Urabá region belonging to the department of Antioquia, which represents the area with the highest production of banana exports and which up to now is free of the Foc TR4 pathogen, has a very high susceptibility classification. In this last case, the factors inherent to the climate (rainfall regime and susceptibility to flooding), as well as edaphic (soils with physical and chemical properties favorable to the pathogen), represent criteria to be taken into account for the banana production sector in this region to reinforce exclusion and biosecurity measures on farms but, additionally, manage soils oriented towards suppression and generate less favorable conditions for the pathogen and better ones for the crop. In this sense, the conditioning of soil chemical variables (pH, organic matter, and Ca and P content) [61,69,72,76], improvements in soil drainage and compaction, and the incorporation of beneficial microorganisms and biological controllers of Foc R4T are strategies within integrated management that have been studied for Foc TR4 and R1 in different productive systems of Musaceae [25,60,63,75,77,78].
According to the results obtained in the exploratory analysis, the PLS-DA turned out to be a powerful statistical technique that can identify the relationships between the predictor variables (in this case, slope, height, organic carbon, precipitation, and farm density index) and the response variable (susceptibility to Foc TR4). The results suggest that these variables are highly correlated with disease incidence and can be used to predict susceptibility levels with a high degree of accuracy.
The inclusion of these variables in management strategies can help to reduce the impact of Foc TR4 on Musaceae production in Colombia. For example, farms located in areas with higher slopes and elevations may be less susceptible to disease and may require targeted management strategies to control disease spread [15,24]. Similarly, farms with low organic carbon levels or high precipitation may require different management strategies to reduce disease susceptibility [79].
The classification of five levels of susceptibility to Foc TR4 in Musaceae is a challenging task due to the complexity and variability of the data. However, the Random Forest algorithm was able to classify the data with high accuracy, as evidenced by the low OOB error rate. This indicates that the model has learned to identify the key features and patterns that distinguish the different levels of susceptibility. The analysis of Random Forest classification performance provides valuable insights into the effectiveness of the model and can be used to further refine and improve the classification of susceptibility levels in Musaceae.
Overall, the significant features identified by Random Forest for the susceptibility provide a clear picture of the significant features that influence the susceptibility of Musaceae to Foc TR4 in Colombia. This information can be used to develop targeted management strategies that focus on controlling these specific factors to reduce the incidence and spread of the disease.
There is a growing body of scientific literature on the implementation of supervised methods and machine-learning algorithms to solve problems related to disease incidence in Musaceae in Latin America [52,75,80,81]. Numerous studies have applied these methods to identify risk factors [15,82,83], but predicting the susceptibility of Musaceae to Fusarium wilt is still a pending task.
Many of these studies have shown the efficacy of supervised methods such as partial least squares discriminant analysis (PLS-DA) [52,84,85,86] and machine learning algorithms such as Random Forest [87,88,89,90] in identifying more significant environmental variables and predicting susceptibility levels with a high degree of accuracy.
However, it is important to note that the application of these methods is still relatively new, and more research is needed to fully understand their potential and limitations. For example, there may be other variables or factors contributing to disease incidence that have not yet been identified or included in the analyses. Additionally, implementing these methods requires access to high-quality data and expertise in statistical analysis and machine learning. In many cases, this can be a barrier to its widespread use.

5. Conclusions

The study demonstrates that the agro-environmental conditions in Colombian Musaceae lands create a favorable environment for the establishment and spread of Foc TR4. Factors such as precipitation, temperature, soil characteristics, and farming conditions play crucial roles in influencing disease dynamics. This pioneering article sheds light on the critical issue of understanding the susceptibility of Colombian Musaceae lands to the devastating pathogen and provides valuable insight into the potential impact of Foc TR4 on the banana industry in Colombia.
In conclusion, addressing the susceptibility of Colombian Musaceae lands to Foc TR4 requires a transdisciplinary and holistic approach. The findings presented in this paper provide a foundation for further research and contribute to the collective efforts aimed at safeguarding the Musaceae in Colombia. By implementing robust biosecurity measures, adopting sustainable agricultural practices, and fostering collaboration between stakeholders, we can strive to minimize the impact of this deadly foe and ensure the long-term resilience of Musaceae production in Colombia and other producing countries from Latin America and the Caribbean.

Author Contributions

Conceptualization, G.R.-Y., B.O.O., O.S.-E. and M.B.-V.; methodology, G.R.-Y., B.O.O., O.S.-E., A.G.-U., M.S.-S. and M.B.-V.; software, G.R.-Y., O.S.-E. and B.O.O.; validation, G.R.-Y., B.O.O., O.S.-E., A.G.-U., M.S.-S. and M.B.-V.; formal analysis, G.R.-Y., B.O.O., O.S.-E., M.S.-S. and M.B.-V.; investigation, G.R.-Y., B.O.O., O.S.-E., A.G.-U., M.S.-S. and M.B.-V.; resources, G.R.-Y., B.O.O., O.S.-E., M.S.-S. and M.B.-V.; data curation, G.R.-Y., B.O.O., O.S.-E., M.S.-S. and M.B.-V.; writing—original draft preparation, G.R.-Y., B.O.O., O.S.-E. and M.B.-V.; writing—review and editing, G.R.-Y., B.O.O., O.S.-E., M.S.-S. and M.B.-V.; visualization, G.R.-Y., B.O.O., O.S.-E., A.G.-U., M.S.-S. and M.B.-V.; supervision, G.R.-Y., B.O.O. and M.B.-V.; project administration, M.B.-V.; funding acquisition, G.R.-Y., B.O.O., M.S.-S. and M.B.-V. All authors have read and agreed to the published version of the manuscript.

Funding

This work was supported by the earmarked fund to Agrosavia from the Colombian Ministry of Agriculture (Grant number 1000734, An update on Musaceas family diseases), the earmarked fund to Agrosavia from the National Plant Protection Organization (ICA-Instituto Colombiano Agropecuario) (Agreement 08, 2020, derived from 021, 2018), and the earmarked fund to Agrosavia and Fontagro: ATN/RF-18761-RG (1002280): Strengthening capacities for the prevention and management of Fusarium wilt in Latin America and the Caribbean.

Data Availability Statement

The data relating to sampling points of farms under quarantine status have privacy restrictions. The climatic, soil, and location data of production areas are found in public databases such as IDEAM, IGAC, and AGRONET, respectively.

Acknowledgments

Special thanks are given to the Colombian Agricultural Institute-ICA for the technical support and sanitary surveillance of the farms under quarantine and financial support, to the Colombian Corporation for Agricultural Research-AGROSAVIA for the technical and financial support, and to the AGROVID group for their collaboration during the visits, samplings carried out, and the provision of field information.

Conflicts of Interest

The authors declare no conflict of interest.

References

  1. Inta, W.; Traiperm, P.; Ruchisansakun, S.; Janssens, S.B.; Viboonjun, U.; Swangpol, S.C. Evolution and Classification of Musaceae Based on Male Floral Morphology. Plants 2023, 12, 1602. [Google Scholar] [CrossRef]
  2. Altendorf, S. La marchitez del banano por Fusarium Raza 4 Tropical: ¿Una creciente amenaza al mercado mundial del banano? La reciente difusión y el posible impacto futuro de esta calamidad en el comercio mundial del banano. In Food Outlook—Biannual Report on Global Food Markets; FAO: Rome, Italy, 2019; pp. 13–21. [Google Scholar]
  3. Izquierdo-García, L.F.; Carmona, S.L.; Zuluaga, P.; Rodríguez, G.; Dita, M.; Betancourt, M.; Soto-Suárez, M. Efficacy of disinfectants against Fusarium oxysporum f. sp. cubense tropical race 4 isolated from La Guajira, Colombia. J. Fungi 2021, 7, 297. [Google Scholar] [CrossRef]
  4. AGRONET. Production Statistics of the Agricultural Sector in Colombia. 2021. Available online: https://www.agronet.gov.co/ (accessed on 29 April 2023).
  5. Maryani, N.; Lombard, L.; Poerba, Y.S.; Subandiyah, S.; Crous, P.W.; Kema, G.H.J. Phylogeny and genetic diversity of the banana Fusarium wilt pathogen Fusarium oxysporum f. sp. cubense in the Indonesian center of origin. Stud. Mycol. 2019, 91, 155–194. [Google Scholar] [CrossRef] [PubMed]
  6. García-Bastidas, F.A.; Quintero-Vargas, J.C.; Ayala-Vasquez, M.; Schermer, T.; Seidl, M.F.; Santos-Paiva, M.; Noguera, A.M.; Aguilera-Galvez, C.; Wittenberg, A.; Hofstede, R.; et al. The first report of Fusarium wilt Tropical Race 4 in Cavendish bananas caused by Fusarium odoratissimum in Colombia. Plant Dis. 2020, 104, 994. [Google Scholar] [CrossRef]
  7. Kema, G.H.; Drenth, A.; Dita, M.; Jansen, K.; Vellema, S.; Stoorvogel, J.J. Fusarium wilt of banana, a recurring threat to global banana production. Front. Plant Sci. 2021, 11, 628888. [Google Scholar] [CrossRef]
  8. ICA. Gestión de riesgos fitosanitarios con enfoque preventivo: Un nuevo abordaje para el sector productivo. In 1° Congreso Bananero del Caribe Colombiano; ICA: Magdalena, Colombia, 2023. [Google Scholar]
  9. Vásquez, M.B.; Gutiérrez, S.L.C.; Yzquierdo, G.A.R.Y.R.; García, L.F.I.; Suárez, M.S.; Correa, J.C.G.; Henao, S.Z.; Ulloa, A.J.G.; Cruz, A.P.Z.; Córdoba, J.H.P.; et al. Uso y control de calidad de desinfectantes en esquemas de bioseguridad, para la prevención y contención de la marchitez por Fusarium Raza 4 Tropical. In Corporación Colombiana de Investigación Agropecuaria-AGROSAVIA; AGROSAVIA: Mosquera, Colombia, 2022; 71p. [Google Scholar] [CrossRef]
  10. Zheng, S.J.; García-Bastidas, F.A.; Li, X.; Zeng, L.; Bai, T.; Xu, S.; Kema, G.H. New geographical insights of the latest expansion of Fusarium oxysporum f. sp. cubense tropical race 4 into the greater Mekong subregion. Front. Plant Sci. 2018, 9, 457. [Google Scholar] [CrossRef] [Green Version]
  11. Staver, C.; Pemsl, D.E.; Scheerer, L.; Perez Vicente, L.; Dita, M. Ex ante assessment of returns on research investments to address the impact of Fusarium wilt tropical race 4 on global banana production. Front. Plant Sci. 2020, 11, 844. [Google Scholar] [CrossRef]
  12. Li, C.Y.; Deng, G.M.; Yang, J.; Viljoen, A.; Jin, Y.; Kuang, R.B.; Yi, G.J. Transcriptome profiling of resistant and susceptible Cavendish banana roots following inoculation with Fusarium oxysporum f. sp. cubense tropical race 4. BMC Genom. 2012, 13, 374. [Google Scholar] [CrossRef] [Green Version]
  13. García-Bastidas, F.A.; Van der Veen, A.J.; Nakasato-Tagami, G.; Meijer, H.J.; Arango-Isaza, R.E.; Kema, G.H. An improved phenotyping protocol for Panama disease in banana. Front. Plant Sci. 2019, 10, 1006. [Google Scholar] [CrossRef] [Green Version]
  14. Dita, M.; Barquero, M.; Heck, D.; Mizubuti, E.S.; Staver, C.P. Fusarium wilt of banana: Current knowledge on epidemiology and research needs toward sustainable disease management. Front. Plant Sci. 2018, 9, 1468. [Google Scholar] [CrossRef] [Green Version]
  15. Olivares, B.O.; Rey, J.C.; Lobo, D.; Navas-Cortés, J.A.; Gómez, J.A.; Landa, B.B. Fusarium wilt of bananas: A review of agro-environmental factors in the Venezuelan production system affecting its development. Agronomy 2021, 11, 986. [Google Scholar] [CrossRef]
  16. Segura, R.A.; Stoorvogel, J.J.; García-Bastidas, F.; Salacinas-Niez, M.; Kema, G.H.J.; Sandoval, J.A. Evaluating the potential of soil management to reduce the effect of Fusarium oxysporum f. sp. cubense in banana (Musa AAA). Eur. J. Plant Pathol. 2021, 160, 441–455. [Google Scholar] [CrossRef]
  17. Segura, M.R.A.; Stoorvogel, J.J.; Blanco, R.F.A.; Sandoval, F.J.A. A medium-term field experiment to study the effect of managing soil chemical properties on Fusarium wilt in banana (Musa AAA). J. Fungi 2021, 7, 261. [Google Scholar] [CrossRef]
  18. Dita, M.; Teixeira, L.A.J.; O’Neill, W.; Pattison, A.B.; Weinert, M.P.; Li, C.Y.; Zheng, S.J.; Staver, C.; Thangavelu, R.; Viljoen, A. Current state of Fusarium wilt of banana in the subtropics. Acta Hortic. 2020, 1272, 45–56. [Google Scholar] [CrossRef]
  19. Cannon, S.; Kay, W.; Kilaru, S.; Schuster, M.; Gurr, S.J.; Steinberg, G. Multi-site fungicides suppress banana Panama disease, caused by Fusarium oxysporum f. sp. cubense Tropical Race 4. PLoS Pathog. 2022, 18, e1010860. [Google Scholar] [CrossRef]
  20. Olivares, B. Banana Production in Venezuela: Novel Solutions to Productivity and Plant Health; Springer Nature: Berlin/Heidelberg, Germany, 2023; p. 180. [Google Scholar]
  21. Segura, R.A.; Stoorvogel, J.J.; Sandoval, J.A. The effect of soil properties on the relation between soil management and Fusarium wilt expression in Gros Michel bananas. Plant Soil 2022, 471, 89–100. [Google Scholar] [CrossRef]
  22. Li, Y.; Jiang, S.; Jiang, J.; Gao, C.; Qi, X.; Zhang, L.; Sun, S.; Dai, Y.; Fan, X. Synchronized Efficacy and Mechanism of Alkaline Fertilizer and Biocontrol Fungi for Fusarium oxysporum f. sp. cubense Tropical Race 4. J. Fungi 2022, 8, 261. [Google Scholar] [CrossRef]
  23. Olivares, B.; Paredes, F.; Rey, J.; Lobo, D.; Galvis-Causil, S. The relationship between the normalized difference vegetation index, rainfall, and potential evapotranspiration in a banana plantation of Venezuela. SAINS TANAH-J. Soil Sci. Agroclimatol. 2021, 18, 58–64. [Google Scholar] [CrossRef]
  24. Olivares, B. Machine Learning and the New Sustainable Agriculture: Applications in Banana Production Systems of Venezuela. Agric. Res. Updates 2022, 42, 133–157. [Google Scholar]
  25. Martínez, G.; Olivares, B.O.; Rey, J.C.; Rojas, J.; Cardenas, J.; Muentes, C.; Dawson, C. The Advance of Fusarium Wilt Tropical Race 4 in Musaceae of Latin America and the Caribbean: Current Situation. Pathogens 2023, 12, 277. [Google Scholar] [CrossRef]
  26. Pitti, J.; Olivares, B.O.; Montenegro, E.; Miller, L.; Ñango, Y. The role of agriculture in the Changuinola district: A case of applied economics in Panama. Trop. Subtrop. Agroecosyst. 2021, 25, 017. [Google Scholar] [CrossRef]
  27. Montenegro, E.J.; Pitti-Rodríguez, J.E.; Olivares-Campos, B.O. Identification of the main subsistence crops of Teribe: A case study based on multivariate techniques. Idesia 2021, 39, 83–94. [Google Scholar] [CrossRef]
  28. Olivares, B.; Pitti, J.; Montenegro, E. Socioeconomic characterization of Bocas del Toro in Panama: An application of multivariate techniques. Rev. Bras. Gest. Desenvolv. Reg. 2020, 16, 59–71. [Google Scholar]
  29. Zhang, X.; Huang, H.; Wu, B.; Xie, J.; Viljoen, A.; Wang, W.; Mostert, D.; Xie, Y.; Fu, G.; Xiang, D.; et al. The M35 Metalloprotease Effector FocM35_1 Is Required for Full Virulence of Fusarium oxysporum f. sp. cubense Tropical Race 4. Pathogens 2021, 10, 670. [Google Scholar] [CrossRef]
  30. Magdama, F.; Monserrate-Maggi, L.; Serrano, L.; Sosa, D.; Geiser, D.M.; Jiménez-Gasco, M.D.M. Comparative analysis uncovers the limitations of current molecular detection methods for Fusarium oxysporum f. sp. cubense race 4 strains. PLoS ONE 2019, 14, e0222727. [Google Scholar] [CrossRef] [Green Version]
  31. Dale, J.; James, A.; Paul, J.Y.; Khanna, H.; Smith, M.; Peraza-Echeverria, S.; Harding, R. Transgenic Cavendish bananas with resistance to Fusarium wilt tropical race 4. Nat. Commun. 2017, 8, 1496. [Google Scholar] [CrossRef] [Green Version]
  32. Mintoff, S.J.L.; Nguyen, T.V.; Kelly, C.; Cullen, S.; Hearnden, M.; Williams, R.; Daniells, J.W.; Tran-Nguyen, L.T.T. Banana Cultivar Field Screening for Resistance to Fusarium oxysporum f. sp. cubense Tropical Race 4 in the Northern Territory. J. Fungi 2021, 7, 627. [Google Scholar] [CrossRef]
  33. Warman, N.M.; Aitken, E.A. The movement of Fusarium oxysporum f. sp. cubense (sub-tropical race 4) in susceptible cultivars of banana. Front. Plant Sci. 2018, 9, 1748. [Google Scholar] [CrossRef] [Green Version]
  34. Drenth, A.; Kema, G. The vulnerability of bananas to globally emerging disease threats. Phytopathology 2021, 111, 2146–2161. [Google Scholar] [CrossRef]
  35. USGS–EROS. 2018 USGS EROS Archive—Digital Elevation—Global 30 Arc-Second Elevation (GTOPO30). U.S. Geological Survey. Earth Resources Observation and Science Center. Available online: https://www.usgs.gov/centers/eros/science/usgs-eros-archive-digital-elevation-global-30-arc-second-elevation-gtopo30 (accessed on 16 April 2023).
  36. IDEAM. Escenario Precipitación para Colombia (mm) Periodo 1976–2005. Instituto de Hidrología, Meteorología y Estudios Ambientales. En: Sistema de Información Ambiental de Colombia (SIAC), Catálogo de Mapas. 2012. Available online: http://bart.ideam.gov.co/cneideam/Capasgeo/Escenario_Precipitacion_1976_2005.zip (accessed on 29 April 2023).
  37. Fick, S.E.; Hijmans, R.J. WorldClim 2: New 1 km Spatial Resolution Climate Surfaces for Global Land Areas. Int. J. Climatol. 2017, 37, 4302–4315. Available online: https://biogeo.ucdavis.edu/data/worldclim/v2.1/base/wc2.1_30s_tavg.zip (accessed on 15 April 2023). [CrossRef]
  38. FAO. Harmonized World Soil Data Base. HWSD Raster. 2018. Available online: https://www.fao.org/soils-portal/soil-survey/mapas-historicos-de-suelos-y-bases-de-datos/base-de-datos-armonizada-de-los-suelos-del-mundo-v12/es/ (accessed on 28 April 2023).
  39. Betancourt Vásquez, M.; Cárdenas López, J.; Rodríguez Yzquierdo, G.A. Guía Para Importar a Colombia Germoplasma y Material de Propagación de Plátano y Banano en el Marco de la Emergencia Sanitaria por Foc R4T en Colombia; AGROSAVIA: Mosquera, Colombia, 2021; pp. 13–20. [Google Scholar] [CrossRef]
  40. Hughes, R.T. Expert judgment as an estimating method. Inf. Softw. Technol. 1996, 38, 67–75. [Google Scholar] [CrossRef]
  41. Van Leeuwen, J.; Creamer, R.; Cluzeau, D.; Debeljak, M.; Gaffi, F.; Henriksen, C.; Kuzmanovski, V.; Menta, C.; Pérès, G.; Picaud, C.; et al. Modeling of soil functions for assessing soil quality: Soil biodiversity and habitat provisioning. Front. Environm. Sci. 2019, 17, 113. [Google Scholar] [CrossRef]
  42. Procter, A.; McDaniels, T.; Vignola, R. Using expert judgments to inform economic evaluation of ecosystem-based adaptation decisions: Watershed management for enhancing water supply for Tegucigalpa, Honduras. Environ. Syst. Decis. 2017, 37, 410–422. [Google Scholar] [CrossRef]
  43. AbdelRahman, M.; Metwaly, M.; Afifi, A.; D’Antonio, P.; Scopa, A. Assessment of soil fertility status under soil degradation rate using geomatics in West Nile Delta. Land 2022, 11, 1256. [Google Scholar] [CrossRef]
  44. Sonneveld, B. Formalizing expert judgements in land degadation assessment: A case of study for Ethiopia. Land Degrad. Dev. 2023, 14, 347–361. [Google Scholar] [CrossRef]
  45. Falcón-Acosta, M.; Vargas-Rodríguez, H.; Torres-Menéndez, F.; Herrera-Blen, L. Evaluación del conflicto de uso agrícola de las tierras a partir de su aptitud física como contribución a la explotación sostenible. Cultiv. Trop. 2014, 35, 13–18. [Google Scholar]
  46. Mattey-Trigueros, D.; Navarro-Picado, J.; Obando-Rodríguez, P.; Fonseca-Sanchez, A.; Nuñez-Solis, C. Caracterización de la cobertura vegetal dentro de la franja de protección del río Copey, Jacó, Puntarenas, Costa Rica. Rev. Geográfica América Cent. 2017, 58, 275–294. [Google Scholar] [CrossRef] [Green Version]
  47. QGIS Development Team. QGIS Geographic Information System. Open-Source Geospatial Foundation Project. Available online: http://qgis.osgeo.org (accessed on 29 April 2023).
  48. R Core Team. R A Language and Environment for Statistical Computing; R Foundation for Statistical Computing: Vienna, Austria, 2023. [Google Scholar]
  49. Chong, J.; Wishart, D.S.; Xia, J. Using MetaboAnalyst 4.0 for comprehensive and integrative metabolomics data analysis. Curr. Protoc. Bioinform. 2019, 68, e86. [Google Scholar] [CrossRef]
  50. Yang, B.; Zhang, C.; Cheng, S.; Li, G.; Griebel, J.; Neuhaus, J. Novel Metabolic Signatures of Prostate Cancer Revealed by 1H-NMR Metabolomics of Urine. Diagnostics 2021, 11, 149. [Google Scholar] [CrossRef]
  51. Szymańska, E.; Saccenti, E.; Smilde, A.K.; Westerhuis, J.A. Double-check: Validation of diagnostic statistics for PLS-DA models in metabolomics studies. Metabolomics 2012, 8, 3–16. [Google Scholar] [CrossRef] [Green Version]
  52. Olivares, B.O.; Rey, J.C.; Perichi, G.; Lobo, D. Relationship of Microbial Activity with Soil Properties in Banana Plantations in Venezuela. Sustainability 2022, 14, 13531. [Google Scholar] [CrossRef]
  53. Mevik, B.H.; Wehrens, R. The pls package: Principal component and partial least squares regression in R. J. Stat Softw 2007, 18, 1–23. [Google Scholar] [CrossRef] [Green Version]
  54. Kuhn, M. Caret: Classification and Regression Training, ascl-1505; Astrophysics Source Code Library: Houghton, MI, USA, 2015. Available online: http://topepo.github.io/caret/train-models-by-tag.html(accessed on 29 April 2023).
  55. Liaw, A.; Wiener, M. Classification and regression by Random Forest. R News 2002, 2, 18–22. [Google Scholar]
  56. Olivares, B.O.; Vega, A.; Rueda Calderón, M.A.; Montenegro-Gracia, E.; Araya-Almán, M.; Marys, E. Prediction of Banana Production Using Epidemiological Parameters of Black Sigatoka: An Application with Random Forest. Sustainability 2022, 14, 14123. [Google Scholar] [CrossRef]
  57. Olivares, B.O.; Vega, A.; Calderón, M.A.R.; Rey, J.C.; Lobo, D.; Gómez, J.A.; Landa, B.B. Identification of Soil Properties Associated with the Incidence of Banana Wilt Using Supervised Methods. Plants 2022, 11, 2070. [Google Scholar] [CrossRef]
  58. Rodríguez, G.; Becerra, J.; Miranda, T.; Alzate, S.; Sandoval, H. Caracterización de tipologías de productores de plátano (Musa AAB) en los Llanos Orientales de Colombia. Rev. Temas Agrar. 2019, 24, 129–138. [Google Scholar] [CrossRef]
  59. Rodríguez, G.; Becerra, J.; Betancourt, M.; Alzate, S.; Miranda, T.; Pisco, C.; Sandoval, H. Modelo productivo de plátano para los Llanos Orientales. In Corporación Colombiana de Investigación Agropecuaria-AGROSAVIA; Agrosavia: Mosquera, Colombia, 2018; 216p. [Google Scholar] [CrossRef]
  60. Wang, Q.; Zhou, L.; Jin, H.; Cong, B.; Yang, H.; Wang, S. Investigating the responses of microbial communities to banana Fusarium wilt in suppressive and conductive soils based on soil particle size differentiation. Agronomy 2022, 12, 229. [Google Scholar] [CrossRef]
  61. Yang, J.; Ren, X.; Liu, M.; Fan, P.; Ruan, Y.; Zhao, Y.; Wang, B.; Li, R. Suppressing soil-borne Fusarium pathogens of bananas by planting different cultivars of pineapples, with comparisons of the resulting bacterial and fungal communities. Appl. Soil Ecol. 2022, 169, 104211. [Google Scholar] [CrossRef]
  62. Jamil, F.N.; Hashim, A.M.; Yusof, M.T.; Saidi, N.B. Analysis of soil bacterial communities and physicochemical properties associated with Fusarium wilt disease of banana in Malaysia. Sci. Rep. 2022, 12, 999. [Google Scholar] [CrossRef]
  63. Dror, B.; Amutuhaire, H.; Frenkel, O.; Jurkevitch, E.; Cytryn, E. Identification of Bacterial Populations and Functional Mechanisms Potentially Involved in Biochar-Facilitated Antagonism of the Soilborne Pathogen Fusarium Oxysporum. Phytobiomes J. 2022, 6, 139–150. [Google Scholar] [CrossRef]
  64. Delgado, H.; Rangel, J.; Silva, A. Caracterización de la fertilidad química de los suelos en sistemas productivos de la altillanura plana, Meta, Colombia. Luna Azul. 2018, 46, 54–69. [Google Scholar] [CrossRef] [Green Version]
  65. García, S.; Bautista, L.; Bolaños, M. Diagnóstico de la fertilidad de los suelos de cuatro municipios de Cundinamarca (Colombia) para la producción de plátano. Actual. Divulg. Científica 2019, 22, e1192. [Google Scholar] [CrossRef] [Green Version]
  66. Combatt-Caballero, E.; Novoa-Yánez, R.; Barrera-Violeth, J.L. Caracterización química de macroelementos en suelos cultivados con plátano (Musa AAB Simmonds) en el departamento de Córdoba, Colombia. Acta Agronómica 2012, 61, 166–176. [Google Scholar]
  67. González, R.; Alvares, E.; Castañeda, D. Evaluación de la calidad química del suelo en agroecosistemas cacaoteros de la subregión del Nordeste y Urabá Antioqueño. Rev. Colomb. Investig. Ind. 2018, 5, 41–52. [Google Scholar] [CrossRef]
  68. Haddad, F.; Rocha, L.; Soares, A.; Martins, I.; Teixeira, L.; Staver, C.; Dita, M. Management of Fusarium wilt of bananas in Minas Gerais, Brazil. Acta Hortic. 2018, 1196, 137–146. [Google Scholar] [CrossRef]
  69. Nowembabazi, A.; Tautaya, G.; Tinzaara, W.; Karamura, E. Effect of integrated potassium nutrition on Fusarium wilt tolerance in apple banana. Afr. J. Plant Sci. 2021, 15, 257–265. [Google Scholar]
  70. Teixeira, L.; Heck, D.; Nomura, E.; Vieira, H.; Dita, M. Soil attributes, plant nutrition, and Fusarium wilt of banana in São Paulo, Brazil. Trop. Plant Pathol. 2021, 46, 443–454. [Google Scholar] [CrossRef]
  71. Sanchez, J.; Rubiano, Y. Procesos específicos de formación en Andisoles, Alfisoles y Ultisoles en Colombia. Rev. EIA 2015, 12, 85–97. [Google Scholar]
  72. Teixeira, L.; Nomura, E.; Damatto, E.; Vieira, H.; Staver, C.; Dita, M. Effectiveness of soil management practices on Fusarium wilt of banana in the Ribeira Valley, Brazil. Trop. Plant Pathol. 2022, 47, 411–420. [Google Scholar] [CrossRef]
  73. González, H.; Gonzalez, A.; Pineda, M.; Escalante, H.; Rodríguez, G.; Soto, A. Edaphic microbiota in banana plots with contrasting vigor and its relationship with soil properties. Bioagro 2021, 33, 143–148. [Google Scholar]
  74. González, H.; González, A.; Rodríguez, G.; León, M.; Betancourt, M. Vigor in banana plants (Musa AAB cv. Hartón) and its relationship with physical, chemical and biological characteristics of the soil. Agron. Costarric. 2021, 45, 115–124. [Google Scholar]
  75. Olivares, B.; Calero, J.; Rey, J.C.; Lobo, D.; Landa, B.; Gómez, J. Correlation of banana productivity levels and soil morphological properties using regularized optimal scaling regression. Catena 2022, 208, 105718. [Google Scholar] [CrossRef]
  76. Olivares, B.O.; Araya-Alman, M.; Acevedo-Opazo, C.; Rey, J.C.; Cañete-Salinas, P.; Kurina, F.G.; Balzarini, M.; Lobo, D.; Navas-Cortés, J.A.; Landa, B.B.; et al. Relationship Between Soil Properties and Banana Productivity in the Two Main Cultivation Areas in Venezuela. J. Soil Sci. Plant Nutr. 2020, 20, 2512–2524. [Google Scholar] [CrossRef]
  77. Gazolla, C.; Britto, B.; Freitas, J.; Beneduzi, A.; Eichelberger, G.; Kayser, L. Soil-plant-microbiota interaction to enhance plant growth. Rev. Bras. Cienc. Solo 2022, 46, e0210098. [Google Scholar] [CrossRef]
  78. Zhu, Z.; Wu, G.; Deng, R.; Hu, X.; Tan, H.; Chen, Y.; Tian, Z.; Li, J. Spatiotemporal biocontrol and rhizosphere microbiome analysis of Fusarium wilt of banana. Commun. Biol. 2023, 6, 27. [Google Scholar] [CrossRef]
  79. Shen, Z.; Xue, C.; Penton, C.R.; Thomashow, L.S.; Zhang, N.; Wang, B.; Ruan, Y.; Li, R.; Shen, Q. Suppression of banana Panama disease induced by soil microbiome reconstruction through an integrated agricultural strategy. Soil Biol. Biochem. 2019, 128, 164–174. [Google Scholar] [CrossRef]
  80. Ye, H.C.; Huang, W.J.; Huang, S.Y.; Cui, B.; Dong, Y.Y.; Guo, A.T.; Ren, Y.; Jin, Y. Identification of banana fusarium wilt using supervised classification algorithms with UAV-based multi-spectral imagery. Int. J. Agric. Biol. 2020, 13, 136–142. [Google Scholar] [CrossRef]
  81. Gomez-Selvaraj, M.; Vergara, A.; Montenegro, F.; Alonso Ruiz, H.; Safari, N.; Raymaekers, D.; Ocimati, W.; Ntamwira, J.; Tits, L.; Omondi, A.B.; et al. Detection of banana plants and their major diseases through aerial images and machine learning methods: A case study in DR Congo and Republic of Benin. ISPRS J. Photogramm. Remote Sens. 2020, 169, 110–124. [Google Scholar] [CrossRef]
  82. Ma, L.; Fu, T.; Blaschke, T.; Li, M.; Tiede, D.; Zhou, Z.; Ma, X.; Chen, D. Evaluation of feature selection methods for object-based land cover mapping of unmanned aerial vehicle imagery using Random Forest and Support Vector Machine classifiers. ISPRS Int. J. Geo-Inf. 2017, 6, 51. [Google Scholar] [CrossRef] [Green Version]
  83. Sangeetha, T.; Lavanya, G.; Jeyabharathi, D.; Rajesh Kumar, T.; Mythili, K. Detection of pest and disease in banana leaf using convolution Random Forest. Test Eng. Manag. 2020, 83, 3727–3735. Available online: https://n9.cl/mevdug (accessed on 24 November 2021).
  84. Ugarte Fajardo, J.; Bayona Andrade, O.; Criollo Bonilla, R.; Cevallos-Cevallos, J.; Mariduena-Zavala, M.; Ochoa Donoso, D.; Vicente Villardon, J.L. Early detection of black Sigatoka in banana leaves using hyperspectral images. Appl. Plant Sci. 2020, 8, e11383. [Google Scholar] [CrossRef]
  85. Chu, X.; Zhang, K.; Liu, H.; Ma, Z.; Wei, H. Early Discrimination of Banana Diseases Based on Two-Dimensional Correlation Spectroscopy (2D-COS) Combined with Partial Least Square Method. In Proceedings of the 2021 3rd International Academic Exchange Conference on Science and Technology Innovation (IAECST), Guangzhou, China, 10–12 December 2021; IEEE: Piscataway, NJ, USA, 2021; pp. 1520–1525. [Google Scholar]
  86. Aeberli, A.; Robson, A.; Phinn, S.; Lamb, D.W.; Johansen, K. A Comparison of Analytical Approaches for the Spectral Discrimination and Characterisation of Mite Infestations on Banana Plants. Remote Sens. 2022, 14, 5467. [Google Scholar] [CrossRef]
  87. Devi, R.D.; Nandhini, S.A.; Hemalatha, R.; Radha, S. IoT enabled efficient detection and classification of plant diseases for agricultural applications. In Proceedings of the 2019 International Conference on Wireless Communications Signal Processing and Networking (WiSPNET), Chennai, India, 21–23 March 2019; IEEE: Piscataway, NJ, USA, 2019; pp. 447–451. [Google Scholar]
  88. Anitha, A. Disease prediction and knowledge extraction in banana crop cultivation using decision tree classifiers. Int. J. Bus. Intell. Data Min. 2022, 20, 107–120. [Google Scholar] [CrossRef]
  89. Zhang, S.; Li, X.; Ba, Y.; Lyu, X.; Zhang, M.; Li, M. Banana Fusarium Wilt Disease Detection by Supervised and Unsupervised Methods from UAV-Based Multispectral Imagery. Remote Sens. 2022, 14, 1231. [Google Scholar] [CrossRef]
  90. Ye, H.; Cui, B.; Huang, S.; Dong, Y.; Huang, W.; Guo, A.; Ren, Y.; Jin, Y. Performance of Support Vector Machines, Artificial Neural Network, and Random Forest for Identifying Banana Fusarium Wilt Using UAV-Based Multi-spectral Imagery. In Proceedings of the 6th China High-Resolution Earth Observation Conference (CHREOC 2019), Changsha, China, 17–19 November 2020; Springer: Singapore, 2020; pp. 261–270. [Google Scholar]
Figure 1. (a) Geographic location of Colombia; Spatial distribution of climate factors and elements: (b) altitude; (c) mean annual precipitation of 1976–2005 (mm/year); (d) mean annual air temperature of 1970–2000 (°C).
Horticulturae 09 00757 g001
Figure 2. Spatial distribution of edaphic elements: (a) pH, (b) soil organic carbon (%), (c) soil drainage (class), (d) soil clay content (%), (e) soil silt content (%), and (f) slope (%).
Horticulturae 09 00757 g002aHorticulturae 09 00757 g002b
Figure 3. Methodological scheme for the determination of the susceptibility index of the farm’s production to the Foc TR4 (SUPFoc).
Horticulturae 09 00757 g003
Figure 4. Function the fit factor according to altitude (FH).
Horticulturae 09 00757 g004
Figure 5. Spatial distribution of the Musaceae production farms density index (iD). In dark blue the approximate line at a density index (iD) = 80.
Horticulturae 09 00757 g005
Figure 6. Function for the adjustment according to the density of Musaceae production farms (FD).
Horticulturae 09 00757 g006
Figure 7. (a) Assessment of the susceptibility of Colombian lands to infection with Foc TR4 due to the effect of climate (Eclimate); (b) Distribution of the classes of susceptibility of the lands due to the effect of the climate (Eclimate) before the infection with Foc TR4 according to the surface (%) that they occupy in each department.
Horticulturae 09 00757 g007aHorticulturae 09 00757 g007b
Figure 8. (a) Assessment of the susceptibility of Colombian lands to infection with Foc TR4 due to the effect of the soil (Esoil); (b) Distribution of land susceptibility classes due to soil effect (Esoil) to infection with Foc TR4 according to the surface (%) they occupy in each department.
Horticulturae 09 00757 g008
Figure 9. (a) Assessment of the susceptibility of Colombian lands to infection with Foc TR4 due to the joint effect of climate and soil (Sclimate–soil); (b) Differences in the assessment of the susceptibility of lands to infection by Foc TR4 due to the effect of the soil (Sclimate–soil) compared to the assessment conferred by the climate alone (Eclimate).
Horticulturae 09 00757 g009
Figure 10. Distribution of the density index of Musaceae production farms (iD).
Horticulturae 09 00757 g010
Figure 11. (a) Classes of susceptibility of Colombian lands to infection with Foc TR4 (SUPFoc); (b) Distribution of the susceptibility classes of the production farms to infection with Foc TR4 (SUPFoc) according to the surface (%) they occupy in each department.
Horticulturae 09 00757 g011aHorticulturae 09 00757 g011b
Figure 12. Results of principal component analysis (PCA) (n = 1029) for dimension reduction: (a) sample scatterplot displays the first two components in each data set in PCA, (b) Loadings plot between the two PCs, (c) PCA biplot between the selected PCs. Foc TR4 susceptibility classes: 0 = very low, 1 = low, 2 = average, 3 = high, 4 = very high.
Horticulturae 09 00757 g012
Figure 13. Results of Partial Least Squares-Discriminant Analysis (PLS-DA) (n = 1029) for distinguishing susceptibility classes. (a) sample scatterplot displays the first two components in each data set in PLS-DA, (b) loading plot weights of each feature selected on the two components of PLS-DA, (c) Important features identified by component 1 and (d) component 2 in PLS-DA. The colored boxes on the right indicate the relative influence of the corresponding variable in each group under study. Foc TR4 susceptibility classes: 0 = very low, 1 = low, 2 = average, 3 = high, 4 = very high.
Horticulturae 09 00757 g013
Figure 14. (a) Cumulative error rates by Random Forest classification (n = 1029) for accuracy assessment of the susceptibility classes obtained by expert criteria. The overall error rate is shown as the red line; the color lines represent the error rates for each class. (b) Significant features identified by Mean decrease accuracy of Random Forest. The colored boxes on the right indicate the relative influence of the corresponding variable in the class under study. Class: 0 (very low), 1 (low), 2 (medium), 3 (high), 4 (very high). (c) Potential outliers are identified by Random Forest, only the top five are labeled (AN = Antioquia; BY = Boyaca; CS = Casanare; SA = Santander and SU = Sucre).
Horticulturae 09 00757 g014
Table 1. Data used for susceptibility modeling.
Data NameSpatial Resolution
(Arc-Seconds)
FormatSource
Annual mean Precipitation30Raster[36] 1
Annual mean temperature30Raster[37] 2
Soil characteristics30Raster[38] 3
Altitude30Raster[35] 4
Location points of farms-Vector
(Point feature)
[39]
Note: 1 IDEAM: Institute of Hydrology, Meteorology, and Environmental Studies Colombia; 2 Downloaded from Worldclim.com; 3 Harmonized World Soil Data Base. Food and Agriculture Organization of the United Nations; 4 Global 30 Arc-Second Elevation. U.S. Geological Survey. Earth Resources Observation and Science Center.
Table 2. Assessment of the climate elements for the conditions of Colombia.
Class and Valuation (Vi)
ElementLow
(1)
Medium
(2)
High
(3)
Very High
(4)
Importance (Ici)
Mean Precipitation (mm/year)<200200–600600–2000>200010
Mean Temperature (°C)<1212–1818.1–25>251
Notes: Each precipitation and temperature range is classified into valuation classes (Vi) from Low (1) to Very High (4) class. ICi: expert-assigned importance for each climate element, as stated in Equation (3).
Table 3. Assessment of soil characteristics for the conditions of Colombia.
Class and Valuation (Vi)
ElementLow
(1)
Medium
(2)
High
(3)
Very High
(4)
Importance (Isi)
pH>7.57.5–6.56.5–5.5<5.515
Organic Carbon (%)>3.683.68–1.841.84–0.92<0.926
Drainage (class) *6 and 753 and 41 and 215
Clay (%)<1515–3030–50>507
Silt (%)<2020–3535–50>507
Land slope (%)>2512–253–12<310
* Drainage classes: 1: Very poorly drained; 2: poorly drained; 3: Imperfectly drained; 4: Moderately well drained; 5: well drained; 6: Somewhat excessively drained; 7: Excessively drained. Notes: Each soil characteristic range is classified into valuation classes (Vi) from Low (1) to Very High (4) class. Isi: expert-assigned importance for each soil characteristic, as stated in Equation (4).
Table 4. The qualitative classification of the susceptibility index of the production farms before the Foc TR4 (SUPFoc).
SUPFoc ValueSusceptibility Class
0–0.5Very low or no considerable
0.5–1.5Low
1.5–2.5Medium
2.5–3.5High
3.5–4Very High
Table 5. Random Forest Classification Performance, the error OOB= 0.023 (n=1029).
Susceptibility Class01234Class Error
0 (very low)510000.17
1 (low)0274100.16
2 (medium)0154200.05
3 (high)01470760.02
4 (very high)00042120.02
Disclaimer/Publisher’s Note: The statements, opinions and data contained in all publications are solely those of the individual author(s) and contributor(s) and not of MDPI and/or the editor(s). MDPI and/or the editor(s) disclaim responsibility for any injury to people or property resulting from any ideas, methods, instructions or products referred to in the content.

