Article

Low Nocturnal Temperature Alters Tomato Foliar and Root Phosphorus Fractions Allocation by Reducing Soil Phosphorus Availability

1
College of Horticulture, Shenyang Agricultural University, Shenyang 110866, China
2
Key Laboratory of Protected Horticulture of Ministry of Education, Shenyang Agricultural University, Shenyang 110866, China
3
National & Local Joint Engineering Research Center of Northern Horticultural Facilities Design & Application Technology (Liaoning), Shenyang 110866, China
*
Authors to whom correspondence should be addressed.
Horticulturae 2023, 9(5), 536; https://doi.org/10.3390/horticulturae9050536
Submission received: 5 April 2023 / Revised: 24 April 2023 / Accepted: 26 April 2023 / Published: 27 April 2023

Abstract

:
Low nocturnal temperature (LNT) is a major constraint for protected tomato production in China during winter and spring, which leads to tomato phosphorus (P) deficiency symptoms. The soil P fractions reflect soil P availability. The foliar and root P fractions reflect the adaptation strategies of tomatoes to LNT. However, the relationship between plant P fractions and soil P fractions under LNT is not well understood. Therefore, we conducted a 40-day indoor incubation experiment with four nocturnal temperatures (15, 12, 9 and 6 °C). Tomato growth status, plant P fractions and soil P fractions were determined. Then, structural equation model (SEM) was used to analyze the direct and/or indirect effects of LNT on soil P fractions, plant P fractions and tomato shoot dry weight (SDW). The results showed that LNT decreased soil P availability by decreasing soil labile P and increasing soil moderately labile P. The foliar inorganic P, metabolite P, nucleic acid P and residual P were decreased under 9 and 6 °C. The root nucleic acid P and lipid P were decreased, while metabolite P was increased under 9 and 6 °C. Tomato foliar and root P fraction allocation was directly influenced by the increase in soil moderately labile P, while the decline in SDW was directly influenced by the decrease in soil labile P. In conclusion, LNT affects tomato P fractions allocation by reducing soil P availability, which limits the shoot dry matter production in tomatoes.

1. Introduction

In northern China, greenhouses have enabled year-round vegetable production in areas where the minimum daily temperature is above −28 °C. During winter, the daytime temperature is suitable for vegetable growth, while the nocturnal temperature in greenhouses drops to less than 10 °C or even 6 °C sometimes. Low nocturnal temperature (LNT) is a serious limitation for greenhouse vegetable seedlings [1], which can experience LNT stress for up to 10 days (d) to a month and a half. Tomato (Solanum lycopersicum L.), a popular vegetable in China, shows obvious symptoms of phosphorus (P) deficiency and growth restriction under low-temperature stress [2,3]. The decreased availability of soil P at low temperatures is an important driver in the development of plant P deficiency [4].
The soil P is vital source of plant P nutrition [5]. Foliar P content is more bound up with soil available P than to soil total P [6]. Soil P could be divided into labile P (LP; resin-P and NaHCO3-P), moderately labile P (MLP; NaOH-P), and nonlabile P (NLP; HCl-P and residual-P) distinguished by plant availability [7,8]. Soil P fractions have been extensively used to study the cycling of soil P and its potential correlation with plant P [9,10]. Different plant P fractions differ greatly in structure and function, and are closely related to plant growth and stress resistance [11]. Previous studies suggested that labile P correlate well with foliar P content [12], while moderately labile P has a negative correlation with foliar P content [6].
Plants adjust by altering the allocation of biomass and the partitioning of P forms within the plant when soil P supply is low [13,14,15]. The redistribution of foliar P fractions has been well studied in trees under low P availability [13,16]. Phosphorus in plants includes inorganic P (15%) and organic P (85%) [16]. Inorganic P includes metabolite P and inorganic P in vacuoles. The inorganic P in vacuole is mainly in the form of phosphate, which can reflect the P supply of soil [17]. Metabolite P, including ATP, ADP and phosphorylated sugars, is an intermediate in carbon metabolism and nucleotides [18]. Organic P (Po) include lipid P, nucleic acid P and residue P. Lipid P refers to the P that makes up cell membrane lipids, also known as structural P [17]. Nucleic acid P mainly includes RNA and DNA [19]. Residual P contains phosphorylated proteins and some unidentified compounds [20]. Previous studies on abiotic stress of P fractions allocation in plants focus on nutrient stress, especially P deficiency. There are few studies on P fractions allocation strategies in plants under low temperature stress. When exposed to low temperature, Eucalyptus nitens seedling foliar nucleic acid P enlarged, inorganic P decreased, and total P content remained unchanged [21]. Bruguiera gymnorhiza responds to chilling by maintaining high nucleic acid P and metabolite P [2].
Depending on the plant species, different plants may have different reactions to reduced soil P availability. The response of tomato P fractions to low soil P availability caused by LNT is unclear. We hypothesize that LNTs reduce the content of soil LP, thus changing the allocation of foliar and root P fractions and restricting tomato growth. We aim to (1) explore the rule of soil P fractions to LNT, (2) investigate the allocation strategy of foliar and root P fractions under LNT stress, and (3) determine how foliar and root fractions respond to soil P fractions under different nocturnal temperatures. This information will provide a theoretical basis for P fertilizer application strategy in vegetables under LNT stress in greenhouse and a new perspective on the physiological response of tomato to LNT stress in greenhouse.

2. Materials and Methods

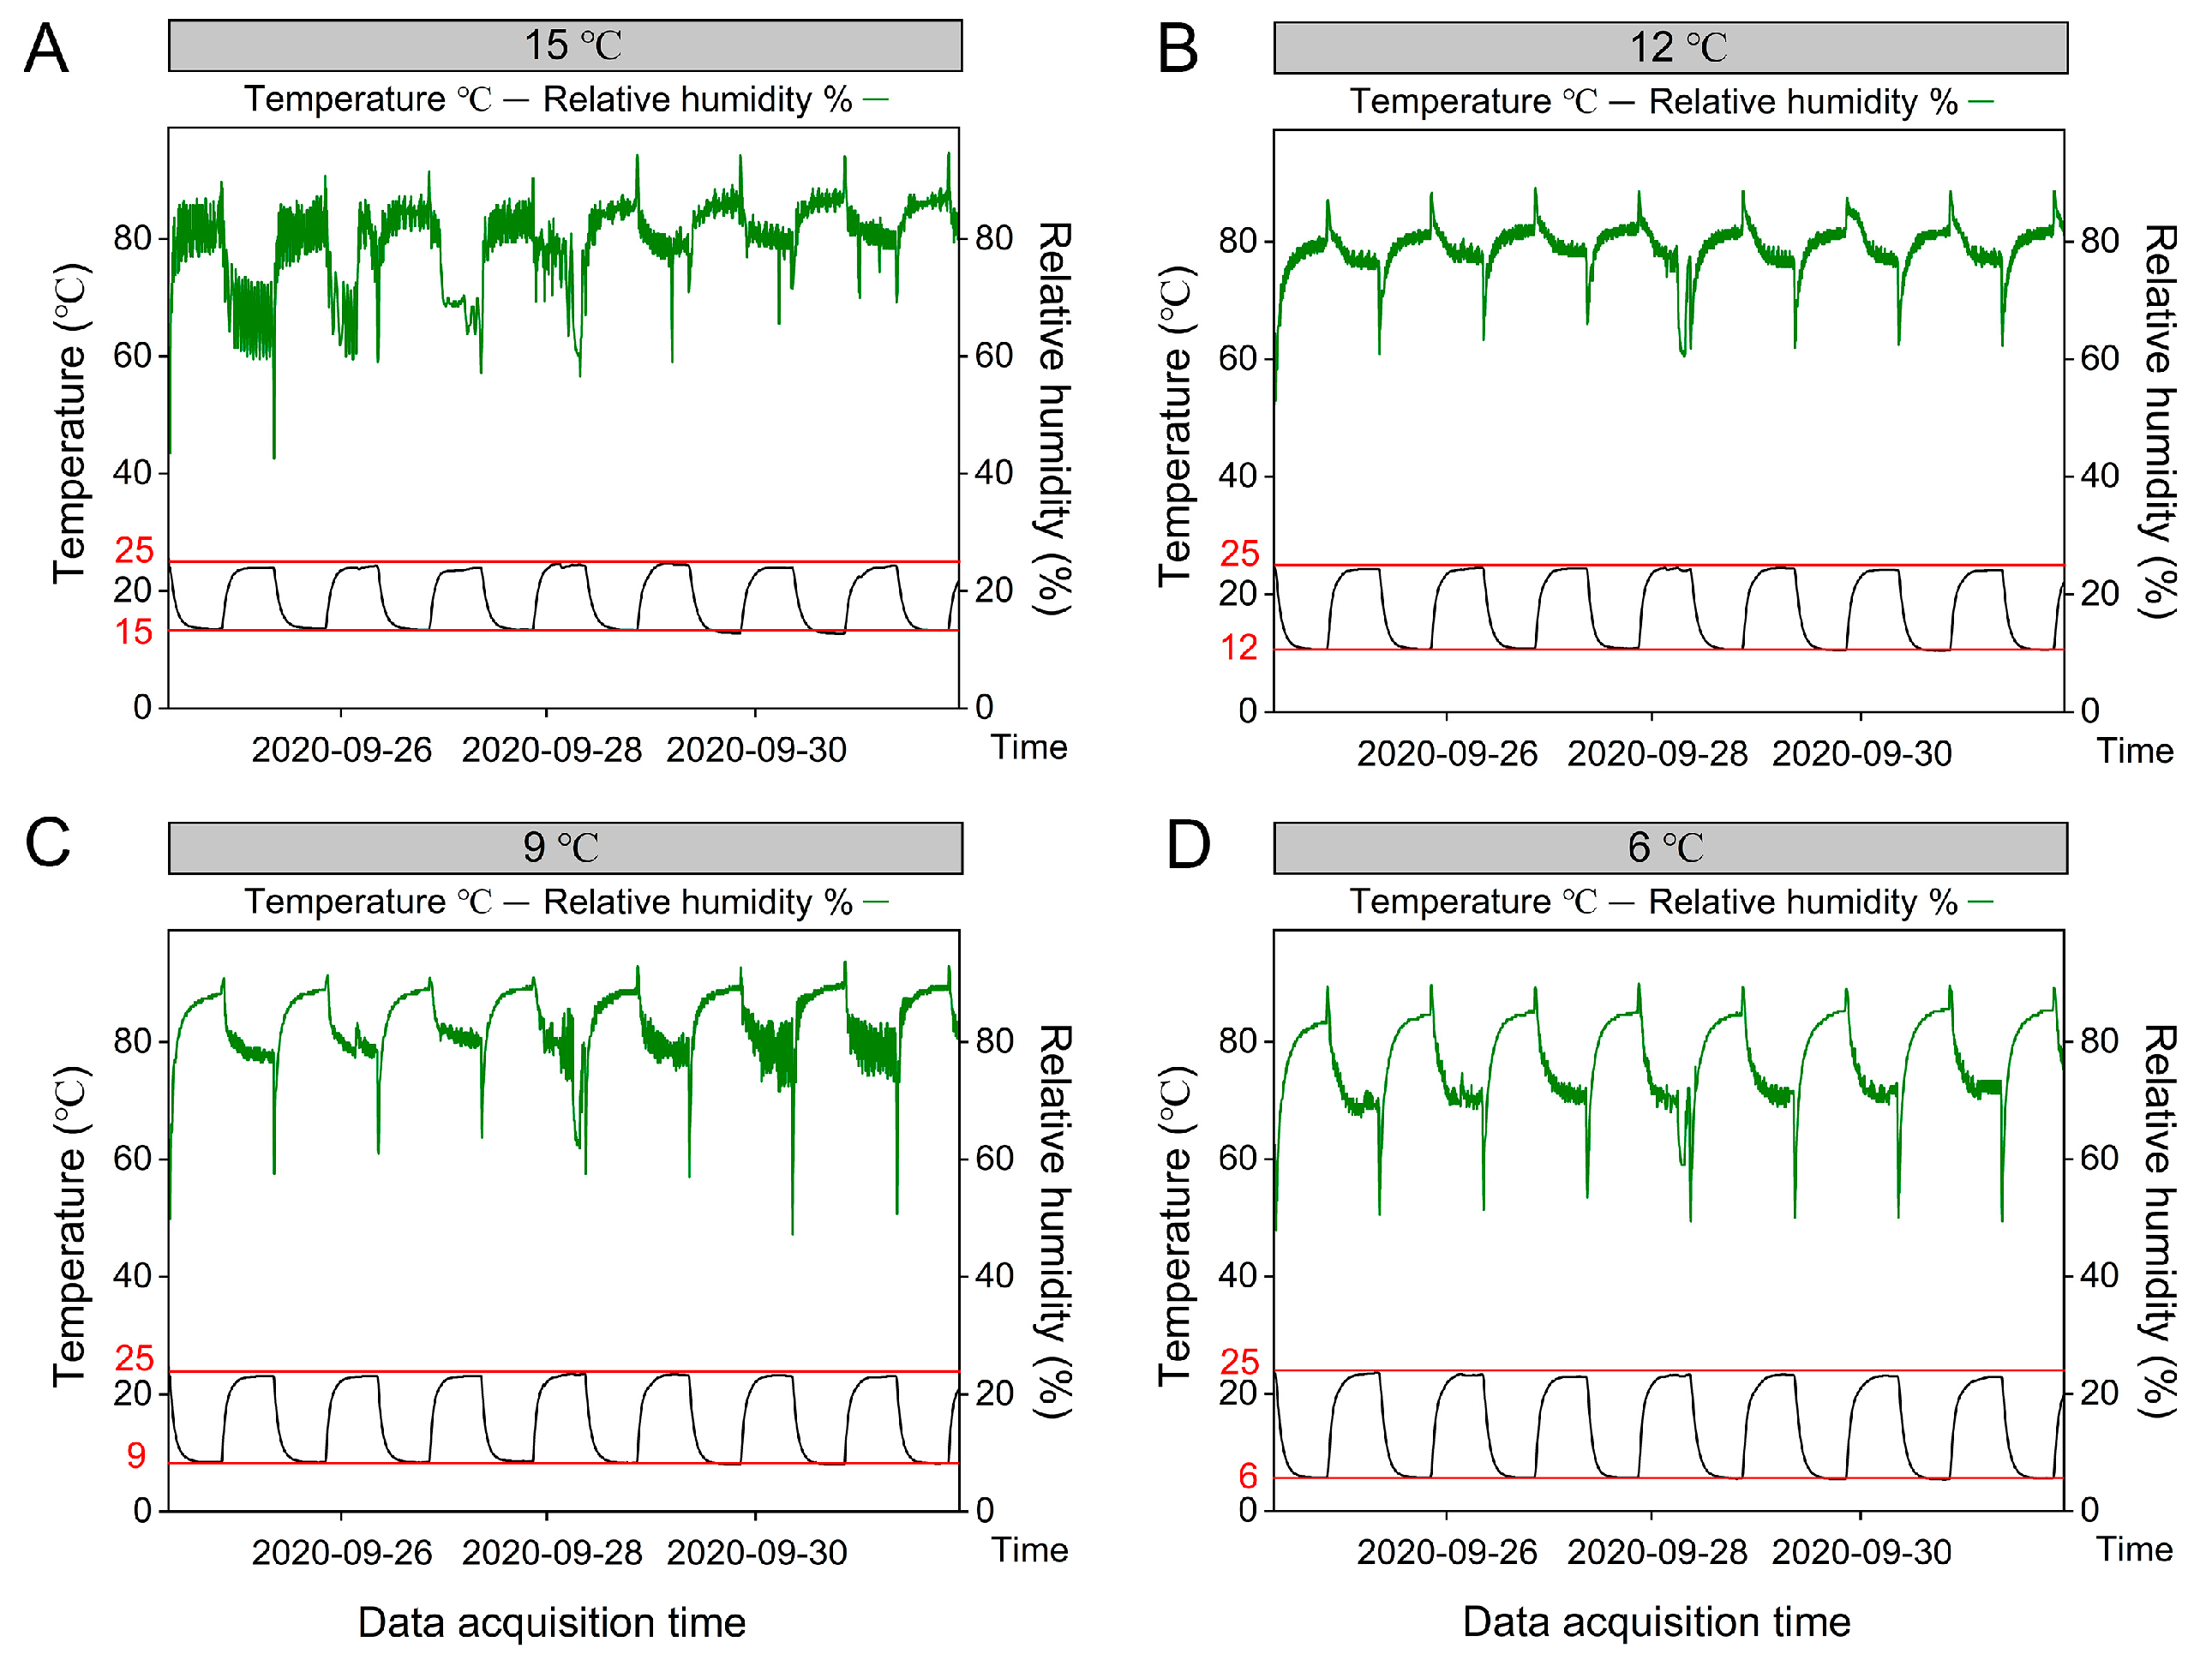
2.1. Experimental Design and Plant Materials

The soil was collected from Shenyang Agriculture University experimental base, Shenyang City, Liaoning Province (123°24′ E, 41°31′ N) and is classified as Hapli-Udic Luvisol ground on the World Reference Base for Soil Resources [22]. The soil was taken from 0–20 cm soil depth. The basic properties of the soil were measured as follows: pH 6.74, EC 87.7 μs·cm−1, available N 77.5 mg·kg−1, available P 126.6 mg·kg−1, available K 130.0 mg·kg−1, total N 1.12 g·kg−1, total P 0.85 g·kg−1, total K 22.3 g·kg−1. Plastic pots that were 260 mm in height and 300 mm in diameter were filled with 2 kg of soil. The application rate of compound chemical fertilizers (ShiJiaLi Chemical fertilizer Company (Chengdu, China)) was 1.07 g·kg−1 of soil (N:P2O5:K2O = 15:15:15), while that of organic fertilizer (chicken manure) was 13.6 g·kg−1 of soil. The nutrient content of chemical fertilizers was measured as follows: total N 28 mg·kg−1, total P 10.6 mg·kg−1, total K 1.0 mg·kg−1. The nutrient content of chicken manure was measured as follows: total N 130 mg·kg−1, total P 45.3 mg·kg−1, total K 2.1 mg·kg−1.
Oukang, a tomato variety with large fruit, was planted for this study. Tomato seeds were pregerminated for 1 d at 27 °C and grown in 50-cavity trays for 21 d. Then, uniform-sized tomato seedlings were transplanted into 12 pots (4 nocturnal temperatures×3 replicates) filled with 2.0 kg soil each. The potted tomato seedlings were grown in an artificial light climate chamber with a day/night temperature of 25/15 °C, a light intensity of 10,000 μmol·m−2·s−1, and an illumination time of 12 h.
After 7 d of adaptation, the tomato pots were separated into 4 groups and then placed in 4 identical artificial climate chambers with a normal daytime temperature of 25 °C and 4 nighttime temperatures: (1) 15 °C control (the normal nocturnal temperature of 15 °C), (2) 12 °C (a nocturnal temperature of 12 °C), (3) 9 °C (a nocturnal temperature of 9 °C) and (4) 6 °C (a nocturnal temperature of 6 °C). Three replicates were performed for each treatment. Three tomato seedlings and three plots of soil were sampled per nocturnal temperature treatment at 40 d. In this study, soil temperature and air temperature were consistent with the temperature setting of the artificial climate chamber, and soil temperature and relative humidity were monitored by RC-4HC soil temperature and humidity recorder (Jiangsu Jingchuang Electronics Co. Ltd., Xuzhou, China), which is shown in Figure 1.

2.2. Soil and Plant Sampling and Chemical Analysis

Air-dried soil samples were used for soil P fractions after they passed through a 2 mm sieve.
Leaf and root sampling: The 3rd youngest fully expanded leaf was taken from plant and the main vein was removed. Root samples were taken 2 cm before the root tip. Liquid nitrogen was used to store the samples of fresh leaves and roots. Then, by freeze-drying treatment to constant weight, the samples were ground into powder for the determination of foliar and root fractions.
Soil P fractions were analyzed using a sequential extraction process [23,24]. Briefly, 0.5 g soil was extracted by 30 mL deionized water and resin (resin-P). The other fractions were successively extracted by0.5 M NaHCO3 pH 8.5, (NaHCO3-P), 0.1 M NaOH (NaOH-P), and 1 M HCl (HCl-P). After these extraction processes, the soil P content was residual P. The soil labile P included resin-P and NaHCO3-P. The soil moderately labile P means NaOH-P. The soil nonlabile P included HCl-P and residual P [7]. The soil P fractions were determined by molybdenum blue colorimetry method [23].
Using the methods of Hidaka and Kitayama [16] and Yan [14] and combining them with the characteristics of P nutrients in tomato, improved determination of foliar and root P fractions was carried out. Powder (50 mg) was successively extracted by chloroform–methanolformic acid, chloroform–methanol water and water-washed chloroform (lipid P), methanol (85%) and 5% trichloroacetic acid (TCA) (inorganic P and metabolite P), and 2.5% TCA (nucleic acid P). After these extraction processes, the residue was measured for foliar residual P. The volume and composition of organic solvents and extraction time refer to Yan et al. [14]. The foliar and root P fractions were determined by molybdenum blue colorimetry method [23].
P absorption of whole tomato plant was calculated as follows:
P   a b s o r p t i o n   o f   w h o l e   t o m a t o   p l a n t = F o l i a r   P   c o n t e n t × F o l i a r   d r y   w e i g h t + S t e m   P   c o n t e n t × S t e m   d r y   w e i g h t + R o o t   P   c o n t e n t × R o o t   d r y   w e i g h t .

2.3. Statistical Analyses

Shoot dry weight, plant height, P absorption of the whole tomato plant, soil P fractions content, foliar and root P content and fraction content were tested separately with One-way ANOVA to compare differences based on Duncan’s test by using SPSS 22.0 (IBM SPSS, Chicago, IL, USA). The correlation heatmap between soil P fractions and foliar and root P fractions was performed by package in R 3.6.3 with Spearman’s correlation. A structural equation model (SEM) was analyzed by using the Amos 21.0 software (IBM SPSS AMOS, Chicago, IL, USA). Origin 2021 (OriginLab Corportation, Northampton, MA, USA) was used for mapping.

3. Results

3.1. P absorption of Whole Tomato Plant, Foliar P Content and Root P Content

Compared with 15 °C, tomato shoot dry weights (SDWs) treated at 9 and 6 °C were significantly decreased (p < 0.05; Figure 2A). Plant height decreased significantly with the decrease in nocturnal temperature. The plant height at 12, 9 and 6 °C showed significant reduction compared with that at 15 °C (p < 0.05; Figure 2B).
LNT significantly reduced the P absorption of whole tomato plant (p < 0.05; Figure 3A). The foliar P content also decreased significantly with the decrease in nocturnal temperature. Compared with 15 °C, foliar P contents treated at 12, 9 and 6 °C were significantly decreased (p < 0.05; Figure 3B). Total phosphorus content in roots decreased with the decrease in nocturnal temperature. Compared with 15 °C, root P content treated at 12 and 9 °C showed a downward trend, but did not reach at a significant level. Compared with 15 °C, root P content treated at 6 °C decreased significantly (p < 0.05; Figure 3C).

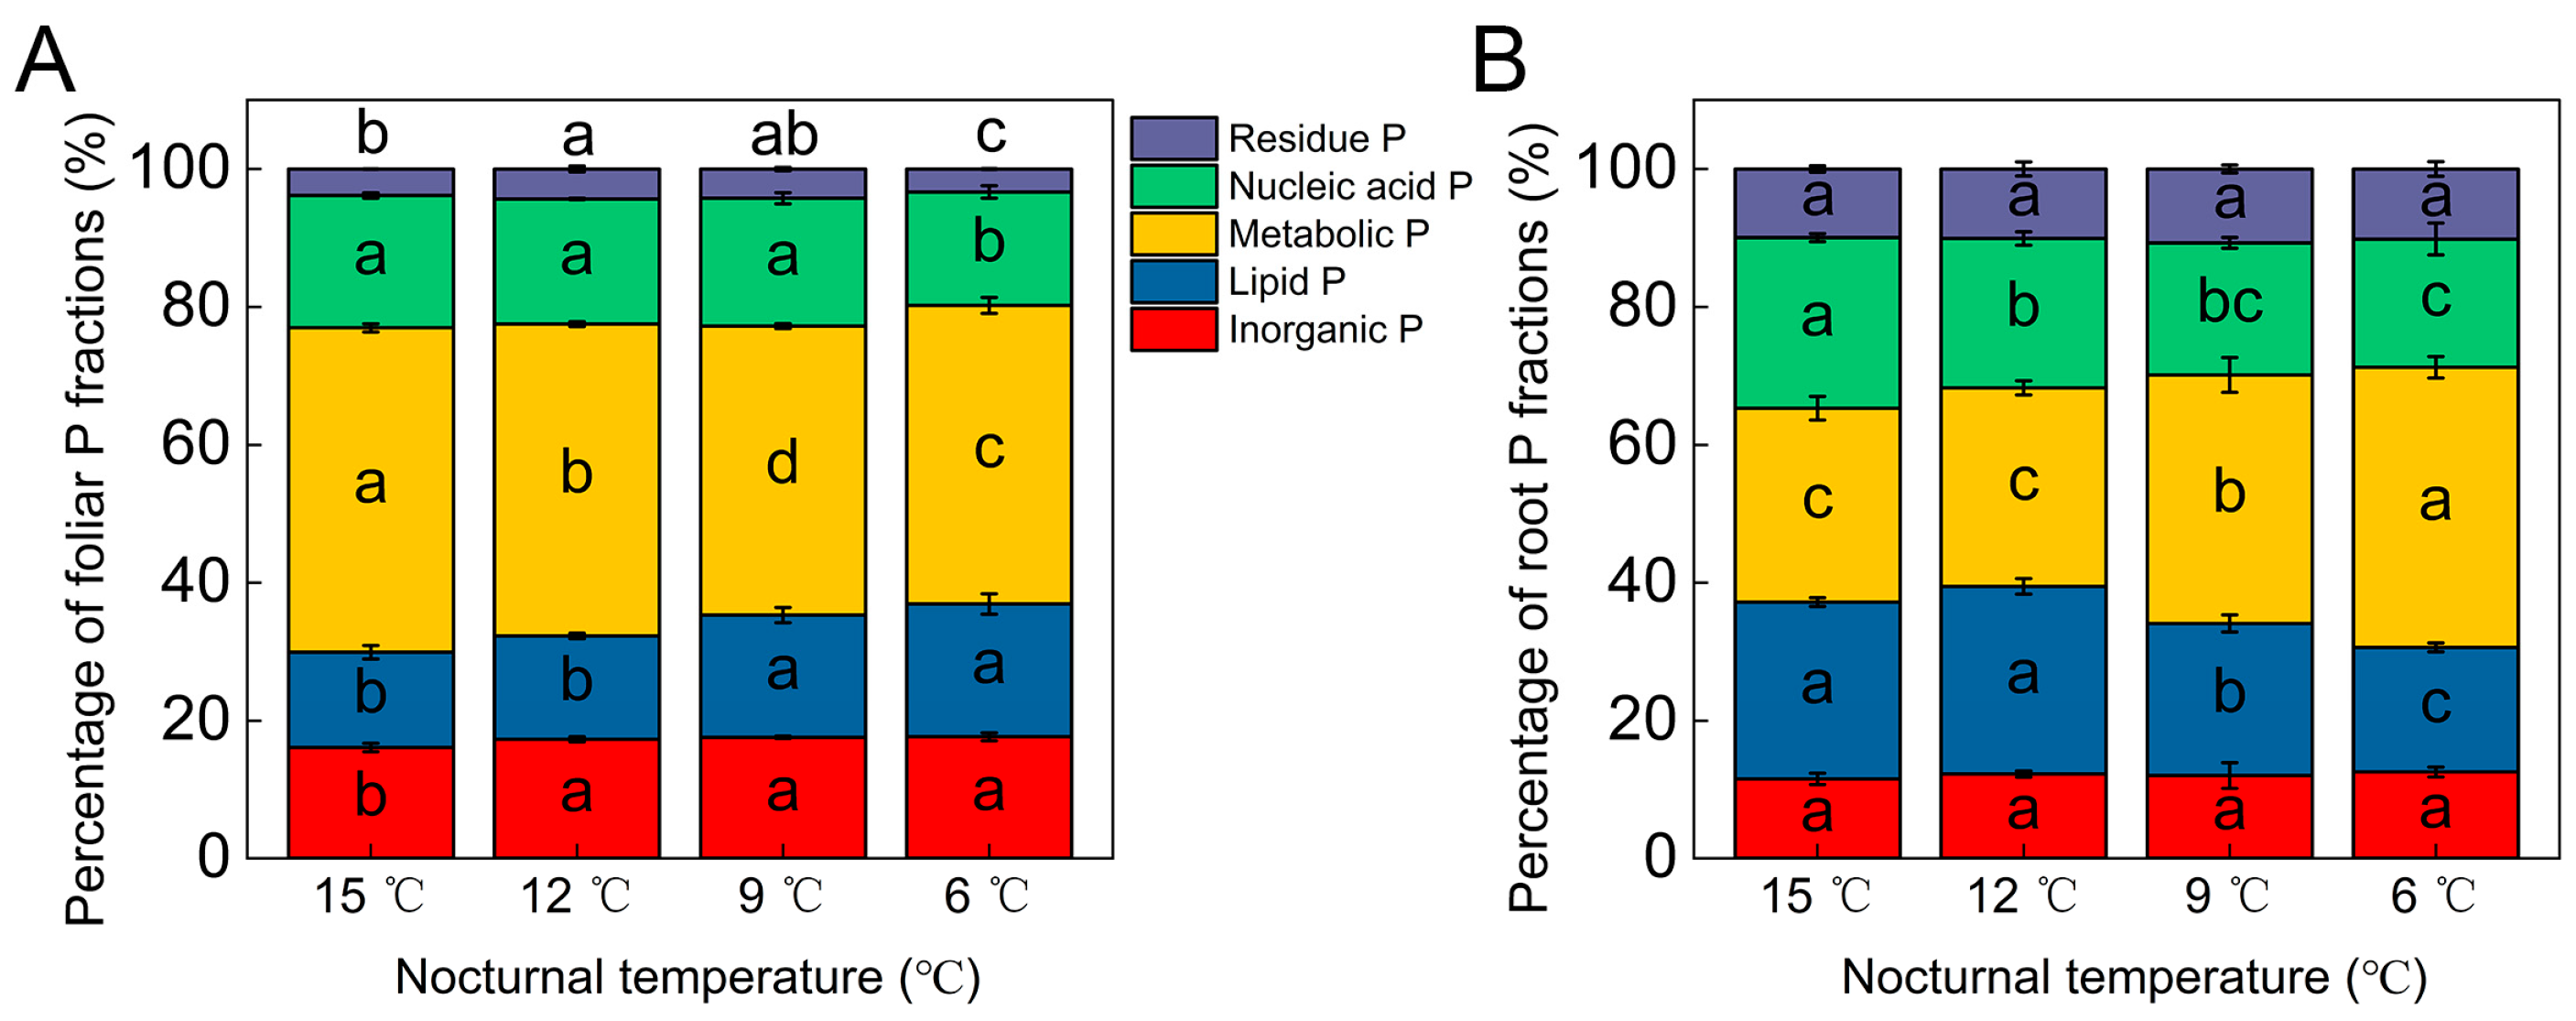
3.2. Tomato Foliar and Root P Fractions

Compared with the control (15 °C), the foliar inorganic P contents were significantly decreased at 9 and 6 °C (p < 0.05; Figure 4A,E). The metabolite P and nucleic acid P contents at 12, 9 and 6 °C appeared significantly reduced compared with those at 15 °C (p < 0.05; Figure 4B,D). In addition, metabolite P and nucleic acid P contents at 12 °C were higher than those at 9 and 6 °C. There was no significant difference between the different nocturnal temperature treatments of foliar lipid P (p > 0.05; Figure 4C).
Compared with the control (15 °C), the root metabolite P content at nocturnal temperature of 9 and 6 °C was significantly increased (p < 0.05; Figure 5B) while significantly decreased root lipid P content was recorded (p < 0.05; Figure 5C). Compared with the control, there was no significant difference in root metabolite P and lipid P content at night temperature 12 °C. The root nucleic acid P content at 12, 9 and 6 °C showed significant reduction compared with that at 15 °C (p < 0.05; Figure 5D). There was no significant difference between the different nocturnal temperature treatments of root inorganic P and residual P content (p > 0.05; Figure 5A,E).
As nocturnal temperature decreased, the foliar inorganic P and lipid P proportions increased significantly. The foliar inorganic P percentage increased significantly at 12, 9 and 6 °C compared with that at 15 °C. The foliar lipid P percentage increased significantly only at 9 and 6 °C compared with that at 15 °C. Conversely, the foliar metabolite P and nucleic acid P proportions decreased significantly with nocturnal temperature. The foliar metabolite P percentage weakened significantly at 12, 9 and 6 °C compared with that at 15 °C, whereas the foliar nucleic acid P percentage weakened significantly only at 6 °C (Figure 6A).
With the decrease in nocturnal temperature, the proportion of root lipid P and nucleic acid P decreased significantly. Compared with the control (15 °C), the proportion of root nucleic acid P gradually significantly decreased from nocturnal temperature of 15 °C to 6 °C. When compared to 15 °C, the proportion of root lipid P only considerably decreased at nocturnal temperatures of 9 and 6 °C. Unlike root lipid P and nucleic acid P, the proportion of root metabolite P gradually significantly increased at nocturnal temperature from 6 °C to 15 °C (Figure 6B).

3.3. Soil P fractions

Compared with control (15 °C), nocturnal temperatures of 9 and 6 °C significantly decreased soil labile P content, while no significant difference in soil labile P content between nocturnal temperature of 12 and 15 °C was observed (p < 0.05; Figure 7A). The soil moderately labile P content at 9 and 6 °C showed significant increase compared with that at 15 °C. Similarly, no significant difference was detected in soil moderately labile P content between nocturnal temperatures of 12 and 15 °C (p < 0.05; Figure 7B). There was no significant difference in the soil nonlabile P content between different nocturnal temperatures (p > 0.05; Figure 7C).

3.4. Linkages between Soil P Fractions and Plant P Fractions

The foliar inorganic P, nucleic acid P, metabolite P and residual P show a positive correlation with soil labile P content (inorganic P, p < 0.01, r = 0.748; metabolite P, p < 0.01, r = 0.713; nucleic acid P, p < 0.01, r = 0.797; residual P, p < 0.01, r = 0.804) and negative correlation with soil moderately labile P content (inorganic P, p < 0.001, r = −0.860; metabolite P, p < 0.001, r = −0.832; nucleic acid P, p < 0.001, r = −0.839; residual P, p < 0.01, r = −0.790). There was no significant correlation between foliar lipid P and soil P fractions (Figure 8A).
There was no significant correlation between soil P fractions and root inorganic P. The root metabolite P was negatively correlated with soil labile P content (p < 0.001, r = −0.860) and positively correlated with soil moderately labile P content (p < 0.001, r = 0.846). The root lipid P was positively correlated with soil labile P content (p < 0.001, r = 0.846) and negatively correlated with soil moderately labile P content (p < 0.001, r = −0.832). The root nucleic acid P was positively correlated with soil labile P content (p < 0.01, r = 0.748) and negatively correlated with soil moderately labile P content (p < 0.001, r = −0.867). The root residual P was negatively correlated with soil nonlabile P content (p < 0.01, r = −0.748) (Figure 8B).
SEM was used to analyze the direct and/or indirect effects of LNT on soil P fractions, plant P fractions and SDW. The fitted models explained 96.8% of the variance in foliar P fractions. LNT and soil MLP had direct positive (p < 0.001) and negative (p < 0.05) effects on foliar P fractions, respectively. The standardized total effects showed that LNT and soil LP have positive effects on foliar P fractions. Soil MLP has negative effects on foliar P fractions (Figure 9A,C). The fitted models explained 98.3% of the variance in root P fractions. LNT and soil MLP had direct positive (p < 0.001) and negative (p < 0.001) effects on root P fractions, respectively. The standardized total effects showed that LNTs have positive effects on root P fractions. Soil MLP has a negative effect on root P fractions (Figure 9A,D). The fitted models explained 88.9% of the variance in SDW. Only soil LP had directly positive (p < 0.001) effects on SDW. The standardized total effects showed that root P fractions, LNT, soil LP and soil MLP have positive effects on SDW. Foliar P fractions have negative effects on SDW (Figure 9A,B).

4. Discussion

4.1. Tomato P Fractions Allocation Responds to LNT

Tomato is sensitive to low temperatures, which can restrict plant growth and productivity [1,24]. The P absorption of whole tomato plant was restricted under LNT stress. The decrease in foliar P content in tomato was caused by the decrease in foliar inorganic P, nucleic acid P, metabolite P and residual P. The decrease in root P content in tomato was caused by the decrease in root nucleic acid P and lipid P.
The LNT significantly reduced the foliar nucleic acid P and metabolite P content. DNA-P and RNA-P are the main component of nucleic acid P involved in protein synthesis and turnover [17,25]. Under LNT stress, photosynthesis of tomato leaves decreased, which led to the destruction of leaf photosynthetic structure [1]. The expression of photosynthetic-related proteins is limited, which leads to the decrease in foliar nucleic acid P. Moreover, LNT stress inhibited dark respiration of leaves [26]. It has been confirmed in trees that foliar nucleic acid P is positively correlated with dark respiration at low temperature [2].
The percentage of foliar P fractions reflects the characteristics of P allocation. Foliar metabolite P and nucleic acid P are involved in the carbon metabolism process. Foliar metabolite P provides substrate for carbon metabolism, and nucleic acid P participates in the synthesis of carbon metabolism enzymes [27]. The percentages of foliar metabolite P were decreased at nocturnal temperatures of 12, 9 and 6 °C. The percentage of foliar nucleic acid P was decreased only at nocturnal temperatures of 6 °C. Tomato leaves exposed to 12 and 9 °C nocturnal temperatures preferably allocate nucleic acid P rather than metabolite P. This indicates that tomato leaves invest more on rRNA to produce proteins to maintain growth, not for enzyme synthesis, at nocturnal temperature of 12 and 9 °C [16]. Although the foliar lipid P content had no significant difference with the decrease in nocturnal temperature, the percentage of foliar lipid P increased. This suggests that tomato preferentially allocates phosphorus to lipid P in order to maintain membrane integrity after suffering LNT stress. Plant cells increase membrane rigidity to sense cold stress, and phospholipid signaling is involved in cold stress signaling [2,28]. In conclusion, the distribution rule of foliar P fractions under LNT stress was as follows: the percentage of foliar metabolite P was reduced, and more phosphate was allocated to foliar lipid P and nucleic acid P. After encountering LNT, the preferential distribution of foliar P was as follows: lipid P > nucleic acid P > metabolite P.
The optimal temperature range for tomato root development was 22–25 °C [29]. Lower root nucleic acid P and lipid P indicated that LNTs cause damage to the root membrane system and reduce the activity of enzymes and expression of P transporters [3,30]. Hence, the ability of the root to take up mineral nutrients was inhibited [31]. The development of young leaves is blocked under LNT, which inhibited photosynthate (phosphorylated sugars, belonging to metabolite P) demand [32]. The triose phosphate was transferred from the leaf to the root [33]. Moreover, the metabolite demand of the root is weakened under low temperatures [31]. Hence, root metabolite P was increased under LNT. The percentage of root nucleic acid P decreased at nocturnal temperatures of 12, 9 and 6 °C. The percentage of root lipid P decreased at nocturnal temperatures of 9 and 6 °C. This indicates that tomato roots preferentially allocate phosphate to lipid P rather than nucleic acid P for enzyme synthesis when exposed to LNT. In conclusion, the distribution rule of root P fractions under LNT stress was as follows: the percentage of root nucleic acid P and lipid P was reduced, and more phosphate was allocated to metabolite P. After encountering LNT, the preferential distribution of root P was as follows: metabolite P > lipid P > nucleic acid P.

4.2. LNT Changes Tomato P Allocation by Reducing Soil P Availability

LNT decreased soil labile P content while increasing soil moderately labile P content. Low temperature restricted soil organic matter decomposition [34], which weakens the competition for immobile P absorption sites [35,36,37]. When exposed to environmental stress, microorganisms compete with plants for phosphorus. Microorganisms store Pi intracellularly in the form of ribosomes or P-storage compounds (mainly polyphosphates) [38], which are supplemented to soil moderately labile P [39,40].
Soil labile P and moderately labile P content characterize foliar and root P fractions. Soil moderately P was negatively correlated with foliar P fractions (inorganic P, metabolite P, nucleic acid P and residual P) (Figure 8A). This is consistent with the research on tree species [6]. As LNT reduced the availability of soil P, tomato preferentially allocated P to foliar lipid P to involve cold stress signaling [2,28]. Soil labile P decreased leading to the decrease in foliar inorganic P content (Figure 7A; [17]). Soil moderately labile P also has a strong relationship with foliar and root P fractions. Based on SEM, the increase in soil moderately labile P directly restricted foliar and root P fractions. On the one hand, LNT directly changed allocation of foliar and root P. On the other hand, LNT indirectly changed allocation of foliar and root P by enhancing soil moderately labile fractions. LNTs have no direct influence on SDW. LNTs indirectly restricted tomato SDW by decreasing soil labile P. Soil labile P was the only direct reason for reduction in tomato SDW. This illustrated that low soil P availability was the main reason for limited shoot biomass accumulation in tomato.

5. Conclusions

LNT stress inhibited P uptake of the whole tomato plant and shoot biomass accumulation. We identified which foliar or root P fractions were reduced to cause P deficiency in tomato plants. The decrease in foliar P content in tomato was attributed to the reduction in foliar inorganic P, metabolite P, nucleic acid P and residual P. The decrease in root P content in tomato was attributed to the reduction in root nucleic acid P and lipid P. Based on previous studies, it was possible to assert that LNT limited biomass accumulation in tomato plants, while our study demonstrates why tomato shoot biomass is limited. Soil labile P and moderately labile P content characterize foliar and root P fractions. LNT decreased soil labile P content while increasing soil moderately labile P content, inducing low soil P availability. LNT directly changed allocation of foliar and root P while indirectly changing allocation of foliar and root P by enhancing soil moderately labile fractions. LNT indirectly restricted tomato SDW by decreasing soil labile P. In conclusion, low nocturnal temperature alters tomato foliar and root P fractions by reducing soil phosphorus availability which limits the accumulation of shoot biomass accumulation in tomato. Future research should focus on the reasons for the reduction of soil P availability and the methods to increase it under LNT. This is conducive to relieving the tomato seedling stage P deficiency symptoms under LNT.

Author Contributions

H.F. and T.L. conceived and designed the study. Q.S. and R.M. performed the experiments. Q.S. analyzed the data and wrote the manuscript. Y.L. and Z.S. assist in perfecting thesis writing. All authors have read and agreed to the published version of the manuscript.

Funding

This work was jointly supported by Project of Education Department of Liaoning Province (LJKMZ20221023), Shenyang Science and Technology Project (21109308), China Agriculture Research System (CARS-23-B02) and Innovation and Entrepreneurship Training Program for Undergraduates in Liaoning Province (S202210157080).

Institutional Review Board Statement

Not applicable.

Informed Consent Statement

Not applicable.

Data Availability Statement

The data presented in this study are available on request from the Corresponding author.

Acknowledgments

The authors would like to thank Awais Muhammad for his contributions in revising the manuscript.

Conflicts of Interest

The authors declare no conflict of interest. The funders have no role in the study design, data collection and analysis, decision to publish, or preparation of the manuscript.

References

  1. Lu, J.; Wang, Z.; Yang, X.; Wang, F.; Qi, M.; Li, T.; Liu, Y. Cyclic Electron Flow Protects Photosystem I Donor Side under Low Night Temperature in Tomato. Environ. Exp. Bot. 2020, 177, 104151. [Google Scholar] [CrossRef]
  2. Yan, L.; Sunoj, V.S.J.; Short, A.W.; Lambers, H.; Elsheery, N.I.; Kajita, T.; Wee, A.K.S.; Cao, K.F. Correlations between Allocation to Foliar Phosphorus Fractions and Maintenance of Photosynthetic Integrity in Six Mangrove Populations as Affected by Chilling. New Phytol. 2021, 232, 2267–2282. [Google Scholar] [CrossRef]
  3. Liu, Y.; Wang, Z.; Ning, X.; Ni, Y.; Li, T. Effects of Low Temperature on Phosphorus Absorption and Transport of Tomato Seedlings. Acta Bot. Boreali-Occident. Sin. 2017, 37, 0097–0104. [Google Scholar]
  4. Sun, F.; Chang, R.; Tariq, A.; Sardans, J.; Penuelas, J.; Jiang, H.; Zhou, X.; Li, N. Livestock Grazing-Exclusion under Global Warming Scenario Decreases Phosphorus Mineralization by Changing Soil Food Web Structure in a Tibetan Alpine Meadow. Sci. Total Environ. 2023, 873, 162313. [Google Scholar] [CrossRef]
  5. Wen, Z.; Pang, J.; Wang, X.; Gille, C.E.; De Borda, A.; Hayes, P.E.; Clode, P.L.; Ryan, M.H.; Siddique, K.H.M.; Shen, J.; et al. Differences in Foliar Phosphorus Fractions, Rather than in Cell-Specific Phosphorus Allocation, Underlie Contrasting Photosynthetic Phosphorus Use Efficiency among Chickpea Genotypes. J. Exp. Bot. 2022, 74, 1974–1989. [Google Scholar] [CrossRef]
  6. Niederberger, J.; Kohler, M.; Bauhus, J. Distribution of Phosphorus Fractions with Different Plant Availability in German Forest Soils and Their Relationship with Common Soil Properties and Foliar P Contents. Soil 2019, 5, 189–204. [Google Scholar] [CrossRef] [Green Version]
  7. Motavalli, P.P.; Miles, R.J. Soil Phosphorus Fractions after 111 Years of Animal Manure and Fertilizer Applications. Biol. Fertil. Soils 2002, 36, 35–42. [Google Scholar] [CrossRef]
  8. Maranguit, D.; Guillaume, T.; Kuzyakov, Y. Land-Use Change Affects Phosphorus Fractions in Highly Weathered Tropical Soils. Catena 2017, 149, 385–393. [Google Scholar] [CrossRef]
  9. Helfenstein, J.; Tamburini, F.; von Sperber, C.; Massey, M.S.; Pistocchi, C.; Chadwick, O.A.; Vitousek, P.M.; Kretzschmar, R.; Frossard, E. Combining Spectroscopic and Isotopic Techniques Gives a Dynamic View of Phosphorus Cycling in Soil. Nat. Commun. 2018, 9, 3226–3234. [Google Scholar] [CrossRef]
  10. Gao, Y.; Wang, X.; Shah, J.A.; Chu, G. Polyphosphate Fertilizers Increased Maize (Zea Mays L.) P, Fe, Zn, and Mn Uptake by Decreasing P Fixation and Mobilizing Microelements in Calcareous Soil. J. Soils Sediments 2020, 20, 1–11. [Google Scholar] [CrossRef]
  11. Gao, Y.; Zeng, F.; Islam, W.; Zhang, Z.; Du, Y.; Zhang, Y.; Chai, X.; Liu, Y. Coexistence Desert Plants Respond to Soil Phosphorus Availability by Altering the Allocation Patterns of Foliar Phosphorus Fractions and Acquiring Different Forms of Soil Phosphorus. J. Plant Growth Regul. 2022, 1–15. [Google Scholar] [CrossRef]
  12. Galván-Tejada, N.C.; Peña-Ramírez, V.; Mora-Palomino, L.; Siebe, C. Soil P Fractions in a Volcanic Soil Chronosequence of Central Mexico and Their Relationship to Foliar P in Pine Trees. J. Plant Nutr. Soil Sci. 2014, 177, 792–802. [Google Scholar] [CrossRef]
  13. Hei, J.; Xie, H.; Yang, L.; Wang, W.; Sardans, J.; Wang, C.; Tariq, A.; Zeng, F.; Peñuelas, J. Effects of Contrasting N-Enriched Biochar Applications on Paddy Soil and Rice Leaf Phosphorus Fractions in Subtropical China. Sci. Total Environ. 2023, 877, 162949. [Google Scholar] [CrossRef]
  14. Yan, L.; Zhang, X.; Han, Z.; Pang, J.; Lambers, H.; Finnegan, P.M. Responses of Foliar Phosphorus Fractions to Soil Age Are Diverse along a 2 Myr Dune Chronosequence. New Phytol. 2019, 223, 1621–1633. [Google Scholar] [CrossRef]
  15. Jiang, M.; Caldararu, S.; Zaehle, S.; Ellsworth, D.S.; Medlyn, B.E. Towards a More Physiological Representation of Vegetation Phosphorus Processes in Land Surface Models. New Phytol. 2019, 222, 1223–1229. [Google Scholar] [CrossRef] [Green Version]
  16. Hidaka, A.; Kitayama, K. Relationship between Photosynthetic Phosphorus-Use Efficiency and Foliar Phosphorus Fractions in Tropical Tree Species. Ecol. Evol. 2013, 3, 4872–4880. [Google Scholar] [CrossRef]
  17. Veneklaas, E.J.; Lambers, H.; Bragg, J.; Finnegan, P.M.; Lovelock, C.E.; Plaxton, W.C.; Price, C.A.; Scheible, W.R.; Shane, M.W.; White, P.J.; et al. Opportunities for Improving Phosphorus-Use Efficiency in Crop Plants. New Phytol. 2012, 195, 306–320. [Google Scholar] [CrossRef]
  18. Zhang, L.; Luo, X.; Lambers, H.; Zhang, G.; Liu, N.; Zang, X.; Xiao, M.; Wen, D. Effects of Elevated CO2 Concentration and Nitrogen Addition on Foliar Phosphorus Fractions of Mikania Micranatha and Chromolaena Odorata under Low Phosphorus Availability. Physiol. Plant 2021, 173, 2068–2080. [Google Scholar] [CrossRef]
  19. Gao, Y.; Tariq, A.; Zeng, F.; Graciano, C.; Zhang, Z.; Sardans, J.; Peñuelas, J. Allocation of Foliar-P Fractions of Alhagi Sparsifolia and Its Relationship with Soil-P Fractions and Soil Properties in a Hyperarid Desert Ecosystem. Geoderma 2022, 407, 115546. [Google Scholar] [CrossRef]
  20. Mo, Q.; Li, Z.; Sayer, E.J.; Lambers, H.; Li, Y.; Zou, B.; Tang, J.; Heskel, M.; Ding, Y.; Wang, F. Foliar Phosphorus Fractions Reveal How Tropical Plants Maintain Photosynthetic Rates despite Low Soil Phosphorus Availability. Funct. Ecol. 2019, 33, 503–513. [Google Scholar] [CrossRef] [Green Version]
  21. Close, D.C.; Beadle, C.L. Chilling-Dependent Photoinhibition, Nutrition and Growth Analysis of Eucalyptus Nitens Seedlings during Establishment. Tree Physiol. 2003, 23, 217–226. [Google Scholar] [CrossRef] [PubMed] [Green Version]
  22. IUSS Working Group WRB. World Reference Base for Soil Resources 2014 (Update 2015). International Soil Classification System for Naming Soils and Creating Legends for Soil Maps. In World Soil Resources Reports; No. 106; FAO: Rome, Italy, 2014. [Google Scholar]
  23. Khan, A.; Guo, S.; Wang, R.; Zhang, S.; Yang, X.; He, B.; Li, T. An Assessment of Various Pools of Organic Phosphorus Distributed in Soil Aggregates as Affected by Long-term P Fertilization Regimes. Soil Use Manag. 2023, 39, 833–848. [Google Scholar] [CrossRef]
  24. Nurhasanah Ritonga, F.; Chen, S. Physiological and Molecular Mechanism Involved in Cold Stress Tolerance in Plants. Plants 2020, 9, 560. [Google Scholar] [CrossRef] [PubMed]
  25. Raven, J.A. Nucleic Acid Requirement of Plants from Low Phosphorus Habitats. A Commentary on: Foliar Nutrient-Allocation Patterns in Banksia Attenuata and Banksia Sessilis Differing in Growth Rate and Adaptation to Low-Phosphorus Habitats. Ann. Bot. 2021, 128, IV–V. [Google Scholar] [CrossRef] [PubMed]
  26. Tombesi, S.; Cincera, I.; Frioni, T.; Ughini, V.; Gatti, M.; Palliotti, A.; Poni, S. Relationship among Night Temperature, Carbohydrate Translocation and Inhibition of Grapevine Leaf Photosynthesis. Environ. Exp. Bot. 2019, 157, 293–298. [Google Scholar] [CrossRef]
  27. Lambers, H.; Finnegan, P.M.; Jost, R.; Plaxton, W.C.; Shane, M.W.; Stitt, M. Phosphorus Nutrition in Proteaceae and Beyond. Nat. Plants 2015, 1, 15109. [Google Scholar] [CrossRef]
  28. Chinnusamy, V.; Zhu, J.; Zhu, J.K. Cold Stress Regulation of Gene Expression in Plants. Trends Plant Sci. 2007, 12, 444–451. [Google Scholar] [CrossRef]
  29. Koevoets, I.T.; Venema, J.H.; Elzenga, J.T.M.; Testerink, C. Roots Withstanding Their Environment: Exploiting Root System Architecture Responses to Abiotic Stress to Improve Crop Tolerance. Front. Plant Sci. 2016, 7, 1335. [Google Scholar] [CrossRef] [Green Version]
  30. Feng, H.; Yan, M.; Fan, X.; Li, B.; Shen, Q.; Miller, A.J.; Xu, G. Spatial Expression and Regulation of Rice High-Affinity Nitrate Transporters by Nitrogen and Carbon Status. J. Exp. Bot. 2011, 62, 2319–2332. [Google Scholar] [CrossRef] [Green Version]
  31. Zhou, Y.; Sommer, M.L.; Hochholdinger, F. Cold Response and Tolerance in Cereal Roots. J. Exp. Bot. 2021, 72, 7474–7481. [Google Scholar] [CrossRef]
  32. Wu, D.; Liu, Y.; Pang, J.; Yong, J.W.H.; Chen, Y.; Bai, C.; Han, X.; Liu, X.; Sun, Z.; Zhang, S.; et al. Exogenous Calcium Alleviates Nocturnal Chilling-Induced Feedback Inhibition of Photosynthesis by Improving Sink Demand in Peanut (Arachis Hypogaea). Front. Plant Sci. 2020, 11, 607029. [Google Scholar] [CrossRef] [PubMed]
  33. Miao, M.; Xu, X.; Chen, X.; Xue, L.; Cao, B. Cucumber Carbohydrate Metabolism and Translocation under Chilling Night Temperature. J. Plant Physiol. 2007, 164, 621–628. [Google Scholar] [CrossRef] [PubMed]
  34. Zhou, J.; Li, X.L.; Peng, F.; Li, C.; Lai, C.; You, Q.; Xue, X.; Wu, Y.; Sun, H.; Chen, Y.; et al. Mobilization of Soil Phosphate after 8 Years of Warming Is Linked to Plant Phosphorus-Acquisition Strategies in an Alpine Meadow on the Qinghai-Tibetan Plateau. Glob. Chang. Biol. 2021, 27, 6578–6591. [Google Scholar] [CrossRef]
  35. Fu, Z.; Wu, F.; Song, K.; Lin, Y.; Bai, Y.; Zhu, Y.; Giesy, J.P. Competitive Interaction between Soil-Derived Humic Acid and Phosphate on Goethite. Appl. Geochem. 2013, 36, 125–131. [Google Scholar] [CrossRef]
  36. Chassé, A.W.; Ohno, T. Higher Molecular Mass Organic Matter Molecules Compete with Orthophosphate for Adsorption to Iron (Oxy)Hydroxide. Environ. Sci. Technol. 2016, 50, 7461–7469. [Google Scholar] [CrossRef] [PubMed]
  37. Kong, M.; Han, T.; Chen, M.; Zhao, D.; Chao, J.; Zhang, Y. High Mobilization of Phosphorus in Black-Odor River Sediments with the Increase of Temperature. Sci. Total Environ. 2021, 775, 145595. [Google Scholar] [CrossRef]
  38. Čapek, P.; Kotas, P.; Manzoni, S.; Šantrůčková, H. Drivers of Phosphorus Limitation across Soil Microbial Communities. Funct. Ecol. 2016, 30, 1705–1713. [Google Scholar] [CrossRef] [Green Version]
  39. Bünemann, E.K. Assessment of Gross and Net Mineralization Rates of Soil Organic Phosphorus—A Review. Soil Biol. Biochem. 2015, 89, 82–98. [Google Scholar] [CrossRef]
  40. De Sena, A.; Madramootoo, C.A.; Whalen, J.K.; von Sperber, C. Nucleic Acids Are a Major Pool of Hydrolyzable Organic Phosphorus in Arable Organic Soils of Southern Ontario, Canada. Biol. Fertil. Soils 2022, 58, 7–16. [Google Scholar] [CrossRef]
Figure 1. Test soil temperature and relative humidity monitoring. (A) soil temperature and relative humidity were treated at day/night temperature of 25/15 °C; (B) soil temperature and relative humidity were treated at day/night temperature of 25/12 °C; (C) soil temperature and relative humidity were treated at day/night temperature of 25/9 °C; (D) soil temperature and relative humidity were treated at day/night temperature of 25/6 °C.
Horticulturae 09 00536 g001
Figure 2. Effect of LNT on tomato shoot dry weight (A) and plant height (B). (A) shoot dry weight; (B) plant height. Different letters above boxplots indicated a significant difference between treatments based on Duncan’s test (p < 0.05). Error bars indicate standard errors.
Horticulturae 09 00536 g002
Figure 3. Effect of LNT on P content in tomato plants. (A) P content of whole plant; (B) foliar P content; (C) root P content. Different letters above boxplots indicated a significant difference between treatments based on Duncan’s test (p < 0.05). Error bars indicate standard errors.
Horticulturae 09 00536 g003
Figure 4. Effect of LNT on foliar P fractions in tomato. (A) Foliar inorganic P content; (B) foliar metabolite P content; (C) foliar lipid P content; (D) foliar nucleic acid P content; (E) foliar residual P content. Different letters above boxplots indicated a significant difference between treatments based on Duncan’s test (p < 0.05). Error bars indicate standard errors.
Horticulturae 09 00536 g004
Figure 5. Effect of LNT on root P fractions in tomato. (A) Root inorganic P content; (B) root metabolite P content; (C) root lipid P content; (D) root nucleic acid content; (E) root residual P content. Different letters above boxplots indicated a significant difference between treatments based on Duncan’s test (p < 0.05). Error bars indicate standard errors.
Horticulturae 09 00536 g005
Figure 6. Effect of LNT on the proportion of foliar (A) and root (B) P fractions in tomato. Different letters in boxplots indicated a significant difference between treatments about every foliar or root P fractions based on Duncan’s test (p < 0.05).
Horticulturae 09 00536 g006
Figure 7. Effects of LNT on the contents of soil P fractions in tomato soil. (A) Soil LP content; (B) soil MLP content; (C) soil NLP content. Soil LP: soil labile P, Soil MLP: soil moderately labile P, Soil NLP: soil nonlabile P. Different letters above boxplots indicated a significant difference between treatments based on Duncan’s test (p < 0.05). Error bars indicate standard errors.
Horticulturae 09 00536 g007
Figure 8. Correlation heatmap between plant fractions and soil P fractions. (A) Foliar P fractions and soil P fractions; (B) root P fractions and soil P fractions. Soil LP: soil labile P, Soil MLP: soil moderately labile P, Soil NLP: soil nonlabile P. Significance levels are as follows: ** p < 0.01 and *** p < 0.001.
Horticulturae 09 00536 g008
Figure 9. Structural equation models (SEM) based on soil P fractions, plant P fractions and shoot dry weight (SDW). (A) structural equation models; (B) standardized total effects on shoot dry weight; (C) standardized total effects on foliar P fractions; (D) standardized total effects on root P fractions. LNT: low nocturnal temperature, Soil LP: soil labile P, Soil MLP: soil moderately labile P, SDW: shoot dry weight. The principal component score was calculated to represent foliar P fractions and root P fractions. Continuous and dashed arrows represent significant and insignificant relationships, respectively. Numbers in bold indicate the variance explained by the model (R2). Continuous and dashed arrows represent significant and insignificant relationships, respectively. Numbers on arrows represent standardized path coefficients. Blue and red arrows show positive and negative effects, respectively. The width of arrows indicates the strength of the correlations. Significance levels are as follows: * p < 0.05 and *** p < 0.001.
Horticulturae 09 00536 g009
Disclaimer/Publisher’s Note: The statements, opinions and data contained in all publications are solely those of the individual author(s) and contributor(s) and not of MDPI and/or the editor(s). MDPI and/or the editor(s) disclaim responsibility for any injury to people or property resulting from any ideas, methods, instructions or products referred to in the content.

