Article

Transcriptome Analyses Reveal the Key Regulators of Tomato Compound Leaf Development

College of Horticulture, Shenyang Agricultural University, Shenyang 110866, China
*
Author to whom correspondence should be addressed.
Horticulturae 2023, 9(3), 363; https://doi.org/10.3390/horticulturae9030363
Submission received: 5 February 2023 / Revised: 7 March 2023 / Accepted: 8 March 2023 / Published: 10 March 2023

Abstract

:
Leaves are one of the organs involved in plant assimilation and transpiration. Different leaf development processes can result in different leaf shapes. Tomato plants have typical compound leaves. It is helpful to explore the regulatory factors affecting the leaf development and morphogenesis of tomatoes to cultivate varieties with high photosynthetic efficiency. We used the typical tomato leaf shape mutants Petroselinum (Pts), Trifoliate (tf2), and Entire (e), which showed a gradual decrease in leaflet number and compound leaf complexity. Transcriptome sequencing was performed to analyze the key differentially expressed genes (DEGs) among the 3 groups, which revealed 2393, 1366, and 1147 DEGs in Pts/VF36, tf2/CR, and e/AC, respectively. We found 86 overlapping DEGs among the 3 groups. In addition, we found that the mutation of Pts, tf2, and e affected not only leaf morphology but also the wax, fatty acid, and abscisic acid pathways during growth and development. An RT-qPCR analysis during leaf primordium development revealed three transcription factors (bHLH079, WRKY44, and WRKY76) and three hormone-regulated genes (IAA-amino acid hydrolase, Gibberellin2ox7, and Gibberellin20ox) that were differentially expressed in the transcriptome. Using virus-induced gene silencing (VIGS), we observed the leaf shape of VIGS plants and found that bHLH079, IAA-amino acid hydrolase, Gibberellin2ox7, Gibberellin20ox, WRKY44, and WRKY76 were the endogenous regulators influencing tomato compound leaf development. This study provides a promising direction for revealing the molecular regulation mechanism underlying compound leaf development in tomatoes.

1. Introduction

Leaves are important aboveground plant parts and are the main sites for plant life activities. The leaf primordium initiates from the flanks of the shoot apical meristem (SAM) and develops into flat structures of variable sizes and forms. Leaf development is a continuous, dynamic, and complex process that can be divided into three stages: initial, primary morphogenesis (PM), and secondary morphogenesis (SM). During the initial stage, the leaf primordia emerge laterally from the SAM followed by transverse leaf expansion. During primary morphogenesis, the leaf spreads laterally; the basic leaf shape is determined; the transverse structure is refined from the leaf margin; and the leaf clefts, serrations, and leaflets are produced simultaneously [1]. During secondary morphogenesis, tissue differentiation and cell expansion occur, leading to increased leaf area eventually followed by a series of cell divisions and differentiation into mature leaves. Another important part of leaf morphogenesis is the establishment of leaf polarity during which cells continuously differentiate to eventually form asymmetric leaf organs [2].
Common tomato leaves are typical pinnate compound leaves, also known as uneven pinnate compound leaves, with deep or shallow lobes of irregular serration, and the size of the leaflets alternates. Furthermore, tomato leaves are of different types, such as entire, trifoliate, and compound leaves. Additionally, tomato leaves can be classified into entire, serrated, or notched leaves depending on their degree of serration [3,4]. The leaf margins in plants are also the result of long-term evolution. As an indispensable part of leaves, the leaf margin is also very important to their morphology. The leaf margin of notched leaves is serrated. This morphological change can improve the stress resistance of plants under abiotic stress [5,6]. In addition, notched leaves have a larger specific leaf area than e leaves, so they are more competitive in their use of light resources [7].
During leaf growth, the developmental time course and morphogenesis are the result of both internal and external environmental factors, and each stage of leaf development is regulated by environmental factors, transcription factors, miRNAs, and plant hormones.
Several key transcription factors involved in the regulation of leaf organ development have been identified. For example, WOX family transcription factors belong to the homeodomain (HD) protein family and play important roles in embryogenesis and lateral organ development [8]. SlLAM1 belongs to the WOX gene family, and knockout SlLAM1, which is obtained through CRISPR-Cas9-mediated genome editing, results in narrower tomato leaves and a reduction in the number of secondary lobules. Furthermore, the overexpression of SlLAM1 in tobacco partially restores the narrow leaf phenotype [9]. The KNOX (Knotted1-like homeobox) transcription factor family is a subfamily of the TALE protein family of homeobox genes which is involved in the regulation of plant growth and development as well as the formation and development of the SAM, and it is essential for the maintenance of SAM function [10]. KNOXI expression in compound leaf tomatoes inhibits differentiation during leaf development [11,12]; however, this inhibition delays leaf maturation and leads to the formation of more leaflets [13]. It is similar to the CIN-TCP family of transcription factors, which affects leaf morphology by regulating the leaf maturation time. The downregulation of the activity of TCP transcription factor LANCEOLATE (LA, TCP2) is essential for maintaining the genetic potential of leaf edge morphogenesis in tomatoes [14]. The LA gene is negatively regulated by miRNA319 at the early stage of leaf development, and when the sensitivity of LA mRNAs to miRNA319 recognition is reduced in the semidominant mutant, an increase in the LA expression level will promote leaf differentiation and lead to simpler leaves [15]. Two bHLH/HLH homolog proteins, leaf-associated protein 1 and leaf-associated protein 2 (AtLP1 and AtLP2), have been identified in Arabidopsis thaliana; LP1 and LP2 play similar active roles in longitudinal cell elongation [16].
Plant hormones are key factors that regulate leaf shape. Auxin coordinates the phyllotaxis of leaf initiation from the SAM and determines the location of serrations and the initiation of the leaflets and lobes from the margin of the leaf primordia. Additionally, auxin influences leaf symmetry in both adaxial–abaxial [17] and bilateral [18] patterning. The ENTIRE (SlIAA9) gene in tomatoes, as a repressor of the auxin response, belongs to the Aux/IAA family of proteins [19]. In tomatoes, the Aux/IAA protein ENTIRE-regulated auxin response factors (ARFs) repress the auxin response and blade growth in the intercalary region. Loss-of-function e mutants develop single blades with partially fused primary leaflets due to ectopic blade growth [20,21,22,23].
During leaf development, GA regulates cell proliferation and expansion and leaf complexity. Increasing the GA level or GA reaction in tomatoes leads to premature leaf ripening and the formation of simpler leaves with smooth edges [24,25,26,27,28].
Cytokinins (CKs) are important regulators of development. During leaf development, CKs promote morphogenesis and delay cell differentiation, and CKs are also crucial for maintaining SAM function [29,30]. Conversely, reduced CK levels due to the expression of the CK degradation gene, Cytokinin oxidase (CKX), results in reduced leaf complexity. Genetic and molecular analyses have shown that CKs delay maturation downstream of the KNOXI transcription factor and mediate the activity of the KNOXI protein in leaf shape regulation [13,31,32]. The overexpression of the CK biosynthesis gene, ISO-PENTENYLTRANSFERASE 7 (IPT7), in tomato leaves results in the formation of highly compound leaves [33].
Brassinosteroids (BRs) affect several developmental processes by promoting elongation and differentiation [34,35]. In tomatoes, the recessive BR-defective mutant dumpy (dpy) is short, causing dense, dark-green, furrowed leaves that curl downward [36]. There are few reports on the involvement of jasmonic acid (JA) [37], abscisic acid (ABA) [38], ethylene (ET) [39,40], and other hormones in tomato leaf development.
In this study, VF36, Petroselinum (Pts), Condine Red (CR), Trifoliate (tf2), Ailsa Craig (AC), and Entire (e) were used as experimental materials. Due to the gradual decrease in the leaflet number and compound leaf complexity in the three groups of mutants, the key differentially expressed genes (DEGs) were screened via a transcriptome sequencing analysis. The transcriptome analysis revealed 86 overlapping DEGs among the 3 groups. It was found that the mutations of Pts, tf2, and e were not only reflected in leaf morphology but also affected the wax, fatty acid, and abscisic acid pathways during plant growth and development. Moreover, the DEGs from the Pts/VF36-tf2/CR, Pts/VF36-entire/AC, and tf2/CR-entire/AC groups were selected for further RT-qPCR analysis. The RT-qPCR results during leaf primordium development showed that the six key factors had a significant expression trend. Finally, the main regulators of tomato leaf shape were selected by observing plants with virus-induced gene silencing (VIGS).

2. Results

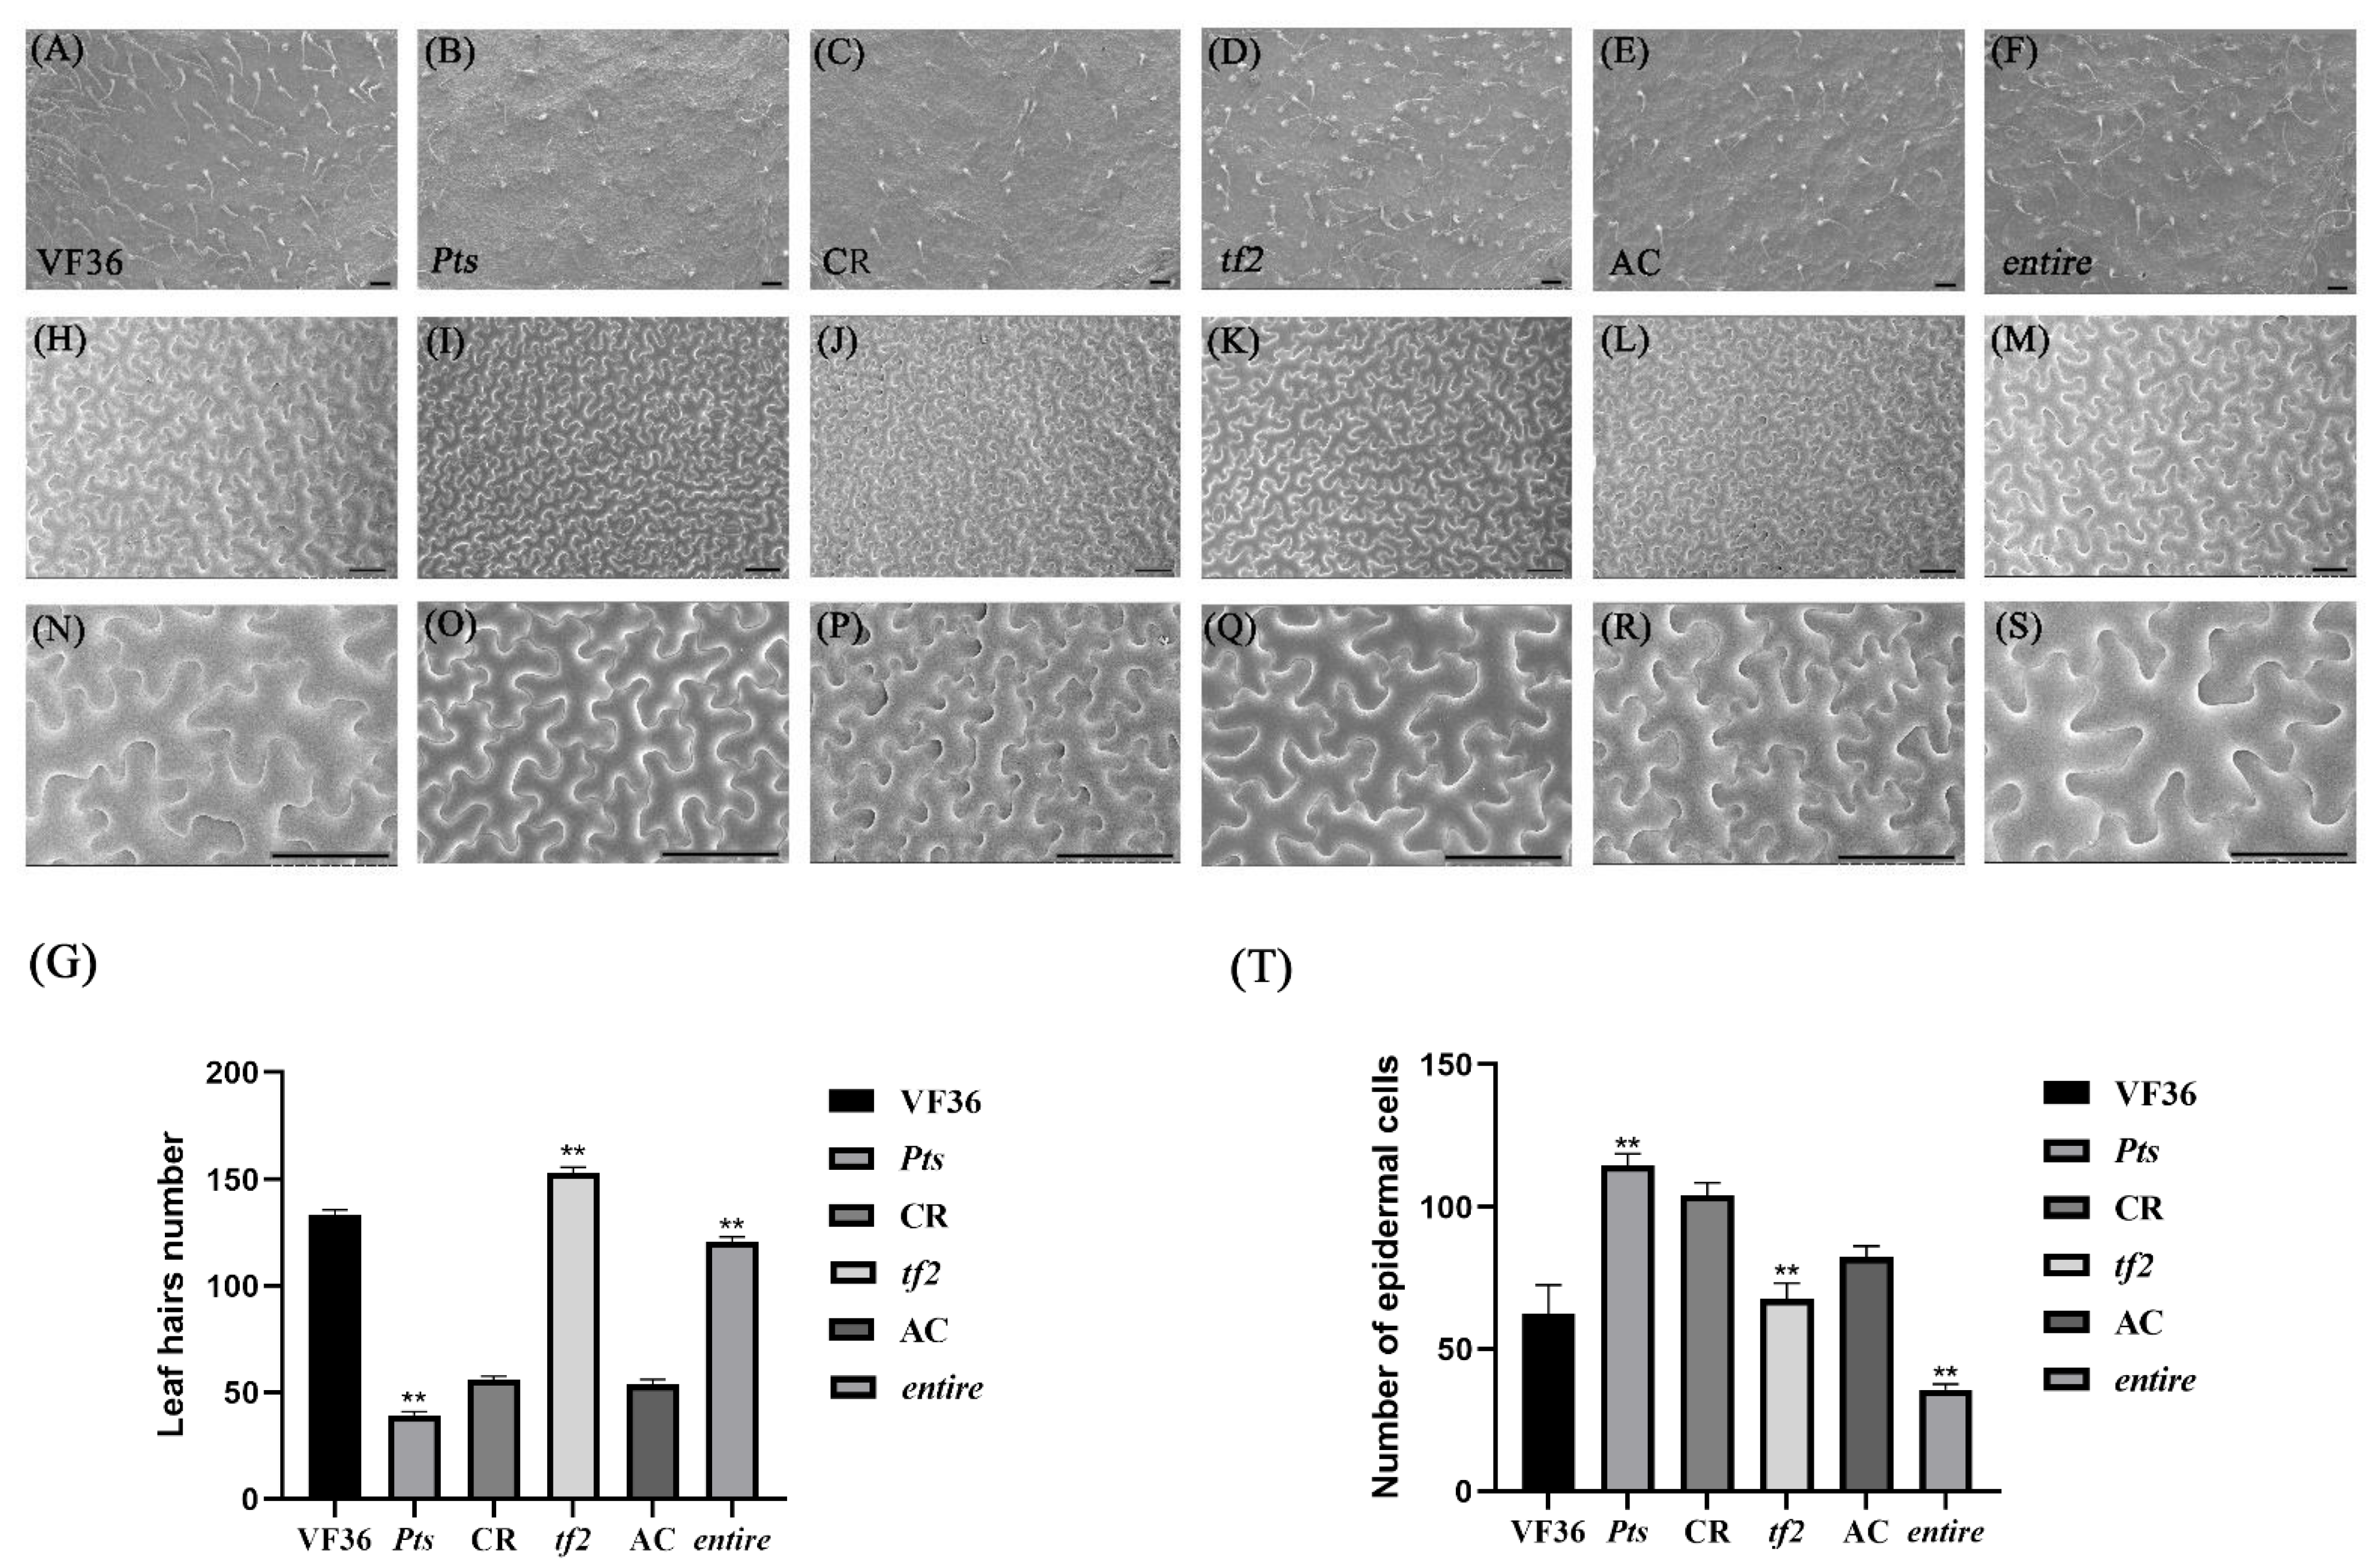
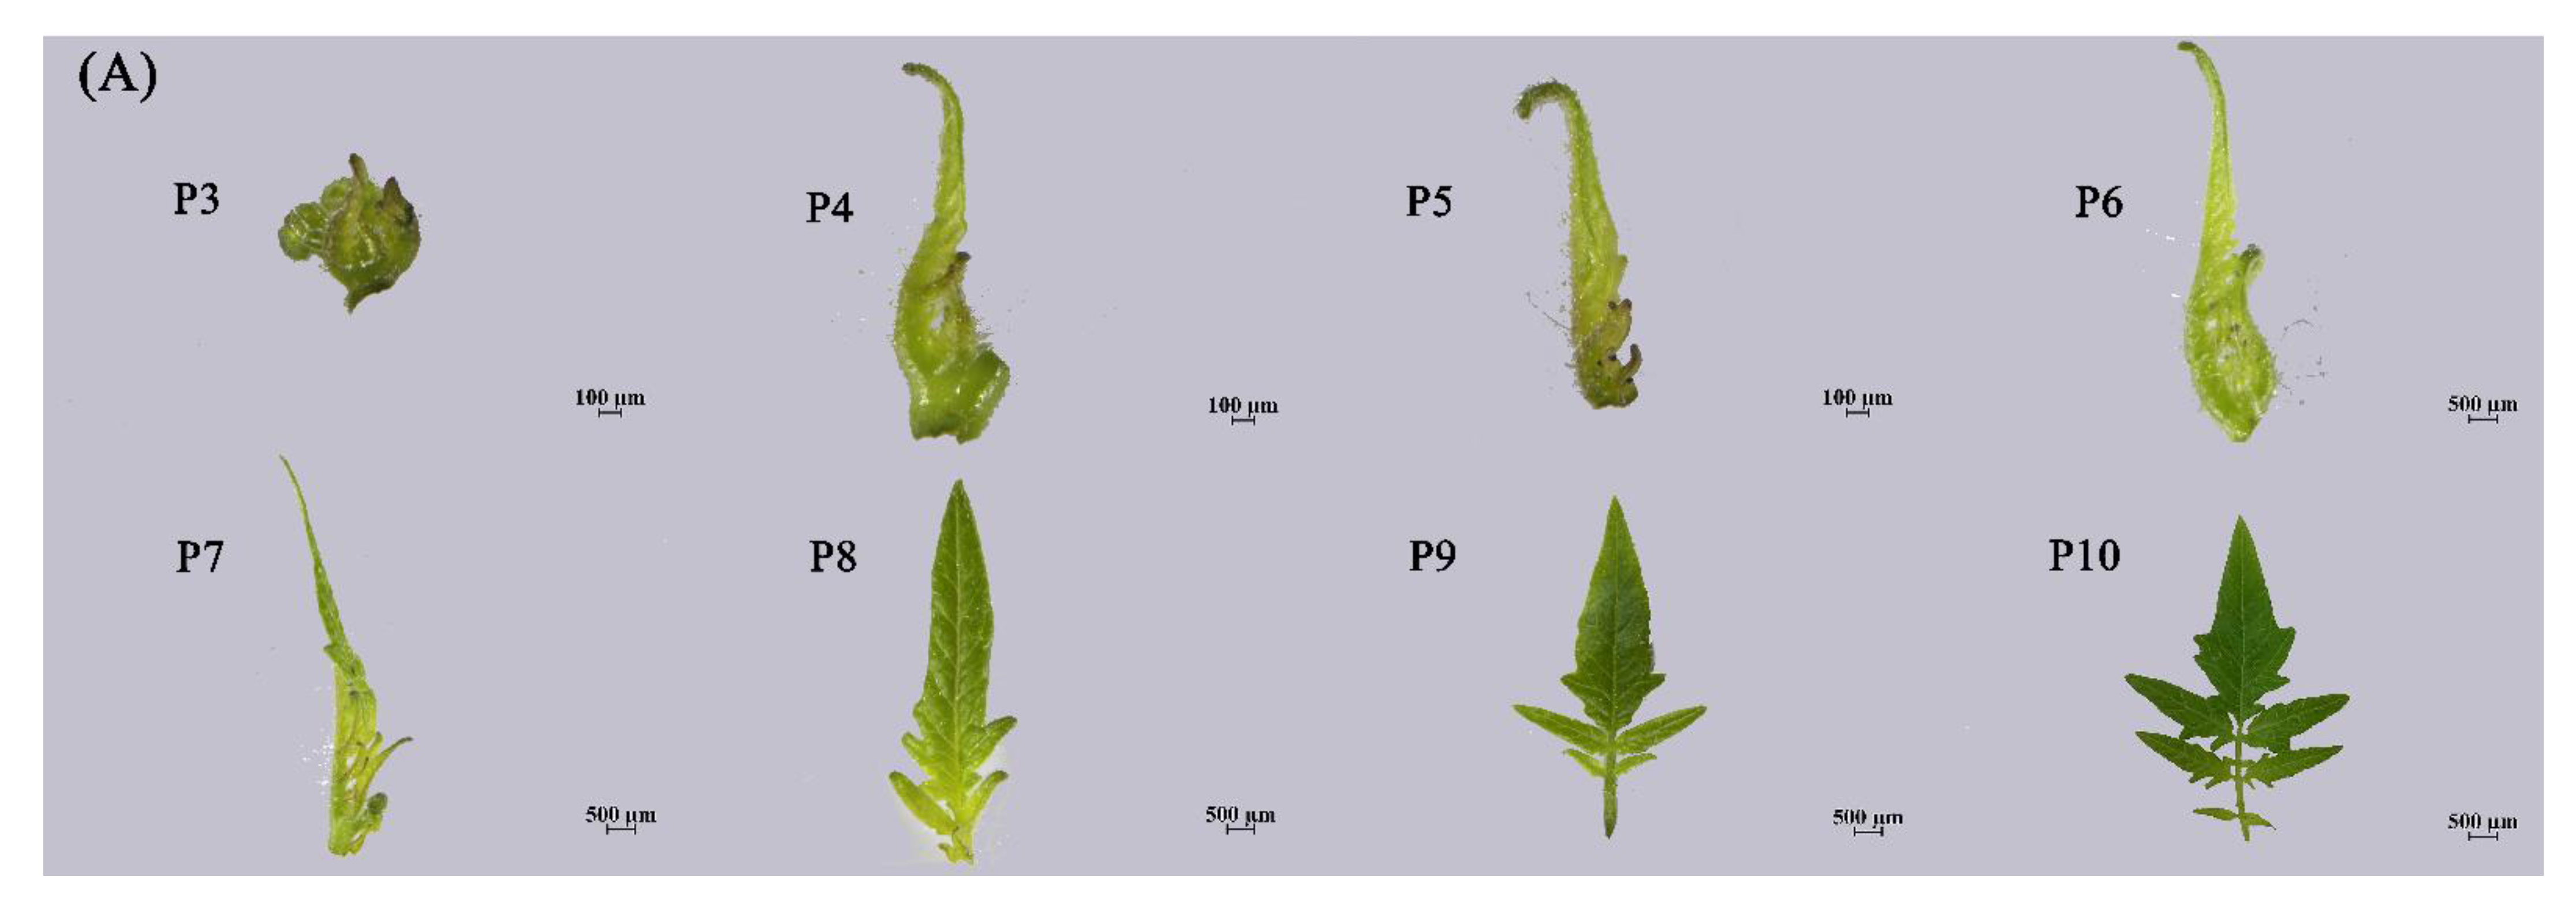
2.1. Leaf Shape Characteristics of the Mutant Plants

The tomato mutant plants (Petroselinum, trifoliate, and entire) showed differences in the number of their compound leaves and in their leaf margins compared to the wild types. Compared with wild-type VF36, the Pts mutant had a significantly greater number of lobules on the leaf axis (Figure 1A and Figure S1A). In contrast, the tf2 mutant showed a simple three-leaflet state with a single narrow leaf in the early stage and a pair of lateral leaves on the petiole in the late stage. Additionally, no leaflets were present (Figure 1B and Figure S1B). Compared with AC, which had a typical compound leaf, the e mutant showed functional defects, leading to the development of single leaves with smooth leaf margins and significantly greater blade lengths and widths (Figure 1C and Figure S1C). The three mutants showed that the complexities of Pts, tf2, and e ranged from high to low. Therefore, these mutants were used to study the relationship between leaf complexity and gene expression.

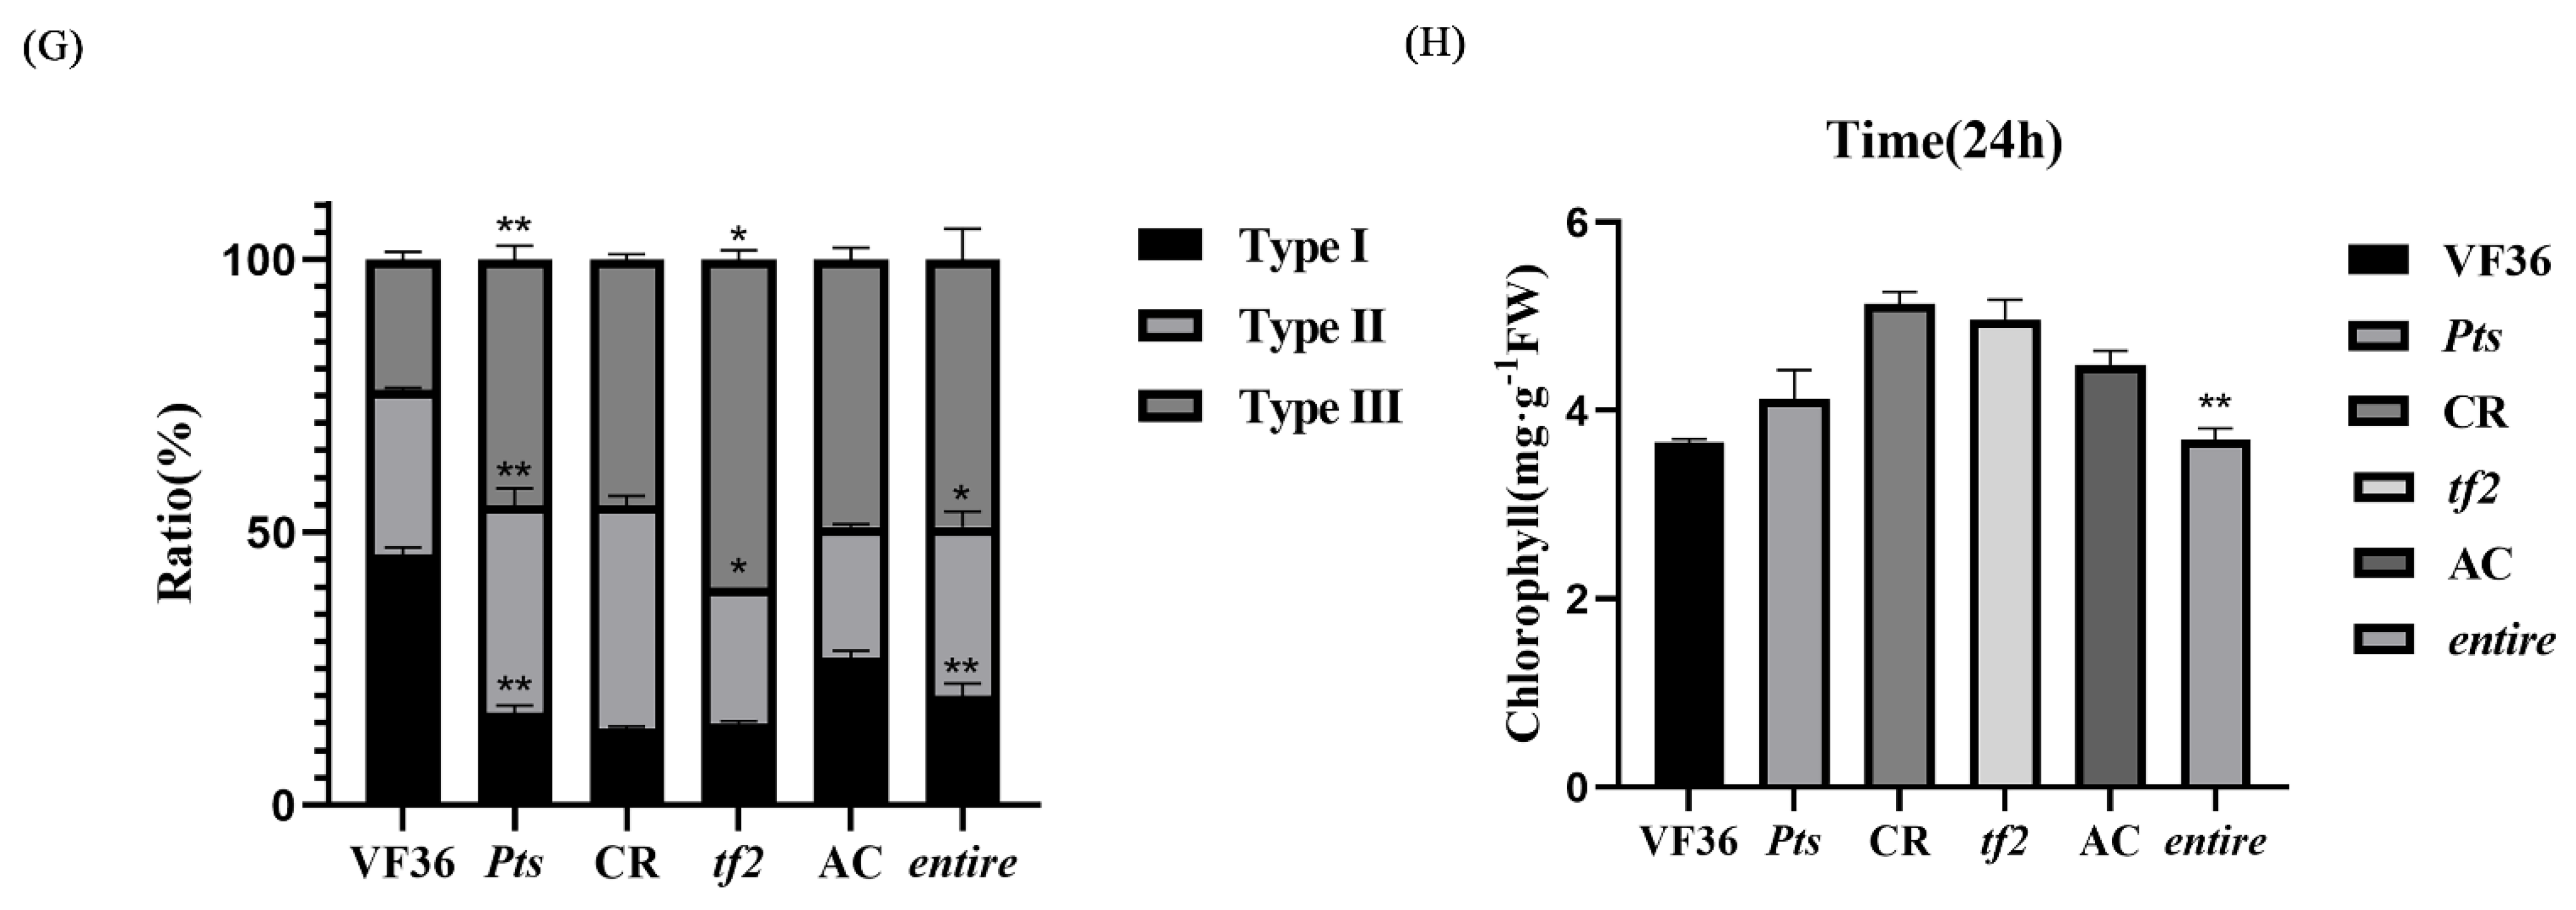
2.2. The Simplification and Complexity of Leaves Can Affect Leaf Hair Development and Cell Division

The delay or promotion of leaf development affected leaf complexity. An increase in the number of compound leaves in the Pts mutant enhanced leaf complexity, whereas the tf2 and e mutants showed reduced leaf complexity due to a reduction in the number of compound leaves. Compared with tomatoes, potatoes, eggplants, and peppers, the premature development of the trichomes or the premature erect leaf primordia formed relatively simple leaves [15]. Scanning electron microscopy showed that the leaf hair number of Pts was significantly lower than that of the wild type, whereas the number of leaf hairs in tf2 and e was significantly higher than that in the wild types (Figure 2A–G). We analyzed the leaf cells to investigate whether premature or delayed leaf maturation affected the leaf epidermal cell levels. The results showed that the number of epidermal cells in the Pts mutant plant was significantly higher than that in the wild-type plant, but the cell size was smaller. The number of epidermal cells in the tf2 and e mutants decreased significantly, and the cells were larger (Figure 2H–T). These results indicate that early leaf maturation simplifies leaves, increases leaf hairs, decreases the division ability of epidermal cells, and increases the expansion of epidermal cells, whereas delayed leaf maturation decreases leaf hairs, increases the division ability of epidermal cells, prolongs the division period, and shortens the expansion period.

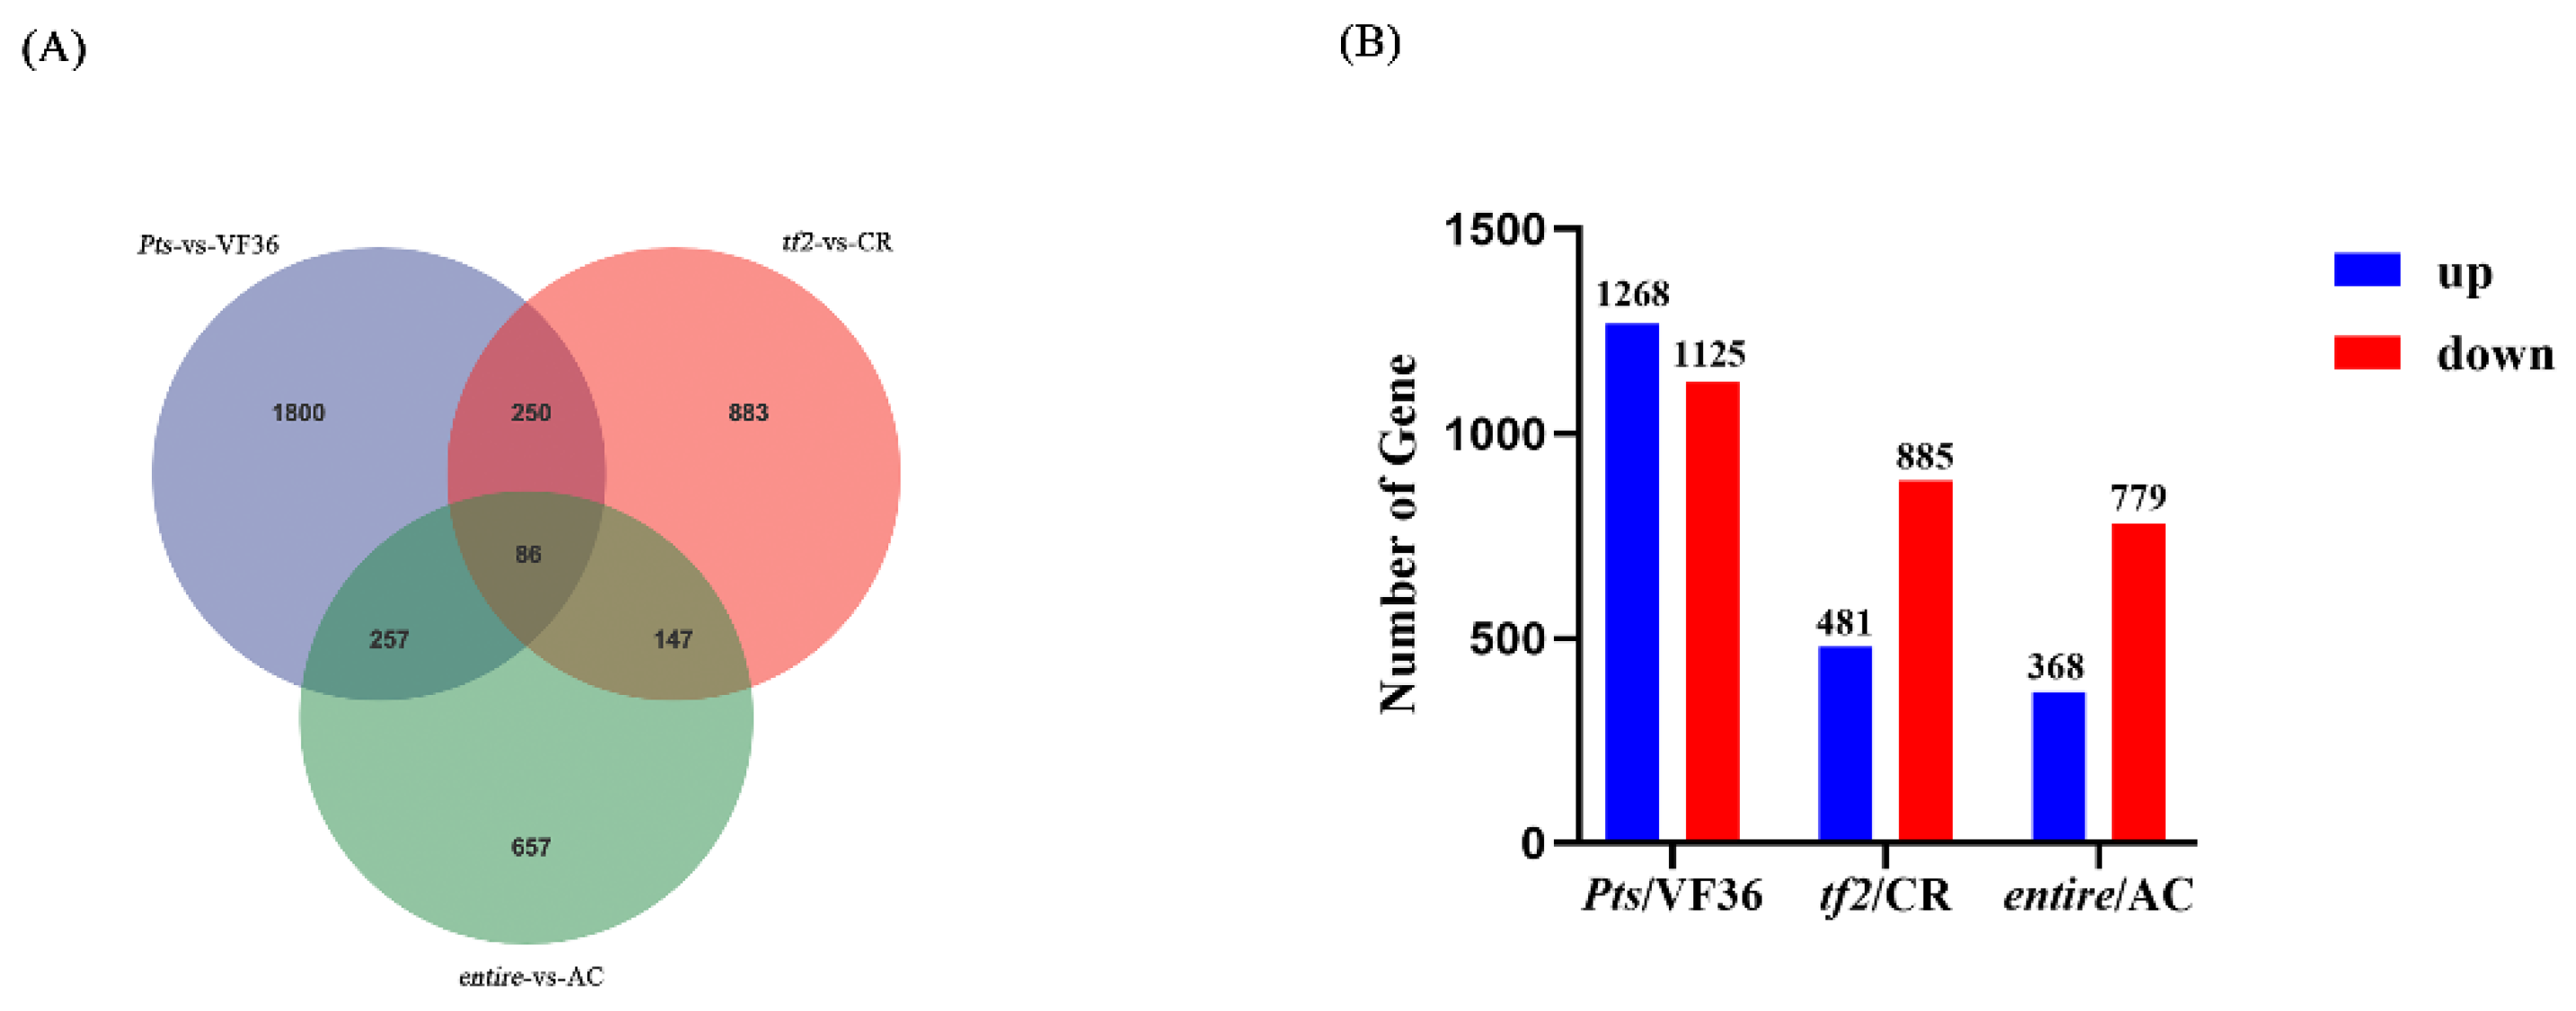
2.3. Transcriptome Sequencing among Pts/VF36, tf2/CR, and e/AC Groups

To identify the DEGs in the tomato mutants with different leaf shapes, we took the fifth true leaf at 45 days. A total of 18 RNA libraries were constructed from Pts, tf2, e, and their respective wild-type leaf samples. Raw reads were generated via the high-throughput sequencing of the six samples with three replicates each (Table S1). After data filtering, the useful reads of the sequencing results for each cDNA library accounted for >87.03% of the raw reads (Q30 > 91.78%) (Table S1). Among the 18 samples, 94.63–96.08% of the reads could be mapped to the tomato genome 4.0 (https://solgenomics.net, on 2 December 2022). Of these mapped reads, 93.84–97.23% matched uniquely. The transcriptome analysis showed 86 overlapping DEGs in the 3 groups—Pts/VF36, tf2/CR, and e/AC; 250 DEGs were detected in the Pts/VF36 and tf2/CR groups, 257 were detected in the Pts/VF36 and entire/AC groups, and 147 were detected in the tf2/CR and entire/AC groups (Figure 3A). A systematic analysis, a database comparison, gene annotation, data acquisition, and a prediction were performed on the 86 genes. Finally, eight candidate genes were screened according to the trend of increasing or decreasing differences in gene expression among the three groups—Pts/VF36, tf2/CR, and e/AC (Table 1). We found four GDSL genes, one MADS transcription factor family gene, one abscisic acid receptor (PYL4) gene, and two fatty-acid-related genes.
The transcriptome analysis showed 2393 DEGs in Pts/VF36, 1268 upregulated genes and 1125 downregulated genes; 1366 DEGs in tf2/CR, 481 upregulated genes and 885 downregulated genes; and 1147 DEGs in entire/AC, 368 upregulated genes and 779 downregulated genes (Figure 3B). The transcription factor families, such as WOX, TCP, bHLH, MADS, WRKY, and MYB, were identified via the analysis of the differentially expressed transcription factors (Figure 3C–E). A total of seven DEGs (bHLH155, MYB13, MADS, MADS-2, TCP12, TCP13, and TCP22) were screened from these transcription factor families (Tables S3 and S4). As described in the Introduction, these transcription factor families are involved in leaf development.
We performed Gene Ontology (GO) and Kyoto Encyclopedia of Genes and Genomes (KEGG) enrichment analyses to further analyze the potential biological roles of the DEGs. We found that the DEGs in Pts/VF36 were mainly enriched in the cell periphery/GO:0071944, the plasma membrane/GO:0005886, transcription regulator activity/GO:0140110, DNA-binding transcription factor activity/GO:0003700, the small-molecule biosynthetic process/GO:0044283, the fatty acid biosynthetic process/GO:0006633, and the cell/GO:0005623 (Figure S2A). The DEGs in tf2/CR were mainly enriched in catalytic activity, oxidoreductase activity/GO:0016491, and the oxidation–reduction process/GO:0055114 (Figure S2B). The DEGs in entire/AC were mainly enriched in the thylakoid/GO:0009579, the chloroplast thylakoid/GO:0009534, the thylakoid membrane/GO:0042651, the photosystem/GO:0009521, and photosynthesis/GO:0015979 (Figure S2C). In the KEGG enrichment analysis, we found that the DEGs in tf2/CR were mainly enriched in amino sugar and nucleotide sugar metabolism, phenylpropanoid biosynthesis, and the MAPK signaling pathways, whereas the DEGs in Pts/VF36 and entire/AC were mainly enriched in plant hormone signal transduction (Figure S2D–F).

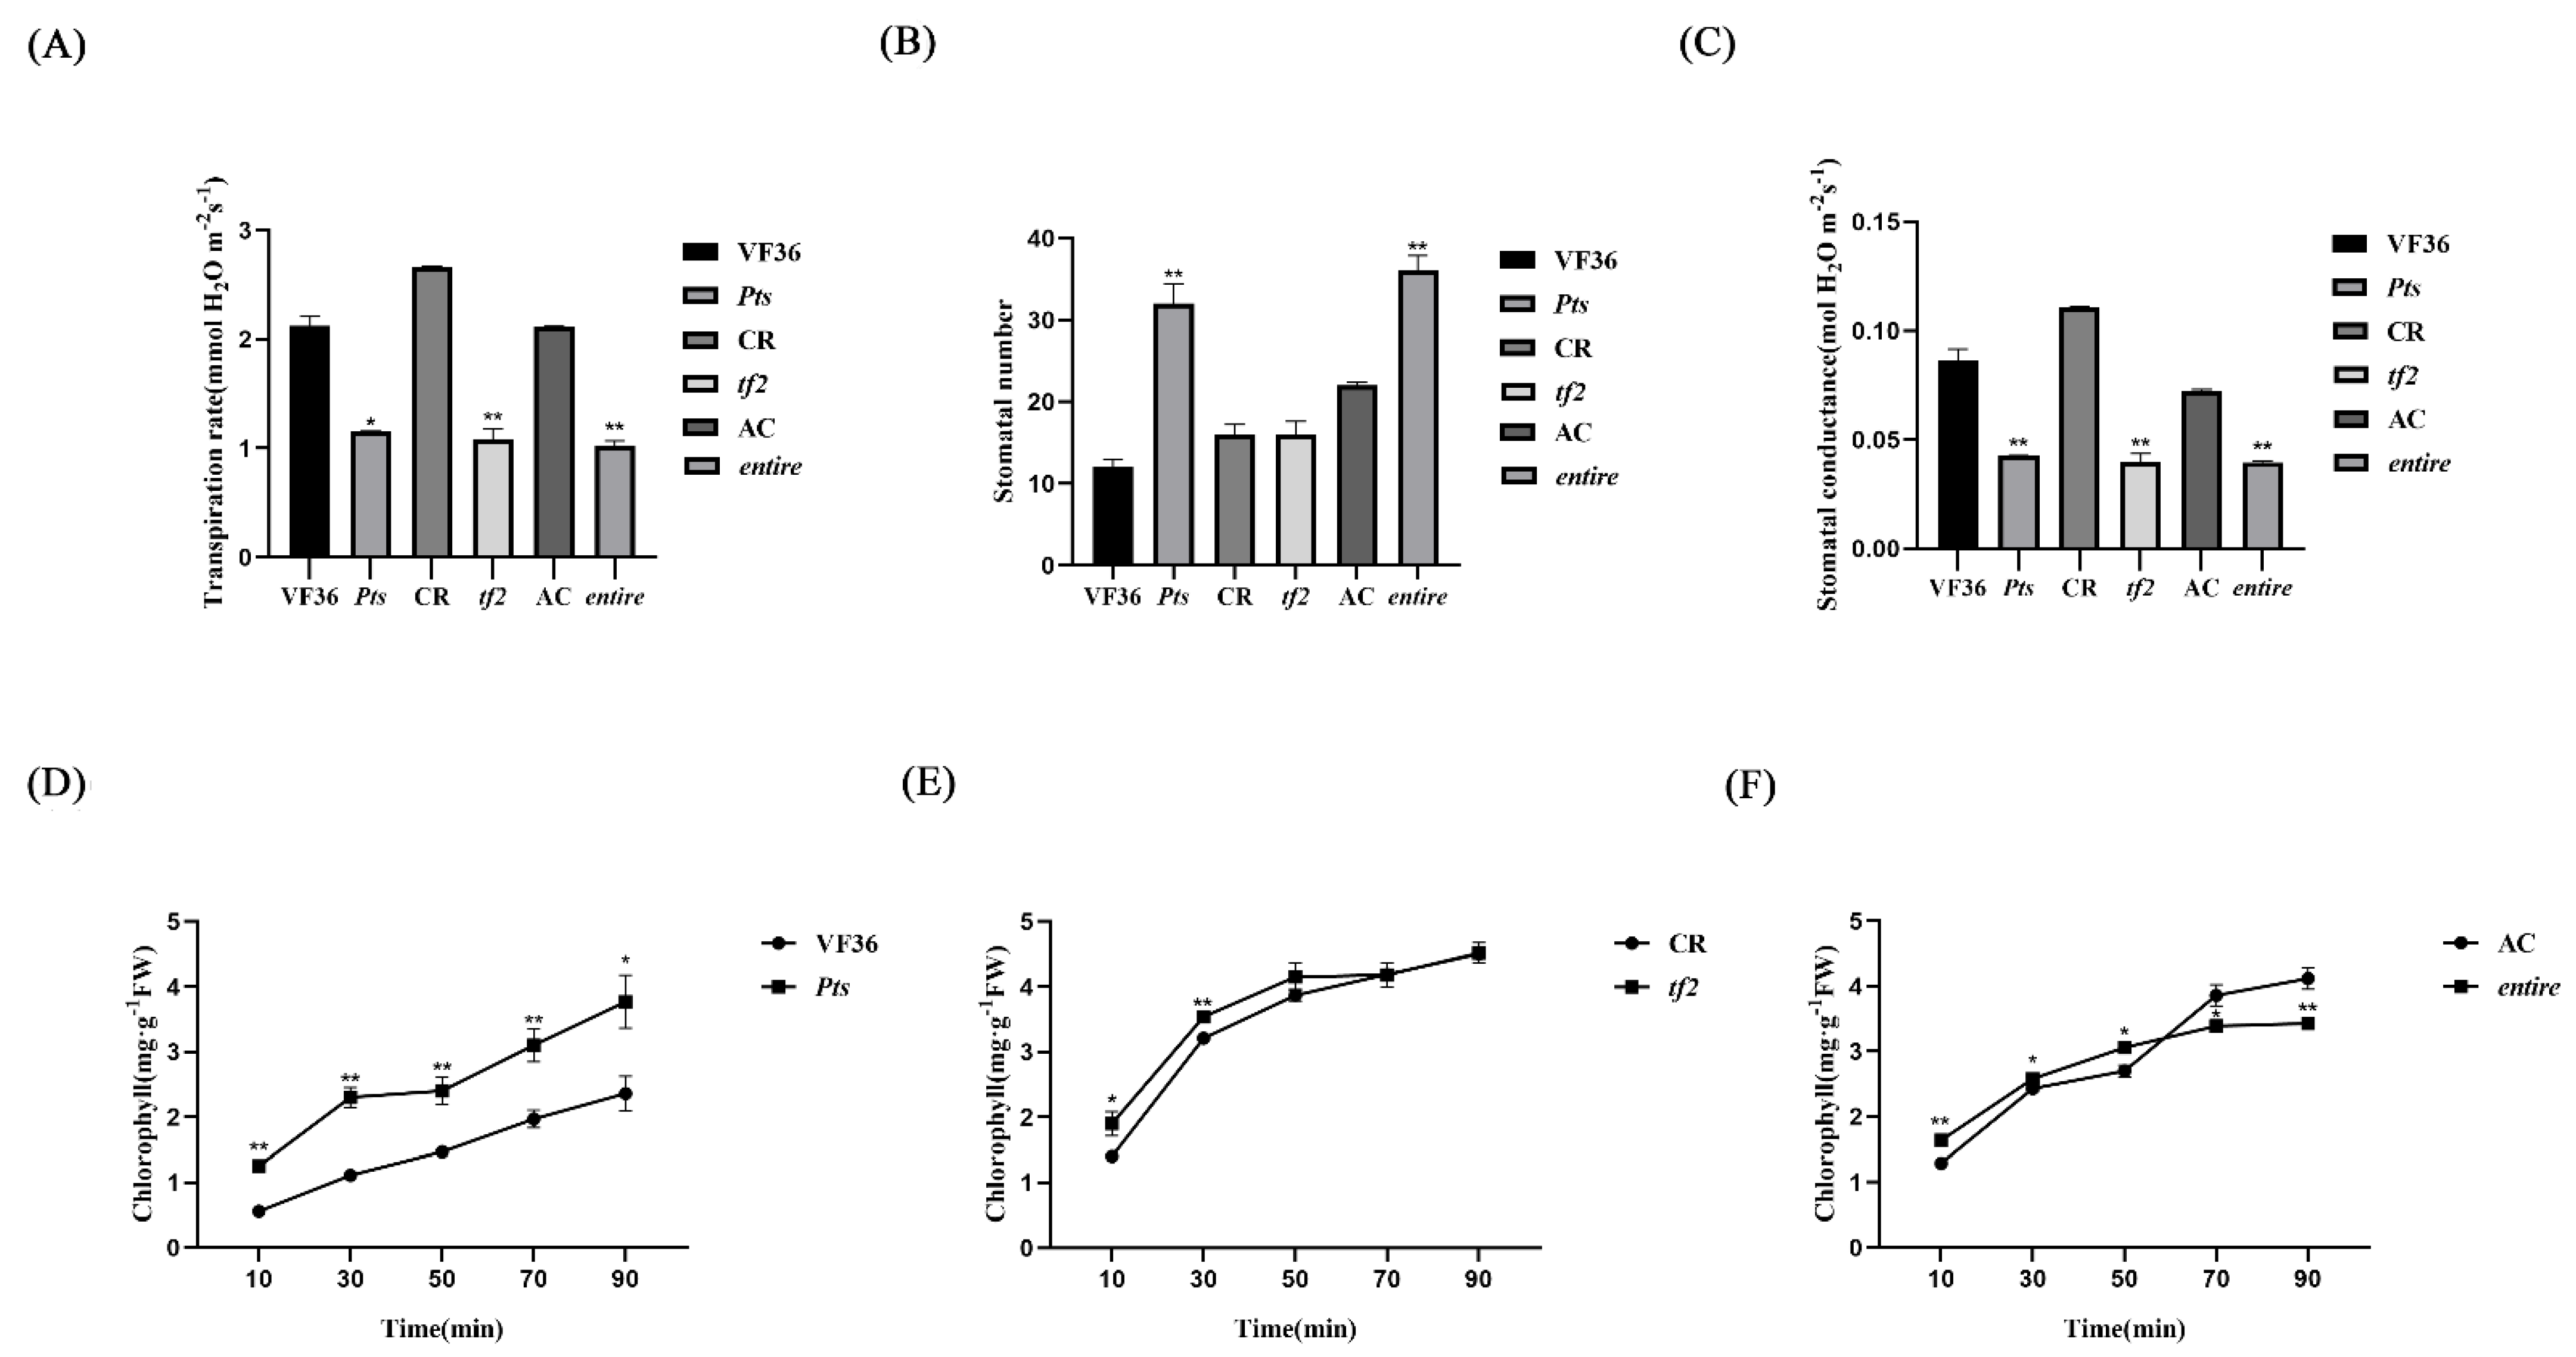
2.4. Transpiration Rate, Stomatal Conductance, and Epidermal Cell Permeability Are Closely Related to GDSL Esterase/Lipase Expression

As mentioned above, the four GDSL genes showed a gradual downregulation trend in the three transcriptomes (Table 1). Previous studies have shown that GDSL genes are related to wax biosynthesis and stomatal outer cuticular ledge (OCL) formation [41]. Therefore, we analyzed the corresponding indices of the stomata. The number of stomata in Pts and e was significantly higher than that in the wild types, with no significant difference in the number of stomata between tf2 and the wild type (Figure 4B). However, the transpiration rate and stomatal conductance of the three mutants were significantly decreased compared to those of the wild types (Figure 4A,C). Based on previous studies, we divided the stomata into three types: type I, normally opened stomatal pores; type II, stomatal pores that were not fully occluded; and type III, stomatal pores that were fully covered [41]. We found that the stoma status of the mutants and their wild types differed according to the statistics of the three types of stomata (Figure 4G). Although the number of stomata changed significantly, the opening and closing state of the stomata was the key factor affecting the transpiration rate. The chlorophyll leaching rate was positively correlated with cell permeability. The results of the chlorophyll leaching experiment further verified that the cell permeability of the mutants was enhanced. The leaching rate of the Pts mutant was significantly higher than that of the wild type at 10–90 min (Figure 4D). The leaching rate of tf2 was significantly higher than that of the wild type at 10–30 min, and the subsequent time was similar to that of the wild type (Figure 4E). The leaching rate of mutant e was significantly higher than that of the wild type at 10 min, 30 min, and 50 min but was significantly lower than that of the wild type at 70–90 min (Figure 4F). We measured the total chlorophyll content at 24 h and found no significant difference in the Pts and tf2 mutants compared with their respective wild types, but the total chlorophyll content of mutant e was significantly lower than that of the wild type (Figure 4H). Thus, the leaching rate of mutant e at 70–90 min was significantly lower than that of the wild type.

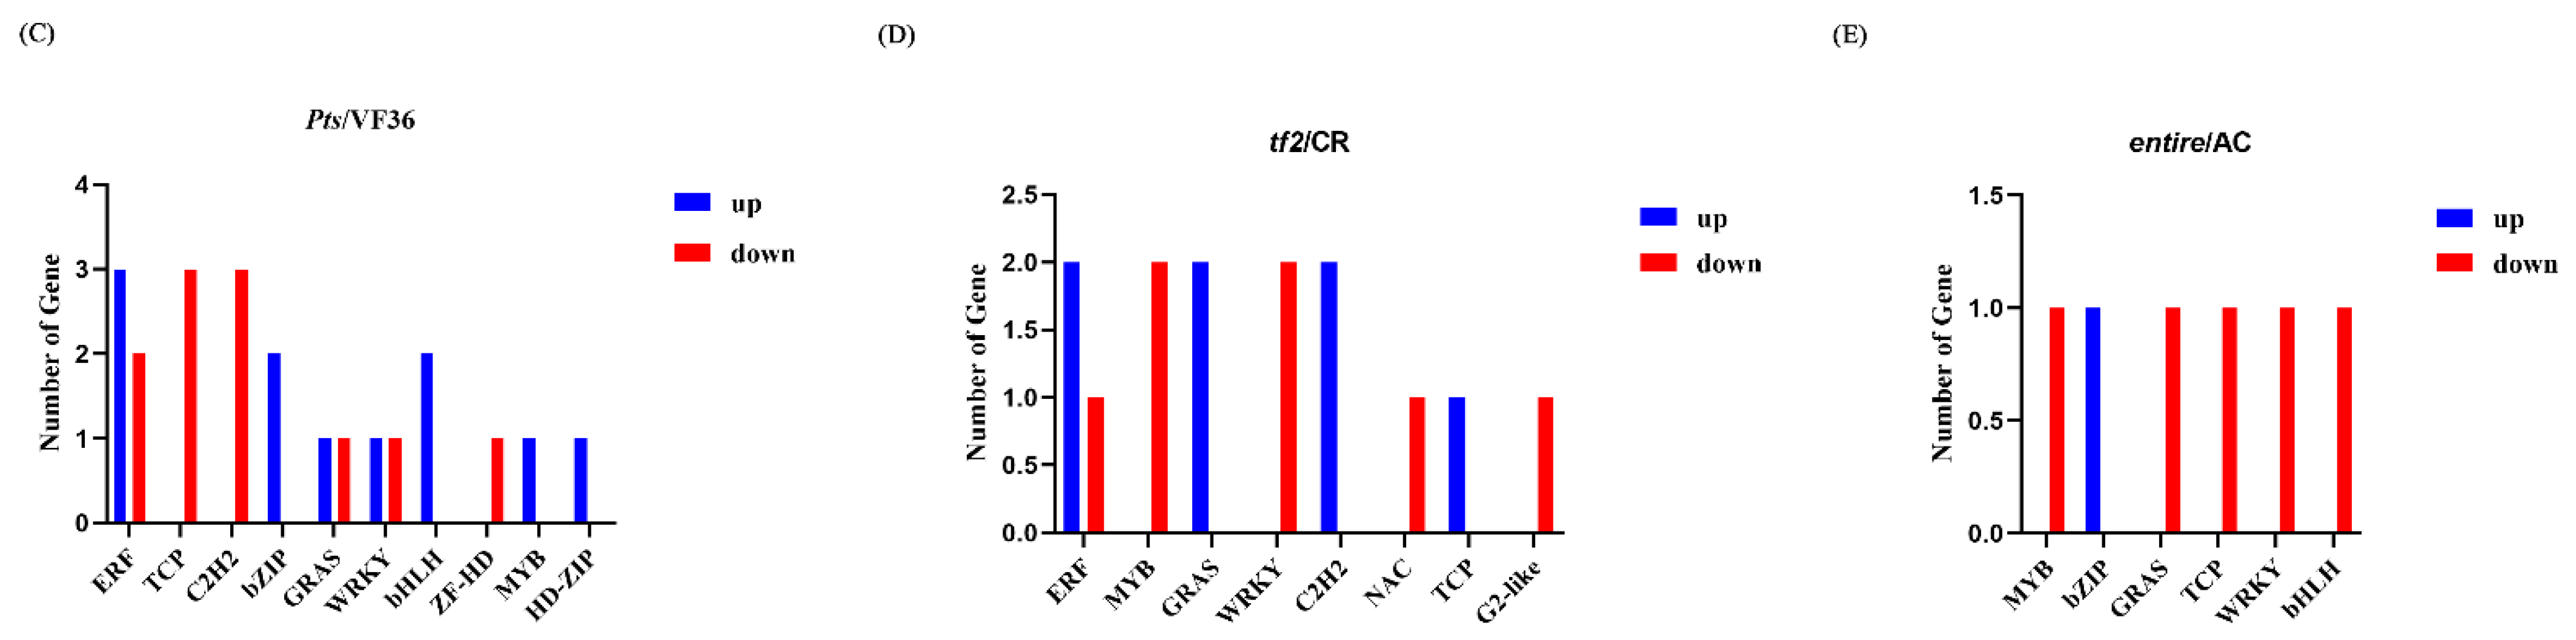
2.5. Differentially Expressed Genes in Pts/VF36 and tf2/CR, Pts/VF36 and e/AC, and tf2/CR and e/AC

The above results indicate that GDSL was not the key factor affecting leaf morphology but that the expression of GDSL could be changed due to different leaf morphologies. Therefore, to further determine the key factors affecting leaf development, we compared the DEGs in groups of two of the transcriptomes to expand the scope of screening. By analyzing the overlapping DEGs, we found five DEGs in the Pts/VF36 and tf2/CR comparison group (Table S6) and two in the Pts/VF36 and entire/AC comparison group (Table S7), which was similar to that in the tf2/CR and entire/AC comparison group (Table S8). The DEGs were identified as bHLH079, IAA-aah, GA2ox7, GA20ox, WRKY44, and WRKY76. Auxin and gibberellic acid (GA) play key roles in leaf development. Auxin coordinates the phyllotaxis of leaf initiation from the SAM and determines the location of serrations and the initiation of the leaflets and lobes from the margin of the leaf primordia [42]. In leaf development, GA regulates cell proliferation and expansion and leaf complexity [24,25,27,43]. The transcription factors of the bHLH and WRKY families have also been shown to play roles in leaf development. AtLP1 and AtLP2, two bHLH/HLH homologs in Arabidopsis thaliana, positively regulate leaf cell elongation [16], and NtWRKY4 participates in leaf morphogenesis [44].

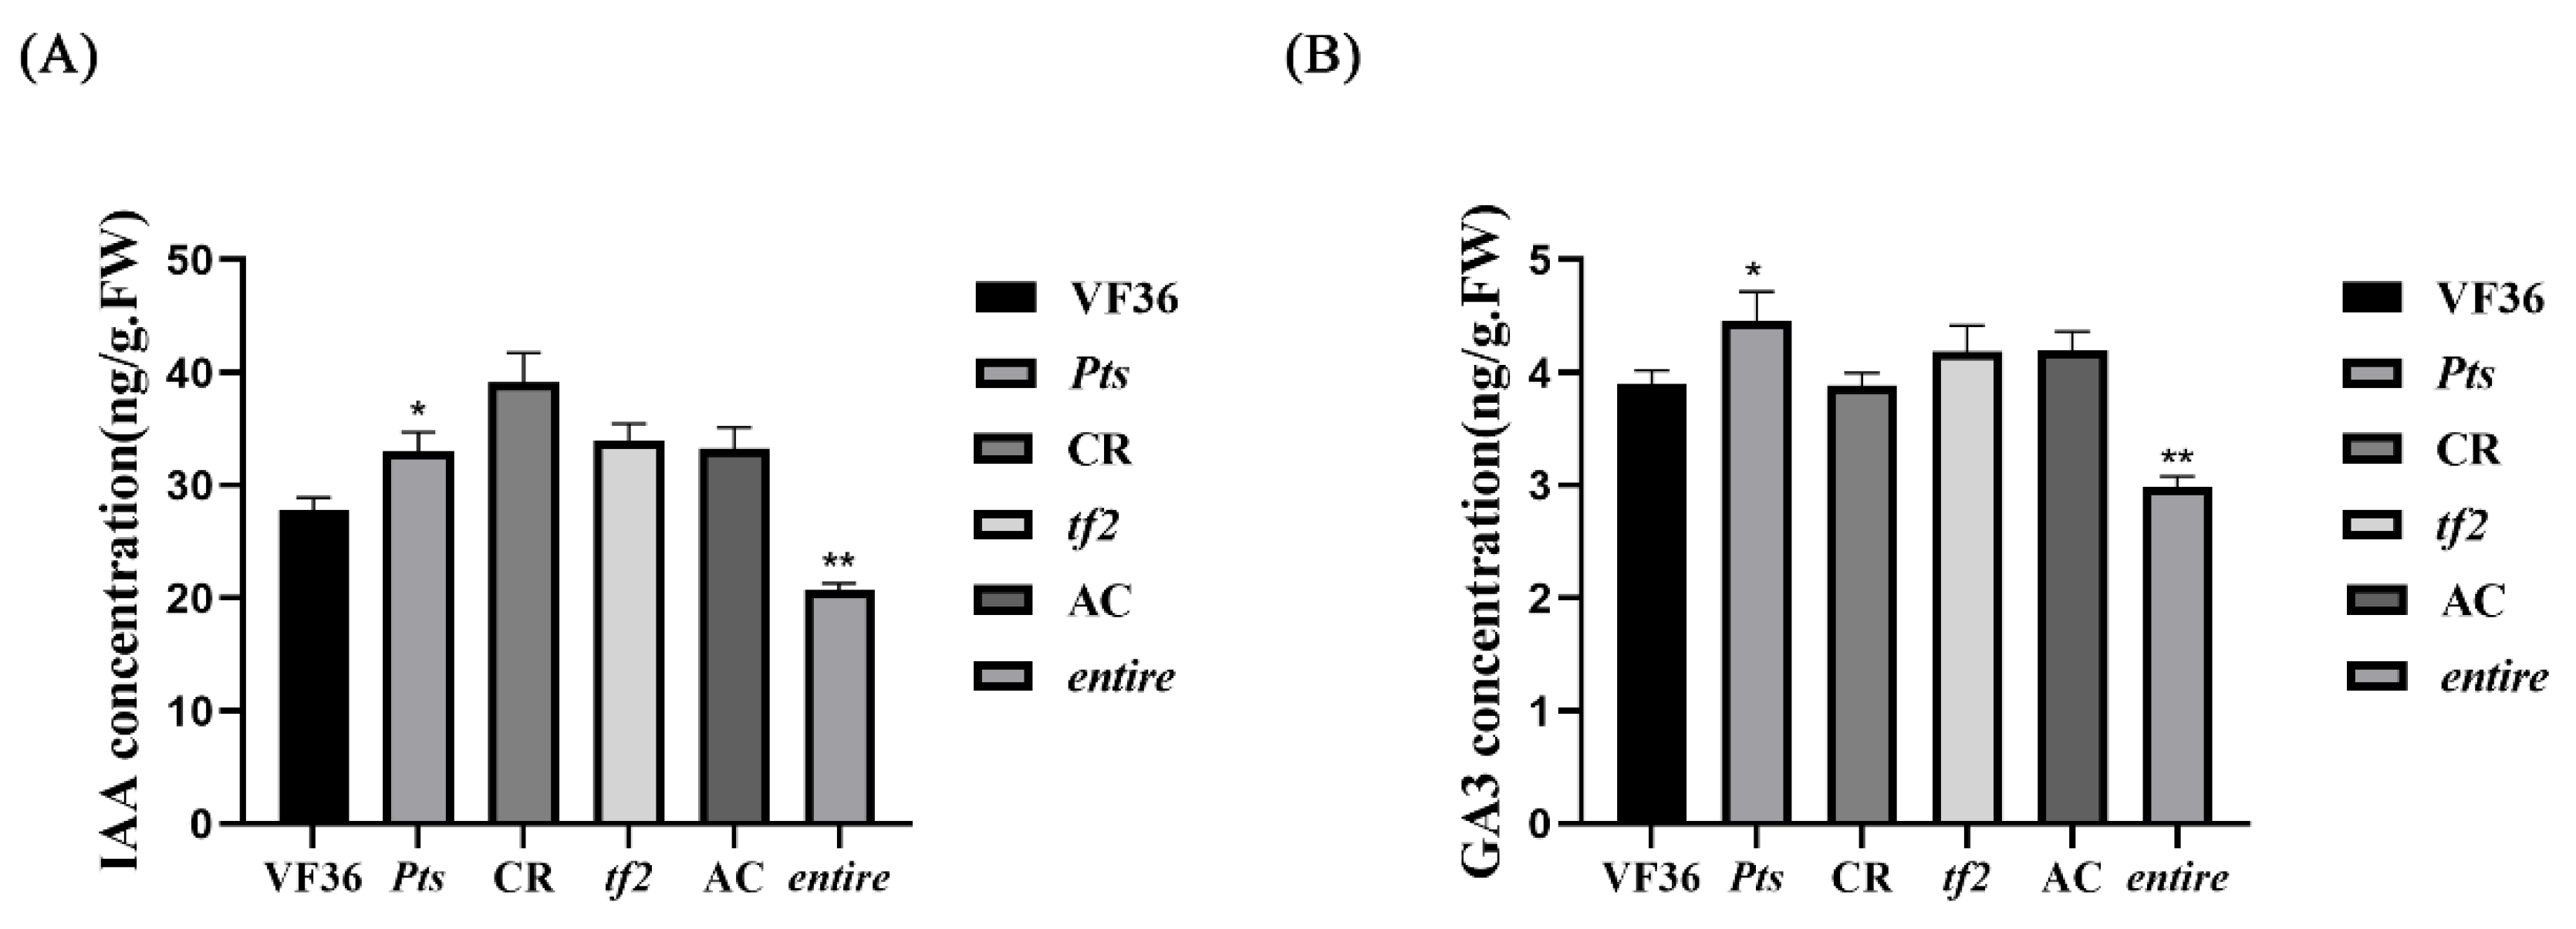
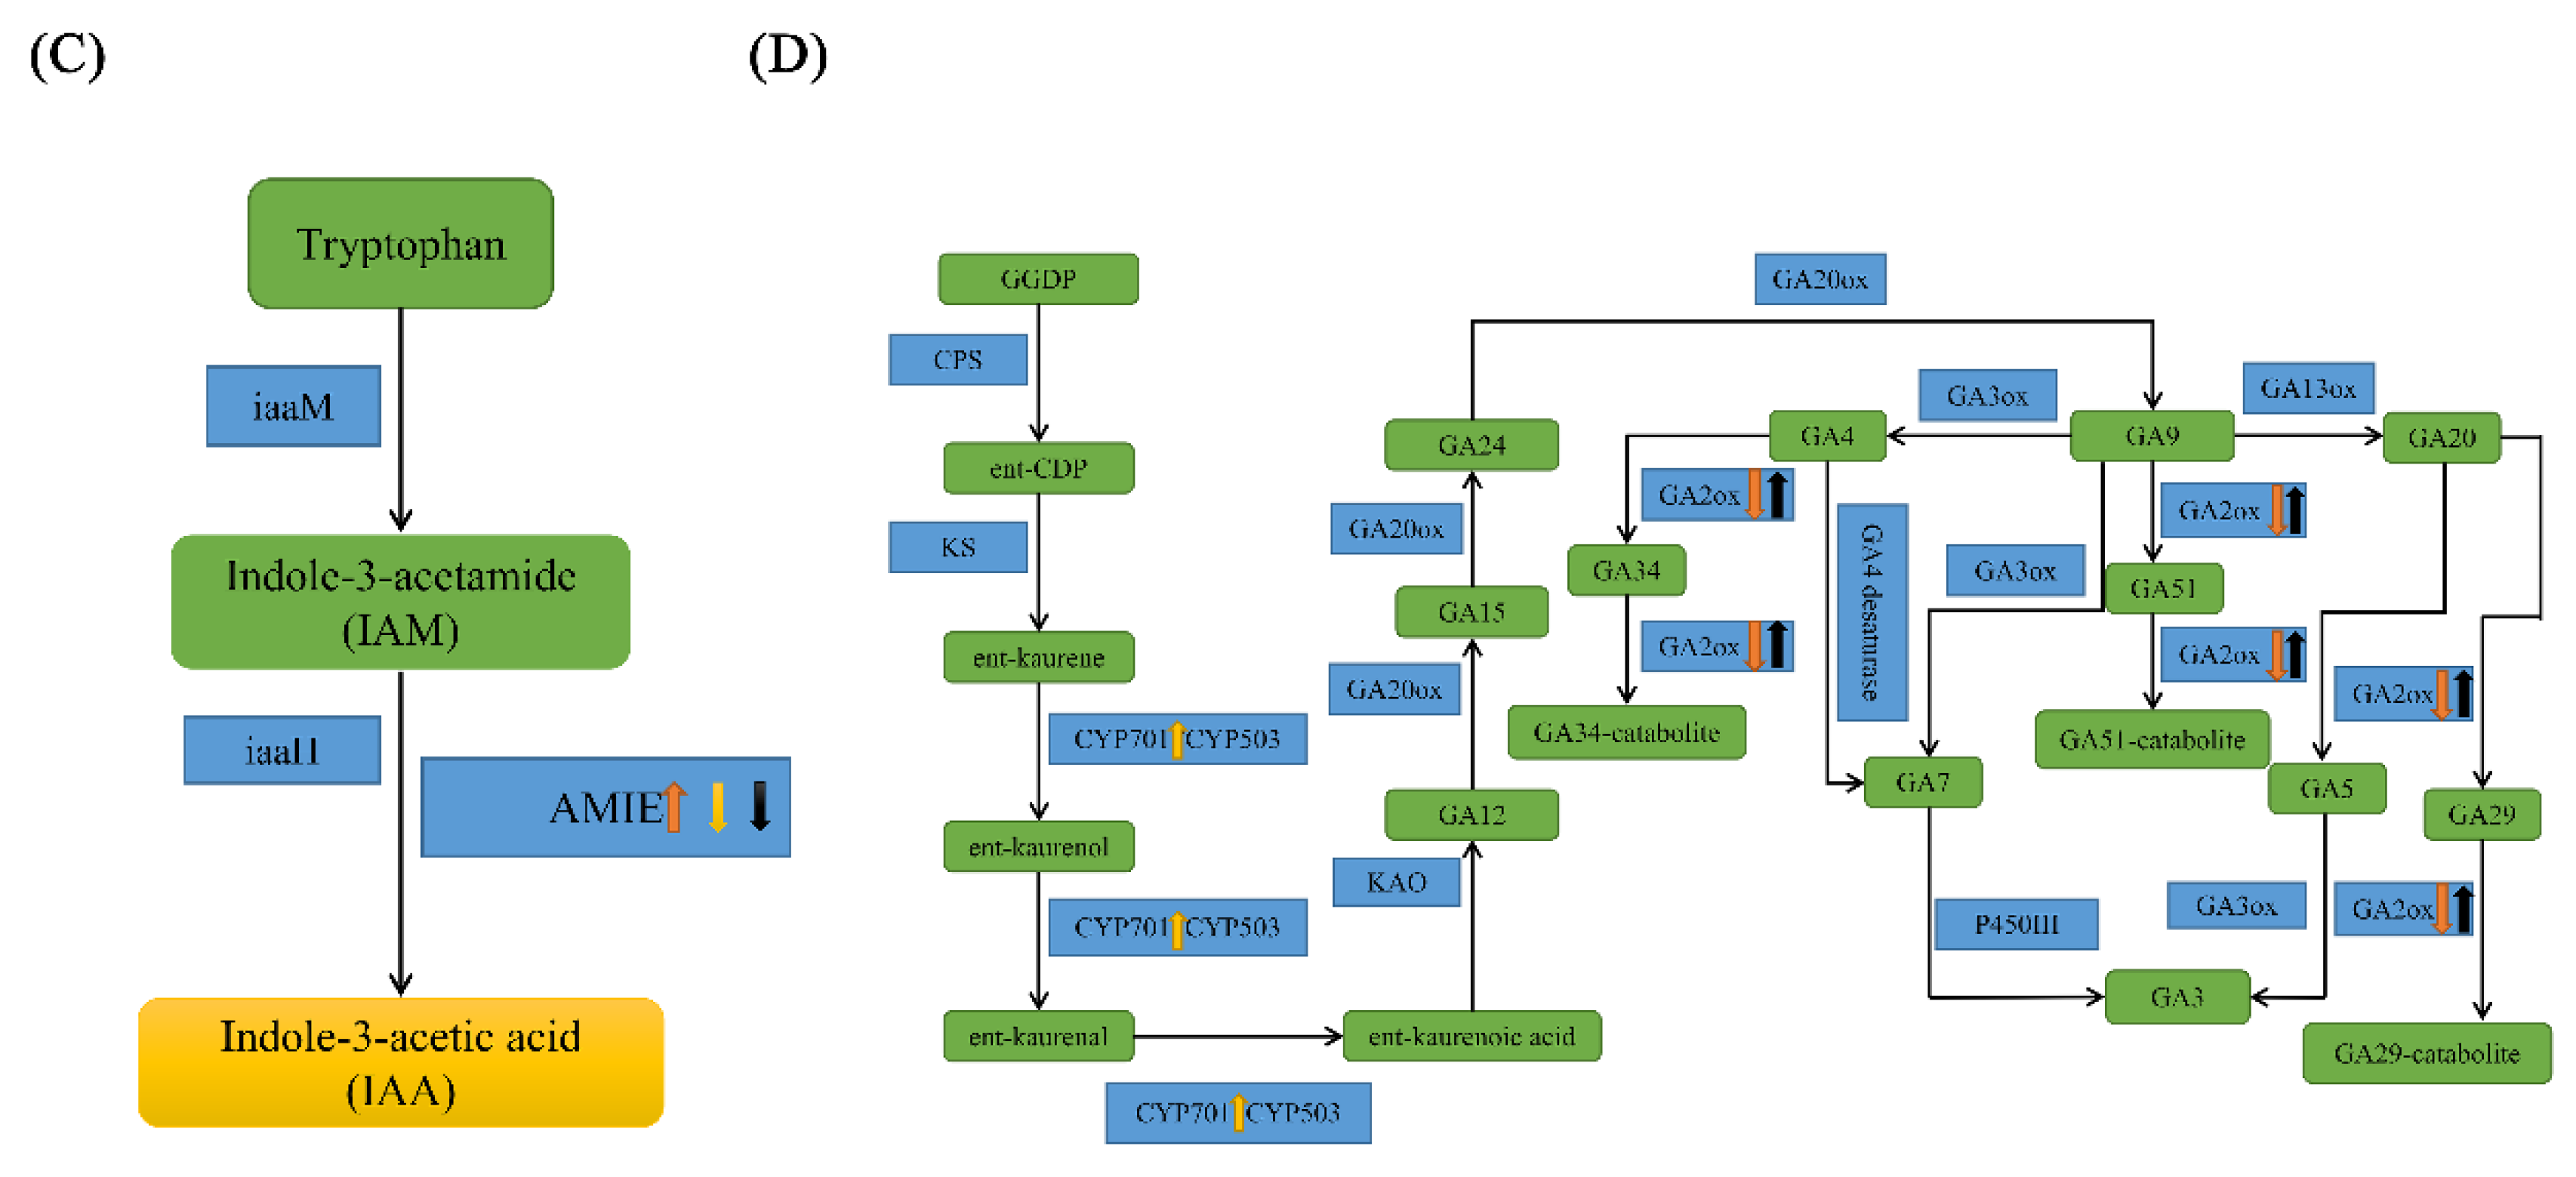
2.6. IAA and GA May Regulate Compound Leaf Shape Formation in Tomatoes

Plant hormones are key factors affecting leaf development and morphogenesis. As mentioned above, IAA-aah and GA2ox7 were differentially expressed in Pts/VF36 and tf2/CR, and GA20ox was differentially expressed in Pts/VF36 and e/AC. Therefore, we selected these two hormones for further analysis. The auxin and GA3 content increased in Pts/VF36, and the auxin and GA3 content decreased in entire/AC (Figure 5A,B). In the IAM pathway of auxin synthesis, the upregulation of AMIE gene expression in Pts led to an increased auxin content. The synthesis of the tf2 and e proteins was decreased due to the downregulation of the expression of the AMIE gene (Figure 5C). In the GA biosynthesis pathway, the upregulation of GA2ox gene expression in Pts resulted in reduced GA decomposition ability and increased GA synthesis, whereas the opposite was observed for e. The upregulation of the expression of CYP701 in tf2 increased GA12 synthesis by GGDP, which is the precursor in GA synthesis, thereby increasing the content of GA (Figure 5D). To date, more than 130 GAs have been identified among which GA1, GA3, GA4, and GA7 have the highest bioactivity. Therefore, we estimated the content of GA3 in the tomato mutant and wild-type plants. The GA3 content in Pts and tf2 was higher than that in the wild-type plants, whereas the total content was lower than that in the wild-type plants. To further verify this result, we analyzed the biosynthesis pathway of GA using KEGG and found two key gene groups, cytochrome P450 monooxygenases (CYP701) and GA2ox. In higher plants, GA synthesis is mainly divided into three stages. In plastids, ent-copalyl diphosphate synthase (CPS) and ent-kaurene synthase (KS) catalyze the conversion of the precursor GGPP to ent-kaurene. In the endoplasmic reticulum, the conversion of ent-kaurene to GA12, which is the first C20-GA in the biosynthetic pathway, is catalyzed by two cytochrome P450 monooxygenases, ent-kaurene oxidase (KO) and ent-kaurenoic acid oxidase (KAO) [45,46], and KO belongs to the subfamily CYP701A. In the cytoplasm, GA20ox and GA3ox eventually catalyze GA12 into GA3 with high biological activity (Figure 6D).

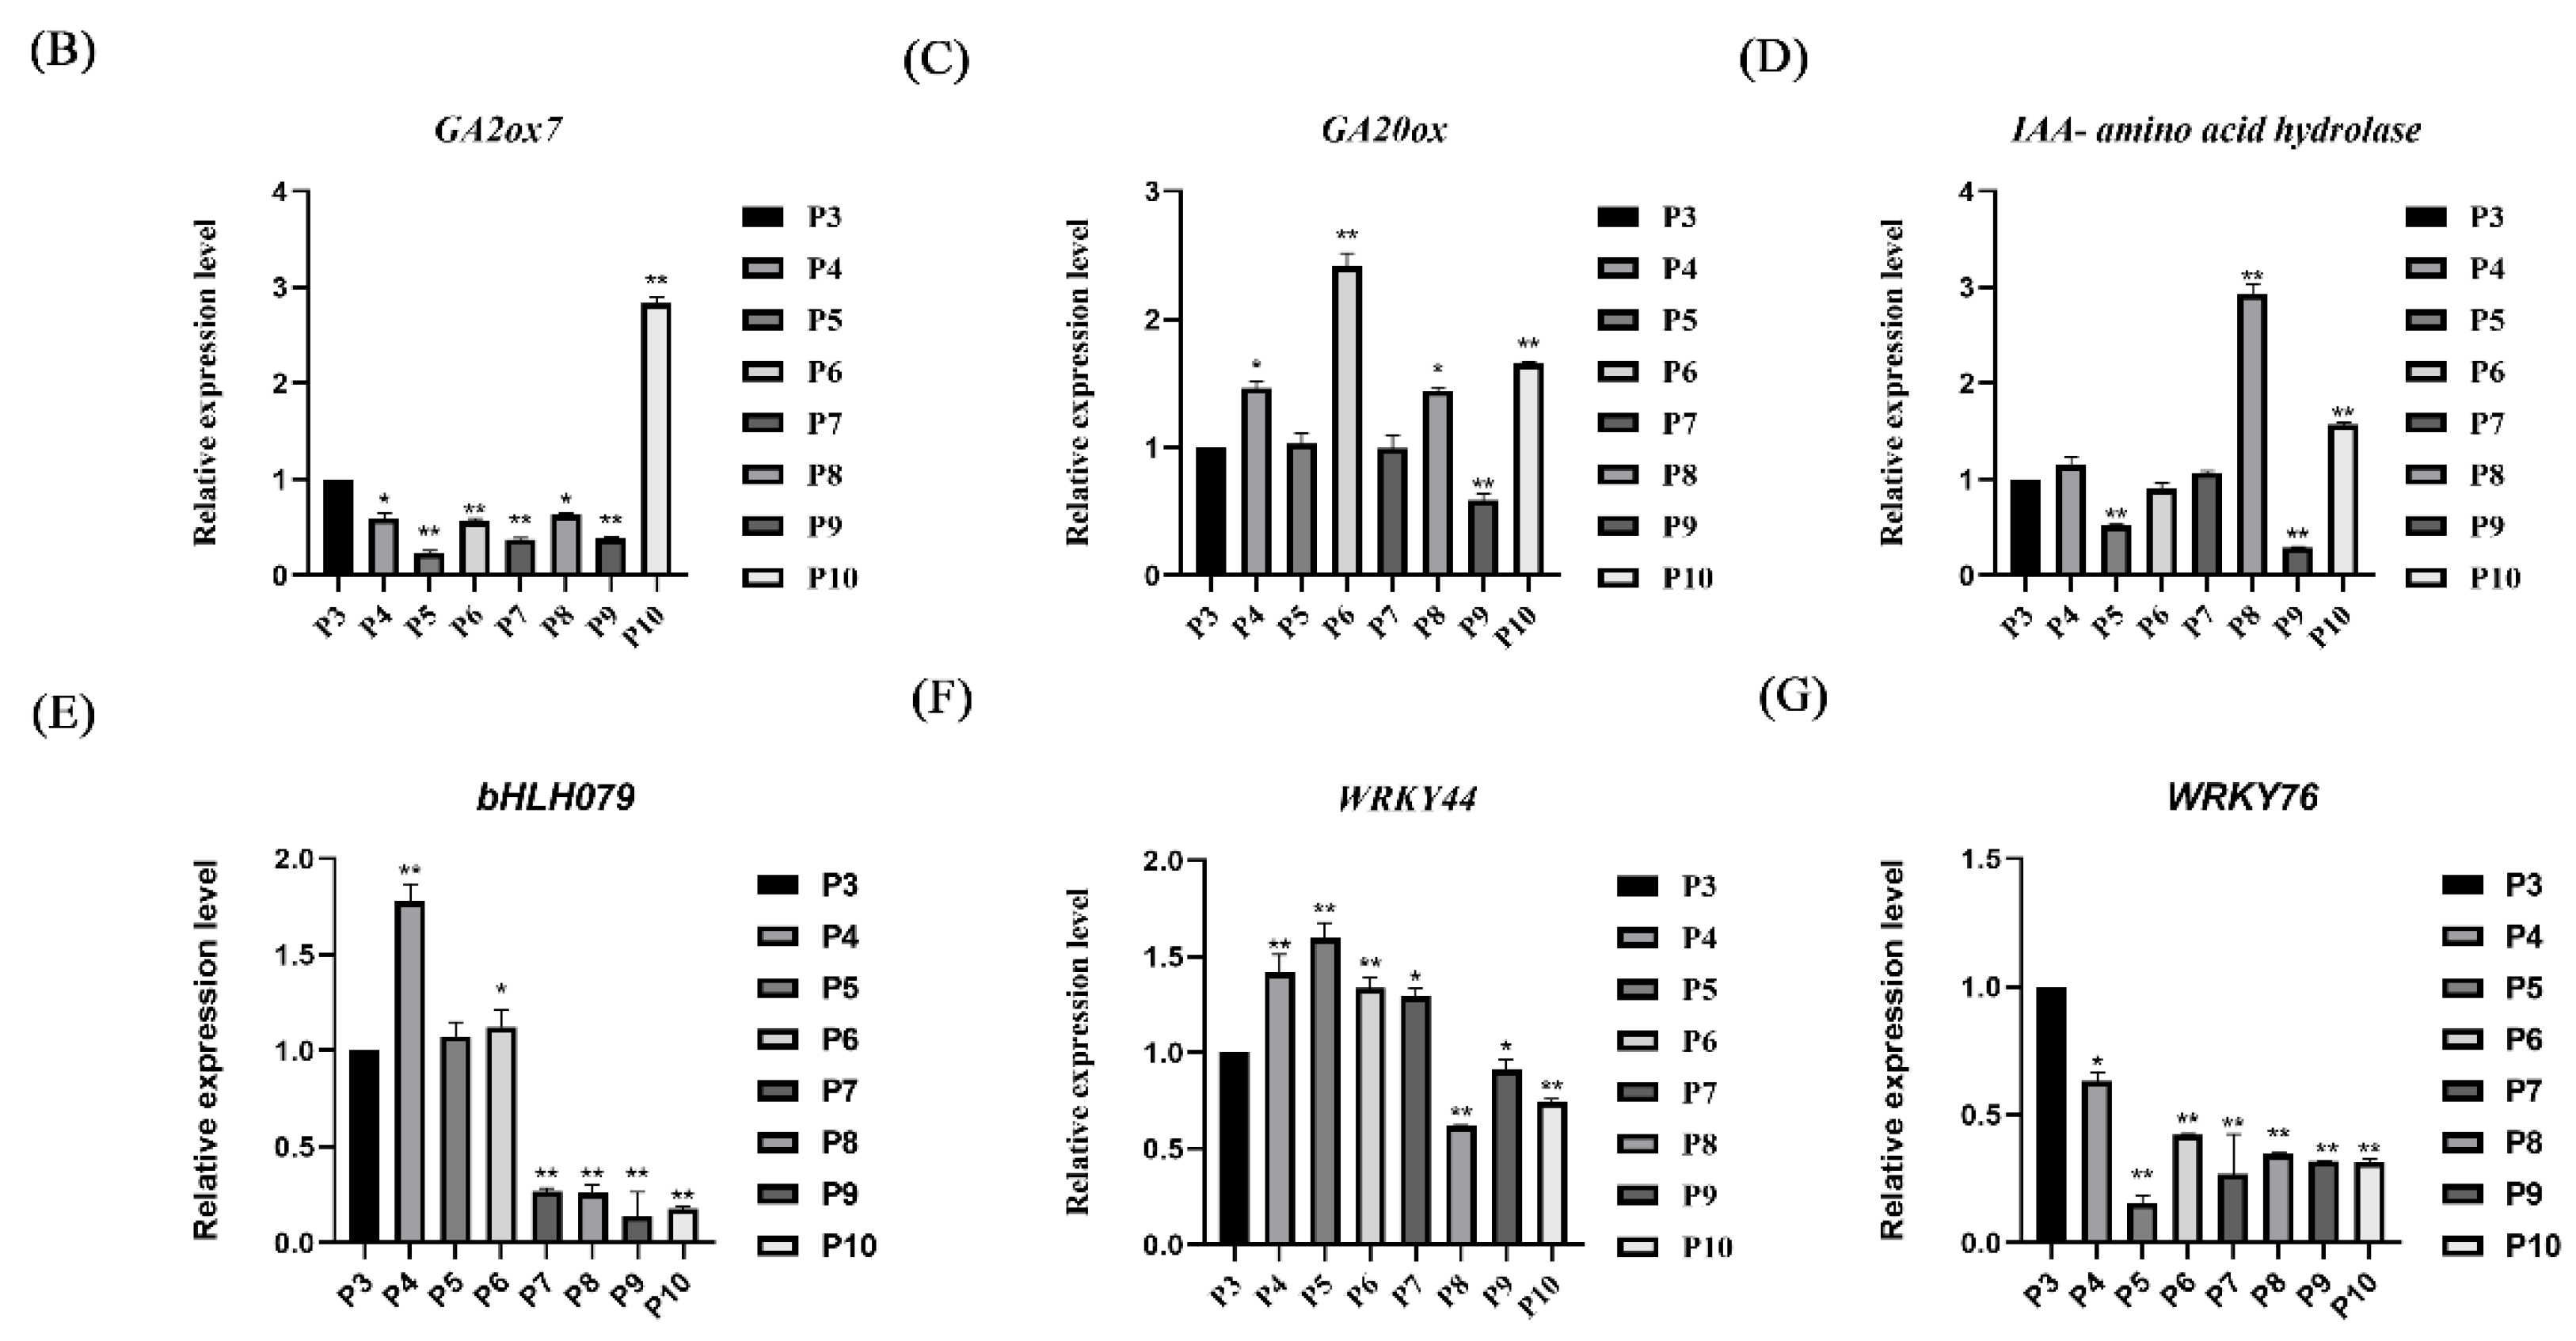
2.7. Identification of the Expression of Candidate Genes at Different Leaf Development Stages in Tomatoes

As mentioned above, we screened six genes by comparing the transcriptomes in groups of two. We selected bHLH079, IAA-aah, GA2ox7, GA20ox, WRKY44, and WRKY76 as candidate genes. To verify whether these are involved in leaf development, we performed RT-qPCR to analyze their expression at the P3–P10 stages of leaf primordium development (Figure 6A–G). Six genes were found to be differentially expressed during leaf primordium development. Specifically, bHLH079 was highly expressed at the P4 stage and was significantly downregulated at the P7–P10 stages (Figure 6E). IAA-aah was highly expressed at the P8 stage, was significantly downregulated at the P9 stage, and was significantly upregulated at the P10 stage (Figure 6D). GA2ox7 expression was significantly downregulated at the P4–P9 stages and was significantly overexpressed at the P10 stage (Figure 6B). GA20ox expression was significantly upregulated at the P4, P6, P8, and P10 stages and was downregulated at the P9 stage (Figure 6C). WRKY44 expression was significantly upregulated at the P4–P7 stages and was downregulated at the P8–P10 stages (Figure 6F). WRKY76 expression was significantly downregulated at the P4–P10 stages (Figure 6G). Therefore, bHLH079, IAA-aah, GA2ox7, GA20ox, WRKY44, and WRKY76 may play important roles in the regulation of tomato compound leaf development. Next, these six genes were verified using VIGS.

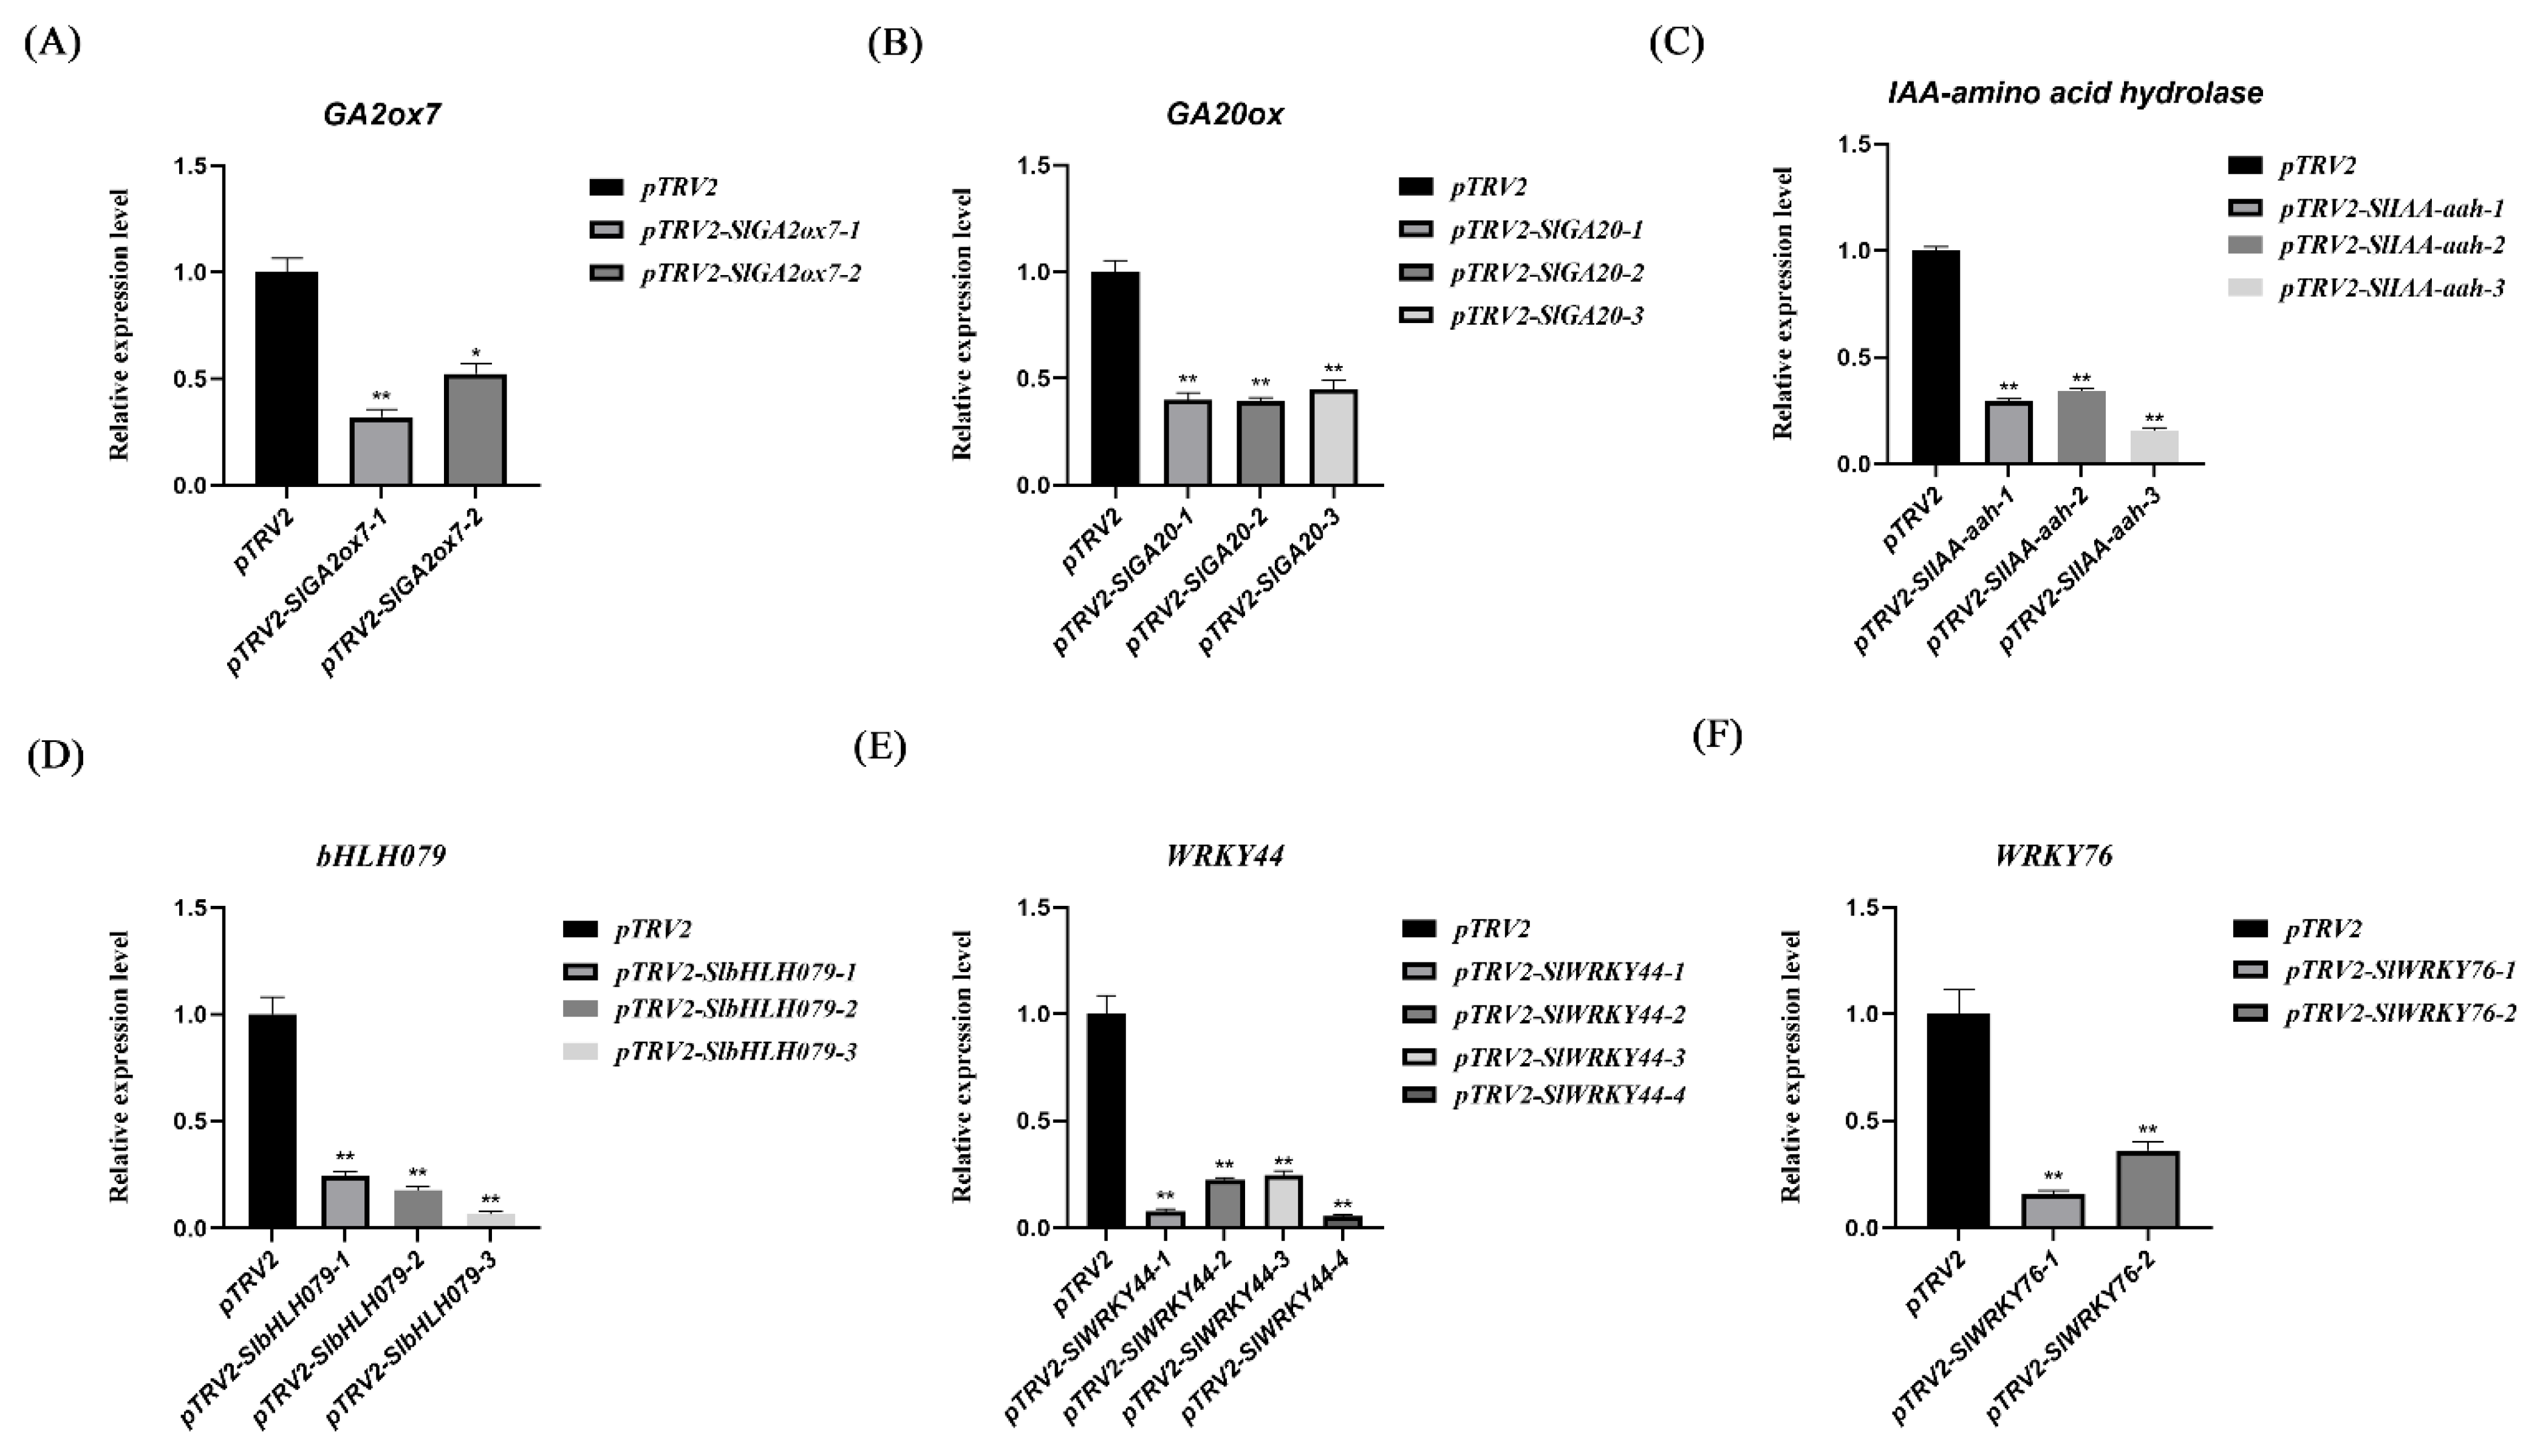
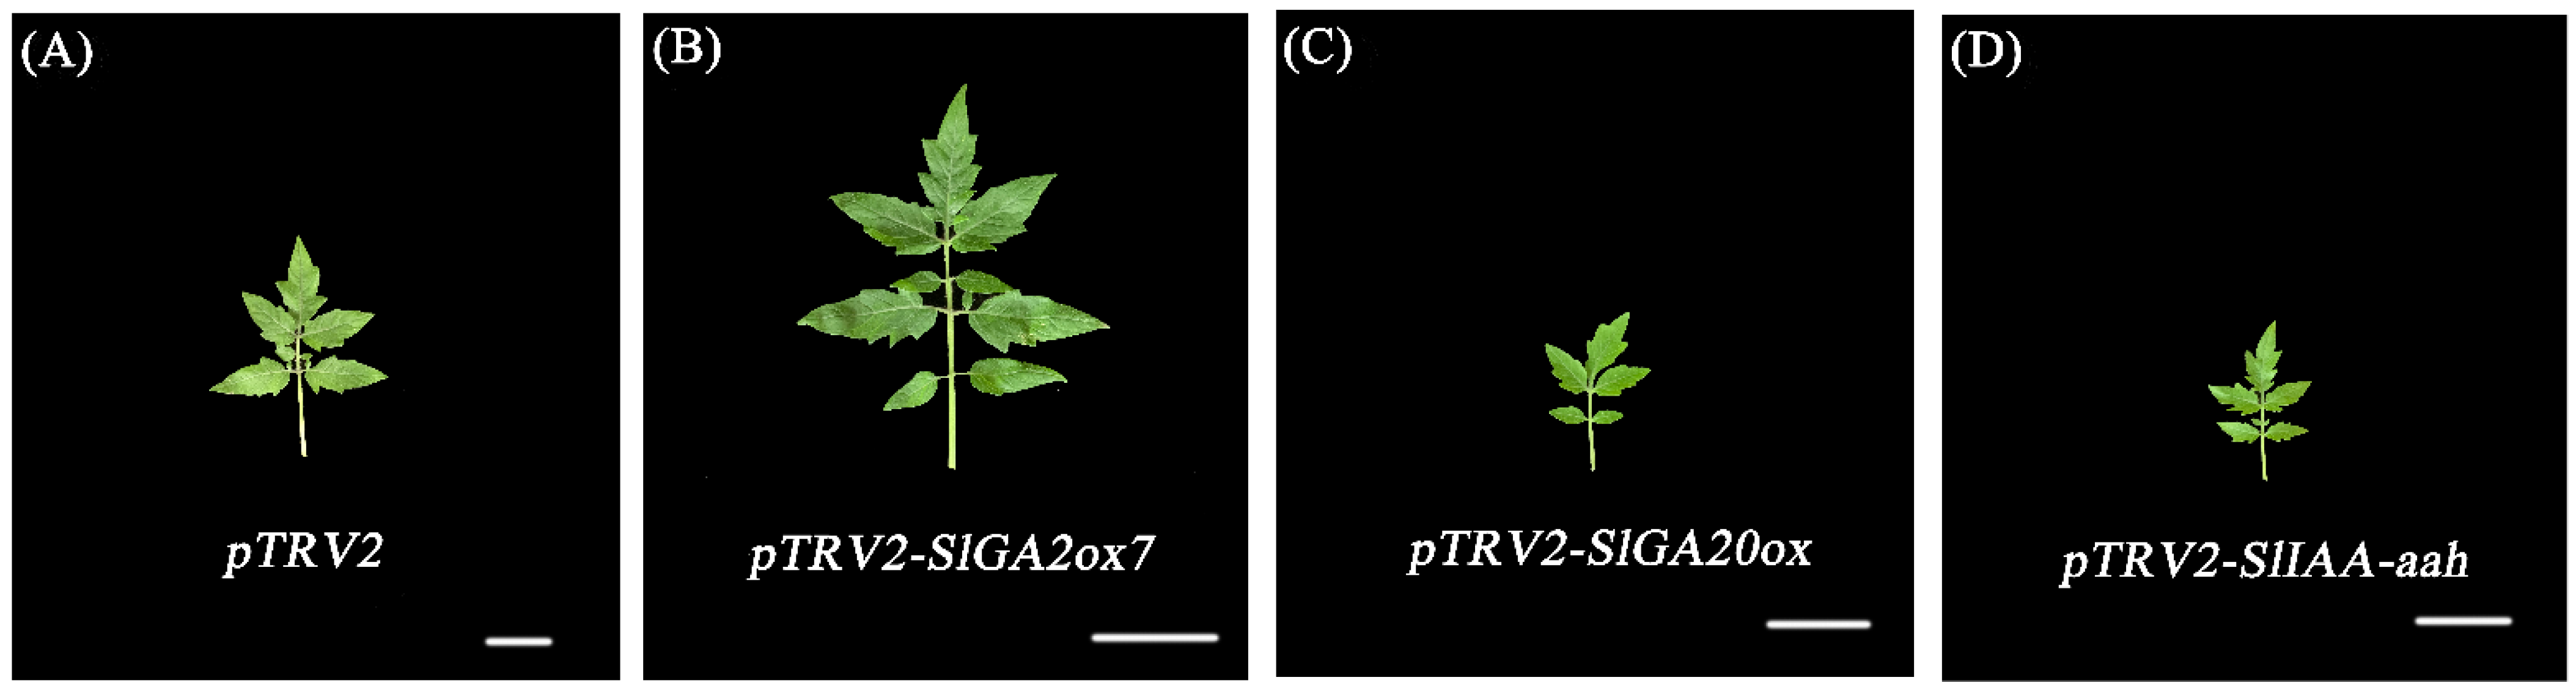
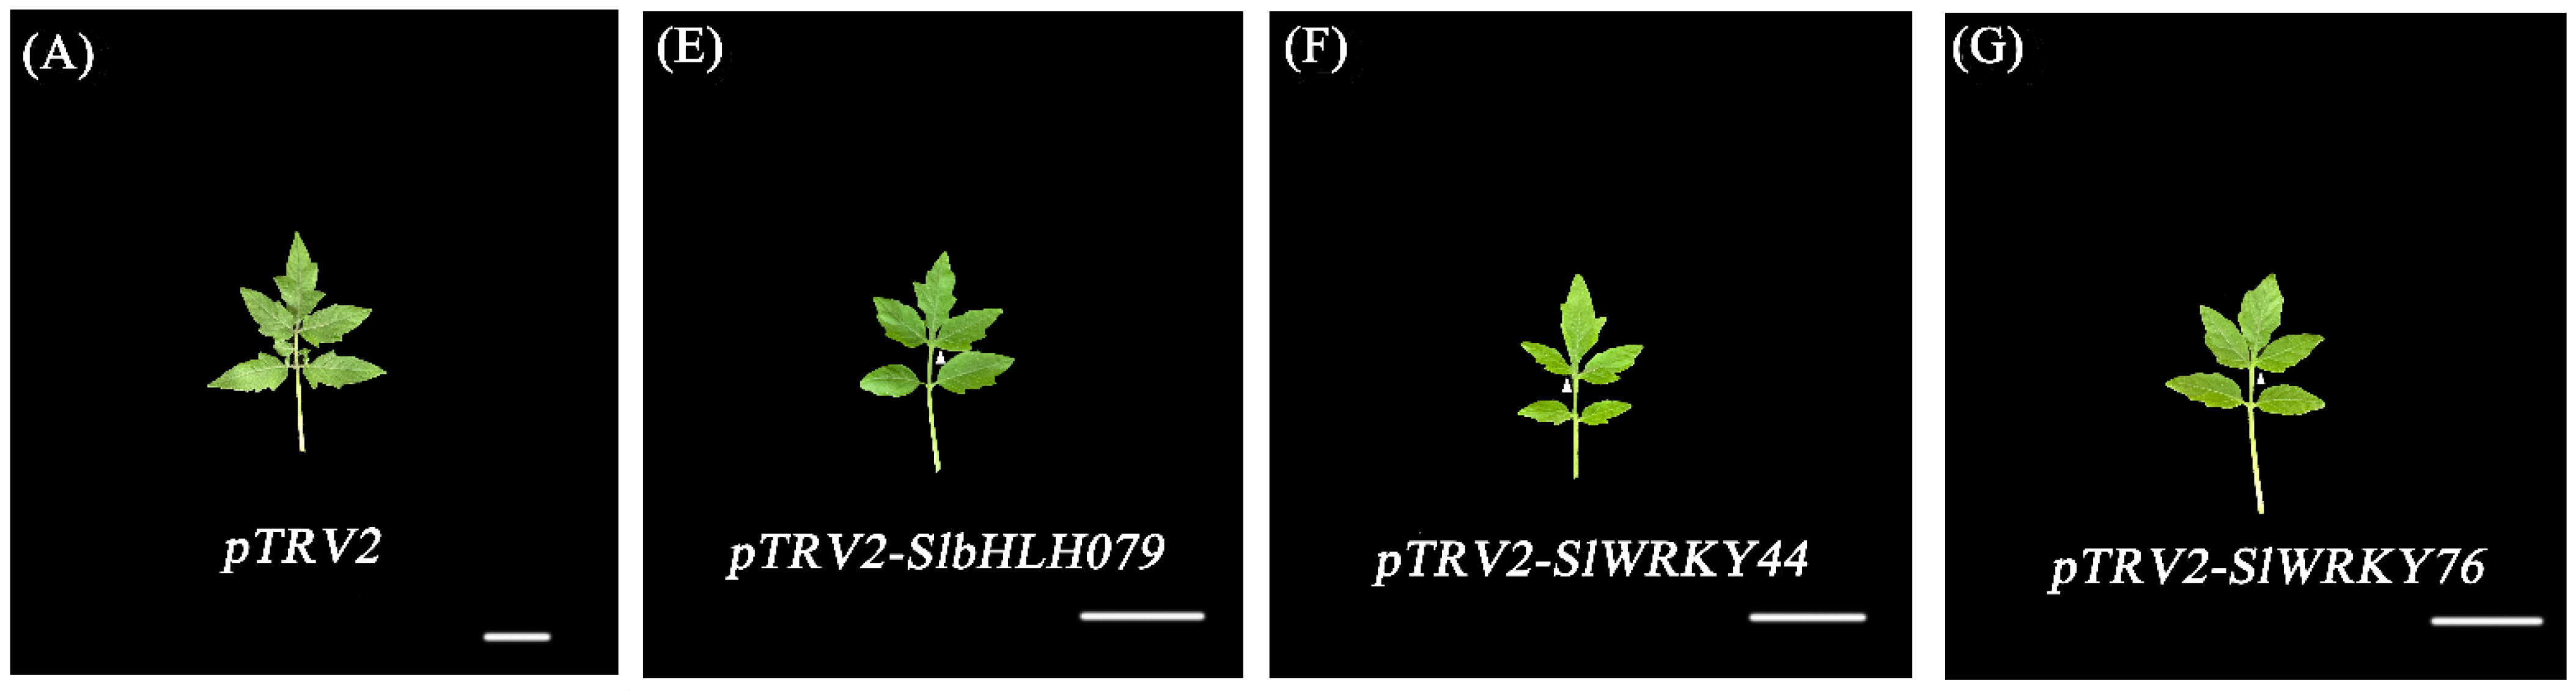
2.8. Morphological Changes in Plants with VIGS

The plants with VIGS were identified using RT-qPCR (Figure 7A–F). Compared with the plants containing the empty vector pTRV2, we found that the pTRV2-SlGA2ox7-containing plants were taller, whereas the pTRV2-SlGA20ox-, pTRV2-SlWRKY44-, pTRV2-SlWRKY76-, pTRV2-SlbHLH079-, and pTRV2-SlIAA-aah-containing plants were shorter (Figure S3A–G). The pTRV2-SlGA20ox-containing plants were significantly dwarfed, with shorter internodes, smaller leaves, and fewer secondary lateral lobules (Figure 8C). The pTRV2-SlWRKY44- and pTRV2-SlWRKY76-containing plants showed a dwarf phenotype, with smooth leaf margins, reduced serrations, leaf blade yellowing, a decreased number of leaflets, and no obvious petioles on the individual primary leaflets (Figure 8F,G). The pTRV2-SlIAA-aah- and pTRV2-SlbHLH079-containing plants were also dwarfed, with smaller leaves. Additionally, the pTRV2-SlIAA-aah leaves had deep fission (Figure 8D), whereas the pTRV2-SlbHLH079 leaves had smooth blade edges and a reduced number of blades (Figure 8E).

3. Discussion

3.1. Different Compound Leaf Shapes Influenced GDSL Expression in Tomatoes

To explore the key factors affecting leaf development, we selected three groups of tomato plants with different leaf morphologies for a transcriptome analysis, and four GDSL genes (Solyc06g064820.3, Solyc11g031960.2, Solyc11g006250.2, and Solyc01g095450.4) were identified through the analysis of three overlapping DEGs (Table 1). It is noteworthy that both the number of compound leaves and the complexity of the leaves of Pts, tf2, and e gradually decreased, and the expression of the four GDSL genes also showed the same trend in the three groups. GDSL esterases/lipases play a key role in regulating plant growth and development, stress resistance, and tissue and organ morphogenesis. Some studies have shown that the GDSL genes affect the differentiation of epidermal cells and are involved in wax biosynthesis and stomatal OCL formation. The stomatal cells and the pavement cells of the rice mutant Wilted dwarf and Lethal 1 (WDL1) are small [47], and Arabidopsis OSP1 (Occlusion of Stomata 1) mutants lead to decreased leaf wax synthesis, leading to stomatal occlusion, which leads to increased epidermal permeability, a decreased transpiration rate, and increased drought resistance [41]. The transpiration rate (Figure 4A), stomatal conductance (Figure 4C), and epidermal permeability (Figure 4D–F) of Pts, tf2, and e were significantly lower than those of the wild types, which is consistent with previous findings. Although the mutants differed from the wild types in the number of total stomata (Figure 4B), we believe that the different types of stomatal (Figure 4G,H) opening and closing states play a key role in stomatal conductance and the transpiration rate. These results indicate that GDSLs are closely related to the transpiration rate, stomatal conductance, and cell permeability. Although GDSLs are not the key factors directly affecting leaf morphology, differences in leaf morphology will affect the expression of the GDSL genes to further change the corresponding leaf physiological functions.

3.2. The Roles of the Plant Hormones IAA and GA in Tomato Compound Leaf Development

To further screen the key factors that may affect leaf morphology, we compared the transcriptomes in groups of two. For the comparison of the groups, we selected six genes—IAA-aah, GA2ox7, GA20ox, bHLH079, WRKY44, and WRKY76. The six genes can be divided into two groups—hormone-related genes and transcription factors. The expression of IAA-aah and GA2ox7 decreased gradually in the Pts/VF36 and tf2/CR comparison group (Table S6), while GA20ox expression increased gradually in the Pts/VF36 and e/AC comparison group (Table S7). Auxin and GA play key roles in leaf development. Auxin coordinates the phyllotaxis of leaf initiation from the SAM and determines the location of serrations and the initiation of the leaflets and lobes from the margin of the leaf primordia [42,48,49]. The regulation of the auxin pathway during tomato leaf development can lead to a significantly simplified leaf phenotype. The exogenous application of 2-4-D or the cultivation of plants on a medium containing the auxin inhibitor NPA leads to the formation of simplified leaves with smooth leaf margins, reduced serration, and a smaller number of leaflets. This simplification is due to the elimination of the discrete distribution of auxin reactions at the leaf edges, which is necessary for the formation of distinct and separate leaflets [42]. In this study, the results showed that the auxin levels were significantly higher in Pts, were nonsignificantly lower in tf2, and were significantly lower in e than that in the wild types (Figure 5A). The same gradual decrease in auxin was consistent with a decrease in the number of compound leaves and leaf complexity. Plants produce active IAA via de novo synthesis and the hydrolysis of IAA conjugates [50,51]. Auxin amino acid hydrolase can hydrolyze auxin conjugates and release free IAA. IAR3, which is a member of the auxin amide hydrolase family, is highly expressed in the roots, stems, and flowers [52]. We verified the changes in the expression of auxin amino acid hydrolase in the leaf primordia at different developmental stages using RT-qPCR (Figure 6D). Compared to the control, the pTRV2-SlIAA-aah plants showed a short stature and deepened leaf splits (Figure 8D and Figure S3D). Tomato plants with an IAR3 knockout exhibited lower levels of free IAA and changes in the response to the pathogen challenge. Changes in IAR3 expression levels led to changes in auxin homeostasis, which ultimately affected the plant defense responses [53]. Further verification is required for whether the differences in leaf morphology and plant height presented by pTRV2-SlIAA-aah were caused by the changes in endogenous auxin homeostasis.
GAs are involved in several developmental processes, such as seed germination, stem elongation, trichome development, pollen maturation, and flowering induction [43]. During leaf development, GA regulates cell proliferation and expansion and affects leaf complexity. Increased GA levels or responses in tomatoes result in taller plants; faster leaf maturation; and, therefore, simpler leaves than those in the wild types [24,25,27]. Compared with the wild types, the mutants Pts, tf2, and e showed significant differences in their leaf hair number, cell size, and cell number (Figure 2A–T). Therefore, we speculated that the difference was due to the changes in the GA levels. This conjecture is also consistent with the expression of the GA2ox7 and GA20ox genes that we screened. The exogenous application of GA3 result in a reduced leaf number and smoothened leaf margins [42]. Reduced GA levels or responses result in stunted plants and, in some cases, the development of highly complex leaves [28,54]. The level of GA3 in Pts and tf2 was higher than that in the wild types, while the level of GA3 in e was significantly lower than that in the wild type (Figure 5B). Although the trend of the GA level was not consistent with the complexity of leaves, the analysis of the GA biosynthesis pathway explained this phenomenon (Figure 5D). The enzymes that are independently encoded by the GA2ox, GA3ox, and GA20ox genes control GA biosynthesis and catabolism. The expression of SlGA20 oxidase 1 (SlGA20ox1), a GA biosynthetic gene, increased in the LA mutants and decreased in the miR319-overexpressing plants. Conversely, the transcript levels of the GA-inactivated gene, SlGA2 oxidase 4 (SlGA2ox4), were increased in the miR319-overexpressing plants. SlGA2ox4 is expressed in the initial leaflet during early leaf development, and its expression increases the complexity of tomato leaves [54]. GA2ox7 and GA20ox are the GA degradation and synthesis genes, respectively. We used the P3 stage of leaf primordium development as a control, and the results of the RT-qPCR analysis showed that the expression level of Ga20ox was relatively high (Figure 6C), while the expression of Ga2ox7 was significantly increased at the P10 stage (Figure 6B). This result also confirmed that GA2ox7 and GA20ox play roles in different stages of leaf development. The pTRV2-SlGA2ox7 and pTRV2-SlGA20ox plants also showed opposite phenotypes in terms of plant height (Figure S3B,C). Compared with the control, the pTRV2-SlGA2ox7 plants were taller (Figure S3B); however, there was no significant difference in leaf morphology (Figure 8B). Recent studies have also shown that water deprivation induces the expression of GA20ox7 in guard cells and leaf tissues, leading to a decrease in the level of active GA, and that a loss in GA2ox7 attenuates the stomatal response to water deficiencies [55]. Therefore, we believe that GA2ox7 may mainly act on guard cells, and its transient silencing led to changes in the GA level and the appearance of higher plant phenotypes; however, there was no significant difference in the leaves. The pTRV2-SlGA20ox plants were shorter and had smaller leaves than the control plants and (Figure 8C and Figure S3C). The differences in the plant height and leaf size of pTRV2-SlGA20ox were also consistent with the phenotype of plants with decreased GA levels. Therefore, it was further confirmed that the homeostasis of the auxin and gibberellin levels was important for leaf development.

3.3. Key Regulators of Tomato Compound Leaf Development

The expression of the bHLH079, WRKY76, and WRKY44 transcription factors was gradually decreased in the comparison groups (Tables S6 and S8). The expression of bHLH079 increased during P4–P6 and significantly decreased during P7–P10 (Figure 6E). Research has shown that the bHLH transcription factor regulates cell elongation in cotton and Arabidopsis, with Arabidopsis leaves and cotton fibers being longer after its overexpression [16,56]. The bHLH gene, SlPRE5, is significantly expressed in young leaves, sepals, and flowers [57]. Therefore, we concluded that bHLH079 was related to leaf development. IBH1 (an IL1-binding bHLH) overexpression causes erect leaves in rice and dwarfism in Arabidopsis [58], similar to the dwarfing phenotype in the pTRV2-SlbHLH079 plants (Figure S3E). However, the leaf morphology of the pTRV2-SlbHLH079 plants was also different. The leaves were smaller, the leaf margins were smooth, and the number of leaflets was reduced (Figure 8E). As described above, leaf complexity (leaf margin type, serration, and number of leaflets) is closely related to the auxin and GA levels. It has also been shown that the bHLH transcription factors can function by regulating hormones [59,60,61,62]. The bHLH transcription factors, phytochrome-interacting factors (PIFs), act as important hubs for the light, auxin, GA, and brassinosteroid pathways. PIFs participate in the regulation of leaf senescence and chlorophyll biosynthesis [63]. During the development of pistil, HEC1 regulates the synthesis, transport, and response of auxin to control the auxin and cytokinin levels in A. thaliana [64]. Moreover, the GA signal suppressor, the DELLA protein, can interact with the bHLH transcription factors, such as AtPIFs, AtMYC2, and AtARFs, in A. thaliana [65,66,67].
WRKYs, another major transcription factor family, are important for plant growth, development, and the responses to abiotic stress. NtWRKY4 has been shown to be involved in leaf morphogenesis [44]. The expression of WRKY44 first increased and then decreased at different developmental stages of the leaf primordia (Figure 6F). However, the expression of WRKY76 was low during the whole period of leaf primordium development (Figure 6G). Although the expression trends of WRKY44 and WRKY76 were not consistent at different leaf primordium stages, the differential phenotypes of the pTRV2-SlWRKY44 and pTRV2-SlWRKY76 plants were consistent. The leaves of pTRV2-SlWRKY44 and pTRV2-SlWRKY76 were etiolated, with smooth leaf margins and no obvious petioles in some parts (Figure 8F,G), which was similar to the phenotype of the tf2 mutant. In addition, WRKY, as a key transcription factor in the regulation of leaf senescence, plays a role in the regulation of the chlorophyll- and senescence-related genes [68,69,70] and in the process of leaf senescence through the hormonal pathways [71,72,73,74]. These results also indicate that bHLH079, WRKY44, and WRKY76 are key factors in leaf development.
In this study, three groups of mutants with different leaf morphologies, pts, tf2, and e, were used to explore the key factors affecting leaf morphology. The differences between the mutants and the wild types were not only reflected in leaf morphology but also in some physiological indexes. Through the screening of the three groups, we guessed that the differences in the transpiration rate, stomatal conductance, cell permeability, and other physiological indicators were closely related to the GDSLs gene. The difference in the endogenous auxin and gibberellin levels also indicated that the change in leaf morphology was closely related to the change in hormone levels. Through further screening and VIGS verification, we also confirmed that the transcription factors bHLH079, WRKY44, and WRKY76 and the hormone-related genes IAA-aah, GA2ox7, and GA20ox were factors affecting leaf morphology.

4. Materials and Methods

4.1. Plant Materials and Culture Conditions

In this study, VF36, Petroselinum (Pts), Condine Red (CR), Trifoliate (tf2), Ailsa Craig (AC), and Entire (e) were used as experimental materials. Tomato mutants were Pts, tf2 (Solanum lycopersicum cv. CR), and e (Solanum lycopersicum cv. Ailsa Craig). Pts showed multiple leaflets due to the retardation of the leaf development process by the KNOX1 gene [13]; tf2 presented a three-leaflet state due to the promotion of leaf maturation [75]; and e showed the functional loss of auxin inhibitory factor IAA9, resulting in single leaves formed via leaf primordium fusion [1]. Seeds were maintained in a water bath (55 °C) for 15 min and were then incubated at a constant temperature (37 °C) until germination (3–4 d). All the plants were grown in a controlled chamber (25 °C, 16/8 h light/dark illumination, and 70–75% humidity). The leaves were collected 45 d after germination, which was when they were fully expanded.

4.2. RNA Isolation

The fifth mature leaf sample collected at 45 d was immediately frozen in liquid nitrogen and stored at −80 °C until use. Total RNA was isolated using TRIzol Reagent (Invitrogen Life Technologies, Carlsbad, CA, USA), and the concentration, quality, and integrity were determined using a NanoDrop spectrophotometer (Thermo Scientific, Waltham, MA, USA). RNA (3 mg) was used for RNA sample preparation.

4.3. Library Preparation

Sequencing libraries were generated using a TruSeq RNA Sample Preparation Kit (Illumina, San Diego, CA, USA). Briefly, mRNA was purified from the total RNA using poly-T oligo-attached magnetic beads. Fragmentation was performed using divalent cations at elevated temperatures in an Illumina proprietary fragmentation buffer. First-strand cDNA synthesis was performed using random oligonucleotides and SuperScript II (Invitrogen, USA). Subsequently, second-strand cDNA synthesis was performed using DNA Polymerase I and RNase H. Remaining overhangs were converted into blunt ends via exonuclease/polymerase activities, and the enzymes were removed. After adenylation of the 3′ ends of the DNA fragments, Illumina PE adapter oligonucleotides were ligated to prepare them for hybridization. To select the preferred 200 bp cDNA fragments, library fragments were purified using the AMPure XP system (Beckman Coulter, Beverly, CA, USA). DNA fragments with ligated adaptor molecules at both ends were selectively enriched using the Illumina PCR Primer Cocktail in a 15-cycle PCR reaction. The products were purified (AMPure XP system) and quantified using an Agilent high-sensitivity DNA assay on a Bioanalyzer 2100 system (Agilent, California, USA). The sequencing library was sequenced on a HiSeq platform (Illumina) by Shanghai Personal Biotechnology Co. Ltd.

4.4. Sequencing and Data Analysis

Eighteen RNA libraries were constructed from Pts, tf2, e, and their respective wild-type leaf samples. Raw reads were generated via high-throughput sequencing of the six samples with three replicates each (Table S1). Clean reads were obtained by removing the adapters and low-quality reads from the raw data. Using HISAT2 2.1.0 software, reads were filtered to Solanum lycopersicum genome [76]. HTSeq 0.9.1 was used to compare the read count value for each gene, and FPKM was used to standardize the expression level of the original gene. For the DESeq variance analysis, DEGs were screened based on the following conditions: multiple expression differences, log2FoldChange > 1, and significant p-value < 0.05. A BLAST search was performed on sequences of DEGs against the database in NCBI. The GO enrichment analysis was performed by GO (http://geneontology.org/, on 2 December 2022), and the KEGG enrichment analysis was performed by Kyoto Encyclopedia of Genes and Genomes (http://www.kegg.jp/, on 2 December 2022).

4.5. Reverse Transcription Quantitative PCR (RT-qPCR) Analysis

RNA extraction and real time-qPCR were performed using 45 d old leaves and the RNAiso plus reagent (TaKaRa, Shiga, Japan). First-strand cDNA was synthesized using a HiScript® II 1st Strand cDNA Synthesis Kit (Vazyme, Nanjing, China). RT-qPCR was performed using AceQ®qPCR SYBR Green Master Mix (Vazyme, Nanjing, China); the primers are listed in Supplementary Table S1. The 2–ΔΔCt method was used to analyze relative gene expression. Data were reported as the mean of three replicates. The housekeeping gene β-actin (primers: 5′-TGTCCCTATTTACGAGGGTTATGC-3′ (actin-F) and 5′-AGTTAAATCACGACCAGCAAGAT-3′ (actin-R)) was used as the internal control. The PCR program was as follows: 95 °C for 45 s, 40 cycles of 95 °C for 10 s, 58 °C for 25 s, and 72 °C for 20 s. For all RT-qPCR experiments, at least three biological replicates were performed, and each reaction was run in triplicate.

4.6. Scanning Electron Microscopy

For scanning electron microscope images, 45 d old fifth leaves were fixed in 2.5% glutaraldehyde in 0.1 mol phosphate buffer (pH 7.4), were dehydrated in a graded ethanol series, were attached with colloidal graphite to a copper stub, and were frozen under vacuum. Dried samples sputtered with 25–30 nm of gold palladium (SC-500; Soquelec, Montreal, QC, Canada) were imaged using a SEM (JSM-6390LV; NTC, Tokyo, Japan) at an accelerating voltage of 10 kV.

4.7. Transpiration Rate Measurements

The fifth mature leaf at 45 d was used to measure the transpiration rate with a portable photosynthesis system (LI-6400XT; Li-Cor, Lincoln, NE, USA) under 150 µmol m–2 s–1 light intensity, 70–75% relative humidity, and 430 ppm CO2 concentration. The measurements were recorded every 30 s for 30 min. Data were presented as the means of at least three leaves from individual plants for each experiment. The experiments were repeated at least three times.

4.8. Tissue Collection

L5 P1 is the fifth leaf when it has just initiated from the SAM, and it becomes L5 P2 after the initiation of the next primordium. For very young leaf primordia at the P1–P3 stages, the leaves were collected with younger leaf primordia and SAM. At the P4 and P5 stages, leaves were collected both with and without the SAM and younger primordia [15].

4.9. Statistical Analysis

One-tailed t-test was used to compare the significance of differences in gene expression data from the RT-PCR analysis. One-way ANOVA was used to compare the contents of DEGs at P3–P10 developmental stages. All values were reported as mean ± standard error (SE). Differences were considered statistically significant at p < 0.05. All data analyses were performed using SPSS 19.0 (SPSS Inc., Chicago, IL, USA).

4.10. UFLC-ESI-MS/MS Assay

The endogenous IAA and GA3 contents were determined using UFLC-ESI-MS/MS. Mature leaves were collected and ground using liquid nitrogen. Three replicates were prepared for each leaf sample. The biomass for each replicate was 0.5 g. Subsequently, IAA and GA3 contents were determined according to protocol published by ESI-MS/MS [77].

4.11. VIGS Assays

For the construction of the VIGS vector, 300 bp fragments of the genes SlbHLH079, SlGA2ox7, SlGA20ox, SlIAA-amino acid hydrolase, SlWRKY44, and SlWRKY76 were amplified using sequence-specific primers (Supplementary Table S2). The pTRV1-, pTRV2-, and pTRV2-host target genes were transformed into Agrobacterium tumefaciens strain GV3101 via electroporation. Cultures containing pTRV1 and pTRV2 vectors were mixed in a 1:1 ratio either individually or simultaneously. The prepared liquid was used to infect the AC cotyledons. The infected plants were transferred to a culture chamber. The infected plants were then transferred to a growth chamber (16 h day/8 h night cycle, 25 °C, and 70–75% humidity). The phenotypes were analyzed 6–7 weeks after inoculation.

4.12. Chlorophyll Leaching Assay

Leaf epidermal penetration of 45 d old plants was measured. First, 0.2 g of leaves was cut into uniform cubes and was soaked in 20 mL of 95% anhydrous ethanol. The absorbance of the samples was measured every 20 min. The treated samples were placed in the dark for 24 h to determine the total chlorophyll content. An ultraviolet (UV) U-5100 spectrophotometer was used to measure the absorbance of the samples at wavelengths of 663 and 645 nm. Total micromoles of chlorophyll were calculated as 20.21 (A645) + 8.02 (A663).
Chlorophyll content = concentration × total extracted liquid (mL)/sample fresh weight × 1000.

Supplementary Materials

The following supporting information can be downloaded at https://www.mdpi.com/article/10.3390/horticulturae9030363/s1, Table S1. The profiles of RNA deep sequencing for VF36, Pts, CR, tf2, AC, and entire; Table S2. Primers used in this study; Table S3. RNA-Seq analysis of DEGs in Pts/VF36; Table S4. RNA-Seq analysis of DEGs in tf2/CR; Table S5. RNA-Seq analysis of DEGs in entire/AC; Table S6. RNA-Seq analysis of DEGs in Pts/VF36 and tf2/CR; Table S7. RNA-Seq analysis of DEGs in Pts/VF36 and entire/AC; Table S8. RNA-Seq analysis of DEGs in tf2/CR and entire/AC; Figure S1. Morphological differences between mutant and wild-type plants; Figure S2. GO and KEGG enrichment analyses; and Figure S3. Differences in leaf morphology of VIGS plants compared with that of pTRV2 plants.

Author Contributions

G.Z., X.L. and J.J. conceived this project and designed the work. G.Z., C.M., S.Y. and X.Z. performed the research, analyzed the data, and wrote the manuscript. G.Z., X.L. and J.J. revised the paper. All authors have read and agreed to the published version of the manuscript.

Funding

This work was supported by the National Key Research and Development Program of China (2019YFD1000301) and the National Natural Science Foundation of China (32172548, 31801847).

Data Availability Statement

Data Availability Statement: All data generated or analyzed during this study are included in this published article (and supplementary information files).

Acknowledgments

In this study, VF36, Petroselinum (Pts), Condine Red (CR), Trifoliate (tf2), Ailsa Craig (AC), and Entire (e), which were used as experimental materials, were from the Tomato Genetics Resource Center at the University of California, Davis. We hereby express our thanks.

Conflicts of Interest

The authors declare that the research was conducted in the absence of any commercial or financial relationships that could be construed as a potential conflict of interest.

Abbreviations

ABAAbscisic acid
ACAilsa Craig
ARFAuxin response factor
bHLHBasic helix-loop-helix
BLASTBasic local alignment search tool
BRBrassinosteroids
CKsCytokinins
CKXCytokinin oxidase genes
CRCondine Red
CPSEnt-copalyl diphosphate synthase
DEGsDifferentially expressed genes
dpyDefective mutant dumpy
eEntire
ETEthylene
FPKMFragments per kilobase of exon model per million mapped reads
GAGibberellic acid
GA2ox7Gibberellin 2-beta-dioxygenase 7
GA20oxGibberellin 20-oxidase-like
GDSLGDSL esterases/lipases
GOGene ontology
GhFP1Cotton bHLH protein
HDHomeodomain
IAAIndole-3-acetic acid
IAA-aahIAA-amino acid hydrolase
IBH1ILI1-binding BHLH Protein 1
IPT7Iso-pentenyl transferase 7
JAJasmonic acid
KAOEnt-kaurenoic acid oxidase
KEGGKyoto Encyclopedia of Genes and Genomes
KNOXKnotted1-like homeobox
KOEnt-kaurene oxidase
KSEnt-kaurene synthase
LALANCEOLATE
LP1Leaf-associated protein 1
LP2Leaf-associated protein 2
MYCMyelocytomatosis
OCLOuter cuticular ledge
OSP1Occlusion of Stomatal Pore 1
PIFsPhytochrome-interacting factors
PMPrimary morphogenesis
PtsPetroselinum
SAGsSenescence-related gene
SAMShoot apical meristem
SMSecondary morphogenesis
tf2Trifoliate
TFsTranscription factors
VIGSVirus-induced gene silencing
wdl1Wilted dwarf and lethal 1
WOXWUSCHEL-related homeobox

References

  1. Berger, Y.; Harpaz-Saad, S.; Brand, A.; Melnik, H.; Sirding, N.; Alvarez, J.P.; Zinder, M.; Samach, A.; Eshed, Y.; Ori, N. The NAC-domain transcription factor GOBLET specifies leaflet boundaries in compound tomato leaves. Development 2009, 136, 823–832. [Google Scholar] [CrossRef] [Green Version]
  2. Tsiantis, M. Control of shoot cell fate: Beyond homeoboxes. Plant Cell 2001, 13, 733–738. [Google Scholar] [CrossRef] [PubMed]
  3. Champagne, C.; Sinha, N. Compound leaves: Equal to the sum of their parts? Development 2004, 131, 4401–4412. [Google Scholar] [CrossRef] [PubMed] [Green Version]
  4. Nikovics, K.; Blein, T.; Peaucelle, A.; Ishida, T.; Morin, H.; Aida, M.; Laufs, P. The balance between the MIR164A and CUC2 genes controls leaf margin serration in Arabidopsis. Plant Cell 2006, 18, 2929–2945. [Google Scholar] [CrossRef] [Green Version]
  5. Ferris, K.G.; Rushton, T.; Greenlee, A.B.; Toll, K.; Blackman, B.K.; Willis, J.H. Leaf shape evolution has a similar genetic architecture in three edaphic specialists within the Mimulus guttatus species complex. Ann. Bot. 2015, 116, 213–223. [Google Scholar] [CrossRef] [PubMed] [Green Version]
  6. Vogel, S. Leaves in the lowest and highest winds: Temperature, force and shape. New Phytol. 2009, 183, 13–26. [Google Scholar] [CrossRef]
  7. Semchenko, M.; Zobel, K. The role of leaf lobation in elongation responses to shade in the rosette-forming forb Serratula tinctoria (Asteraceae). Ann. Bot. 2007, 100, 83–90. [Google Scholar] [CrossRef] [Green Version]
  8. Burglin, T.R.; Affolter, M. Homeodomain proteins: An update. Chromosoma 2016, 125, 497–521. [Google Scholar] [CrossRef] [Green Version]
  9. Wang, C.Q.; Zhao, B.L.; He, L.L.; Zhou, S.L.; Liu, Y.; Zhao, W.Y.; Guo, S.Q.; Wang, R.R.; Bai, Q.Z.; Li, Y.H.; et al. The WOX family transcriptional regulator SlLAM1 controls compound leaf and floral organ development in Solanum lycopersicum. J. Exp. Bot. 2021, 72, 1822–1835. [Google Scholar] [CrossRef]
  10. Romani, F.; Reinheimer, R.; Florent, S.N.; Bowman, J.L.; Moreno, J.E. Evolutionary history of HOMEODOMAIN LEUCINE ZIPPER transcription factors during plant transition to land. New Phytol. 2018, 219, 408–421. [Google Scholar] [CrossRef] [Green Version]
  11. Bar, M.; Ori, N. Compound leaf development in model plant species. Curr. Opin. Plant Biol. 2015, 23, 61–69. [Google Scholar] [CrossRef]
  12. Tsuda, K.; Hake, S. Diverse functions of KNOX transcription factors in the diploid body plan of plants. Curr. Opin. Plant Biol. 2015, 27, 91–96. [Google Scholar] [CrossRef] [PubMed] [Green Version]
  13. Hareven, D.; Gutfinger, T.; Parnis, A.; Eshed, Y.; Lifschitz, E. The making of a compound leaf: Genetic manipulation of leaf architecture in tomato. Cell 1996, 84, 735–744. [Google Scholar] [CrossRef] [PubMed] [Green Version]
  14. Ori, N.; Cohen, A.R.; Etzioni, A.; Brand, A.; Yanai, O.; Shleizer, S.; Menda, N.; Amsellem, Z.; Efroni, I.; Pekker, I.; et al. Regulation of LANCEOLATE by miR319 is required for compound-leaf development in tomato. Nat. Genet. 2007, 39, 787–791. [Google Scholar] [CrossRef]
  15. Shleizer-Burko, S.; Burko, Y.; Ben-Herzel, O.; Ori, N. Dynamic growth program regulated by LANCEOLATE enables flexible leaf patterning. Development 2011, 138, 695–704. [Google Scholar] [CrossRef] [Green Version]
  16. Lu, R.; Zhang, J.; Wu, Y.W.; Wang, Y.; Zhang, J.; Zheng, Y.; Li, Y.; Li, X.B. bHLH transcription factors LP1 and LP2 regulate longitudinal cell elongation. Plant Physiol. 2021, 187, 2577–2591. [Google Scholar] [CrossRef]
  17. Pekker, I.; Alvarez, J.P.; Eshed, Y. Auxin response factors mediate Arabidopsis organ asymmetry via modulation of KANADI activity. Plant Cell 2005, 17, 2899–2910. [Google Scholar] [CrossRef] [Green Version]
  18. Chitwood, D.H.; Headland, L.R.; Ranjan, A.; Martinez, C.C.; Braybrook, S.A.; Koenig, D.P.; Kuhlemeier, C.; Smith, R.S.; Sinha, N.R. Leaf Asymmetry as a Developmental Constraint Imposed by Auxin-Dependent Phyllotactic Patterning. Plant Cell 2012, 24, 2318–2327. [Google Scholar] [CrossRef] [PubMed]
  19. Wang, H.; Jones, B.; Li, Z.; Frasse, P.; Delalande, C.; Regad, F.; Chaabouni, S.; Latche, A.; Pech, J.-C.; Bouzayen, M. The tomato Aux/IAA transcription factor IAA9 is involved in fruit development and leaf morphogenesis. Plant Cell 2005, 17, 2676–2692. [Google Scholar] [CrossRef] [PubMed] [Green Version]
  20. Ben-Gera, H.; Dafna, A.; Alvarez, J.P.; Bar, M.; Mauerer, M.; Ori, N. Auxin-mediated lamina growth in tomato leaves is restricted by two parallel mechanisms. Plant J. 2016, 86, 443–457. [Google Scholar] [CrossRef]
  21. Ben-Gera, H.; Shwartz, I.; Shao, M.R.; Shani, E.; Estelle, M.; Ori, N. ENTIRE and GOBLET promote leaflet development in tomato by modulating auxin response. Plant J. 2012, 70, 903–915. [Google Scholar] [CrossRef]
  22. Hendelman, A.; Buxdorf, K.; Stav, R.; Kravchik, M.; Arazi, T. Inhibition of lamina outgrowth following Solanum lycopersicum AUXIN RESPONSE FACTOR 10 (SlARF10) derepression. Plant Mol. Biol. 2012, 78, 561–576. [Google Scholar] [CrossRef] [PubMed]
  23. Koenig, D.; Bayer, E.; Kang, J.; Kuhlemeier, C.; Sinha, N. Auxin patterns Solanum lycopersicum leaf morphogenesis. Development 2009, 136, 2997–3006. [Google Scholar] [CrossRef] [PubMed] [Green Version]
  24. Bassel, G.W.; Mullen, R.T.; Bewley, J.D. Procera is a putative DELLA mutant in tomato (Solanum lycopersicum): Effects on the seed and vegetative plant. J. Exp. Bot. 2008, 59, 585–593. [Google Scholar] [CrossRef] [Green Version]
  25. Fleishon, S.; Shani, E.; Ori, N.; Weiss, D. Negative reciprocal interactions between gibberellin and cytokinin in tomato. New Phytol. 2011, 190, 609–617. [Google Scholar] [CrossRef] [PubMed]
  26. Hay, A.; Kaur, H.; Phillips, A.; Hedden, P.; Hake, S.; Tsiantis, M. The gibberellin pathway mediates KNOTTED1-type homeobox function in plants with different body plans. Curr. Biol. CB 2002, 12, 1557–1565. [Google Scholar] [CrossRef] [PubMed] [Green Version]
  27. Jasinski, S.; Tattersall, A.; Piazza, P.; Hay, A.; Martinez-Garcia, J.F.; Schmitz, G.; Theres, K.; McCormick, S.; Tsiantis, M. PROCERA encodes a DELLA protein that mediates control of dissected leaf form in tomato. Plant J. 2009, 60, 397-397. [Google Scholar]
  28. Livne, S.; Lor, V.S.; Nir, I.; Eliaz, N.; Aharoni, A.; Olszewski, N.E.; Eshed, Y.; Weiss, D. Uncovering DELLA-Independent Gibberellin Responses by Characterizing New Tomato procera Mutants. Plant Cell 2015, 27, 1579–1594. [Google Scholar] [CrossRef] [Green Version]
  29. Gordon, S.P.; Chickarmane, V.S.; Ohno, C.; Meyerowitz, E.M. Multiple feedback loops through cytokinin signaling control stem cell number within the Arabidopsis shoot meristem. Proc. Natl. Acad. Sci. USA 2009, 106, 16529–16534. [Google Scholar] [CrossRef] [Green Version]
  30. Kurakawa, T.; Ueda, N.; Maekawa, M.; Kobayashi, K.; Kojima, M.; Nagato, Y.; Sakakibara, H.; Kyozuka, J. Direct control of shoot meristem activity by a cytokinin-activating enzyme. Nature 2007, 445, 652–655. [Google Scholar] [CrossRef]
  31. Chen, J.J.; Janssen, B.J.; Williams, A.; Sinha, N. A gene fusion at a homeobox locus: Alterations in leaf shape and implications for morphological evolution. Plant Cell 1997, 9, 1289–1304. [Google Scholar] [PubMed] [Green Version]
  32. Shalit, A.; Rozman, A.; Goldshmidt, A.; Alvarez, J.P.; Bowman, J.L.; Eshed, Y.; Lifschitz, E. The flowering hormone florigen functions as a general systemic regulator of growth and termination. Proc. Natl. Acad. Sci. USA 2009, 106, 8392–8397. [Google Scholar] [CrossRef] [PubMed] [Green Version]
  33. Shani, E.; Ben-Gera, H.; Shleizer-Burko, S.; Burko, Y.; Weiss, D.; Ori, N. Cytokinin Regulates Compound Leaf Development in Tomato. Plant Cell 2010, 22, 3206–3217. [Google Scholar] [CrossRef] [PubMed] [Green Version]
  34. Saini, S.; Sharma, I.; Pati, P.K. Versatile roles of brassinosteroid in plants in the context of its homoeostasis, signaling and crosstalks. Front. Plant Sci. 2015, 6, 17. [Google Scholar] [CrossRef] [PubMed] [Green Version]
  35. Singh, A.P.; Savaldi-Goldstein, S. Growth control: Brassinosteroid activity gets context. J. Exp. Bot. 2015, 66, 1123–1132. [Google Scholar] [CrossRef] [Green Version]
  36. Koka, C.V.; Cerny, R.E.; Gardner, R.G.; Noguchi, T.; Fujioka, S.; Takatsuto, S.; Yoshida, S.; Clouse, S.D. A putative role for the tomato genes DUMPY and CURL-3 in brassinosteroid biosynthesis and response. Plant Physiol. 2000, 122, 85–98. [Google Scholar] [CrossRef] [Green Version]
  37. Li, L.; Zhao, Y.; McCaig, B.C.; Wingerd, B.A.; Wang, J.; Whalon, M.E.; Pichersky, E.; Howe, G.A. The tomato homolog of CORONATINE-INSENSITIVE1 is required for the maternal control of seed maturation, jasmonate-signaled defense responses, and glandular trichome development. Plant Cell 2004, 16, 126–143. [Google Scholar] [CrossRef] [Green Version]
  38. Zhu, M.K.; Li, Y.L.; Chen, G.P.; Ren, L.J.; Xie, Q.L.; Zhao, Z.P.; Hu, Z.L. Silencing SlELP2L, a tomato Elongator complex protein 2-like gene, inhibits leaf growth, accelerates leaf, sepal senescence, and produces dark-green fruit. Sci. Rep. 2015, 5, 11. [Google Scholar] [CrossRef] [Green Version]
  39. Guo, H.; Ecker, J.R. Plant responses to ethylene gas are mediated by SCF(EBF1/EBF2)-dependent proteolysis of EIN3 transcription factor. Cell 2003, 115, 667–677. [Google Scholar] [CrossRef] [Green Version]
  40. Tieman, D.M.; Ciardi, J.A.; Taylor, M.G.; Klee, H.J. Members of the tomato LeEIL (EIN3-like) gene family are functionally redundant and regulate ethylene responses throughout plant development. Plant J. Cell Mol. Biol. 2001, 26, 47–58. [Google Scholar] [CrossRef] [Green Version]
  41. Tang, J.; Yang, X.P.; Xiao, C.L.; Li, J.Y.; Chen, Y.Q.; Li, R.Y.; Li, S.P.; Lu, S.Y.; Hu, H.H. GDSL lipase occluded stomatal pore 1 is required for wax biosynthesis and stomatal cuticular ledge formation. New Phytol. 2020, 228, 1880–1896. [Google Scholar] [CrossRef] [PubMed]
  42. Shwartz, I.; Levy, M.; Ori, N.; Bar, M. Hormones in tomato leaf development. Dev. Biol. 2016, 419, 132–142. [Google Scholar] [CrossRef] [PubMed]
  43. Shinjiro; Yamaguchi, Gibberellin metabolism and its regulation. Annu. Rev. Plant Biol. 2008, 59, 225–251. [CrossRef] [PubMed]
  44. Ren, X.J.; Huang, W.D.; Li, W.Z.; Yu, D.Q. Tobacco transcription factor WRKY4 is a modulator of leaf development and disease resistance. Biol. Plant. 2010, 54, 684–690. [Google Scholar] [CrossRef]
  45. Helliwell, C.A.; Poole, A.; Peacock, W.J.; Dennis, E.S. Arabidopsis ent-kaurene oxidase catalyzes three steps of gibberellin biosynthesis. Plant Physiol. 1999, 119, 507–510. [Google Scholar] [CrossRef] [PubMed] [Green Version]
  46. Helliwell, C.A.; Sullivan, J.A.; Mould, R.M.; Gray, J.C.; Peacock, W.J.; Dennis, E.S. A plastid envelope location of Arabidopsis ent-kaurene oxidase links the plastid and endoplasmic reticulum steps of the gibberellin biosynthesis pathway. Plant J. Cell Mol. Biol. 2001, 28, 201–208. [Google Scholar] [CrossRef]
  47. Park, J.J.; Jin, P.; Yoon, J.; Yang, J.I.; Jeong, H.J.; Ranathunge, K.; Schreiber, L.; Franke, R.; Lee, I.J.; An, G. Mutation in Wilted Dwarf and Lethal 1 (WDL1) causes abnormal cuticle formation and rapid water loss in rice. Plant Mol.Biol. 2010, 74, 91–103. [Google Scholar] [CrossRef]
  48. Bilsborough, G.D.; Runions, A.; Barkoulas, M.; Jenkins, H.W.; Hasson, A.; Galinha, C.; Laufs, P.; Hay, A.; Prusinkiewicz, P.; Tsiantis, M. Model for the regulation of Arabidopsis thaliana leaf margin development. Proc. Natl. Acad. Sci. USA 2011, 108, 3424–3429. [Google Scholar] [CrossRef] [Green Version]
  49. Hay, A.; Tsiantis, M. The genetic basis for differences in leaf form between Arabidopsis thaliana and its wild relative Cardamine hirsuta. Nat. Genet. 2006, 38, 942–947. [Google Scholar] [CrossRef]
  50. Bartel, B. AUXIN BIOSYNTHESIS. Annu. Rev. Plant Physiol. Plant Mol. Biol. 1997, 48, 51–66. [Google Scholar] [CrossRef]
  51. Normanly, J.; Grisafi, P.; Bartel, F.B. Arabidopsis mutants resistant to the auxin effects of indole-3-acetonitrile are defective in the nitrilase encoded by the NIT1 gene. Plant Cell 1997, 9, 1781–1790. [Google Scholar] [PubMed]
  52. Davies, R.T.; Goetz, D.H.; Lasswell, J.; Anderson, M.N.; Bartel, B. IAR3 encodes an auxin conjugate hydrolase from Arabidopsis. Plant Cell 1999, 11, 365–376. [Google Scholar] [CrossRef] [Green Version]
  53. D’Ippolito, S.; Vankova, R.; Joosten, M.; Casalongue, C.A.; Fiol, D.F. Knocking down expression of the auxin-amidohydrolase IAR3 alters defense responses in Solanaceae family plants. Plant Sci. 2016, 253, 31–39. [Google Scholar] [CrossRef] [PubMed]
  54. Yanai, O.; Shani, E.; Russ, D.; Ori, N. Gibberellin partly mediates LANCEOLATE activity in tomato. Plant J. 2011, 68, 571–582. [Google Scholar] [CrossRef] [PubMed]
  55. Shohat, H.; Cheriker, H.; Kilambi, H.V.; Eliaz, N.I.; Blum, S.; Amsellem, Z.; Tarkowska, D.; Aharoni, A.; Eshed, Y.; Weiss, D. Inhibition of gibberellin accumulation by water deficiency promotes fast and long-term ‘drought avoidance’ responses in tomato. New Phytol. 2021, 232, 1985–1998. [Google Scholar] [CrossRef]
  56. Liu, Z.H.; Chen, Y.; Wang, N.N.; Chen, Y.H.; Wei, N.; Lu, R.; Li, Y.; Li, X.B. A basic helix-loop-helix protein (GhFP1) promotes fibre elongation of cotton (Gossypium hirsutum) by modulating brassinosteroid biosynthesis and signalling. New Phytol. 2020, 225, 2439–2452. [Google Scholar] [CrossRef]
  57. Li, J.; Gong, J.; Zhang, L.C.; Shen, H.; Chen, G.P.; Xie, Q.L.; Hu, Z.L. Overexpression of SlPRE5, an atypical bHLH transcription factor, affects plant morphology and chlorophyll accumulation in tomato. J. Plant Physiol. 2022, 273, 11. [Google Scholar] [CrossRef]
  58. Zhang, L.Y.; Bai, M.Y.; Wu, J.X.; Zhu, J.Y.; Wang, H.; Zhang, Z.G.; Wang, W.F.; Sun, Y.; Zhao, J.; Sun, X.H.; et al. Antagonistic HLH/bHLH Transcription Factors Mediate Brassinosteroid Regulation of Cell Elongation and Plant Development in Rice and Arabidopsis. Plant Cell 2009, 21, 3767–3780. [Google Scholar] [CrossRef] [Green Version]
  59. Bai, M.Y.; Fan, M.; Oh, E.; Wang, Z.Y. A Triple Helix-Loop-Helix/Basic Helix-Loop-Helix Cascade Controls Cell Elongation Downstream of Multiple Hormonal and Environmental Signaling Pathways in Arabidopsis. Plant Cell 2012, 24, 4917–4929. [Google Scholar] [CrossRef] [Green Version]
  60. Sakulsingharoj, C.; Inta, P.; Sukkasem, R.; Pongjaroenkit, S.; Chowpongpang, S.; Sangtong, V. Overexpression of OSB2 gene in transgenic rice up-regulated expression of structural genes in anthocyanin biosynthesis pathway. Thai J. Genet. 2014, 7. [Google Scholar]
  61. Zheng, K.; Wang, Y.; Na, Z.; Jia, Q.; Wang, S. Involvement of PACLOBUTRAZOL RESISTANCE6/KIDARI, an atypical bHLH transcription factor, in auxin responses in arabidopsis. Front. Plant Sci. 2017, 8, 1813. [Google Scholar] [CrossRef] [PubMed] [Green Version]
  62. Zheng, K.J.; Wang, Y.T.; Wang, S.C. The non-DNA binding bHLH transcription factor Paclobutrazol Resistances are involved in the regulation of ABA and salt responses in Arabidopsis. Plant Physiol. Biochem. 2019, 139, 239–245. [Google Scholar] [CrossRef] [PubMed]
  63. Song, Y.; Yang, C.W.; Gao, S.; Zhang, W.; Li, L.; Kuai, B.K. Age-Triggered and Dark-Induced Leaf Senescence Require the bHLH Transcription Factors PIF3, 4, and 5. Mol. Plant. 2014, 7, 1776–1787. [Google Scholar] [CrossRef] [Green Version]
  64. Schuster, C.; Gaillochet, C.; Lohmann, J.U. Arabidopsis HECATE genes function in phytohormone control during gynoecium development. Development 2015, 142, 3343–3350. [Google Scholar] [CrossRef] [Green Version]
  65. Feng, S.; Martinez, C.; Gusmaroli, G.; Yu, W.; Zhou, J.; Wang, F.; Chen, L.; Lu, Y.; Iglesias-Pedraz, J.M.; Kircher, S. Coordinated regulation of Arabidopsis thaliana development by light and gibberellins. Nature 2008, 451, 475–479. [Google Scholar] [CrossRef] [PubMed] [Green Version]
  66. Hong, G.J.; Xue, X.Y.; Mao, Y.B.; Wang, L.J.; Chen, X.Y. Arabidopsis MYC2 Interacts with DELLA Proteins in Regulating Sesquiterpene Synthase Gene Expression. Plant Cell 2012, 24, 2635–2648. [Google Scholar] [CrossRef] [Green Version]
  67. Hu, J.H.; Israeli, A.; Ori, N.; Sun, T.P. The Interaction between DELLA and ARF/IAA Mediates Crosstalk between Gibberellin and Auxin Signaling to Control Fruit Initiation in Tomato. Plant Cell 2018, 30, 1710–1728. [Google Scholar] [CrossRef] [Green Version]
  68. Gu, L.J.; Dou, L.L.; Guo, Y.N.; Wang, H.T.; Li, L.B.; Wang, C.C.; Ma, L.; Wei, H.L.; Yu, S.X. The WRKY transcription factor GhWRKY27 coordinates the senescence regulatory pathway in upland cotton (Gossypium hirsutum L.). BMC Plant Biol. 2019, 19, 14. [Google Scholar] [CrossRef] [Green Version]
  69. Niu, F.F.; Cui, X.; Zhao, P.Y.; Sun, M.T.; Yang, B.; Deyholos, M.K.; Li, Y.; Zhao, X.J.; Jiang, Y.Q. WRKY42 transcription factor positively regulates leaf senescence through modulating SA and ROS synthesis in Arabidopsis thaliana. Plant J. 2020, 104, 171–184. [Google Scholar] [CrossRef]
  70. Zentgraf, U.; Laun, T.; Miao, Y. The complex regulation of WRKY53 during leaf senescence of Arabidopsis thaliana. Eur. J. Cell Biol. 2010, 89, 133–137. [Google Scholar] [CrossRef] [PubMed]
  71. Chen, L.G.; Xiang, S.Y.; Chen, Y.L.; Li, D.B.; Yu, D.Q. Arabidopsis WRKY45 Interacts with the DELLA Protein RGL1 to Positively Regulate Age-Triggered Leaf Senescence. Mol. Plant. 2017, 10, 1174–1189. [Google Scholar] [CrossRef] [Green Version]
  72. Gan, S.; Amasino, R.M. Making Sense of Senescence (Molecular Genetic Regulation and Manipulation of Leaf Senescence). Plant Physiol. 1997, 113, 313–319. [Google Scholar] [CrossRef] [PubMed] [Green Version]
  73. He, Y.; Fukushige, H.; Hildebrand, D.F.; Gan, S. Evidence supporting a role of jasmonic acid in Arabidopsis leaf senescence. Plant Physiol. 2002, 128, 876–884. [Google Scholar] [CrossRef] [PubMed] [Green Version]
  74. Morris, K.; MacKerness, S.A.; Page, T.; John, C.F.; Murphy, A.M.; Carr, J.P.; Buchanan-Wollaston, V. Salicylic acid has a role in regulating gene expression during leaf senescence. Plant J. Cell Mol. Biol. 2000, 23, 677–685. [Google Scholar] [CrossRef]
  75. Naz, A.A.; Raman, S.; Martinez, C.C.; Sinha, N.R.; Schmitz, G.; Theres, K. Trifoliate encodes an MYB transcription factor that modulates leaf and shoot architecture in tomato. Proc. Natl. Acad. Sci. USA 2013, 110, 2401–2406. [Google Scholar] [CrossRef] [PubMed] [Green Version]
  76. Pertea, M.; Kim, D.; Pertea, G.M.; Leek, J.T.; Salzberg, S.L. Transcript-level expression analysis of RNA-seq experiments with HISAT, StringTie and Ballgown. Nat. Protoc. 2016, 11, 1650–1667. [Google Scholar] [CrossRef]
  77. Liu, H.; Li, X.; Xiao, J.; Wang, S. A convenient method for simultaneous quantification of multiple phytohormones and metabolites: Application in study of rice-bacterium interaction. Plant Methods 2012, 8, 2. [Google Scholar] [CrossRef] [Green Version]
Figure 1. Morphological differences between mutant and wild-type plants. (A) Pts mutant had significantly greater number of leaflets than VF36 wild type. (B) tf2 mutant had significantly smaller number of leaflets and deeper cleft than CR wild type. (C) entire mutant had simplified leaves and smooth leaf margins compared with AC wild type. (AC) Plants were 45 d old. The selected leaf was the fifth true leaf of the 45 d old plants in (AC). Bars = 500 μm in (AC). (D) Leaf structure. TL represents terminal leaflet, LT represents lateral leaflet, F represents foliole, P represents petiolated, R represents rachis, and LM represents leaf margin.
Horticulturae 09 00363 g001
Figure 2. Differences in the number of leaf hairs and cells between tomato mutants and wild types visualized using scanning electron microscope (SEM). (AF) Images of mutant Pts, tf2, and e and wild-type VF36, CR, and AC under SEM. (G) Differences in the number of leaf hairs between mutant Pts, tf2, and e and wild-type VF36, CR, and AC. (HS) Images of epidermal cells observed under SEM at 300 (H,J,L,N,P,R) and 800 (I,K,M,O,Q,S) magnification. (T) The number of epidermal cells differed between mutant Pts, tf2, and entire and wild-type VF36, CR, and AC. (G,T) Values are presented as means ± SE (n = 3). ** indicate significant differences between wild types and transgenic lines or mutants at p < 0.05 and p < 0.01, respectively. (AS) Bars = 50 μm.
Horticulturae 09 00363 g002
Figure 3. Overlapping differential genes and transcription factor families of differentially expressed genes (DEGs) in Pts/VF36, tf2/CR, and e/AC. (A) Number of DEGs in transcriptome of tomato mutant plants with different leaf morphology compared with that of the wild-type plants. The sum of the numbers in each circle is the total number of DEGs in the comparison combination, and the overlapping parts of the circles represent the DEGs shared between the two comparison groups. (B) The abscissa represents the comparison groups of difference analysis, the ordinate represents the number of DEGs, blue bars represent upregulated expression, and red bars represent downregulated expression. (CE) The transcription factor families were differentially expressed in Pts/VF36, tf2/CR, and e/AC. The abscissa represents different transcription factor families, and the ordinate represents the number of different genes falling into a transcription factor family. Blue bars represent upregulated expression, and red bars represent downregulated expression.
Horticulturae 09 00363 g003aHorticulturae 09 00363 g003b
Figure 4. Physiological differences between the mutants and the wild types. (A) Transpiration rate of the fourth true leaf. Mutants Pts, tf2, and e and their corresponding wild types VF36, CR, and AC. Values are presented as means ± SE (n = 3). * and ** indicate significant differences between wild types and transgenic lines or mutants at p < 0.05 and p < 0.01, respectively. (B) Differences in stoma number between mutants Pts, tf2, and e and their corresponding wild types VF36, CR, and AC. Values are presented as means ± SE (n = 3). * and ** indicate significant differences between wild types and transgenic lines or mutants at p < 0.05 and p < 0.01, respectively. (C) Differences in stomatal conductance between mutants Pts, tf2, and entire and their corresponding wild types VF36, CR, and AC. Values are presented as means ± SE (n = 3). * and ** indicate significant differences between wild types and transgenic lines or mutants at p < 0.05 and p < 0.01, respectively. (DF) Determination of chlorophyll leaching rate. Measurements were recorded every 20 min in the mutants Pts, tf2, and e and their corresponding wild types VF36, CR, and AC. Values are presented as means ± SE (n = 3). * and ** indicate significant differences between wild types and transgenic lines or mutants at p < 0.05 and p < 0.01, respectively. (G) The ratio of type I, type II, and type III stomata in the mutants Pts, tf2, and e and their corresponding wild types VF36, CR, and AC. type I, normal opened stomatal pores; type II, stomatal pores not fully occluded; type III, stomatal pores fully covered. Values are presented as means ± SE (n = 3). * and ** indicate significant differences between wild types and transgenic lines or mutants at p < 0.05 and p < 0.01, respectively. (H) Total chlorophyll content at 24 h in mutants Pts, tf2, and e and their corresponding wild types VF36, CR, and AC. Values are presented as means ± SE (n = 3). * and ** indicate significant differences between wild types and transgenic lines or mutants at p < 0.05 and p < 0.01, respectively.
Horticulturae 09 00363 g004aHorticulturae 09 00363 g004b
Figure 5. Determination of concentration of IAA and GA3 and biosynthesis pathway analysis. (A,B) The contents of IAA and GA3 in mutants Pts, tf2, and e and in their corresponding wild types VF36, CR, and AC were determined. Values are presented as means ± standard error (SE) (n = 3). * and ** indicate significant differences between wild types and transgenic lines or mutants at p < 0.05 and p < 0.01, respectively. (C,D) Related gene changes in IAA and GA3 biosynthesis pathways. The orange arrows represent Pts/VF36, yellow arrows represent tf2/CR, and black arrows represent e/AC. Upward arrows represent upregulation of gene expression, and downward arrows represent downregulation of gene expression.
Horticulturae 09 00363 g005aHorticulturae 09 00363 g005b
Figure 6. Analysis of the expression levels of candidate genes at different stages of AC leaf primordium development. (A) The P3–P10 stages of leaf primordium development were selected, and AC was used as the material. Bars = 500 μm in (A). (BG) Analysis of the expression levels of candidate genes at different developmental stages of leaf primordia. The gene expression level at P3 was selected as the control. Mean values and standard deviation from three biological replicates are shown. Independent t-tests demonstrated a significant (* p < 0.05) or a highly significant (** p < 0.01) difference in gene expression levels.
Horticulturae 09 00363 g006aHorticulturae 09 00363 g006b
Figure 7. Gene expression in plants with VIGS compared with that in pTRV2 control. (AF) The expression of bHLH079, IAA-Amino acid hydrolase, Gibberellin2ox7, Gibberellin20ox, WRKY44, and WRKY76 in VIGS plants was compared with that in pTRV2 plants. pTRV2 was used as a blank vector control. Mean values and standard deviation from three biological replicates are shown. Independent t-tests demonstrated a significant (* p < 0.05) or a highly significant (** p < 0.01) difference in gene expression levels.
Horticulturae 09 00363 g007
Figure 8. Differences in leaf morphology of VIGS plants compared with that of pTRV2 plants. (AG) The fourth true leaf of VIGS and pTRV2 plants at 45 d were used as the control. Bars = 4 cm.
Horticulturae 09 00363 g008aHorticulturae 09 00363 g008b
Table 1. RNA-Seq analysis of differentially expressed genes (DEGs) in Pts/VF36, tf2/CR, and entire/AC.
Gene IDPts/VF36Log2
(FC)
tf2/CRLog2
(FC)
entire/ACLog2
(FC)
Description
Solyc06g064820.3Downregulation−2.30Downregulation−3.52Downregulation−5.58GDSL esterase/lipase At1g71691
Solyc11g031960.2Downregulation−1.36Downregulation−1.79Downregulation−1.80GDSL esterase/lipase At1g33811
Solyc11g006250.2Downregulation−1.71Downregulation−3.50Downregulation−3.63GDSL esterase/lipase At5g33370
Solyc01g095450.4Downregulation−1.94Downregulation−3.42Downregulation−5.72GDSL esterase/lipase At4g01130
Solyc03g006830.3Downregulation−1.89Downregulation−2.37Downregulation−2.50MADS-box transcription factor 2
Solyc05g009270.4Downregulation−3.40Downregulation−3.84Downregulation−4.03Fatty acid elongase 3-ketoacyl-CoA synthase
Solyc09g090500.3Downregulation−1.42Downregulation−1.91Downregulation−2.10Cyclopropane-fatty-acyl-phospholipid synthase
Solyc06g050500.2Downregulation−1.26Upregulation1.66Upregulation1.82Abscisic acid receptor PYL4
Disclaimer/Publisher’s Note: The statements, opinions and data contained in all publications are solely those of the individual author(s) and contributor(s) and not of MDPI and/or the editor(s). MDPI and/or the editor(s) disclaim responsibility for any injury to people or property resulting from any ideas, methods, instructions or products referred to in the content.

