Article

Nano-Biochar Suspension Mediated Alterations in Yield and Juice Quality of Kinnow (Citrus reticulata L.)

1
Institute of Molecular Biology and Biotechnology, The University of Lahore, Lahore 54590, Pakistan
2
Nuclear Institute for Agriculture and Biology College (NIAB-C), Pakistan Institute of Engineering and Applied Sciences (PIEAS), Islamabad 45650, Pakistan
3
Department of Plant Breeding and Genetics, University of Agriculture Faisalabad, Faisalabad 38000, Pakistan
4
Department of Soil, Plant, and Food Sciences, University of Bari “Aldo Moro”, 70126 Bari, Italy
5
Centre of Agriculture Biochemistry and Biotechnology, University of Agriculture Faisalabad, Faisalabad 38000, Pakistan
6
Department of Environmental Science, University of Agriculture Faisalabad, Faisalabad 38000, Pakistan
7
Department of Botany, Division of Science and Technology, University of Education, Lahore 54770, Pakistan
*
Authors to whom correspondence should be addressed.
Horticulturae 2023, 9(5), 521; https://doi.org/10.3390/horticulturae9050521
Submission received: 4 March 2023 / Revised: 15 April 2023 / Accepted: 18 April 2023 / Published: 22 April 2023

Abstract

:
Nutrient deficiency negatively affects the yield and quality of citrus fruit. The present experiment was carried out to investigate the improvement in fruit yield and juice quality of Kinnow (Citrus reticulata L.) by foliar application of nano-biochar suspension (NBS). The experiment was carried out in a citrus farmer’s orchard with a history of low fruit yield, using a randomized complete block design. Four NBS treatments, i.e., 0% (control), 1, 3, and 5%, were applied through foliar application at the flowering stage. Foliar application of NBS at 5% and 3% significantly (p < 0.05) improved flowering, fruit retention, fruit set, fruit size, length, weight, diameter, juice volume levels, and minimized fruit dropping. The electrical conductivity of the juice was significantly decreased by increases in NBS concentration. Total dissolved solids increased slightly with treatments as compared to control. However, NBS foliar application did not show significant effects on nitrogen (N), potassium (K), and sodium (Na) leaf contents, but had some effect on phosphorus (P) content. Principal component analysis and a correlation matrix revealed significant (p < 0.05) positive and negative associations among the studied traits. The results of the current experiment showed that all parameters were significantly improved with the application of NBS at 3 and 5%, except that N, K, and Na levels were unaffected. The most encouraging results were achieved at a concentration of 5% NBS. In conclusions, the foliar application of NBS had a significant positive impact on fruit yield and juice quality.

1. Introduction

Citrus is a genus of trees that is extremely important for the economy of several countries. Citrus fruits are presently grown in more than 140 countries worldwide. The highest production of citrus fruit was recorded in the northern hemisphere, particularly in Mediterranean regions and the United States [1]. Global citrus production is currently estimated to be over 116 million tons. Brazil is the world’s largest citrus-growing country, accounting for 18.1% of worldwide citrus production, followed by China (17.2%) and the United States [2]. These three countries account for half of the world’s citrus production [3]. Citrus is an important component of the global juice industry, and Pakistan is among the top ten citrus-growing countries worldwide [4]. In 2018, 0.2 million hectares of citrus fruits were cultivated in Pakistan, yielding 2.29 million tons [5,6]. Kinnow is cultivated worldwide for its delicious taste and high nutritional value [7]. Citrus is mostly grown under natural environmental conditions to maintain the natural flavor and quality of the fruit [8]. For the growth of high-quality and economically important citrus fruits, an optimum supply of plant nutrients, especially macro- and micronutrients, is essential [9,10]. Citrus is planted all over Pakistan, but Punjab supplies more than 95% of the crop [11]. Despite having a large area under citrus cultivation, the per hectare productivity of citrus fruit in Pakistan is still low compared to other citrus-growing countries of the world [9,12]. In fact, nutritional deficiencies negatively affect fruit sets [13], inhibit the biosynthesis of plant growth hormones and slow down physio-biochemical processes, thereby reducing yield and growth in plants. Therefore, an adequate nutrient supply is essential for optimum plant growth, maintenance of physio-biochemical activities, and high crop productivity [14]. Nutrients are structural constituents and regulatory co-factors for various enzymes and proteins in plants; therefore, they play an important role in metabolic processes [15]. Nutrient deficiency is one of the main reasons for low crop productivity and is common in Pakistani soils due to their low organic carbon content and a high pH that results in the immobilization of several micronutrients [16].
Biochar is a rich source of carbonaceous material obtained from organic wastes which are thermally decomposed in the absence or deficiency of oxygen [17]. Biochar plays an important role in enhancing agricultural productivity by mitigating drought and salinity stress and improving crop yield and by scavenging reactive oxygen species [18]. Modern manufacturing techniques provide assistance in the fabrication of nanomaterials having diameters of less than 100 nm and specific shapes, which can be used in improving crop quality and productivity [19]. Nanomaterials can enter the plant tissues via symplast or apoplast pathways and show either negative or positive effects [20]. Thus, the appropriate utilization of nano-biochar suspensions (NBS) is an ideal choice to improve crop yield, growth, and development in soils that are less fertile. Exogenous application of carbon-containing nanomaterials is more advantageous for proper plant growth and development as they have more micro-porosity and surface area [21]. The use of engineered carbon nanoparticles has improved the growth and metabolism of several crops, as reported by Verma et al. [22].
Plant growth and production can be improved by choosing the right nutrient ratio [23,24]. Foliar application supplies macro- and micro-nutrients, phytohormones, stimulants, and other beneficial substances at additive rates. Nutrient foliar spray improves citrus fruit yield and resistance against disease, and reduces insect pest attacks [10,24]. Nutrients are easily available to plants through foliar application methods, and their application at specific phenological stages can play a significant role in biochemical activities that are required to promote fruit yield and quality. To increase quality and productivity, proper nutrition management is a key regulatory factor [25]. Thus, keeping in view the vital role of nutrients, the present investigation was conducted to enhance citrus fruit yield and juice quality by using nano-biochar suspension (NBS) as a foliar spray.

2. Materials and Methods

2.1. Experimental Site

This experiment was carried out during the period 20 October 2021–15 March 2022, in a citrus orchard located in district Kot-Addu, Punjab, Pakistan. Soil was sampled following a W scheme, coring till 60 cm using an auger. Soil samples were air dried and analyzed for their main physical and chemical characteristics. The particle-size distribution was determined using the pipette method and the soil texture was identified with the USDA textural classification system [26]. The pH was measured using a WTW pH meter (Weilheim, Germany), while the electrical conductivity (EC) was analyzed with a WTW LF538 conductivity-meter (Weilheim, Germany). Total nitrogen content was estimated using the Kjeldhal method, the exchangeable potassium was measured by Flame Photometer (PFP7, Leicestershire, UK) and the available phosphorus content was analyzed according to Jackson’s protocol [27]. The physicochemical properties of soil are shown in Table 1. The citrus plants were 25 years old and during the experiment they were managed in accordance with the local good agricultural practices.

2.2. Experimental Design

2.2.1. Nano-Biochar Suspension Characteristics

The NBS was prepared as colloidal suspension of nano-biochar supplied by Prof. Dr. Lixin Zhang, College of Life Sciences, Northwest A&F University (Northern Campus), Yangling, Shaanxi, China under a Pak-China project. Its detailed characteristics and analyses have been already published by Khaliq et al. [28]. However, in brief, the pH of nanobiochar was 10.3, and EC was 3.02 dS m−1, whereas the pH of the dispersion was 2.9, and EC was 1.75 dS m−1. The SEM images of the NBC showed some globular and smooth and other sharp-edged flake-like morphology. The EDX analysis confirmed the presence of elemental carbon (C), calcium (Ca), and magnesium (Mg), along with weak silicon (Si) and potassium (K). The black spots of EDX spectra showed that it was C-rich in parts, while the crystalline area was higher in Ca. Overall, the elemental analysis of nanobiochar indicated that it was composed of C (62.5%), O (28.8%), H (1.92%), N (0.19%), and P (0.15%). Other elements such as Ca, Na, Si, P, K, Fe, Al, Mg, Sr, Cr, and Ti were also present in nanobiochar as identified by ICP-AES. The nanobiochar dispersion has relatively low S, Ca, Na, K, Fe, Mg, Zn, and Cu.

2.2.2. NBS Treatment and Experimental Design

The present experiment was performed in a randomized complete block design with factorial arrangement of three replications and four treatments of NBS, i.e., 0%, 1%, 3% and 5% (w/v). The different aforementioned levels of NBS were prepared in distilled water and the foliar spray was applied at flowering time on each selected plant. During the experiment in each row of the citrus orchard a sequence of 11 trees were selected as follows: trees 1 and 2 for the control treatment (0%), tree 3 (non-experimental); trees 4 and 5 for 1% NBS treatment, tree 6 (non-experimental); trees 7 and 8 for 3% NBS treatment; tree 9 (non-experimental), trees 10 and 11 for 5% NBS treatment. The experiment was arranged in randomized complete block design (RCBD). After foliar application of NBS, the first summer flush leaves were collected for physio-chemical analysis. For this purpose, a hundred mature leaves per tree (third leaf from top of the randomly selected branches from all four sides of a tree) were collected, rinsed twice with tap water and once with distilled water and dried in oven at 70 ± 2 °C. The dried ground leafy material was used for the elemental analyses, i.e., total nitrogen (N) concentration was obtained using micro-Kjeldhal method [29] and phosphorus (P) by Jackson’s method [27]. Na and K concentrations were obtained using a Flame-Photometer (Jenway-PFP7, Leicestershire, UK). The growth, quality and yield-relevant parameters were recorded at fruit maturity.

2.3. Fruit Drop and Yield

Fruit samples were randomly collected from each treated plant. Fruit size was determined through a water displacement method, while fruit length, width and diameter were determined by tape measure. The fruit weight was determined using a weighing balance (JC-1202A, China) and peel thickness was estimated by Venire-caliper. Flowers were counted at full blooming stage from tagged branches of both treated and untreated plants for the estimation of fruit set. Fruits were counted after 2 weeks of full blooming and fruit setting was estimated using the following formulae given by Ashraf et al. [23]:
Fruit setting (%) = (total number of fruits/total number of flowers) × 100.
Flower retention (%) = (flowers retained after foliar application of NBS/total number of flowers after foliar application of NBS) × 100.
Fruit drop (%) = (total number of fruits − number of fruits in late July)/Total number of fruits) × 100.
Fruit retention (%) = (number of fruits retained/total number of fruitlets) × 100.

2.4. Juice Quality and Chemical Analysis

The fruit juice was mechanically extracted using a local fabricated machine. Its volume was measured by water displacement method using a volumetric cylinder, and pH was determined using a WTW pH-meter (Germany). Juice EC was measured using a WTW LF538EC-meter (Germany). A digital refractometer was used to estimate the total dissolved solids (TDS) of the fruit juice. The ascorbic acid content of fruit juice was measured using the Ruck method [30].

2.5. Statistical Analysis

The collected data for all the parameters were analyzed using analysis of variance (ANOVA) to test for significance. The means were compared using Tukey’s test at 5% probability level using XL-STAT software (ver-2019). Pearson’s correlation analysis was performed to identify the relationship among traits using XL-STAT software (ver-2019). Principal component analysis (PCA) was performed using Factoextra, FactoMineR and RColorBrewer packages in R software.

3. Results

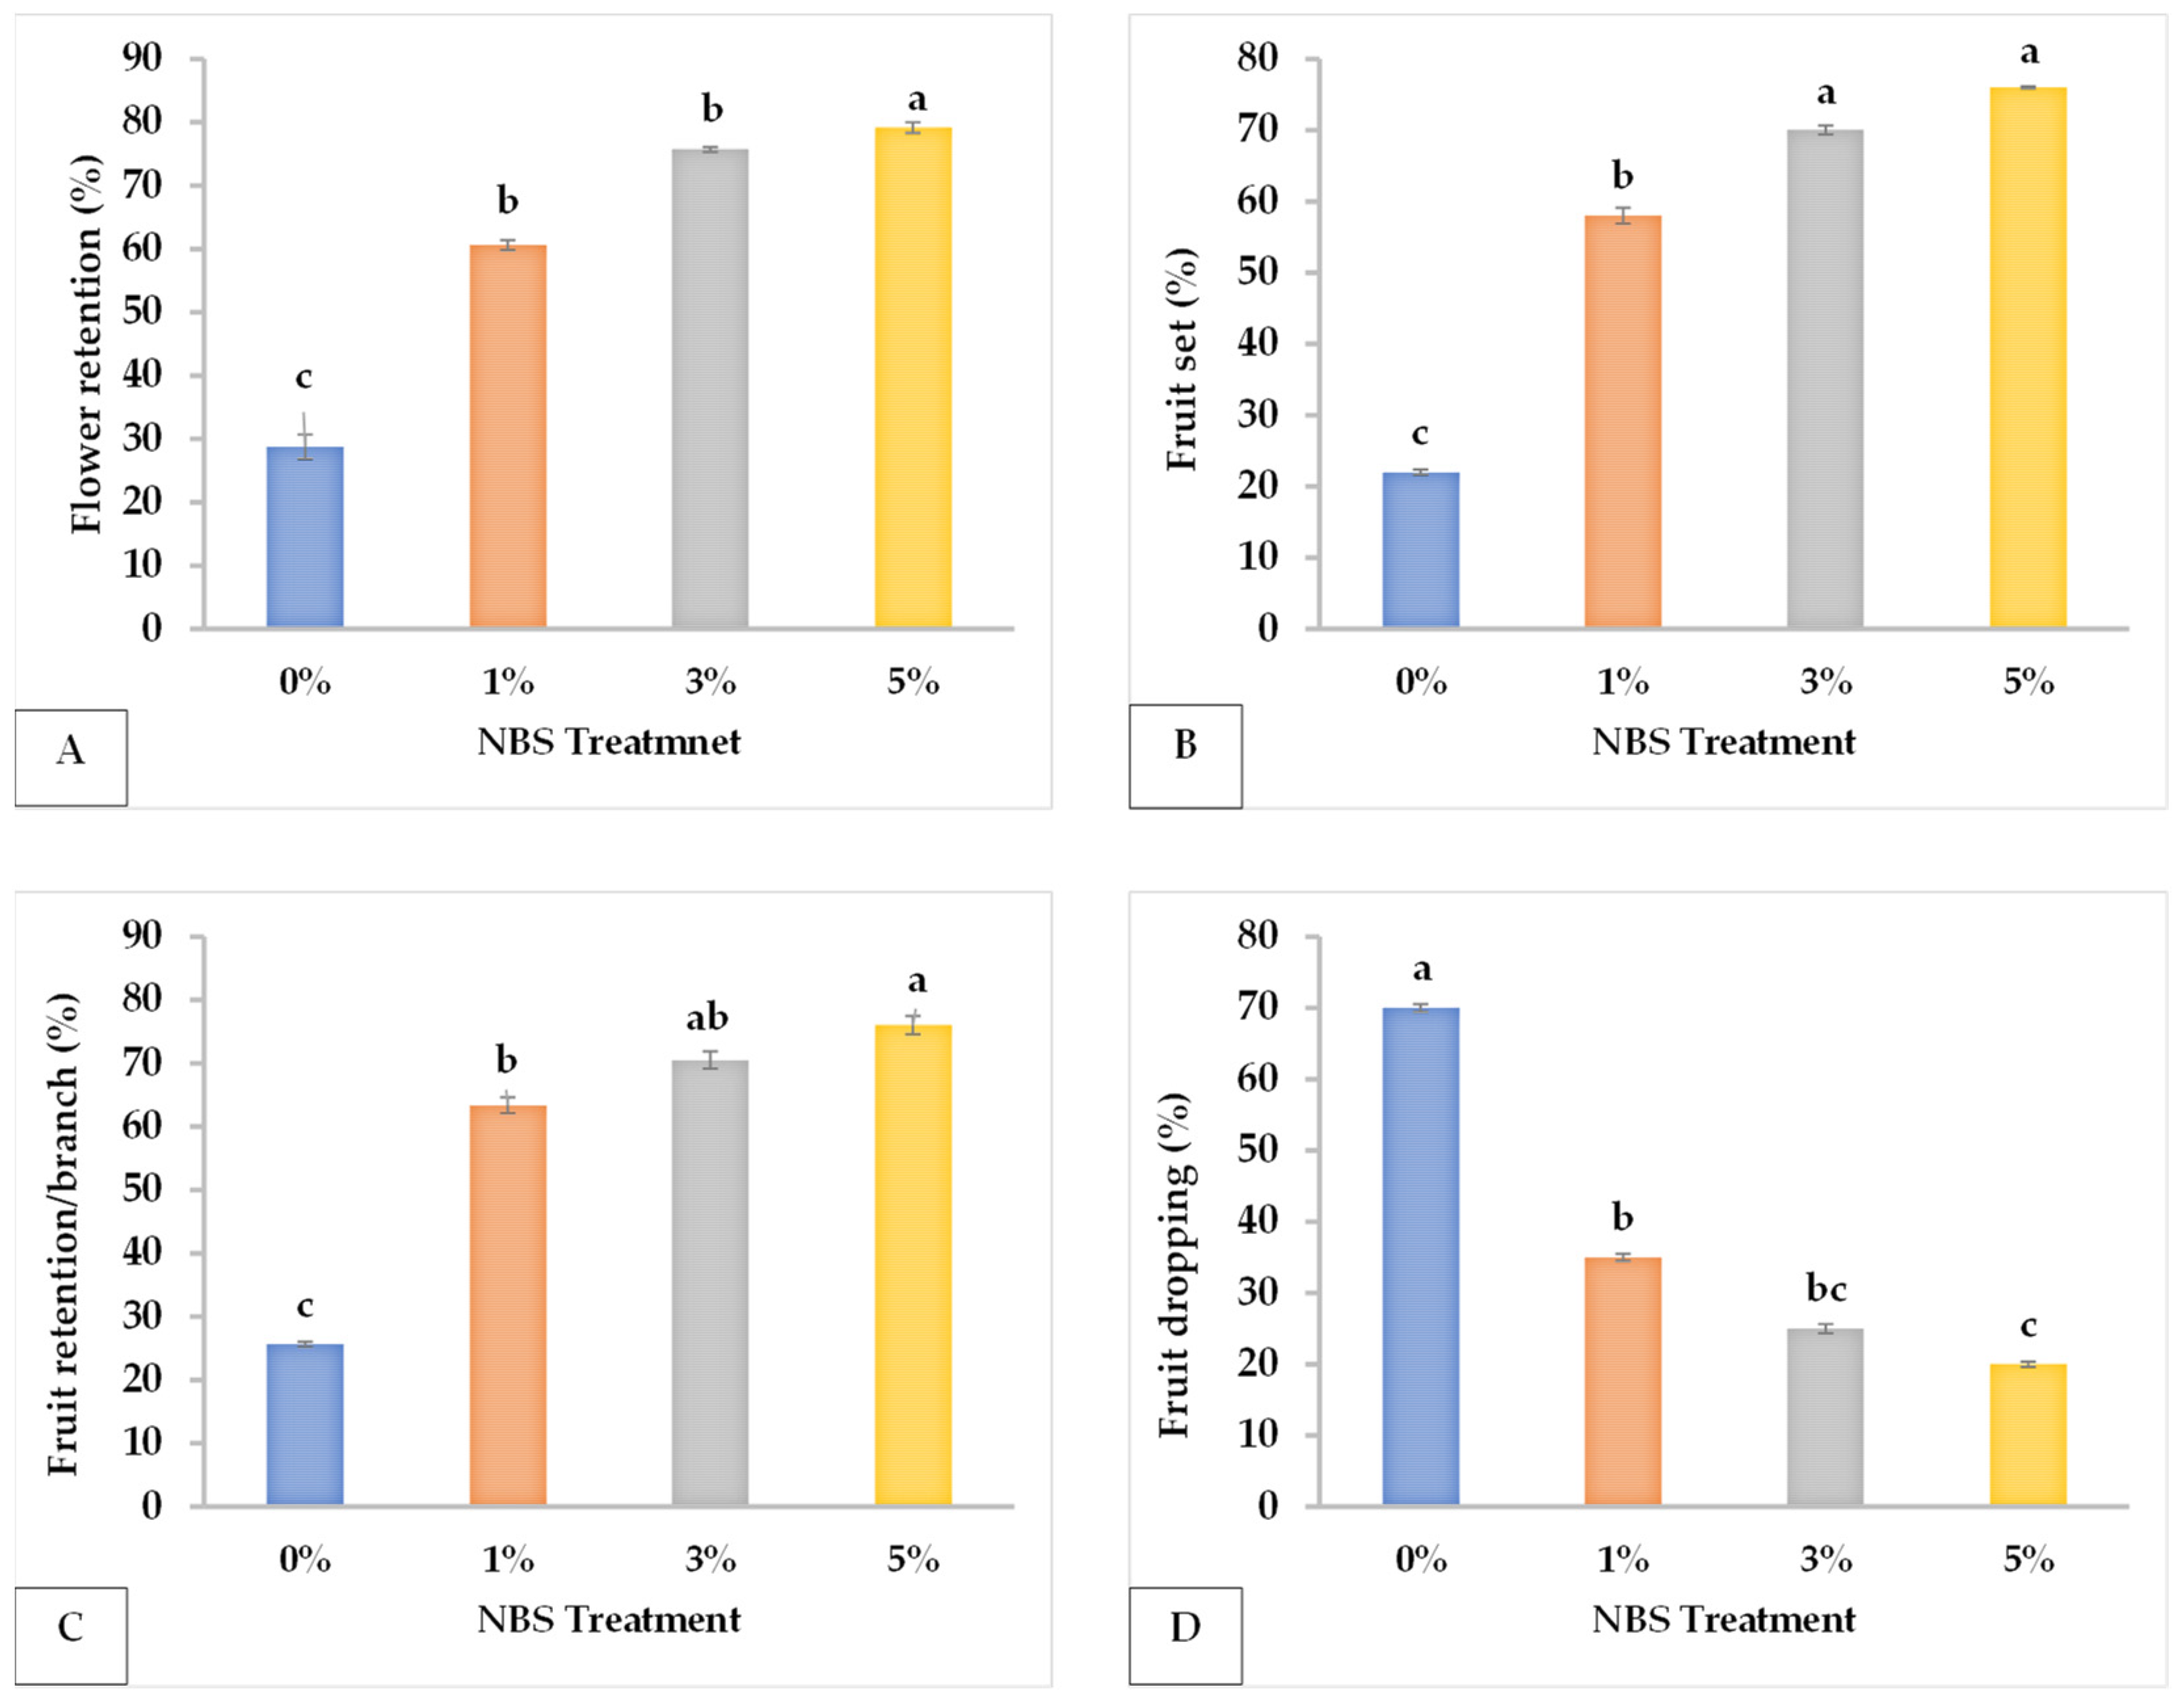
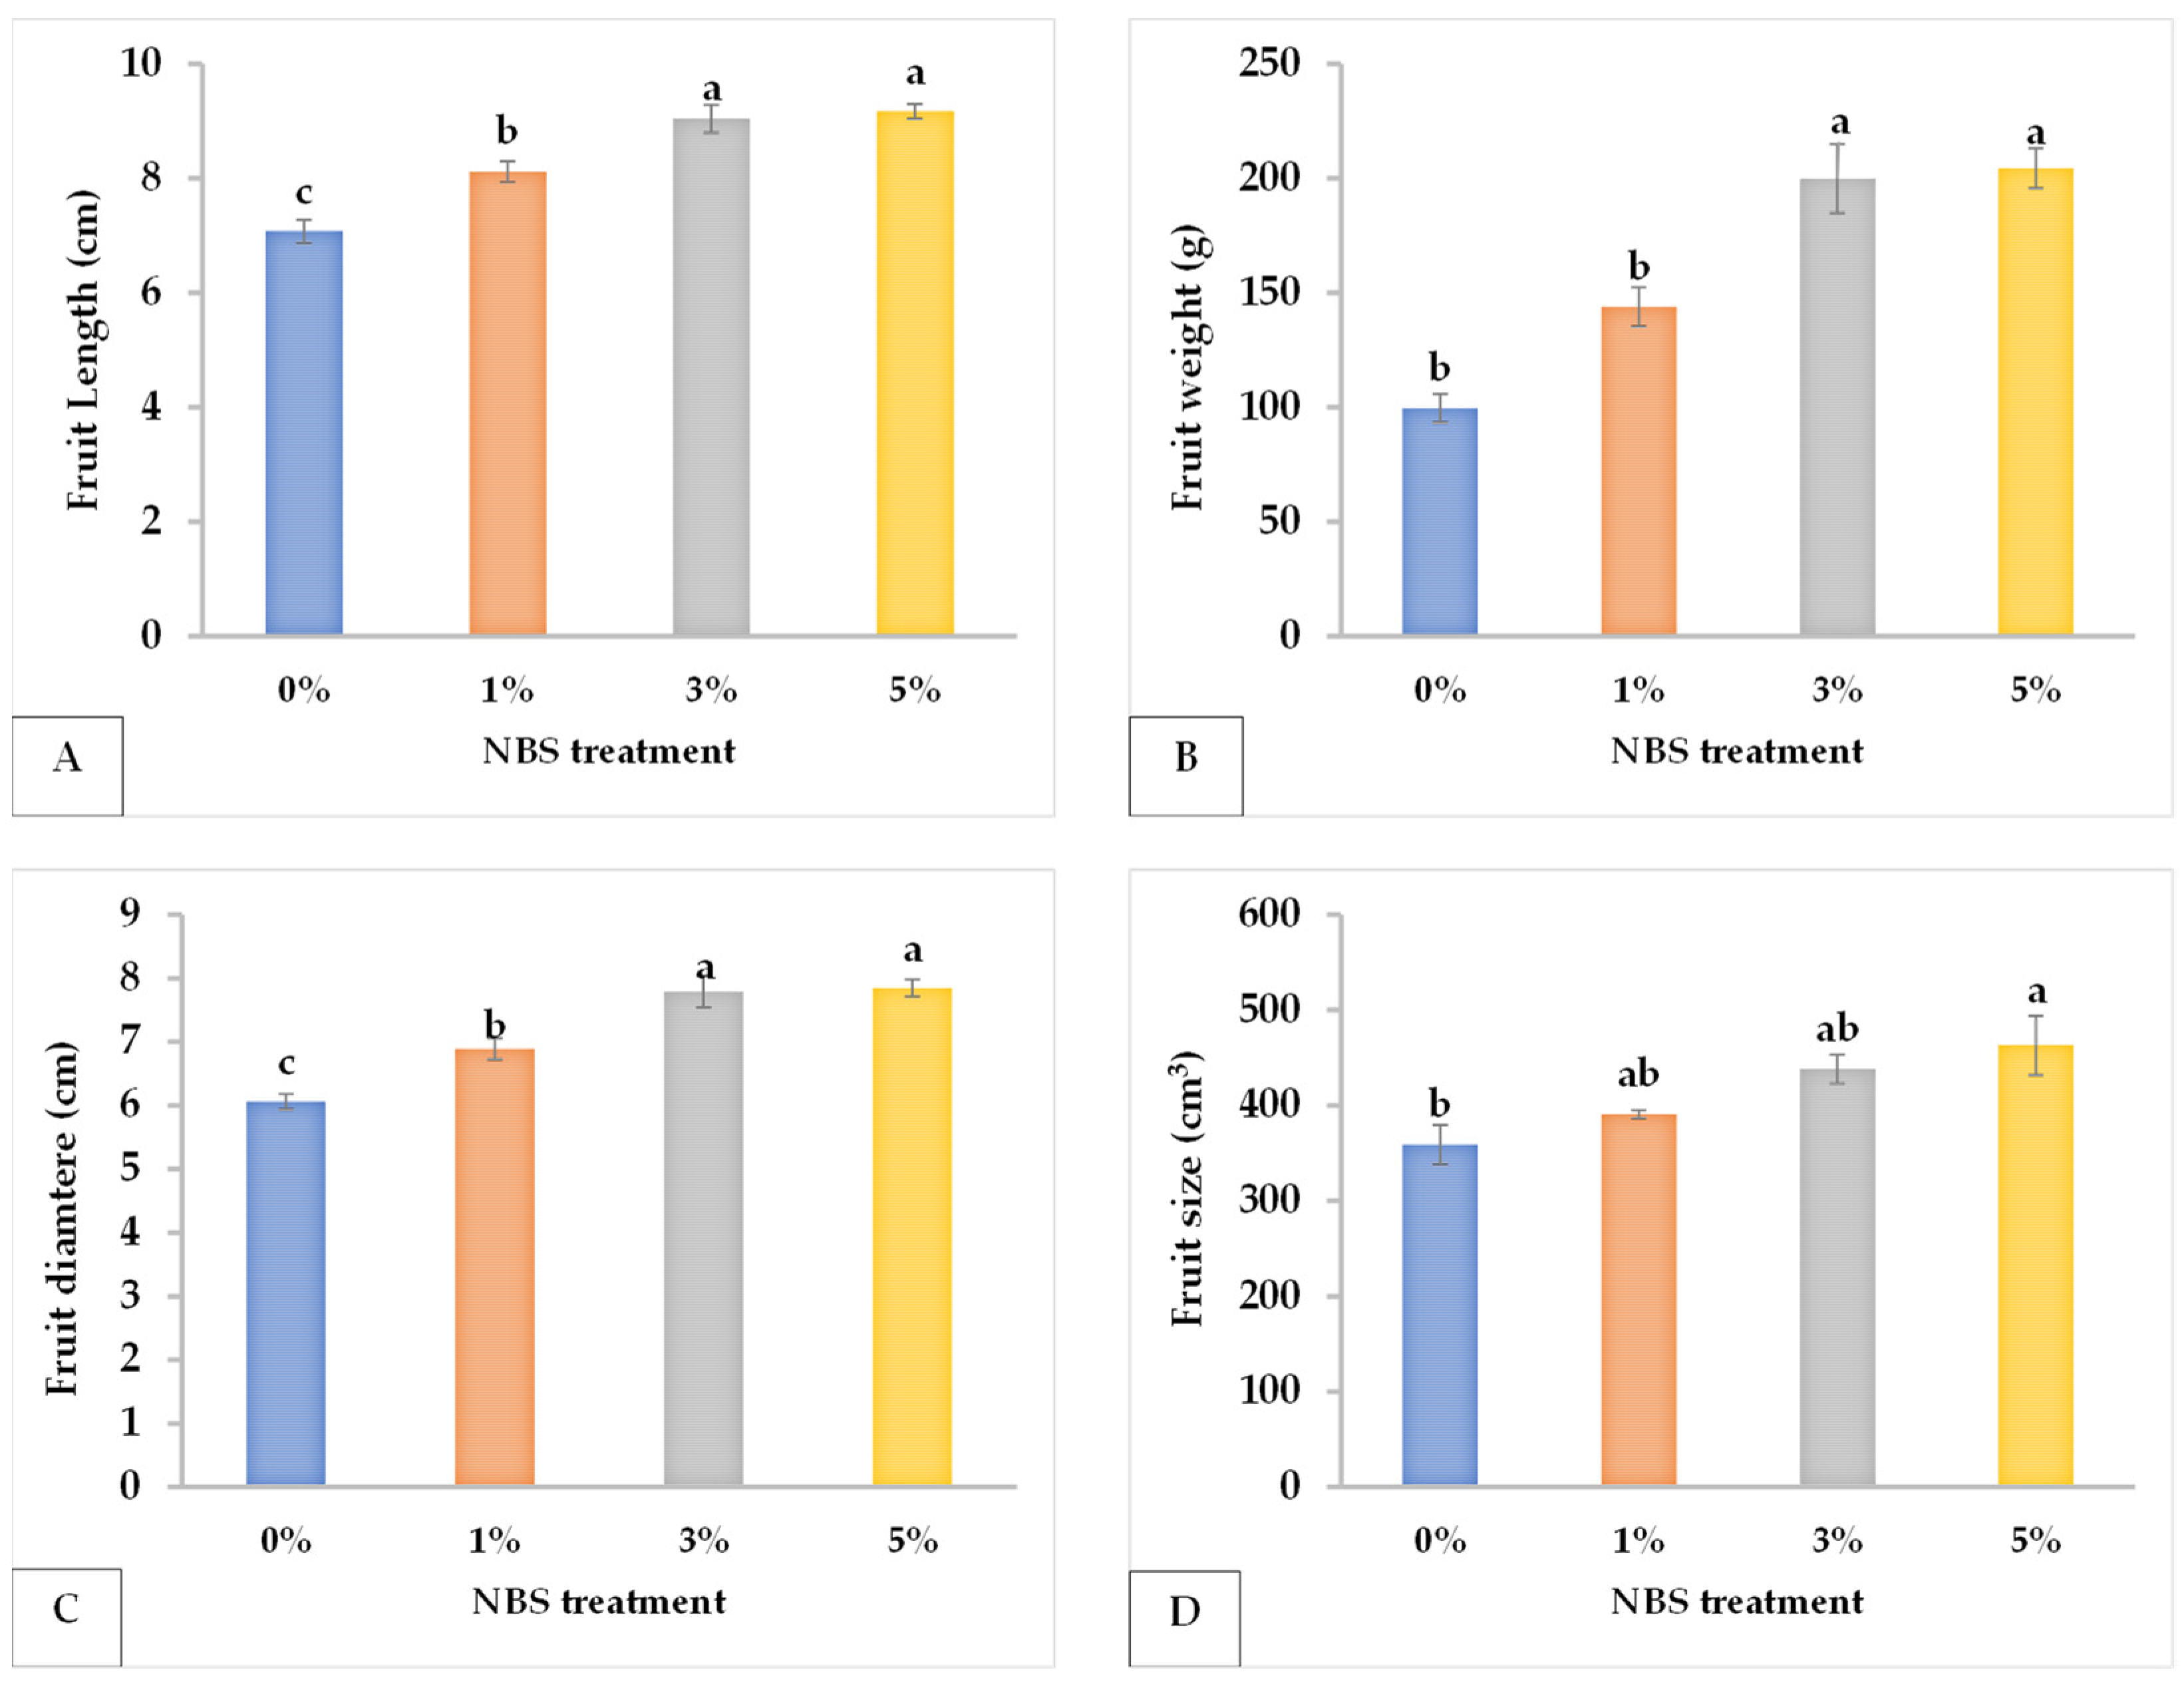
3.1. Fruit Yield and Yield Components
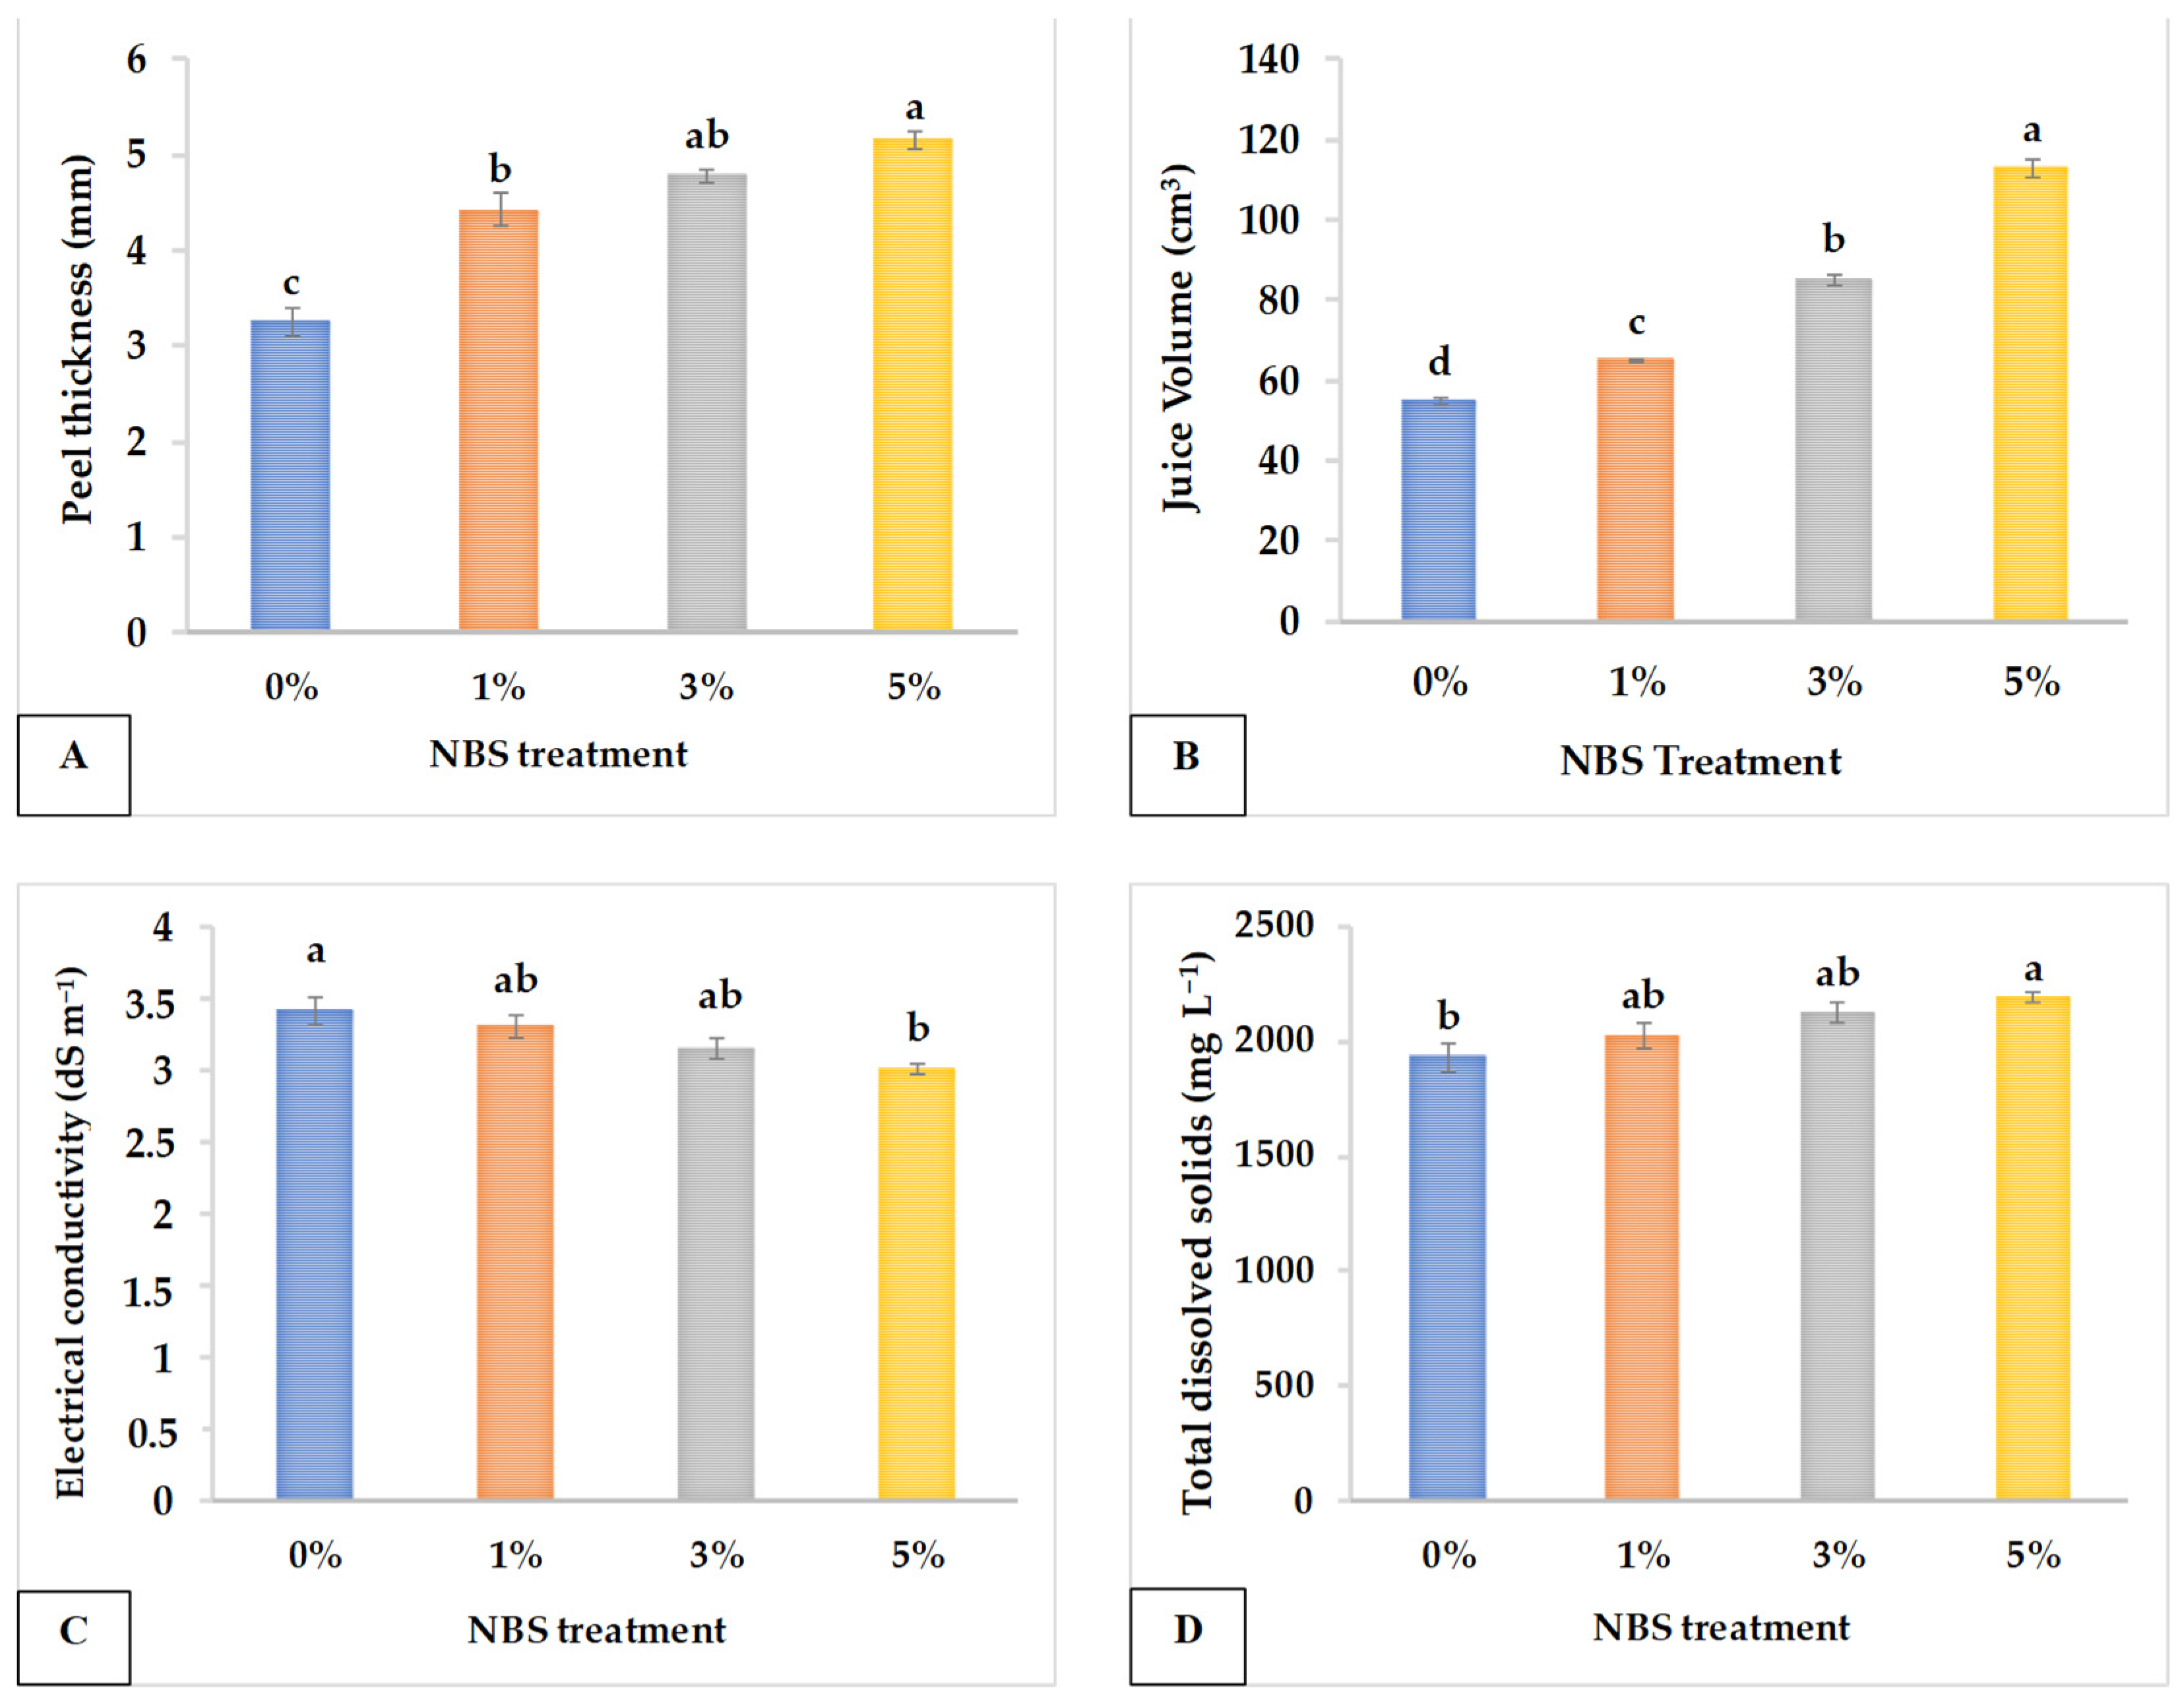
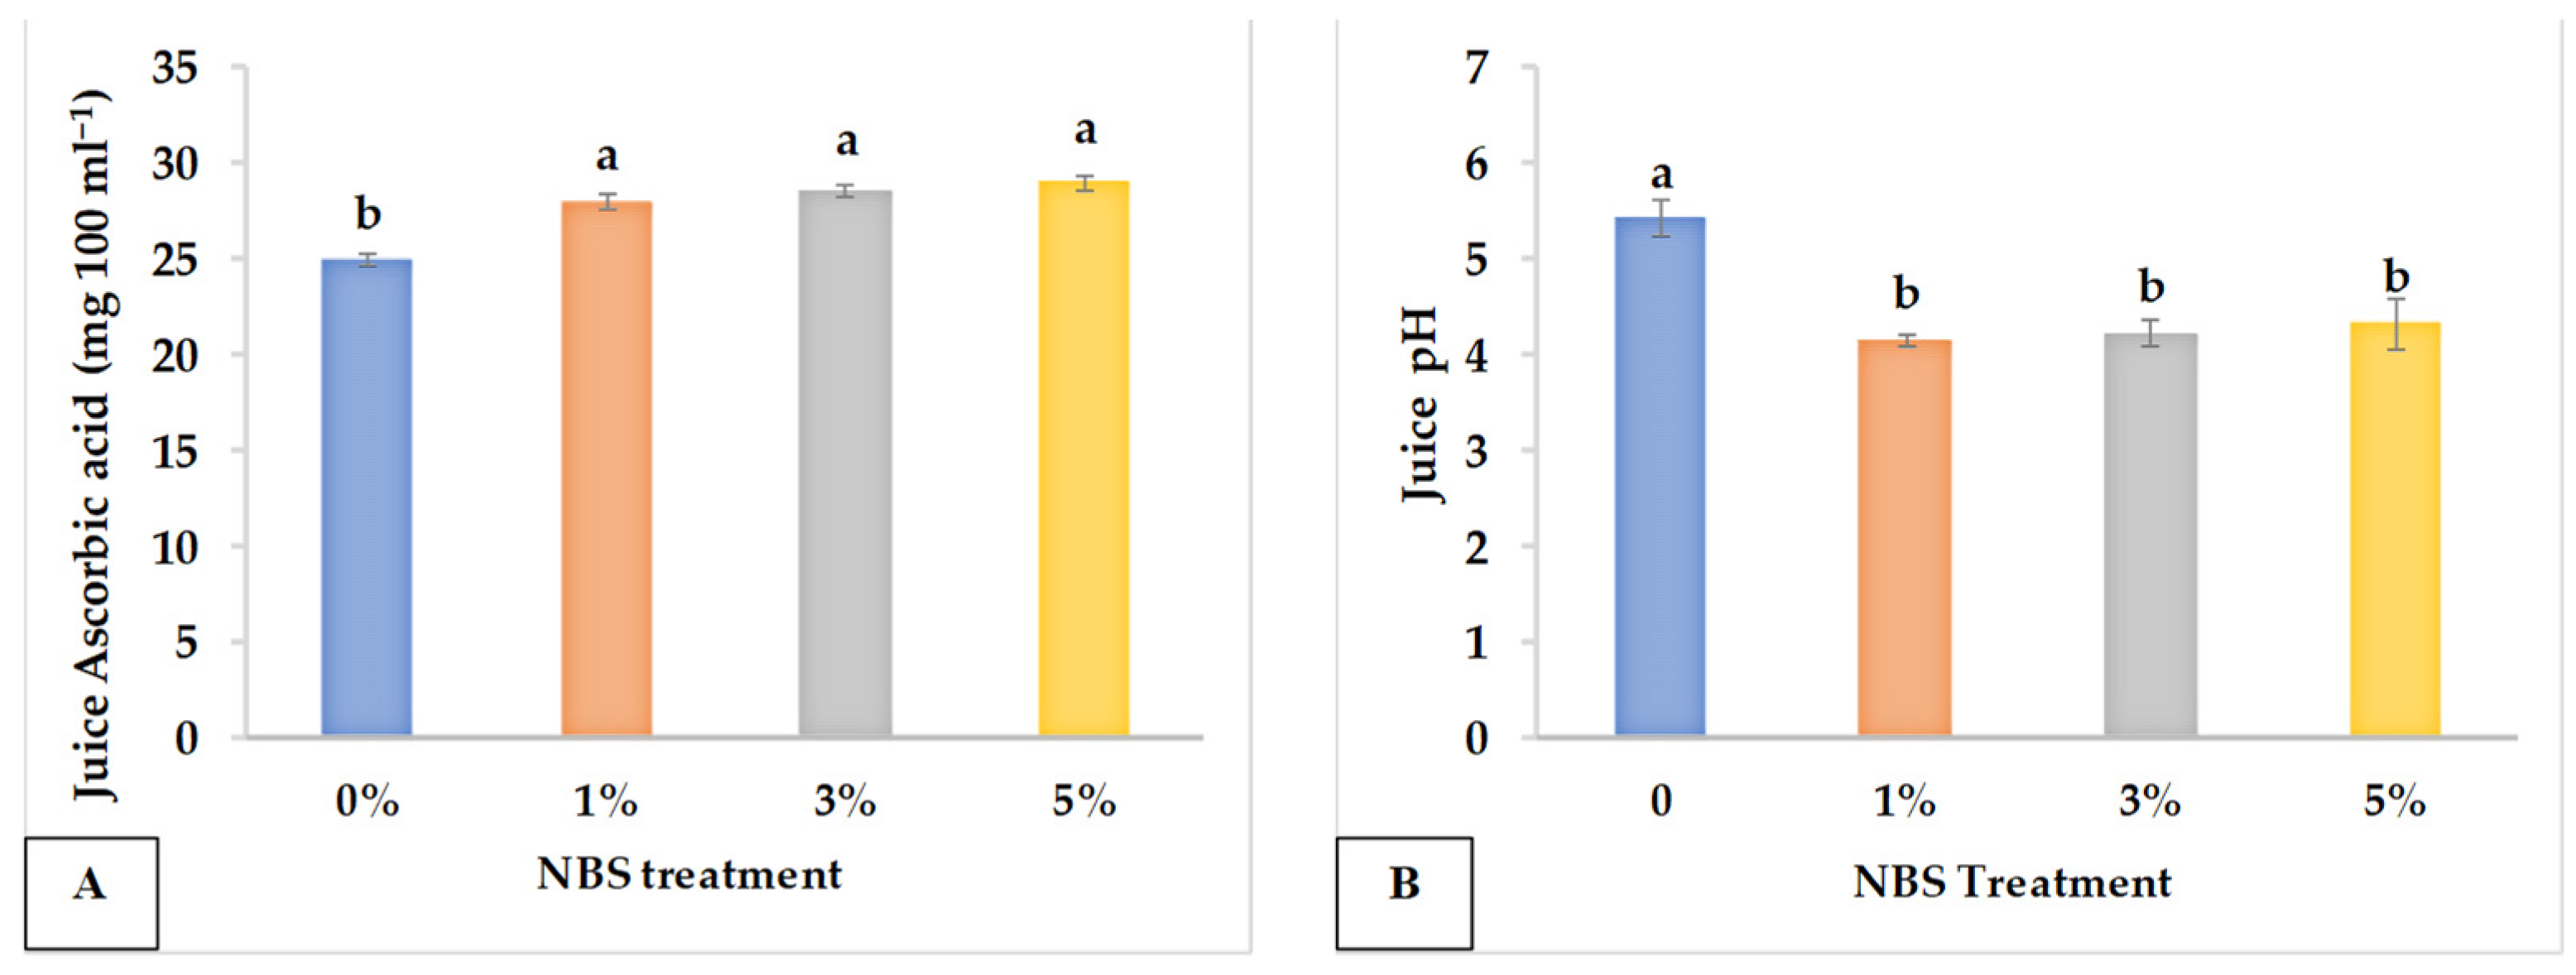
The results of the present experiments showed that foliar spray of NBS on citrus plants significantly (p < 0.05) improved flower retention per branch (Figure 1A). The flower retention increased with increases in the percentage of NBS applied: in fact, plants sprayed with 5% NBS retained the highest percentage of flowers (79%), followed by 3, 1 and 0% treatments, whose flower retention was 76, 60 and 29%, respectively (Figure 1A, Table 2). The application of 5% NBS resulted in the highest fruit set, with 76% fruits per branch, followed by the 3, 1 and 0% NBS treatments with 70, 58 and 22% fruits per branch, respectively, at yield (Figure 1B, Table 2). The fruit retention was also high (76%) at 5% NBS followed by 3, 1 and 0% with 70, 63 and 25% retention, respectively (Figure 1C, Table 2). The fruit dropping decreased with an increase in the percentage of NBS applied, since the highest level of fruit dropping was recorded in plants treated with 0% NBS (70%/branch); the level was about 20%/branch in 5% NBS treated plants while it was 25 and 35% at 3 and 1% NBS levels (Figure 1D, Table 2).
Plants treated with 5 and 3% NBS showed the highest average fruit length, followed by 1% NBS treated fruits and control (Figure 2A, Table 2). Similarly, application of NBS at 5 and 3% resulted in significantly higher (p < 0.05) fruit weight and diameter, compared to 1% NBS and control (Figure 2B,C, Table 2). Regarding fruit size (Supplementary Figure S1) and peel thickness, fruits obtained using 5% NBS showed significantly higher values of these parameters, respectively, than the control (Figure 2D and Figure 3A), while 3 and 1% NBS treatments resulted in intermediate values (Table 2).
Maximum juice volume/fruit was obtained from fruits foliarly sprayed with 5% NBS (113.1 cm3) and the value decreased with decreasing percentages of NBS (3%: 85.3 cm3; 1%: 65.3 cm3; 0%: 55.1 cm3); (Figure 3B).

3.2. Juice Quality

The electrical conductivity (EC) of citrus fruit juice was slightly but significantly (p < 0.05) reduced by the foliar application of NBS (Figure 3C, Table 3). The lowest juice EC was recorded in the fruit juice obtained from 5% NBS (3.0 dS m−1), followed by 3, 1 and 0% (3.2, 3.3 dS m−1 and 3.4 dS m−1, respectively). In contrast, the total dissolved solids (TDS) value (Figure 3D, Table 3) of the fruit juice was highest with 5% NBS application (2194 mg L−1), lowest with the control (1937 mg L−1) and intermediate when plants were treated with 3 and 1% NBS (Figure 3D, Table 3). The ascorbic acid content was significantly (p < 0.05) improved with the foliar application of NBS; the control plants showed the lowest ascorbic acid content with respect to the other treatments (Figure 4A, Table 3). Accordingly, the juice pH was significantly (p < 0.05) reduced under all treatments as compared to control. The latter showed an average value of pH 5.4, well above the average value around pH 4 of the treated plants (Figure 4B, Table 3).

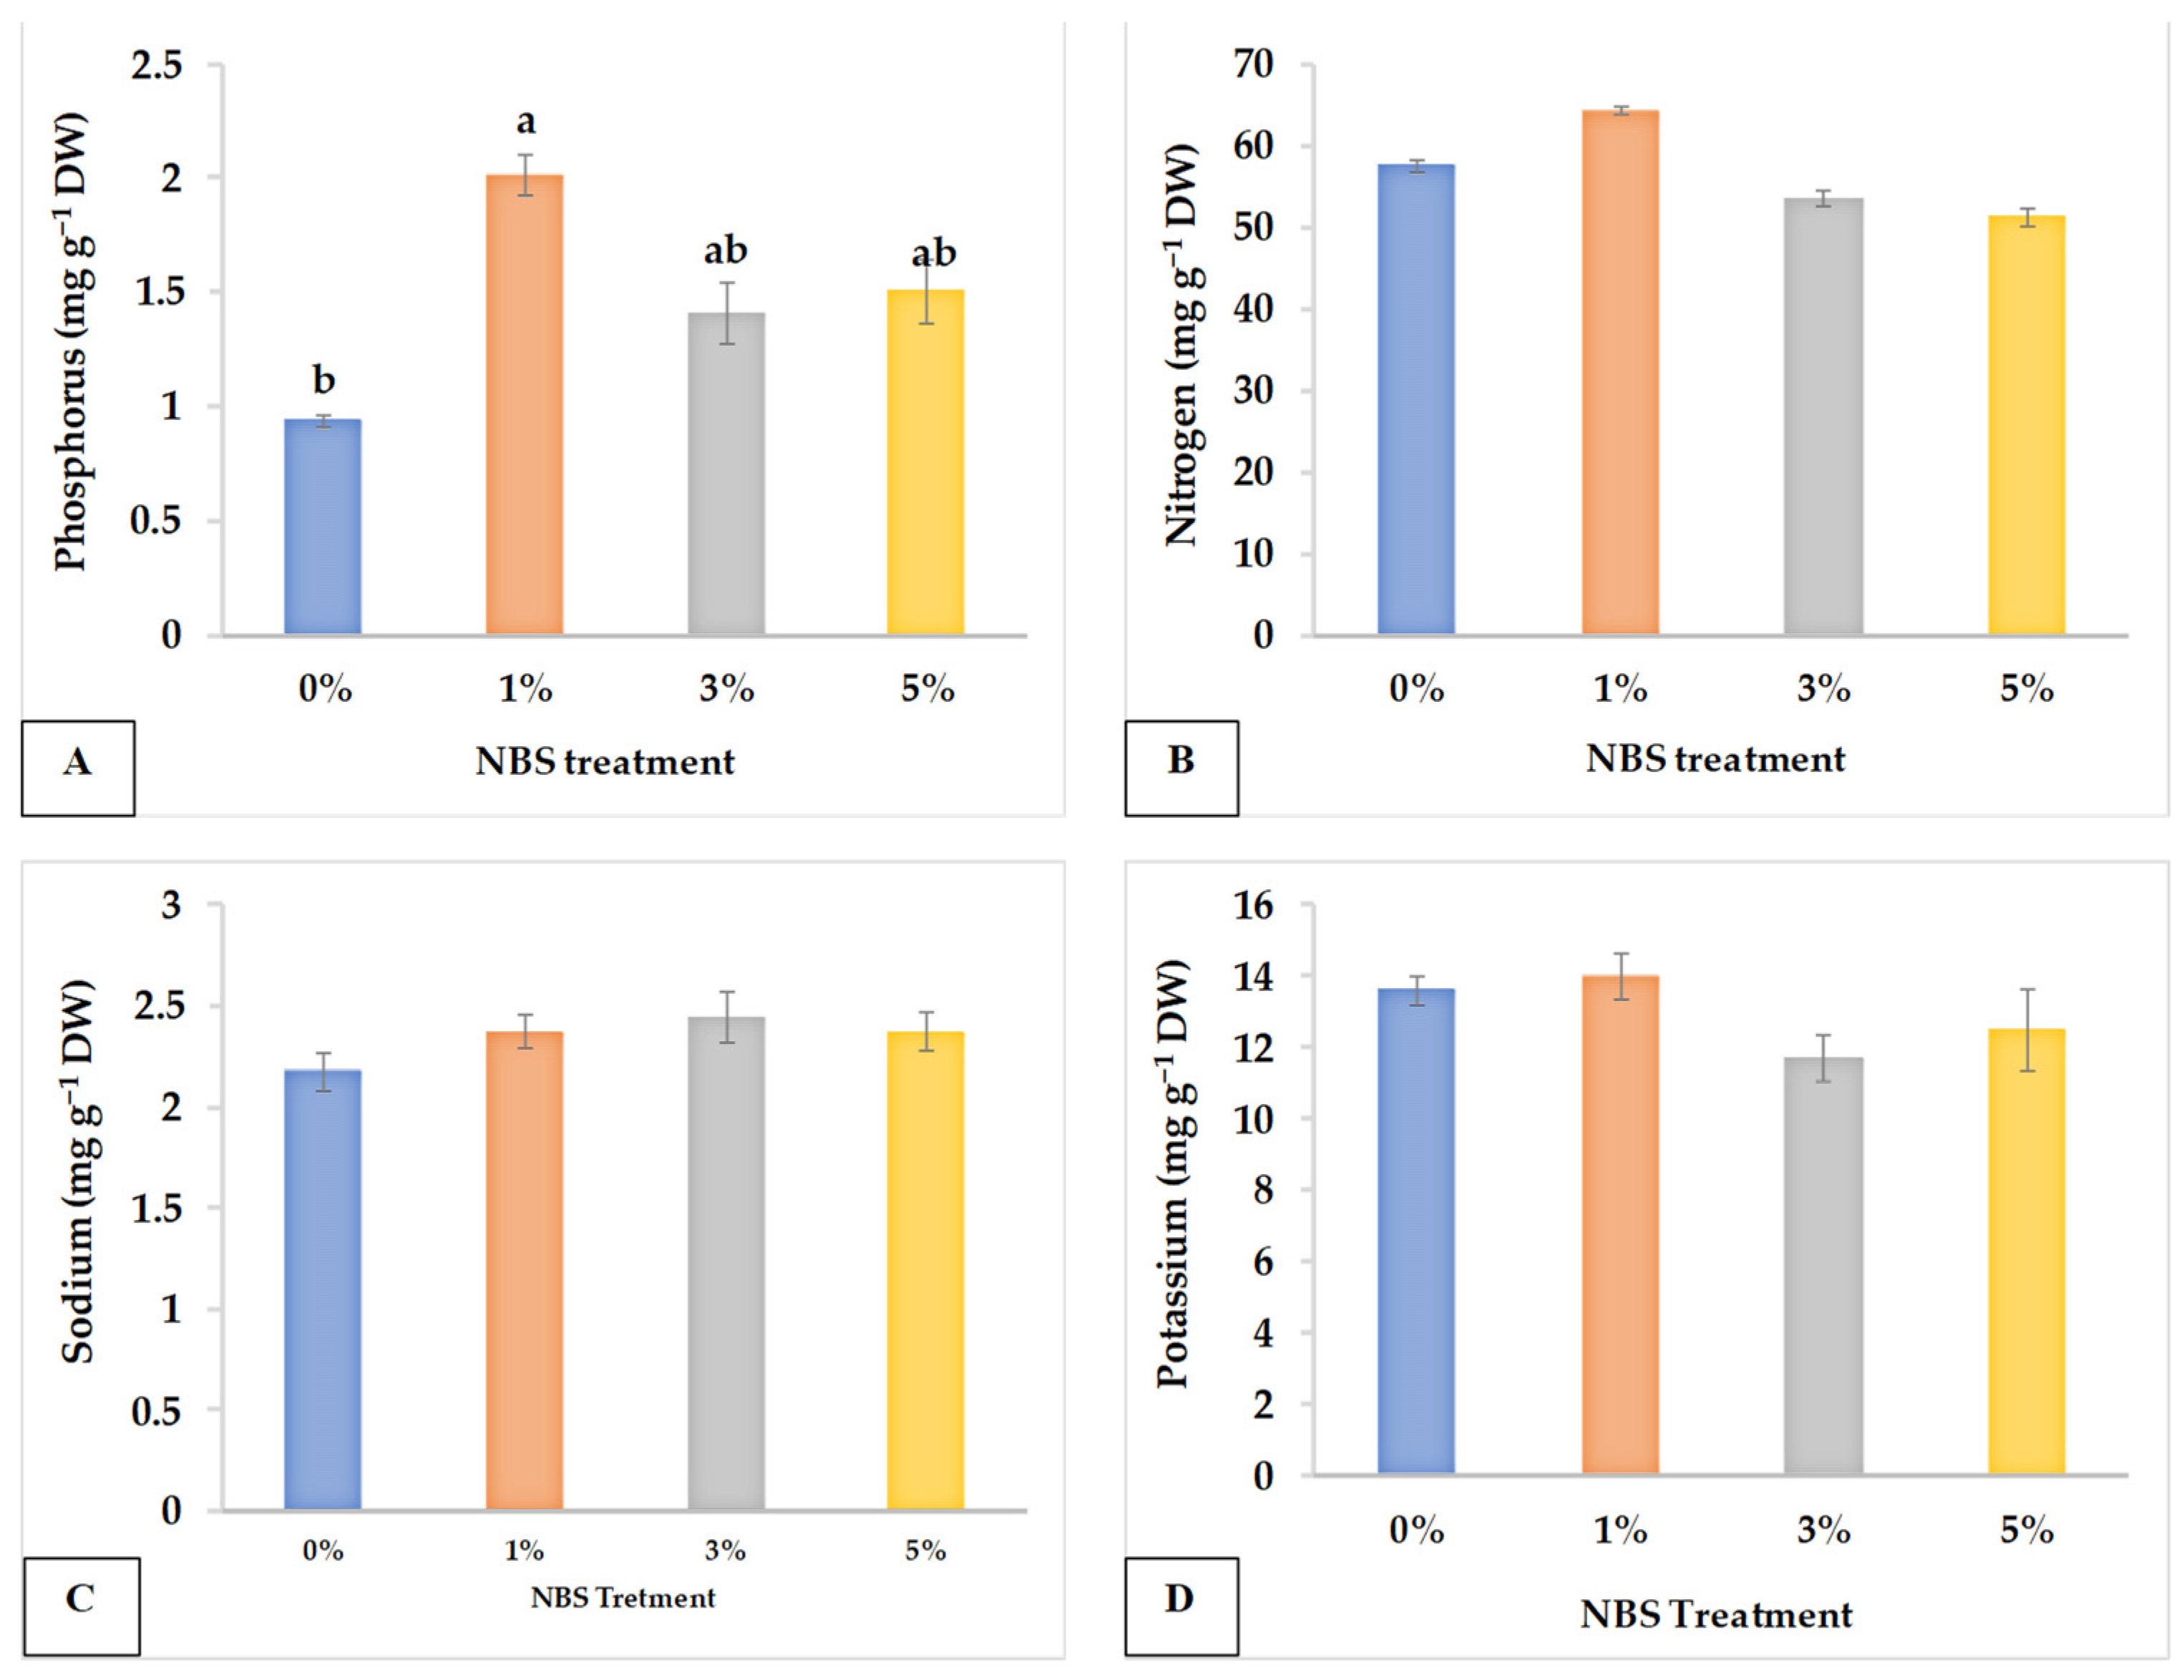
3.3. Leaf Chemical Analysis

The foliar application of NBS did not affect leaf Na, K and N concentrations. In contrast, P contents significantly (p < 0.05) improved under all NBS treatments (Figure 5A), particularly with the 1% NBS, which reached the highest content with 2.38 mg P g−1 DW of leaf tissue. Similarly, N contents were numerically the highest (64.3 mg g−1 DW) when trees were sprayed with 1% of NBS (Figure 5B; Table 4).
The highest leaf Na+ concentrations were observed in plants sprayed only with water (2.2 mg g−1 DW) followed by 3% NBS (2.1 mg g−1 DW), 5% NBS (2.2 mg g−1 DW) and 1% NBS (2.0 mg g−1 DW) (Figure 5C). However, the highest leaf K concentration was recorded for plants sprayed with 1% NBS (14.3 mg g−1 DW) closely followed by 0% NBS (13.3 mg g−1 DW), 5% NBS (12.5 mg g−1 DW) and 3% NBS (11.7 mg g−1 DW) (Figure 5D).

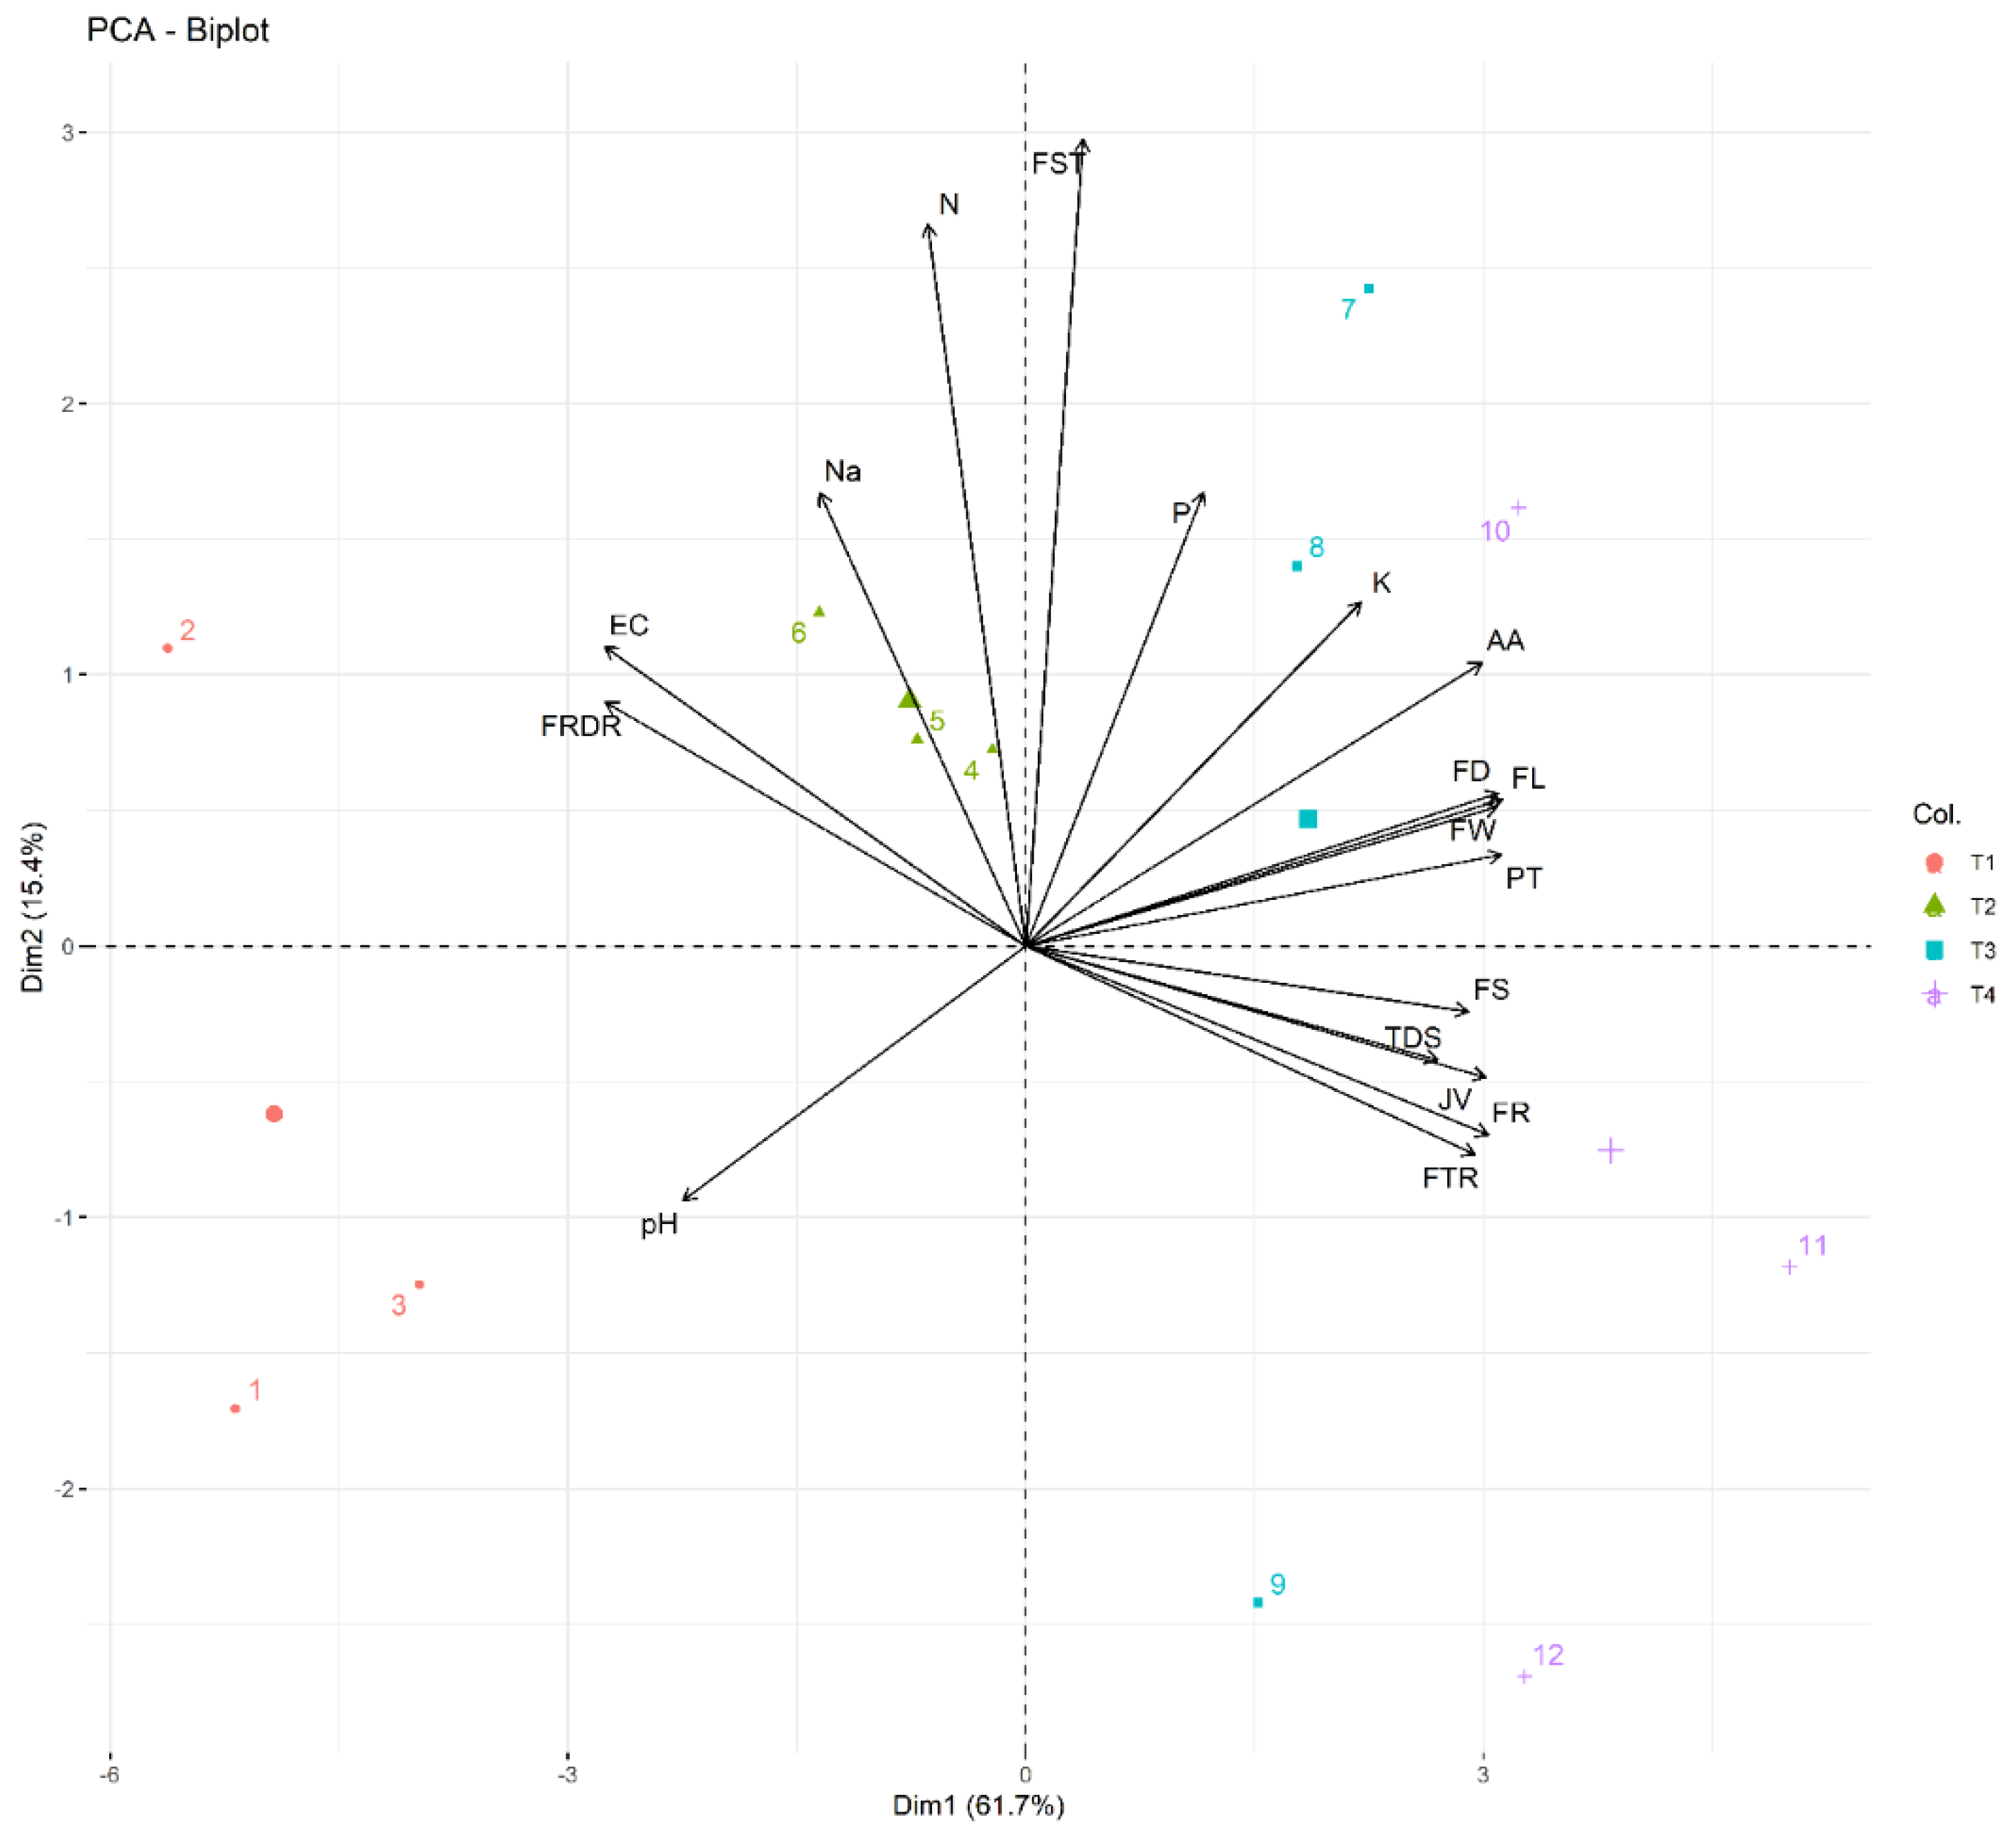
3.4. Principal Component Analysis and Correlation Revealed a Strong Relation among Treatments

A biplot was developed using principal component analysis (PCA). The results showed that 77.1% of the total variance could be explained with the first two components (61.7% for PC1 and 15.4% for PC2). PC1 was mostly characterized by FTR (fruit retention), JV (juice volume), TDS (total dissolved solids), FS (fruit size), PT (peel thickness), FW (fresh weight), FD (fruit diameter), FL (fruit length), FR (fruit retention/branch), FST (fruit setting), and AA (ascorbic acid), while PC2 was mainly represented by FRDR (fruit dropping), Na+ (sodium), N (nitrogen), EC (electrical conductivity), and FST (fruit setting) (Figure 6). Among the studied parameters, most showed a positive correlation with Dim1 (PC1) and a negative correlation with Dim2 (PC2). NBS levels 3 and 5% (T3 and T4 in Figure 6) showed a maximum effect on almost all of the studied traits, such TDS, JV, FD, and P, and therefore, these two levels favored the above-mentioned traits. In addition, the parameters clustered together, such as FTR, TDS, JV, FS, AA, and FR, had a strong significant positive correlation as they favored each other (Figure 6, Table 4). Interestingly, the above-mentioned parameters (FTR, TDS, JV, FS, AA, and FR) showed a strongly significant negative correlation with EC and FRDR, and therefore they moved in opposite directions (Figure 6, Table 4). Pearson’s correlation analysis revealed a strongly significant (p < 0.05) positive and negative correlation (based on two-tailed test) among all the parameters (Table 4). The fruit yield-related parameters such as FL (r = 0.876), FW (r = 0.887), FD (r = 0.879), PT (r = 0.769) and AA (r = 0.723) had significant (p < 0.05) positive correlation with fruit size (FS), and FS (r = 0.820) had significant (p < 0.05) positive correlation with juice volume (JV) (Table 4).

4. Discussion

The foliar application of NBS resulted in better performances of the citrus trees. The NBS contributed useful nutrients to the plants as compared with the water spray of the control, but a plant hormone-like role of the biochar cannot be ruled out, as reported by Graber et al. [31]. Better plant nutrition and physiology could be the reasons for better fruit-set, and physical and chemical parameters of the Kinnow mandarins. Earlier reported findings showed that appropriate nutrient supply is effective in retaining the flowers and fruits [12,24,32]. It is also reported that fruit size, fruit weight and juice volume increase with optimal nutrient supply and maintenance of good management practices such as insect/pest control, water and soil management [33,34,35]. The increased peel thickness helps to extend the shelf life of Kinnow fruits by reducing moisture loss. Customers and the fruit juice industry prefer fruits that have a thick peel and longer shelf life. Earlier investigations regarding peel thickness support the above findings [36,37]. According to Chakraborty et al. [38], foliar application of nano-biochar improves the trees’ photosynthesis and water relations, resulting in biosynthesis of photosynthates and water translocation; consequently, fruits with larger diameters and sizes can be achieved. Water shortages often occur during the life cycles of citrus fruit growth, even in normal environments, and can disturb the fruit yield and fruit quality parameters. The present findings indicate that foliar application of NBS is effective in improving all these parameters. NBS-mediated fruit yield and quality improvements enhance fruit size and color, juice contents, and juice flavor. Moreover, an insufficient supply of nutrients may accelerate fruit dropping. Reports have indicated that NBS acts like growth-promoting substances that are involved in cell division and differentiation in the pedicel during the fruit growth stage. The higher fruit weight caused by exogenous application of NBS is linked with improved pedicel growth and greater development of the secondary vascular tissue, mainly the xylem [10]. The results also indicated that NBS supply increased the fruit sink strength which improved the fruit size and weight. This means that exogenous application of NBS enlarges fruit by increasing cell expansion rather than cell division. The increase in fruit weight and size caused by the foliar application of NBS is possibly due to increased photosynthetic capacity and chlorophyll contents linked to better plant nutrition and hormonal physiology. Thus, plants in better condition resulted in increased TDS levels of the fruits, as observed in present study (Figure 3D).
Foliar application of NBS enhanced juice volume (Figure 3B), TDS (Figure 3D), and ascorbic acid (Figure 4A) which confirmed the earlier finding of Ashraf et al. [24] that nutrient supply to citrus plants is effective in improving juice volume and other juice quality parameters. Similarly, [39] also claimed that foliar spraying with nitrogen improves fruit size juice volume, TSS, and ascorbic acid. Previous research investigations show that proper nutrient supply at the proper time improves juice TDS.
Principal component analysis was used to develop a biplot that provides information about the response of different attributes of citrus fruit and juice under NBS treatments in the climate zone of Kot Addu, Pakistan. Results in PC1 showed that flower retention, juice volume, TDS, fruit size, peel thickness, fruit weight, fruit diameter, fruit length, fruit retention/branch, fruit setting, and ascorbic acid content were improved positively by NBS. PC2 indicated that fruit dropping, Na, N, and EC under the influence of NBC were either negatively affected or unaffected. Parameters, in PC1 a showed positive and PC2 negative relationship with NBS. Presently, PCA analysis is being used in many studies to work out relationships among different parameters influenced by nutrient supply and stresses [10,12,16].
Citrus fruits, especially Kinnow mandarins, are well-known for their ascorbic acid content, which is essential for human health as an antioxidant that helps to reduce the harmful effects of reactive oxygen species (ROS), as well as controlling skin diseases [40], cancer attacks [41], and bacterial and fungal diseases [42,43]. The results of the present investigation indicated that foliar application of NBS is effective in enhancing the juice ascorbic acid concentration. The literature also confirms that adequate nutrition supply improves the ascorbic acid content of citrus juice [7,12,24]. Overall, the results showed that NBS foliar spray is effective in improving the yield and quality of fruit and juice.

5. Conclusions

The present study suggests that citrus growers can use NBS, especially at rates 3–5%, to improve the fruit-set of their Kinnow mandarins. This not only increases the yield of the citrus trees, but gives more flavorful and healthier fruit, with a better shelf-life. The foliar application of NBS at 3% and 5% was effective in enhancing the fruit weight, TDS, fruit size, fruit retention, juice volume and ascorbic acid with respect to control. Furthermore, it was found that use of NBS enhanced the thickness of the peel, which is a positive attribute for extending the shelf life of Kinnow fruits. Therefore, foliar application of 5% NBS can be recommended as giving optimum citrus fruit yield and juice with good quality.

Supplementary Materials

The following supporting information can be downloaded at: https://www.mdpi.com/article/10.3390/horticulturae9050521/s1, Figure S1: Effect of different concentrations of nanobiochar suspension (NBS), i.e., 0 (with H2O spray or control), 1%, 3% and 5% foliar application on citrus fruits (orchard located in Kot. Addu, Punjab, Pakistan). R1, R2 and R3 represents samples collected from replication 1, replication 2 and replication 3 at 0%, 1%, 3% and 5% NBS application.

Author Contributions

Conceptualization, M.Y.A., F.D.M. and G.B.; methodology, M.Y.S., S.R.A. and H.N.; software, S.R.A. and M.Y.S.; investigation, M.Y.S., M.Y.A., Z.K., S.P., N.G. and S.R.A.; data curation, M.Y.A., F.D.M. and G.B.; writing—original draft preparation, M.Y.S., M.Y.A., F.D.M., G.B., Z.K., S.P., N.G., H.N., C.C., S.A. and S.R.A.; writing—review and editing, M.Y.S., S.R.A., M.Y.A., F.D.M. and G.B.; supervision, M.Y.A. All authors have read and agreed to the published version of the manuscript.

Funding

This research received no external funding.

Data Availability Statement

Data is contained within the article.

Conflicts of Interest

The authors declare no conflict of interest.

References

  1. Barry, G.H.; Caruso, M.; Gmitter, F.G., Jr. Commercial scion varieties. In The Genus Citrus, 1st ed.; Talon, M., Caruso, M., Gmitter, F.G., Jr., Eds.; Woodhead Publishing: Cambridge, UK, 2020; pp. 83–104. [Google Scholar] [CrossRef]
  2. Luckstead, J.; Devadoss, S. The importance of h-2a guest workers in agriculture. Choices 2019, 34, 1–8. [Google Scholar] [CrossRef]
  3. Neves, M.F.; Trombin, V.G.; Marques, V.N.; Martinez, L.F. Global orange juice market: A 16-year summary and opportunities for creating value. Trop. Plant Pathol. 2020, 45, 166–174. [Google Scholar] [CrossRef]
  4. Urbaneja, A.; Grout, T.G.; Gravena, S.; Wu, F.; Cen, Y.; Stansly, P.A. Citrus pests in a global world. In The Genus Citrus, 1st ed.; Talon, M., Caruso, M., Gmitter, F.G., Jr., Eds.; Woodhead Publishing: Cambridge, UK, 2020; pp. 333–348. [Google Scholar] [CrossRef]
  5. Cheema, I.A.; Jamali, H.K. Growth of Citrus Fruits in Pakistan. Amazon. Investig. 2020, 9, 74–81. [Google Scholar] [CrossRef]
  6. Ahmad, B.; Mehdi, M.; Ghafoor, A.; Anwar, H. Value chain assessment and measuring export determinants of citrus fruits in Pakistan: An analysis of primary data. Pak. J. Agric. Sci. 2018, 55, 677–693. [Google Scholar] [CrossRef]
  7. Liu, Y.; Heying, E.; Tanumihardjo, S.A. History, global distribution, and nutritional importance of citrus fruits. Compr. Rev. Food Sci. Food Saf. 2012, 11, 530–545. [Google Scholar] [CrossRef]
  8. Zacarias, L.; Cronje, P.J.; Palou, L. Postharvest technology of citrus fruits. In The Genus Citrus, 1st ed.; Talon, M., Caruso, M., Gmitter, F.G., Jr., Eds.; Woodhead Publishing: Cambridge, UK, 2020; pp. 421–446. [Google Scholar] [CrossRef]
  9. Donkersley, P.; Silva, F.W.; Carvalho, C.M.; Al-Sadi, A.M.; Elliot, S.L. Biological, environmental and socioeconomic threats to citrus lime production. J. Plant. Dis. Prot. 2018, 125, 339–356. [Google Scholar] [CrossRef]
  10. Anwar, S.; Ashraf, M.Y.; Saleem, M.; Shafiq, F.; Khan, N.; Khan, R.A.; Farid, G.; Ashraf, M. Integrated hormonal and nutrient management promote fruit retention and quality traits of Citrus reticulata. J. Plant Nutr. 2022, 46, 83–100. [Google Scholar] [CrossRef]
  11. Nawaz, R.; Abbasi, N.A.; Hafiz, I.A.; Khalid, A.; Ahmad, T. Economic analysis of citrus (Kinnow mandarin) during on-year and off-year in the Punjab province, Pakistan. J. Hortic. 2018, 5, 2376–3354. [Google Scholar] [CrossRef]
  12. Ashraf, M.Y.; Hussain, F.; Ashraf, M.; Akhter, J.; Ebert, G. Modulation in yield and juice quality characteristics of citrus fruit from trees supplied with zinc and potassium foliarly. J. Plant Nutr. 2013, 36, 1996–2012. [Google Scholar] [CrossRef]
  13. Abu-Alrub, I.; Saleh, S.; Awaga, A.A. Effect of different rates of nitrogen and phosphorus fertilizers on yield and quality of greenhouse tomato under the UAE condition. EC Agri. 2019, 5, 139–146. [Google Scholar]
  14. Elanchezhian, R.; Kumar, D.; Ramesh, K.; Biswas, A.K.; Guhey, A.; Patra, A.K. Morpho-physiological and biochemical response of maize (Zea mays L.) plants fertilized with nano-iron (Fe3O4) micronutrient. J. Plant Nutr. 2017, 40, 1969–1977. [Google Scholar] [CrossRef]
  15. Ahanger, M.A.; Morad-Talab, N.; Abd-Allah, E.F.; Ahmad, P.; Hajiboland, R. Plant growth under drought stress: Significance of mineral nutrients. In Water Stress and Crop Plants: A Sustainable Approach, 1st ed.; Ahmad, P., Ed.; John Wiley & Sons: Chichester, UK, 2016; pp. 649–668. [Google Scholar] [CrossRef]
  16. Fatima, S.; Riaz, M.; Al-Wabel, M.I.; Arif, M.S.; Yasmeen, T.; Hussain, Q.; Roohi, M.; Fahad, S.; Ali, K.; Arif, M. Higher biochar rate strongly reduced decomposition of soil organic matter to enhance C and N sequestration in nutrient-poor alkaline calcareous soil. J. Soil Sediments. 2021, 21, 148–162. [Google Scholar] [CrossRef]
  17. Zhao, D.; Yan, B.; Liu, C.; Yao, B.; Luo, L.; Yang, Y.; Zhou, Y. Mitigation of acidogenic product inhibition and elevated mass transfer by biochar during anaerobic digestion of food waste. Bioresour. Technol. 2021, 338, 125531–125547. [Google Scholar] [CrossRef] [PubMed]
  18. Mansoor, S.; Kour, N.; Manhas, S.; Zahid, S.; Wani, O.A.; Sharma, V.; Wijaya, L.; Alyemeni, M.N.; Alsahli, A.A.; El-Serehy, H.A.; et al. Biochar as a tool for effective management of drought and heavy metal toxicity. Chemosphere 2021, 271, 129458. [Google Scholar] [CrossRef]
  19. Khan, Z.; Xianting, F.; Khan, M.N.; Khan, M.A.; Zhang, K.; Fu, Y.; Shen, H. The toxicity of heavy metals and plant signaling facilitated by biochar application: Implications for stress mitigation and crop production. Chemosphere 2022, 308, 136466. [Google Scholar] [CrossRef]
  20. Singh, R.P.; Handa, R.; Manchanda, G. Nanoparticles in sustainable agriculture: An emerging opportunity. J. Control. Release 2021, 329, 1234–1248. [Google Scholar] [CrossRef]
  21. Ramanayaka, S.; Vithanage, M.; Alessi, D.S.; Liu, W.J.; Jayasundera, A.C.; Ok, Y.S. Nanobiochar: Production, properties, and multifunctional applications. Environ. Sci. Nano 2020, 7, 3279–3302. [Google Scholar] [CrossRef]
  22. Verma, S.K.; Das, A.K.; Gantait, S.; Kumar, V.; Gurel, E. Applications of carbon nanomaterials in the plant system: A perspective view on the pros and cons. Sci. Total Environ. 2019, 667, 485–499. [Google Scholar] [CrossRef]
  23. Ashraf, M.Y.; Gul, A.; Ashraf, M.; Hussain, F.; Ebert, G. Improvement in yield and quality of Kinnow (Citrus deliciosa × Citrus nobilis) by potassium fertilization. J. Plant Nutr. 2010, 33, 1625–1637. [Google Scholar] [CrossRef]
  24. Ashraf, M.Y.; Yaqub, M.; Akhtar, J.; Khan, M.A.; Ali-Khan, M.; Ebert, G. Control of excessive fruit drop and improvement in yield and juice quality of Kinnow (Citrus deliciosa × Citrus nobilis) through nutrient management. Pak. J. Bot. 2012, 44, 259–265. [Google Scholar]
  25. Yaseen, M.; Ahmad, M. Nutrition management in citrus: Effect of multinutrients foliar feeding on the yield of Kinnow at different locations. Pak. J. Bot. 2010, 42, 1863–1870. [Google Scholar]
  26. Soil Survey Staff. Key to Soil Taxonomy, 12th ed.; USDA-Natural Resources, Conservation Service: Washington, DC, USA, 2014; p. 379.
  27. Jackson, M.L. Soil Chemical Analysis; Prentice Hall: Hoboken, NJ, USA, 1962; 498p. [Google Scholar]
  28. Khaliq, H.; Anwar, S.; Shafiq, F.; Ashraf, M.; Zhang, L.; Haider, I.; Khan, S. Interactive Effects of Soil and Foliar-Applied Nanobiochar on Growth, Metabolites, and Nutrient Composition in Daucus carota. J. Plant Growth Regul. 2022, 15, 1–15. [Google Scholar] [CrossRef]
  29. Bremner, J.M.; Edwards, A.P. Determination and isotope-ratio analysis of different forms of nitrogen in soils: I. Apparatus and procedure for distillation and determination of ammonium. Soil Sci. Soc. Am. J. 1965, 29, 504–507. [Google Scholar] [CrossRef]
  30. Ruck, J.A. Chemical Method for Fruit and Vegetable Products; Research Station, Summerland, Department of Agriculture: Ottawa, ON, Canada, 1961. [Google Scholar]
  31. Graber, E.R.; Frenkel, O.; Jaiswal, A.K.; Elad, Y. How may biochar influence severity of diseases caused by soilborne pathogens? Carbon Manag. 2014, 5, 169–183. [Google Scholar] [CrossRef]
  32. Lal, G.; Dayal, H. Effect of integrated nutrient management on yield and quality of acid lime (Citrus aurantifolia Swingle). Afr. J. Agric. Res. 2014, 9, 2985–2991. [Google Scholar] [CrossRef]
  33. Clarke, A.R.; Powell, K.S.; Weldon, C.W.; Taylor, P.W. The ecology of Bactrocera tryoni (Diptera: Tephritidae): What do we know to assist pest management? Ann. Appl. Biol. 2011, 158, 26–54. [Google Scholar] [CrossRef]
  34. Gregory, M.M.; Leslie, T.W.; Drinkwater, L.E. Agroecological and social characteristics of New York city community gardens: Contributions to urban food security, ecosystem services, and environmental education. Urban Ecosyst. 2016, 19, 763–794. [Google Scholar] [CrossRef]
  35. Hasan, M.; Rahim, M.A.; Islam, A.K.M.S.; Rahman, M.M.; Rahman, M.A.; Naher, N. Effect of management practices on the growth and yield of lime and lemon. Int. J. Biosci. 2016, 8, 22–33. [Google Scholar] [CrossRef]
  36. Khalid, S.; Malik, A.U.; Saleem, B.A.; Khan, A.S.; Khalid, M.S.; Amin, M. Tree age and canopy position affect rind quality, fruit quality and rind nutrient content of ‘Kinnow’mandarin (Citrus nobilis Lour × Citrus deliciosa Tenora). Sci. Hortic. 2012, 135, 137–144. [Google Scholar] [CrossRef]
  37. Qureshi, M.A.; Jaskani, M.J.; Khan, A.S.; Haider, M.S.; Shafqat, W.; Asif, M.; Mehmood, A. Influence of different rootstocks on physico-chemical quality attributes of Kinnow mandarin. Pak. J. Agric. Sci. 2021, 58, 929–935. [Google Scholar]
  38. Chakraborty, R.; Mukhopadhyay, A.; Paul, S.; Sarkar, S.; Mukhopadhyay, R. Nanocomposite-based smart fertilizers: A boon to agricultural and environmental sustainability. Sci. Total Environ. 2023, 863, 160859. [Google Scholar] [CrossRef]
  39. Saleem, B.A.; Malik, A.U.; Maqbool, M.; Islam-ud-din, M.F.; Rajwana, I.A. Early winter spray of low biuret urea improves marketable yield and fruit quality of sweet oranges. Pak. J. Bot. 2008, 40, 1455–1465. [Google Scholar]
  40. Palou, L.; Valencia-Chamorro, S.A.; Pérez-Gago, M.B. Anti fungal edible coatings for fresh citrus fruit: A review. Coatings 2015, 5, 962–986. [Google Scholar] [CrossRef]
  41. Song, J.K.; Bae, J.M. Citrus fruit intake and breast cancer risk: A quantitative systematic review. J. Breast Cancer 2013, 16, 72–76. [Google Scholar] [CrossRef] [PubMed]
  42. Canamas, T.P.; Viñas, I.; Usall, J.; Torres, R.; Anguera, M.; Teixidó, N. Control of postharvest diseases on citrus fruit by preharvest applications of biocontrol agent Pantoea agglomerans CPA-2: Part II. Effectiveness of different cell formulations. Postharvest Biol. Technol. 2008, 49, 96–106. [Google Scholar] [CrossRef]
  43. Nicosia, M.G.L.D.; Pangallo, S.; Raphael, G.; Romeo, F.V.; Strano, M.C.; Rapisarda, P.; Schena, L. Control of postharvest fungal rots on citrus fruit and sweet cherries using a pomegranate peel extract. Postharvest Biol. Technol. 2016, 114, 54–61. [Google Scholar] [CrossRef]
Figure 1. Effect of nano-biochar suspension (NBS) application on (A) flower retention, (B) fruit set, (C) fruit retention/branch, (D) fruit dropping. Values are means of three replications; different letters indicates significant differences among the treatments (p < 0.05).
Horticulturae 09 00521 g001
Figure 2. Effect of nano-biochar suspension (NBS) application on (A) fruit length, (B) fruit weight, (C) fruit diameter, (D) fruit size. Values are means of three replications; different letters indicates significant differences among the treatments (p < 0.05).
Horticulturae 09 00521 g002
Figure 3. Effects of nano-biochar suspension (NBS) application on (A) peel thickness, (B) juice volume, (C) electrical conductivity and (D) total dissolved solids. Values are means of three replications; different letters indicates significant differences among the treatments (p < 0.05).
Horticulturae 09 00521 g003
Figure 4. Effects of nano-biochar suspension (NBS) foliar spray on (A) juice ascorbic acid and (B) juice pH. Values are means of three replications; different letters indicate significant differences among the treatments (p < 0.05).
Horticulturae 09 00521 g004
Figure 5. Effect of nano-biochar suspension (NBS) foliar spray on (A) Phosphorus, (B) Nitrogen, (C) Sodium and (D) Potassium. Values are means of three replications; different letters indicate significant differences among the treatments (p < 0.05).
Horticulturae 09 00521 g005
Figure 6. Biplot values (scores) for different fruit and juice quantity and quality parameters of Kinnow (Citrus reticulata) foliar sprayed with different levels of nano-biochar suspension (NBS).
Horticulturae 09 00521 g006
Table 1. Soil physical and chemical characteristics of selected citrus orchard.
Soil CharacteristicsKot Addu
Soil textureClay loam
EC (dS m−1)3.5
pH7.3
Organic matter (%)0.8
P (mg kg−1)9
K (mg kg−1)
Total Nitrogen (%)
175
0.75
Table 2. Effects of different levels of nano-biochar suspension (NBS) on citrus flower and fruit morphology. Mean values of three replications are presented; different letters and * indicate significance differences among the treatments (p < 0.05). p < 0.05 (*), p < 0.001 (***), p < 0.0001 (****), ns (non-significant); FR, flower retention/branch; FTR, fruit retention/branch; FL, fruit length; FW, fruit weight; FD, fruit diameter; FS, fruit size; PT, peel thickness; FRDR, fruit dropping/branch; FST, fruit set/branch.
NBS Concentration (%)FRFTRFL
(cm)
FW
(g)
FD
(cm)
FS
(cm3)
PT
(mm)
FRDRFST
028.77 c25.65 c7.073 c99.533 b6.061 c358.867 b3.266 c70 a22 c
160.59 b63.35 b8.113 b143.800 b6.891 b390.800 ab4.438 b35 b58 b
375.72 a70.5 ab9.040 a199.933 a7.791 a438.333 ab4.796 ab25 bc70 a
579.15 a76 a9.167 a204.400 a7.845 a463.000 a5.172 a20 c76 a
Significance***************************
Table 3. Effects of different levels of nano-biochar suspension (NBS) on citrus juice quality and leaf chemical analysis. Mean values of three replications are presented; different letters and * indicate significance differences among the treatments (p < 0.05). p < 0.05 (*), p < 0.001 (***), p < 0.0001 (****), ns (non-significant); EC, electrical conductivity; TDS, total dissolved solids; AA, Ascorbic Acid; pH, potential of hydrogen; JV, juice volume; N, Nitrogen; P, Phosphorous; Na+, Sodium; K+, Potassium.
NBS Concentration (%)EC
(ds m−1)
TDS
(mg L−1)
AA
(mg 100 mL−1)
pHJV
(mL)
N
(mg g−1 DW)
P
(mg g−1 DW)
Na+
(mg g−1 DW)
K+
(mg g−1 DW)
03.428 a1936.640 b25.033 b5.439 a55.067 d5.787 a0.941 b2.229 a11.673 a
13.321 ab2028.373 ab28.107 a4.164 b65.267 c6.440 a2.382 a2.026 a12.346 a
33.169 ab2125.653 ab28.667 a4.240 b85.333 b5.367 a2.079 ab2.099 a13.278 a
53.026 b2193.920 a29.060 a4.345 b113.133 a5.133 a1.510 ab2.073 a14.271 a
Significance**********ns*nsns
Table 4. Correlation matrix showing Pearson’s correlation among traits under four nano-biochar suspension treatments. Abbreviations: FR, flower retention/branch; FTR, fruit retention/branch; FL, fruit length; FW, fruit weight; FD, fruit diameter; FS, fruit size; PT, peel thickness; FRDR, fruit dropping/branch; EC, electrical conductivity; TDS, total dissolved solids; AA, Ascorbic Acid; pH, potential of hydrogen; JV, juice volume; FST, fruit set/branch; N, Nitrogen; P, Phosphorous; Na+, Sodium; K+, Potassium. * indicate significance correlation, p < 0.05 (*), p < 0.001 (**).
FRFTRFLFWFDFSPTFRDRECTDSAApHJVFSTNPNa+K+
FR
FTR0.958 **
FL0.821 **0.779 **
FW0.813 **0.765 **0.992 **
FD0.810 **0.756 **0.995 **0.997 **
FS0.792 **0.741 **0.876 **0.887 **0.879 **
PT0.840 **0.848 **0.942 **0.911 **0.927 **0.769 **
FRDR−0.797 **−0.790 **−0.687 *−0.701 **−0.693 **−0.795 **−0.705 **
EC−0.792 **−0.823 **−0.712 **−0.702 **−0.694 **−0.791 **−0.752 **0.921 **
TDS0.843 **0.735 **0.781 **0.780 **0.791 **0.705 **0.765 **−0.654 *−0.580 *
AA0.779 **0.748 **0.924 **0.892 **0.904 **0.723 **0.931 **−0.647 *−0.633 *0.742 **
pH−0.556 *−0.589 *−0.676 *−0.610 *−0.634 *−0.424−0.808 **0.4470.549 *−0.362−0.802 *
JV0.941 **0.947 **0.853 **0.861 **0.847 **0.820 **0.841 **−0.776 **−0.803 **0.808 **0.756 **−0.462
FST−0.152−0.1540.2520.2350.2580.0110.2360.1220.1280.0100.387−0.351−0.039
N−0.262−0.329−0.102−0.120−0.107−0.167−0.1940.3640.455−0.2190.0880.020−0.2670.642 *
P0.1510.1730.4080.4020.4040.3240.405−0.260−0.165−0.0160.509 *−0.642 *0.0770.3740.229
Na+−0.436−0.386−0.270−0.207−0.228−0.420−0.3520.540 *0.576 *−0.382−0.3220.369−0.2350.3950.359−0.091
K+0.621 *0.553 *0.617 *0.640 *0.637 *0.559 *0.556 *−0.614−0.4680.613 *0.683 *−0.3060.671 *0.4470.3610.1780.052
Disclaimer/Publisher’s Note: The statements, opinions and data contained in all publications are solely those of the individual author(s) and contributor(s) and not of MDPI and/or the editor(s). MDPI and/or the editor(s) disclaim responsibility for any injury to people or property resulting from any ideas, methods, instructions or products referred to in the content.

