Article

Comprehensive Metabolomic and Transcriptomic Analysis of the Regulatory Network of Volatile Terpenoid Formation during the Growth and Development of Pears (Pyrus spp. ‘Panguxiang’)

1
College of Forestry, Henan Agricultural University, Zhengzhou 450046, China
2
Zhengzhou Zhengshi Chemical Co., Ltd., Zhengzhou 450002, China
*
Authors to whom correspondence should be addressed.
These authors contributed equally to this work.
Horticulturae 2023, 9(4), 483; https://doi.org/10.3390/horticulturae9040483
Submission received: 1 March 2023 / Revised: 6 April 2023 / Accepted: 7 April 2023 / Published: 12 April 2023
(This article belongs to the Section Genetics, Genomics, Breeding, and Biotechnology (G2B2))

Abstract

:
Volatiles are essential substances that determine distinct fruit flavors and user preferences. However, the metabolic dynamic and molecular modulation models that regulate the overall flavor generation during fruit growth and ripening are still largely unclear for most fruit species. To comprehensively analyze the molecular mechanism and regulation mechanism of aroma accumulation and aroma component formation in Pyrus spp. ‘Panguxiang’ (‘Panguxiang’pear), this study compared pear phenotype, sugars, organic acid content, and the expression of related genes and metabolites amid pear growth and development in Pyrus spp. ‘Panguxiang’. A total of 417 VOCs (4 amines, 19 aromatics, 29 aldehydes, 31 alcohols, 38 ketones, 64 heterocyclic compounds, 89 terpenoids, 94 esters, and 49 others) were found. The potential gene expression patterns were explored by combining transcriptomics and metabolomics, and VOC-associated metabolism and transcriptome data from all samples were integrated during the growth and development period. On this basis, we constructed a colorful model depicting changes in the VOCs and genes throughout pear growth and development. Our findings reveal that terpenoid biosynthesis pathways are the main aroma production pathways during pear growth and development. In addition to providing novel insights into the metabolic control of fruit flavor during growth and development, this study also provides a new theoretical basis for studying aroma metabolites in pears.

1. Introduction

The pear (Pyrus spp.) is a major fruit crop globally and has a high economic value. According to FAO statistics, the global harvest area and production in 2021 were 1,399,484 hectares and 2,568,713 t, respectively. In the same year, the harvest area and production of pears in China were 986,479 hectares and 18,978,144 t, respectively, accounting for about 70% of the world totals (https://www.fao.org/faostat/zh/#data, accessed on 2 April 2023) [1]. Pears are cultivated in more than 50 countries, of which white pears (Pyrus bretschneideri Rehder) are the most-planted varieties in China and are often called Chinese pears [2]. In addition to being eaten as a snack fruit, pear fruit is also a traditional medicine with antispasmodic, anti-inflammatory, and diuretic benefits [3]. Pyrus spp. ‘Panguxiang’, a new cultivar derived from P. bretschneideri Rehd. cv. ‘Biyang piaoli’, is sweet and crisp fruit with a special aroma and fame among consumers [4]. However, a series of problems need to be urgently studied, such as which synthetic pathways account for the accumulation and production of characteristic aromas and how related genes are expressed in the ‘Panguxiang’ pear.
Volatile compounds are vital in determining the desirability of pears among consumers. Aroma is a key indicator of fruit quality [5], and a rich fruit aroma can increase consumer desire to buy, as well as improve living standards and the demand for fruits, making fruit aroma a crucial research focus [6]. The production of aroma is also a sign of ripe fruit, which is composed of different volatile compounds, many of which can be detected by the human sense of smell [7]. Aroma is an essential component of fruit quality. The aroma of many fruits has been studied in recent years, including the white pear [8], apple [9], watermelon [10], mango [11], melon [12], strawberry [13], peach [14], and tomato [15]. P. pyrifolia, in particular, contains more than 300 volatile compounds [16].
The essence of fruit aroma is volatile aromatic substances, which can be divided into four categories: benzene/phenylpropane compounds, terpene compounds, fatty acid derivatives, and amino acid derivatives [17,18]. The distribution of volatile organic compounds (VOCs) varies with fruit growth and development. In plants, terpenoids account for the largest group of VOCs [19]. Terpenoids are mainly formed from isoprenyl diphosphate (IPP) and dimethylallyl diphosphate (DMAPP) via a complex process. According to the molar ratio of IPP to DMAPP, terpenoids can be divided into monoterpenes (1:1); sesquiterpenes and sterols (2:1); and diterpenes, carotenoids, and polyterpenes (3:1) [20]. Among them, C10 monoterpenes and C15 sesquiterpenes are the key compounds that determine the characteristic aroma of fruits [17]. In addition, sesquiterpenes are generated in the cytoplasm via the mevalonic acid (MVA) pathway, and monoterpenes are produced in cytosols and plastids via the 2-c-methylerythritol 4-phosphate (MEP) pathway in higher plants [21,22].
Therefore, this study analyzes the dynamic changes in aroma composition and nutrients during the development of the ‘Panguxiang’ pear by combining metabolomics and transcriptomics. The variations in metabolite composition amid the growth of pear fruits and the associations between related gene expression and metabolites in the main pathways of aroma synthesis were expounded. The molecular mechanism for the synthesis of the pear was further elucidated at the transcription and metabolic levels, which underlies the comprehensive analysis of molecular and regulatory mechanisms of aroma accumulation and aroma component formation of the ‘Panguxiang‘ fruit.

2. Materials and Methods

2.1. Plant Materials

The study location: The Key Laboratory of Forest Resources Cultivation of Henan Agricultural University and the State Forestry Administration (112°42′114°14′ E, 34°16′34°58′ N) has sandy loam soil at pH 7.0. The average annual temperature is 17 °C, and the total rainfall is 1326.8 mm. Three trees were selected from each development stage, and fruits were randomly selected from different directions of the tree body, and 10–20 fruits were collected each time. In 2021, a 6-year-old Pangu fragrant pear tree under robust growth was chosen as the experimental tree.
Four phases of pear fruit growth and ripening were sampled: 60 days (S1, Rapid expansion), 90 days (S2, Late expansion of fruit), 120 days (S3, Nutrient accumulation), and 147 days (S4, Ripening) after flowering. After sampling, all obtained samples were kept in a refrigerator at −80 °C for subsequent experiments. Each experiment was performed in triplicate.

2.2. Determination of Physiological Parameters

Sugars and organic acids were quantified using liquid chromatography. The pulp (2 g) was weighed, and then the sugars were extracted with ultrapure water and the organic acids with metaphosphate, respectively. For the determination of sugars, the pulp was first broken into a homogenate, ultrasonically extracted for 15 min, and centrifuged at 5600× g/min for 10 min. The supernatant was filtered using a 0.22 μm filter head. Then, the supernatant was detected using a liquid chromatograph (equipped with a UV sensor and a refractometer) and a RI-101 differential refraction detector. The determination was performed using an Agilent Hi-Plex Ca column (300 × 7.7 mm) at 85 °C with a mobile phase of pure water and a flow rate of 0.6 mL/min. Organic acids were detected using an Ultimate 3000 UV detector. The pulp was broken into a homogenate, ultrasonically extracted for 15 min, and centrifuged at 5600× g/min for 10 min. The supernatant was filtered using a 0.22 μm filter head and detected with liquid chromatography using an Agilent ZOBAX C18 column (4.6 mm × 250 mm) at 20 °C, a mobile phase of 0.2% metaphosphoric acid (flow rate 1.0 mL/min), and 214 nm. Standard products of fructose, glucose, sorbitol, and sucrose (Sigma Aldrich Trading Co., Ltd., Shanghai, China) were used as reference standards. Standard products of malic acid, citric acid, oxalic acid, and shikimic acid were also provided by Sigma Aldrich (St. Louis, MO, USA). Metaphosphate was offered by Sinopharm Group Chemical Reagents Shenyang Company (Shenyang, China). The Milli-Q ultrapure water system was made by Millipore (Burlington, MA, USA). The Diane U-3000 liquid chromatograph was produced by Thermo Fisher Co., Ltd. (Waltham, MA, USA).

2.3. Sample Treatment and GC-MS Conditions

The samples were ground to powder in liquid nitrogen and removed (1 g, 1 mL) immediately to headspace vials (Agilent, Palo Alto, CA, USA) added with a NaCl-saturated solution. For the SPME analysis, each vial was kept at 60 °C for 5 min. Then, its headspace was exposed to a 120 µm DVB/CWR/PDMS fiber (Agilent) for 15 min at 100 °C. After sampling, the VOCs were desorbed from the fiber coating in the injection port of the GC meter (Model 8890; Agilent) at 250 °C for 5 min using the splitless mode. VOCs were detected and quantified using an Agilent Model 8890 GC and a 7000D mass meter (Agilent) with a 30 m × 0.25 mm × 0.25 μm DB-5MS (5% phenyl-polydimethylsiloxane) capillary column. Helium was used as the carrier gas at a 1.2 mL/min linear rate. The injector was kept at 250 °C and the detector at 280 °C. The oven was started at 40 °C (3.5 min), heated at 10 °C/min to 100 °C, at 7 °C/min to 180 °C, at 25 °C/min to 280 °C, and maintained for 5 min. Mass spectra were acquired using the electron impact (EI) ionization mode at 70 eV. The quadrupole mass detector, ion source, and transfer line were set at 150, 230, and 280 °C, respectively. MS using the ion monitoring (SIM) mode was performed to identify and quantify analytes. Metabolites were qualified and quantified as reported [23]. The repeatability of metabolite extraction and technical duplication was tested by overlapping the total ion chromatography (TIC) of the MS of different QC samples. Instrumental stability ensured the data were repeatable and reliable.

2.4. Integrative Analysis of Metabolome and Transcriptome

Transcriptome assembly and analysis were performed as reported [24]. The transcript sequences were mapped to 7 public databases: the NCBI non-redundant protein sequence database (NR) (www.ncbi.nlm.nih.gov, accessed on 2 April 2023) [25]; Swiss-Prot [26]; Gene Ontology (GO) [27]; euKaryotic Ortholog Groups (KOG) [28]; Protein family (Pfam) [29]; Kyoto Encyclopedia of Genes and Genomes (KEGG) [30]; and TrEMBL [31,32]. A Pearson correlation analysis was performed to combine the metabolome and transcriptome data. Correlation coefficients were computed as per metabolite log2(fold-change) and transcript. The coefficient R > 0.9 was selected. Metabolome and transcriptome associations were visualized using Cytoscape 2.8.2.

2.5. Statistical Analysis

Metabolome and transcriptome analyses were conducted in biological triplicate. Principal component analysis (PCA) and orthogonal projections to latent structures discriminant analysis (OPLS-DA) were performed with R software (http://www.r-project.org/, accessed on 2 April 2023) [33]. Differentially accumulated metabolites among the analyzed pear fruits were identified at the criteria of a fold change ≥2 or ≤0.5, variable importance in projection (VIP) score > 1, and p < 0.05 [34,35]. All differential VOCs or gene expressions were examined using hierarchical clustering with TBtools 1.113 version [36]. Data were analyzed using SPSS 26.0 (IBM, Armonk, NY, USA).

3. Results

3.1. Changes in Physiological Indicators of Fruits

The appearance changes during fruit growth and ripening are shown in Figure 1a. As the fruit develops, its diameter and weight increase. During this development, the contents of sugars are generally on the rise, maximizing in period S3 (121.19 mg/g). The most abundant substance was sorbitol followed by fructose, glucose, and sugar (Figure 1b). Organic acids are important substances throughout the growth and development of pear fruits, and their contents continued to decrease during the four stages. In addition to citric acid, other organic acids were also in a continuous downtrend. From stage S2, the citric acid content maximized to 1.42 mg/g. In addition, the richest organic acid was quinic acid, with the highest value of ~5.18 mg/g observed in stage S1 (Figure 1c).

3.2. Metabolomic Analysis of Pear Fruits

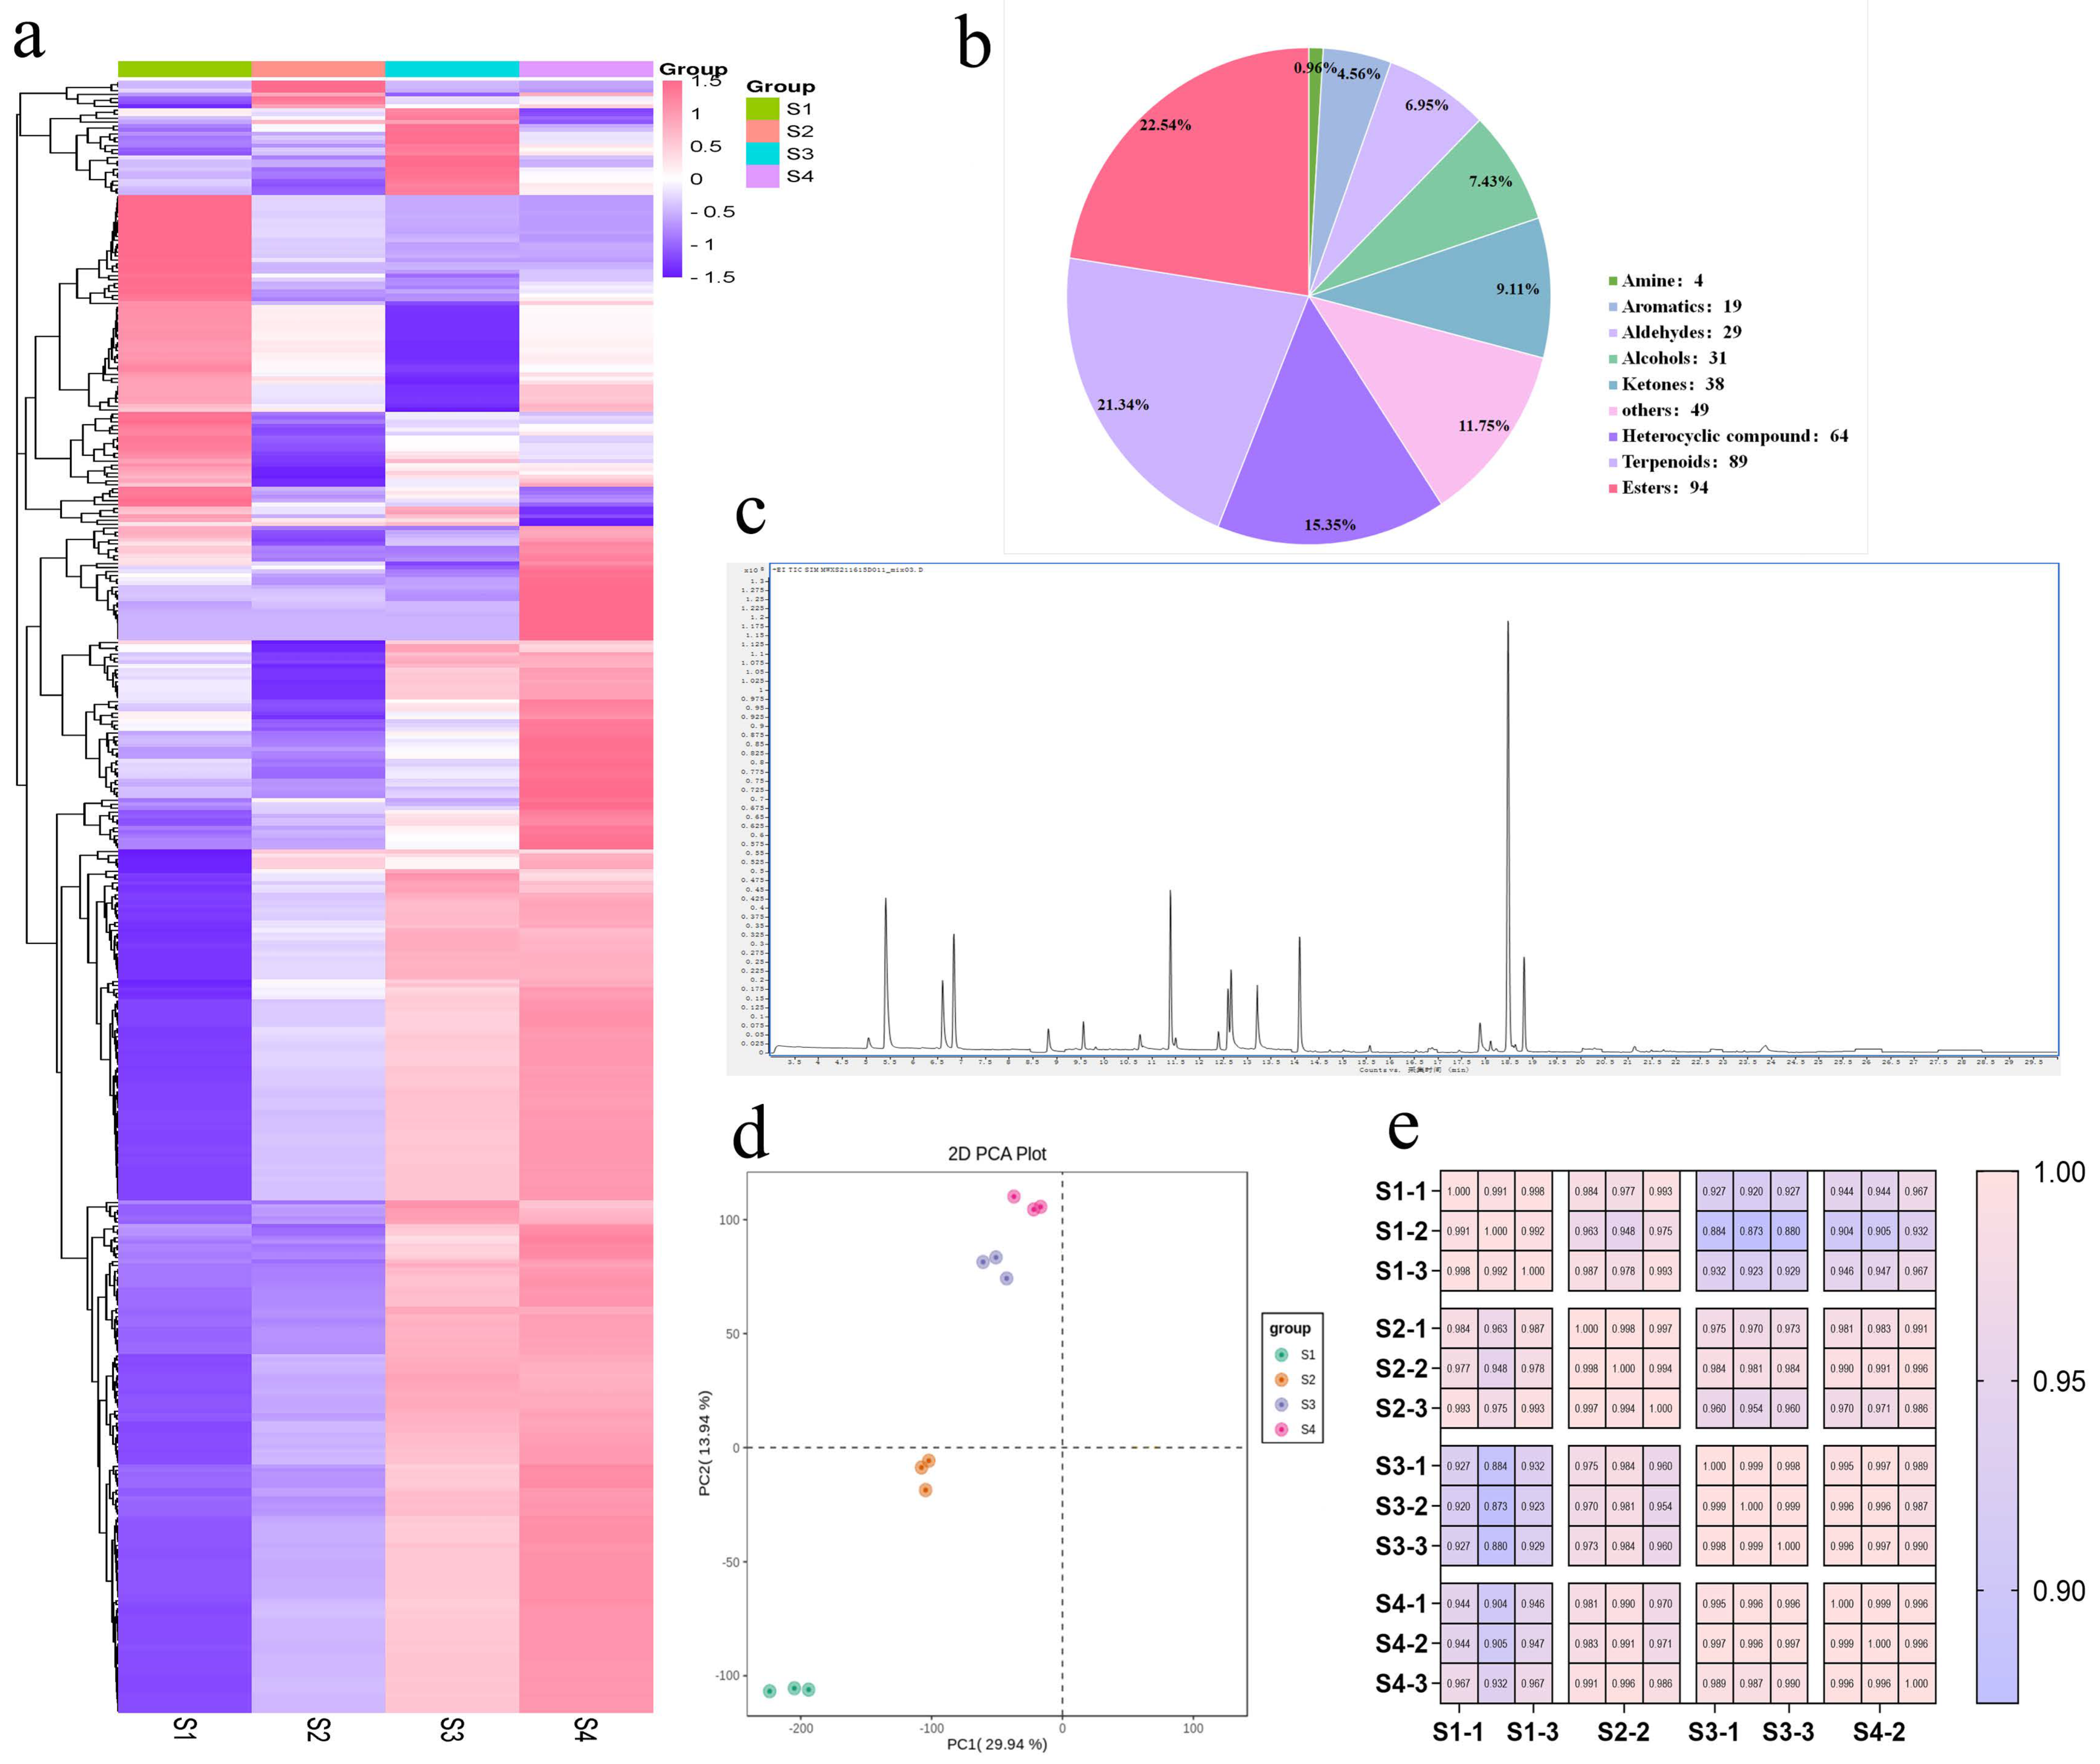
The clean data from each sample reached 6 GB, and the Q30 score was >91% in each case (Table S1). A total of 417 VOCs were identified in the S1, S2, S3, and S4 pear fruits with GC-MS (Figure 2a, Table S2). The VOCs were divided into amines (4, 0.96%), aromatics (19, 4.56%), aldehydes (29, 6.95%), alcohols (31, 7.43%), ketones (38, 9.11%), heterocyclic compounds (64, 15.35%), terpenoids (89, 21.34%), esters (94, 22.54%), and others (49, 11.75%). Among them, esters contributed the most (~22.54%) followed by terpenoids (21.34%) and ketones (9.11%), which were the main components in pear fruit VOCs (Figure 2b). Moreover, the curve overlap of the total ion flow was high, suggesting the signal stability is high and the experimental results are reliable (Figure 2c). Next, PCA was performed on the 417 metabolites to clarify the discrepancy in the metabolite profiles among the four stages. The PCA results separated the samples into four distinct periods (Figure 2d). In addition, the R between samples exceeded 0.5, and the R for the same variety exceeded 0.9, implying the results are reliable and reproducible (Figure 2e).

3.3. Differences in VOCs of Pear Fruits

OPLS-DA combines PLS-DA and OSC to screen variances by removing irrelevant variances. In the OPLS-DA model, the VOC contents of the samples were compared pairwise between S1 and S2 (R2X = 0.546, R2Y = 0.901, and Q2 = 0.788; Figure S1a), between S2 and S3 (0.6, 0.854, 0.774; Figure S1b), between S3 and S4 (0.438, 0.862, 0.777; Figure S1c), and between S1 and S4 (0.788, 0.998, 0.989; Figure S1d). The Q2 values for all comparisons surpassed 0.5, implying that these models were stable and reliable and that the discrepancy in the VOCs can be further screened. The variable impact on projection (VIP) of the OPLS-DA model revealed that the VOC variances remarkably varied among the four stages of pear fruits.
VOCs were significantly enriched during pear fruit ripening (Figure S2). Compared with S1, 45 VOCs were up-regulated and 5 VOCs were down-regulated in S2 (Figure S2e). However, 75 VOCs accumulated and 25 VOCs declined in S4 relative to S1 (Figure S2h). Additionally, 34 VOCs were up-regulated and 22 VOCs were down-regulated from S2 to S3 (Figure S2f). Furthermore, 33 VOCs were enriched and 15 VOCs were down-regulated in S4 compared to S3 (Figure S2g). These results indicate that VOCs accumulate considerably during pear fruit growth and ripening. The differential VOCs can be critical factors in aroma formation amid pear fruit ripening. Hence, we focused on these significantly up- and down-regulated VOCs. This study previously documented the expression patterns for 417 metabolites at different stages (Figure 2a). Here, pairwise comparisons were completed among the four periods to reveal the accumulation pattern of VOCs during fruit growth and development. Compared to S1, S2 was significantly down-regulated than up-regulated, with significantly more differential VOCs (Figure S3a, Table S3). Starting with S3, large differential VOCs were up-regulated (Figure S3b,c, Tables S4 and S5). Compared with S1, S4 had significantly more differential VOCs than the other groups, and most were up-regulated (Figure S3d, Table S6). Additionally, terpenoids had the highest differential VOC contents in the four stages. Next, we aimed to determine the underlying metabolic pathways of terpenoids.

3.4. Correlation between Metabolites and Transcripts in Pear Fruits

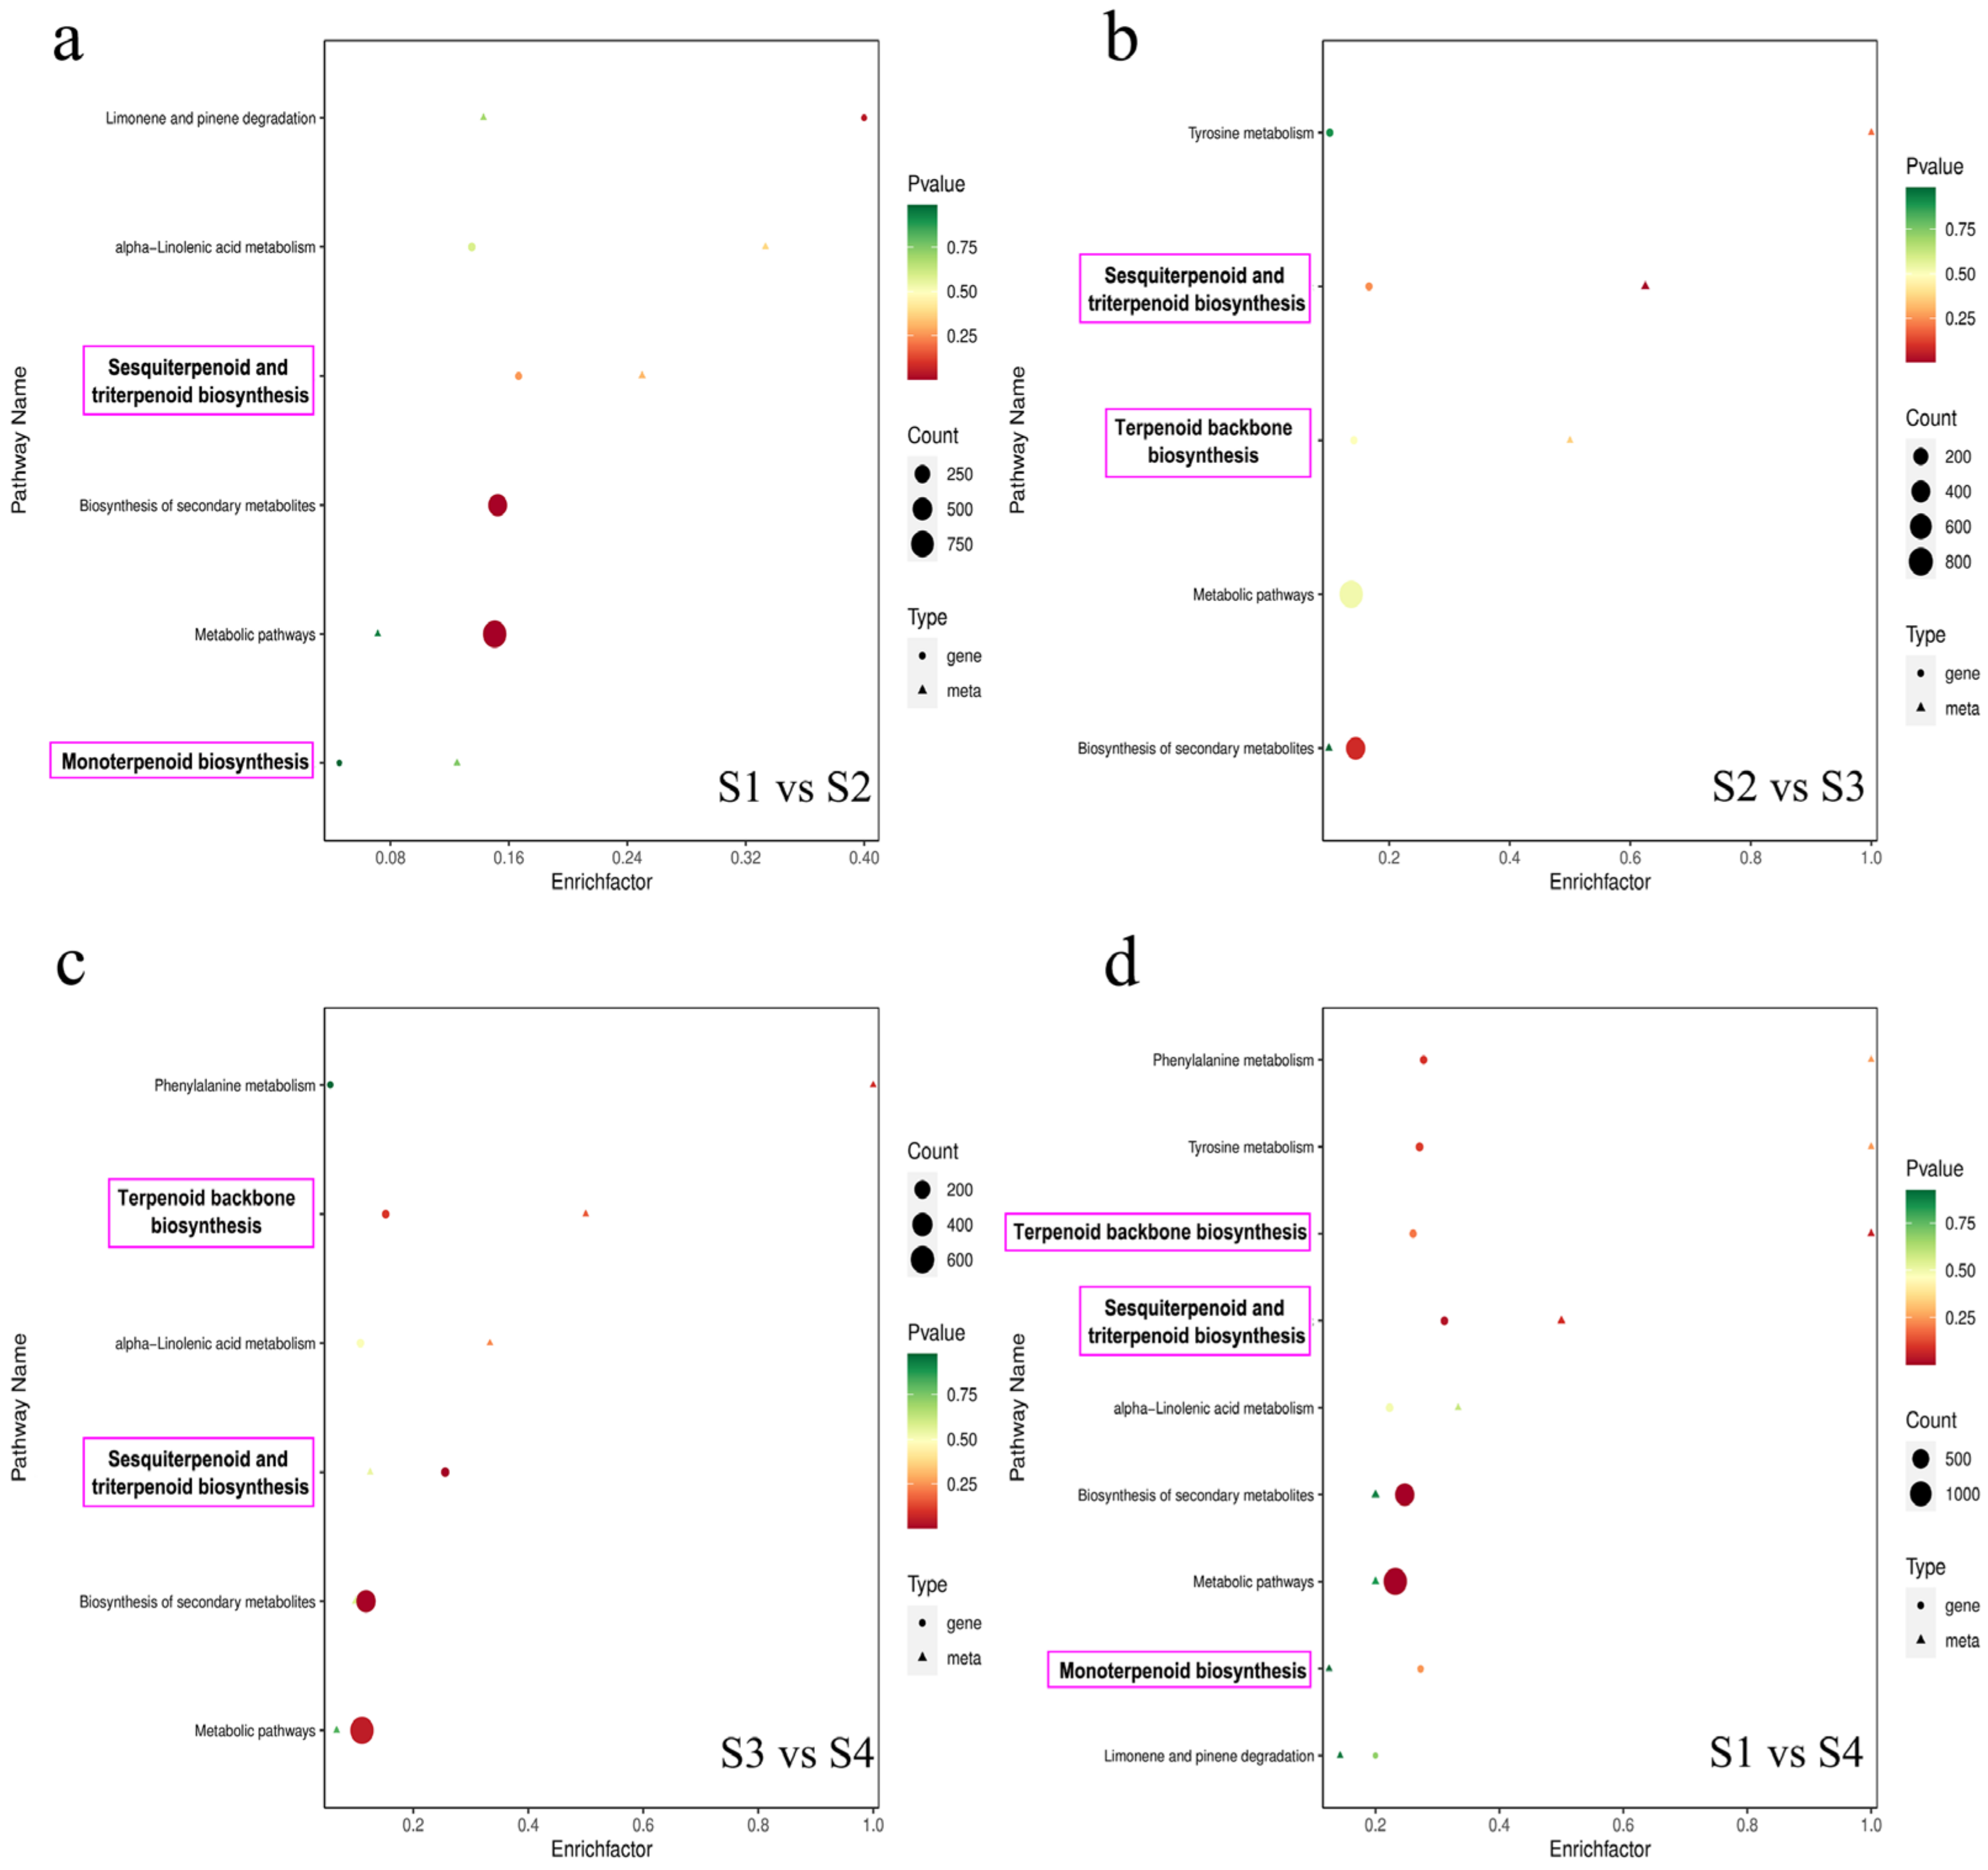
This study probed into the association between metabolites and transcript data. The KEGG enrichment analysis of differential VOCs and DEGs uncovered a KEGG pathway shared by the two omics. The KEGG classification demonstrated that the terpenoid synthesis pathway was significantly enriched during the growth and development of pear fruits (Figure 3). The nine-quadrant graph based on the correlation analysis showed that metabolites in the third and seventh quadrants were positively regulated by genes, and metabolites in the first and ninth quadrants are negatively regulated by genes (Figure S3).

3.5. Gene Expression Profiling of Terpenoid Metabolic Pathways

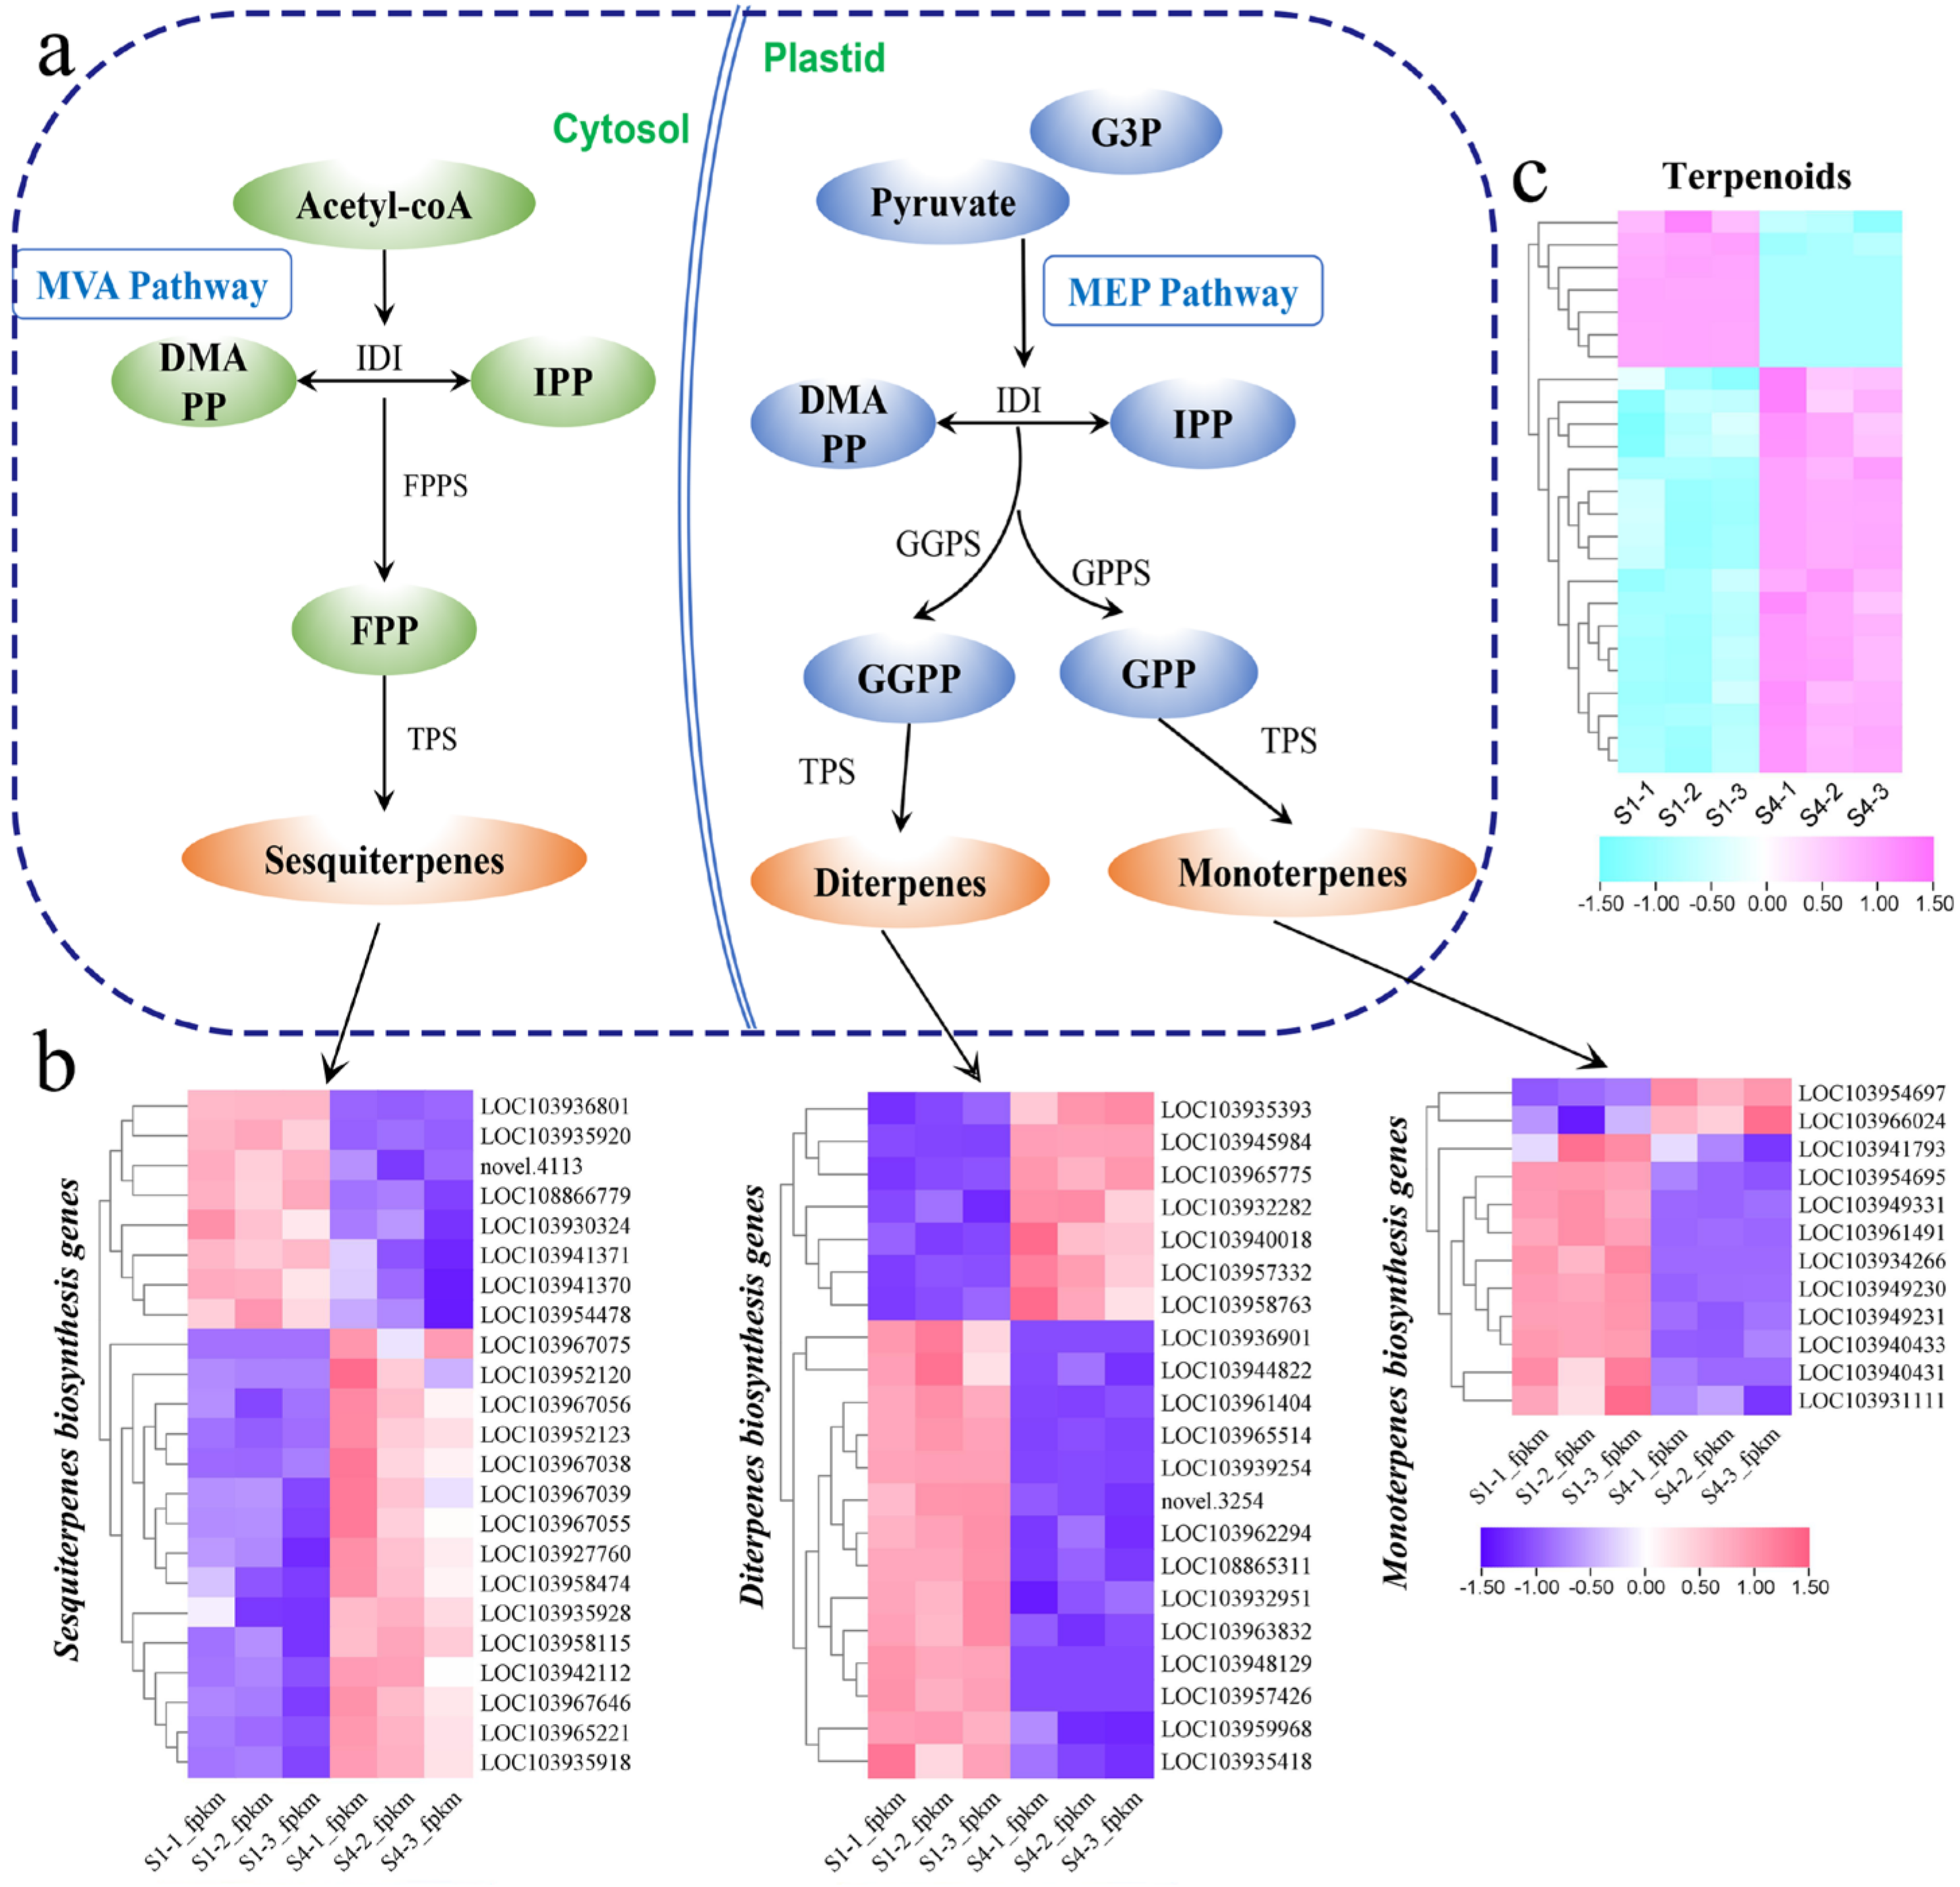
Compared with the early stage of growth and development, fruits in the ripening stage have more levels and types of terpenoids. There are two main terpenoid formation pathways in pears: the MVA pathway in the cytosol and the MEP pathway in the plastid (Figure 4a). In the MVA pathway, sesquiterpene biosynthetic genes were up-regulated, and in the MEP pathway, monoterpene and diterpene biosynthetic genes were down-regulated, all significantly (Figure 4b). Among the differential metabolites measured, sesquiterpene levels and types were higher (Figure 4c, Table S7). We randomly selected genes, analyzed the expression patterns of those genes using qRT-PCR, and compared them with FPKM values. The results showed that the expression patterns of randomly selected genes were consistent under different techniques, indicating that our data were reliable (Figure S4 and Table S8).

4. Discussion

During the long-term process of pears breeding/selection, great importance has been attributed to fruit size, color, yield, the sugar–acid ratio, and maturation season [37]. This study analyzed changes in the content of sugars and organic acids. As the fruit matured, the sugar content and the sweetness of the fruit increased and the organic acid content and the acidity decreased, which are in line with variations in the ripe flavor of other fruits [38].
In addition to flavor studies, such as those described for sweetness and acidity, aroma is also an important component of fruit flavor. Therefore, elucidating the metabolic pathways controlling the formation and enrichment of key aroma flavor substances is critical in increasing fruit flavor quality. Each fruit species has a unique aroma based on the blending of fruit VOCs [39]. Our study showed that terpenoids and esters were the main parts of the ‘Panguxiang‘ fruit aroma, which is consistent with the main VOCs in the growth and development stages of pineapple (Ananas comosus (L.) Merr.) [40] and ‘Nanguo’ pear (Pyrus ussuriensis Maxim.) [41]. We analyzed DEGs and differential VOCs in the four stages of ’Panguxiang‘ and found that the two jointly enriched the terpenoid biosynthesis pathway. Thereby, we boldly speculate that the unique aroma of ’Panguxiang‘ is most likely due to the increase in the type and content of terpenoids. At present, esters, alcohols, and aldehydes are considered the main volatile aroma components in pears [42]. In our study, however, volatile terpenes are second only to esters. Terpenoids have been studied in citrus fruits, and the results show that the volatile oil is mainly composed of monoterpene in citrus lemon peel and of terpene and terpene alcohol in oranges [43]. In addition, terpenoids were also reported in the aroma of apricots [44] and peaches [45] during fruit growth and development. On this basis, we further analyzed the biosynthetic pathways of terpenoids to find what interesting results will emerge.
As one of the most important groups of plant volatiles, terpenoids are widely present in higher plants and participate in a wide range of biological activities [46]. We built a colorful model for studying ‘Panguxiang’ terpenoids by comparing stages S1 versus S4 (Figure 4). The model clearly showed how terpenoids were generated, with monoterpenes and diterpenes produced via the MAP pathway and sesquiterpenes generated via the MEV pathway [47,48]. Interestingly, the expressions of biosynthetic genes of sesquiterpenes and mono/di-terpenes were diametrically the opposite. The sesquiterpene biosynthetic gene was significantly up-regulated, while mono/di-terpenes were significantly down-regulated. Furthermore, we identified 15 sesquiterpenes and 7 monoterpenes but no diterpenes. The contents of sesquiterpenoids and metabolites were higher compared with monoterpenoids. These results indicate that sesquiterpenoids play a key role in volatile terpenoids in the ‘Panguxiang’ pear, which are mainly produced through the MEV pathway. The terpenes accumulated in plants not only contribute to the production of specific aromas beneficial to the plant but are also directly or indirectly involved in the defense against insects or bacteria [49]. Among the metabolic pathways of fruit growth and development, it has been reported that ABA associated with maturity and color-related carotenoids occupy an important position [50]. The color of fruits has always been the target of artificial breeding, and carotenoid production is also through the MEP route. Pears have less color change during growth and development, so we boldly speculate that the content of carotenoids may be reduced. This is also the focus of our next research, which will focus on the changes in the relevant metabolic pathways during maturation.
Research on the volatile aroma of pear began in 1927 [6], and a number of related studies are reported every year. However, there are few reports on volatile terpenoids. During the growth and ripening of pear fruit, the changes in volatile substances vary and are affected by many factors [51]. Perhaps the volatile aroma components of pears during storage are significantly different from those during growth and development (maybe the total amount of terpenoids decreased and other substances increased). Therefore, our future research focus is aimed to explore the dynamic change process in volatile aroma during storage and to continue to provide a theoretical basis for fruit flavor research.

Supplementary Materials

The following supporting information can be downloaded at: https://www.mdpi.com/article/10.3390/horticulturae9040483/s1, Figure S1, Analysis of differential VOCs. (a–d) OPLS-DA plots and loading plots. (e–h) Volcano plot showing the differential VOC expressions between (e) S1 and S2, (f) S2 and S3, (g) S3 and S4, and (h) S1 and S4. Figure S2, Metabolites with significant differences in the four stages. Significantly different metabolites were assessed using VIP and fold change. Figure S3, The nine-quadrant diagram of correlation analysis between transcriptomics and metabonomics. Figure S4, Expression patterns of randomly selected genes detected using different techniques. Table S1, Data preprocessing results statistics. Table S2, A list of VOCs identified in pear fruit. Tables S3–S6, A list of differential VOCs identified in pear fruit in S1–S2, S2–S3, S3–S4, and S1–S4. Table S7, A list of differential terpenoids identified in pear fruit in S1–S4. Table S8. A list of primers.

Author Contributions

Conceptualization, Z.L. (Zhen Liu) and X.G.; methodology, J.Q. and Q.C.; validation, H.L. and S.Y.; formal analysis, H.L. and S.Y.; resources, Z.L. (Zhen Liu); data curation, H.L.; writing—draft preparation, H.L.; writing—review and editing, J.Q. and S.R.; visualization, H.L. and S.R.; supervision, Y.W. and Z.L. (Zhi Li); project administration, Z.L. (Zhen Liu) and C.M.; funding acquisition, J.Q. and Z.L. (Zhen Liu). All authors have read and agreed to the published version of the manuscript.

Funding

This study was supported by the National Natural Science Foundation of China, Funding number 31700549 and the Achievements Transformation Fund Project, funding number 2014D00000150.

Data Availability Statement

Not applicable.

Acknowledgments

Thanks to Pengcheng Li for his guidance in plotting the figures.

Conflicts of Interest

The authors declare no conflict of interest.

References

  1. FAO. Available online: https://www.fao.org/faostat/zh/#data (accessed on 5 April 2023).
  2. Forster, B. Wild Crop Relatives: Genomic and Breeding Resources, Cereals; Experimental Agriculture; Kole, C., Ed.; Springer: Berlin/Heidelberg, Germany, 2011; Volume 47, p. 736. [Google Scholar]
  3. Cui, T.; Nakamura, K.; Ma, L.; Li, J.-Z.; Kayahara, H. Analyses of Arbutin and Chlorogenic Acid, the Major Phenolic Constituents in Oriental Pear. J. Agric. Food Chem. 2005, 53, 3882–3887. [Google Scholar] [CrossRef] [PubMed]
  4. Li, H.Y.; Wang, Y.M.; Geng, X.D. Study on Grafting Seedling cultivation Technology of Pyrus spp. ‘Panguxiang’ pear in spring. J. Henan Agric. Univ. 2016, 50, 486–489. (In Chinese) [Google Scholar]
  5. Sun, Q.; Zhang, N.; Wang, J.; Zhang, H.; Li, D.; Shi, J.; Li, R.; Weeda, S.; Zhao, B.; Ren, S.; et al. Melatonin promotes ripening and improves quality of tomato fruit during postharvest life. J. Exp. Bot. 2014, 66, 657–668. [Google Scholar] [CrossRef] [PubMed] [Green Version]
  6. Spaho, N.; Gaši, F.; Leitner, E.; Blesić, M.; Akagić, A.; Žuljević, S.O.; Kurtović, M.; Ratković, D.; Murtić, M.S.; Akšić, M.F.; et al. Characterization of Volatile Compounds and Flavor in Spirits of Old Apple and Pear Cultivars from the Balkan Region. Foods 2021, 10, 1258. [Google Scholar] [CrossRef] [PubMed]
  7. Goff, S.A.; Klee, H.J. Plant volatile compounds: Sensory cues for health and nutritional value? Science 2006, 311, 815–819. [Google Scholar] [CrossRef]
  8. Chen, J.L.; Yan, S.; Feng, Z.; Xiao, L.; Hu, X.S. Changes in the volatile compounds and chemical and physical properties of Yali pear (Pyrus bertschneideri Reld) during storage. Food Chem. 2006, 97, 248–255. [Google Scholar] [CrossRef]
  9. Villatoro, C.; Altisent, R.; Echeverría, G.; Graell, J.; López, M.L.; Lara, I. Changes in biosynthesis of aroma volatile compounds during on-tree maturation of ‘Pink Lady®’ apples. Postharvest Biol. Technol. 2008, 47, 286–295. [Google Scholar] [CrossRef]
  10. Lewinsohn, E.; Sitrit, Y.; Bar, E.; Azulay, Y.; Ibdah, M.; Meir, A.; Yosef, E.; Zamir, D.; Tadmor, Y. Not just colors—Carotenoid degradation as a link between pigmentation and aroma in tomato and watermelon fruit. Trends Food Sci. Technol. 2005, 16, 407–415. [Google Scholar] [CrossRef]
  11. Lalel, H.J.D.; Singh, Z.; Tan, S.C. Aroma volatiles production during fruit ripening of ‘Kensington Pride’ mango. Postharvest Biol. Technol. 2003, 27, 323–336. [Google Scholar] [CrossRef]
  12. Obando-Ulloa, J.M.; Moreno, E.; García-Mas, J.; Nicolai, B.; Lammertyn, J.; Monforte, A.J.; Fernández-Trujillo, J.P. Climacteric or non-climacteric behavior in melon fruit: 1. Aroma volatiles. Postharvest Biol. Technol. 2008, 49, 27–37. [Google Scholar] [CrossRef]
  13. Van de Poel, B.; Vandendriessche, T.; Hertog, M.L.A.T.M.; Nicolai, B.M.; Geeraerd, A. Detached ripening of non-climacteric strawberry impairs aroma profile and fruit quality. Postharvest Biol. Technol. 2014, 95, 70–80. [Google Scholar] [CrossRef]
  14. Wang, Y.; Yang, C.; Li, S.; Yang, L.; Wang, Y.; Zhao, J.; Jiang, Q. Volatile characteristics of 50 peaches and nectarines evaluated by HP–SPME with GC–MS. Food Chem. 2009, 116, 356–364. [Google Scholar] [CrossRef]
  15. Maul, F.; Sargent, S.A.; Sims, C.A.; Baldwin, E.A.; Balaban, M.O.; Huber, D.J. Tomato Flavor and Aroma Quality as Affected by Storage Temperature. J. Food Sci. 2000, 65, 1228–1237. [Google Scholar] [CrossRef]
  16. Rapparini, F.; Predieri, S. Pear Fruit Volatiles. Hortic. Rev. 2010, 28, 237–324. [Google Scholar]
  17. El Hadi, M.A.; Zhang, F.J.; Wu, F.F.; Zhou, C.H.; Tao, J. Advances in fruit aroma volatile research. Molecules 2013, 18, 8200–8229. [Google Scholar] [CrossRef] [PubMed]
  18. Schwab, W.; Davidovich-Rikanati, R.; Lewinsohn, E. Biosynthesis of plant-derived flavor compounds. Plant J. 2008, 54, 712–732. [Google Scholar] [CrossRef]
  19. Ramya, M.; An, H.R.; Baek, Y.S.; Reddy, K.E.; Park, P.H. Orchid floral volatiles: Biosynthesis genes and transcriptional regulations. Sci. Hortic. 2018, 235, 62–69. [Google Scholar] [CrossRef]
  20. Gershenzon, J.; Kreis, W. Biochemistry of Terpenoids: Monoterpenes, Sesquiterpenes, Diterpenes, Sterols, Cardiac Glycosides and Steroid Saponins. Annu. Plant Rev. Online 2018, 218–294. [Google Scholar]
  21. Newman, J.D.; Chappell, J. Isoprenoid biosynthesis in plants: Carbon partitioning within the cytoplasmic pathway. Crit. Rev. Biochem. Mol. Biol. 1999, 34, 95–106. [Google Scholar] [CrossRef]
  22. Jin, J.; Zhang, S.; Zhao, M.; Jing, T.; Zhang, N.; Wang, J.; Wu, B.; Song, C. Scenarios of Genes-to-Terpenoids Network Led to the Identification of a Novel α/β-Farnesene/β-Ocimene Synthase in Camellia sinensis. Int. J. Mol. Sci. 2020, 21, 655. [Google Scholar] [CrossRef] [Green Version]
  23. Yuan, H.; Cao, G.; Hou, X.; Huang, M.; Du, P.; Tan, T.; Zhang, Y.; Zhou, H.; Liu, X.; Liu, L.; et al. Development of a widely targeted volatilomics method for profiling volatilomes in plants. Mol. Plant 2022, 15, 189–202. [Google Scholar] [CrossRef] [PubMed]
  24. Li, H.; Quan, J.; Rana, S.; Wang, Y.; Li, Z.; Cai, Q.; Ma, S.; Geng, X.; Liu, Z. The Molecular Network behind Volatile Aroma Formation in Pear (Pyrus spp. Panguxiang) Revealed by Transcriptome Profiling via Fatty Acid Metabolic Pathways. Life 2022, 12, 1494. [Google Scholar] [CrossRef] [PubMed]
  25. Ali, M.; Li, P.; She, G.; Chen, D.; Wan, X.; Zhao, J. Transcriptome and metabolite analyses reveal the complex metabolic genes involved in volatile terpenoid biosynthesis in garden sage (Salvia officinalis). Sci. Rep. 2017, 7, 1–21. [Google Scholar] [CrossRef] [PubMed] [Green Version]
  26. Apweiler, R.; Bairoch, A.; Wu, C.H.; Barker, W.C.; Boeckmann, B.; Ferro, S.; Gasteiger, E.; Huang, H.; Lopez, R.; Magrane, M.; et al. UniProt: The Universal Protein knowledgebase. Nucleic Acids Res. 2004, 32, D115–D119. [Google Scholar] [CrossRef]
  27. Ashburner, M.; Ball, C.A.; Blake, J.A.; Botstein, D.; Butler, H.; Cherry, J.M.; Davis, A.P.; Dolinski, K.; Dwight, S.S.; Eppig, J.T.; et al. Gene Ontology: Tool for the unification of biology. Nat. Genet. 2000, 25, 25–29. [Google Scholar] [CrossRef] [PubMed] [Green Version]
  28. Koonin, E.V.; Fedorova, N.D.; Jackson, J.D.; Jacobs, A.R.; Krylov, D.M.; Makarova, K.S.; Mazumder, R.; Mekhedov, S.L.; Nikolskaya, A.N.; Rao, B.S.; et al. A comprehensive evolutionary classification of proteins encoded in complete eukaryotic genomes. Genome Biol. 2004, 5, R7. [Google Scholar] [CrossRef] [PubMed] [Green Version]
  29. Finn, R.D.; Bateman, A.; Clements, J.; Coggill, P.; Eberhardt, R.Y.; Eddy, S.R.; Heger, A.; Hetherington, K.; Holm, L.; Mistry, J.; et al. Pfam: The protein families database. Nucleic Acids Res. 2014, 42, D222–D2302. [Google Scholar] [CrossRef] [Green Version]
  30. Kanehisa, M.; Goto, S.; Kawashima, S.; Okuno, Y.; Hattori, M. The KEGG resource for deciphering the genome. Nucleic Acids Res. 2004, 32, D277–D280. [Google Scholar] [CrossRef] [Green Version]
  31. O’Donovan, C.; Martin, M.J.; Glemet, E.; Codani, J.J.; Apweiler, R. Removing redundancy in SWISS-PROT and TrEMBL. Bioinformatics 1999, 15, 258–259. [Google Scholar] [CrossRef] [Green Version]
  32. Zheng, Y.; Jiao, C.; Sun, H.; Rosli, H.G.; Pombo, M.A.; Zhang, P.; Banf, M.; Dai, X.; Martin, G.B.; Giovannoni, J.J.; et al. iTAK: A Program for Genome-wide Prediction and Classification of Plant Transcription Factors, Transcriptional Regulators, and Protein Kinases. Mol. Plant 2016, 9, 1667–1670. [Google Scholar] [CrossRef] [Green Version]
  33. R-Project. Available online: http://www.r-project.org/ (accessed on 5 April 2023).
  34. Tang, N.; An, J.; Deng, W.; Gao, Y.; Chen, Z.; Li, Z. Metabolic and transcriptional regulatory mechanism associated with postharvest fruit ripening and senescence in cherry tomatoes. Postharvest Biol. Technol. 2020, 168, 111274. [Google Scholar] [CrossRef]
  35. Wang, A.; Li, R.; Ren, L.; Gao, X.; Zhang, Y.; Ma, Z.; Ma, D.; Luo, Y. A comparative metabolomics study of flavonoids in sweet potato with different flesh colors (Ipomoea batatas (L.) Lam). Food Chem. 2018, 260, 124–134. [Google Scholar] [CrossRef] [PubMed]
  36. Chen, C.; Chen, H.; Zhang, Y.; Thomas, H.R.; Frank, M.H.; He, Y.; Xia, R. TBtools: An Integrative Toolkit Developed for Interactive Analyses of Big Biological Data. Mol. Plant 2020, 13, 1194–1202. [Google Scholar] [CrossRef] [PubMed]
  37. Wang, L.; He, F.; Huang, Y.; He, J.; Yang, S.; Zeng, J.; Deng, C.; Jiang, X.; Fang, Y.; Wen, S. Genome of wild mandarin and domestication history of mandarin. Mol. Plant 2018, 11, 1024–1037. [Google Scholar] [CrossRef] [PubMed] [Green Version]
  38. Wang, R.; Shu, P.; Zhang, C.; Zhang, J.; Chen, Y.; Zhang, Y.; Du, K.; Xie, Y.; Li, M.; Ma, T.; et al. Integrative analyses of metabolome and genome-wide transcriptome reveal the regulatory network governing flavor formation in kiwifruit (Actinidia chinensis). New Phytol. 2022, 233, 373–389. [Google Scholar] [CrossRef] [PubMed]
  39. Baietto, M.; Wilson, A.D. Electronic-nose applications for fruit identification, ripeness and quality grading. Sensors 2015, 15, 899–931. [Google Scholar] [CrossRef]
  40. Steingass, C.B.; Carle, R.; Schmarr, H.G. Ripening-dependent metabolic changes in the volatiles of pineapple (Ananas comosus (L.) Merr.) fruit: I. Characterization of pineapple aroma compounds by comprehensive two-dimensional gas chromatography-mass spectrometry. Anal. Bioanal. Chem. 2015, 407, 2591–2608. [Google Scholar] [CrossRef]
  41. Li, X.J.; Qi, L.Y.; Zhang, N.N.; Zhao, L.H.; Sun, Y.Q.; Huang, X.T.; Wang, H.Y.; Yin, Z.P.; Wang, A.D. Integrated metabolome and transcriptome analysis of the regulatory network of volatile ester formation during fruit ripening in pear. Plant Physiol. Biochem. 2022, 185, 80–90. [Google Scholar] [CrossRef]
  42. Shi, F.; Zhou, X.; Zhou, Q.; Yao, M.M.; Wei, B.D.; Ji, S.J. Transcriptome analyses provide new possible mechanisms of aroma ester weakening of ‘Nanguo’ pear after cold storage. Sci. Hortic. 2018, 237, 247–256. [Google Scholar] [CrossRef]
  43. Mahalwal, V.S.; Ali, M. Volatile Constituents of the Fruits Peels of Citrus lemon (Linn) Burm. F. J. Essent. Oil Bear. Plants 2003, 6, 31–35. [Google Scholar] [CrossRef]
  44. Karabulut, I.; Gokbulut, I.; Bilenler, T.; Sislioglu, K.; Ozdemir, I.S.; Bahar, B.; Çelik, B.; Seyhan, F. Effect of fruit maturity level on quality, sensory properties and volatile composition of two common apricot (Prunus armeniaca L.) varieties. J. Food Sci. Technol. 2018, 55, 2671–2678. [Google Scholar] [CrossRef] [PubMed]
  45. Wei, C.; Liu, H.; Cao, X.; Zhang, M.; Li, X.; Chen, K.; Zhang, B. Synthesis of flavour-related linalool is regulated by PpbHLH1 and associated with changes in DNA methylation during peach fruit ripening. Plant Biotechnol. J. 2021, 19, 2082–2096. [Google Scholar] [CrossRef] [PubMed]
  46. Baldwin, I.T. Plant volatiles. Curr. Biol. 2010, 20, R372–R392. [Google Scholar] [CrossRef] [PubMed] [Green Version]
  47. Phillips, M.A.; D’Auria, J.C.; Gershenzon, J.; Pichersky, E. The Arabidopsis thaliana type I Isopentenyl Diphosphate Isomerases are targeted to multiple subcellular compartments and have overlapping functions in isoprenoid biosynthesis. Plant Cell 2008, 20, 677–696. [Google Scholar] [CrossRef] [Green Version]
  48. Monson, R.K. Metabolic and gene expression controls on the production of biogenic volatile organic compounds. In Biology, Controls and Models of Tree Volatile Organic Compound Emissions; Niinemets, Ü., Monson, R., Eds.; Springer: Berlin/Heidelberg, Germany, 2013; pp. 153–179. [Google Scholar]
  49. Ding, Y.; Huffaker, A.; Köllner, T.G.; Weckwerth, P.; Robert, C.A.M.; Spencer, J.L.; Lipka, A.E.; Schmelz, E.A. Selinene volatiles are essential precursors for maize defense promoting fungal pathogen resistance. Plant Physiol. 2017, 175, 1455–1468. [Google Scholar] [CrossRef] [PubMed]
  50. Aharoni, A.; Jongsma, M.A.; Bouwmeester, H.J. Volatile science? Metabolic engineering of terpenoids in plants. Trends Plant Sci. 2005, 10, 594–602. [Google Scholar] [CrossRef]
  51. Wang, J.F.; Abbey, T.; Kozak, B.; Madilao, L.L.; Tindjau, R.; Nin, D.J.; Castellarin, S.D. Evolution over the growing season of volatile organic compounds in Viognier (Vitis vinifera L.) grapes under three irrigation regimes. Food Res. Int. 2019, 125, 108512. [Google Scholar] [CrossRef]
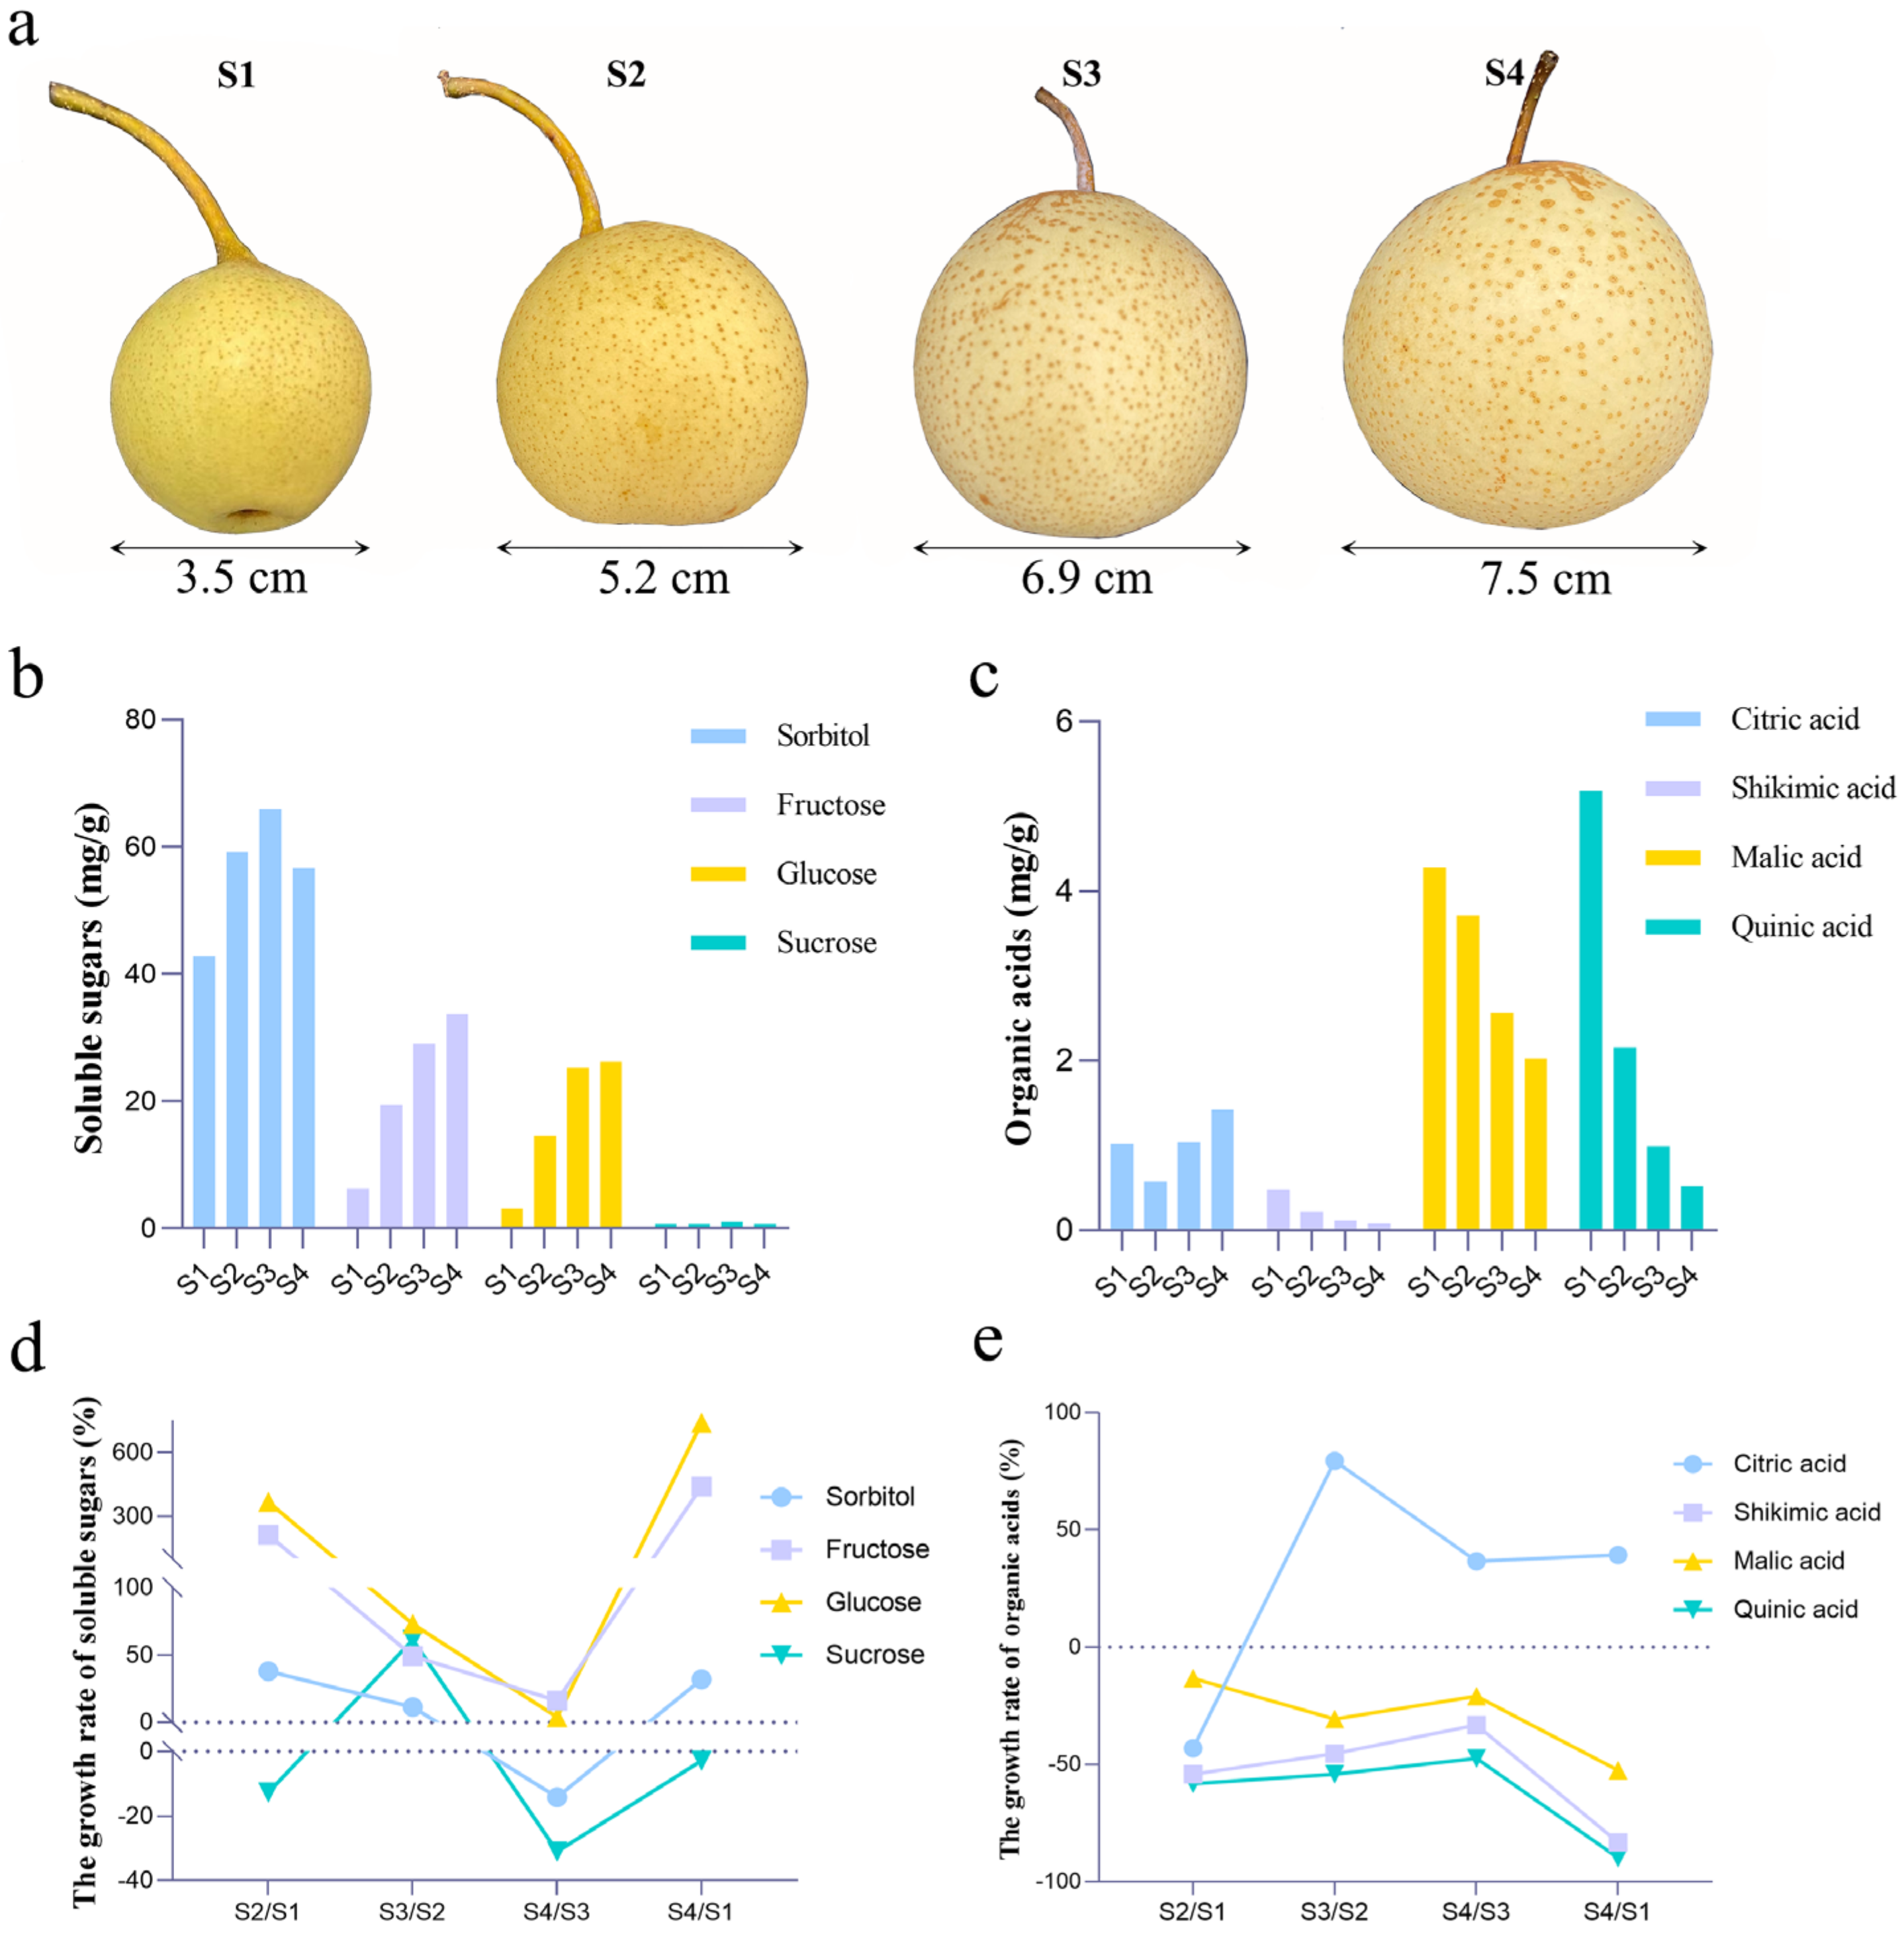
Figure 1. Phenotypic analysis of ‘Panguxiang’ in four growth and development stages. (a) The phenotype of ‘Panguxiang’ at the four stages [23]. Determination of (b) sugar content and (c) organic acid content. (d,e) The growth rate of sugar and organic acids.
Horticulturae 09 00483 g001
Figure 2. Heat map, TIC, PCA, and correlation coefficient for relative VOC differences at the four stages. (a,b) Clustering heat map of all VOCs. (c) Overlay of the QC sample mass detection TIC plot. (d) PCA score plots showing high cohesion within groups and good separation among the four stages. Quality control in the mixed sample. (e) Correlation coefficient.
Horticulturae 09 00483 g002
Figure 3. Bubble map drawn for the KEGG pathway enriched with metabolomics and transcriptomics. (ad) The abscissa represents the pathway enrichment factor (Diff/Background) in different omics, and the abscissa is the name of the KEGG pathway. The gradient of red–yellow–green shows the variation in the significance of high–medium–low enrichment represented by the p-value. The bubble shape stands for omics, the bubble size shows the number of differential metabolites or genes, and a larger number means a larger point.
Horticulturae 09 00483 g003
Figure 4. Differential gene expression patterns of two terpenoid biosynthetic pathways for fruits in stages S1 and S4. (a) Biosynthetic pathway of terpenoids in plants. Terpenoid precursors (acetyl-CoA and pyruvate) enter the MVA pathway in the cytosol to generate sesquiterpenes or the MEP pathway in plastids to form monoterpenes and diterpenes. The enzymes and intermediates of both pathways are shown. (b) DEGs for monoterpenes, diterpenes, and sesquiterpenes biosynthesis pathways. (c) Differential terpenoids. DMAPP: dimethylallyl diphosphate; FPP: farnesyl diphosphate; FPPS: farnesyl pyrophosphate synthase; GGPP: geranylgeranyl pyrophosphate; GGPS: geranylgeranyl pyrophosphate synthase; GPP: geranyl diphosphate; GPPS: geranyl diphosphate synthase; IDI: isopentenyl diphosphate isomerase; IPP: isopentenyl diphosphate; TPS: terpenoid synthase.
Horticulturae 09 00483 g004
Disclaimer/Publisher’s Note: The statements, opinions and data contained in all publications are solely those of the individual author(s) and contributor(s) and not of MDPI and/or the editor(s). MDPI and/or the editor(s) disclaim responsibility for any injury to people or property resulting from any ideas, methods, instructions or products referred to in the content.