Article

Light Intensity during Green-Leaf Butterhead Lettuce Propagation Influences Yield and Carotenoids at Harvest

Plant Sciences Department, University of Tennessee, 2505 E.J. Chapman Drive, Knoxville, TN 48824, USA
*
Author to whom correspondence should be addressed.
Horticulturae 2023, 9(2), 223; https://doi.org/10.3390/horticulturae9020223
Submission received: 21 December 2022 / Revised: 29 January 2023 / Accepted: 31 January 2023 / Published: 7 February 2023

Abstract

:
Controlled environment agriculture (CEA) operations must increase resource-use efficiency, yield, and phytonutrient concentrations to remain competitive. Carotenoids are phytonutrients of interest due to their purported health promoting effects. Their content is impacted by environmental controls, including lighting. Light-use efficiency increases with greater planting density, which is highest during seedling production. This creates the opportunity to raise light intensity during seedling production to improve growth characteristics and phytonutrient concentrations at harvest. Therefore, the objective of this research was to quantify the extent to which light intensity influences carotenoid accumulation in green butterhead lettuce seedlings, and if differences remain at harvest. Lettuce ‘Rex’ (Lactuca sativa L.) seedlings were grown under fluorescent lighting with intensities of 60, 100, 200, 400, or 600 µmol·m−2·s−1 with a 24-h photoperiod. After 14 days, seedlings were transplanted into raft hydroponic systems in a common greenhouse environment and grown for 21 days. At transplant and final harvest, tissue samples were collected and stored at −80 °C for phytonutrient analysis. Carotenoids, β-carotene, lutein, neoxanthin, zeaxanthin, and violaxanthin, and chlorophylls a and b were quantified using high-performance liquid chromatography (HPLC). We observed a 475% fresh mass enhancement in seedlings grown under 400 versus 60 µmol·m−2·s−1, with a 174% improvement persisting to final harvest. Higher seedling light intensities also generally increased leaf numbers in seedlings and at final harvest, as well as seedling carotenoid concentrations. Final harvest carotenoid concentrations generally decreased with increasing light intensity. Thus, producers should be cognizant that seedling light intensity strongly influences seedling and finished production yield, morphology, and carotenoid content.

1. Introduction

Lettuce (Lactuca sativa L.) is the most popular leafy green vegetable in the United States (U.S.). Its short production time, compact size, and relatively low resource use are appealing attributes for controlled environment agriculture (CEA). In 2019, USD 2.7 billion of lettuce was grown and sold in the U.S., with nearly all being produced in California and Arizona [1]. With production localized to small geographic areas that are highly susceptible to climate change, CEA provides a promising alternative by distributing production across the U.S., thereby reducing the potential impacts of climate change on food production. However, operational costs, such as electricity, are a major barrier to CEA [2,3,4]. Therefore, to optimize CEA efficiency, the primary goal is to minimize electricity use while maximizing growth, development, and phytonutrient content. One of the most obvious environmental parameters to target is light, due to its metabolic importance and sizeable share of CEA energy expenses.
Light regulates numerous processes vital for production outcomes including plant morphology, sugar and secondary metabolite accumulation, and biomass yield. An ideal lettuce production regimen promotes increased leaf numbers, plant mass, and phytonutrient concentrations while shortening production time in the most energy-efficient manner. All of these parameters are influenced by light. Light intensity, photoperiod, and spectral quality are the primary dimensions of production lighting.
Light intensity determines available excitation energy for photosynthesis. Photosynthetic photon flux density (PPFD) is its current standard unit and describes quanta of photosynthetically active light bombarding one square meter per second (µmol·m−2·s−1), though PPFD is commonly converted to daily light integral (DLI). The DLI is effectively the same function as PPFD, but extrapolated over one day, and thus expressed as mol·m−2·d−1.
High production DLIs have been repeatedly demonstrated to improve lettuce yield and growth characteristics. In two studies, increasing DLI from 13.0 to 25.9 mol·m−2·d−1 and from 7.0 to 34.8 mol·m−2·d−1 increased fresh mass by nearly two–fold [5,6]. Despite these results, a DLI of 17 mol·m−2·d−1 is often recommended for butterhead lettuce if vertical air flow is used, and 12 to 14 mol·m−2·d−1 with horizontal air flow [7]. Higher DLIs can cause tip burn, regions of necrosis on inner leaves, rendering the crop unsaleable. Tip burn is caused by calcium (Ca) deficiency, often due to a translocation issue and not a lack of Ca in the nutrient solution since plant Ca uptake is passive. Therefore, tip burn frequently appears in humid environments, which limit transpiration, or during rapid leaf growth under high DLIs, which outpaces Ca transport [5].
Since tip burn usually occurs late in production, light intensity could be increased early in production to drive growth without sacrificing quality. Lettuce seedling production lighting recommendations are lower than those for finishing stages; however, recent studies have suggested researchers re-evaluate pre-existing recommendations [8]. Walters and Lopez [9] determined that basil (Ocimum basilicum) seedling fresh mass can be increased by up to 284% by raising DLI from 6 to 35 mol·m−2·d−1, and, after being transplanted into a common greenhouse environment, up to an 80% increase in fresh mass persisted. Therefore, there is potential to increase lettuce yield while mitigating tip burn by increasing seedling production light intensity.
A less-studied consequence of altering DLI is resultant plant phytonutrient concentrations. Carotenoids are phytonutrients produced in lettuce with potential human health benefits [10]. A primary role of carotenoids’ in plants is photosystem photoprotection by quenching reactive oxygen species and chlorophyll excited states. They additionally assist in maximizing light capture, are integral to light harvesting complex superstructures, and serve as precursors to plant hormones [11,12]. The two primary groups of carotenoids are carotenes, which are pure hydrocarbons, and xanthophyll carotenoids, which are oxygenated derivatives of carotenes. Carotenoids have a variety of roles in both plants and humans.
β-carotene is cleaved by oxygenase enzymes in the human body to produce vitamin A, an essential nutrient with a plethora of metabolic roles. Vitamin A is required for optimal immune function, ocular pigment maintenance, and intestinal health [10]. There is also a notable amount of work indicating promise for β-carotene in attenuating cancer risk and combatting adiposity, both in vitro and in vivo, though with conflicting results [13,14,15]. Zeaxanthin, antheraxanthin, and violaxanthin are all β-carotene derivatives that mainly accumulate in the light harvesting complexes and participate in the xanthophyll cycle. Lutein is an α-carotene derivative, and generally the most abundant carotenoid in plant tissues. It is integral to peripheral antenna complex structures and has been indicated in decreasing inflammatory cytokine responses following muscular damage, foveal photoprotection, and membrane stabilization in humans [16,17]. Zeaxanthin and lutein are both present in primate macular pigmentation, and could play a role in reducing macular degeneration, a leading cause of age-related eyesight loss. Johnson et al. [18] found that providing rhesus monkeys (Macaca mulatta) with lutein and zeaxanthin dietary supplements increased retinal xanthophyll concentrations, suggesting that diet is an important vector for macular protection. Neoxanthin is crucial to PSII structure, and also serves as a precursor to the plant hormone abscisic acid [19].
Considering carotenoids’ myriad nutritional qualities for humans and developmental roles for plants, maximizing their concentrations in crops is desirable. Carotenoid biosynthesis is a tightly regulated process that principally proceeds due to coordinated light-induced signaling between phytochromes (PHYs) and cryptochromes (CRYs). Phytochrome interacting factors (PIFs) and constitutive photomorphogenic one (COP1) negatively regulate seedling photomorphogenesis, which includes carotenoid accumulation. When activated by light, PHYs and CRYs degrade PIFs and COP1, and carotenoid biosynthesis proceeds rapidly [20]. Because carotenoid transcriptional regulation occurs largely as a light response, optimizing production light intensity is a clear contender for increasing concentrations.
Increasing production light intensity also raises electrical expenses. Light-use efficiency is partially a function of planting density because light is distributed over area. Planting density is greatest during the seedling stage, presenting the opportunity to spread high light costs across more plants, thus condensing resources early in development. This targeted application could, in effect, increase desirable growth characteristics and nutrient concentrations at harvest while avoiding excess costs associated with increased lighting throughout the entire production cycle. Despite much work detailing the effect of increasing PPFD during production, little work exists describing targeted light intensity increases during lettuce seedling production and its effects on final harvest yield and phytonutrient content. Therefore, the primary objective of this study was to determine the extent light intensity during lettuce seedling production influences growth characteristics and carotenoid concentration in seedlings, and if differences persist through harvest.

2. Materials and Methods

2.1. Plant Production

Lettuce ‘Rex’ seeds (Johnny’s Selected Seeds, Winslow, MA, USA) were sown in phenolic foam cubes (1.9 × 2.2 × 3.8 cm, Oasis Grower Solutions, Kent, OH, USA) and placed in a reach-in growth chamber (E15; Conviron, Winnipeg, MB, Canada) under fluorescent lighting (Sylvania, Danvers, MA, USA) with target light intensities of 60, 100, 200, 400, and 600 µmol·m−2·s−1 for a 24-hour photoperiod, creating DLIs of 5.4, 8.9, 16.9, 35.9, 52.7 mol·m−2·d−1, respectively. Actual light intensities, reported in Table 1, were measured with a portable quantum sensor (LI–250; LI–COR, Inc., Lincoln, NE, USA). Seeds were irrigated daily with nutrient solution containing deionized water (H2O) supplemented with 12N–1.8P–13.4K water-soluble fertilizer providing (mg·L−1) 100 nitrogen, 15 phosphorus, 112 potassium, 58 calcium, 17 magnesium, 2 sulfur, 1.4 iron, 0.5 zinc, 0.4 copper and manganese, and 0.1 boron and molybdenum (RO Hydro FeED; JR Peters, Inc., Allentown, PA, USA), and magnesium sulfate (MgSO4) providing (mg·L−1) 15 magnesium and 20 sulfur, and adjusted to a pH of 5.8 with hydrogen sulfate (H2SO4) or potassium bicarbonate (KCHO3). Air temperature was maintained at 23.1 ± 0.1 °C.
Fourteen days after sowing (19 December, 17 January, and 16 February; Table 2), seedlings were transplanted into 122 × 183 cm × 15 cm” raft hydroponic systems with 61 × 122 cm sealed surface foam rafts (36 ct lettuce raft; Beaver Plastics, Acheson, AB, Canada) in a common glass-glazed greenhouse environment in Knoxville, TN. Nutrient solution contained deionized water supplemented with 12N–1.8P–13.4K water-soluble fertilizer (RO Hydro FeED; JR Peters, Inc., Allentown, PA, USA) and MgSO4, providing twice the concentrations reported previously for seedlings. Electrical conductivity (EC) and pH were measured (HI9813–6N Portable Waterproof pH/EC/TDS Meter; Hanna Instruments, Woonsocket, RI, USA) and adjusted to 1.56 mS·cm−1 and 6.0, respectively, by adding fertilizer, deionized water, H2SO4, or KCHO3. Air stones were added to provide dissolved oxygen.
Exhaust fans, evaporative-pad cooling, central heating, horizontal air flow fans, and high-pressure sodium supplemental lighting were controlled by an environmental control system (Priva Office Direct Version 9.2; Priva North America, Vineland Station, ON, Canada). Temperature was measured with a shielded temperature sensor (Watchdog WeatherTracker Model 305; Spectrum Technologies Inc., Aurora, IL, USA) as reported in Table 2. The photoperiod was 16 h (0600 to 2200 hr), consisting of natural photoperiods (lat. 43º N) and day-extension lighting from high-pressure sodium lamps providing a supplemental PPFD of ~225 µmol·m−2·s−1 when the outdoor PPFD was low to maintain target DLIs. Actual DLIs are reported in Table 2. Plants were grown for an additional 21 d before harvesting.

2.2. Carotenoid and Chlorophyll Extraction

Frozen samples were freeze dried for at least 72 h then ground with liquid nitrogen (N). Freeze-dried shoot tissues were weighed into 0.100 ± 0.010 g subsamples, added to a 50 mL grinding tube, and pigments were extracted using the method modified from Kopsell et al. [21]. Subsamples were hydrated with 0.8 mL reverse osmosis H2O, 0.8 mL of ethyl-β-8′-apo-carotenoate (internal standard), and 2.5 mL of tetrahydrofuran. Samples were then ground using a drill press homogenizer in an ice bath to prevent excess heating. After grinding, samples were centrifuged at 500 gn for 3 min. Supernatant was removed with a Pasteur pipette, and the ground sample was rehydrated with 2 mL of tetrahydrofuran. Samples were ground and centrifuged a second time and the supernatant was removed. This was repeated two additional times for a total of four grind and centrifuge cycles. The supernatant was evaporated to 0.5 mL under nitrogen gas (N2), brought to 5 mL with acetone, then transferred to and sealed in 1.8 mL amber autosampler vials. Samples were stored at −20 °C until analysis.

2.3. HPLC Analysis

High-performance liquid chromatography (HPLC) quantification was performed using an Agilent 1200 series HPLC (Agilent, Santa Clara, CA, USA) system equipped with a C30, 4.6 × 250 mm column according to Kopsell and Sams [22]. Samples ran for 58 min with 1.0 mL mobile phase·minute−1 flow rate. The mobile phase contained 88.99% methanol, 11.00% methyl tert-butyl ether, and 0.01% triethylamine by volume. ChemStation software was used to integrate peaks, which were assigned compounds based on retention time comparison with external standards (Sigma–Aldrich, Darmstadt, Germany).

2.4. Data Collection and Statistical Analyses

The experiment was organized in a randomized complete block design where seedling light treatments were applied in separate growth chambers. The transplant stage was organized in a completely randomized design. The experiment was conducted three times over time. At 14 and 35 days after sowing, at transplant and harvest, the width at the widest point, height from substrate surface to the highest point of the plant, leaf number, and fresh mass of 10 plants per treatment were measured and recorded. Four samples per treatment were stored in a −80 °C freezer, then freeze-dried for phytonutrient quantification and six samples per treatment were placed in a forced-air drier at 60 °C for at least 72 h. Both freeze-dried and oven-dried samples were weighed, and dry mass was recorded. For morphological and phytochemical data, analysis of variance was performed using JMP (version 16; SAS Institute Inc., Cary, NC, USA). Significant relationships p ≤ 0.05 are reported. Linear and quadratic regression analyses were conducted using JMP and quadratic plateau regression analyses (Equation (1)) were conducted using R (Version 4.1.2).
y = x < X 0 ,   a + b x b x 2 2 X 0 x X 0 ,   a + bX 0 2  
where:
X 0 = light saturation point
x = photosynthetic photon flux density (PPFD; µmol·m−2·s−1)

3. Results

3.1. Seedlings

At transplant, 14 days after sowing, seedling fresh and dry mass, dry matter concentration, leaf number, and stem diameter increased as light intensity increased, while plant height decreased (Figure 1A–F). As light intensity increased from 60 to 600 µmol·m−2·s−1, seedling fresh and dry mass, dry matter concentration, leaf numbers, and stem thickness increased quadratically by 0.6 g, 0.04 g, and 39.3 g·kg−1, 1 leaf, and 0.7 mm, respectively (Figure 1A–E; Table 3). Plant height decreased quadratically by 2.2 cm as light intensity increased from 60 to 200 µmol·m−2·s−1, then plateaued (Figure 1F; Table 3). The calculated light saturation point for height reduction was 288 µmol·m−2·s−1 (Table 3).
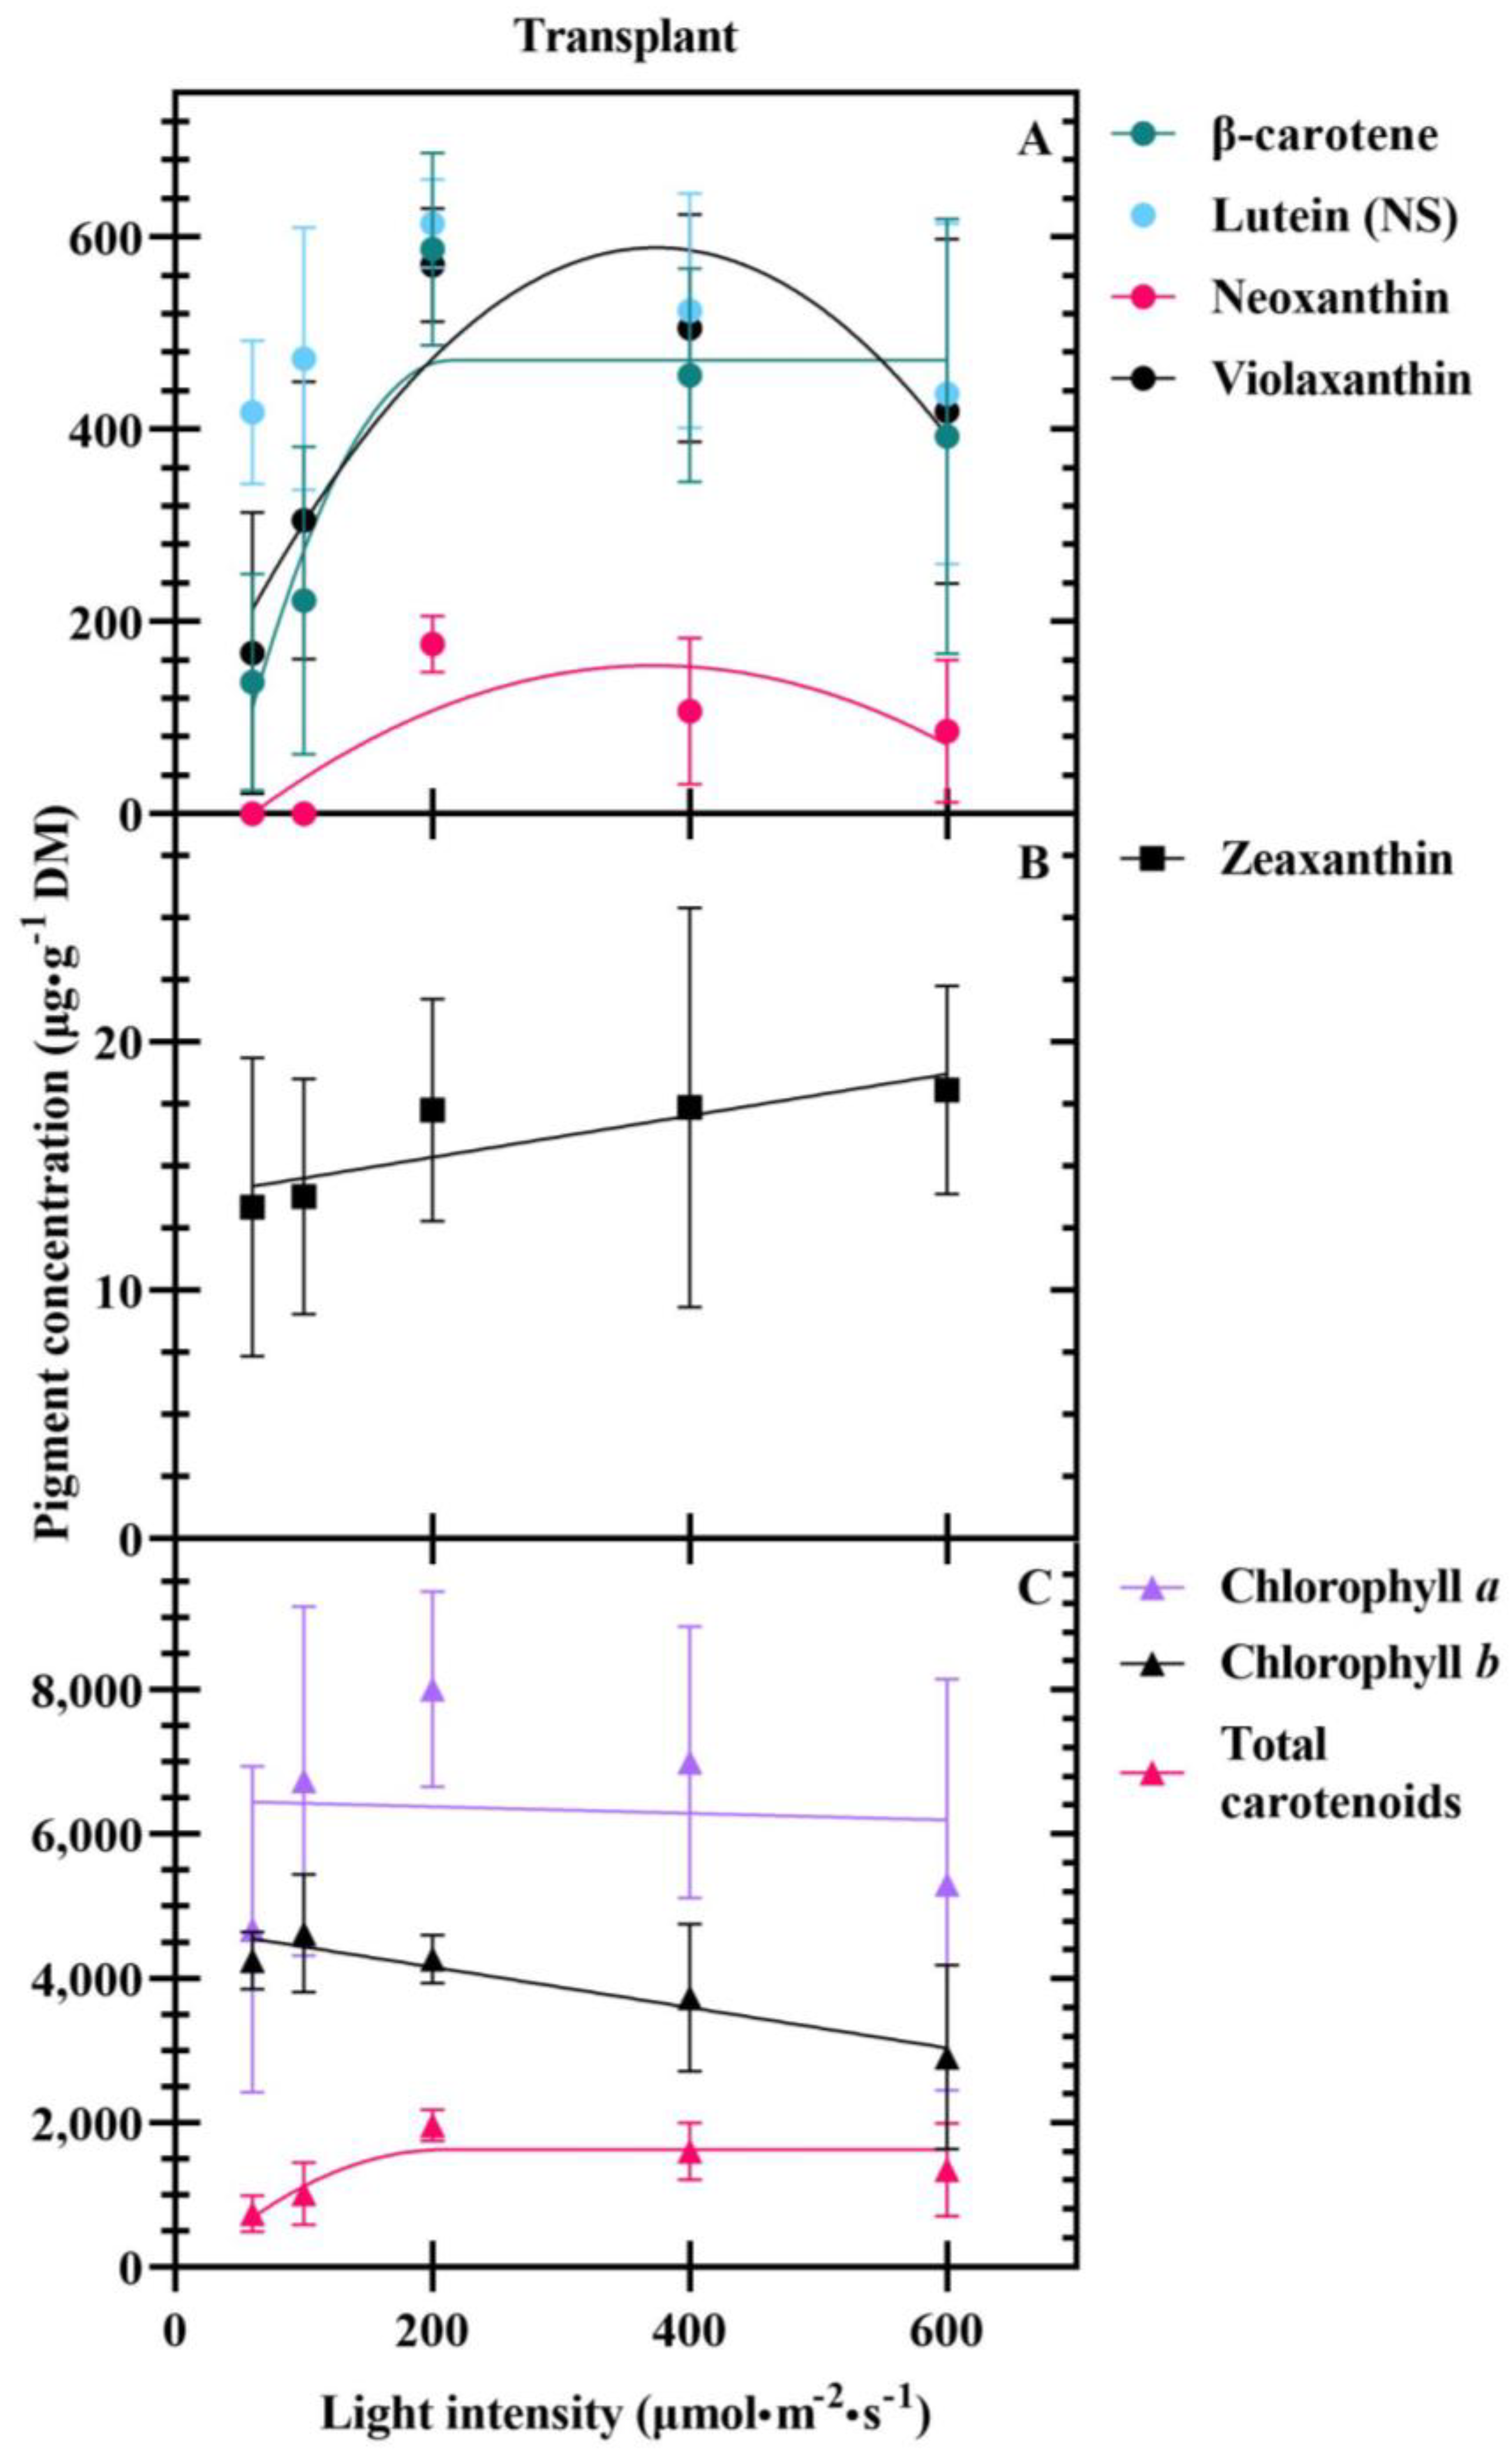
Seedling chlorophyll and carotenoid concentrations were also influenced by light intensity. As light intensity increased from 60 to 200 µmol·m−2·s−1, neoxanthin and violaxanthin concentrations increased quadratically by 404 and 177 μg·g−1, respectively, but decreased 152 and 91 μg·g−1, respectively, as light intensity further increased to 600 µmol·m−2·s−1 (Figure 2A; Table 3). Β-carotene concentrations exhibited a quadratic plateau response to light intensity; as intensity increased from 60 to 200 µmol·m−2·s−1, concentrations increased by 450 μg·g−1, then plateaued as light intensity further increased (Figure 2A; Table 3). Zeaxanthin concentrations increased linearly by 5 μg·g−1 as light intensity increased from 60 to 600 µmol·m−2·s−1 (Figure 2B; Table 3). Total carotenoid concentration exhibited a quadratic plateau response as well, increasing in concentration up to 200 µmol·m−2·s−1, then plateauing (Figure 2C; Table 3). In contrast, chlorophyll b concentrations decreased linearly by 1344 μg·g−1 as light intensity increased from 60 to 600 µmol·m−2·s−1; and chlorophyll a, and lutein concentrations were not influenced by light (Figure 2A,C; Table 3).
Lutein, chlorophyll a and b, and total carotenoid content per plant exhibited a quadratic plateau response to light intensity. As intensity increased from 60 to 400 µmol·m−2·s−1, content increased by 18, 241, 123, and 39 µg·plant−1, respectively, then plateaued as light intensity further increased (Figure 3A,C; Table 3). The calculated light saturation points were 369, 350, 365, and 356 µmol·m−2·s−1, respectively (Table 3). Β-carotene, violaxanthin, neoxanthin, and zeaxanthin content per plant was not influenced by light intensity (Figure 3A,B).

3.2. Harvest

At harvest, 21 days after transplanting seedlings in a common greenhouse environment, differences in leaf numbers, plant height, and shoot fresh and dry mass persisted while dry matter concentration differences did not (Figure 4A–D). As light intensity increased from 60 to 400 µmol·m−2·s−1, leaf numbers and shoot fresh and dry mass increased by 13 leaves, 103 g, and 2.5 g with calculated saturation points of 327, 295, and 301 µmol·m−2·s−1, respectively (Figure 4A–C; Table 4). As light intensity further increased, leaf numbers and fresh mass remained the same. Plant height increased quadratically by 2.1 cm as intensity increased from 60 to 600 µmol·m−2·s−1 (Figure 4D; Table 4).
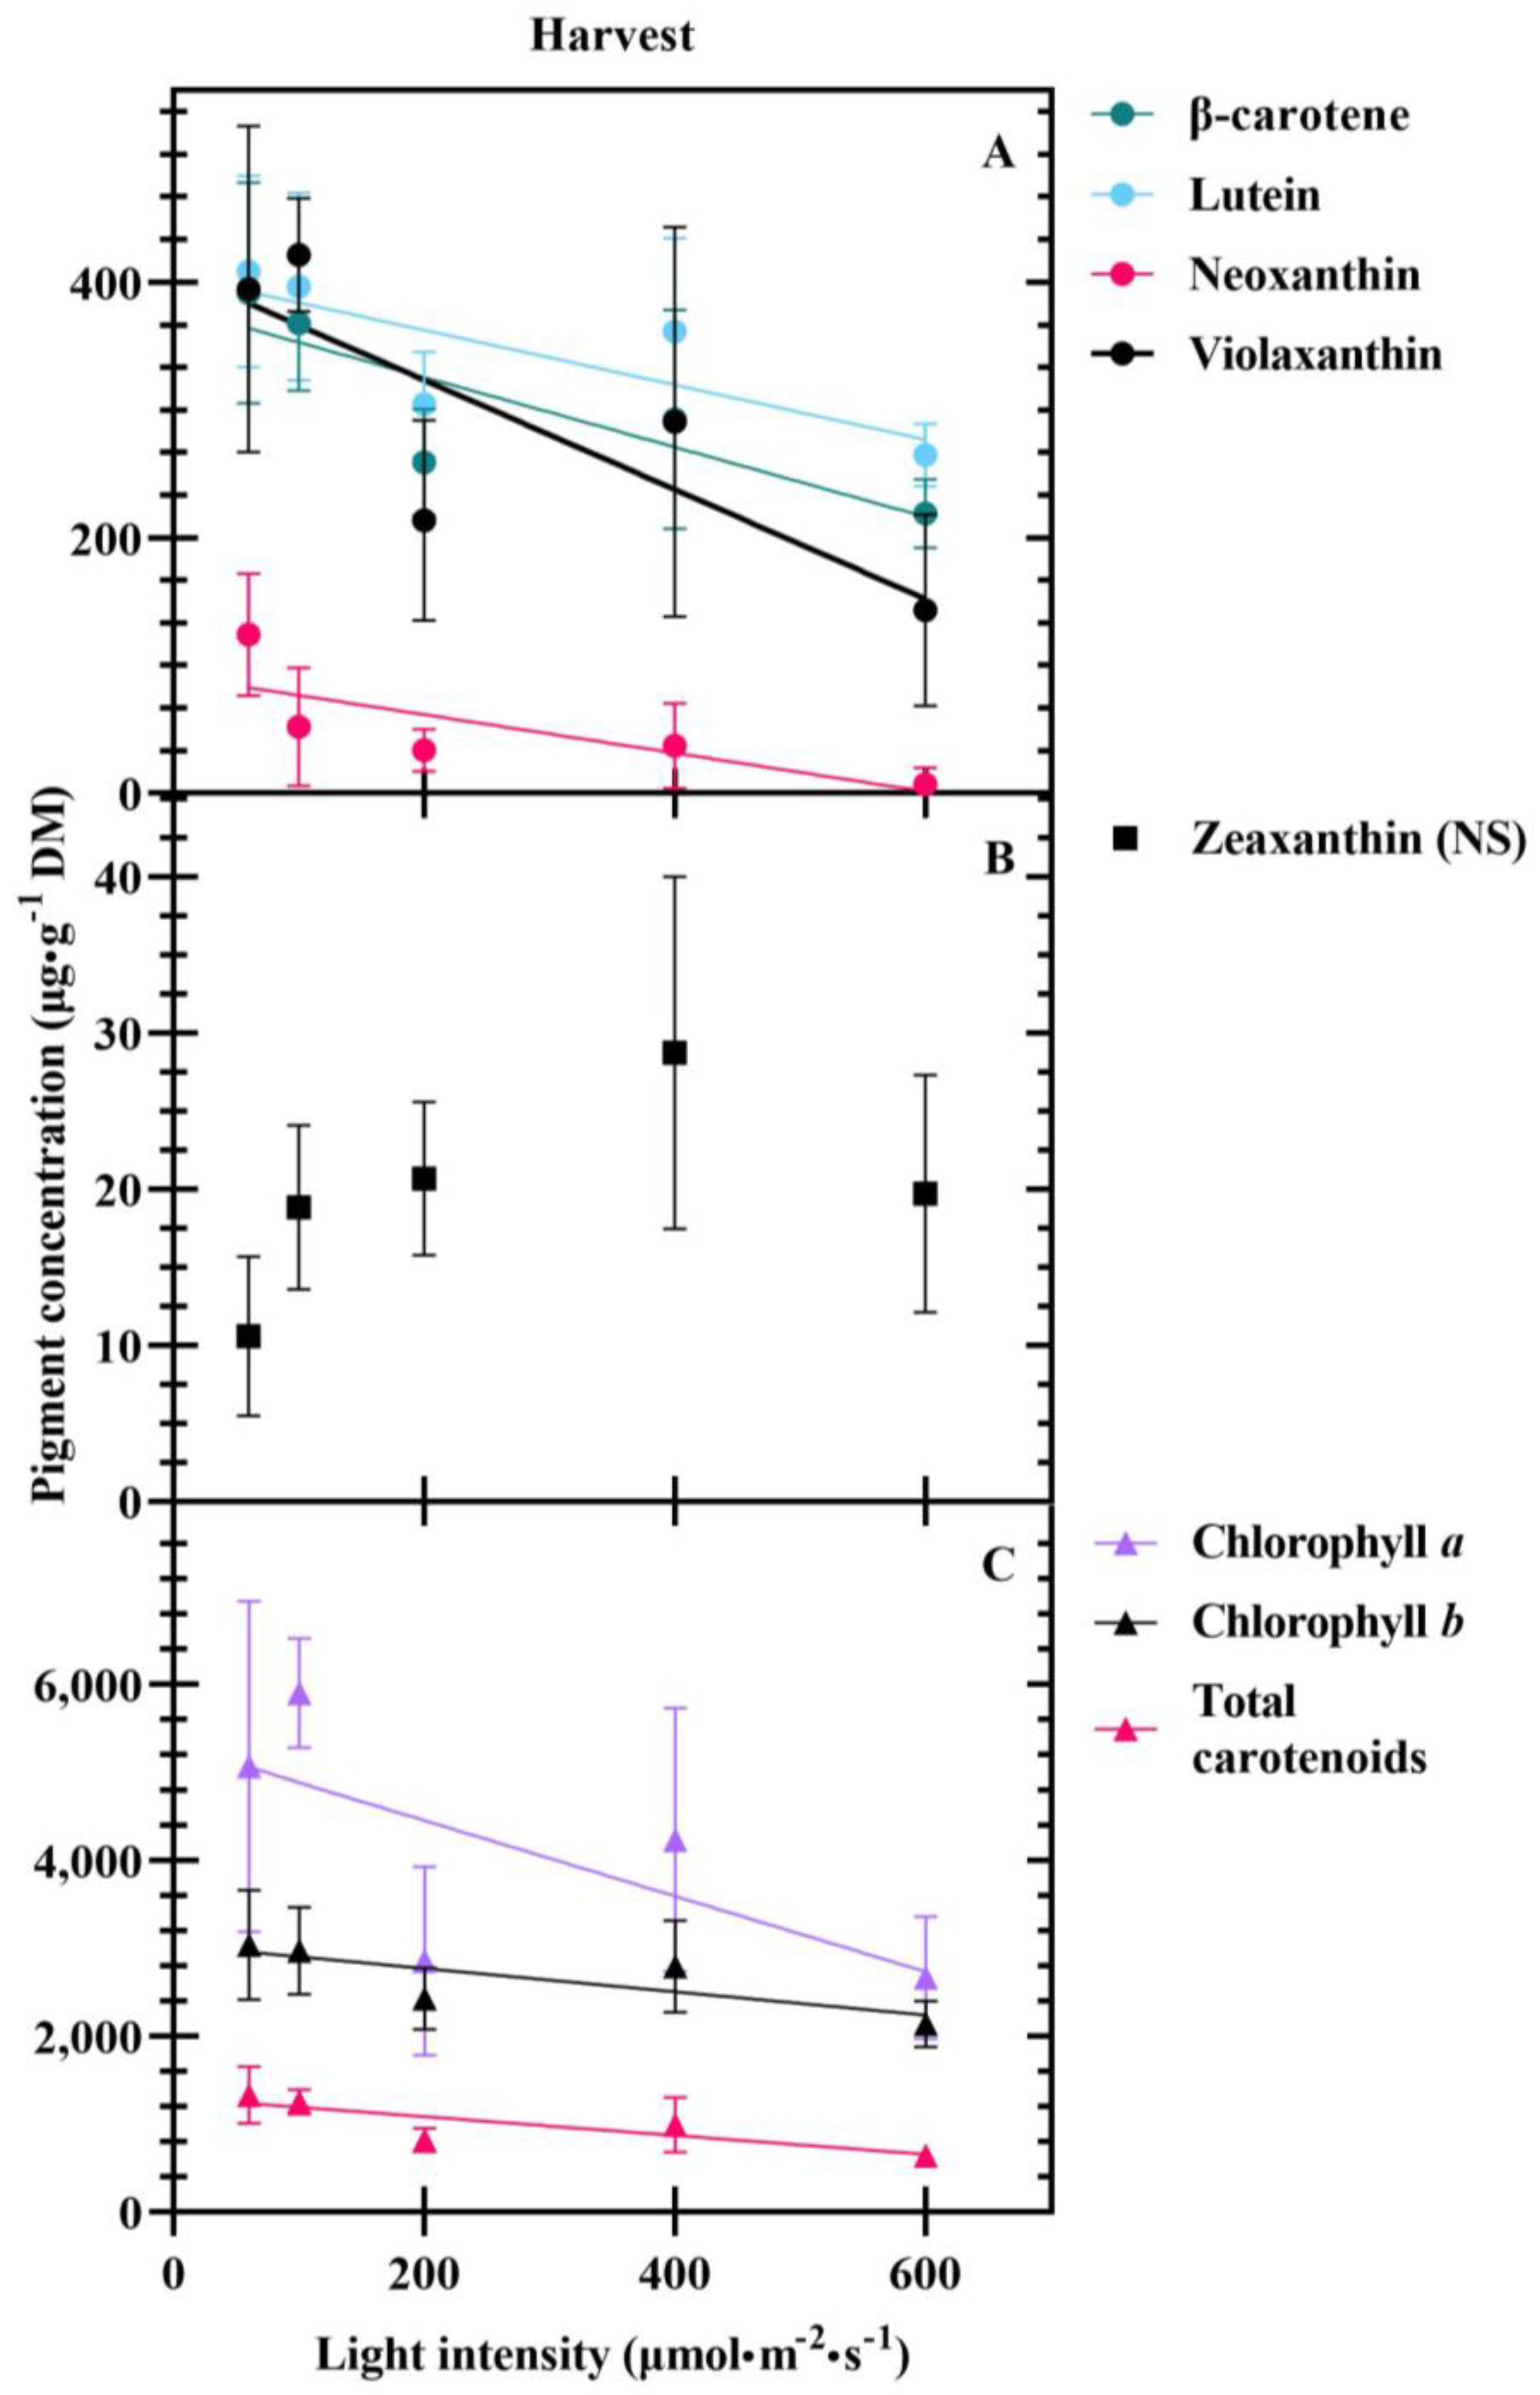
At harvest, some differences in carotenoid and chlorophyll concentrations due to propagation light intensity persisted. Β-carotene, lutein, neoxanthin, violaxanthin, chlorophylls a and b, and total carotenoid concentrations decreased linearly by 173, 144, 117, 251, 2396, 899, and 688 μg·g−1, respectively, as light intensity during propagation increased from 60 to 600 µmol·m−2·s−1 (Figure 5A,C; Table 4). Harvest zeaxanthin concentrations displayed no significant difference across seedling lighting treatments (Figure 5B).
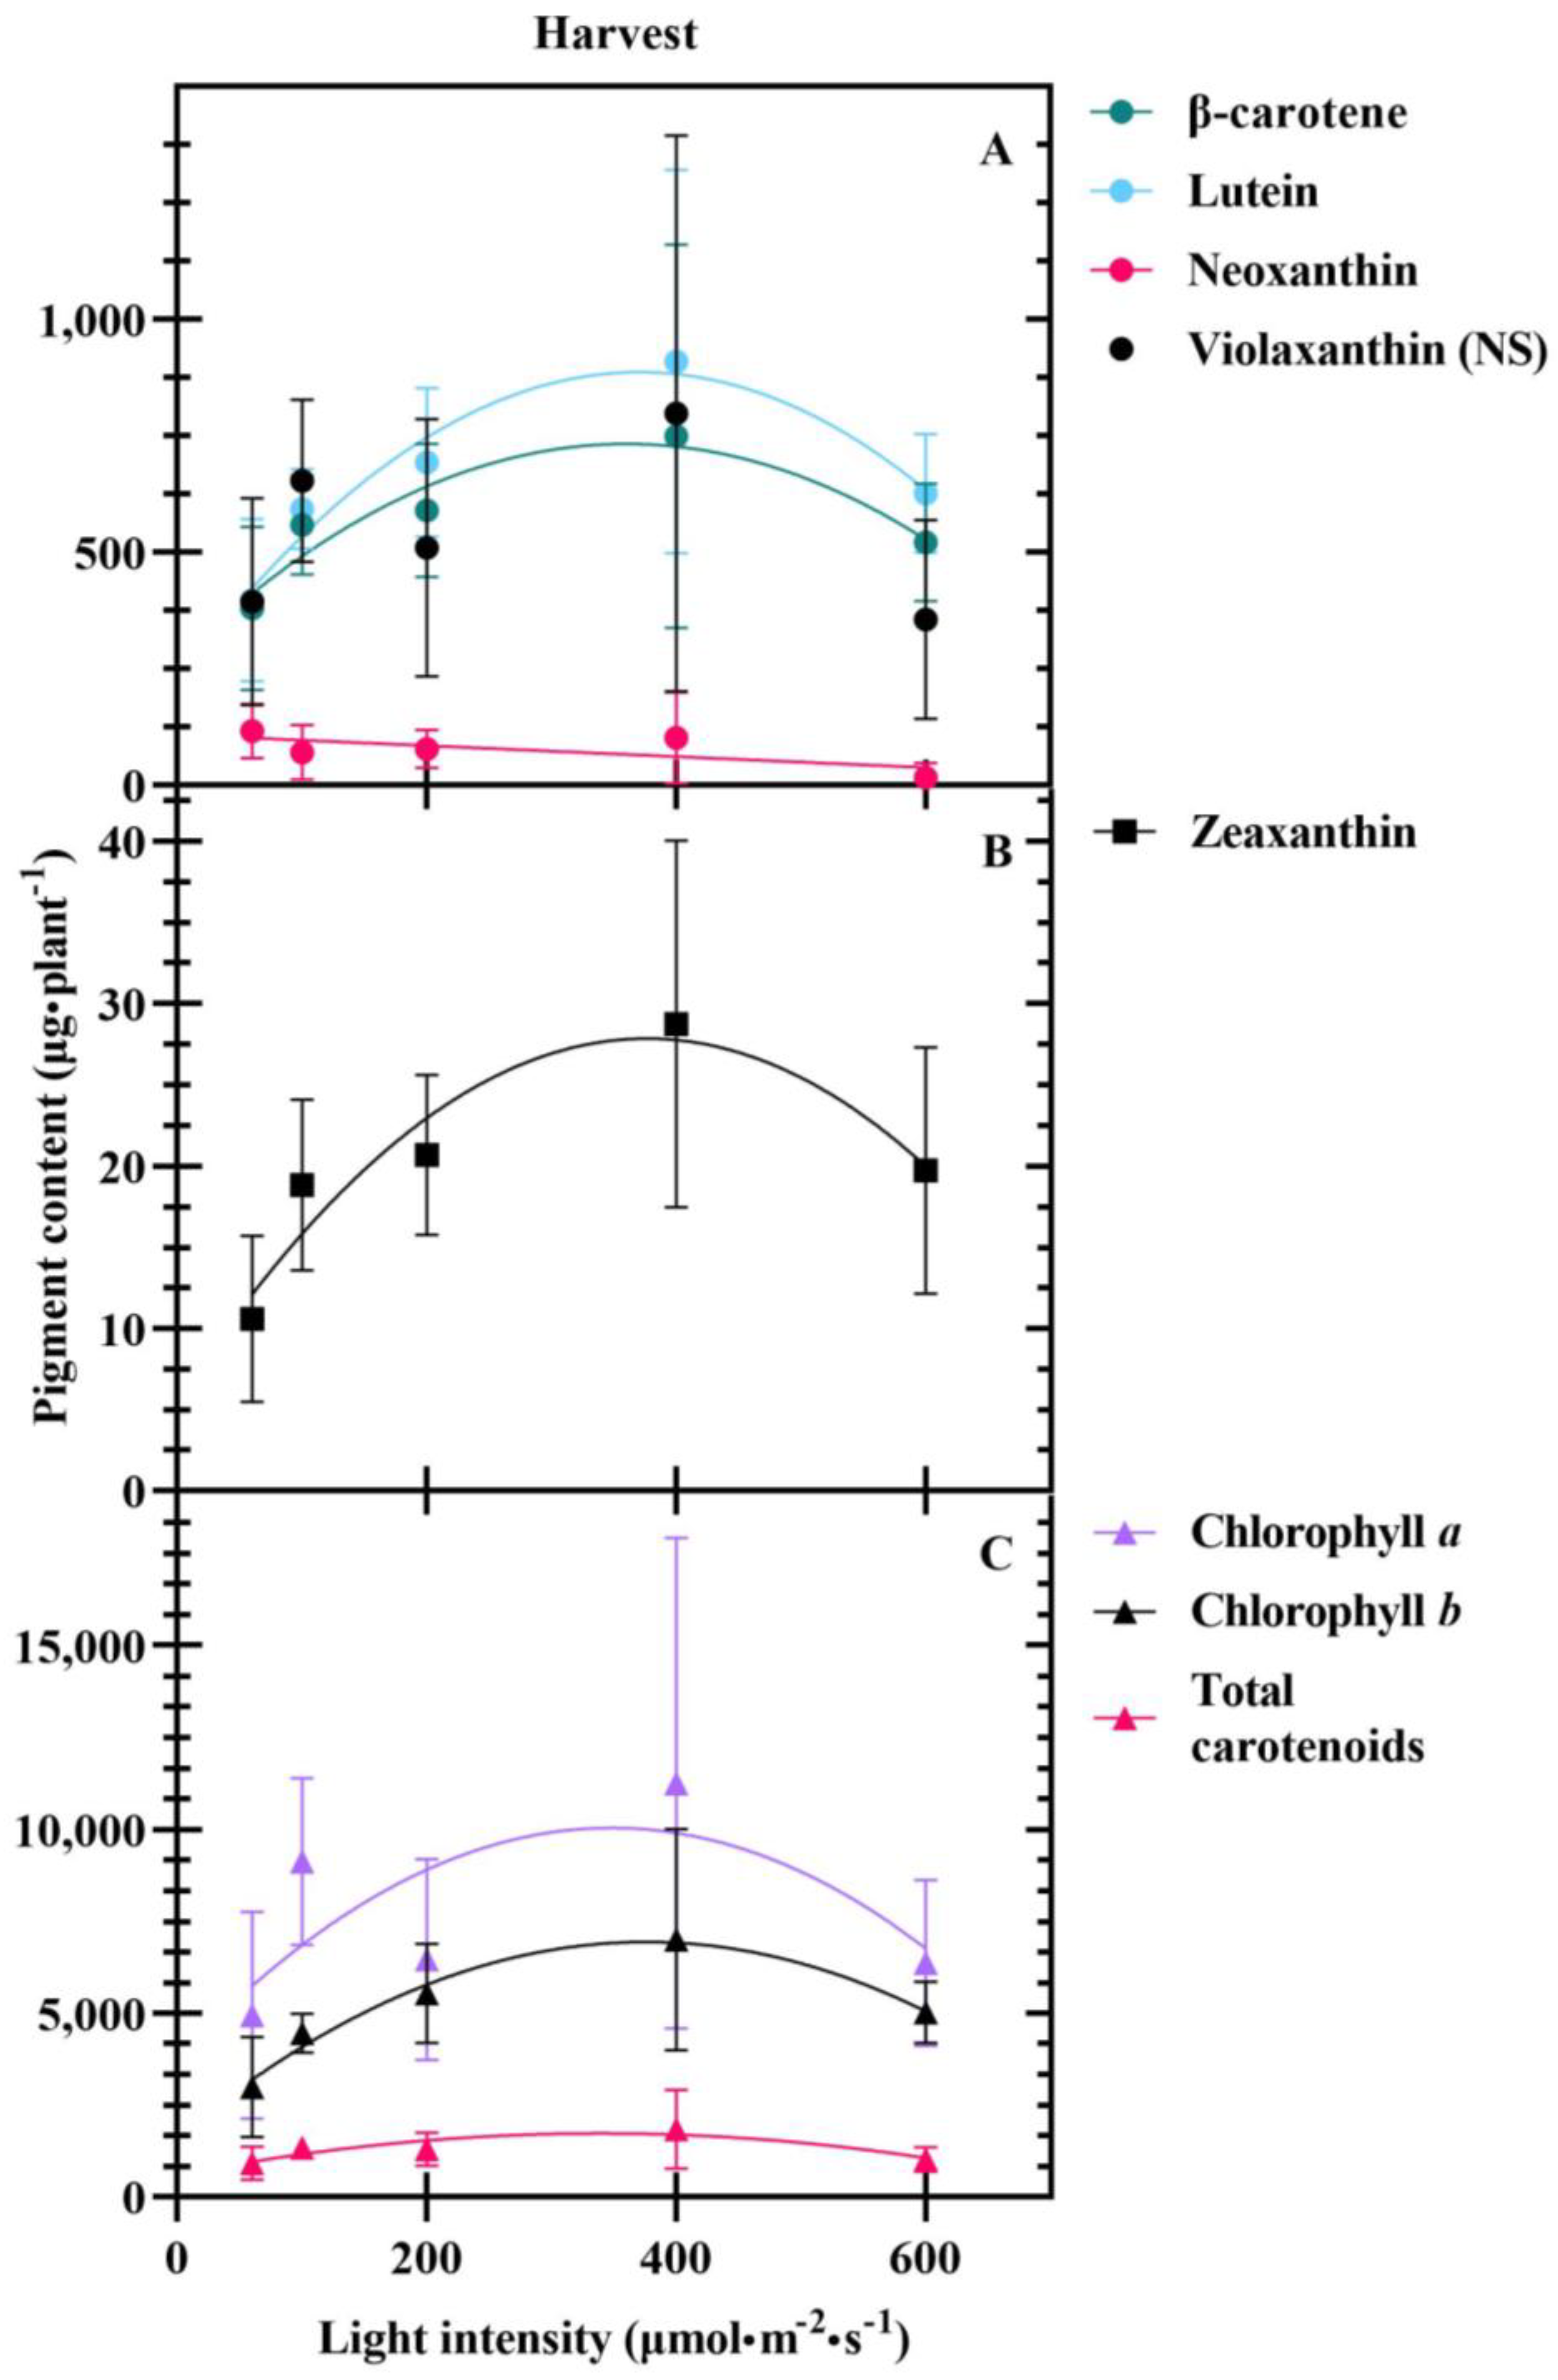
At harvest, β-carotene, lutein, zeaxanthin, chlorophylls a and b, and total carotenoid content per plant exhibited a positive quadratic response to increasing light intensity while neoxanthin exhibited a linear decrease of 100 µg·plant−1 (Figure 6A–C; Table 4). As intensity increased from 60 to 400, content increased by 370, 512, 18, 6304, 4015, and 919 µg·plant−1, respectively.

4. Discussion

4.1. Yield at Transplant and Harvest Increases with DLI to A Point

Increasing the DLI from 5.2 to 51.8 mol·m−2·d−1 (60 to 600 µmol·m−2·s−1) during ‘Rex’ seedling production increased fresh and dry mass by 475% and 1050%, respectively (Figure 1A,B; Table 3). However, the fresh mass increase from 400 to 600 µmol·m−2·s−1 (0.06 g) was not as great as the increase from 200 to 400 µmol·m−2·s−1 (0.18 g). Seedling yield trends observed in our study are consistent with previous research. Sago [5] found that increasing DLI from 13.0 to 25.9 mol·m−2·d−1 increased 35-day old butterhead lettuce ‘Pansoma’ dry mass by 86%. Further, Kelly et al. [23] reported a near 100% increase in 27-day old lettuce ‘Rex’ fresh mass, when raising DLI from 6.9 to 15.6 mol·m−2·d−1. In each case, increasing DLIs produced positive outcomes; however, these studies did not investigate DLIs as high as 51.8 mol·m−2·d−1. Malondialdehyde, a compound used to predict stress, has been shown to increase in lettuce exposed to 600 µmol·m−2·s−1, thus our higher light intensity treatments may have been deleterious [24].
A 174% and 159% increase in ‘Rex’ fresh and dry mass, respectively, persisted through harvest as propagation DLI increased from 5.2 to 34.6 mol·m−2·d−1 (Figure 4A,B; Table 4). This increase was attenuated relative to the transplant response due to 21 days of production in a common greenhouse environment. However, this yield increase is still significant from a production perspective. This response has been observed in other crops; for example, as the DLI increased from 5.8 to 34.6 mol·m−2·d−1, basil seedling fresh mass increased 284% [9]. When transplanted into a common greenhouse environment, an 80% increase in basil fresh mass persisted. Our results also align with previous lettuce research investigating DLI modification throughout the entire production duration. For example, Yan et al. [25] reported a 134% enhancement in 40-d old purple lettuce ‘Ziwei’ fresh mass under 15.1 mol·m−2·d−1 (300 µmol·m−2·s−1) versus 5.0 mol·m−2·d−1 (100 µmol·m−2·s−1), consistent with our observed 174% fresh mass increase as the DLI increased from 5.2 to 34.6 mol·m−2·d−1 (60 to 400 µmol·m−2·s−1). A nonsignificant yield difference between 400 and 600 µmol·m−2·s−1 (20.2 to 30.2 mol·m−2·d−1) has also been previously described in ‘Lvling’ green leaf lettuce [26]. Our results indicate that a DLI of at least 25.5 to 34.6 mol·m−2·d−1 during lettuce seedling production promotes the greatest harvestable fresh mass.

4.2. DLI Alters Plant Morphology

Plant development, including leaf unfolding rate, increases with higher DLIs. We observed a 53% leaf number increase from 5.2 to 34.6 mol·m−2·d−1 (Figure 1D; Table 3), whereas Dai et al. [6] found increasing the DLI from 6.9 to 34.8 mol·m−2·d−1 promoted a near 100% increase in ‘Beizishing No. 3′ lettuce leaf numbers. Additionally, Sago [5] found that increasing the DLI from 13.0 to 25.9 mol·m−2·d−1 nearly doubled leaf numbers in 30 day–old ‘Pansoma’ butterhead lettuce. These discrepancies in leaf number magnitude most likely resulted from production time, theirs being 25 or 30 days versus ours at 14 days, resulting in similar leaf unfolding rates.
Our leaf number increases were greater at harvest. We observed a 60% increase in leaf numbers at harvest as seedling DLI increased from 5.2 to 34.6 mol·m−2·d−1 (Figure 4C). Increasing leaf numbers at transplant, assuming roughly equal size and light exposure, could have provided greater light capture in the common greenhouse environment. Light capture directly impacts photosynthesis, which influences yield. Hastened plant development due to seedling DLI has been demonstrated in floriculture crops. For example, increasing propagation DLI from 4.1 to 14.2 mol·m−2·d−1 hastened flowering for celosia (Celosia argentea var. plumosa), impatiens (Impatiens walleriana), French marigold (Tagetes patula), and pansy (Viola tricolor) [27]. Additionally, greater basil node and branch numbers from increasing the DLI from 5.8 to 34.6 mol·m−2·d−1 during seedling production persisted through harvest in a common greenhouse environment [9].
As the DLI increased, ‘Rex’ seedlings were more compact (Figure 1F; Table 3). Low-light environments induce shade-avoidance responses, eliciting seedling elongation [28]. For example, young tomato plants were 12.8 cm tall when grown under 23.8 mol·m−2·d−1 but were 22.4 cm tall when grown under a much lower DLI of 2.2 mol·m−2·d−1. Even though plants grown under 23.8 mol·m−2·d−1 were 9.6 cm shorter, they had over double the fresh mass versus seedlings grown under 2.2 mol·m−2·d−1. Our height trends reversed relative to seedlings, with a 17% increase from 5.2 to 17.3 mol·m−2·d−1 (60 to 200 µmol·m−2·s−1), which agrees with established findings. This is likely due to increased overall growth of older plants.

4.3. Carotenoids Are Differentially Impacted at Transplant and Harvest

Seedling pigment concentrations and contents were highly influenced by light intensity treatments and followed similar trends to one another (Figure 2A–C and Figure 3A–C; Table 3). Exposure to 400 to 600 µmol·m−2·s−1 (34.6 to 51.8 mol·m−2·d−1) potentially induced oxidative stress, thus increasing xanthophyll concentrations, though this could have also oxidized carotenoids [29]. High violaxanthin to zeaxanthin ratios, as we observed, generally indicate a lower irradiance condition, though this was conserved across all light treatments. This could have resulted from our harvesting method, as the xanthophyll cycle epoxidation state is highly dynamic, and changes rapidly due to shifting light conditions [30].
Kopsell et al. [21] reported decreased kale (Brassica oleracea) seedling chlorophyll b concentrations, from 0.104 to 0.0855 mg·g−1, when increasing the DLI from 13.9 to 23.3 mol·m−2·d−1 (275 to 463 µmol·m−2·s−1; 14–h photoperiod), which aligns with our 0.043 to 0.029 mg·g−1 decrease from a DLI of 17.3 to 51.8 mol·m−2·d−1 (200 to 600 µmol·m−2·s−1; Figure 2C). Our seedlings were also produced under constant lighting, removing the dark period during which PIFs and COP1 accumulate and downregulate carotenoid biosynthesis, possibly enhancing treatment effects [20]. However, treatment effects could have been blunted by the 24-h photoperiod, which has also been shown to decrease carotenoid concentrations, likely due to photooxidation [31].
At harvest, carotenoid and chlorophyll concentrations generally decreased with increasing light intensity (Figure 5A–C; Table 4), opposite from the trend at transplant and opposite of our original hypothesis. During finishing in the greenhouse, plants were exposed to a 16-h photoperiod as opposed to the 24-h photoperiod during seedling production. A more standard circadian rhythm with a scotoperiod could have impacted carotenoid accumulation [20]. Additionally, the greenhouse DLI averaged 16.6 mol·m−2·d−1 across replications, lower than our two highest seedling treatments (Table 1 and Table 2). In addition, whole shoots were freeze dried and homogenized prior to carotenoid extractions and analyses. If stems were considerably more massive in higher light treatment plants, this could have “diluted” pigment concentrations, as stem tissue generally contains fewer carotenoids compared with leaves. Increased interest in CEA dynamic environmental control and shifting focus from solely on yield, but also nutritional quality, indicates a thorough evaluation of why this opposite carotenoid trend occurred is needed to determine better how light intensity can be best leveraged for biofortification.
Harvest carotenoid and chlorophyll content trends were roughly opposite to concentration trends (Figure 6A–C; Table 4). The 174% increase in harvest fresh mass from seedlings grown under 60 to 400 µmol·m−2·s−1 (5.2 to 34.6 mol·m−2·d−1) explains this. Content is defined as the total amount of a given pigment in an entire plant’s shoot tissue (mg·plant−1), calculated by multiplying the pigment’s concentration and the sample’s freeze-dried plant mass. Such a marked increase in fresh mass could have been dilutional to concentrations while still evincing an overall increase in carotenoid content.

5. Conclusions

Production light intensity is a simple but powerful vector for inducing plant yield and phytonutrient, specifically carotenoid, concentration responses. Targeted light intensity application during periods of high planting density may be a cost-effective method in increasing yield and phytonutrient content. Increasing light intensity during lettuce ‘Rex’ seedling production is a viable strategy for improving morphology and yield at harvest. To produce the greatest fresh mass at transplant and harvest, seedlings should be grown under light intensities from 295 to 400 µmol·m−2·s−1 for a 24-h photoperiod (25.5 to 34.6 mol·m−2·d−1). However, this strategy may decrease carotenoid concentrations at harvest. Further work will be necessary to elucidate what causes the harvest stage carotenoid response.

Author Contributions

S.R.G. performed the laboratory experiments and prepared the manuscript; D.S.D.M. performed the production experiments and aided in manuscript preparation; S.E.P. and A.G.R. conducted data analyses and reviewed the manuscript; C.E.S. reviewed the manuscript and provided support; and K.J.W. conceptualized and designed the study, obtained funding, and revised the manuscript. All authors have read and agreed to the published version of the manuscript.

Funding

This research was funded by the University of Tennessee Office of Undergraduate Research and the University of Tennessee Herbert Scholars Award.

Data Availability Statement

Data can be made available upon request by the corresponding author.

Acknowledgments

We would like to thank Jessica Kurtis for harvesting help, JR Peters for fertilizer, Hydrofarm for hydroponic production supplies, Oasis Grower Solutions for substrate.

Conflicts of Interest

The authors declare no conflict of interest.

References

  1. U.S. Department of Agriculture—National Agriculture Statistics Service (USDA–NASS). Vegetables 2019 Summary. 2020. Available online: https://www.nass.usda.gov/Publications/Todays_Reports/reports/vegean20.pdf (accessed on 29 April 2021).
  2. Eaves, J.; Eaves, S. Comparing the profitability of a greenhouse to a vertical farm in Quebec. Can. J. Agric. Econ. /Rev. Can. D’Agroeconomie 2018, 66, 43–54. [Google Scholar] [CrossRef]
  3. Hoops, G.P.; Olshansky, H.P.; Tavares, J.; Rosen, R. Copenhagen’s Case for Urban Farming: A Feasibility Study. Bachelor’s Thesis, Worcester Polytechnic Institute, Worcester, MA, USA, 2018. [Google Scholar]
  4. Zeidler, C.; Schubert, D.; Vrakking, V. Feasibility Study: Vertical Farm EDEN; DLR Institute of Space Systems, German Aerospece Center: Bremen, Germany, 2013. [Google Scholar]
  5. Sago, Y. Effects of light intensity and growth rate on tipburn development and leaf calcium concentration in butterhead lettuce. HortScience 2016, 51, 1087–1091. [Google Scholar] [CrossRef]
  6. Dai, L.; Zhang, X.; Teng, Y.; Gu, Y.; Chen, L.; Kong, X.; Han, Y. Asia Pacific Academy of Science Pte. Ltd. Available online: https://aber.apacsci.com/index.php/ama/article/view/2109 (accessed on 31 October 2022).
  7. Brechner, M.; Both, A.J.; Staff, C.E.A. Hydroponic Lettuce Handbook; Cornell Controlled Environment Agriculture: Ithica NY, USA, 1996; pp. 504–509. [Google Scholar]
  8. Lopez, R.; Runkle, E.S. Light Management in Controlled Environments; Meister Media Worldwide: Willoughby, OH, USA, 2017. [Google Scholar]
  9. Walters, K.J.; Lopez, R.G. Basil seedling production environment influences subsequent yield and flavor compound concentration during greenhouse production. PLoS ONE 2022, 17, e0273562. [Google Scholar] [CrossRef]
  10. Wiseman, E.M.; Bar-El Dadon, S.; Reifen, R. The vicious cycle of vitamin a deficiency: A review. Crit. Rev. Food Sci. Nutr. 2017, 57, 3703–3714. [Google Scholar] [CrossRef] [PubMed]
  11. Al-Babili, S.; Bouwmeester, H.J. Strigolactones, a novel carotenoid–derived plant hormone. Annu. Rev. Plant Biol. 2015, 66, 161–186. [Google Scholar] [CrossRef]
  12. Frank, H.A.; Brudvig, G.W. Redox functions of carotenoids in photosynthesis. Biochemistry 2004, 43, 8607–8615. [Google Scholar] [CrossRef]
  13. Amengual, J.; Gouranton, E.; van Helden, Y.G.J.; Hessel, S.; Ribot, J.; Kramer, E.; Kiec-Wilk, B.; Razny, U.; Lietz, G.; Wyss, A.; et al. Beta–carotene reduces body adiposity of mice via bcmo1. PLoS ONE 2011, 6, e20644. [Google Scholar] [CrossRef]
  14. Kim, Y.; Seo, J.H.; Kim, H. Β–carotene and lutein inhibit hydrogen peroxide–induced activation of nf–κb and il–8 expression in gastric epithelial ags cells. J. Nutr. Sci. Vitaminol. 2011, 57, 216–223. [Google Scholar] [CrossRef]
  15. Yao, N.; Yan, S.; Guo, Y.; Wang, H.; Li, X.; Wang, L.; Hu, W.; Li, B.; Cui, W. The association between carotenoids and subjects with overweight or obesity: A systematic review and meta–analysis. Food Funct. 2021, 12, 4768–4782. [Google Scholar] [CrossRef]
  16. Cheng, F.; Zhang, Q.; Yan, F.-F.; Wan, J.-F.; Lin, C.-S. Lutein protects against ischemia/reperfusion injury in rat skeletal muscle by modulating oxidative stress and inflammation. Immunopharmacol. Immunotoxicol. 2015, 37, 329–334. [Google Scholar] [CrossRef]
  17. Widomska, J. Why has nature chosen lutein and zeaxanthin to protect the retina? J. Clin. Exp. Ophthalmol. 2014, 5, 326. [Google Scholar] [CrossRef]
  18. Johnson, E.J.; Neuringer, M.; Russell, R.M.; Snodderly, D.M. Nutritional manipulation of primate retinas, iii: Effects of lutein or zeaxanthin supplementation on adipose tissue and retina of xathophyll-free monkeys. Investigative Ophtamol. Visual Sci. 2005, 46, 692. [Google Scholar] [CrossRef]
  19. Tu, W.; Wu, L.; Zhang, C.; Sun, R.; Wang, L.; Yang, W.; Yang, C.; Liu, C. Neoxanthin affects the stability of the C 2 S 2 M 2 -type photosystem II supercomplexes and the kinetics of state transition in Arabidopsis. Plant J. 2020, 104, 1724–1735. [Google Scholar] [CrossRef]
  20. Pizarro, L.; Stange, C. Light–dependent regulation of carotenoid biosynthesis in plants. Cienc. E Investig. Agrar. 2009, 36, 143–162. [Google Scholar] [CrossRef]
  21. Kopsell, D.A.; Pantanizopoulos, N.I.; Sams, C.E.; Kopsell, D.E. Shoot tissue pigment levels increase in ‘Florida Broadleaf’ mustard (Brassica juncea L.) microgreens following high light treatment. Sci. Hortic. 2012, 140, 96–99. [Google Scholar] [CrossRef]
  22. Kopsell, D.A.; Sams, C.E. Increases in shoot tissue pigments, glucosinolates, and mineral elements in sprouting broccoli after exposure to short-duration blue light from light emitting diodes. J. Amer. Soc. Hortic. Sci. 2013, 138, 31–37. [Google Scholar] [CrossRef]
  23. Kelly, N.; Choe, D.; Meng, Q.; Runkle, E.S. Promotion of lettuce growth under an increasing daily light integral depends on the combination of the photosynthetic photon flux density and photoperiod. Sci. Hortic. 2020, 272, 109565. [Google Scholar] [CrossRef]
  24. Weiguo, F.; Pingping, L.; Yanyou, W.; Jianjian, T. Effects of different light intensities on anti–oxidative enzyme activity, quality and biomass in lettuce. Hortic. Sci. 2012, 39, 129–134. [Google Scholar] [CrossRef]
  25. Yan, Z.; He, D.; Niu, G.; Zhou, Q.; Qu, Y. Growth, nutritional quality, and energy use efficiency of hydroponic lettuce as influenced by daily light integrals exposed to white versus white plus red light–emitting diodes. HortScience 2019, 54, 1737–1744. [Google Scholar] [CrossRef]
  26. Fu, W.; Li, P.; Wu, Y. Effects of different light intensities on chlorophyll fluorescence characteristics and yield in lettuce. Sci. Hortic. 2012, 135, 45–51. [Google Scholar] [CrossRef]
  27. Pramuk, L.A.; Runkle, E.S. Photosynthetic daily light integral during the seedling stage influences subsequent growth and flowering of Celosia, Impatiens, Salvia, Tagetes, and Viola. HortScience 2005, 40, 1099C–1099. [Google Scholar] [CrossRef]
  28. Fan, X.X.; Xu, Z.G.; Liu, X.Y.; Tang, C.M.; Wang, L.W.; Han, X.L. Effects of light intensity on the growth and leaf development of young tomato plants grown under a combination of red and blue light. Sci. Hortic. 2013, 153, 50–55. [Google Scholar] [CrossRef]
  29. Ramel, F.; Birtic, S.; Cuiné, S.; Triantaphylidès, C.; Ravanat, J.-L.; Havaux, M. Chemical quenching of singlet oxygen by carotenoids in plants. Plant Physiol. 2012, 158, 1267–1278. [Google Scholar] [CrossRef] [PubMed]
  30. Álvarez, D.; Voß, B.; Maass, D.; Wüst, F.; Schaub, P.; Beyer, P.; Welsch, R. Carotenogenesis is regulated by 5′utr–mediated translation of phytoene synthase splice variants. Plant Physiol. 2016, 172, 2314–2326. [Google Scholar] [CrossRef]
  31. Simkin, A.J.; Zhu, C.; Kuntz, M.; Sandmann, G. Light–dark regulation of carotenoid biosynthesis in pepper (Capsicum annuum) leaves. J. Plant Physiol. 2003, 160, 439–443. [Google Scholar] [CrossRef]
Figure 1. Fresh mass (A), dry mass (B), dry matter concentration (C), leaf number (D), stem diameter (E), and height (F) of 14-day old butterhead lettuce ‘Rex’ (Lactuca sativa) seedlings grown under light intensities of 60, 100, 200, 400, or 600 µmol·m−2·s−1 for a 24-h photoperiod. Each symbol represents the mean of 30 plants ± SE. Lines represent linear, quadratic, or quadratic plateau regression. Equations and significance are reported in Table 3.
Horticulturae 09 00223 g001
Figure 2. Concentrations [µg·g−1 dry mass (DM)] of β-carotene, lutein, neoxanthin, and violaxanthin (A), zeaxanthin (B), chlorophyll a and b, and total carotenoids (C) of 14-day old butterhead lettuce ‘Rex’ (Lactuca sativa) seedlings grown under light intensities of 60, 100, 200, 400, or 600 µmol·m−2·s−1 for a 24-h photoperiod. Each symbol represents the mean of 12 plants ± SE. Lines represent linear, quadratic, or quadratic plateau regression. Equations and significance are reported in Table 3.
Horticulturae 09 00223 g002
Figure 3. Content (µg·plant−1) of β-carotene, lutein, neoxanthin, and violaxanthin (A), zeaxanthin (B), chlorophyll a and b, and total carotenoids (C) of 14-day old butterhead lettuce ‘Rex’ (Lactuca sativa) seedlings grown under light intensities of 60, 100, 200, 400, or 600 µmol·m−2·s−1 for a 24-h photoperiod. Each symbol represents the mean of 12 plants ± SE. Lines represent linear, quadratic, or quadratic plateau regression. Equations and significance are reported in Table 3.
Horticulturae 09 00223 g003
Figure 4. Fresh mass (A), dry mass (B), dry matter concentration (C), leaf number (D) of butterhead lettuce ‘Rex’ (Lactuca sativa) seedlings grown under light intensities of 60, 100, 200, 400, or 600 µmol·m−2·s−1 for a 24-h photoperiod for 14 d and then transplanted into a common greenhouse environment and grown for 21 d. Each symbol represents the mean of 30 plants ± SE. Lines represent linear, quadratic, or quadratic plateau regression. Equations and significance are reported in Table 4.
Horticulturae 09 00223 g004
Figure 5. Concentrations [µg·g−1 dry mass (DM)] of β-carotene, lutein, neoxanthin, and violaxanthin (A), zeaxanthin (B), chlorophyll a and b, and total carotenoids (C) of butterhead lettuce ‘Rex’ (Lactuca sativa) seedlings grown under light intensities of 60, 100, 200, 400, or 600 µmol·m−2·s−1 for a 24-h photoperiod for 14 d and then transplanted into a common greenhouse environment and grown for 21 d. Each symbol represents the mean of 12 plants ± SE. Lines represent linear, quadratic, or quadratic plateau regression. Equations and significance are reported in Table 4.
Horticulturae 09 00223 g005
Figure 6. Content (µg·plant−1) of β-carotene, lutein, neoxanthin, and violaxanthin (A), zeaxanthin (B), chlorophyll a and b, and total carotenoids (C) of butterhead lettuce ‘Rex’ (Lactuca sativa) seedlings grown under light intensities of 60, 100, 200, 400, or 600 µmol·m−2·s−1 for a 24-h photoperiod for 14 d and then transplanted into a common greenhouse environment and grown for 21 d. Each symbol represents the mean of 12 plants ± SE. Lines represent linear, quadratic, or quadratic plateau regression. Equations and significance are reported in Table 4.
Horticulturae 09 00223 g006
Table 1. Target and actual light intensity (±sd) and daily light integral (DLI) (±sd) during the seedling growth stage (14 d) of lettuce ‘Rex’ (Lactuca sativa L.) over three replications in time.
Light Intensity
(µmol·m−2·s−1)
DLI
(mol·m−2·d−1)
TargetActual
6062 ± 35.4
100103 ± 48.9
200196 ± 616.9
400415 ± 735.9
600610 ± 1352.7
Table 2. The date of lettuce ‘Rex’ (Lactuca sativa L.) transplant, daily light integral (DLI) (± sd), and average daily air temperature (± sd) during the finishing growth stage (21 d).
Rep.Transplant DateDLI
(mol·m−2·d−1)
Air Temperature
(°C)
119 December 202015.5 ± 1.221.8 ± 1.2
217 January 202118.3 ± 2.723.5 ± 0.8
316 February 202116.0 ± 1.623.1 ± 1.3
Table 3. Regression analysis parameters and R2 for butterhead lettuce ‘Rex’ (Lactuca sativa) growth, development, and carotenoid and chlorophyll concentrations and content at transplant in response to seedlings grown under light intensities of 60, 100, 200, 400, or 600 µmol·m−2·s−1 for a 24-h photoperiod for 14 d. x = photosynthetic photon flux density (PPFD; µmol·m−2·s−1). X 0 = light saturation point.
( y ) Parameterabc X 0 R2
Fresh mass (g)0.17 z1.32 × 10−3−2.55 × 10⁻⁶ 0.752
(0.02) y(6.64 × 10⁻⁵)(3.75 × 10⁻⁷)
Dry mass (g)2.34 × 10−38.77 × 10−5−8.91 × 10⁻⁸ 0.816
(1.08 × 10⁻³)(3.94 × 10⁻⁶)(2.23 × 10⁻⁸)
Dry mass conc. (g·kg−1)29.050.08−7.96 × 10⁻⁵ 0.675
(1.40)(0.01)(2.87 × 10⁻⁵)
Stem diameter (mm)0.651.58 × 10−3(−2.11 × 10⁻⁶) 0.607
(0.04)(1.43 × 10⁻⁴)(8.04 × 10⁻⁷)
Leaf number1.932.65 × 10−3−3.57 × 10⁻⁶ 0.646
(0.05)(1.80 × 10⁻⁴)(1.02 × 10⁻⁶)
Height (cm)7.90−0.03 287.930.641
(0.34)(0.01) (30.42)
β–carotene conc. (µg·g−1 DM)−226.246.52 214.100.464
(−228.45)(4.02) (68.75)
Neoxanthin conc. (µg·g−1 DM)52.330.32−1.59 × 10⁻³ 0.425
(16.48)(0.06)(3.38 × 10⁻⁴)
Violaxanthin conc. (µg·g−1 DM)337.710.78−3.83 × 10⁻³ 0.458
(37.65)(−0.14)(7.73 × 10⁻⁴)
Zeaxanthin conc. (µg·g−1 DM)13.680.01 0.088
(1.39)(0.00)
Chlorophyll b conc. (µg·g−1 DM)
4724.16−2.81 0.322
(210.51)(0.62)
Total carotenoid conc. (µg·g−1 DM)
−230.0717.74 209.520.424
(677.77)(12.05) (72.49)
Lutein content (µg·plant−1)
−7.940.15 369.090.709
(3.29)(0.04) (63.22)
Chlorophyll a content (µg·plant−1)
−108.262.05 350.210.643
(−51.03)(0.62) (67.93)
Chlorophyll b content (µg·plant−1)
−46.221.00 365.370.646
(25.04)(0.30) (71.78)
Total carotenoid content (µg·plant−1)
−20.480.36 355.900.699
(7.78)(0.10) (61.18)
z Coefficients for model equations used to generate Figure 1, Figure 2 and Figure 3. Linear: y = a + b x . Quadratic: y = a + b x + c x 2 . Quadratic Plateau: if x < X 0 ,     y = a + b x b x 2 2 X 0 , if x X 0 ,     y = a + bX 0 2 . y Standard error (SE).
Table 4. Regression analysis parameters and R2 for butterhead lettuce ‘Rex’ (Lactuca sativa) growth, development, and carotenoid and chlorophyll concentrations and content at harvest in response to seedlings grown under light intensities of 60, 100, 200, 400, or 600 µmol·m−2·s−1 for a 24-h photoperiod for 14 d and then transplanted into a common greenhouse environment and grown for 21 d. x = photosynthetic photon flux density (PPFD; µmol·m−2·s−1). X 0 = light saturation point.
( y ) Parameter abc X 0 R2
Fresh mass (g)−5.49 z1.14 294.890.859
(7.26) y(0.10) (16.07)
Dry mass (g)0.010.03 300.920.438
(0.52)(0.01) (45.85)
Leaf number15.370.13 326.910.720
(1.32)(0.02) (27.89)
Height (cm)13.144.65 × 10−3−1.63 × 10⁻⁵ 0.166
(0.24)(8.60 × 10⁻⁴)(4.83 × 10⁻⁶)
Β-carotene conc. (µg·g−1 DM)380.36−0.27 0.401
(17.50)(0.05)
Lutein conc. (µg·g−1 DM)
405.37−0.22 0.309
(16.93)(0.05)
Neoxanthin conc. (µg·g−1 DM)91.84−0.15 0.356
(10.58)(0.03)
Violaxanthin conc. (µg·g−1 DM)409.19−0.43 0.376
(28.98)(0.09)
Chlorophyll a conc. (µg·g−1 DM)5315.26−4.35 0.265
(377.41)(1.12)
Chlorophyll b conc. (µg·g−1 DM)3037.61−1.35 0.240
(124.94)(0.37)
Total carotenoid conc. (µg·g−1 DM)1299.29−1.08 0.431
(64.70)(0.19)
Β-carotene content (µg·plant−1)527.740.64−3.54 × 10⁻³ 0.217
(54.85)(0.21)(1.16 × 10⁻³)
Lutein content (µg·plant−1)573.160.97−4.78 × 10⁻³ 0.365
(54.81)(0.21)(1.16 × 10⁻³)
Neoxanthin content (µg·plant−1)107.90−0.12 0.135
(15.88)(0.048)
Zeaxanthin content (µg·plant−1)16.920.03−1.56 × 10⁻⁴ 0.371
(1.84)(0.01)(3.88 × 10⁻⁵)
Chlorophyll a content (µg·plant−1)7491.557.92−0.05 0.129
(1007.04)(3.86)(0.02)
Chlorophyll b content (µg·plant−1)4347.678.00−0.04 0.410
(404.70)(1.55)(0.01)
Total carotenoid content (µg·plant−1)1302.391.37−0.01 0.199
(146.35)(0.56)(3.09 × 10⁻³)
z Coefficients for model equations used to generate Figure 4, Figure 5 and Figure 6. Linear: y = a + b x . Quadratic: y = a + b x + c x 2 . Quadratic Plateau: if x < X 0 ,     y = a + b x b x 2 2 X 0 , if x X 0 ,     y = a + bX 0 2     . y Standard error (SE).
Disclaimer/Publisher’s Note: The statements, opinions and data contained in all publications are solely those of the individual author(s) and contributor(s) and not of MDPI and/or the editor(s). MDPI and/or the editor(s) disclaim responsibility for any injury to people or property resulting from any ideas, methods, instructions or products referred to in the content.