Article

Evaluation of Nitrogen and Water Management Strategies to Optimize Yield in Open Field Cucumber (Cucumis sativus L.) Production

1
Environmental Science Center, Qatar University, Doha 2713, Qatar
2
School of Science, Western Sydney University, Richmond, NSW 2753, Australia
3
Hawkesbury Institute for the Environment, Western Sydney University, Penrith, NSW 2751, Australia
4
Southwest Florida Research and Education Center, Horticultural Sciences Department, Institute of Food and Agricultural Science, University of Florida, Immokalee, FL 34142, USA
5
Agricultural Research Station, Qatar University, Doha 2713, Qatar
*
Author to whom correspondence should be addressed.
Horticulturae 2023, 9(12), 1336; https://doi.org/10.3390/horticulturae9121336
Submission received: 3 September 2023 / Revised: 13 October 2023 / Accepted: 14 October 2023 / Published: 13 December 2023

Abstract

:
Countries in arid climates, such as Qatar, require efficient water-saving strategies and nitrogen treatment for vegetable production. Vegetable importation constituted approximately USD 352 million of Qatar’s 2019 GDP; hence, enhancing local production is essential. This study investigated the effect of varying nitrogen and water levels on cucumber (Cucumis sativus L.) fruit yield. Various water management strategies were also evaluated. A split plot design was employed with two water levels (W1: 50% deficit irrigation, W2: 100% full irrigation) and three nitrogen levels (N1: 50 kg N ha−1, N2: 70 kg N ha−1, N3: 100 kg N ha−1) to examine cucumber yield and physiological response. Our findings revealed that using minimal drip irrigation and reducing nitrogen levels significantly enhanced the growth, SPAD index, fruit characteristics, and yield components of cucumber. Drip irrigation had a greater influence on cucumber production than nitrogen levels. Shoot height increased by 4% from W2N1 (T1) to W1N3 (T6) and 4.93% from W2N2 (T2) to W1N2 (T5). Fruit length and width increased by 10.63% and 13.41% from T2 and T1 to T5, respectively. The highest total yield occurred at T5, followed by T6, T2, W2N3 (T3), W1N1 (T4), and T1 at 34.5, 29.1, 27.6, 25.8, 25.2, and 20.4 t/ha, respectively. The optimal combination comprised 50% deficit irrigation (W1) and 70 kg N ha−1 (N2) nitrogen. These results suggest the importance of optimizing drip irrigation for achieving maximum cucumber fruit yield in arid climates.

1. Introduction

In most parts of the world, particularly arid and semi-arid regions, population increase and climatic change have posed serious threats to vegetable production. Indeed, droughts may become more frequent, severe, and prolonged due to climate change [1,2]. Most countries in this region, such as Qatar and Kuwait, are characterized by harsh weather conditions with low rainfall and a higher chance of drought occurrence, poor soil composition coupled with high temperatures, which invariably hinder agriculture production [3]. Thus, water availability is a major constraint to vegetable production in this region. Meanwhile, it has been projected that agricultural production will continue to increase in arid regions due to a rise in population and demand for more arable land, ultimately leading to an increase in demand for irrigation water resources [4,5]. Also, climate change has made the future uncertain as the predicted water balance between precipitation and evapotranspiration is anticipated to be unfavorable, requiring a large amount of water for irrigation [6]. Indeed, the predicted occurrence of drought in Qatar is high as its annual rainfall is often lower than the prevailing annual evapotranspiration [7]; hence, water supply remains the major constraint to crop production.
The availability of water resources is essential for the sustainable existence of humans, while the persistent increase in the global population coupled with industrialization has resulted in a noticeable increase in its consumption [8,9]. The situation is even more dire in arid and semi-arid regions. Thus, water is a scarce resource in Qatar, and its uses must be rationed among industry, municipal, and agriculture sectors [10]. Agricultural water usage accounts for 85.40% of the total water usage or consumption in Qatar, followed by municipal (11.84%) and industrial (2.76%) use [10].
Similarly, soil fertility is crucial to sustainable vegetable production and requires adequate maintenance and improvement [11,12]. Fertilization impacts soil nutrients and fertility, thus increasing crop yield and product quality. However, excessive usage of chemical fertilizers often results in low efficiency; imbalanced fertilization can result in micronutrient deficiencies [13]. In an attempt to increase agricultural output, excessive fertilizer application has led to soil degradation, groundwater contamination, and other ecological and environmental issues, while overdrawing groundwater is consequential to the groundwater table, increasing the salinity of the soil and exposing the soil to other stresses [14]. Moreover, excessive use of nitrogen (N) fertilizers can pose serious health and environmental hazards, as over 70% of N fertilizer applied in food production is lost to the environment [12,15]. Although N is an essential nutrient for crop productivity, achieving optimal application levels can be challenging due to the dynamic availability of N to plants during growth [16].
Owing to its unique taste, nutritional benefits, and high yield, cucumber is an important horticultural crop produced and consumed globally. Cucumber provides vitamins, minerals, and nutrients essential for human growth and development [14,17]. Vegetable production is a top priority outlined in the Qatar National Food Security Strategy 2018–2023. Although Qatar currently ranks 140th worldwide, it strives for self-sufficiency in vegetable production. Indeed, a significant increase in vegetable production, from 65,117 tons in 2017 to 101,881 tons in 2021, has been reported comprising four major vegetables: cucumber (19.48%), tomato (15.35%), bell pepper (6.02%), and eggplant (4.64%) [18]. Cucumber can be eaten raw and is often incorporated in fruit juice preparation. It offers certain health benefits as it possesses a significant amount of water and is extremely low in caloric content. More specifically, cucumber exhibits potential benefits in managing diabetes, reducing lipids, and acting as an antioxidant. Cucumber also aids in detoxification by eliminating stored waste products and harmful chemical toxins, while its fresh juice is beneficial for skin nourishment [19]. Cucumber is extensively cultivated in Qatar due to its short growth cycle and flavorful taste coupled with huge economic value. However, efforts to increase cucumber production may lead to poor fertilizer application and excessive water irrigation, resulting in water and nitrogen waste, increased soil salinity, nitrogen leaching, pollution, and consequently, reduced cucumber output and quality [20]. The impact of N availability on vegetable yield and quality is eminent. Thus, its application should be well-tailored and managed in cucumber (Cucumis sativus L.) to enhance yield and quality while minimizing its negative impacts [14,21]. In the open field, cultivated cucurbits, such as cucumber, melon, pumpkin, and squash, exhibit variation in optimal nitrogen rates depending on the cucurbit location and species, ranging from 80 to 200 kg N ha−1 [16,22,23,24]. However, in Qatar, the recommended rate of N fertilizer for general cucurbit cultivation has not been properly documented. As such, it is unclear whether the current use is under, over, or within the reported range for application as basal or surface treatment. Consequently, it is unclear whether the N rate use is suitable for open-field cucumber production in Qatar.
Water and nitrogen remain the most essential limiting factors that influence the accumulation of crop biomass, invariably resulting in crop yield variation [25,26,27,28,29]. Accordingly, the current adopted a sustainable irrigation technique to conserve water and an effective nitrogen management strategy to sustain crop cultivation/production in arid and semi-arid regions. We found that the rational utilization of nitrogen and irrigation water can substantially mitigate the suppressive impact of harsh weather conditions on crops under adequate agronomic practices, increasing the crop yield. We propose that our results will optimize nitrogen and irrigation application to obtain crops with better yields while protecting the environment from pollution.

2. Materials and Methods

2.1. Site Location

The experiment was conducted in field conditions at the Agriculture Research Station of Qatar University, situated 60 km north of Qatar off Shamal road in Rawdat Al-Faras within the Al Shamal Municipality, between 2 November 2022 and 10 February 2023. The farm is located at 25°48′ N latitude and 51°20′ E longitude. The study area can be characterized as a subtropical arid desert climate, characterized by minimal annual precipitation of 58.15 mm, temperature fluctuations ranging from 25.60 °C to 33.49 °C, humidity levels varying between 32% and 72%, average wind speed of 6 knots, mean sea level (MSL) atmospheric pressure of 6 hPa, and an average of 7.8 daily sunshine hours per year [18,30]. However, most rainfall occurred during November and December up to January 2023. The water source for irrigation is underground brackish water; thus efficient use of available water is crucial for preserving land and water resources. Anions and cations in water samples were quantified using the Metrohm 850 Ion Chromatography (IC) system in the Central Laboratory Unit, Qatar University, following the methodology outlined by Wilson et al. (2011), while the pH and electrical conductivity were determined using YSI Exo-2 Sonde (YSI Inc., Yellow Springs, OH, USA) [31].

2.2. Soil Properties, Land Preparation, and Seeding Transplanting

At the experimental site, the available soil is a combination of sand, loam, and clay. Before transplanting seedlings, soil samples were extracted from the experimental field at a depth ranging from 0 to 30 cm using an auger. These soil samples were subjected to a comprehensive chemical analysis at the sediment lab of the Environmental Science Center, Qatar University, to assess various soil properties, including organic matter content, pH, electrical conductivity (EC), as well as phosphorus (P), calcium (Ca), copper (Cu), magnesium (Mg), sodium (Na), zinc (Zn), boron (B), potassium (K), and manganese (Mn) concentrations. The analysis procedure involved utilizing a heating block and acid digestion method to determine the total metal content in the soil. During this procedure, 0.25 g of fine soil samples were mixed with 9 mL of HNO3 acid and heated at 95 °C for 30 min. Subsequently, 3 mL of HF acid was added, and the mixture was heated for an additional 30 min at the same temperature. The temperature was then increased to 135 °C for 60 min to reduce the volume, followed by a slight increase to 155 °C until the sample was nearly dried. Subsequently, 3 mL of HNO3 acid and 20 mL of deionized water were added, and the mixture was heated until it became clear. After cooling, the solution was quantitatively transferred into a 100 mL volumetric flask and diluted with deionized water to the desired volume. The ion concentrations were determined using a Perkin Elmer ICPOES 5300 DV instrument (Perkin-Elmer Optima 5300 DV, PerkinElmer, Waltham, MA, USA). Additionally, the soil’s organic matter content was evaluated by estimating the organic carbon content using the Walkley and Black method. Although the soil does not have serious issues with salinity or poor drainage, the plot of land was selected based on prior support for vegetable production. The pre-planting operation, including clearing of the field, followed by plowing and furrowing, was performed to achieve good soil structure.
After land preparation and a 3-day acclimatization period, the seedlings were transplanted and subjected to the same treatment to ensure uniformity before the experimental treatments.

2.3. Experimental Design

The experiment was carried out under main and sub-plot arrangements. Irrigation was applied to the main plots while nitrogen (N) was applied to the sub-plots, with three replicates in a split-plot design. Cucumber cultivation/production was evaluated by the drip irrigation practices applied under different rates: full (100%) and deficit (50%). Three nitrogen levels were studied, representing varying percentages of the recommended 100 kg N ha−1 for cucumber drip irrigation. Urea was the nitrogen source, with concentrations of 100%, 70%, and 50% of the recommended rate (Table 1). In Qatar, the conventional method is extensively accepted by most farmers for scheduling irrigation and is based on the duration required to irrigate a plot. The cucumber hybrid seedling was transplanted on 2 November 2022, and the experiment ran until January/February 2023, with a 70 m × 50 cm row-to-row plant-to-plant spacing arrangement. Each experimental plot comprised four rows, 3 m long and 2.10 m wide, with five cucumber seedlings planted in each row, resulting in a total of twenty cucumber seedlings per plot. Phosphorus (70 kg P2O5 ha−1) and potassium (60 kg Ca(H2PO4)2. H2O ha−1) were applied to all treatments. Drip irrigation was applied every other day each week until the required quantity of water was reached. The components of the drip system included polyethylene laterals with 12 mm diameters fixed with in-line drippers at a distance of 50 cm. Nitrogen was applied at seedling, flowering, fruit enlarging, and fruit maturity stages in equal doses with the drip irrigation system starting 5 days after transplantation (Table 2). All agronomic activities, including weeding and plant protection measures, were performed similarly to local practices. The fruits were harvested between 17 December 2022 and 10 January 2023 when they reached their full size and were green.

2.4. Growth, Fruit, and Yield Parameters

The shoot height of the cucumber plant was determined on the 17th day after transplantation by measuring from the assumed base (above soil level) to the highest point where the leaves were completely opened using a ruler. The average was recorded at the beginning and end of the experiment. A few days after transplantation, the leaves per plant were manually counted. The leaf length and width were measured with a ruler, and the average length and width were recorded. Four weeks after transplantation, the stem width was manually measured with a digital vernier caliper (Clarke CM145 Digital Vernier Caliper) and used to calculate the plant diameter. When the leaves were green and healthy during the second week after transplantation, the chlorophyll content was measured using a common diagnostic tool, Soil Plant Analysis Development (SPAD) chlorophyll meter (SPAD–2: Konica Minolta Optics, Osaka, Japan), and expressed as the SPAD Index [32]. The fruit length and width were manually determined with a digital vernier caliper at each harvest. The summation of the harvested fruit weight was determined at each harvest and the end of the cultivation period with a laboratory scale and recorded in grams per fruit. The number of fruits collected per experimental unit was manually counted and recorded at each harvest, and the sum was calculated for the total number of fruits per experimental unit for all treatments. Thus, the fruit parameters, viz. length, width, number/plant, average weight, and fresh yield were recorded at each harvest.

2.5. Statistical Analysis

The effects of irrigation and different levels of N application coupled with their interaction were determined via analysis of variance (ANOVA) using Minitab 19 (Minitab Inc., State College, PA, USA). Mean differences were compared using Tukey’s post hoc test at a 5% significance level (p ≤ 0.05).

3. Results

The impact of different levels of irrigation and nitrogen treatment on cucumber vegetative growth parameters, yield constituents, and total yield are shown in Figure 1A–I. and Table 3. The results presented in Table 4 indicate statistically significant differences in the measured parameters.

3.1. Soil of the Cultivated Plot and Irrigation Water

Soil samples were analyzed via ion chromatography, YSI Meter, and MOOPAM. A substantial amount of anions and cations was detected, with moderate and suitable pH levels, and total organic matter for proper cucumber growth (Table 5). Additionally, the electrical conductivity (EC) and pH of the irrigation water source were quantified. The ion composition of the irrigation water source comprised sodium, magnesium, potassium, calcium, chlorine, and sulfate (Table 5).

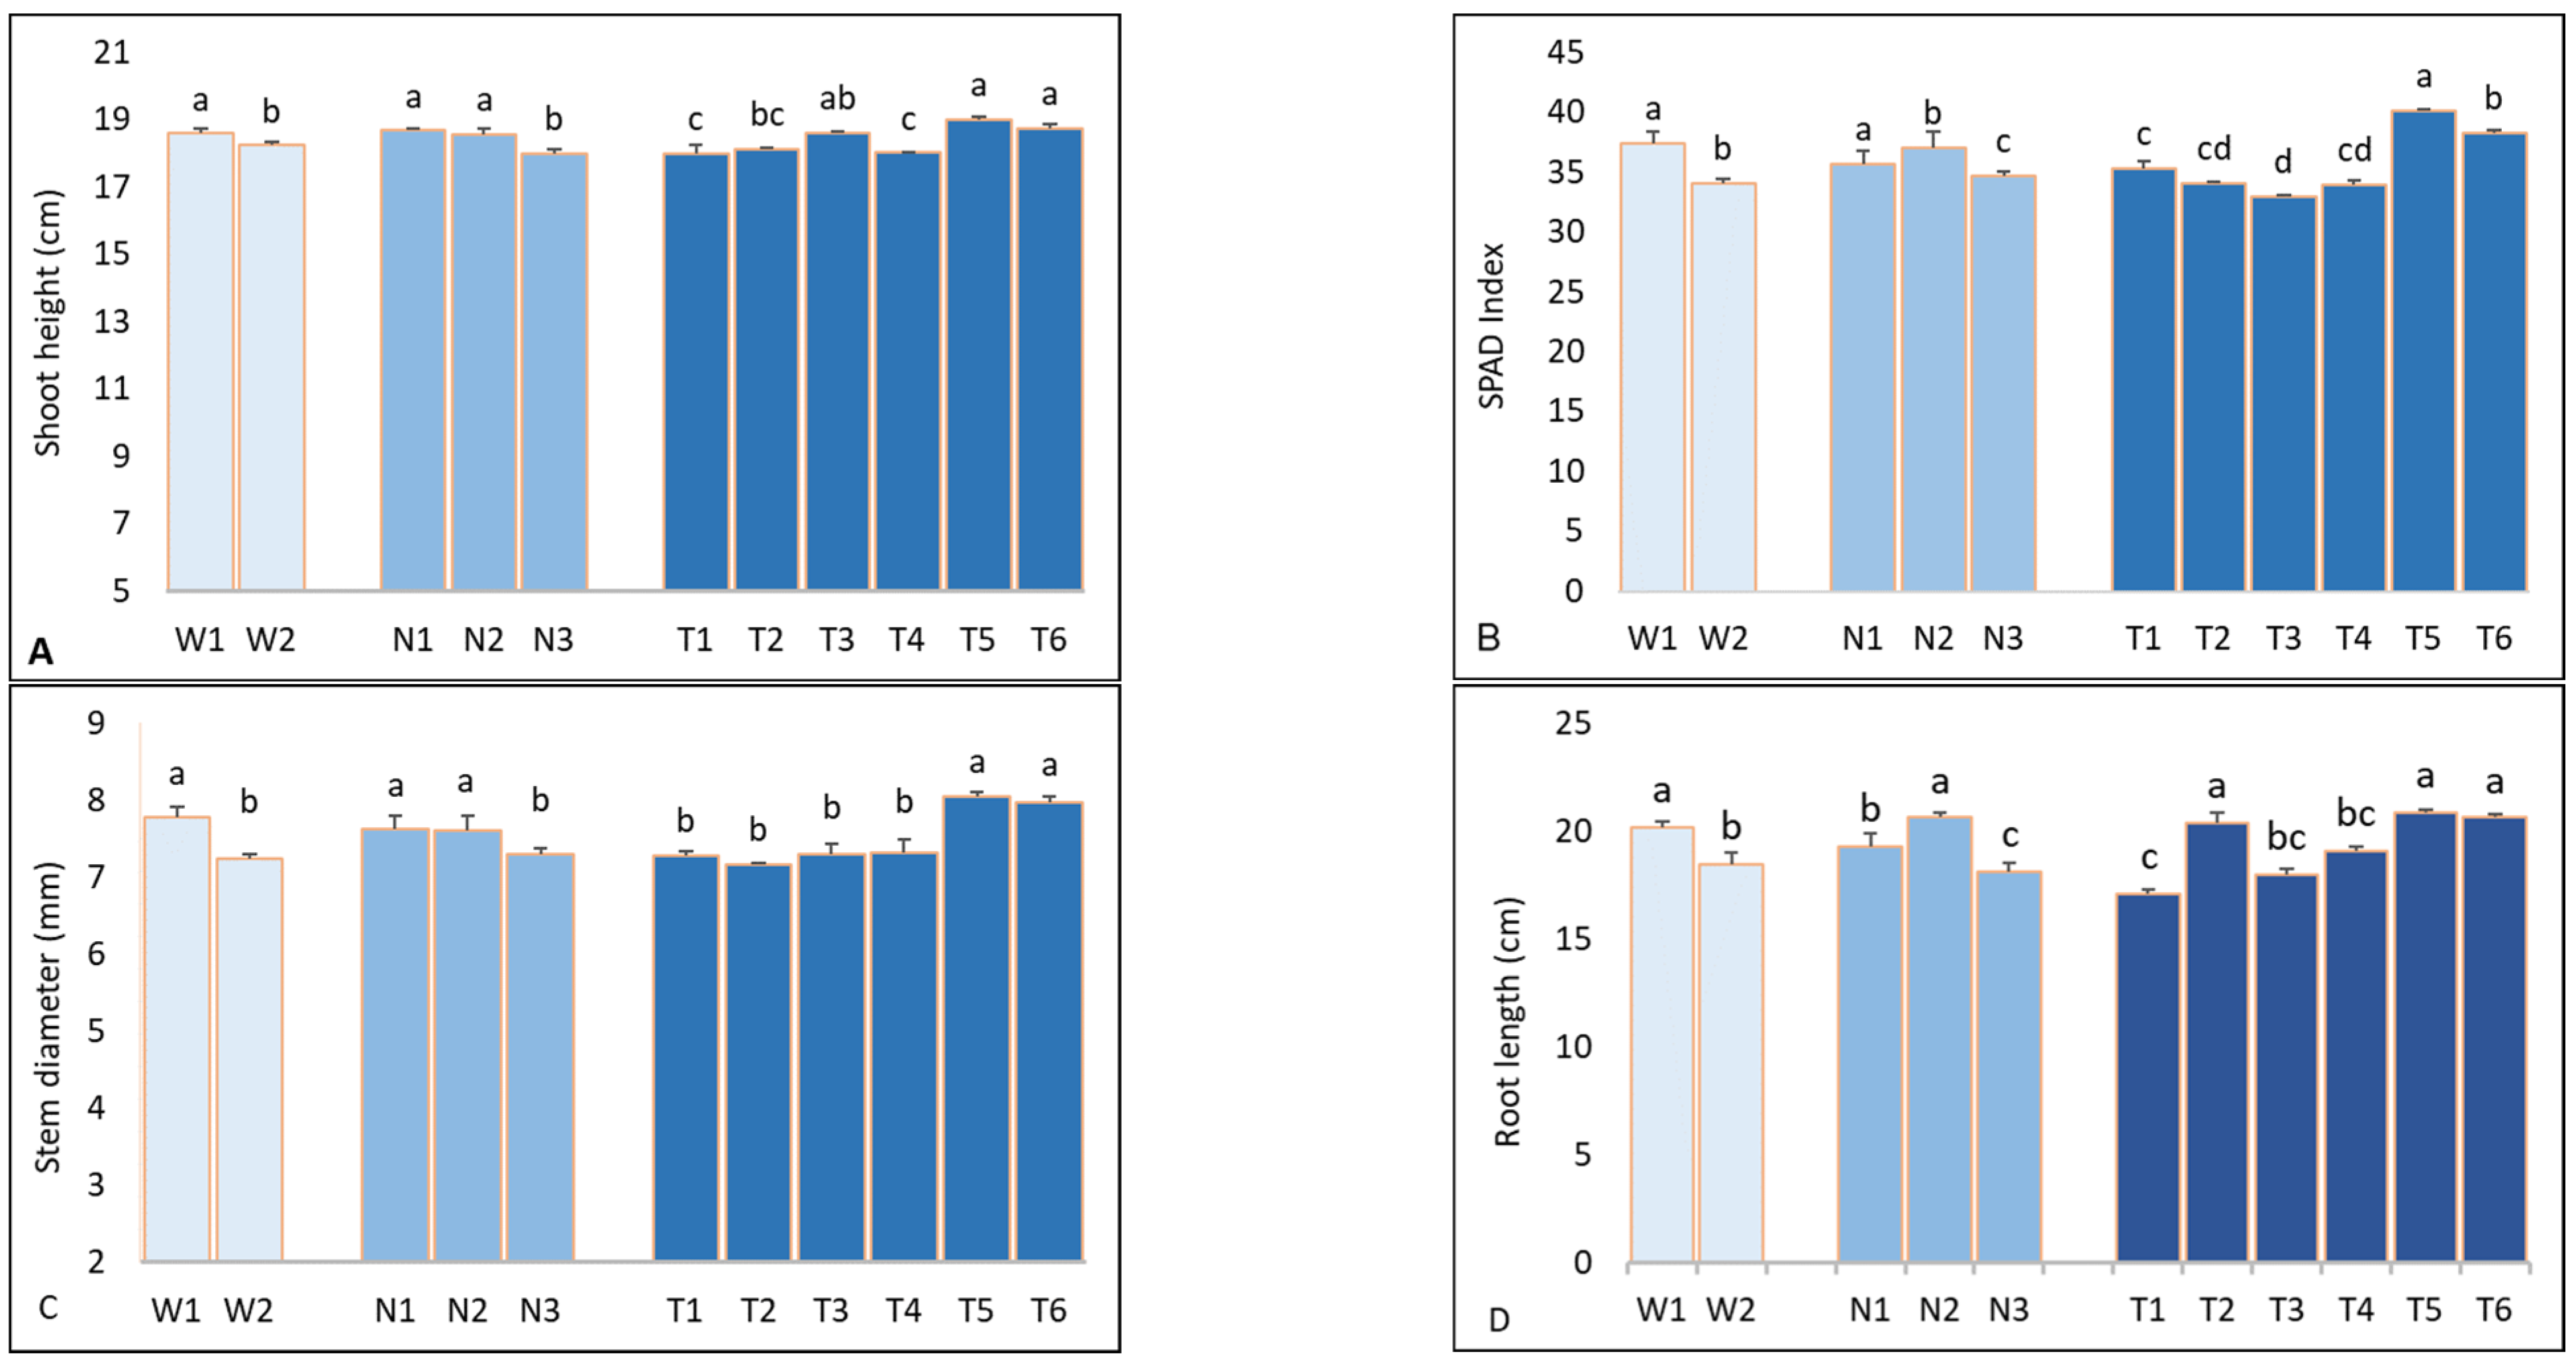
3.2. Effect of Irrigation and Nitrogen on Cucumber Growth Parameters and SPAD Index

A range of cucumber growth parameters, yield constituents, and fruit yield was observed based on the amount of water (W) used in drip irrigation at various nitrogen levels (Table 3). Plant shoot height significantly increased with decreasing N levels up to N1. In drip irrigation, the tallest plant shoot was found at N2 and N1 in W1 (T5 and T6) while in W2 the tallest was under N1 treatment (T3).
The SPAD index in plant leaves revealed that the chlorophyll content significantly increased with decreasing fertilizer application; the SPAD index was highest under N2 and N1 in W1 (T5 and T6). The highest SI was achieved with N3 treatment in W2. The stem diameter followed the same trend, with the largest diameter recorded under N2 and N1 in W1 (T5 and T6), while the largest in the W2 treatment was found under N1 (T3). Also, the root length was significantly increased with decreasing fertilizer application; the root length was longest with N1 and N2 in W1 (T5 and T6). Meanwhile, in the W2 plots, the longest roots were achieved under the N3 treatment. Similarly, the stem diameter was the largest under N2 and N1 in W1 (T5 and T6) and under N1 in W2 (T3).

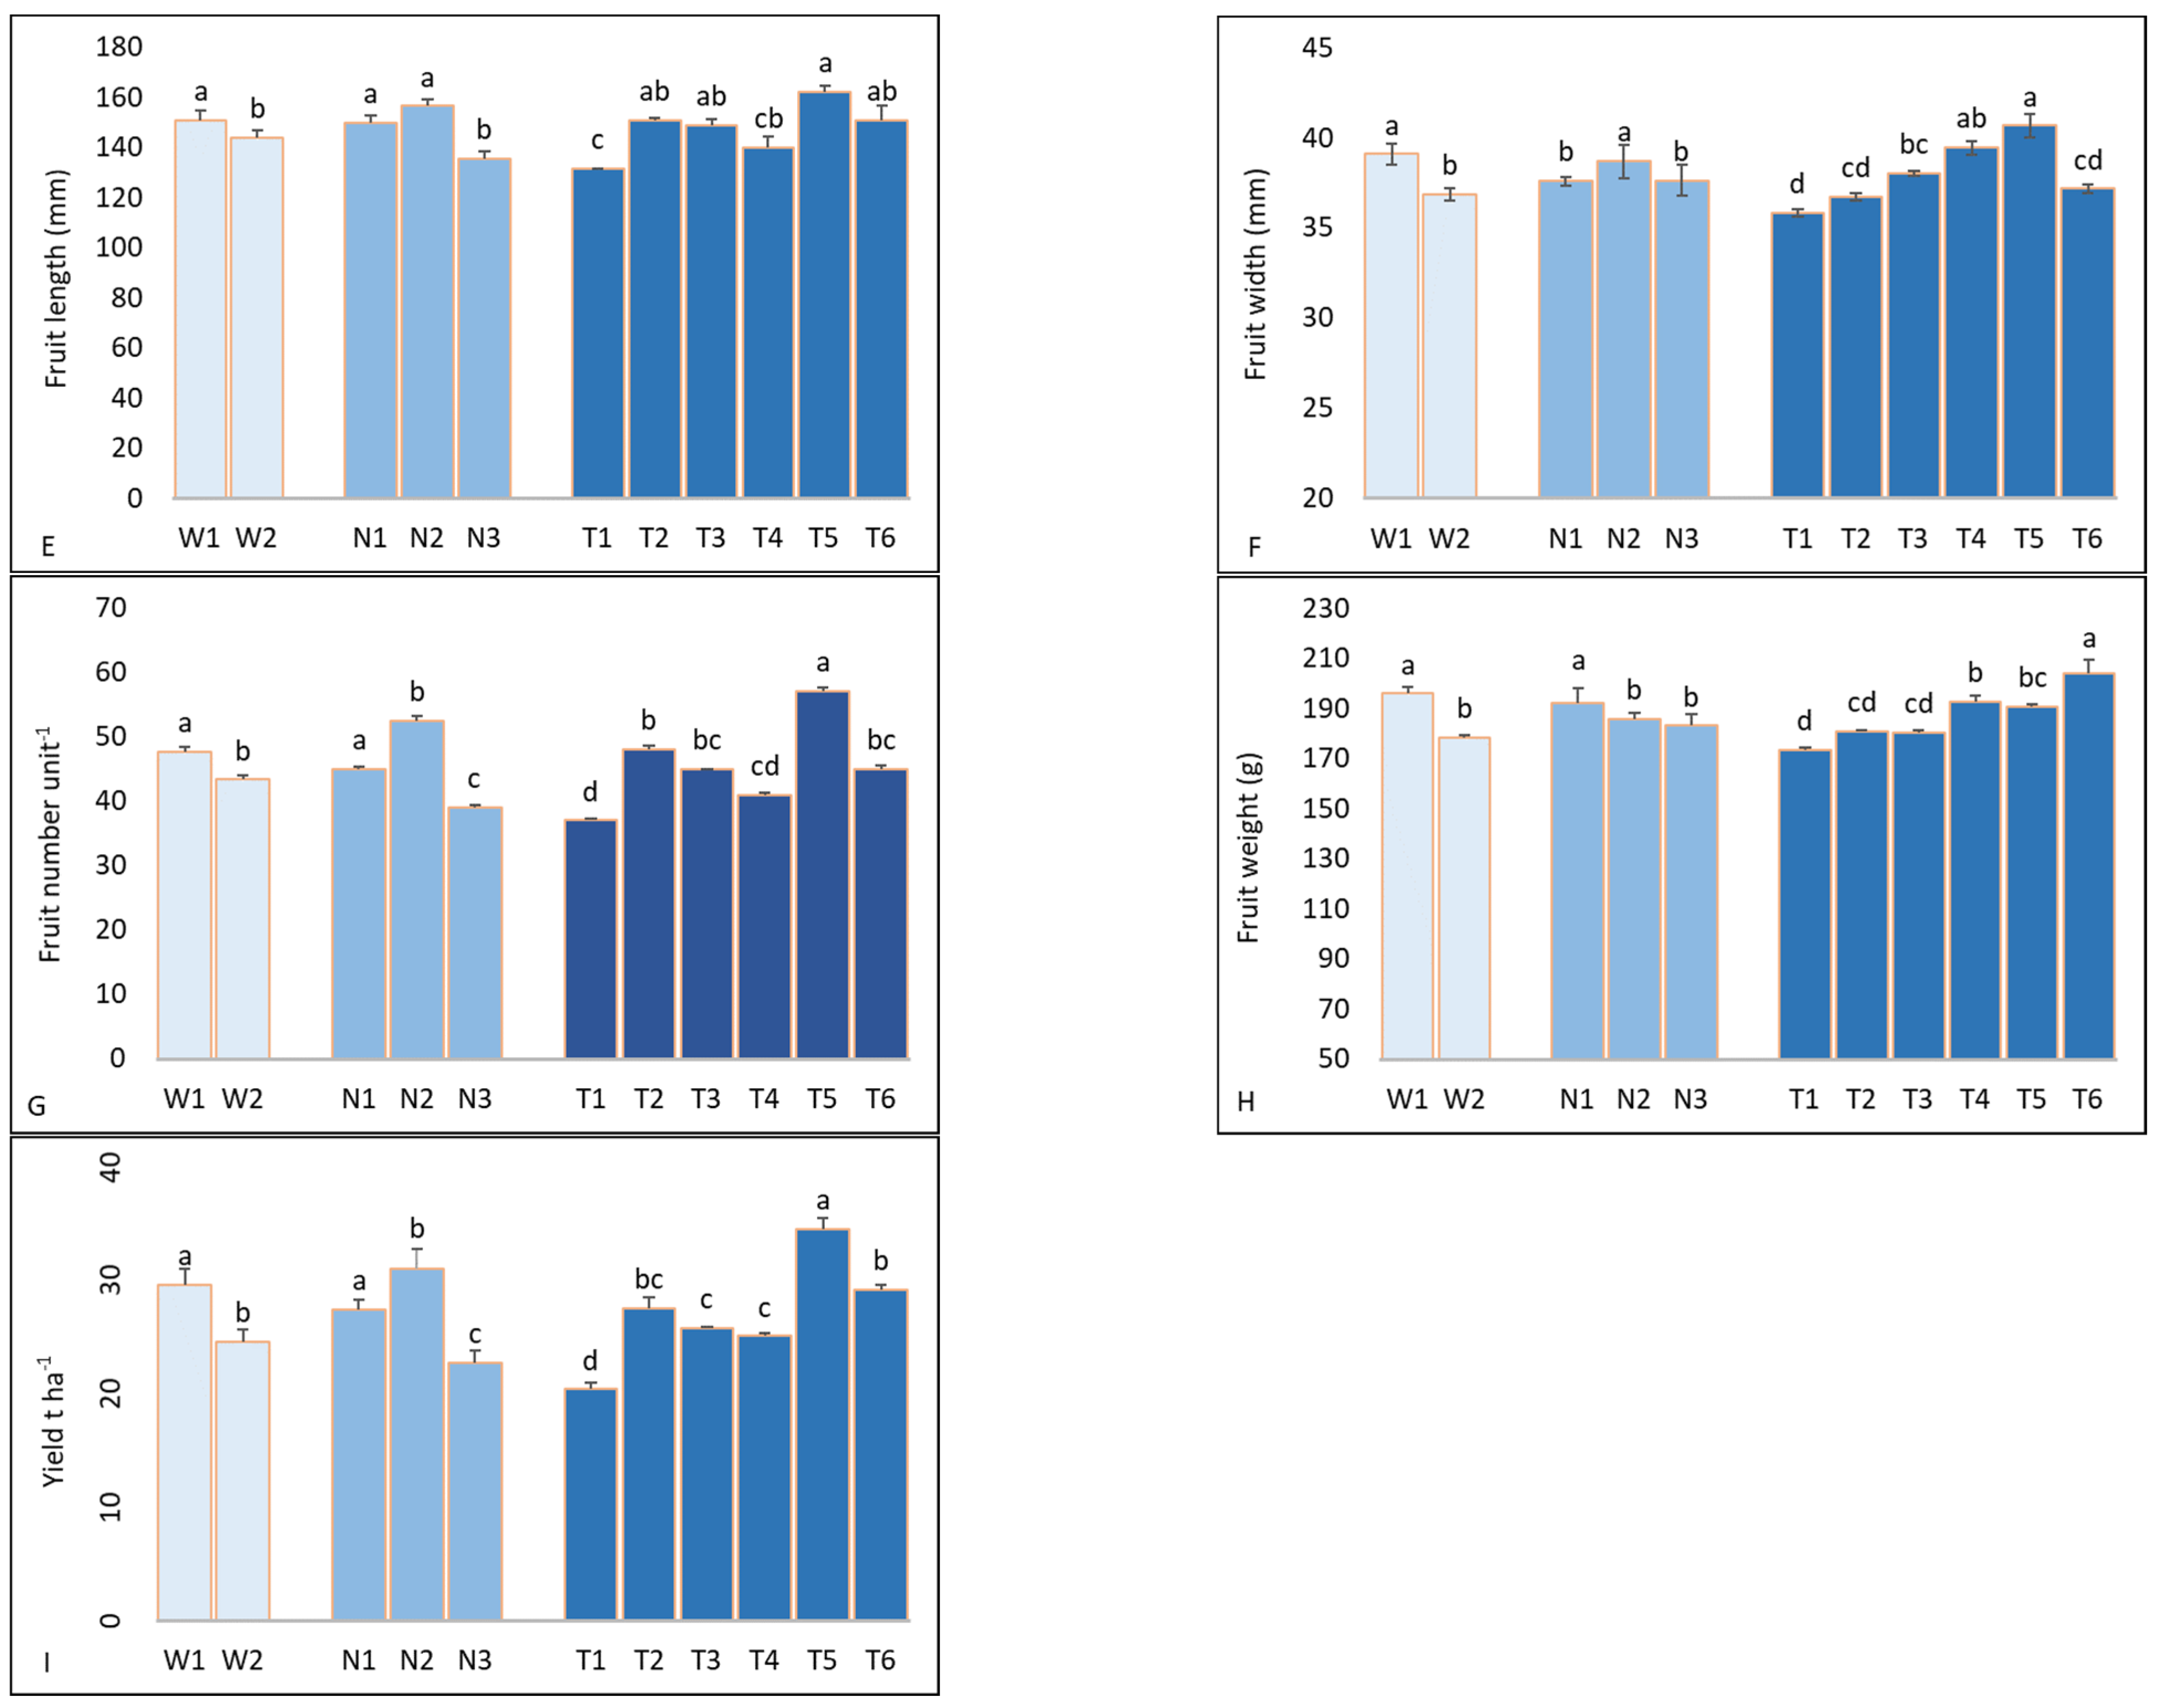
3.3. Effect of Irrigation and Nitrogen on Fruit Yield

Figure 1E–H showed a significant difference in the fruit yield constituents, including the length, width, number of fruits per plant, and weight of the cucumbers based on the N treatment and W level. In W1, the longest fruit was observed with N2 and N1 treatments and the shortest with N3 treatments. In the W2 treatment, the longest fruit was recorded at N2. followed by N1, and the shortest was obtained following N3 treatment (Figure 1E). The fruit width showed a similar pattern, with the largest obtained under N3 in W1 and N1 in W2 and the smallest found under N1 in W1 and N3 in W2 treatments (Figure 1F). The fruit weight followed the same trend; the heaviest fruit was obtained under N1, followed by N2 in W1, and N2 and N1 in W2, while the lightest fruit was found under N3 in W1 and W2 treatments.
The fruit yield was noticeably larger in W1 compared to W2 under N1 and N2 treatments. The highest fruit yield was obtained under N2, followed by N1 (T5 and T6) in W1, and the lowest was achieved under N3. W2 produced the maximum yield at N2 (T2) and the lowest yield under N3 (T1) (Figure 1I). However, the yields produced under W1 and N2 (34.5421 t ha−1), N1 (29.137 t ha−1), and N3 (25.0734 t ha−1) were higher than those under W2 and N2 (27.5621 t ha−1), N1 (25.7986 t ha−1), and N3 (20.3913 t ha−1). The most fruitful yield was obtained under treatment with W1 and N2, which was 22.48% larger than W2 and N2, suggesting that W1 and N2 (T5) was the ideal combination. Hence, drip irrigation (W1) produces a 22.48% greater fruit yield with a 50% water deficit and 30 kg of nitrogen per ha compared to the highest yield achieved with W2 at the same N level. These findings suggest that optimizing water quantity applied via drip under different N levels in the field is crucial for maximizing drip irrigation benefits.

4. Discussion

As unfavorable climate change continues to make water-saving techniques increasingly important in arid and semi-arid areas where water availability and supply are limited, optimizing the conventional or full irrigation system leads to enhanced crop production and water use efficiency [33,34,35,36,37,38]. At the end of the current study, the tallest shoot was observed in the treatment subjected to W1 drip irrigation (deficit water irrigation system), while the W2 treatment showcased the shortest plant (Table 3). These findings agree with those of Harmanto et al. (2005) [39] and Rahil and Qanadillo (2015) [20], who reported that at 70% irrigation deficit, the plant height was highest for tomato and cucumber cultivated to optimize irrigation and N consumption (Abdalhi et al., 2016) [40]. In contrast, Hashem et al. (2011) [41] contended that for cucumber plants, a 100% irrigation level succeeded by 80% and 120% irrigation levels across two growing seasons, leading to increased vegetative parameters. Additionally, Ngouajio et al. (2007) mentioned that augmented vegetative parameters under the 100% irrigation level were attributed to the appropriate irrigation volume, particularly during early growth stages, fostering a deeper and more expansive root system [42]. Similarly, the SPAD index value for the leaf chlorophyll content increased to 37.42 with water deficit irrigation in W1 (Table 3), indicating that excessive or deficit irrigation can achieve high or low chlorophyll content. Interestingly, our finding was supported by Amer et al. (2009) [43], who found that under deficit irrigation, the chlorophyll content statistically increases. Similarly, the findings agreed with the work of Abdalhi et al. (2016) [40], who stated that leaf chlorophyll content decreased significantly as the water irrigation deficit increased; the maximum leaf chlorophyll was obtained when the irrigation deficit was maintained [40]. Deficient irrigation as a water-saving strategy has exhibited a positive impact on yield compared with full or traditional irrigation. It has been argued successfully in different studies conducted across the world. In our study, the increased yield at W1 compared with W2 is in line with that reported by Dogan et al. (2008) who achieved the highest cv. Ananas fruit yields at 75% irrigation (43.8 Mg ha−1) compared to 100% (38.9 Mg ha−1) [44]. In another study conducted on cotton cultivation, the adoption of deficit irrigation resulted in a reduction of water consumption by 31–34%, leading to a 13–24% increase in cottonseed yield [45,46,47]; our findings supported this. However, our findings contradict others, who reported that the quantity of irrigation leads to a linear increase in onion fruit yields [41,48,49]. Hence, our findings support the notion that reduced irrigation can lead to higher crop yields.
Different studies have widely reported that applying fertilizer to various crops significantly positively affects healthy plant growth and yield [50,51,52]. Our findings showed that fertilization application and two-drip irrigation practices resulted in higher yields with a minimal water supply and N required (Table 3). However, under the open-field planting of cucumber, the yield exhibited a significant increase with a slight increase in N level up to N2, below the recommended N nutrient requirement for cucumber cultivation. Thus, the yield increased from N1 to N2 (13.03%) (i.e., 50 to 70 Kg ha−1) at a stage where the yield was assumed to be constant before decreasing (11.43%) at N3 (1000 Kg ha−1). These results suggest that the optimum fertilizer treatment is likely 70 Kg ha−1. The maximal yields were evidenced by increased fruit quantity and enhanced individual fruit weight. However, no significant difference in fruit weight was observed between N1 and N3 plots, indicating that, within the confines of our experimental parameters, N1 fertilization influenced these yield constituents. Conversely, excessive quantities of N in N3 plots impact fruit weight. Our findings aligned with those of Cabello et al. (2009), who found a substantial increment in yield (18%) upon transitioning from 30 to 85 kg N ha−1. Subsequently, the yield demonstrated constancy before a marginal decline (13%) at the 139 kg ha−1 level [53]. Contrarily, it was reported that under arid and semi-arid climatic conditions, cucumber plants responded to as much as 240 kg N ha−1 [54].
Considering the interaction between water and N, at N70 in W1 (T5), considered an optimum combination, the highest cucumber fruit yield was obtained compared to the other treatments, leading to a 50% reduction in water use and 30 and 50 Kg N ha−1 (Table 3). This study’s findings agree with those of Rahil et al. (2015), who discovered that crop yields increased when irrigation was reduced by as much as 70% [20]. Alternatively, no significance was recorded in yield between T2, T3, and T4. In summary, the highest fruit yield was achieved under the `T5 treatment, which was 40.87, 20.00, 25.32, 27.41, and 15.66% higher than T1, T2, T3, T4, and T6, respectively. Hence, the cucumber fruit yield was higher under deficit irrigation treatment, which could result from the crop’s potential to adapt to areas with lower water availability or reduced water supply. In arid and semi-arid regions, these methods can be utilized as a sustainable strategy to maximize water use, allowing farmers to achieve favorable crop yields while conserving water resources. To achieve maximum productivity and long-term viability, irrigation strategies must consider crop-specific requirements and local environmental conditions, as demonstrated by this study.

5. Conclusions

Our findings show that cucumber growth performance is sensitive to fertigation and irrigation levels. The application of deficit drip water irrigation at 70% N level is considered the sustainable and optimal standard to obtain higher fruit yield in an arid area like Qatar, characterized by harsh climatic conditions. Moreover, improving the application of N fertilizer and reducing water usage in field cucumber production produces fresh vegetables and reduces environmental pollution from leaching and contamination by excessive N fertilizer use. In our forthcoming research, we will emphasize the utilization of omics techniques to delve deeper into the intricate dynamics underlying nutrient management and cucumber cultivation. This approach will expand our knowledge of these complex, multifaceted dynamic processes and enhance cucumber production.

Author Contributions

Conceptualization, S.H., Z.-H.C., M.A. and T.A.; methodology, A.S.B., M.F.K. and T.A.; software, A.S.B. and T.A.; formal analysis, A.S.B. and T.A.; investigation, A.S.B.; resources M.A. and T.A.; writing—original draft preparation, B.AS.; writing—review and editing, A.S.B., S.H., Z.-H.C., M.A. and T.A.; supervision, T.A.; funding acquisition, S.H., Z.-H.C., M.A. and T.A. All authors have read and agreed to the published version of the manuscript.

Funding

This publication was made possible by MME grant MME01-0826-190018 from the Qatar National Research Fund (a member of Qatar Foundation). The findings achieved herein are solely the responsibility of the authors.

Data Availability Statement

Access to the data used in this study is subject to certain restrictions. The data were obtained under rules and are not publicly available. However, interested individuals may request access to the data by contacting the corresponding author (T.A.) and making a reasonable request, subject to approval.

Acknowledgments

The authors are grateful to the Director of the Agricultural Research Station for providing the necessary support. Also, we are grateful to AGRICO for supplying us with the inputs (seedlings) used. The soil samples of the field analysis using Inductively coupled plasma-optical emission spectrometry (ICP-OES) were facilitated by the Environmental Science Center. Also, water samples analysis by the Ion Chromatography analysis was facilitated by the Central Laboratories unit, at Qatar University.

Conflicts of Interest

The authors declare no conflict of interest.

References

  1. Jones, E.; van Vliet, M.T. Drought impacts on river salinity in the southern US: Implications for water scarcity. Sci. Total Environ. 2018, 644, 844–853. [Google Scholar] [CrossRef] [PubMed]
  2. Parkash, V.; Singh, S.; Deb, S.K.; Ritchie, G.L.; Wallace, R.W. Effect of deficit irrigation on physiology, plant growth, and fruit yield of cucumber cultivars. Plant Stress 2021, 1, 100004. [Google Scholar] [CrossRef]
  3. Ben Hassen, T.; El Bilali, H. Sustainable Agriculture and Food Security in Qatar: International Threats and Local Constraints. In Sustainable Agriculture and Food Security; Springer: Berlin/Heidelberg, Germany, 2022; pp. 425–442. [Google Scholar]
  4. Sauer, T.; Havlík, P.; Schneider, U.A.; Schmid, E.; Kindermann, G.; Obersteiner, M. Agriculture and resource availability in a changing world: The role of irrigation. Water Resour. Res. 2010, 46, 1–12. [Google Scholar] [CrossRef]
  5. Amare, D. Review on Effect of Different Irrigation Method on Water Use Efficiency, Yield Productivity and Nitrogen Application. J. Biol. Agric. Health 2020, 10, 1–9. [Google Scholar]
  6. Bisbis, M.B.; Gruda, N.; Blanke, M. Potential impacts of climate change on vegetable production and product quality–A review. J. Clean. Prod. 2018, 170, 1602–1620. [Google Scholar] [CrossRef]
  7. Issaka, A.I.; Paek, J.; Abdella, K.; Pollanen, M.; Huda, A.; Kaitibie, S.; Goktepe, I.; Haq, M.; Moustafa, A.T. Analysis and calibration of empirical relationships for estimating evapotranspiration in Qatar: Case study. J. Irrig. Drain. Eng. 2017, 143, 05016013. [Google Scholar] [CrossRef]
  8. Van Vuuren, D.P.; Bijl, D.L.; Bogaart, P.; Stehfest, E.; Biemans, H.; Dekker, S.C.; Doelman, J.C.; Gernaat, D.E.; Harmsen, M. Integrated scenarios to support analysis of the food–energy–water nexus. Nat. Sustain. 2019, 2, 1132–1141. [Google Scholar] [CrossRef]
  9. Bello, A.S.; Zouari, N.; Da’ana, D.A.; Hahladakis, J.N.; Al-Ghouti, M.A. An overview of brine management: Emerging desalination technologies, life cycle assessment, and metal recovery methodologies. J. Environ. Manag. 2021, 288, 112358. [Google Scholar] [CrossRef]
  10. Ahmad, A.Y.; Al-Ghouti, M.A. Approaches to achieve sustainable use and management of groundwater resources in Qatar: A review. Groundw. Sustain. Dev. 2020, 11, 100367. [Google Scholar] [CrossRef]
  11. Çolpan, E.; Zengin, M.; Özbahçe, A. The effects of potassium on the yield and fruit quality components of stick tomato. Hortic. Environ. Biotechnol. 2013, 54, 20–28. [Google Scholar] [CrossRef]
  12. Souri, M.K.; Yarahmadi, B. Effect of Amino Chelates Foliar Application on Growth and Development of Marigold (Calendula officinalis) plant. Iran. J. Plant Prod. Technol. 2015, 15, 109–119. [Google Scholar]
  13. Souri, M.k.; Sooraki, F.Y.; Moghadamyar, M. Growth and quality of cucumber, tomato, and green bean under foliar and soil applications of an aminochelate fertilizer. Hortic. Environ. Biotechnol. 2017, 58, 530–536. [Google Scholar] [CrossRef]
  14. Li, J.; Yang, X.; Zhang, M.; Li, D.; Jiang, Y.; Yao, W.; Zhang, Z. Yield, Quality, and Water and Fertilizer Partial Productivity of Cucumber as Influenced by the Interaction of Water, Nitrogen, and Magnesium. Agronomy 2023, 13, 772. [Google Scholar] [CrossRef]
  15. Souri, M.K. Aminochelate fertilizers: The new approach to the old problem; a review. Open Agric. 2016, 1, 118–123. [Google Scholar] [CrossRef]
  16. Van Eerd, L.L.; O’Reilly, K.A. Yield, nitrogen dynamics, and fertilizer use efficiency in machine-harvested cucumber. HortScience 2009, 44, 1712–1718. [Google Scholar] [CrossRef]
  17. Zhao, H.; Zhai, X.; Guo, L.; Yang, Y.; Li, J.; Ren, C.; Wang, K.; Liu, X.; Zhan, R.; Wang, K. Comparing protected cucumber and field cucumber production systems in China based on emergy analysis. J. Clean. Prod. 2019, 236, 117648. [Google Scholar] [CrossRef]
  18. PSA. Planning and Statistic Authority. PSA Statistical Subjects. 2021. Available online: https://www.psa.gov.qa/en/statistics1/StatisticsSite/Pages/default.aspx (accessed on 20 September 2023).
  19. Mukherjee, P.K.; Nema, N.K.; Maity, N.; Sarkar, B.K. Phytochemical and therapeutic potential of cucumber. Fitoterapia 2013, 84, 227–236. [Google Scholar] [CrossRef]
  20. Rahil, M.; Qanadillo, A. Effects of different irrigation regimes on yield and water use efficiency of cucumber crop. Agric. Water Manag. 2015, 148, 10–15. [Google Scholar] [CrossRef]
  21. Nakano, Y.; Noda, S.; Miyake, Y.; Kogoshi, M.; Sato, F.; Iijima, W. Applicability of Variable-Rate Nitrogen Top Dressing Based on Measurement of the Within-Field Variability of Soil Nutrients for Cabbage Production. Horticulturae 2023, 9, 506. [Google Scholar] [CrossRef]
  22. Jamil Mohammad, M. Squash yield, nutrient content and soil fertility parameters in response to methods of fertilizer application and rates of nitrogen fertigation. Nutr. Cycl. Agroecosystems 2004, 68, 99–108. [Google Scholar] [CrossRef]
  23. Esmel, C.E.; Santos, B.M.; Gilreath, J.P. Effects of nitrogen rates on summer squash growth and yield. HortScience 2006, 41, 506C-506. [Google Scholar] [CrossRef]
  24. Ferrante, A.; Spinardi, A.; Maggiore, T.; Testoni, A.; Gallina, P.M. Effect of nitrogen fertilisation levels on melon fruit quality at the harvest time and during storage. J. Sci. Food Agric. 2008, 88, 707–713. [Google Scholar] [CrossRef]
  25. Hamzei, J.; Soltani, J. Deficit irrigation of rapeseed for water-saving: Effects on biomass accumulation, light interception and radiation use efficiency under different N rates. Agric. Ecosyst. Environ. 2012, 155, 153–160. [Google Scholar] [CrossRef]
  26. Yang, G.; Tang, H.; Tong, J.; Nie, Y.; Zhang, X. Effect of fertilization frequency on cotton yield and biomass accumulation. Field Crops Res. 2012, 125, 161–166. [Google Scholar] [CrossRef]
  27. Fondio, L.; N’Gbesso, M.; Coulibaly, N.D. Effect of mineral fertilization on African eggplant (Solanum spp.) Productivity in Côte d’Ivoire. J. Agric. Sci. Technol. 2016, 6, 188–195. [Google Scholar] [CrossRef]
  28. Du, Y.-D.; Cao, H.-X.; Liu, S.-Q.; Gu, X.-B.; Cao, Y.-X. Response of yield, quality, water and nitrogen use efficiency of tomato to different levels of water and nitrogen under drip irrigation in Northwestern China. J. Integr. Agric. 2017, 16, 1153–1161. [Google Scholar] [CrossRef]
  29. Mwinuka, P.R.; Mbilinyi, B.P.; Mbungu, W.B.; Mourice, S.K.; Mahoo, H.F.; Schmitter, P. Optimizing water and nitrogen application for neglected horticultural species in tropical sub-humid climate areas: A case of African eggplant (Solanum aethiopicum L.). Sci. Hortic. 2021, 276, 109756. [Google Scholar] [CrossRef]
  30. Shomar, B.; Darwish, M.; Rowell, C. What does integrated water resources management from local to global perspective mean? Qatar as a case study, the very rich country with no water. Water Resour. Manag. 2014, 28, 2781–2791. [Google Scholar] [CrossRef]
  31. Wilson, M.B.; Zhang, C.; Gandhi, J. Analysis of inorganic nitrogen and related anions in high salinity water using ion chromatography with tandem UV and conductivity detectors. J. Chromatogr. Sci. 2011, 49, 596–602. [Google Scholar] [CrossRef]
  32. Bello, A.S.; Saadaoui, I.; Ahmed, T.; Hamdi, H.; Cherif, M.; Dalgamouni, T.; Al Ghazal, G.; Ben-Hamadou, R. Enhancement in Bell Pepper (Capsicum annuum L.) Plants with Application of Roholtiella sp. (Nostocales) under Soilless Cultivation. Agronomy 2021, 11, 1624. [Google Scholar] [CrossRef]
  33. Intrigliolo, D.S.; Castel, J.R. Response of grapevine cv.‘Tempranillo’to timing and amount of irrigation: Water relations, vine growth, yield and berry and wine composition. Irrig. Sci. 2010, 28, 113–125. [Google Scholar] [CrossRef]
  34. Fernández, V.; Brown, P.H. From plant surface to plant metabolism: The uncertain fate of foliar-applied nutrients. Front. Plant Sci. 2013, 4, 289. [Google Scholar] [CrossRef] [PubMed]
  35. Dong, Y.; Zhao, Z.; Zhang, X.; Liu, X.; Li, Q. Improvement of alternate partial root-zone drip irrigation on photosynthesis and water use efficiency of cucumbers. J. Plant Nutr. Fertil. 2016, 22, 269–276. [Google Scholar]
  36. Huang, P.F.; Yin, G.H.; Gu, J.; Liu, Z.X.; Guo, J.L. Effects of alternate subsurface drip irrigation on yield and water use efficiency of spring maize. Ying Yong Sheng Tai Xue Bao= J. Appl. Ecol. 2016, 27, 2507–2512. [Google Scholar]
  37. Liu, X.; Liu, B.; Cui, Q.; Zhang, W.; Li, M.; Ai, X.; Bi, H.; Li, Q. Effects of alternative drip irrigation and nitrogen fertilization on growth, photosynthesis, yield, and water-nitrogen use efficiency of cucumbers in solar greenhouse. Plant Physiol. J. 2016, 52, 905–916. [Google Scholar]
  38. Luo, H.; Li, F. Tomato yield, quality and water use efficiency under different drip fertigation strategies. Sci. Hortic. 2018, 235, 181–188. [Google Scholar] [CrossRef]
  39. Salokhe, V.; Babel, M.; Tantau, H. Water requirement of drip irrigated tomatoes grown in greenhouse in tropical environment. Agric. Water Manag. 2005, 71, 225–242. [Google Scholar]
  40. Abdalhi, M.A.; Cheng, J.; Feng, S.; Yi, G. Performance of drip irrigation and nitrogen fertilizer in irrigation water saving and nitrogen use efficiency for waxy maize (Zea mays L.) and cucumber (Cucumis sativus L.) under solar greenhouse. Grassl. Sci. 2016, 62, 174–187. [Google Scholar] [CrossRef]
  41. Hashem, F.; Medany, M.; El-Moniem, E.M.A.; Abdallah, M.M.F. Influence of green-house cover on potential evapotranspiration and cucumber water requirements. Arab Univ. J. Agric. Sci. 2011, 19, 205–215. [Google Scholar]
  42. Ngouajio, M.; Wang, G.; Goldy, R. Withholding of drip irrigation between transplanting and flowering increases the yield of field-grown tomato under plastic mulch. Agric. Water Manag. 2007, 87, 285–291. [Google Scholar] [CrossRef]
  43. Amer, K.H.; Midan, S.A.; Hatfield, J.L. Effect of deficit irrigation and fertilization on cucumber. Agron. J. 2009, 101, 1556–1564. [Google Scholar] [CrossRef]
  44. Dogan, E.; Kirnak, H.; Berekatoglu, K.; Bilgel, L.; Surucu, A. Water stress imposed on muskmelon (Cucumis melo L.) with subsurface and surface drip irrigation systems under semi-arid climatic conditions. Irrig. Sci. 2008, 26, 131–138. [Google Scholar] [CrossRef]
  45. Du, T.; Kang, S.; Zhang, J.; Li, F.; Hu, X. Yield and physiological responses of cotton to partial root-zone irrigation in the oasis field of northwest China. Agric. Water Manag. 2006, 84, 41–52. [Google Scholar] [CrossRef]
  46. Du, T.; Kang, S.; Zhang, J.; Li, F. Water use and yield responses of cotton to alternate partial root-zone drip irrigation in the arid area of north-west China. Irrig. Sci. 2008, 26, 147–159. [Google Scholar] [CrossRef]
  47. Chai, Q.; Gan, Y.; Turner, N.C.; Zhang, R.-Z.; Yang, C.; Niu, Y.; Siddique, K.H. Water-saving innovations in Chinese agriculture. Adv. Agron. 2014, 126, 149–201. [Google Scholar]
  48. Zhang, H.-X.; Chi, D.-C.; Qun, W.; Jun, F.; Fang, X.-Y. Yield and quality response of cucumber to irrigation and nitrogen fertilization under subsurface drip irrigation in solar greenhouse. Agric. Sci. China 2011, 10, 921–930. [Google Scholar] [CrossRef]
  49. Sahin, U.; Kuslu, Y.; Kiziloglu, F. Response of cucumbers to different irrigation regimes applied through drip-irrigation system. JAPS J. Anim. Plant Sci. 2015, 25, 198–205. [Google Scholar]
  50. Souri, M.K.; Hatamian, M. Aminochelates in plant nutrition: A review. J. Plant Nutr. 2019, 42, 67–78. [Google Scholar] [CrossRef]
  51. Dimkpa, C.O.; Fugice, J.; Singh, U.; Lewis, T.D. Development of fertilizers for enhanced nitrogen use efficiency–Trends and perspectives. Sci. Total Environ. 2020, 731, 139113. [Google Scholar] [CrossRef]
  52. Padilla, F.M.; Farneselli, M.; Gianquinto, G.; Tei, F.; Thompson, R.B. Monitoring nitrogen status of vegetable crops and soils for optimal nitrogen management. Agric. Water Manag. 2020, 241, 106356. [Google Scholar] [CrossRef]
  53. Cabello, M.J.; Castellanos, M.; Romojaro, F.; Martinez-Madrid, C.; Ribas, F. Yield and quality of melon grown under different irrigation and nitrogen rates. Agric. Water Manag. 2009, 96, 866–874. [Google Scholar] [CrossRef]
  54. Cui, B.-J.; Niu, W.-Q.; Du, Y.-D.; Zhang, Q. Response of yield and nitrogen use efficiency to aerated irrigation and N application rate in greenhouse cucumber. Sci. Hortic. 2020, 265, 109220. [Google Scholar] [CrossRef]
Figure 1. Shoot height (A), SPAD index (B), stem diameter (C), root length (D), fruit length (E), fruit width (F), number of fruit unit−1 (G), fruit weight (H), and yield (ton ha−1) (I) of cucumber-treated plants treated with 50, 70, and 100% nitrogen deficit (N1, N2, and N3) and 50 and 100% full drip irrigation (W1 and W2). The interaction study is represented by T1 (Full irrigation, 100% nitrogen), T2 (Full irrigation, 70% nitrogen), T3 (Full irrigation, 50% nitrogen), T4 (Deficit irrigation, 100% nitrogen), T5 (Deficit irrigation, 70% nitrogen), and T6 (Deficit irrigation, 50% nitrogen) respectively with three replicates per treatment. The different letters indicate significance according to the Tukey’s test (p < 0.05).
Horticulturae 09 01336 g001aHorticulturae 09 01336 g001b
Table 1. Details of experimental treatments with irrigation and nitrogen fertilizer.
TreatmentTreatment Designation
Irrigation method (independent)
Deficit irrigation–50%W1
Full irrigation–100%W2
50 kg N ha−1 (50% of recommended N1)N1
70 kg N ha−1 (70% of recommended N2)N2
100 kg N ha−1 (100% of recommended N3)N3
Interaction
Full irrigation, 100% nitrogen (W2N3)T1
Full irrigation, 70% nitrogen (W2N2)T2
Full irrigation, 50% nitrogen (W2N1)T3
Deficit irrigation, 100% nitrogen (W1N3)T4
Deficit irrigation, 70% nitrogen (W1N2)T5
Deficit irrigation, 50% nitrogen (W1N1)T6
Table 2. Application of nitrogen fertilizer at different growth stages of cucumber. N1: 50% of recommended N, N2: 70% of recommended N, N3: 100% of recommended N.
N Fertilizer ApplicationSeedlingFloweringFruit EnlargingFruit Maturity
N1 50 kg N ha−1 (50%)5151515
N2 70 kg N ha−1 (70%)7212121
N3 100 kg N ha−1 (100%)10303030
Table 3. Effect of drip irrigation and N treatment on the vegetative growth parameters and yield of cucumber. Analysis of variance (ANOVA) p values are shown (p < 0.05, significance; p > 0.05, no significance). Different lowercase letters in the same column represent significant differences between N treatments or drip irrigation methods or interactions (p < 0.05); the same letters represent non-significant differences between N treatments or drip irrigation methods or interactions (p > 0.05) with three replicates per treatment.
TreatmentsShoot Height (cm)SPAD IndexStem Width (mm)Root Length (cm)Fruit Length (mm)Fruit Width (mm)Number of Fruit/UnitFruit Weight (g)Yield (ton/ha)
Drip irrigation levels
W5018.58 ± 0.15 a37.42 ± 0.92 a7.78 ± 0.13 a20.2 ± 0.29 a150.98 ± 3.91 a39.09 ± 0.56 a48 ± 0.84 a196.01 ± 2.68 a29.58 ± 1.41 a
W10018.23 ± 0.12 b34.07 ± 0.39 b7.25 ± 0.05 b18.5 ± 0.52 b143.77 ± 3.16 b36.86 ± 0.33 b43 ± 0.58 b178.36 ± 1.23 b24.58 ± 1.13 b
Nitrogen treatments
N5018.67 ± 0.07 a35.60 ± 1.20 b7.63 ± 0.17 a19.32 ± 0.60 b149.87 ± 2.84 a37.58 ± 0.22 b45 ± 0.26 a192.46 ± 5.79 a27.47 ± 0.78 a
N7018.54 ± 0.20 a37.02 ± 1.35 a7.61 ± 0.20 a20.63 ± 0.24 a156.56 ± 2.77 a38.70 ± 0.93 a53 ± 0.76 b185.91 ± 2.26 b31.05 ± 1.68 b
N10018 ± 0.11 b34.61 ± 0.44 c7.31 ± 0.07 b18.10 ± 0.46 c135.7 ± 2.7 b37.64 ± 0.83 b39 ± 0.37 c183.18 ± 4.45 b22.73 ± 1.08 c
Interaction
T117.99 ± 0.24 c35.28 ± 0.63 c7.29 ± 0.04 b17.1 ± 0.17 c131.45 ± 0.36 c35.84 ± 0.19 d37 ± 0.33 d173.60 ± 0.75 a20.39 ± 0.55 d
T218.10 ± 0.05 bc34.00 ± 0.11 cd7.16 ± 0.02 b20.4 ± 0.47 a150.85 ± 0.83 ab36.73 ± 0.22 cd48 ± 0.58 b180.89 ± 0.27 c27.56 ± 0.96 bc
T318.58 ± 0.04 ab32.93 ± 0.12 d7.29 ± 0.15 b18 ± 0.27 bc149.00 ± 2.13 ab38.00 ± 0.13 bc45 ± 0.00 bc180.59 ± 0.63 cd25.80 ± 0.09 c
T418.00 ± 0.02 c33.94 ± 0.35 cd7.32 ± 0.16 b19.1 ± 0.17 bc139.95 ± 4.28 cb39.44 ± 0.39 ab41 ± 0.33 cd192.76 ± 2.60 b25.07 ± 0.28 c
T518.99 ± 0.09 a40.04 ± 0.11 a8.05 ± 0.05 a20.87 ± 0.15 a162.27 ± 2.27 a40.67 ± 0.65 a57 ± 0.58 a190.92 ± 0.62 bc34.54 ± 0.97 a
T618.75 ± 0.12 a38.27 ± 0.26 b7.97 ± 0.07 a20.63 ± 0.15 a150.73 ± 5.93 ab37.16 ± 0.23 cd45 ± 0.58 bc204.34 ± 5.12 a29.14 ± 0.45 b
Table 4. Analysis of variance showing statistically significant effects of various treatments on cucumber shoot height, SPAD index, stem width, root length, fruit length, fruit width, number of fruit/plant, fruit weight, and yield. Three replicates per treatment. * Indicates highly significant differences at p < 0.05 level, ns = not significant.
Source of VariationAdjusted Mean Square
Shoot Height (cm)SPAD IndexStem Width (mm)Root Length (cm)Fruit Length (mm)Fruit Width (mm)Number of Fruit/PlantFruit Weight (g)Yield (ton/ha)
N treatment0.76 *8.83 *0.20 *9.64 *680.36 *2.36 *30.50 *136.54 *104.50 *
Drip irrigation levels0.56 *50.41 *1.28 *13.01 *234.43 *22.49 *9.39 *1400.79 *112.51 *
N × W levels0.33 *24.90 *0.29 *1.87 *37.07 ns10.68 *3.39 *73.21 *5.09 *
SE0.040.310.030.231.970.370.6117.171.24
SD0.171.330.120.84135.551.552.5972.85.25
Table 5. Certain soil and water characteristics in the open field experiment with three replicates per treatment.
Chemical ConstituentsAnalytical MethodSoil Sample (depth 0–30 cm)(mg kg−1 DW)Water Sample (mg L−1)
Sodium (Na)Ion chromatography (IC)andInductively coupled plasma–optical Emission spectrometry (ICP–OES)10,294 ± 97.4274.5 ± 8.7
Magnesium (Mg)32,031 ± 134.798.5 ± 2.2
Potassium (K)13,445 ± 40.524.5 ± 1.7
Calcium (Ca)62,330 ± 126.6297.7 ± 4.7
Boron (B)3849 ± 31.7nd
Copper (Cu)30 ± 0.1nd
Iron (Fe)26,378 ± 129.4nd
Manganese (Mn)585 ± 2.8nd
Zinc (Zn)76 ± 0.5nd
Phosphorus (P)1223 ± 11.4nd
Chlorine (Cl)nd433.5 ± 10.6
Sulfate (SO4)nd422.5 ± 11.8
EC (mS/cm)YSI Meter2.25 ± 1.43.01 ± 0.5
pH7.82 ± 0.27.07 ± 0.4
TOM (%)MOOPAM0.5 ± 0.2nd
EC, electrical conductivity; pH, potential of hydrogen; TOM (%), total organic matter; nd, not determined with three replicates.
Disclaimer/Publisher’s Note: The statements, opinions and data contained in all publications are solely those of the individual author(s) and contributor(s) and not of MDPI and/or the editor(s). MDPI and/or the editor(s) disclaim responsibility for any injury to people or property resulting from any ideas, methods, instructions or products referred to in the content.

