Abstract
Water shortage, one of the main limiting factors for plant growth and development, can be alleviated by an adequate nutrient supply. The effect of different nitrogen (N), phosphorus (P) and potassium (K) supply levels and their combinations was examined in different rainfall supply periods (wet, normal, dry) on a grass sward in a field experiment. Dry and fresh aboveground biomass production were primarily increased by the N–rainfall supply interaction, from 0.739 to 6.51 and from 1.84 to 21.8 t ha−1, respectively, but the P–rainfall supply and N–P interactions and K treatment all had significant effects. Dry matter content was primarily influenced by the N–rainfall supply interaction, increasing in response to N in dry periods and declining in wet periods. Water use efficiency (WUE) was increased by the N–rainfall supply interaction from 28.3 to 127 kg ha−1 mm−1, but the N–P interaction had a similarly strong effect, and K treatment increased it in the dry period. The N, P and K contents of the aboveground biomass were increased by treatment with the corresponding element, but were also influenced by rainfall supply. The increase in biomass, mainly due to N treatment, caused the dilution of the P and K contents in grass in treatments poorly supplied with P and K. Biomass production and WUE were significantly improved up to a dose of 200 kg ha−1 year−1 of N, up to a supply level of 153 mg kg−1 of P2O5, and 279 mg kg−1 of K2O measured in the soil. Treating grass with the N, P and K macroelements may effectively increase biomass production and water use efficiency, but above a certain level their application is unnecessary.
1. Introduction
Most of the fresh biomass of plants is made up of water. A lack of water induces many unfavourable morphological, physiological and biochemical processes in plants. In dry periods, the water potential, transpiration rate and relative water content are reduced, and the leaf temperature is increased [1]. Drought stress in plants reduces photosynthesis and carbon dioxide fixation and accelerates the production of reactive oxygen species, causing oxidative damage to proteins, DNA and lipids. These processes limit the division of cells and, in more severe cases, may cause membrane damage and cell death [2].
Longer drought periods, reduced rainfall and higher temperatures can therefore cause serious problems for both the natural ecosystem and agricultural production. Meanwhile, agriculture is also facing increasingly serious challenges due to the growing population. Water deficit, and the resulting drought stress, is one of the main limiting factors for crop germination, growth, development and biomass production [3]. Global crop production losses are likely to increase as higher temperatures and water shortages become more frequent in many regions of the world [2].
As plants dry up, the amount of nutrients, including their absorption and distribution, largely determines the remaining growth activity. Drought stress can be alleviated if the plant is well supplied with certain nutrients. Optimal nutrient supply increases water use efficiency (WUE) and promotes root growth, giving the plant the opportunity to access water and nutrients from deeper soil layers [4]. It is therefore important to determine the role of mineral nutrients in plant growth under drought stress, the effect of drought stress on nutrient availability and the interactions between nutrient application and plant response to drought stress. Numerous elements have been shown to alleviate the negative effects of drought stress. In addition to the macroelements N, P and K [5,6,7], B, Mn [8], Ca [9], Se [10], Si [11,12] and Zn [13] have also been reported to mitigate the negative effects of water deficit.
Of the macroelements N, P and K, the most extensive studies have involved K [14]. Adequate K supplies may alleviate the negative effects of drought stress, while in the case of K deficiency, leaf cell turgor decreases, transpiration increases and water retention decreases [15]. K reduces the harmful effects of the reactive oxygen species produced in plants due to stress by increasing photosynthetic electron transport and inhibiting the activity of membrane-bound NADPH oxidases [16]. A sufficient level of K supplementation has been reported to mitigate the effects of water stress, for example in potato [17], tomato [18], barley [19], winter wheat [1] and maize [20].
As macroelements, both N and P help plants to tolerate drought by promoting plant development, making them stronger and more resistant to abiotic stress, and also by improving WUE [21]. N is an important base for proteins, nucleic acids and certain plant hormones [22]. Adequate N supplies were found to assist drought-stressed plants to tolerate drought stress by maintaining higher leaf water potential, photosynthetic activity, chlorophyll and Rubisco content, a stronger antioxidative defence system and lower lipid peroxidation [23,24]. P application has a positive effect on plant growth during drought [25], improving photosynthesis, nitrate reductase activity, nutrient accumulation [26], stomatal conductance and WUE [6,27].
If sufficient water is available to plants, the limiting factor is usually primarily N; although, depending on the properties of the soil, P and K are also important, so their adequate supply in the soil is crucial [28,29]. Most studies have evaluated the individual effects of N, P or K on the development and biomass production of plants during drought, while studies on the combined effects of these nutrients are scant [7,30]. To the best of our knowledge, the role of these three macroelements in grass biomass production, dry matter content and WUE has not yet been investigated in a factorial field experiment with four nutrient levels and three rainfall levels, thus enabling their effects to be compared and optimal supply levels to be determined.
In the case of grasses, drought also causes a decrease in leaf water content, photosynthesis, respiration and root activity [31,32,33], which may cause a decrease in biomass production [34] and impair the nutritive value of the hay [35].
The use of fertilisers is common practice for intensive swards [36], such as golf courses or lawns, but they may also be applied in places where irrigation cannot or will not be provided, so that only natural precipitation serves as the water source [37]. Grass may also serve as a cover plant, for example, between rows in orchards or vineyards or in the case of slope cultivation [38]. The favourable effect of N, P and K fertilisation on the drought tolerance of grasses has also been confirmed [39,40,41].
The evolution of the sward composition examined here was described earlier [42], and a previous study showed that, among the N, P and K treatments, K had the least effect on biomass production in this soil [43]. The objectives of the present study were to reveal the extent to which the soil N, P and K supplies improved the biomass production and WUE of the grass, and whether better macroelement supplies resulted in a significant biomass increase even in drier periods, when nutrient uptake may be inhibited.
The hypothesis was that drought tolerance, represented by biomass production and WUE in dry precipitation periods, would be promoted by N, P and K, but to the greatest extent by N and K. It was also expected that the concentration of N, P and K in the aboveground biomass would increase in dry periods because the higher element concentration in the reduced biomass was expected to exceed the inhibition of uptake from the soil.
2. Materials and Methods
The experiment was carried out in the framework of a long-term fertilisation experiment. The sward was established in the autumn of 2000 at the Nagyhörcsök Research Station of the Institute for Soil Sciences, Centre for Agricultural Research, HUN-REN (N 46°51′56.84″; E 18°31′10.17″; alt. 140 m a.s.l.).
The calcareous chernozem loamy soil (Calcaric Phaeosem) of the site had a pH(H2O) of 8.24, a pH(KCl) of 7.39, and a CEC of 28.3 meq 100 g−1, and contained 3.04% organic matter and 4.27% CaCO3 in the 0–20 cm layer. The total N content was 2031 mg kg−1 and the mineral N content was 15.3 mg kg−1 [44]. The area was drought-sensitive, with a groundwater table at a depth of 13–15 m, and had an average yearly precipitation of 537 mm, measured at the research station.
Plots involving all possible combinations of the different N, P and K treatment levels were set up in a factorial design. The trial included 4 N × 4 P × 4 K = 64 treatments in 2 replicates, giving a total of 128 plots, each measuring 6 m by 6 m. The individual treatments represented low (unfertilised control), moderate, high and very high supply levels. The fertilisers were applied as Ca-ammonium nitrate, superphosphate and potassium chloride. The 0, 100, 200 and 300 kg ha−1 N doses were applied yearly and in two halves, one in autumn and the other in spring. Since P and K are less mobile in the soil, P and K fertilisers were applied at rates of 0, 500, 1000 and 1500 kg of P2O5 and K2O in the autumn of 1999 to provide fertilisation for the next 10–15 years. Since the N fertiliser was spread on the surface and the P and K fertilisers were applied before the sward was established, no tillage was necessary, and the grass was not affected by any agrotechnical disturbances besides mowing. The P and K supplies of the soil in the plots was subsequently checked every 5 years to make sure that the established nutrient supply treatments were still markedly different from each other. The treatments and the ammonium lactate-soluble (AL) P and K contents of the ploughed layer are shown in Table 1. Accordingly, these fertilisation treatment levels will be referred to as N0, N1, N2, N3, P0, P1, P2, P3, K0, K1, K2 and K3.

Table 1.
Treatment levels and the AL-soluble P2O5 and K2O contents in the ploughed layer of the soil.
The soil was analysed using the following analytical tests: the soil pH(H2O) was measured in a 1:2.5 soil:water suspension after mixing for 12 h, pH(KCl) using 1 M KCl solution [45], total N content with the Kjeldahl method [46], mineral N content according to Bremner and Keeney [47], cation exchange capacity (CEC) with the modified method of Mehlich [48], organic matter content with the modified Walkley–Black method [49] and CaCO3 content with the Scheibler gas-volumetric method [50]. The plant-available P2O5 and K2O fractions were measured after extraction with ammonium acetate-lactate (AL-P2O5 and AL-K2O) [51].
The biomass yield of the grass at the time of mowing is influenced less by the annual rainfall than by the seasonal rainfall [52]. In a previous paper, it was reported that the yield of the first mowing of this sward was mainly influenced by the precipitation sum in the months of March and April [53]. As a longer period was examined in the present work, the tests were performed again, and it was confirmed that the precipitation sum in March and April was the most suitable predictor of biomass production with a value of R = 0.279 significant at p < 0.05.
Three categories were identified based on the precipitation sum in March and April during the period 2001–2010: dry, normal and wet periods. For each of these categories, two typical years were selected, so that the periods were clearly separated from each other. The data of the following years were selected for analysis based on their sum of precipitation in the months of March and April: dry period: 2003—27.0 mm and 2009—20.8 mm; normal period: 2002—53.3 mm and 2010—67.7 mm; wet period: 2001—109.3 mm and 2005—92.2 mm (Figure 1). The 50-year average precipitation sum at the experimental site in March and April was 70.8 mm, while the annual sum was 544 mm. The 50-year average temperature in March and April were 6.5 and 11.9 °C, respectively, while the annual average temperature was 11.2 °C. Regarding the monthly temperature values, the studied years showed no substantial deviation from the average.
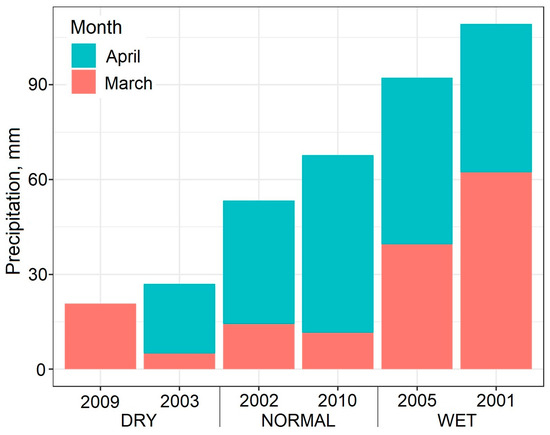
Figure 1.
Sum of precipitation in the months of March and April in the studied years with the indication of the rainfall categories (dry, normal, wet).
Precipitation was measured with a Hellmann rain gauge, installed at 1 m above the ground. The amount of precipitation was recorded daily at 7 a.m. The accuracy of the measurement was 0.1 mm.
Aboveground biomass was harvested once a year in the dry years and twice in wet years, but as the majority, that is 79.5%, of the mowed hay biomass came from the first mowing, so for the sake of comparability, only the biomass data of the first mowing was taken into account. The aboveground vegetation was harvested annually in late May or early June with a clipping height of 4 cm. The fresh biomass was weighed immediately after mowing and was subsequently dried in a drying room at 30 °C for 10 days, after which the hay biomass was measured.
In this study, WUE expresses the mass of dry biomass production per hectare in relation to the amount of precipitation, so it takes into account the total amount of water received by the soil–plant system [54]. WUE was calculated based on the following formula:
WUE [kg ha−1 mm−1] = dry biomass production [kg ha−1]/sum of precipitation (April + May) [mm].
The average relative abundance of the grassland for the examined period was as follows: 23% crested wheatgrass (Agropyron cristatum), 21% smooth brome (Bromus inermis), 19% tall fescue (Festuca arundinacea), 11% field chickweed (Cerastium arvense), 6.3% shepherd’s purse (Capsella bursa-pastoris), 3.8% cocksfoot grass (Dactylis glomerata), 3.4% black medick (Medicago lupulina) and 2.7% field bindweed (Convolvulus arvensis), while the remaining 10% was made up of other species.
To determine the plant P and K element contents, the dried plant samples were finely ground and digested in a mixture of 7 cm3 67% HNO3 and 3 cm3 30% H2O2, after which the ICP technique was used (ICP-AES, Jobin Yvon Ultima2, Horiba Scientific Ltd., Kyoto, Japan). The plant N content was determined with the Kjeldahl method [55].
The effect of N, P, K supply levels and precipitation periods on dry and fresh biomass, dry matter content, WUE and the N, P and K content of grass aboveground biomass was evaluated with factorial ANOVA. Depending on the ANOVA results, further investigations were made on the main effects or interactions. The significance of the differences between individual treatments was tested with Tukey’s HSD post hoc test (p < 0.05). The Statistica v.13 software (TIBCO Software Inc., Palo Alto, CA, USA) was used for the statistical evaluation, and the ggplot2 package [56] of the R software [57] was used to create the figures.
3. Results
The analysis of the main effects and interactions of the various factors on the response variables is shown in Table 2. Both the wet and dry biomass yields were affected by the interactions between rainfall periods, N and P treatments, and the main effect of the K treatment. It can also be seen that the K treatment did not interact with any other factor, so there was no significant difference in the case of either dry, normal and wet periods, or different N and P treatment levels. With regard to biomass production, only the main effect of the K treatment will be examined in the following, while in the case of precipitation periods, N and P treatments’ pairwise interactions will also be analysed.
Table 2.
F-values for each source of variation in the rainfed grass experiment.
The rainfall period–N interaction and the main effects of the P and K treatments on the dry matter content were all significant. WUE was significantly influenced by the interactions of rainfall period–N, rainfall period–K and N–P. The N content of the grass was influenced by the rainfall period–N interaction, and the P content by rainfall period–N treatment interaction and by the main effects of the P and K treatments. The K content was determined by the N–K interaction and the main effect of the rainfall period.
Figure 2 shows that dry biomass production increased significantly in the N1 treatment compared to the N0 treatment and in the N2 treatment compared to the N1 and N0 treatments, except in the wet rainfall period, but the difference between N3 and N2 was no longer significant in any rainfall period. At the N0 level, biomass production increased in the wet rainfall period compared to the other two periods; however, in the case of the higher N treatment levels, the differences between the biomass productions in the dry and normal rainfall periods were larger, while the results of the normal and wet periods were more similar. As a result of the rainfall–N interaction, the dry biomass production increased from the lowest 0.739 t ha−1, measured at the N0 level in the dry period, to 6.51 t ha−1, measured at the N2 level in the wet period (Figure 2A). In the case of P, the effects were moderate compared to N. The difference was only significant between P0 and the other P levels in the normal and wet periods, whereas there were no significant differences between any P levels in the dry period. At the same time, except for biomass production in the normal and wet periods at the P0 level, the rainfall periods were significantly different from each other at all P levels. Biomass production increased from 1.80 t ha−1 (P0 level of the dry period) to 6.10 t ha−1 as a result of the rainfall–P interaction (Figure 2B). In the case of the N–P interaction, at the N0 level the rising P levels alone did not induce an increase in dry biomass production, and even at higher N levels there was only a significant difference between the P0 and P1 treatments, so the higher P levels no longer resulted in surplus dry biomass production. Dry biomass production increased from 1.25 t ha−1 measured at the N0 × P0 level to 5.70 t ha−1 measured at the N3 × P3 level as a result of the N–P interaction (Figure 2C). Increasing K supplies increased the dry biomass production slightly, but significantly only between the K0 and K2 treatments, while the K3 treatment increased it only to a non-significant extent compared to K2 (Figure 2D).
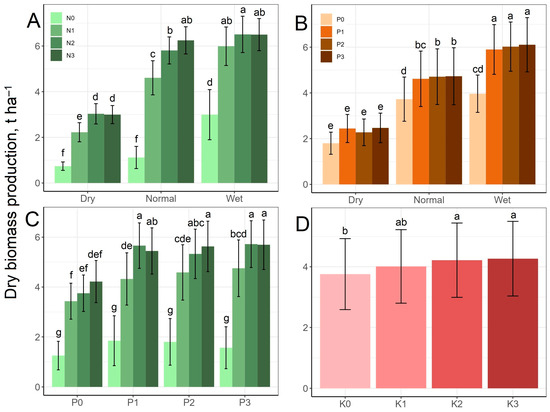
Figure 2.
Effect of rainfall–N (A), rainfall–P (B) and N–P (C) interactions and K treatment (D) on dry biomass production mean values. The columns represent the means and the error bars the standard deviation. The letters indicate significant differences between the means (Tukey’s HSD, p < 0.05).
Changes in fresh biomass as a result of the treatments are shown in Figure 3. For each N treatment level from N1 to N3, the fresh biomass production in different rainfall periods differed significantly, increasing with increases in the amount of rainfall. In the normal and wet periods, the fresh biomass increased significantly under the N1 and N2 treatments and, in the dry period, under the N1 treatment compared to N0, while N3 did not produce a significant surplus compared to N2. Fresh biomass production increased from 1.85 t ha−1 at the N0 level in the dry period to 21.8 t ha−1 at the N2 level in the wet period (Figure 3A). The P0 control level was significantly different from the higher P levels only in the wet period. All three periods were statistically different from each other at all P levels. The average biomass production of 5.29 t ha−1 in the dry period was increased to 13.3 t ha−1 by the higher rainfall of the wet period without P treatment, which was further increased to an average of 19.6 t ha−1 by the P1–3 treatments (Figure 3B). Regarding the N–P interaction, the amount of fresh biomass did not increase significantly above the P1 treatment level. At the N0 level, different P treatments did not cause a significant difference in the fresh biomass. The lowest value was produced by the N0 × P0 treatment (3.70 t ha−1), while the highest was produced by the N2 × P1 treatment (16.7 t ha−1) (Figure 3C). The biomass production increased parallel to the rising K levels from 10.8 to 12.6 t ha−1, but the difference in biomass production was significant only between K0 and K2–K3, as well as K1 and K3 (Figure 3D).
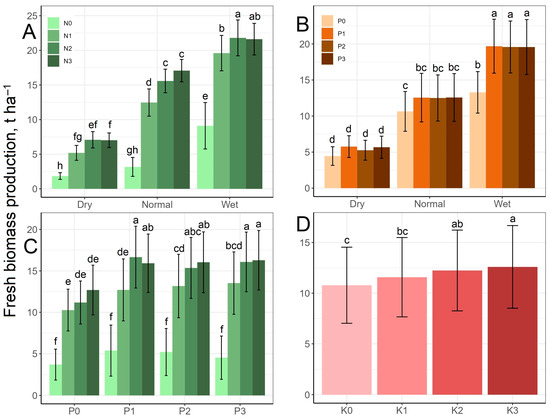
Figure 3.
Effect of the rainfall–N (A), rainfall–P (B) and N–P (C) interactions and K treatment (D) on fresh biomass production mean values. The columns represent the means and the error bars the standard deviation. The letters indicate significant differences between the means (Tukey’s HSD, p < 0.05).
Figure 4 shows that the rainfall–N interaction greatly influenced the dry matter content of the grass, which of course decreased with increasing rainfall. In the dry period, the N treatment further increased the dry matter content (highest value: 43.8% at the N2 level in the dry period), while in the wet period it further decreased it (lowest value: 29.9% at the N2 level in the wet period) (Figure 4A). P had an increasing effect, as the dry matter contents measured at the P1–3 levels were significantly higher (with the highest value of 37.6% at the P3 level) than for the P0 control (35.6%) (Figure 4B). Higher K levels decreased dry matter content, but the difference was only significant between K0 (37.5%) and K3 (36.2%) (Figure 4C).
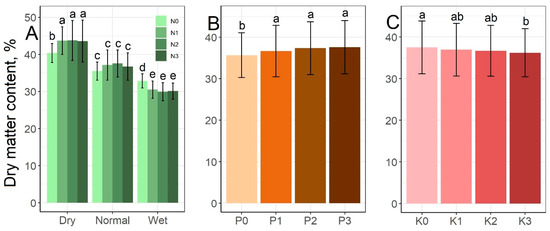
Figure 4.
Effect of the rainfall–N interaction (A), P (B) and K treatment (C) on dry matter content mean values. The columns represent the means and the error bars the standard deviation. The letters indicate significant differences between the means (Tukey’s HSD, p < 0.05).
Figure 5 shows that the N1 treatment significantly increased WUE compared to N0, and the N2 and N3 treatments compared to N1. Also, the effect of N was significantly stronger in the dry and normal rainfall periods than in the wet period. The WUE values were the lowest in the wet period averaged over the N treatments, but considering the rainfall–N interaction, the lowest value was found at the N0 level in the normal rainfall period (19.1 kg ha−1 mm−1), while the highest was in the dry period at the N2 level (127 kg ha−1 mm−1) (Figure 5A). Considering the rainfall–K interaction, K had an increasing effect on WUE, but this was significant only in the dry rainfall period, in which the greatest difference was between the K0 (79.5 kg ha−1 mm−1) and K2 (102 kg ha−1 mm−1) treatments (Figure 5B). The P treatment enhanced the WUE-increasing effect of N, since the N2 and N3 treatments resulted in a significantly higher WUE at the P1 treatment level than at the P0 level. However, increases above the P1 level were no longer significant (Figure 5C).
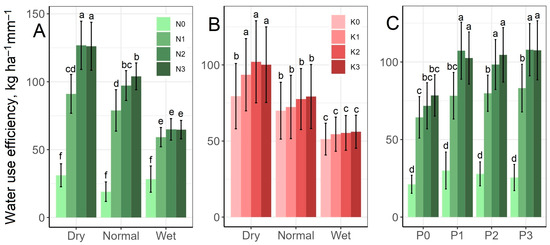
Figure 5.
Effect of the rainfall–N (A), rainfall–K (B) and N–P (C) interactions on water use efficiency mean values. The columns represent the means and the error bars the standard deviation. The letters indicate significant differences between the means (Tukey’s HSD, p < 0.05).
Figure 6 shows the N content of grass aboveground biomass. At the N0 level, very similar N contents were detected for all the rainfall periods. The results obtained in the dry and wet periods were surprisingly similar, and there was no significant difference between the two periods at the individual N levels, but lower N contents were recorded in the normal period at the N1–N3 treatment levels. N content varied between 0.968% (at the N0 level in the dry period) and 2.16% (at the N3 level in the wet period).
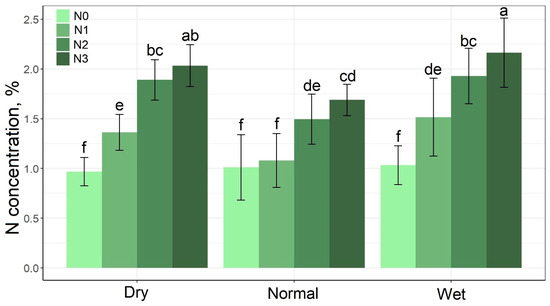
Figure 6.
Effect of the rainfall–N interaction on N content mean values of grass aboveground biomass. The columns represent the means and the error bars the standard deviation. The letters indicate significant differences between the means (Tukey’s HSD, p < 0.05).
The P content of grass biomass is shown in Figure 7. At the N0 level, the P content decreased parallel to the increase in the rainfall supply, so the highest value was reached at the N0 level in the dry period (3281 mg kg−1). However, at the N1 level and above, the P contents in the wet rainfall period exceeded the values measured in the dry and normal periods (Figure 7A). As the P treatment levels increased, the P content of the grass increased significantly from the P0 level (1490 mg kg−1) up to the P2 level (2304 mg kg−1), whereas the difference between the P2 and P3 levels was not significant (Figure 7B). K treatment caused a decrease in P content, but this was only significant between the K0 and K2–3 levels (Figure 7C).
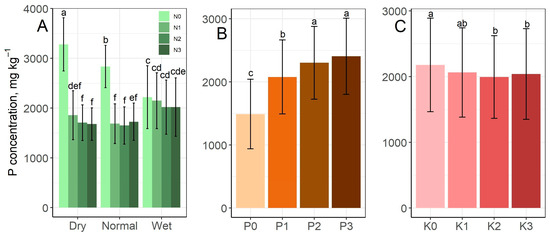
Figure 7.
Effect of the rainfall–N (A) and P–N interactions (B) and K treatment (C) on the P content mean values of grass aboveground biomass. The columns represent the means and the error bars the standard deviation. The letters indicate significant differences between the means (Tukey’s HSD, p < 0.05).
Figure 8 shows the K content of grass, which increased significantly parallel to the increase in rainfall supply from 14,920 mg kg−1 (dry period) to 20,350 mg kg−1 (wet period) (Figure 8A). The K content of the aboveground biomass also increased after K treatment, but this was influenced by the N treatments. At the K0 level, the N2 treatment significantly reduced the K content compared to the N0 level, whereas at the K3 level, the N1–3 treatments non-significantly increased the K content compared to the N0 level. The lowest value was found in N2 × K0 (11,006 mg kg−1), while the highest value in the N3 × K3 (22,813 mg kg−1) treatment combination (Figure 8B).
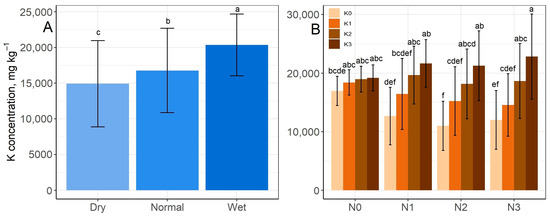
Figure 8.
Effect of rainfall (A) and the K–N interaction (B) on K content mean values of grass aboveground biomass. The columns represent the means and the error bars the standard deviation. The letters indicate significant differences between the means (Tukey’s HSD, p < 0.05).
4. Discussion
Drought is commonly observed to decrease biomass in grasslands [58]. The results of the present study confirmed the negative effect of drought on biomass production. N and P had a different effect on biomass production depending on the rainfall amount (Table 2). Chang et al. [22] found that N treatment effectively improved the drought tolerance of creeping bentgrass by promoting the antioxidant metabolism and N metabolism and thus protecting cell membranes from oxidative damage. However, in the present study, the N3 treatment level no longer caused a significantly increase in either the dry or fresh biomass production, suggesting that a dose of N above 200 kg ha−1 is unnecessary under these conditions. Concerning the rainfall period–N interaction, it can be seen that N treatment significantly increased the dry biomass production in the normal and wet periods, but in the dry period, the effectiveness of N was limited (Figure 2A). In the case of fresh biomass, however, the difference between the normal and wet rainfall periods was significant at all N levels, indicating that in the case of high rainfall, high doses of 200–300 kg ha−1 year−1 of N treatment can be useful in increasing biomass (Figure 3A). The dry biomass production obtained in the present experiment was typically between 2 and 6 t ha−1, which corresponds to the results of Hofer et al. [34], who conducted fertilised lawn experiments in Switzerland and Ireland.
The biomass production in all the three rainfall periods differed significantly at all P treatment levels, except for P0. Above the P1 level, however, higher P rates no longer resulted in a significant surplus in either dry or fresh biomass. In the dry period, P treatments only caused a slight, non-significant increase in biomass (Figure 2B and Figure 3B). This is consistent with Tariq et al. [6], who found that in dry conditions, P fertilisation had no effect and P uptake was limited. The results showed that at higher P treatment levels, N treatment also resulted in higher biomass production (Figure 2C and Figure 3C), suggesting that P treatment increased N efficiency. A similar result was obtained by Francisquini Junior et al. [59] for guinea grass (Panicum maximum) when testing P fertilisers with different solubility.
In the present experiment, K increased biomass production regardless of the rainfall amount (Table 2). Hu et al. [40] reported the positive effect of K treatment on stomatal reopening and the resumption of photosynthesis in Kentucky bluegrass (Poa pratensis) following drought stress, indicating the favourable effect of K treatment under dry conditions.
P increased and K decreased the dry matter content of the sward, but N had an increasing or decreasing effect depending on the rainfall period (Figure 4). The dry matter content is a very important characteristic that helps grass to tolerate drought. A high dry matter content indicates the presence of thicker cell walls, which serve to maintain turgor [60]. In this context, it might be useful to supply plants with adequate N and P in order to increase drought resistance. At the same time, the lower dry matter content means that the plant contains more moisture, which results in an advantage in dry periods, so K supply is also beneficial.
WUE was increased by N, P and K treatments, and N and P had a mutually strengthening effect (Figure 5). Previous results also indicated the WUE-enhancing effect of macronutrients. Togawa-Urakoshi and Ueno [61] reported higher photosynthetic water-use efficiency in the case of higher N supplies for the vast majority of the grass species examined, and the ability of N to increase WUE was demonstrated in Zoysiagrass (Zoysia japonica) [39], tall fescue (Festuca arundinacea) [62], and several other plant species [21]. P application also had a positive effect on WUE by improving assimilation rate in the case of common bean (Phaseolus vulgaris) [27] and by improving the relative water content of leaves in the case of Eucalyptus grandis seedlings [6]. In a grass experiment Ihtisham et al. [63] observed the highest WUE values in treatment with lower N, P and K fertilisation levels and the lowest WUE values in treatments with higher quantities of fertilisers. However, in their experiment, WUE was the ratio of photosynthesis to transpiration, and N and K especially increased the rate of transpiration or increased it to a greater extent than photosynthesis. According to Sardans and Peñuelas [15], K has a particularly important role in increasing WUE and limiting water loss. This finding is not supported by the results of the present study, but the role played by K in drought tolerance is underlined by the fact that it significantly increased WUE in the dry period (Figure 5B).
The N content of grass may be high during the dry period due to the concentration effect [64], but the high soil moisture content in the wet rainfall period can promote N uptake [6], so both dry and wet periods can result in high N content in plants. This may also have happened in the present study. In the normal and wet periods, the dry biomass data hardly differed from each other at higher (N2 and N3) treatment levels (Figure 2). The higher rainfall quantity in the wet period, on the other hand, may have facilitated the movement of N in the soil, thus supporting plant N uptake. This could explain the equally high N content in the dry and wet periods (Figure 6). Tariq et al. [6] found that P application to eucalyptus improved the N supply of the plant in the wet rainfall period, but had no such effect in the dry period. This was not confirmed, however, in the present study.
The P content was determined by the interaction of N treatment and the rainfall supply of the period, while P and K treatments influenced P concentration alone (Figure 7). Both N and P concentrations in the aboveground biomass were the highest in the dry period, and the lowest in the normal period, contradicting the results of several previous studies. According to Bista et al. [58], drought significantly reduced the concentrations of N (by 51%) and P (by 39%) in the shoot of big bluestem grass (Andropogon gerardii), despite the fact that the biomass also decreased, so the concentration effect was unable to counteract the inhibition of N and P uptake. In other words, drought reduced the uptake of N and P more strongly than that of water, while in the present study it was the other way around. Other authors reported that drought had different effects on N and P uptake. Mariotte et al. [41] found that the uptake of P by mixed stands of four different grass species was hindered by drought to a much greater extent than that of N. This was confirmed by Dijkstra et al. [28] in an investigation in a semi-arid grassland area, suggesting that warming reduced the availability of P relative to N. The N:P ratio was inversely proportional to soil moisture, so the P concentration decreased relative to that of N during dry periods.
In contrast to N and P, K concentration increased parallel to the amount of precipitation of the period. The higher rainfall supply may have helped the movement of K in the soil, thus supporting the uptake of K by the grass. Similarly to the experiment of Studer et al. [65], the relatively abundant supply of K in the soil of the present study meant that the higher biomass resulting from the better rainfall in normal and wet seasons had adequate K supplies, so the dilution effect did not prevail for this element (Figure 8).
5. Conclusions
Significant increases were obtained in dry biomass, dry matter content and WUE up to a dose of 200 kg ha−1 year−1 of N, so this is the maximum dose that is reasonable under the given experimental conditions. P had a beneficial effect on dry and fresh biomass production, dry matter content and WUE up to a level of 153 mg kg−1 of P2O5, while levels above this proved to be unnecessary. K increased dry biomass and WUE up to a supply level of 279 mg kg−1, and fresh biomass up to 390 mg kg−1 of K2O. The N, P and K treatments had a beneficial effect on fresh and dry biomass production in all three rainfall periods, but the effect of N and P was strengthened by higher rainfall supplies. WUE increased after N, P and K treatment, but decreased with increasing rainfall supplies. The N and P concentrations were the highest in the dry period, when the K concentration was the lowest.
The N, P and K fertilisation of grasses may be justified in dry, normal and wet years because of their ability to improve biomass production. However, it is crucial to test the nutrient supplies in the soil, since, if the soil is already well supplied with nutrients, additional fertilisation will not result in surplus biomass. The results of the study draw attention to the interactions between nutrient effects and the amount of rainfall. Both N, P and K supplies and the amount of rainfall have different effects at different levels, highlighting the fact that if only one factor is examined alone or the N, P and K nutrient levels are increased together, interactions between nutrients and the water supply remain unexplored.
Author Contributions
Conceptualization, P.R., A.S. and P.C. (Péter Csontos); formal analysis, P.R.; writing—original draft preparation, P.R.; writing—review and editing, P.R., A.S., M.R., P.C. (Péter Csontos) and P.C. (Péter Csathó); visualization, P.R. All authors have read and agreed to the published version of the manuscript.
Funding
This research received no external funding.
Data Availability Statement
The data presented in this study are available on request from the corresponding author. The data are not publicly available due to certain ownership restrictions.
Acknowledgments
The authors are very grateful to the late Imre Kádár for creating and supervising the experiment.
Conflicts of Interest
The authors declare no conflict of interest.
References
- Lotfi, R.; Abbasi, A.; Kalaji, H.M.; Eskandari, I.; Sedghieh, V.; Khorsandi, H.; Sadeghian, N.; Yadav, S.; Rastogi, A. The role of potassium on drought resistance of winter wheat cultivars under cold dryland conditions: Probed by chlorophyll a fluorescence. Plant Physiol. Biochem. 2022, 182, 45–54. [Google Scholar] [CrossRef] [PubMed]
- Hasanuzzaman, M.; Nahar, K.; Gill, S.S.; Fujita, M. Drought Stress Responses in Plants, Oxidative Stress, and Antioxidant Defense. In Climate Change and Plant Abiotic Stress Tolerance, 1st ed.; Tuteja, N., Gill, S.S., Eds.; Wiley Press: Weinheim, Germany, 2013; pp. 209–249. [Google Scholar] [CrossRef]
- Dietz, K.-J.; Zörb, C.; Geilfus, C.-M. Drought and crop yield. Plant Biol. 2021, 23, 881–893. [Google Scholar] [CrossRef] [PubMed]
- Hu, Y.; Schmidhalter, U. Drought and salinity: A comparison of their effects on the mineral nutrition of plants. J. Plant Nutr. Soil Sci. 2005, 168, 541–549. [Google Scholar] [CrossRef]
- Sedri, M.H.; Roohi, E.; Niazian, M.; Niedbała, G. Interactive Effects of Nitrogen and PotassiumFertilizers on Quantitative-Qualitative Traits and Drought Tolerance Indices of Rainfed Wheat Cultivar. Agronomy 2022, 12, 30. [Google Scholar] [CrossRef]
- Tariq, A.; Pan, K.; Olatunji, O.A.; Graciano, C.; Li, Z.; Li, N.; Song, D.; Sun, F.; Wu, X.; Dakhil, M.A.; et al. Impact of phosphorus application on drought resistant responses of Eucalyptus grandis seedlings. Physiol. Plant. 2019, 166, 894–908. [Google Scholar] [CrossRef] [PubMed]
- Mahmoud, N.; Abdou, M.A.H.; Salaheldin, S.; Soliman, W.S.; Abbas, A.M. The Impact of Irrigation Intervals and NPK/Yeast on the Vegetative Growth Characteristics and Essential Oil Content of Lemongrass. Horticulturae 2023, 9, 365. [Google Scholar] [CrossRef]
- Karim, M.R.; Zhang, Y.-Q.; Zhao, R.-R.; Chen, X.-P.; Zhang, F.-S.; Zou, C.-Q. Alleviation of drought stress in winter wheat by late foliar application of zinc, boron, and manganese. J. Plant Nutr. Soil Sci. 2012, 175, 142–151. [Google Scholar] [CrossRef]
- Wang, W.H.; Chen, J.; Liu, T.W.; Chen, J.; Han, A.D.; Simon, M.; Dong, X.J.; He, J.X.; Zheng, H.L. Regulation of the calcium-sensing receptor in both stomatal movement and photosynthetic electron transport is crucial for water use efficiency and drought tolerance in Arabidopsis. J. Exp. Bot. 2014, 65, 223–234. [Google Scholar] [CrossRef]
- Nawaz, F.; Ashraf, M.Y.; Ahmad, R.; Waraich, E.A.; Shabbir, R.N.; Bukhari, M.A. Supplemental selenium improves wheat grain yield and quality through alterations in biochemical processes under normal and water deficit conditions. Food Chem. 2015, 175, 350–357. [Google Scholar] [CrossRef]
- Rea, R.S.; Islam, M.R.; Rahman, M.M.; Nath, B.; Mix, K. Growth, Nutrient Accumulation, and Drought Tolerance in Crop Plants with Silicon Application: A Review. Sustainability 2022, 14, 4525. [Google Scholar] [CrossRef]
- Reséndiz-Muñoz, J.; Cruz-Lagunas, B.; Fernández-Muñoz, J.L.; de Jesús Adame-Zambrano, T.; Delgado-Núñez, E.J.; Zagaceta-Álvarez, M.T.; Aguilar-Cruz, K.A.; Urbieta-Parrazales, R.; Miranda-Viramontes, I.; Morales-Barrera, J.; et al. Influence of Artificial Shading and SiO2 on Agastache mexicana subsp. mexicana’s Ability to Survive under Water Stress. Horticulturae 2023, 9, 995. [Google Scholar] [CrossRef]
- Al-Selwey, W.A.; Alsadon, A.A.; Alenazi, M.M.; Tarroum, M.; Ibrahim, A.A.; Ahmad, A.; Osman, M.; Seleiman, M.F. Morphological and Biochemical Response of Potatoes to Exogenous Application of ZnO and SiO2 Nanoparticles in a Water Deficit Environment. Horticulturae 2023, 9, 883. [Google Scholar] [CrossRef]
- Seleiman, M.F.; Al-Suhaibani, N.; Ali, N.; Akmal, M.; Alotaibi, M.; Refay, Y.; Dindaroglu, T.; Abdul-Wajid, H.H.; Battaglia, M.L. Drought Stress Impacts on Plants and Different Approaches to Alleviate Its Adverse Effects. Plants 2021, 10, 259. [Google Scholar] [CrossRef] [PubMed]
- Sardans, J.; Peñuelas, J. Potassium stoichiometry and global change. Glob. Ecol. Biogeogr. 2015, 24, 261–275. [Google Scholar] [CrossRef]
- Ahanger, M.A.; Tyagi, S.R.; Wani, M.R.; Ahmad, P. Drought Tolerance: Role of Organic Osmolytes, Growth Regulators, and Mineral Nutrients. In Physiological Mechanisms and Adaptation Strategies in Plants Under Changing Environment, 1st ed.; Ahmad, P., Wani, M., Eds.; Springer: New York, NY, USA, 2014; Volume 1, pp. 25–55. [Google Scholar] [CrossRef]
- Bahar, A.A.; Faried, H.N.; Razzaq, K.; Ullah, S.; Akhtar, G.; Amin, M.; Bashir, M.; Ahmed, N.; Wattoo, F.M.; Ahmar, S.; et al. Potassium-Induced Drought Tolerance of Potato by Improving Morpho-Physiological and Biochemical Attributes. Agronomy 2021, 11, 2573. [Google Scholar] [CrossRef]
- De Luca, A.; Corell, M.; Chivet, M.; Parrado, M.A.; Pardo, J.M.; Leidi, E.O. Reassessing the Role of Potassium in Tomato Grown with Water Shortages. Horticulturae 2021, 7, 20. [Google Scholar] [CrossRef]
- Cai, K.; Gao, H.; Wu, X.; Zhang, S.; Han, Z.; Chen, X.; Zhang, G.; Zeng, F. The Ability to Regulate Transmembrane Potassium Transport in Root Is Critical for Drought Tolerance in Barley. Int. J. Mol. Sci. 2019, 20, 4111. [Google Scholar] [CrossRef] [PubMed]
- Ul-Allah, S.; Ijaz, M.; Nawaz, A.; Sattar, A.; Sher, A.; Naeem, M.; Shahzad, U.; Farooq, U.; Nawaz, F.; Mahmood, K. Potassium Application Improves Grain Yield and Alleviates Drought Susceptibility in Diverse Maize Hybrids. Plants 2020, 9, 75. [Google Scholar] [CrossRef]
- Brueck, H. Effects of nitrogen supply on water-use efficiency of higher plants. J. Plant Nutr. Soil Sci. 2008, 171, 210–219. [Google Scholar] [CrossRef]
- Chang, Z.; Liu, Y.; Dong, H.; Teng, K.; Han, L.; Zhang, X. Effects of Cytokinin and Nitrogen on Drought Tolerance of Creeping Bentgrass. PLoS ONE 2016, 11, 0154005. [Google Scholar] [CrossRef]
- Abid, M.; Tian, Z.; Ata-Ul-Karim, S.T.; Cui, Y.; Liu, Y.; Zahoor, R.; Jiang, D.; Dai, T. Nitrogen Nutrition Improves the Potential of Wheat (Triticum aestivum L.) to Alleviate the Effects of Drought Stress during Vegetative Growth Periods. Front. Plant Sci. 2016, 7, 981. [Google Scholar] [CrossRef] [PubMed]
- Kovács, A.B.; Vágó, I.; Kremper, R. Growth and yield responses of garden bean (Phaseolus vulgaris L.) to nitrogen and sulphur fertilization. Analele Univ. Din Oradea Fasc. Protecţia Mediu. 2008, 13, 93–111. [Google Scholar]
- Garg, B.K.; Burman, U.; Kathju, S. The influence of phosphorus nutrition on the physiological response of moth bean genotypes to drought. J. Plant Nutr. Soil Sci. 2004, 167, 503–508. [Google Scholar] [CrossRef]
- Naeem, M.; Khan, M.M.A. Phosphorus ameliorates crop productivity, photosynthesis, nitrate reductase activity and nutrient accumulation in coffee senna (Senna occidentalis L.) under phosphorus-deficient soil. J. Plant Interact. 2009, 4, 145–153. [Google Scholar] [CrossRef][Green Version]
- dos Santos, M.G.; Ribeiro, R.V.; de Oliveira, R.F.; Pimentel, C. Gas exchange and yield response to foliar phosphorus application in Phaseolus vulgaris L. under drought. Braz. J. Plant Physiol. 2004, 16, 171–179. [Google Scholar] [CrossRef]
- Dijkstra, F.A.; Pendall, E.; Morgan, J.A.; Blumenthal, D.M.; Carrillo, Y.; LeCain, D.R.; Follett, R.F.; Williams, D.G. Climate change alters stoichiometry of phosphorus and nitrogen in a semiarid grassland. New Phytol. 2012, 196, 807–815. [Google Scholar] [CrossRef] [PubMed]
- Kovács, A.B.; Kremper, R.; Kátai, J.; Vágó, I.; Buzetzky, D.; Kovács, E.M.; Konya, J.; Nagy, N.M. Characterisation of soil phosphorus forms in the soil-plant system using radioisotopic tracer method. Plant Soil Environ. 2021, 67, 367–375. [Google Scholar] [CrossRef]
- Shabbir, R.N.; Waraich, E.A.; Ali, H.; Nawaz, F.; Ashraf, M.Y.; Ahmad, R.; Awan, M.I.; Ahmad, S.; Irfan, M.; Hussain, S.; et al. Supplemental exogenous NPK application alters biochemical processes to improve yield and drought tolerance in wheat (Triticum aestivum L.). Environ. Sci. Pollut. Res. 2016, 23, 2651–2662. [Google Scholar] [CrossRef]
- Chai, Q.; Jin, F.; Merewitz, E.; Huang, B. Growth and Physiological Traits Associated with Drought Survival and Post-drought Recovery in Perennial Turfgrass Species. J. Am. Soc. Hort. Sci. 2010, 135, 125–133. [Google Scholar] [CrossRef]
- Mojzes, A.; Kalapos, T.; Kovács-Láng, E. Plant ecophysiological responses to drought, nocturnal warming and variable climate in the Pannonian sand forest-steppe: Results of a six-year climate manipulation experiment. Biologia 2017, 72, 1431–1445. [Google Scholar] [CrossRef]
- Cseresnyés, I.; Rajkai, K.; Szitár, K.; Radimszky, L.; Ónodi, G.; Kröel-Dulay, G. Root capacitance measurements allow non-intrusive in-situ monitoring of the seasonal dynamics and drought response of root activity in two grassland species. Plant Soil 2020, 449, 423–437. [Google Scholar] [CrossRef]
- Hofer, D.; Suter, M.; Haughey, E.; Finn, J.A.; Hoekstra, N.J.; Buchmann, N.; Lüscher, A. Yield of temperate forage grassland species is either largely resistant or resilient to experimental summer drought. J. Appl. Ecol. 2016, 53, 1023–1034. [Google Scholar] [CrossRef]
- Tasi, J.; Bajnok, M.; Szentes, S.; Török, G. Relationship of feed quality and water supply on dry and mesic pastures. Növénytermelés/Crop Prod. 2012, 61, 181–184. [Google Scholar]
- Botero Londoño, J.M.; Celis-Celis, E.M.; Botero Londoño, M.A. Nutritional quality, nutrient uptake and biomass production of Pennisetum purpureum cv. King grass. Sci. Rep. 2021, 11, 13799. [Google Scholar] [CrossRef]
- Bajnok, M.; Harcsa, M.; György, A.; Barcsák, Z. Sward renovation with enhancing of soil fertility. Cereal Res. Commun. 2008, 36, 263–266. [Google Scholar]
- Tesic, D.; Keller, M.; Hutton, R.J. Influence of Vineyard Floor Management Practices on Grapevine Vegetative Growth, Yield, and Fruit Composition. Am. J. Enol. Vitic. 2007, 58, 1–11. [Google Scholar] [CrossRef]
- Erickson, J.E.; Kenworthy, K.E. Nitrogen and light affect water use and water use efficiency of zoysiagrass genotypes differing in canopy structure. HortScience 2011, 46, 643–647. [Google Scholar] [CrossRef]
- Hu, L.; Wang, Z.; Huang, B. Effects of Cytokinin and Potassium on Stomatal and Photosynthetic Recovery of Kentucky Bluegrass from Drought Stress. Crop Sci. 2013, 53, 221–231. [Google Scholar] [CrossRef]
- Mariotte, P.; Cresswell, T.; Johansen, M.P.; Harrison, J.J.; Keitel, C.; Dijkstra, F.A. Plant uptake of nitrogen and phosphorus among grassland species affected by drought along a soil available phosphorus gradient. Plant Soil 2020, 448, 121–132. [Google Scholar] [CrossRef]
- Ragályi, P.; Kádár, I.; Szemán, L.; Csathó, P.; Csontos, P. Effect of N, P and K fertilization on the species succession of an established grass sward during a decade. Bot. Közlemények 2018, 105, 13–26. [Google Scholar] [CrossRef]
- Kádár, I.; Ragályi, P. Mineral fertilization and grass productivity in a long-term field experiment. Arch. Agron. Soil Sci. 2012, 58, 127–131. [Google Scholar] [CrossRef]
- Koós, S.; Németh, T. Seasonal Dynamics of Mineral Nitrogen in the 10th and 30th years of a Long-Term Field Experiment in Hungary. Commun. Soil Sci. Plant Anal. 2006, 37, 2899–2910. [Google Scholar] [CrossRef]
- ISO 10390:2021; Soil, Treated Biowaste and Sludge—Determination of pH. International Organization for Standardization: Geneva, Switzerland, 2021. Available online: https://www.iso.org/standard/75243.html (accessed on 5 November 2022).
- ISO 11261:1995; Soil Quality—Determination of Total Nitrogen—Modified Kjeldahl Method. International Organization for Standardization: Geneva, Switzerland, 1995. Available online: https://www.iso.org/standard/19239.html (accessed on 22 September 2023).
- Bremner, J.M.; Keeney, D.R. Determination and Isotope-Ratio Analysis of Different Forms of Nitrogen in Soils: 3. Exchangeable Ammonium, Nitrate, and Nitrite by Extraction-Distillation Methods. Soil Sci. Soc. Am. J. 1966, 30, 577–582. [Google Scholar] [CrossRef]
- ISO 13536:1995; Soil Quality—Determination of the Potential Cation Exchange Capacity and Exchangeable Cations Using Barium Chloride Solution Buffered at pH = 8,1. International Organization for Standardization: Geneva, Switzerland, 1995. Available online: https://www.iso.org/standard/22180.html (accessed on 22 September 2023).
- FAO. Standard Operating Procedure for Soil Organic Carbon, Walkley-Black Method, Titration and Colorimetric Method; FAO: Rome, Italy, 2020; Available online: https://www.fao.org/3/ca7471en/ca7471en.pdf (accessed on 22 March 2023).
- ISO 10693:1997; Soil Quality—Determination of Carbonate Content—Volumetric Method. International Organization for Standardization: Geneva, Switzerland, 1997. Available online: https://www.iso.org/standard/18781.html (accessed on 22 September 2023).
- Egnér, H.; Riehm, H.; Domingo, W.R. Untersuchungen über die chemische Bodenanalyse als Grundlage für die Beurteilung des Nährstoffzustandes der Böden. II. Chemische Extrationsmethoden zur Phosphur- und Kaliumbestimmung. K. Lantbr. Högsk. Ann. 1960, 26, 199–215. [Google Scholar]
- Tasi, J.; Bajnok, M.; Szentes, S.; Penksza, K. The distribution of precipitation as a stress coefficient on harvest amounts of different grasslands. Cereal Res. Commun. 2009, 37, 109–112. [Google Scholar]
- Ragályi, P.; Kádár, I.; Csontos, P. Effect of precipitation on the yield of hay meadows with contrasting nutrient supply. Bulg. J. Agric. Sci. 2014, 20, 779–785. [Google Scholar]
- Chávez, C.; Limón-Jiménez, I.; Espinoza-Alcántara, B.; López-Hernández, J.A.; Bárcenas-Ferruzca, E.; Trejo-Alonso, J. Water-Use Efficiency and Productivity Improvements in Surface Irrigation Systems. Agronomy 2020, 10, 1759. [Google Scholar] [CrossRef]
- ISO 1871:2009; Food and Feed Products—General Guidelines for the Determination of Nitrogen by the Kjeldahl Method. International Organization for Standardization: Geneva, Switzerland, 2009. Available online: https://www.iso.org/standard/41320.html (accessed on 22 September 2023).
- Wickham, H. ggplot2: Elegant Graphics for Data Analysis; Springer: New York, NY, USA, 2016; ISBN 978-3-319-24277-4. Available online: https://ggplot2.tidyverse.org (accessed on 22 June 2021).
- R Core Team. R: A Language and Environment for Statistical Computing; R Foundation for Statistical Computing: Vienna, Austria, 2022; Available online: https://www.R-project.org/ (accessed on 22 September 2023).
- Bista, D.R.; Heckathorn, S.A.; Jayawardena, D.M.; Mishra, S.; Boldt, J.K. Effects of Drought on Nutrient Uptake and the Levels of Nutrient-Uptake Proteins in Roots of Drought-Sensitive and -Tolerant Grasses. Plants 2018, 7, 28. [Google Scholar] [CrossRef]
- Francisquini Junior, A.; Calonego, J.C.; Rosolem, C.A.; dos Santos, C.H.; Tiritan, C.S. Increase of nitrogen-use efficiency by phosphorus fertilization in grass–legume pastures. Nutr. Cycl. Agroecosyst. 2020, 118, 165–175. [Google Scholar] [CrossRef]
- Blumenthal, D.M.; Mueller, K.E.; Kray, J.A.; Ocheltree, T.W.; Augustine, D.J.; Wilcox, K.R. Traits link drought resistance with herbivore defence and plant economics in semi-arid grasslands: The central roles of phenology and leaf dry matter content. J. Ecol. 2020, 108, 2336–2351. [Google Scholar] [CrossRef]
- Togawa-Urakoshi, Y.; Ueno, O. Photosynthetic nitrogen- and water-use efficiencies in C3 and C4 subtype grasses grown under two nitrogen supply levels. Plant Prod. Sci. 2022, 25, 183–194. [Google Scholar] [CrossRef]
- Kunrath, T.R.; Lemaire, G.; Sadras, V.O.; Gastal, F. Water use efficiency in perennial forage species: Interactions between nitrogen nutrition and water deficit. Field Crops Res. 2018, 222, 1–11. [Google Scholar] [CrossRef]
- Ihtisham, M.; Fahad, S.; Luo, T.; Larkin, R.M.; Yin, S.; Chen, L. Optimization of Nitrogen, Phosphorus, and Potassium Fertilization Rates for Overseeded Perennial Ryegrass Turf on Dormant Bermudagrass in a Transitional Climate. Front. Plant Sci. 2018, 9, 487. [Google Scholar] [CrossRef] [PubMed]
- Jarrell, W.M.; Beverly, R.B. The Dilution Effect in Plant Nutrition Studies. Adv. Agron. 1981, 34, 197–224. [Google Scholar] [CrossRef]
- Studer, C.; Hu, Y.; Schmidhalter, U. Interactive Effects of N-, P- and K-Nutrition and Drought Stress on the Development of Maize Seedlings. Agriculture 2017, 7, 90. [Google Scholar] [CrossRef]
Disclaimer/Publisher’s Note: The statements, opinions and data contained in all publications are solely those of the individual author(s) and contributor(s) and not of MDPI and/or the editor(s). MDPI and/or the editor(s) disclaim responsibility for any injury to people or property resulting from any ideas, methods, instructions or products referred to in the content. |
© 2023 by the authors. Licensee MDPI, Basel, Switzerland. This article is an open access article distributed under the terms and conditions of the Creative Commons Attribution (CC BY) license (https://creativecommons.org/licenses/by/4.0/).