Article

Transcriptome Analysis of Rhododendron liliiflorum H. Lév. Flower Colour Differences

1
Key Laboratory of National Forestry and Grassland Administration on Biodiversity Conservation in Karst Mountainous Areas of Southwestern China, Key Laboratory of Plant Physiology and Development Regulation, Key Laboratory of Environment Friendly Management on High Altitude Rhododendron Diseases and Pests, Institutions of Higher Learning in Guizhou Province, School of Life Science, Guizhou Normal University, Guiyang 550001, China
2
Guizhou Academy of Forestry Sciences, Guiyang 550001, China
3
College of Mathematics and Information Science, Guiyang University, Guiyang 550001, China
*
Authors to whom correspondence should be addressed.
These authors contributed equally to this work.
Horticulturae 2023, 9(1), 82; https://doi.org/10.3390/horticulturae9010082
Submission received: 16 November 2022 / Revised: 24 December 2022 / Accepted: 5 January 2023 / Published: 9 January 2023
(This article belongs to the Special Issue Physiological and Molecular Biology Research on Ornamental Flower)

Abstract

:
Rhododendron liliiflorum H. Lév., with white outer edges and yellow inner edges of petals, is an ornamental flower that originated in China. In this study, we analysed the white (W) and yellow (Y) parts of R. liliiflorum flowers by RNA sequencing. Then, unigene assembly, unigene annotation, and classification of Eukaryotic Orthologous Groups (KOGs) were performed. Gene ontology (GO) classification and pathway enrichment analysis for unigenes were also conducted. A total of 219,221 transcripts and 180,677 unigenes of R. liliiflorum were obtained from 48.52 Gb of clean reads. Differentially expressed gene (DEG) analysis indicated that 2310 unigenes were upregulated and 3062 were downregulated in W vs. Y. Thirty-six of these DEGs were involved in the flavonoid biosynthesis pathway. Pathway enrichment analysis showed that DEGs were significantly enriched in phenylpropanoid, flavonoid, and isoflavone biosynthesis. The expression of dihydroflavonol-4-reductase (DFR) and chalcone synthase (CHS) may affect differences in R. liliiflorum flower colour. The findings on flavonoid biosynthesis and other related genes in this study will provide guidance for exploring the mechanism of flower colour formation in Rhododendron.

1. Introduction

Flower colour polymorphisms, considered to be one of the key adaptive characteristics chiefly correlated with pollinators (such as insects and birds) and animals for seed dispersal, have fascinated botanists, ecologists, and horticulturists [1,2,3]. The colouring of floral organs is predominantly caused by the accumulation of carotenoids, flavonoids, and alkaloids [4]. Flavonoids, a large group of secondary metabolites, have the structure of 2-phenylchromone. Flavonoids are one of the most important pigments in the petals of various ornamental plants, and they produce the widest range of colors from pale yellow to violet. They have been reported as the main pigment in Chrysanthemum morifolium Ramat. [5], Dahlia pinnata Cav. [6], Rosa chinensis Jacq. [2], Matthiola incana (L.) R. Br. [7], and Paeonia lactiflora Pall. [8].
Flavonoids, produced by a branch of the phenylpropanoid biosynthesis pathway, generally include chalcones, flavonoids, flavonols, and anthocyanins [9,10]. In the flavonoid biosynthesis pathway (Figure 1), the upstream substrate L-phenylalanine is first converted to chalcone by phenylalanine ammonia-lyase (PAL), cinnamate-4-hydroxylase (C4H), 4-coumaroyl-CoA synthetase (4CL), chalcone synthase (CHS), and chalcone isomerase (CHI) [11]. Then, the synthesised chalcone is converted to flavanones by CHI, and the subsequent pathway is further divided into three branches, including flavonoid 3′,5′-hydroxylase (F3′5′H), flavanone 3-hydroxylase (F3H), and isoflavone synthetase (IFS), which catalyses the production of pentahydroxy flavanone, dihydrokaempferol (DHK) and isoflavones. DHK is further differentiated into two branches: the production of flavanol under the co-catalysis of flavonoid 3′-hydroxylase (F3′H), F3′5′H, and flavonol synthase (FLS) and the production of flavanol under the catalysis of FLS, followed by the production of leucoanthocyanidin under the catalysis of dihydroflavonol-4-reductase (DFR). The subsequent production of flavonol is catalysed by ANS, leucoanthocyanidin reductase (LAR), and anthocyanidin reductase (ANR). A reduction in the expression of CHI, the second key enzyme in this pathway, can induce an increase in chalcone, leading to colour changes [12]. There are basically two colour series, red and pure yellow, of flavonoid compounds [3]. The red series mainly includes anthocyanins, which can regulate the colour from pink to violet [13]. Other flavonoid compounds principally belong to the pure yellow series, for instance, dark yellow chalcone and aurora ketone, as well as pale yellow or almost colourless flavonoids and flavonols [14]. Flavonoid components may also vary widely in different coloured petals of the same species; for example, white C. morifolium contains only flavonoids and flavonols, while pink C. morifolium primarily contains anthocyanins, flavonoids, and flavonols [15].
The floral colours of the genus Rhododendron are varied, including red, pink, purple, blue, yellow, and white [16], indicating that rhododendrons are ideal materials for investigating differences in floral colour traits. Ye et al. [3] researched the flower colour divergence of three varieties of Rhododendron sanguineum Franch. Complex, namely R. sanguineum var. sanguineum (with bright crimson flowers), R. var. haemaleum (with deep blackish crimson flowers), and R. var. didymoides (with yellow flushed with pink flowers). It was found that FLS, ANS, acyltransferase (AT), CHI, and glutathione S-transferase (GST) were highly expressed in deep blackish crimson flowers, which was related to the production of anthocyanins [17]. In addition, β-glucosidase (BGLU) and peroxidase (PER) related to the degradation of anthocyanins were highly expressed in yellow flushed with pink flowers [18,19]. Du et al. [16] systematically studied the flower colours of 30 species of azalea (classified into red, purplish pink, purple, and white groups) via anthocyanin and flavonol identification, and found that the red group mainly contained cyanidin monoglycosides and had much higher total anthocyanin contents than the purplish pink and purple groups. White flowers did not accumulate anthocyanins [20], but the petals contained similar amounts of flavonols as the coloured flowers [16]. Rhododendron liliiflorum H. Lév. is a Rhododendron species native to Guangxi, Guizhou, Hunan, and southeast Yunnan, China, where it grows in sparse forests and shrubs on the hillside at altitudes of 800–1800 m [21]. The flower of R. liliiflorum is tubular and bell shaped, with white outer edges and yellow inner edges of petals. At present, the mechanism of flower colour formation in R. liliiflorum has rarely been studied. Therefore, we used transcriptomic analysis to investigate gene expression during the process of flower colour formation in R. liliiflorum in this study. We discuss the gene expression of enzymes related to chalcone, flavonoid, and anthocyanin biosynthesis in the flavonoid biosynthesis pathway, which can provide a basis for the genetic improvement of flower colour in R. liliiflorum and the genus Rhododendron.

2. Materials and Methods

2.1. Experimental Materials

The experimental materials (R. liliiflorum) transplanted from the Baili Rhododendron Nature Reserve (N 27°12′54″, E 105°55′5″) (Figure 2a), which is located in northwest Guizhou, China, were collected in the Key Laboratory of Plant Physiology and Development Regulation, Guizhou Normal University, in May 2021. R. liliiflorum flowers that had just bloomed for 2–3 days were picked. Afterwards, the yellow and white parts of the petals were quickly divided into five parts from the top to the base at −18 °C to maintain the activity of the petals and labelled from A to E. The samples were subsequently rapidly frozen in liquid nitrogen and kept at −80 °C.

2.2. RNA Extraction, Library Construction and Sequencing

The experiments were performed using three biological replicates of W (white part of petals) and Y (yellow part of petals) samples (Figure 2b) for library construction and sequencing. Total RNA was isolated from petal samples using an RNA Prep Pure Plant Kit (Tiangengjin, Beijing). RNA quality, purity, and integrity were determined using agarose gel electrophoresis, a Nano Photometer (OD260/280 and OD260/230), and an Agilent 2100 biological analyser. The RNA concentration was measured using a Qubit 2.0 fluorometer. After passing quality control, the mRNA purified from the total RNA of each of the three replicates using poly-T oligo-attached magnetic beads was cut into short fragments by adding a fragmentation buffer and then used as a template to synthesize the first-strand cDNA with random hexamer primers. The double-stranded cDNA was generated by adding buffer, dNTPs (dUTP, dATP, dGTP, and dCTP), and DNA polymerase I to the first-strand cDNA and purified with AMPure XP beads. The purified double-stranded cDNA was end-repaired and elongated by A-tail addition, and sequencing adapters were ligated. The cDNA fragment was size selected with AMPure XP beads and enriched by PCR to construct the final cDNA library. Qubit 2.0 was used for the preliminary quantitation of the cDNA library, Agilent 2100 was used to detect the insertion size of the library, and qPCR was used to accurately quantify the effective concentration of the library (the effective content of the library > 2 nM) to complete the quality inspection of the library. After evaluating and qualifying the cDNA library, it was sequenced on an Illumina HiSeq platform (Wuhan Metware Biotechnology Co., Ltd., Wuhan, China).

2.3. Sequence Filtering, Splicing and Assembly

The raw data were first filtered by removing reads with adapter sequences, containing poly-Ns, with ambiguous nucleotides, and those of low quality. Then, sequencing error check was conducted and the phred scores (Q20, Q30) were calculated. The quality of the remaining reads was evaluated with FastQC, including GC content, sequence length distribution, and sequence duplication level of the clean data [3]. The obtained clean reads were assembled using Trinity v. 2.6.5 software [22]. The longest cluster sequence obtained after Corset hierarchical clustering was used as the unigene for subsequent analysis.

2.4. Unigene Functional Annotation and Expression Level Analysis

Using BLASTx (v.2.2.26) [23], the unigene sequences were compared against the NCBI non-redundant protein database (Nr), the Kyoto Encyclopedia of Genes and Genomes (KEGG) database (http://www.genome.jp/kegg/) accessed on 1 June 2021 [24], Eukaryotic Orthologous Groups database (KOG) (http://ftp.ncbi.nih.gov/pub/COG/KOG) accessed on 1 June 2021 [25], the Swiss-Prot database (http://www.uniprot.org/) accessed on 1 June 2021 [26], and the TrEMBL database. Gene ontology (GO) annotations were analysed using the Blast2GO (V.2.5) program (http://www.geneontology.org/) accessed on 2 June 2021 [27]. After predicting the amino acid sequences of the unigenes, Hmmer 3.0 (http://hmmer.janelia.org/) accessed on 2 June 2021 was used to compare the results with the Pfam database to obtain the annotation information of the unigenes. Taking the transcriptome spliced by Trinity as the reference sequence (Ref), the clean reads of each sample were mapped to Ref using RESM v. 1.3.1 [28]. The number of fragments per transcript was related to the amount of sequenced data (or mapped data), the length of the transcript, and the expression level of the transcript. To truly reflect the expression level of transcripts, the number of mapped reads and the length of transcripts in the sample must be normalised. Based on the alignments, the read counts of each gene were calculated and normalised to fragments per kilobase of transcript per million mapped fragments (FPKM) values. The FPKM method was used as an index to measure the level of transcript or gene expression.

2.5. Screening and Enrichment Analysis of DEGs

Setting |log2fold change| ≥ 1 and false discovery rate (FDR) ≤ 0.05 as the threshold, the differentially expressed genes between W (white part of petals) and Y (yellow part of petals) were calculated using R 4.1.0 package DESeq2 [29,30]. The screened differentially expressed genes were annotated using KEGG pathway enrichment (among which pathways with a p value < 0.05 were considered significantly enriched) and Gene Ontology (GO). KEGG pathway annotation was performed online using DEG query sequences mapped to the KEGG Automatic Annotation Server (KAAS) (http://www.genome.jp/tools/kaas/) accessed on 3 June 2021. The gene ontology (GO) annotations of DEGs were analysed using the Blast2GO (V.2.5) program (http://www.geneontology.org/) accessed on 3 June 2021 [27].

3. Results

3.1. Transcriptome Sequencing and Assembly

Through transcriptome sequencing of the white and yellow parts of R. liliiflorum, a total of 6 sample transcripts of W vs. Y samples were obtained. The total number of raw reads was 335,805,834. After filtering, the number of clean reads was 323,525,900, and the clean read ratio reached 96.34% for a total of 48.52 Gb of data. The GC contents of the six samples were between 46.14% and 46.76%, and the ranges of Q20 and Q30 were 97.91–98.13% and 94.03–94.55%, respectively (Table 1). The base quality values Q20 and Q30 of the clean reads in each sample were higher than 97% and 94%, respectively, and the GC content was more than 46%, which indicated that the base recognition accuracy was high, and the sequencing result quality was good. It could be seen that the transcriptome sequencing results met the quality requirements for subsequent assembly. To improve the sequencing depth and integrity of transcript assembly, Trinity software was used to assemble and splice the obtained clean reads. A total of 219,221 transcripts were obtained, with an average assembly length of 1135 bp and an N50 length of 1928 bp. Among them, 82,737 transcripts were more than 1000 bp long, accounting for 37.74% of the total transcripts. Subsequently, the longest sequence in the transcript was selected as the unigene sequence. A total of 180,677 unigenes were obtained, with an average assembly length of 1317 bp and an N50 length of 2016 bp (Table 2). Among them, 82,719 unigenes were more than 1000 bp long, accounting for 45.78% of the total transcripts. The length distributions of the assembled transcripts and unigenes are shown in Table 3.

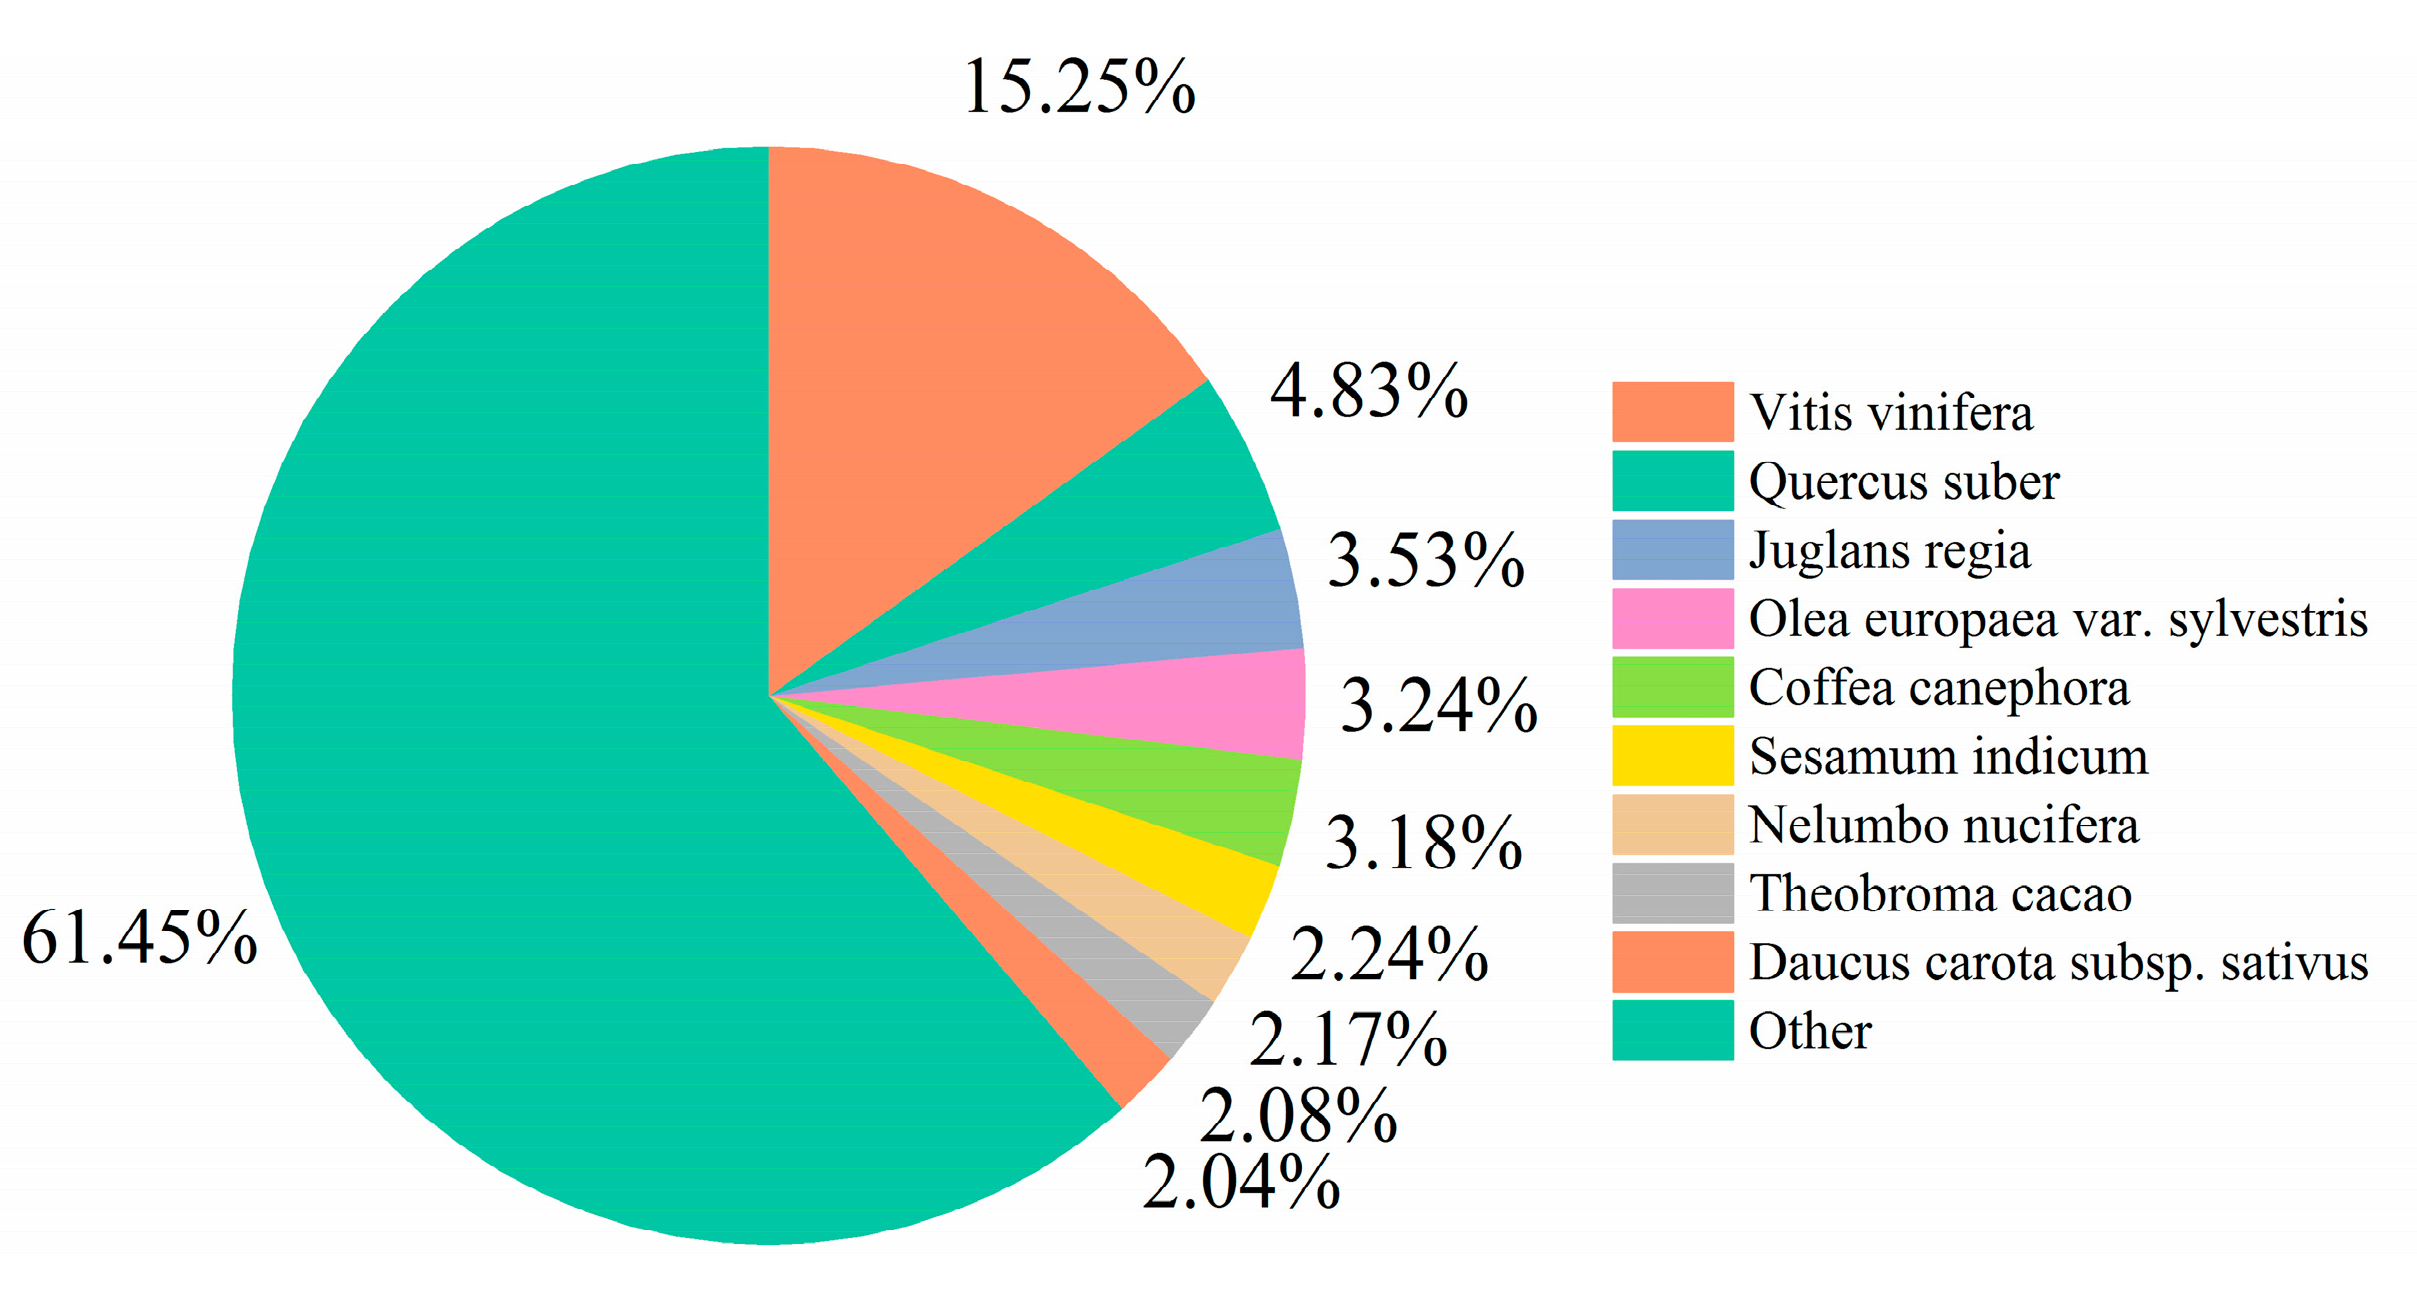
3.2. Functional Annotation Results

BLAST was used to compare the unigene sequences with the KEGG, Nr, Swiss-Prot, GO, COG/KOG, Trembl, and protein family (Pfam) databases. After predicting the amino acid sequence of the unigenes, HMMER was used for comparison with the Pfam database to obtain the annotation information for the unigenes. A total of 171,948 unigenes were annotated (Table 4). Among the seven databases, 63.25% of unigenes were annotated by Nr, 62.9% of unigenes were annotated by Trembl, and the fewest genes (38.47%) were annotated by the KOG database. Comparison with the Nr database reported the percentage of total homologous sequences with other species (Figure 3). It was found that the sequences annotated with Vitis vinifera L.-related genes were the most abundant, up to 16,589, which accounted for 15.25% of the genes annotated by the Nr database. The related species with sequence homology greater than 2% included Quercus suber L., Juglans regia L., Olea europaea var. sylvestris, Coffea canephora Pierre ex Froehn., Sesamum indicum L., Nelumbo nucifera Gaertn., Theobroma cacao L., and Daucus carota subsp. Sativus (Hoffm.). We also found that 616 unigenes (0.6%) were annotated as Rhododendron.

3.3. GO Terms and Classifications

GO annotations were performed for the unigenes, and 708,175 GO annotations were obtained for 90,560 (52.67%) unigenes. The GO annotations were divided into three ontologies: biological processes, cell components, and molecular functions. Among them, annotations for biological processes were the most abundant (accounting for 47.46% of unigenes), whereas annotations for molecular functions were the least numerous (accounting for 22.03% of unigenes) (Figure 4). The three ontologies were divided into 59 more detailed terms. Biological processes were divided into 28 terms, of which cellular process was associated with the most unigenes, accounting for 24.22% of this subcategory, followed by metabolic process (18.01%) and biological regulation (9.30%). Sulphur utilisation was associated with the lowest number of unigenes, accounting for only 0.0011% of all biological processes. Cell components were divided into 18 terms according to their positions in the cell, of which cell, cell part, and organelle accounted for 22.46%, 22.43%, and 17.01% of unigenes in this ontology, respectively. Other organism and organism parts were less abundant, accounting for only 0.004% of unigenes. Among the 13 terms of molecular functions, catalytic activity and binding were the most abundant, accounting for 46.25% and 40.43% of unigenes in this ontology, respectively, while toxin activity and protein tag were the least abundant, accounting for 0.0008% and 0.011%, respectively. From these results, we can see that the expression of genes associated with cell activity and metabolic activity terms in R. liliiflorum was high, indicating strong metabolic capacity.

3.4. KOG Terms and Classifications

When the assembled unigenes were compared to the Eukaryotic Orthologous Groups (KOG), the information obtained from the KOG functional annotation of R. liliiflorum showed that the terms could be subdivided into 25 categories and a total of 66,156 unigenes were annotated (accounting for 38.47% of the total number of unigenes). The gene expression abundance of each category varied greatly, including 76,226 functional annotations, which basically covered most of the life activities of R. liliiflorum (Figure 5). Among them, general function prediction only, signal transmission mechanisms, and posttranslational modification, protein turnover, and chaperones were the most common, with 16,605 (21.78%), 7768 (10.19%), and 7144 (9.37%) unigenes, respectively. There were fewer unigenes associated with cell motility and extracellular structures, only 22 (0.03%) and 207 (0.27%) unigenes, respectively.

3.5. Screening and Enrichment Analysis of DEGs in Yellow and White Parts of R. liliiflorum Petals

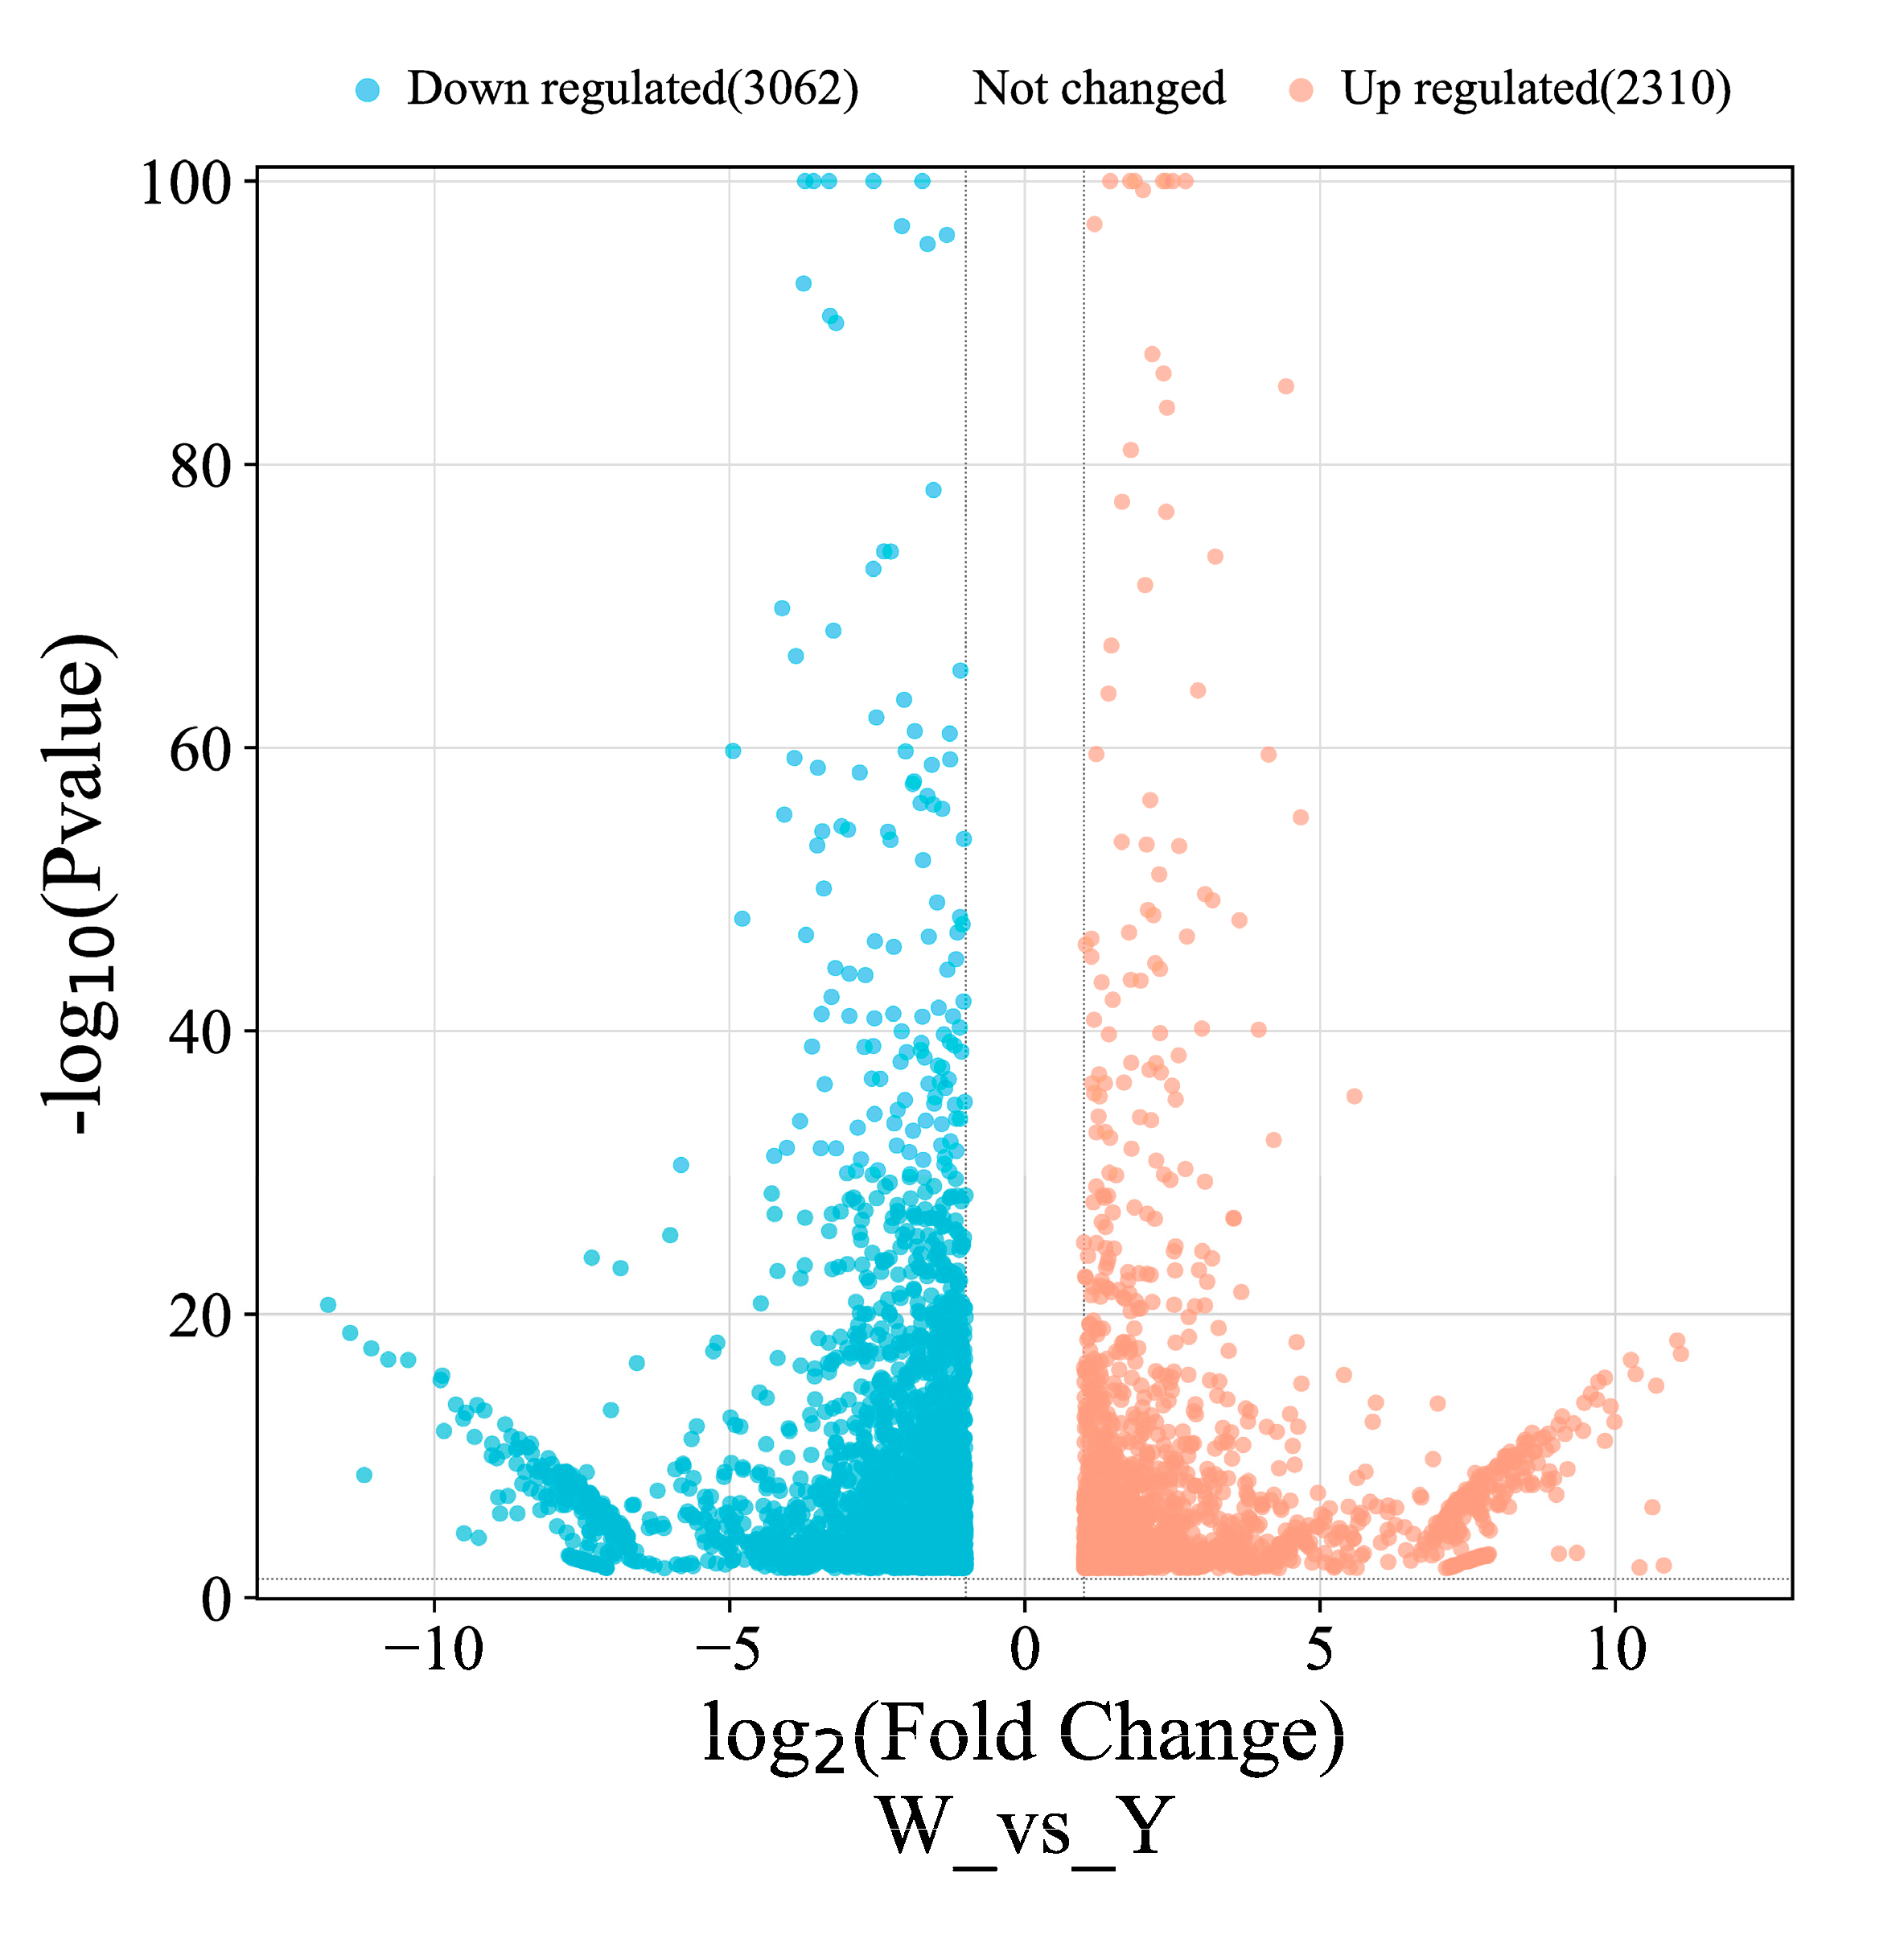
3.5.1. Screening of DEGs

By comparing the gene expression levels of the yellow and white parts of the petals of R. liliiflorum, taking |log2fold Change| ≥ 1 and FDR < 0.05 as the screening conditions, 5372 DEGs were screened from the comparison of W vs. Y. There were 2310 upregulated unigenes and 3062 downregulated unigenes, and the total number of downregulated unigenes was higher than the total number of upregulated unigenes (Figure 6).

3.5.2. GO Enrichment of DEGs

The top 50 GO terms with significant enrichment were determined. As shown in the histogram of GO enrichment entries (Figure 7), the significantly enriched GO terms included photosystem and oxidoreductase activity, acting on peroxide as acceptor, peroxidase activity, response to chitin, and photosystem I.
Among the 50 GO terms with the most significant enrichment, 24 terms were enriched in biological processes, of which the number of differentially expressed proteins enriched in response to chitin was the largest (46), followed by divalent metal ion transport and divalent inorganic cation transport (both 39).
There were 22 GO terms enriched in molecular functions, among which the differentially expressed genes related to calcium ion transmembrane transporter activity were the most abundant (48), followed by oxidoreductase activity, acting on peroxide as acceptor (47), and peroxidase activity. Four GO terms were enriched in cell components, all related to photosynthesis, among which photosystem (41) was the most abundant, followed by photosystem II (31) and photosystem I (22). GO terms related to flavonoid biosynthesis and pigments were not in the top 50, but they added up to 20 GO terms related to the biosynthesis of flavonol, flavanone, flavonoid, 2-isoflavonoid, and riboflavin.
The abscissa represents the ratio of genes annotated to the total number of genes annotated and the ordinate represents the name of the GO entry. The labels on the left side of the graph represent the categories to which the GO term belongs. The GO term definitions were: 1: amino acid transport; 2: amino sugar catabolic process; 3: aminoglycan catabolic process; 4: antibiotic catabolic process; 5: calcium ion transport; 6: calcium-mediated signaling; 7: carbohydrate derivative catabolic process; 8: cell wall macromolecule catabolic process; 9: cellular response to amino acid stimulus; 10: cellular response to nitrogen compound; 11: cellular response to organonitrogen compound; 12: chitin catabolic process; 13: chitin metabolic process; 14: divalent inorganic cation transport; 15: divalent metal ion transport; 16: glucosamine-containing compound catabolic process; 17: glucosamine-containing compound metabolic process; 18: hydrogen peroxide catabolic process; 19: hydrogen peroxide metabolic process; 20: response to amino acid; 21: response to chitin; 22: second-messenger-mediated signaling; 23: toxin catabolic process; 24: toxin metabolic process; 25: chloroplast thylakoid membrane protein complex; 26: photosystem; 27: photosystem I; 28: photosystem II; 29: amino acid transmembrane transporter activity; 30: calcium channel activity; 31: calcium ion transmembrane transporter activity; 32:chitinase activity; 33: chlorophyll binding; 34: extracellular ligand-gated ion channel activity; 35: gamma-aminobutyric acid transmembrane transporter activity; 36: germacradienol synthase activity; 37: germacrene-D synthase activity; 38: glutamate receptor activity; 39: glutathione transferase activity; 40: ionotropic glutamate receptor activity; 41: ligand-gated channel activity; 42: ligand-gated ion channel activity; 43: neurotransmitter receptor activity; 44: oxidoreductase activity, acting on diphenols and related substances as donors, oxygen as acceptor; 45: oxidoreductase activity, acting on paired donors, with incorporation or reduction of molecular oxygen, NAD(P)H as one donor, and incorporation of one atom of oxygen; 46: oxidoreductase activity, acting on peroxide as acceptor; 47: peroxidase activity; 48: transmitter-gated channel activity; 49: transmitter-gated ion channel activity; and 50: UDP-arabinose 4-epimerase activity.

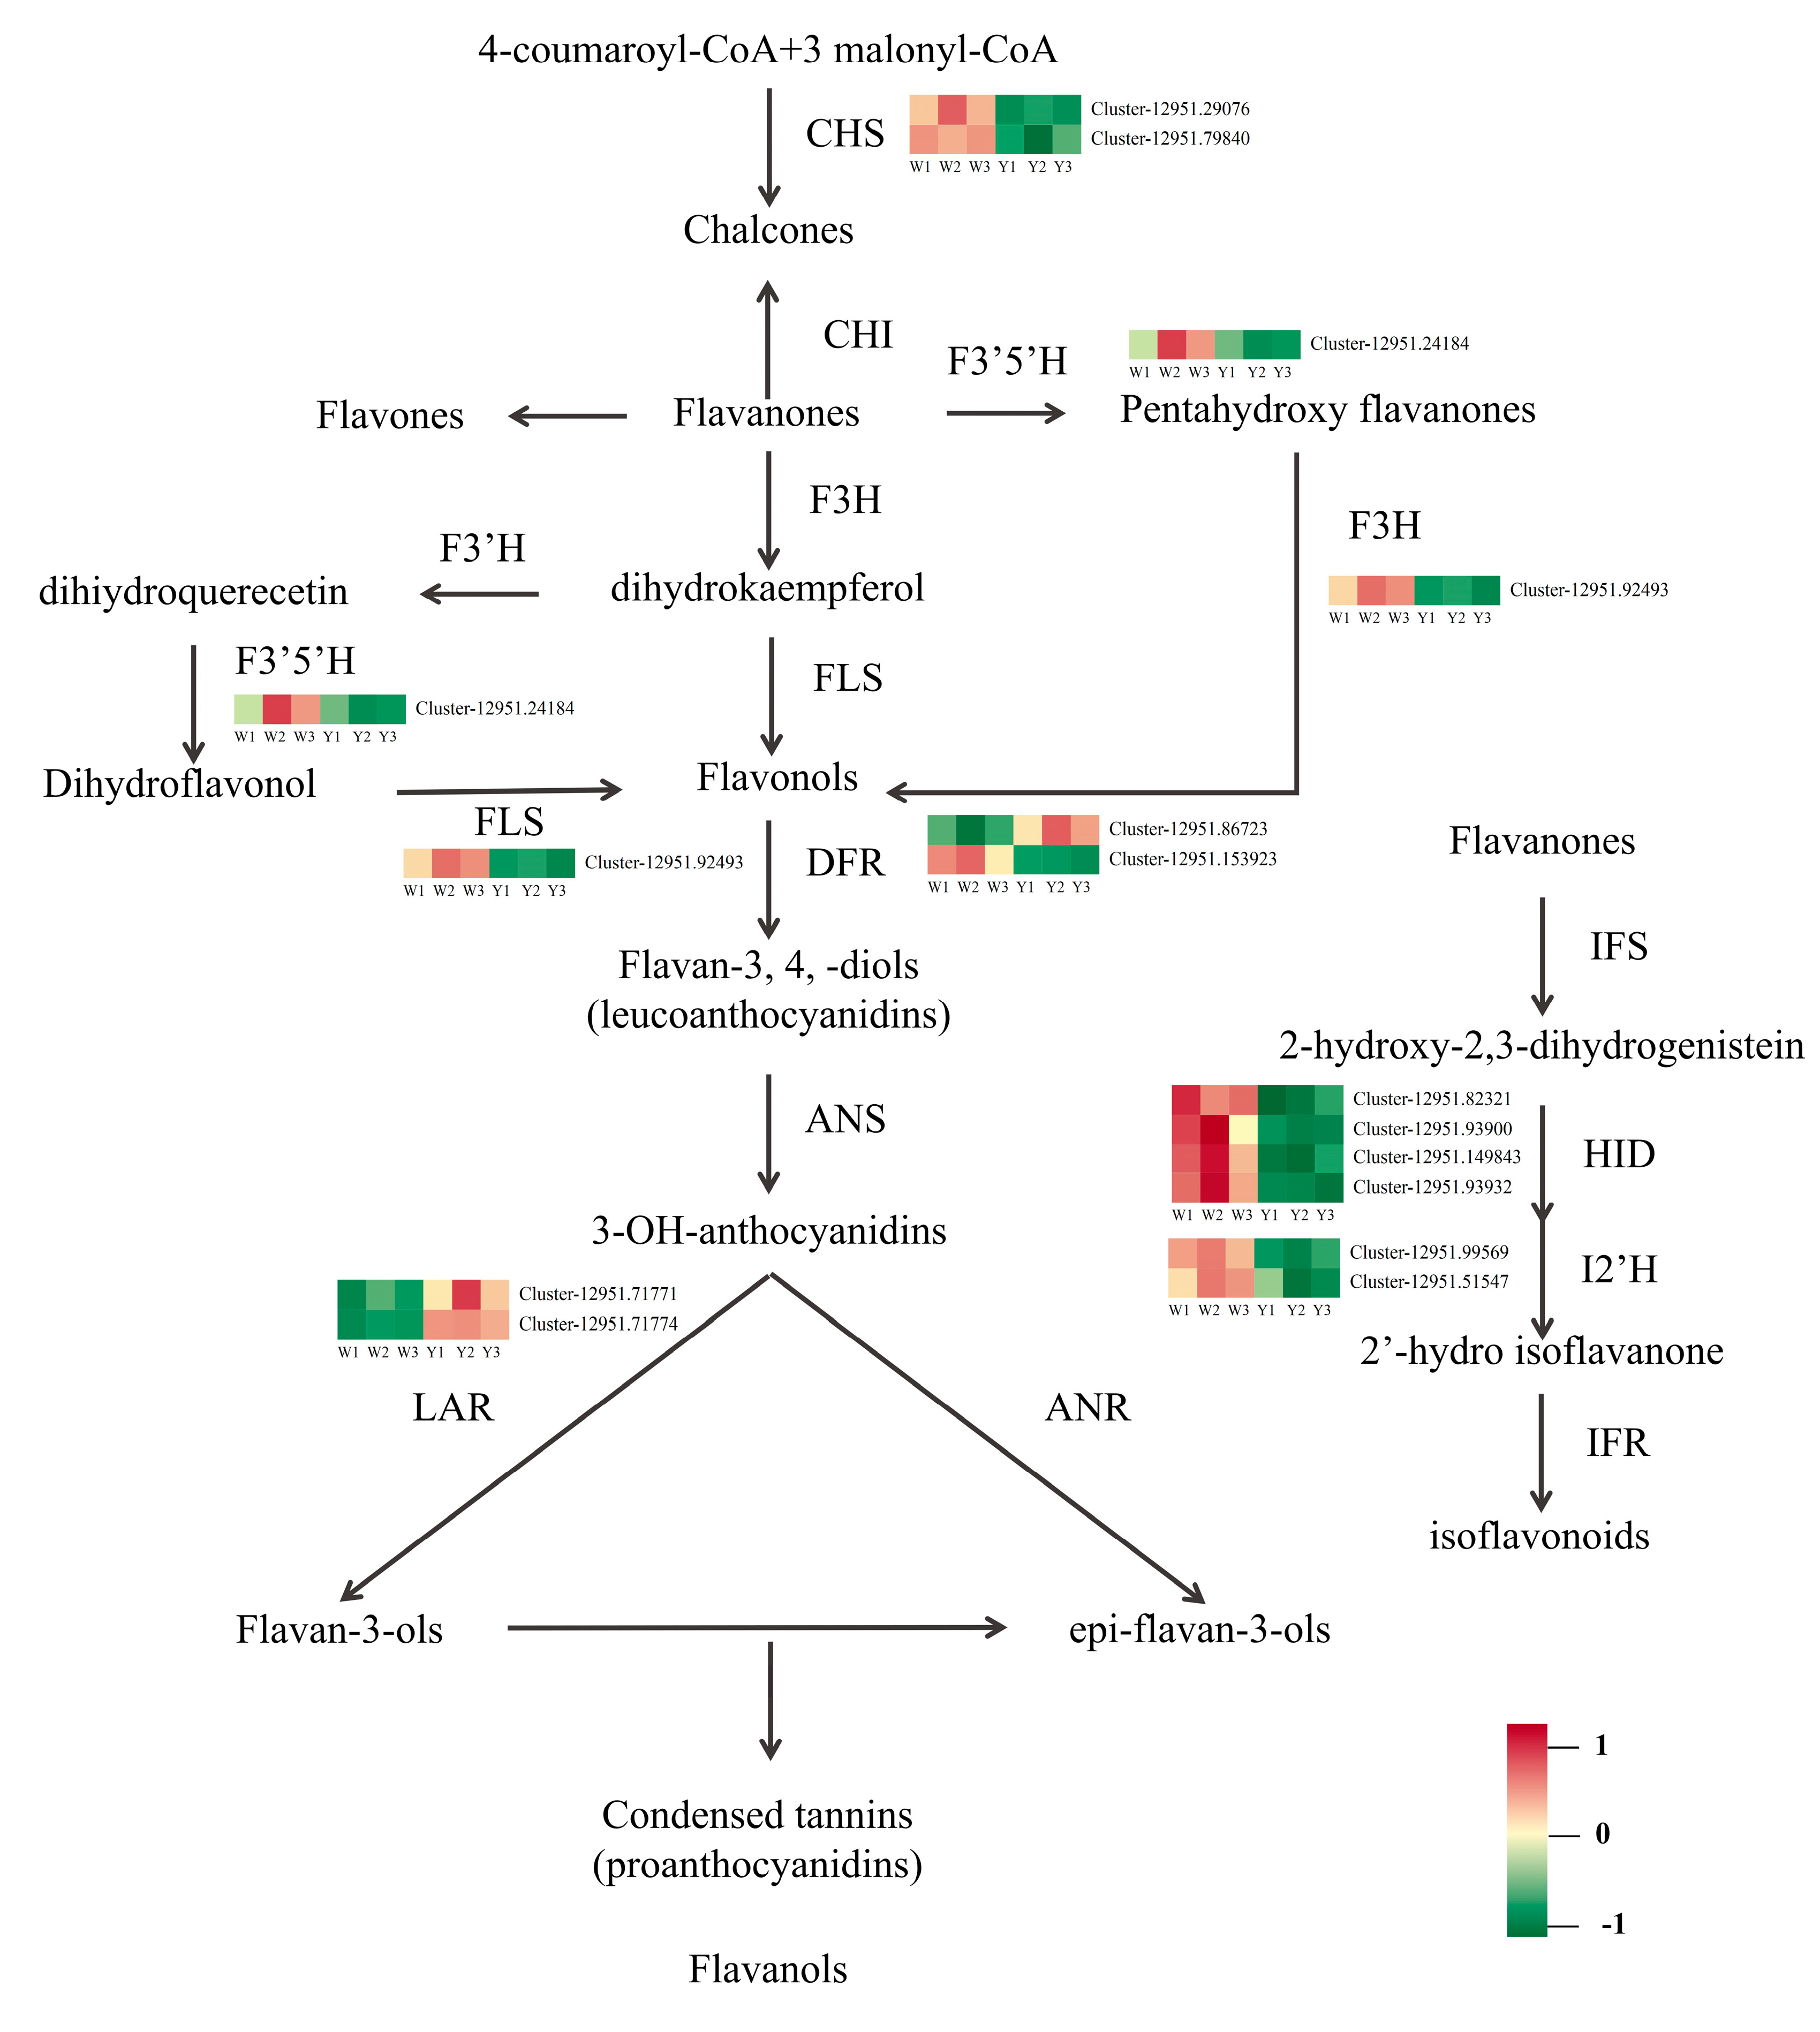
3.5.3. KEGG Enrichment Analysis of DEGs

DEGs were annotated into 135 pathways, of which 28 metabolic pathways were significantly enriched (p < 0.05), and the top 20 pathways with significant enrichment were screened. As shown by the KEGG enrichment scatter diagram (Figure 8), KEGG significant enrichment was reflected in phenylpropanoid biosynthesis, photosynthesis, metabolic pathways, MAPK signalling pathway-plant, and biosynthesis of secondary metabolites. Among them, several metabolic pathways were related to flavonoid biosynthesis: the phenylpropanoid biosynthesis pathway (map00940) contained 110 unigenes, the flavonoid biosynthesis pathway contained 27 unigenes, and the isoflavone biosynthesis pathway contained 14 unigenes. According to the above annotation results, we found that 11 enzyme-related genes are involved in the flavonoid generation pathway (Table 5). Through the flavonoid biosynthesis pathway diagram (Figure 9), we found that the DEGs from the yellow part of the petals of R. liliiflorum were downregulated in pathways related to the biosynthesis of isoflavones, chalcone, flavanone, dihydrobrassinol, and flavonol, whereas two DEGs related to dihydroflavonol-4-reductase (DFR) were enriched in the anthocyanin biosynthesis pathway, of which one was upregulated and the other was downregulated. In addition, DEGs associated with LAR were upregulated in the anthocyanin biosynthesis pathway of flavanols.

4. Discussion

R. liliiflorum is a very important ornamental plant, and the colours of its petals are mainly yellow and white. To understand the reasons for this phenomenon, this study used the Illumina HiSeq sequencing platform to sequence the transcriptome of the yellow and white parts of the petals of R. liliiflorum. The results showed that each group of samples produced more than 6 GB of clean data, and a total of 180,677 unigenes were obtained, of which 171,948 were annotated. Through the differential expression comparison of W vs. Y, 5372 DEGs were obtained and further annotated through the KEGG pathway. The results showed that the DEGs of R. liliiflorum petals in different coloured parts were significantly enriched in phenylpropanoid biosynthesis, photosynthesis, metabolic pathways, MAPK signalling pathway-plant, biosynthesis of secondary metabolites, and flavonoid and isoflavone biosynthesis (Figure 8). In addition, GO classification also showed that a large number of DEGs in W vs. Y were involved in the primary metabolism of active substances in R. liliiflorum. This showed that the biosynthesis of flavonoids in the petals of R. liliiflorum was significantly differentially regulated during the development process. In this study, 36 genes related to the biosynthesis of flavonoids in the petals of R. liliiflorum were identified (Table 5), including CYP73A (1), 4CL (3), CHS (2), DFR (2), F3′5′H (1), FLS (1), LAR (2), CCoAOMT (2), HCT (16), I2′H (2), and HID (4).
Flavonoid metabolism is considered to be one of the most important ways to promote floral colour formation and is catalysed by multiple enzyme complexes [3]. In the flavonoid biosynthesis pathway (Figure 9), this study identified six key enzyme genes, including CHS, F3′5′H, FLS, DFR, I2′H, and LAR, involved in the regulation of flavonoid biosynthesis. The gene expression of CHS, F3′5′H, FLS, and I2′H was downregulated, and these genes were involved in the regulation of chalcone, dihydroflavonol, flavonol, and isoflavone biosynthesis, respectively. In contrast, LAR was upregulated in the anthocyanin to flavonoid biosynthesis pathway. The expression levels of two DEGs related to DFR were upregulated and downregulated. CHS is a key rate-limiting enzyme in the flavonoid biosynthesis pathway [31]. If it is inhibited, the total flavonoid level will be reduced [32]. The mutation of F3′5′H leads to a decrease in delphinid levels and an increase in anthocyanin levels [33]. Ectopic expression of FLS promotes the accumulation of kaempferol and a decrease in the anthocyanin content in flowers [34]. At the same time, FLS overexpression enhances quercetin signalling in roots [35]. HID can further convert the generated 2-hydroxy-2,3-dihydrogenistein and 2,7,40-trihydroxyisoflavone into the isoflavones genistein and daidzein [36], and then these two substances will lead to the accumulation of isoflavones under the continuous catalysis of a batch of enzymes, such as I2′H [37,38]. As a key regulatory enzyme for anthocyanin biosynthesis, DFR can catalyse the conversion of three colourless dihydroflavonol alcohols into light anthocyanins, playing an important role in the accumulation of anthocyanin aglycones [39]. Massive expression of upstream genes and low expression of DFR cause the biosynthesis of a great deal of anthoxanthin and a small amount of colourless leucopelargonidin and leucocyanidin [8]. Many yellow varieties of Dahlia variabilis Hort. do not show DFR activity [40]. LAR expression in R. liliiflorum was significantly upregulated. LAR is a member of the reductase–epimerase–dehydrogenase enzyme family and closely related to isoflavone reductase in the isoflavonoid biosynthesis pathway [25]. LAR affects the accumulation of anthocyanins in plants by participating in the biosynthesis of plant-derived proanthocyanidins (PAs), while higher levels of PAs inhibit the production of anthocyanins and quercetin [41]. It has been proven that LAR can convert white anthocyanin into (+)—catechin [42]. Wang et al. [43] studied the flavonoid biosynthesis of Narcissus tazetta L. var. chinensis Roem. and speculated that the lack of anthocyanins was due to the high expression of LAR and FLS and insufficient expression of ANS [43].
A previous study of the metabolites of some yellow and white flowers found that the flavonoid content of yellow flowers in medical C. morifolium [44] and Freesia hybrida Klatt. [45] was higher than that of white flowers, but the results were opposite in P. lactiflora [46] and Pericallis hybrida B. Nord. [47]. Specific to the type of flavonoids, it was found that the quercetin content in yellow flowers of Gossypium arboreum L. was higher than that of white flowers, while the kaempferol content was lower than that of white flowers [48]. Quercetin content in yellow flowers of Michelia maudiae Dunn was higher than that in white flowers [49]. These results proved that the flavonoid content affects the colour development of most yellow flowers. The transcriptome study on the corresponding parts of the above species found that the expression levels of FLS, F3H, DFR, and CHI were relatively high in yellow flowers. Wang et al. [50] found that the expression levels of isoflavonoids and dihydroflavonols in yellow flowers were higher than those in white flower of Carthamus tinctorius L., but the regulated gene expression was higher in white flowers than in yellow flowers [50]. Generally, in most flowers, the flavonoid content of yellow flowers is higher than that of white flowers, which may be regulated by FLS, F3H, DFR, etc., but the colour differentiation of the same flower may not be closely related to the flavonoid content. For example, the inner petal was yellow and the outer petal was white, but the flavonoid content of the white part was higher than that of the yellow part [46]. Bao et al. [51] found the pH of the yellow inner petals was higher than that of the white outer petals, and the moisture content was lower than that of white part in P. lactiflora. Similar to R. liliiflorum, DFR was upregulated and CHS was downregulated in P. lactiflora, indicating that these two genes may play a regulatory role in flower coloured differentiation of the same flower. Of course, apart from anthocyanins, flavonoids, and peptide factors, the pH of flower issues, epidermal cell surfaces, and anthocyanic vacuolar inclusion might also play roles in the formation of floral colour [16].

5. Conclusions

Using Illumina Hiseq transcriptome sequencing technology, this work analysed gene expression in the petals of R. liliiflorum. This study provides a preliminary understanding of the mechanism of gene regulation in the colour formation of R. liliiflorum petals. Our results show that the colour change of R. liliiflorum is related to differential changes in gene expression levels, and to a certain extent, it is related to genes associated with the flavonoid biosynthesis pathway. In the flavonoid biosynthesis pathway, we found that the expression of DEGs related to CHS, F3′5′H, FLS, I2′H, and HID in the chalcone, dihydroflavonol, and pentahydroxyflavanol flavonol biosynthesis pathways was downregulated. In the flavonol biosynthesis colourless anthocyanin pathway, the expression levels of two DEGs associated with DFR were upregulated and downregulated, while in the flavanol biosynthesis pathway, the expression of DEGs associated with LAR was upregulated. These results show that CHS, F3′5′H, FLS, I2′H, HID, DFR, LAR, and other enzyme-related genes play a key role in the formation of R. liliiflorum petal colour.

Author Contributions

Conceptualization, L.L. and Y.Y.; formal analysis, M.C., X.W. and J.D.; investigation, X.Z. (Xu Zhang) and Z.Z.; writing—original draft preparation, H.Z., M.C., X.W. and J.D.; writing—review and editing, X.Z. (Ximin Zhang), J.G., M.T. and J.T. All authors have read and agreed to the published version of the manuscript.

Funding

This research was supported by the Natural Science Foundation of China and the Karst Science Research Center of Guizhou Province, China (U1812401); the Science and Technology Support Plant Project, China ([2021] No. 224); Higher Education Science and Research Youth Project of Guizhou Education Department (Qianjiaoji [2022]130); QIANKEHEPINGTAIRENCAI ([2017] No. 5726-15); Science and Technology Fund Project of Guizhou Province ([2020] No. 4Y028); Innovation and entrepreneurship training plan for national and provincial college students, Guizhou Normal University, China (S202110663037); the Natural Science Foundation of China (NSFC) (32260393); and Guizhou forestry scientific research project, Qianlinkehe ([2022] No. 28).

Data Availability Statement

All sequencing data are available through the NCBI Sequence Read Archive under the accession number PRJNA898493.

Acknowledgments

The authors would like to thank the Natural Science Foundation of China and the Karst Science Research Center of Guizhou Province of China (U1812401) and the Science and Technology Support Plant Project of China ([2021]224) for their support in this research.

Conflicts of Interest

The authors declare no conflict of interest.

References

  1. Bradshaw, H.D.; Schemske, D.W. Allele substitution at a flower colour locus produces a pollinator shift in monkeyflowers. Nature 2003, 426, 176–178. [Google Scholar] [CrossRef] [PubMed]
  2. Schmitzer, V.; Veberic, R.; Osterc, G.; Stampar, F. Color and Phenolic Content Changes during Flower Development in Groundcover Rose. J. Am. Soc. Hortic. Sci. 2010, 135, 195–202. [Google Scholar] [CrossRef] [Green Version]
  3. Ye, L.-J.; Möller, M.; Luo, Y.-H.; Zou, J.-Y.; Zheng, W.; Wang, Y.-H.; Liu, J.; Zhu, A.-D.; Hu, J.-Y.; Li, D.-Z. Differential expressions of anthocyanin synthesis genes underlie flower color divergence in a sympatric Rhododendron sanguineum complex. BMC Plant Biol. 2021, 21, 204. [Google Scholar] [CrossRef] [PubMed]
  4. Mol, J.; Grotewold, E.; Koes, R. How genes paint flowers and seeds. Trends Plant Sci. 1998, 3, 212–217. [Google Scholar] [CrossRef]
  5. Chen, S.; Li, C.; Zhu, X.; Deng, Y.M.; Sun, W.; Wang, L.; Chen, F.; Zhang, Z. The identification of flavonoids and the expression of genes of anthocyanin biosynthesis in the chrysanthemum flowers. Biol. Plant. 2012, 56, 458–464. [Google Scholar] [CrossRef]
  6. Thill, J.; Miosic, S.; Ahmed, R.; Schlangen, K.; Muster, G.; Stich, K.; Halbwirth, H. ‘Le Rouge et le Noir’: A decline in flavone formation correlates with the rare color of black dahlia (Dahlia variabilis hort.) flowers. BMC Plant Biol. 2012, 12, 225. [Google Scholar] [CrossRef] [Green Version]
  7. Tatsuzawa, F.; Saito, N.; Toki, K.; Shinoda, K.; Honda, T. Flower Colors and their Anthocyanins in Matthiola incana Cultivars (Brassicaceae). J. Jpn. Soc. Hortic. Sci. 2012, 81, 91. [Google Scholar] [CrossRef] [Green Version]
  8. Zhao, D.; Tao, J.; Han, C.; Ge, J. Flower color diversity revealed by differential expression of flavonoid biosynthetic genes and flavonoid accumulation in herbaceous peony (Paeonia lactiflora Pall.). Mol. Biol. Rep. 2012, 39, 11263–11275. [Google Scholar] [CrossRef]
  9. Winkel-Shirley, B. Flavonoid biosynthesis. A colorful model for genetics, biochemistry, cell biology, and biotechnology. Plant Physiol. 2001, 126, 485–493. [Google Scholar] [CrossRef] [Green Version]
  10. Zhou, Z.; Gao, H.; Ming, J.; Ding, Z.; Lin, X.e.; Zhan, R. Combined Transcriptome and Metabolome analysis of Pitaya fruit unveiled the mechanisms underlying Peel and pulp color formation. BMC Genom. 2020, 21, 734. [Google Scholar] [CrossRef]
  11. Liu, W.; Feng, Y.; Yu, S.; Fan, Z.; Li, X.; Li, J.; Yin, H. The Flavonoid Biosynthesis Network in Plants. Int. J. Mol. Sci. 2021, 22, 12824. [Google Scholar] [CrossRef] [PubMed]
  12. Nishihara, M.; Nakatsuka, T.; Yamamura, S. Flavonoid components and flower color change in transgenic tobacco plants by suppression of chalcone isomerase gene. FEBS Lett. 2005, 579, 6074–6078. [Google Scholar] [CrossRef] [PubMed] [Green Version]
  13. Dong, W.; Li, M.; Li, Z.; Li, S.; Zhu, Y.; Ding, H.; Wang, Z. Transcriptome analysis of the molecular mechanism of Chrysanthemum flower color change under short-day photoperiods. Plant Physiol. Biochem. 2020, 146, 315–328. [Google Scholar] [CrossRef] [PubMed]
  14. Malik, W.; Khan, A.; Masooma, H.; Aslam, U.; Iqbal, M.; Qayyum, A.; Yasmeen, A.; Bibi, N. Transcriptome Analysis of Pigment Related Genes in Colored Cotton. Int. J. Agric. Biol. 2015, 17, 1560–8530. [Google Scholar]
  15. Zheng, X.; Zhao, B.; Zeng, H.; Shen, H.; Xu, J. Comparative Analysis of Composition and Content of Pigments in Petals of Three Different Colors of Rhododendron calophytum in Qinling Mountains. J. Northwest For. Univ. 2017, 32, 62–68. (In Chinese) [Google Scholar]
  16. Du, H.; Lai, L.; Wang, F.; Sun, W.; Zhang, L.; Li, X.; Wang, L.; Jiang, L.; Zheng, Y. Characterisation of flower colouration in 30 Rhododendron species via anthocyanin and flavonol identification and quantitative traits. Plant Biol. 2018, 20, 121–129. [Google Scholar] [CrossRef]
  17. Jaakola, L.; Määttä, K.; Pirttilä, A.M.; Törrönen, R.; Kärenlampi, S.; Hohtola, A. Expression of genes involved in anthocyanin biosynthesis in relation to anthocyanin, proanthocyanidin, and flavonol levels during bilberry fruit development. Plant Physiol. 2002, 130, 729–739. [Google Scholar] [CrossRef] [Green Version]
  18. Zipor, G.; Duarte, P.; Carqueijeiro, I.; Shahar, L.; Ovadia, R.; Teper-Bamnolker, P.; Eshel, D.; Levin, Y.; Doron-Faigenboim, A.; Sottomayor, M.; et al. In planta anthocyanin degradation by a vacuolar class III peroxidase in Brunfelsia calycina flowers. New Phytol. 2015, 205, 653–665. [Google Scholar] [CrossRef]
  19. Liu, Y.; Tikunov, Y.; Schouten, R.E.; Marcelis, L.F.M.; Visser, R.G.F.; Bovy, A. Anthocyanin Biosynthesis and Degradation Mechanisms in Solanaceous Vegetables: A Review. Front. Chem. 2018, 6, 52. [Google Scholar] [CrossRef]
  20. Mizuta, D.; Ban, T.; Miyajima, I.; Nakatsuka, A.; Kobayashi, N. Comparison of flower color with anthocyanin composition patterns in evergreen azalea. Sci. Hortic. 2009, 122, 594–602. [Google Scholar] [CrossRef]
  21. Wang, S.; Zhang, Y.; Zou, Q.; Shan, W.; Li, X.; Zhang, L. Effects of IBA concentration and cutting time on rooting of Rhododendron kiangsiense and Rh. liliiflorum cuttings. Guihaia 2016, 36, 1468–1475. (In Chinese) [Google Scholar]
  22. Haas, B.J.; Papanicolaou, A.; Yassour, M.; Grabherr, M.; Blood, P.D.; Bowden, J.; Couger, M.B.; Eccles, D.; Li, B.; Lieber, M.; et al. De novo transcript sequence reconstruction from RNA-seq using the Trinity platform for reference generation and analysis. Nat. Protoc. 2013, 8, 1494–1512. [Google Scholar] [CrossRef] [PubMed]
  23. Altschul, S.F.; Madden, T.L.; Schäffer, A.A.; Zhang, J.; Zhang, Z.; Miller, W.; Lipman, D.J. Gapped BLAST and PSI-BLAST: A new generation of protein database search programs. Nucleic Acids Res. 1997, 25, 3389–3402. [Google Scholar] [CrossRef] [PubMed]
  24. Kanehisa, M.; Goto, S.; Hattori, M.; Aoki-Kinoshita, K.F.; Itoh, M.; Kawashima, S.; Katayama, T.; Araki, M.; Hirakawa, M. From genomics to chemical genomics: New developments in KEGG. Nucleic Acids Res. 2006, 34, D354–D357. [Google Scholar] [CrossRef]
  25. Tatusov, R.L.; Fedorova, N.D.; Jackson, J.D.; Jacobs, A.R.; Kiryutin, B.; Koonin, E.V.; Krylov, D.M.; Mazumder, R.; Mekhedov, S.L.; Nikolskaya, A.N.; et al. The COG database: An updated version includes eukaryotes. BMC Bioinform. 2003, 4, 41. [Google Scholar] [CrossRef] [Green Version]
  26. UniProt Consortium. UniProt: A hub for protein information. Nucleic Acids Res. 2015, 43, D204–D212. [Google Scholar] [CrossRef] [Green Version]
  27. Conesa, A.; Götz, S.; García-Gómez, J.M.; Terol, J.; Talón, M.; Robles, M. Blast2GO: A universal tool for annotation, visualization and analysis in functional genomics research. Bioinformation 2005, 21, 3674–3676. [Google Scholar] [CrossRef] [Green Version]
  28. Li, B.; Dewey, C.N. RSEM: Accurate transcript quantification from RNA-Seq data with or without a reference genome. BMC Bioinform. 2011, 12, 323. [Google Scholar] [CrossRef] [Green Version]
  29. Love, M.I.; Huber, W.; Anders, S. Moderated estimation of fold change and dispersion for RNA-seq data with DESeq2. Genome Biol. 2014, 15, 550. [Google Scholar] [CrossRef] [Green Version]
  30. Varet, H.; Brillet-Guéguen, L.; Coppée, J.Y.; Dillies, M.A. SARTools: A DESeq2- and EdgeR-Based R Pipeline for Comprehensive Differential Analysis of RNA-Seq Data. PLoS ONE 2016, 11, e0157022. [Google Scholar] [CrossRef] [Green Version]
  31. Deng, X.; Bashandy, H.; Ainasoja, M.; Kontturi, J.; Pietiäinen, M.; Laitinen, R.A.E.; Albert, V.A.; Valkonen, J.P.T.; Elomaa, P.; Teeri, T.H. Functional diversification of duplicated chalcone synthase genes in anthocyanin biosynthesis of Gerbera hybrida. New Phytol. 2014, 201, 1469–1483. [Google Scholar] [CrossRef] [PubMed]
  32. Schijlen, E.; De Vos, R.; Martens, S.; Jonker, H.; Rosin, F.; Molthoff, J.; Tikunov, Y.; Angenent, G.; van tunen, A.; Bovy, A. RNA Interference Silencing of Chalcone Synthase, the First Step in the Flavonoid Biosynthesis Pathway, Leads to Parthenocarpic Tomato Fruits. Plant Physiol. 2007, 144, 1520–1530. [Google Scholar] [CrossRef] [PubMed] [Green Version]
  33. Takahashi, R.; Dubouzet, J.G.; Matsumura, H.; Yasuda, K.; Iwashina, T. A new allele of flower color gene W1 encoding flavonoid 3’5’-hydroxylase is responsible for light purple flowers in wild soybean Glycine soja. BMC Plant Biol. 2010, 10, 155. [Google Scholar] [CrossRef] [PubMed]
  34. Jiang, X.; Shi, Y.; Fu, Z.; Li, W.-W.; Lai, S.; Wu, Y.; Wang, Y.; Liu, Y.; Gao, L.; Xia, T. Functional characterization of three flavonol synthase genes from Camellia sinensis: Roles in flavonol accumulation. Plant Sci. 2020, 300, 110632. [Google Scholar] [CrossRef] [PubMed]
  35. Park, S.; Kim, D.-H.; Yang, J.-H.; Lee, J.-Y.; Lim, S. Increased Flavonol Levels in Tobacco Expressing AcFLS Affect Flower Color and Root Growth. Int. J. Mol. Sci. 2020, 21, 1011. [Google Scholar] [CrossRef] [Green Version]
  36. Veremeichik, G.N.; Grigorchuk, V.P.; Butovets, E.S.; Lukyanchuk, L.M.; Brodovskaya, E.V.; Bulgakov, D.V.; Bulgakov, V.P. Isoflavonoid biosynthesis in cultivated and wild soybeans grown in the field under adverse climate conditions. Food Chem. 2021, 342, 128292. [Google Scholar] [CrossRef]
  37. Uchida, K.; Akashi, T.; Aoki, T. The Missing Link in Leguminous Pterocarpan Biosynthesis is a Dirigent Domain-Containing Protein with Isoflavanol Dehydratase Activity. Plant Cell Physiol. 2017, 58, 398–408. [Google Scholar] [CrossRef] [Green Version]
  38. Yao, S.; Lan, Z.; Huang, R.; Tan, Y.; Huang, D.; Gu, J.; Pan, C. Hormonal and transcriptional analyses provides new insights into the molecular mechanisms underlying root thickening and isoflavonoid biosynthesis in Callerya speciosa (Champ. ex Benth.) Schot. Sci. Rep. 2021, 11, 9. [Google Scholar] [CrossRef]
  39. Sun, w.; Zhou, N.; Feng, C.; Sun, S.; Tang, M.; Tang, X.; Ju, Z.; Yi, Y. Functional analysis of a dihydroflavonol 4-reductase gene in Ophiorrhiza japonica (OjDFR1) reveals its role in the regulation of anthocyanin. PeerJ 2021, 9, e12323. [Google Scholar] [CrossRef]
  40. Halbwirth, H.; Muster, G.; Stich, K. Unraveling the Biochemical Base of Dahlia Flower Coloration. Nat. Prod. Commun. 2008, 3, 1934578X0800300807. [Google Scholar] [CrossRef] [Green Version]
  41. Li, H.; Tian, J.; Yao, Y.-y.; Zhang, J.; Song, T.-t.; Li, K.-t.; Yao, Y.-c. Identification of leucoanthocyanidin reductase and anthocyanidin reductase genes involved in proanthocyanidin biosynthesis in Malus crabapple plants. Plant Physiol. Biochem. 2019, 139, 141–151. [Google Scholar] [CrossRef] [PubMed]
  42. Liu, C.; Wang, X.; Shulaev, V.; Dixon, R.A. A role for leucoanthocyanidin reductase in the extension of proanthocyanidins. Nat. Plants 2016, 2, 16182. [Google Scholar] [CrossRef] [PubMed]
  43. Wang, G.; Yang, B.; Wu, J.; Luo, P.; Anwar, M.; Allan, A.C.; Lin-Wang, K.; Espley, R.V.; Zeng, L. Identification of Genes Involved in Flavonoid Biosynthesis of Chinese Narcissus (Narcissus tazetta L. var. chinensis). Plant Mol. Biol. Report. 2018, 36, 812–821. [Google Scholar] [CrossRef]
  44. Zou, Q.; Wang, T.; Guo, Q.; Yang, F.; Chen, J.; Zhang, W. Combined metabolomic and transcriptomic analysis reveals redirection of the phenylpropanoid metabolic flux in different colored medicinal Chrysanthemum morifolium. Ind. Crops Prod. 2021, 164, 113343. [Google Scholar] [CrossRef]
  45. Zhu, J.; Guo, X.; Li, X.; Tang, D. Composition of Flavonoids in the Petals of Freesia and Prediction of Four Novel Transcription Factors Involving in Freesia Flavonoid Pathway. Front. Plant Sci. 2021, 12, 756300. [Google Scholar] [CrossRef]
  46. Wu, Y.-q.; Wei, M.-r.; Zhao, D.-q.; Tao, J. Flavonoid content and expression analysis of flavonoid biosynthetic genes in herbaceous peony (Paeonia lactiflora Pall.) with double colors. J. Integr. Agric. 2016, 15, 2023–2031. [Google Scholar] [CrossRef]
  47. Jin, X.; Huang, H.; Wang, L.; Sun, Y.; Dai, S. Transcriptomics and Metabolite Analysis Reveals the Molecular Mechanism of Anthocyanin Biosynthesis Branch Pathway in Different Senecio cruentus Cultivars. Front. Plant Sci. 2016, 7. [Google Scholar] [CrossRef] [Green Version]
  48. Xing, A.S.; Wang, X.Y.; Nazir, M.F.; Zhang, X.M.; Wang, X.X.; Yang, R.; Chen, B.J.; Fu, G.Y.; Wang, J.J.; Ge, H.; et al. Transcriptomic and metabolomic profiling of flavonoid biosynthesis provides novel insights into petals coloration in Asian cotton (Gossypium arboreum L.). BMC Plant Biol. 2022, 22, 416. [Google Scholar] [CrossRef]
  49. Lang, X.; Li, N.; Li, L.; Zhang, S. Integrated Metabolome and Transcriptome Analysis Uncovers the Role of Anthocyanin Metabolism in Michelia maudiae. Int. J. Genom. 2019, 2019, 4393905. [Google Scholar] [CrossRef] [Green Version]
  50. Wang, R.; Ren, C.; Dong, S.; Chen, C.; Xian, B.; Wu, Q.; Wang, J.; Pei, J.; Chen, J. Integrated Metabolomics and Transcriptome Analysis of Flavonoid Biosynthesis in Safflower (Carthamus tinctorius L.) with Different Colors. Front. Plant Sci. 2021, 12. [Google Scholar] [CrossRef]
  51. Bao, M.; Liu, M.; Zhang, Q.; Wang, T.; Sun, X.; Xu, J. Factors Affecting the Color of Herbaceous Peony. J. Am. Soc. Hortic. Sci. J. Amer. Soc. Hort. Sci. 2020, 145, 257–266. [Google Scholar] [CrossRef]
Figure 1. Flavonoid biosynthesis pathway.
Horticulturae 09 00082 g001
Figure 2. (a) Distribution of R. liliiflorum in Guizhou Province, China; (b) Pictures of R. liliiflorum flowers and white (W) vs. yellow (Y) parts.
Horticulturae 09 00082 g002
Figure 3. Species distribution of the R. liliiflorum unigenes in the Nr database.
Horticulturae 09 00082 g003
Figure 4. Gene ontology (GO) classification of unigenes.
Horticulturae 09 00082 g004
Figure 5. Eukaryotic Orthologous Groups (KOG) annotations of unigenes.
Horticulturae 09 00082 g005
Figure 6. DEG volcano map. The red dots represent upregulated differentially expressed genes, the blue dots represent downregulated differentially expressed genes.
Horticulturae 09 00082 g006
Figure 7. Gene Ontology analysis of top 50 differential expressed genes.
Horticulturae 09 00082 g007
Figure 8. Kyoto Encyclopedia of Genes and Genomes (KEGG) pathway enrichment analysis of differentially expressed unigenes. The ordinate represents the KEGG pathway and the abscissa represents the Rich factor. The larger the Rich factor, the greater the degree of enrichment. The larger the point, the greater the number of differentially expressed genes enriched in the pathway. The redder the colour of the dot, the more pronounced the enrichment.
Horticulturae 09 00082 g008
Figure 9. Schematic diagram of the flavonoid biosynthesis pathway related to flower pigment in the R. liliiflorum. Enzyme acronyms and expression patterns are shown beside each metabolic step and the direction of synthesis is marked with black arrows. The RNA-seq expression pattern of each gene is shown in heatmaps. The colour scale represents log2-transformed FPKM (fragments per kilobase of exon per million mapped reads) values. W vs. Y represent white and yellow parts of petals in R. liliiflorum, respectively.
Horticulturae 09 00082 g009
Table 1. Clean reads data quality statistics.
SampleRaw ReadsClean ReadsClean Bases (G)Q20 (%)Q30 (%)GC Content (%)
W160,163,29858,377,4688.7698.0294.2946.69
W263,100,24061,086,4229.1698.0594.3546.59
W358,213,40656,532,0148.4897.9194.0346.76
Y151,367,34449,409,4927.4198.1194.5146.36
Y248,489,06846,025,4666.998.1194.5346.14
Y354,472,47852,095,0387.8198.1394.5546.16
Q20: The percentage of alkali base with Qphred value no less than 20 in total alkali base; Q30: Percentage of alkali base with Qphred value no less than 30 in total alkali base; GC content: the percentage of the sum of G and C in high-quality reads to the base of total alkali.
Table 2. Assembly results of transcriptome using Trinity software.
ItemTotal Sequence NumberAverage Length (bp)N50 Length (bp)N90 Length (bp)
Transcripts219,22111351928470
Unigenes180,67713172016590
N50/N90: Sorting the spliced transcripts from long to short, and accumulating the length of transcripts to spliced transcripts no less than 50%/90% of the total length.
Table 3. Length statistics of transcripts and unigenes from the transcriptome assembly.
Sequence Number200–500 bp500–1000 bp1000–2000 bp≥2000 bp
Transcripts85,52050,96445,44637,291
Unigenes47,88650,07245,42937,290
Table 4. Statistics related to unigenes.
DatabaseNumber of GenesPercentage (%)
KEGG81,78447.56%
Nr108,75363.25%
Swiss-Prot78,20945.48%
Trembl108,15962.90%
KOG66,15638.47%
GO90,56052.67%
Pfam81,63947.48%
Table 5. Genes associated with flavonoid biosynthesis were identified in the transcriptome of R. liliiflorum.
Gene NameEC No.Number of DEGs
CYP73AE1.14.13.111
4CLE6.2.1.123
CHSE2.3.1.742
DFRE1.1.12.342
F3′5′HE1.14.14.811
FLSE1.14.11.231
LARE1.14.11.192
CCoAOMTE2.1.1.1042
HCTE2.3.1.13316
I2′HE1.14.13.892
HIDE4.2.1.1054
Enzyme abbreviations: CYP73A: trans-cinnamate 4-monooxygenase; 4CL: 4-coumarate-CoA ligase; CHS: chalcone synthase; DFR: dihydroflavonol-4-reductase; F3′5′H: flavonoid 3′,5′-hydroxylase; FLS: flavonol synthase; ANR: anthocyanidin reductase; LAR: leucoanthocyanidin reductase; CCoAOMT: caffeoyl-CoA 0-methyltransferase; HCT: shikimate O-hydroxycinnamoyltransferase; I2′H: isoflavone 2′-hydroxylase; HID: 2-hydroxyisoflavanone dehydratase.
Disclaimer/Publisher’s Note: The statements, opinions and data contained in all publications are solely those of the individual author(s) and contributor(s) and not of MDPI and/or the editor(s). MDPI and/or the editor(s) disclaim responsibility for any injury to people or property resulting from any ideas, methods, instructions or products referred to in the content.

