Article

In-Orchard Sizing of Mango Fruit: 2. Forward Estimation of Size at Harvest

Institute of Future Farming Systems, Central Queensland University, Rockhampton 4701, Australia
*
Author to whom correspondence should be addressed.
Horticulturae 2023, 9(1), 54; https://doi.org/10.3390/horticulturae9010054
Submission received: 2 November 2022 / Revised: 29 December 2022 / Accepted: 30 December 2022 / Published: 3 January 2023

Abstract

:
Forecast of tree fruit yield requires prediction of harvest time fruit size as well as fruit number. Mango (Mangifera indica L.) fruit mass can be estimated from correlation to measurements of fruit length (L), width (W) and thickness (T). On-tree measurements of individually tagged fruit were undertaken using callipers at weekly intervals until the fruit were past commercial maturity, as judged using growing degree days (GDD), for mango cultivars ‘Honey Gold’, ‘Calypso’ and ‘Keitt’ at four locations in Australia and Brazil during the 2020/21 and 21/22 production seasons. Across all cultivars, the linear correlation of fruit mass to LWT was characterized by a R2 of 0.99, RMSE of 29.9 g and slope of 0.5472 g/cm3, while the linear correlation of fruit mass to L ( ( W + T ) 2 )2, mimicking what can be measured by machine vision of fruit on tree, was characterized by a R2 of 0.97, RMSE of 25.0 g and slope of 0.5439 g/cm3. A procedure was established for the prediction of fruit size at harvest based on measurements made five and four or four and three weeks prior to harvest (approx. 514 and 422 GDD, before harvest, respectively). Linear regression models on weekly increase in fruit mass estimated from lineal measurements were characterized by an R2 > 0.88 for all populations, with an average slope (rate of increase) of 19.6 ± 7.1 g/week, depending on cultivar, season and site. The mean absolute percentage error for predicted mass compared to harvested fruit weight for estimates based on measurements of the earlier and later intervals was 16.3 ± 1.3% and 4.5 ± 2.4%, respectively. Measurement at the later interval allowed better accuracy on prediction of fruit tray size distribution. A recommendation was made for forecast of fruit mass at harvest based on in-field measurements at approximately 400 to 450 GDD units before harvest GDD and one week later.

1. Introduction

Yield forecasts of tree fruits are essential to harvest resource planning and marketing. A range of technologies can be employed in these forecasts, as reviewed by Anderson et al. [1]. One approach relies on manual- or machine-vision-based estimates of both fruit number and mass. Manual estimation of fruit number involves counting fruit on a sample of trees in each orchard, while the estimation of fruit mass distribution requires estimation of mass of a sample of fruit in each orchard. As manual procedures, both are tedious given the number of samples required for a statistically valid estimation. To alleviate the manual workload, machine vision has been applied to orchard fruit counting, e.g., Anderson et al. [2] used a camera system mounted to a vehicle to assess number of fruit in mango (Mangifera indica L.) orchards, reporting an absolute percentage error of less than 10% in 15 of 20 orchards.
An in-orchard estimation of fruit mass can be achieved non-destructively through correlation of mass to fruit lineal dimensions, based on fruit allometry, and a forward prediction of mass at harvest can be made based on an assumed growth rate. Mango fruit mass (M) can be estimated from measurements of fruit length (L), width (W) and thickness (T) (Equation (1), Figure 1), as described by Spreer and Muller [3] and confirmed by Wang et al. [4] and Anderson et al. [5].
M = kLWT
where k ranges from 0.49 to 0.51 for the cultivars considered (R2 = 0.97, RMSE = 28.7 g) by Anderson et al. [5] and Spreer and Muller [3].
The requirement for forward prediction of fruit size at harvest is illustrated in a 2022 season example of a 50,000-tree orchard for which hot weather conditions resulted in early maturation, as judged by dry matter content and flesh colour, when fruit were at a size sub-optimal for market requirements (orchardist pers. comm.). Forward knowledge of this outcome would have allowed change in agronomic practice, e.g., additional irrigation. However, the labor requirement of manual measurement of fruit dimensions using callipers is such that in-orchard fruit sizing is not an established practice in Australian commercial practice., and when attempted, typically involve assessment of an inadequate sample size, i.e., a sample that does not represent the actual size distribution.
Non-destructive in-orchard estimation of fruit dimensions can also be achieved from a camera-based system that incorporates a system for measurement or camera to fruit distance. Given ease of use, such a system allows for sampling of many more fruit. L can be measured from the maximum vertical extent of the fruit in an image acquired from the inter-row of fruit on tree, however, fruit may orient such that a measure of the horizontal extent of the imaged fruit will be between width and thickness.
For example, Utai et al. [6] reported mass estimation using machine vision of fruit of mango cultivar ‘Nam Dok Mai’ in context of pack-line grading, with fruit in a known orientation. An artificial neural network for estimation of mass, with inputs of either manually measured L, W and T or L, W and area as estimated from a top view image, and T estimated from a side view image. Using inputs of manual LWT estimates, an RMSE of 6.6 g was achieved on a test set, while for LWT estimates based on bounding box dimensions from top and side view images, a RMSE of 8.2 g was achieved. Using estimates from top view images only of L and segmented area, or L and fitted ellipse area, or segmented fruit area only, RMSE increased to 9.5, 11.8 and 10.4 g, respectively. However, all methods achieved >95% accuracy in classification of fruit to three size classes.
The CQUniversity (Australia) group has pursued a line of work related to on-tree fruit sizing. Wang et al. [7] developed an Android phone app that processed images taken of on-tree mango fruit against a backing board with a scale to obtain estimates of fruit L and W, with an RMSE of 5 mm reported. Fruit mass was based on the product of L and W2. Wang et al. [4] reported use of a Kinect v2 depth camera mounted on an imaging platform with a LED floodlight used to perform orchard imaging at night for mango fruit load estimation (as used by Anderson et al. [2]. The depth camera allowed measurement of camera to fruit distance and estimation of the actual size of detected and localized fruit using the thin lens formula. A subset of imaged fruit was considered, being those fruit considered to be un-occluded based on eccentricity of an ellipse fitted to the object bounding box. A RMSE of 4.9 and 4.3 mm was reported for fruit L and apparent W, respectively. With the Kinect v2 discontinued from production, Neupane et al. [8] undertook a comparison of seven commercially available depth cameras, recommending the Azure Kinect camera for this fruit sizing application, based on the RMSE of camera to object distance measurements.
A count of mango fruit made some four to six weeks before harvest is reasonable for a harvest forecast as fruit drop is generally low in the period before harvest. A sample of fruit in the orchard can also be measured for lineal dimensions at this time, however, a pre-harvest estimate of fruit size must be adjusted to allow for growth of the fruit before harvest. The increase in fruit mass from fruit set to harvest is typically described by a sigmoidal curve, as illustrated by Carella et al. [9]. Growth models are used for forward prediction of harvest mass in a number of tree fruit crops, notably apple and citrus. For example, Costa et al. [10] predicted final mass of Gala, Golden Delicious and Fuji cultivars of apple based on a linear extrapolation from lineal measurements made between 50 and 80 days after bloom, with prediction of weight at harvest, 80 days later. Prediction error was between 7 and 22%, with R2 of 0.87, for Golden Delicious, and up to 10% for the other cultivars, relative to actual mass of fruit at harvest. Khurshid and Braysher (2009) [11] predicted the final fruit size distribution of Washington Navel oranges from measurements made more than 150 days before harvest, using a non-linear model based on cubic smoothing splines developed on data of three seasons and tested on data of a fourth season. A prediction error of 10%, with R2 of 0.82, was reported. However, such ‘long range’ predictions risk failure when growing conditions are not consistent.
Many authors have presented time series data on mango fruit mass and commented on the impact of environmental conditions such as rainfall above 40 mm (e.g., Anderson et al. [5]; Carella et al. [9]), without modelling of the growth data. Some authors have applied a sigmoidal model to measurements of mango fruit mass across the whole fruit developmental period from fruit set to harvest maturity, (e.g., Da Silva et al. [12]; Souza et al. [13]; Carella et al. [9]). Carella et al. [9] noted that (for ‘Tommy Atkins’ and ‘Keitt’ cultivars) fruit mass increase in the late development period, from 50 to 100 days after flowering, could be described by a linear relationship of decreasing slope in each of three sequential intervals, each 3 to 4 weeks. This result indicates that measurements taken at two times in the final linear growth period can be used to forecast mass at harvest, with the rate of fruit growth expected to be cultivar specific and influenced by growing conditions, particularly soil moisture status.
The current exercise was undertaken to underpin work on the use of in-field machine vision for measurement of fruit dimensions in support of forward prediction of fruit size at harvest. The study focused on the cultivars ‘Honey Gold’, ‘Calypso’ and ‘Keitt’ as examples, given ready access to field plantings. As there is a high rate of fruit drop in the fruit development period before stone hardening (over 50%, and drop can be selective by fruit age and thus size, e.g., Anila and Radha, [14]), focus was given to sizing measurements taken from stone hardening stage onwards, i.e., approximately 6 weeks before harvest, with consideration of the compromise between time before harvest and prediction accuracy. Further, the impact of fruit size measurement error on prediction of tray size distribution was explored, as this is a measure of relevance to industry.

2. Materials and Methods

2.1. Plant Material

Experimental exercises were located in ‘Honey Gold’, ‘Keitt’ and ‘Calypso’ blocks across 4 farms in differing geographic locations, involving 9 orchard blocks and 11 flowering events in the 2020 and 2021 seasons (Table 1). All trees had similar architecture (approx. 3 m height and 3 m width), with a range of tree spacings (e.g., 8 × 3, 7 × 4, 6 × 3). Panicles were tagged at floral initiation (panicle ‘asparagus’ stage, Supplementary Materials), with panicles from two flowering events tagged in orchards 1 and 2. In orchards 3 to 9, only one flower event per block was tagged. No major rainfall events occurred during the measurement periods. Irrigation was discontinued on all populations approximately three weeks before expected harvest, following commercial practice.
Fruit that developed on five tagged panicles on each of five to nine trees (giving 17 to 44 fruit, Table 1) were tagged with numbered flagging tape for each of the 11 flowering events. Fruit were tagged between 4 and 9 weeks before harvest maturity, as judged by growing degree days (GDD) from flowering.

2.2. Harvest Maturity Estimation

The date of commercial harvest maturity was based on GDD from the asparagus stage of flowering, calculated following the procedure described by Ometto [15]. A base lower temperature (Tb) of 12 °C and a base upper temperature (TB) of 32 °C was employed using a target GDD of 1680 for ‘Calypso’ (Moore, [16]), 1800 for ‘Honey Gold’ (Moore, [16]), and 2185 for ‘Keitt’ (Amaral, [17]). Daily maximum and minimum temperatures for GDD calculations were acquired from a temperature record of 15 min interval data from LoRa enabled sensors (SensorHost, Rockhampton, Australia) in screen enclosures mounted 1.2 m above ground and located in an open space adjacent to each orchard. GDD was automatically calculated daily within an in-house developed on-line application, with forward prediction of harvest date based on 10-year average temperature history for each site (www.fruitmaps.info).

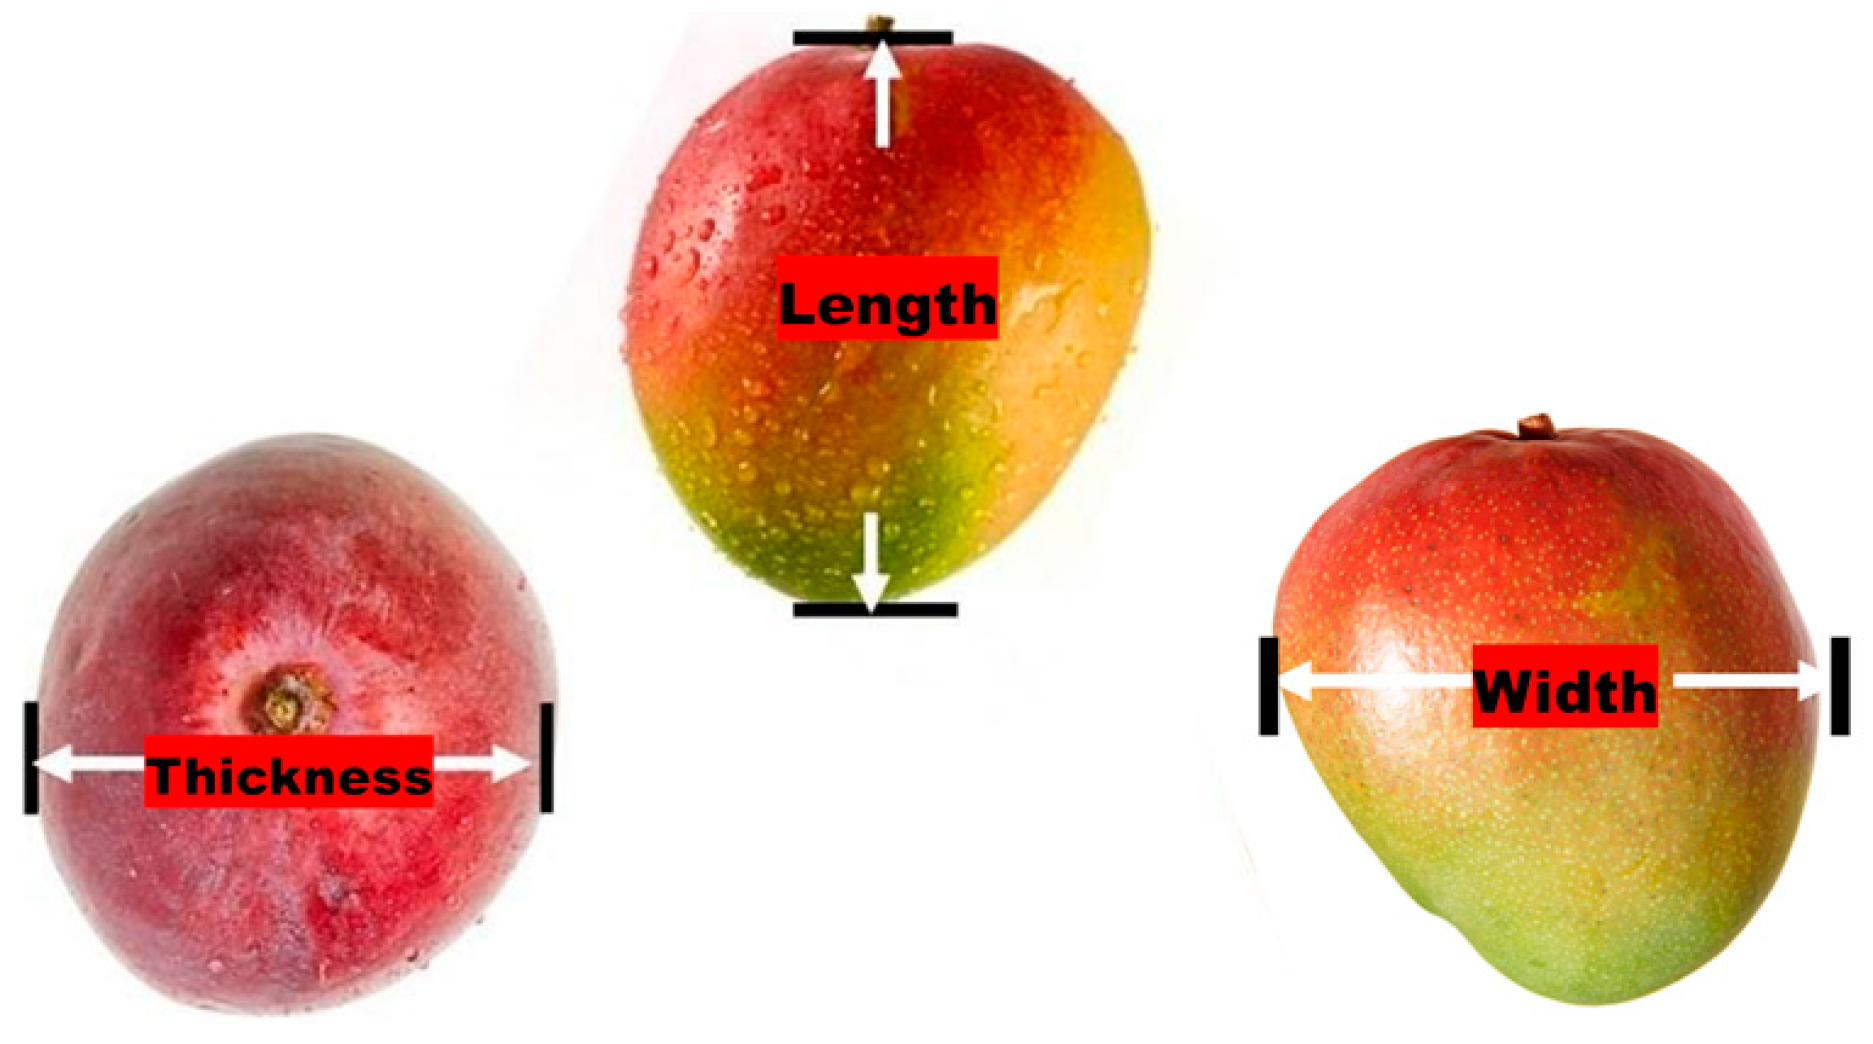
2.3. Fruit Measurements

Weekly measurements were made of the lineal dimensions of fruit L, W and T, continued until beyond harvest maturity as judged by GDD. L, W and T measurements were made to a resolution of 1 mm using callipers (Craftright Metric, Australia). Following harvest, fruit were weighed to an accuracy of 1 g (GX-1000, A&D Weighing, Thebarton, Australia). Forward predictions of mass were made based on a linear rate of increase estimated from measurements made at 5 and 4, and 4 and 3 weeks before harvest.
The impact of error on fruit mass assessment was considered in context of packing into the 7 kg fruit trays typically used by the Australian fruit industry. These reinforced cardboard trays are marketed with either 10, 12, 14, 16, 18, 20 or 22 fruit per tray, with corresponding fruit mass averages of 720, 600, 514, 450, 400, 360 and 327 g.

2.4. Statistics

Standard error (SE) on slope of regression lines of fruit mass on GDD was calculated for each population. A Chi squared statistical test on significance of differences between frequency distributions was undertaken using SigmaPlot v5.0 software. The statistics of Root mean square error (RMSE) (Equation (2)) and Mean Average Error (MAE) (Equation (3)) for the regression model of actual fruit mass on fruit mass estimated from lineal dimensions were calculated as:
RMSE = i = 1 n ( y y i ) 2 n
MAE = i = 1 n | y y i | n
where, ‘ y i ’ represents the actual measurement, ‘ y ’ represents the predicted value, and ‘ n ’ represents the number of samples in the study.

3. Results and Discussion

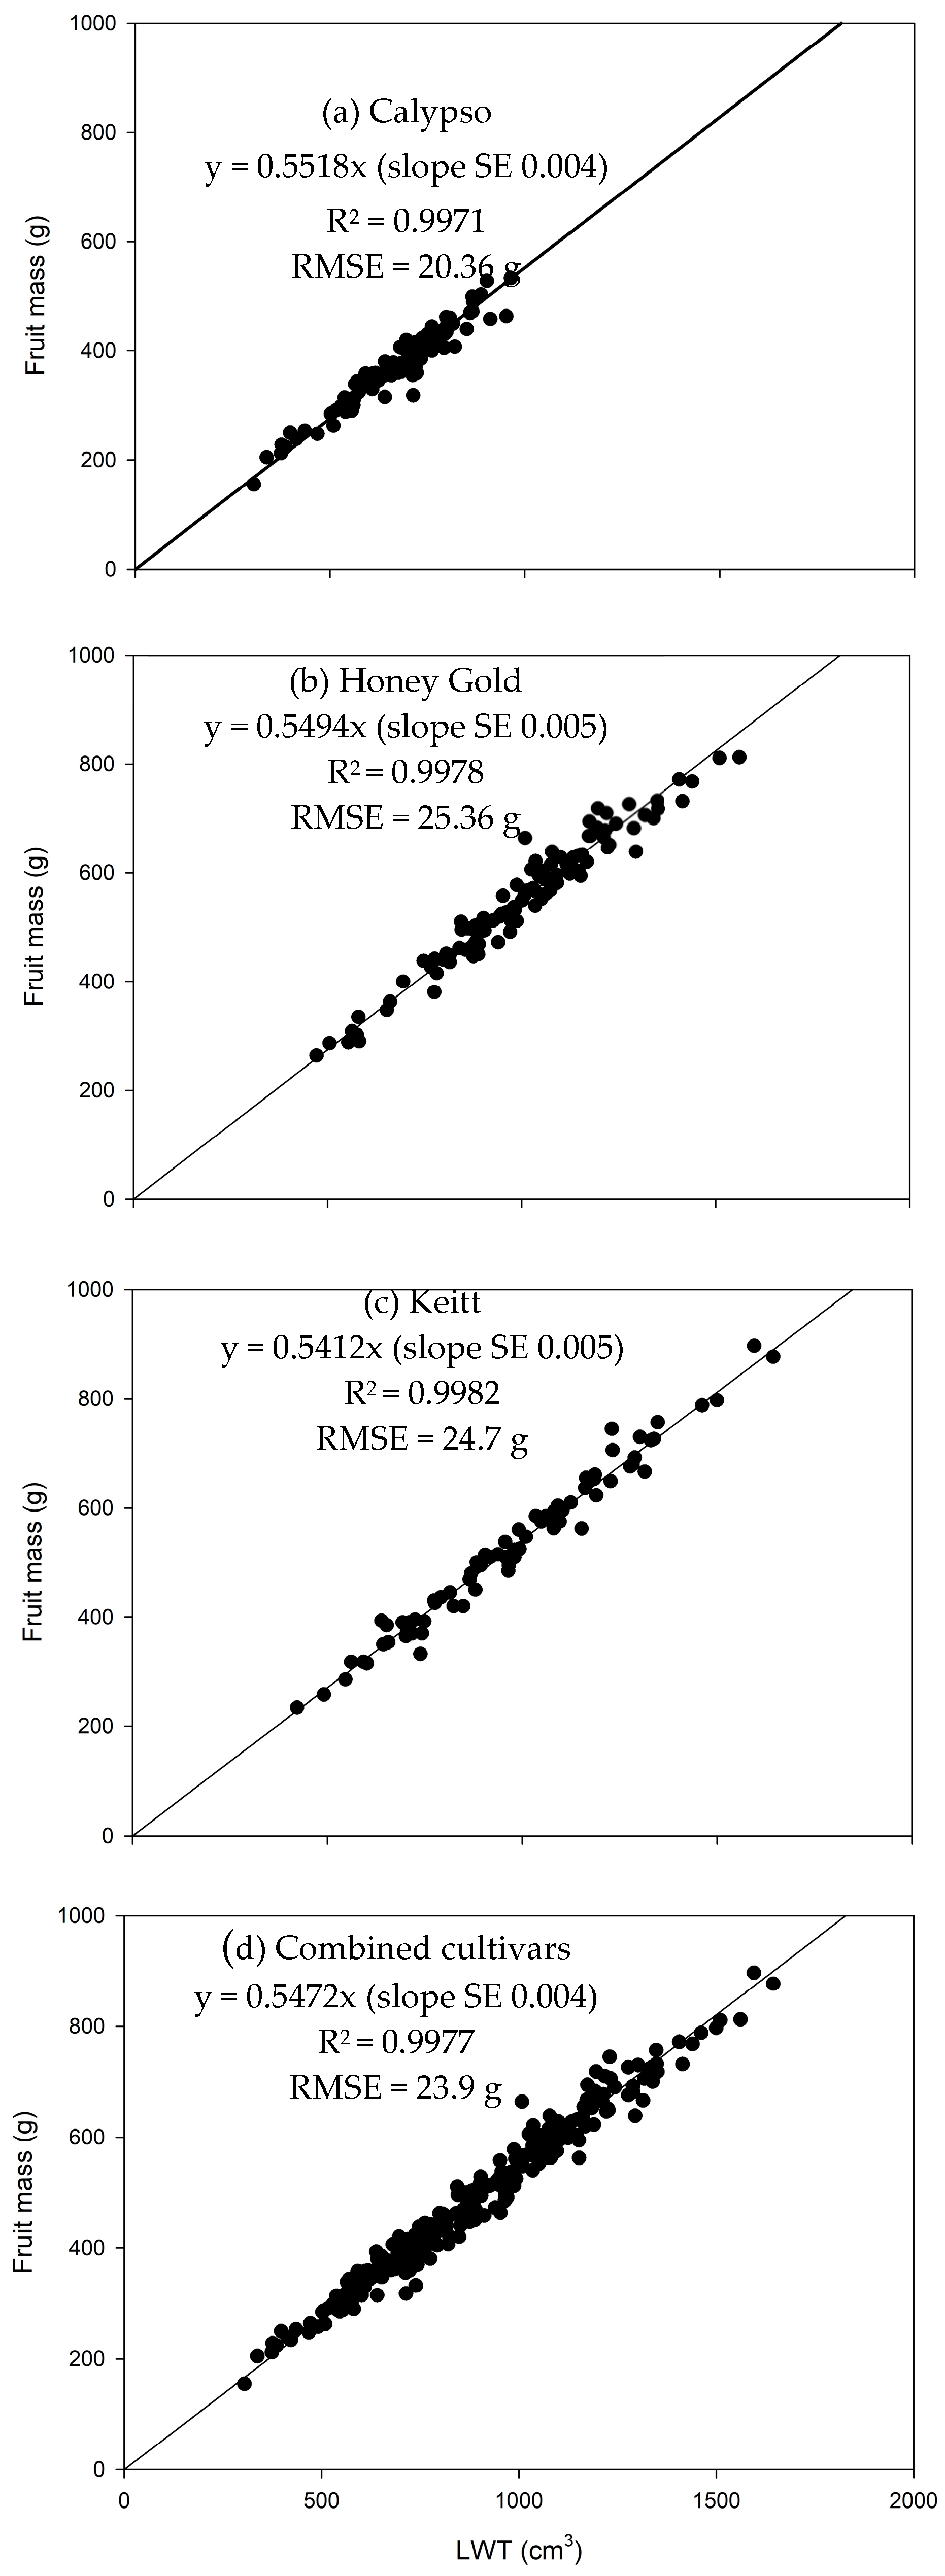
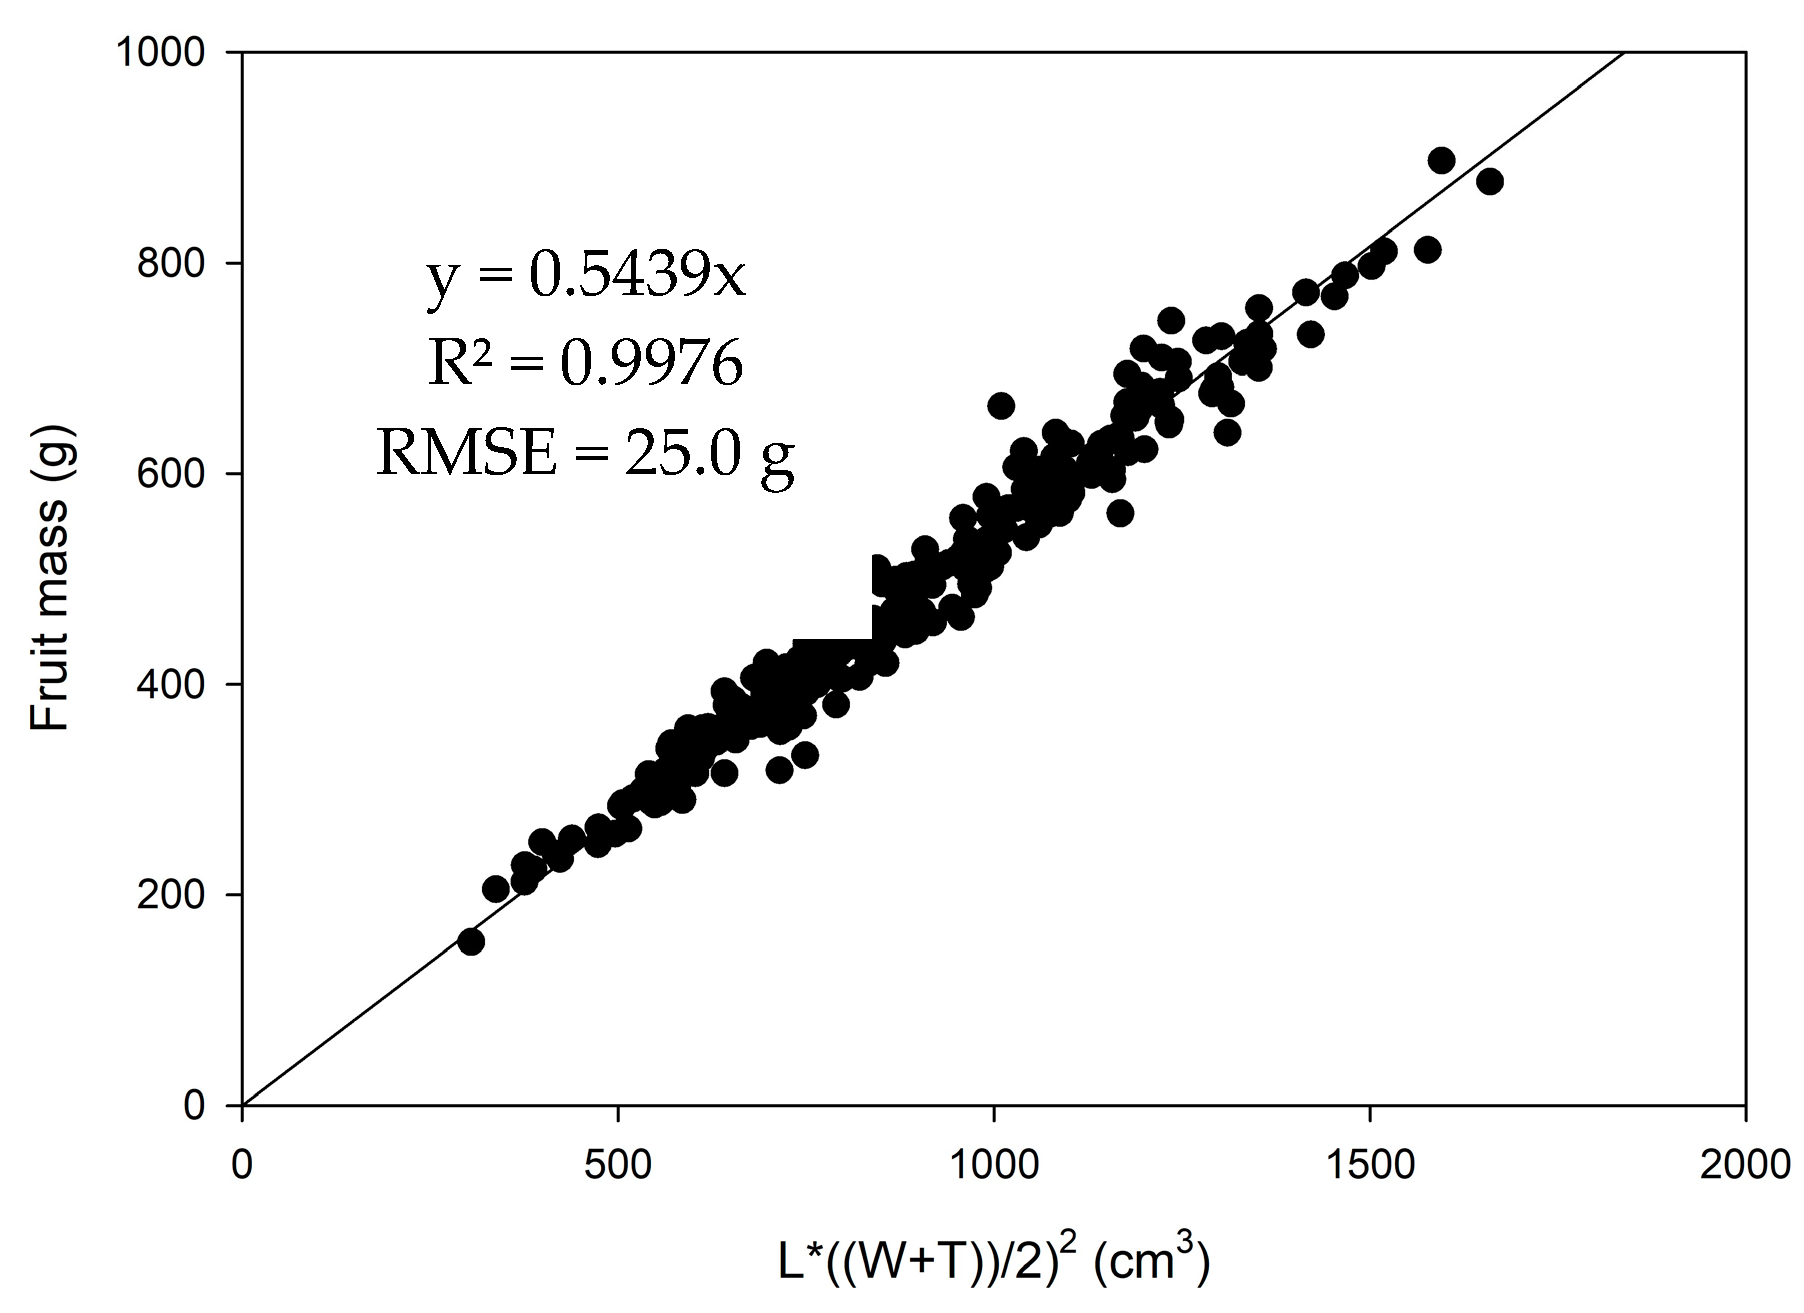
3.1. Estimation of Fruit Mass from Linear Dimensions

Fruit mass was well described by the product of fruit lineal dimensions, L, W and T (Equation (1)) for both cultivar specific models and the combined cultivar model (Figure 2). Although fruit of the assessed cultivars vary somewhat in shape, the combined cultivar model achieved a R2 > 0.997 and RMSE of 29.9 g, which was similar to that of cultivar specific models (Figure 2). Slopes (g/cm3) of 0.55, 0.55 and 0.54 (with SE of 0.005 or less in all cases) were recorded for the ‘Honey Gold’, ‘Keitt’ and ‘Calypso’ populations, while the slope for a combined cultivar model was 0.55 (SE of 0.004). Use of the combined model M (g) = 0.5472*LWT was considered acceptable for mass estimation of these three cultivars. The fit of a linear relationship between mass and volume infers that variation in fruit specific gravity with fruit maturation was negligible in context of the slope of mass to LWT.
These results are consistent with that of Spreer and Muller [3] who reported a linear correlation between fruit mass and LWT for Thai cultivar ‘Chock Anan’, with R2 0.95 to 0.98 and RMSE from 8 to 17 g for data of three seasons, and overall slope of 0.54 g/cm3. For the Australian cultivar ‘Calypso’, Anderson et al. [5] reported a R2 of 0.97, RMSE of 28.7 g and slope of 0.49–0.51 g/cm3.
The fruit lineal dimension of length can be estimated from images of un-occluded fruit on a tree, but as fruit orientation is uncontrolled, the maximum horizontal dimension of imaged fruit will be of orientations ranging from width to thickness. Given a random orientation, on average the apparent width of the imaged fruit will represent the average of fruit W and T (Wang et al. [4]). The correlation of fruit mass to the product of fruit length and the square of the average of W and T (Equation (4)) was similar to that for the product of L, W and T (Figure 2d cf. Figure 3). This result supports the proposed use of machine vision estimates of fruit lineal for estimation of fruit mass.
M = k   L * ( ( W + T ) 2 ) 2

3.2. Sampling

In the current study, tagged fruit were measured by calliper weekly, and later harvested and weighed. This approach avoids sampling variation. For commercial orchard management, tagged fruit could be monitored, but this would require careful selection of ‘representative’ fruit in each orchard. More commonly, a ‘randomly’ selected sample of fruit would be measured. Walsh et al. [18] recommend use of a systematic uniform random sampling strategy, with required sample number (n) is approximated as:
n = t ( SD e ) 2
where SD is population standard deviation, e is accepted error and t is the t statistic for the desired probability level. For example, for 95% probability, a prediction error of 20 g and a SD of 139 g (from Table 1), a minimum sample number of 95 is recommended. For cultivar specific sampling, the ‘Calypso’ SD of 74.3 g invokes a minimum sample number of 30, the ‘Honey Gold’ SD of 119 g, 60, and the ‘Keitt’ SD of 141 g, 100. These numbers are achievable in terms of the required workload for calliper assessment (approx. 2 h for measurement of 100 fruit across an orchard) within commercial practice, although the work is tedious.

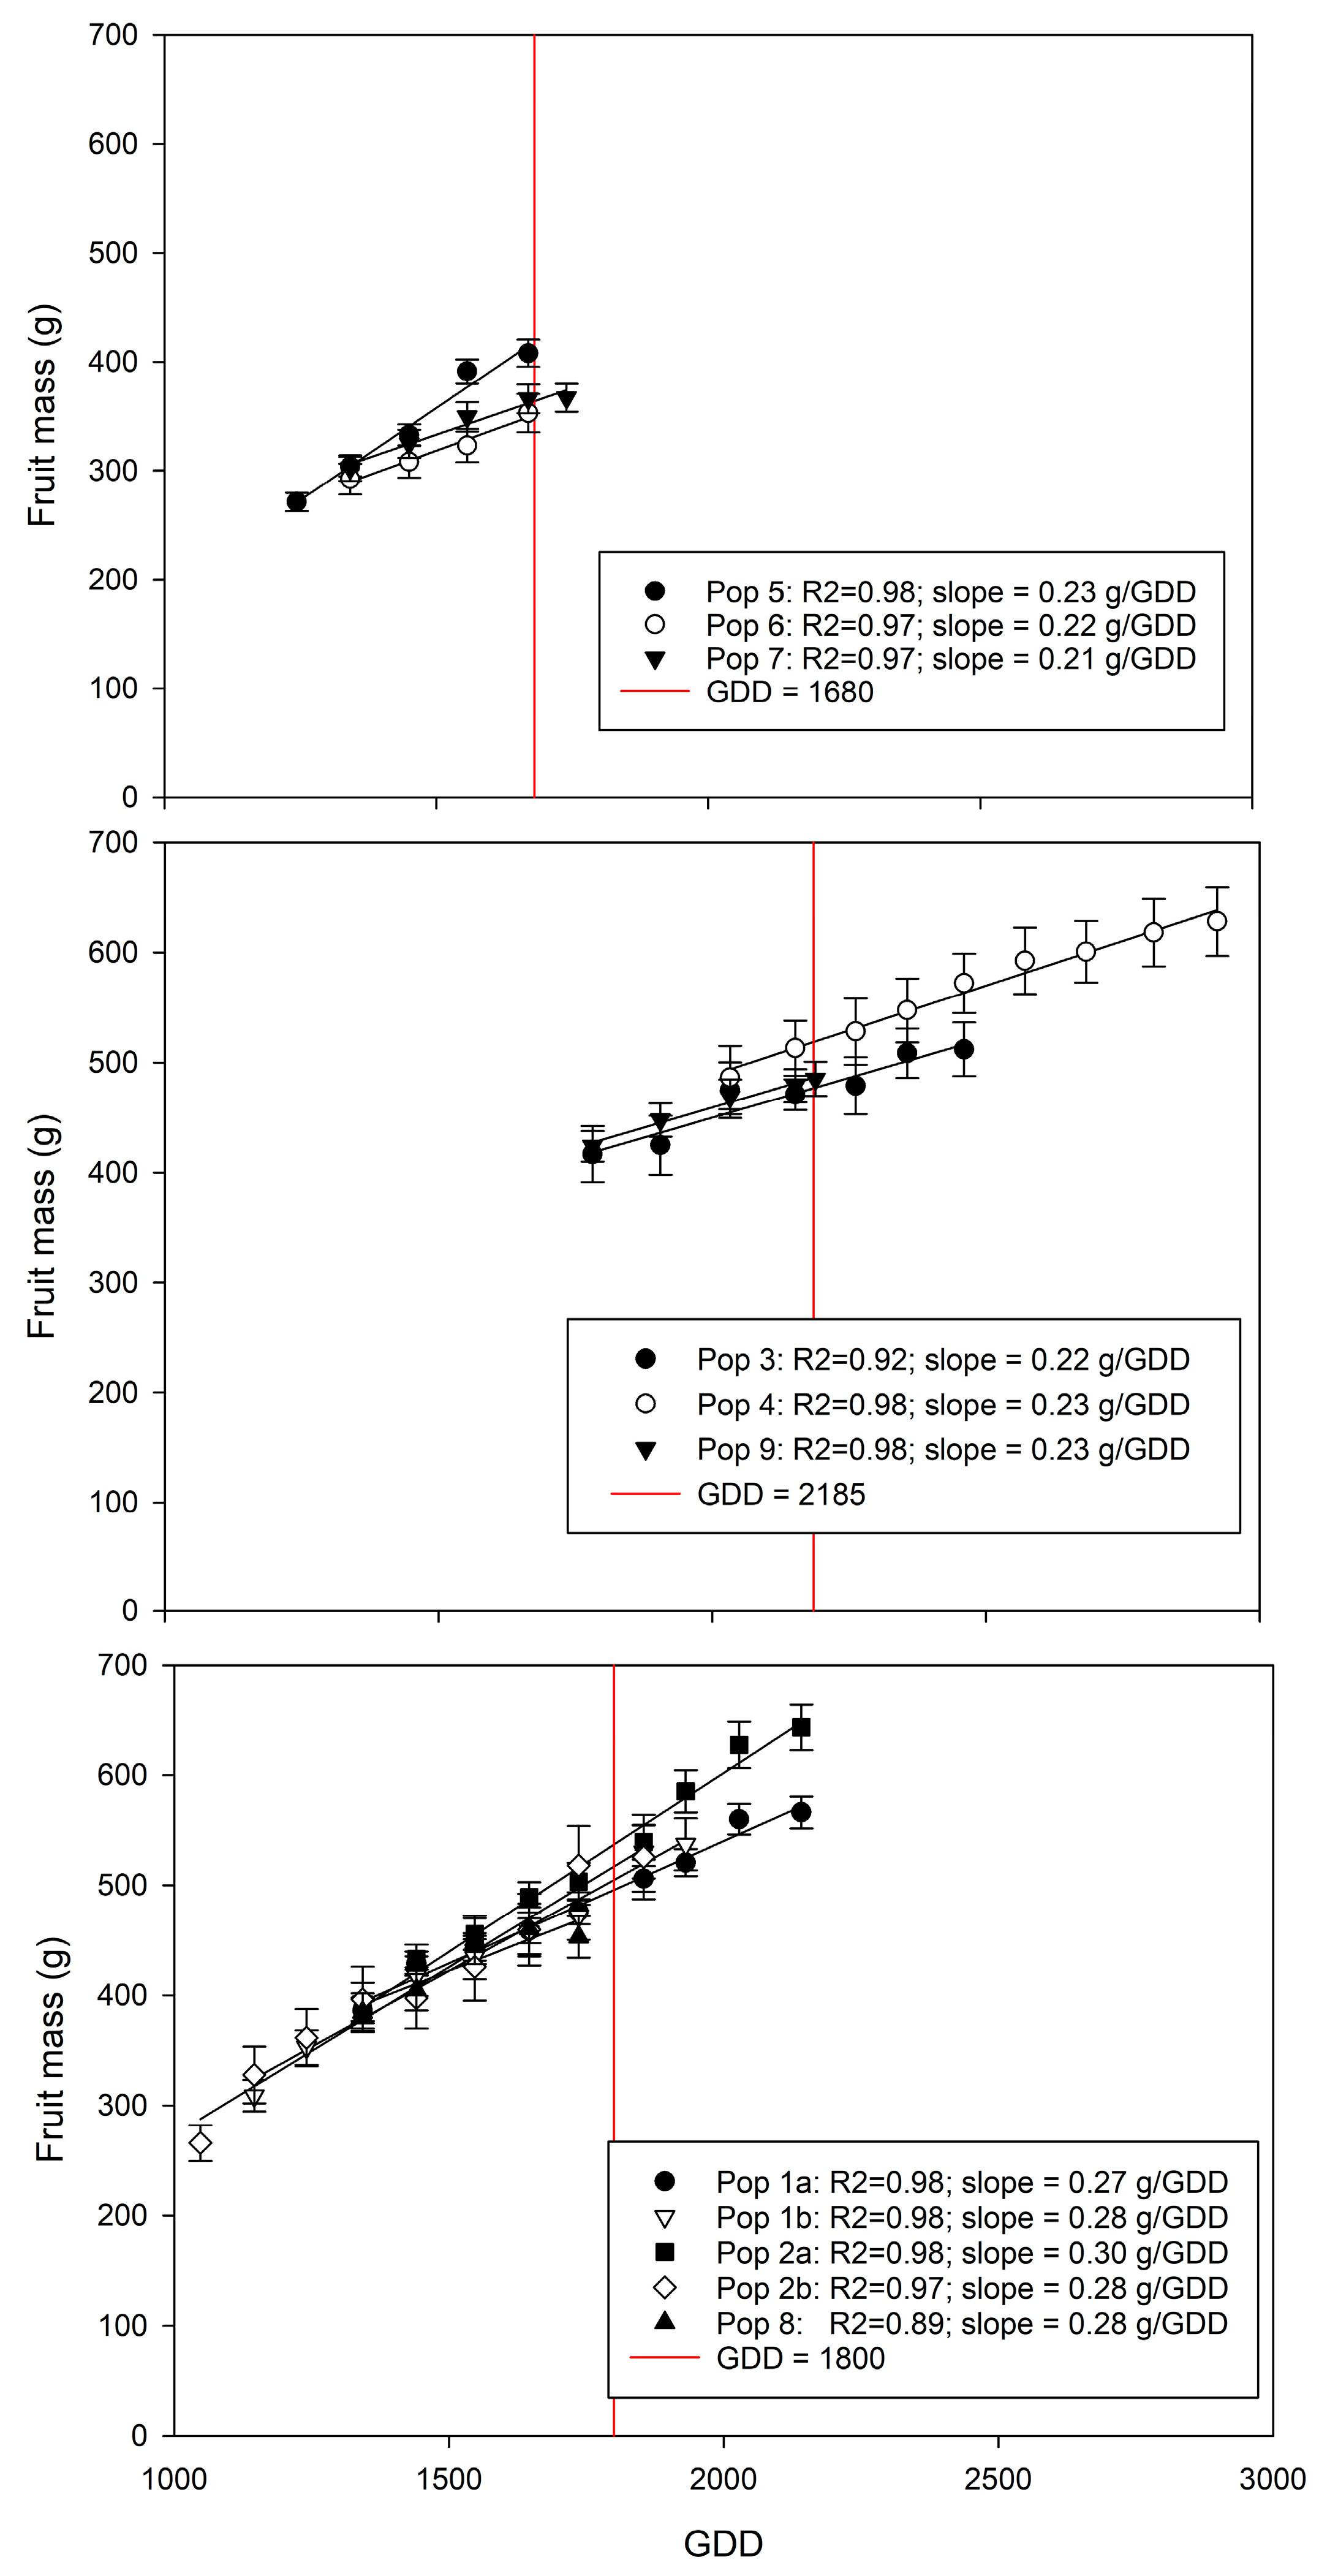
3.3. Prediction of Fruit Mass at Harvest

The rate of fruit growth will be influenced by factors such as crop load and plant water status. Non-linearities in mass increase are expected from variations in growth conditions, particularly plant water status, e.g., as reported for mango by Anderson et al. [5], with a 40 mm rainfall event associated with a decrease in fruit dry matter content but an increase in fruit size. Such responses are well documented for a range of fruits, e.g., stone fruit [19,20].
For the measured period of up to seven weeks before harvest, the R2 of a linear regression fit to the time series data of fruit mass was above 0.89 for all populations assessed, on both a GDD (Figure 4) and calendar day (data not shown), reflecting relatively stable environmental conditions in these cases. However, growth rates varied between populations, i.e., cultivar and growing condition. Rates are reported in terms of g/GDD in Figure 4. For the same data sets, the rates estimated in units of g/week were: (i) between 16.9 and 34.2 g/week for the Calypso sets; (ii) between 17.0 and 32.5 g/week for the Honey Gold sets, and between 15.3 and 18.8 g/week for the ‘Keitt’ sets.
The mean of fruit size increased with time, but population spread, as indexed by SD, was relatively constant over the monitored period in all 11 populations (Figure 4 and Figure 5). It is therefore reasonable to apply a linear projection to the pre-harvest size distribution to produce a predicted mass profile at the anticipated harvest date.
Fruit size distribution for an example population for four field measurement events and actual (harvested) mass is illustrated in Figure 5. The frequency bin size (30 g) was chosen as less than the lowest range of fruit masses in a tray (tray size 22, fruit mass range approximately 60 g).
Forecast of fruit mass at harvest for harvest planning purposes is required as early as possible in fruit development. Forward predictions were made based on a rate of fruit growth estimated from measurements made at 5 and 4, and 4 and 3 weeks before harvest (Table 2). Using measurements taken on weeks 5 and 4, predicted average fruit mass at harvest was under and over-estimated between −15 and 18% (with a mean and SD of absolute errors of 16.3 ± 1.3% across the 11 populations). For measurements taken on weeks 4 and 3 before harvest, estimates were between −6% and 8% (mean and SD of absolute errors of 4.5 ± 2.4%) of actual mass (Table 2), with an RMSE and bias of predicted fruit mass at time of harvest compared to actual fruit mass of 47.5 and 25.9 g, 61.0 and 6.0 g, and 43.8 and −34.6 g, for the ‘Calypso’, ‘Honey Gold’ and ‘Keitt’ populations, respectively.
For recommendation of a cultivar specific sampling start in GDD, the difference in GDD at the sampling dates (3, 4 and 5 weeks before harvest) and GDD at harvest maturity was calculated (Table 2, column 2). For example, for Honey Gold, the GDD difference between five weeks before harvest and harvest ranged from 505 to 524 units across the assessed populations.

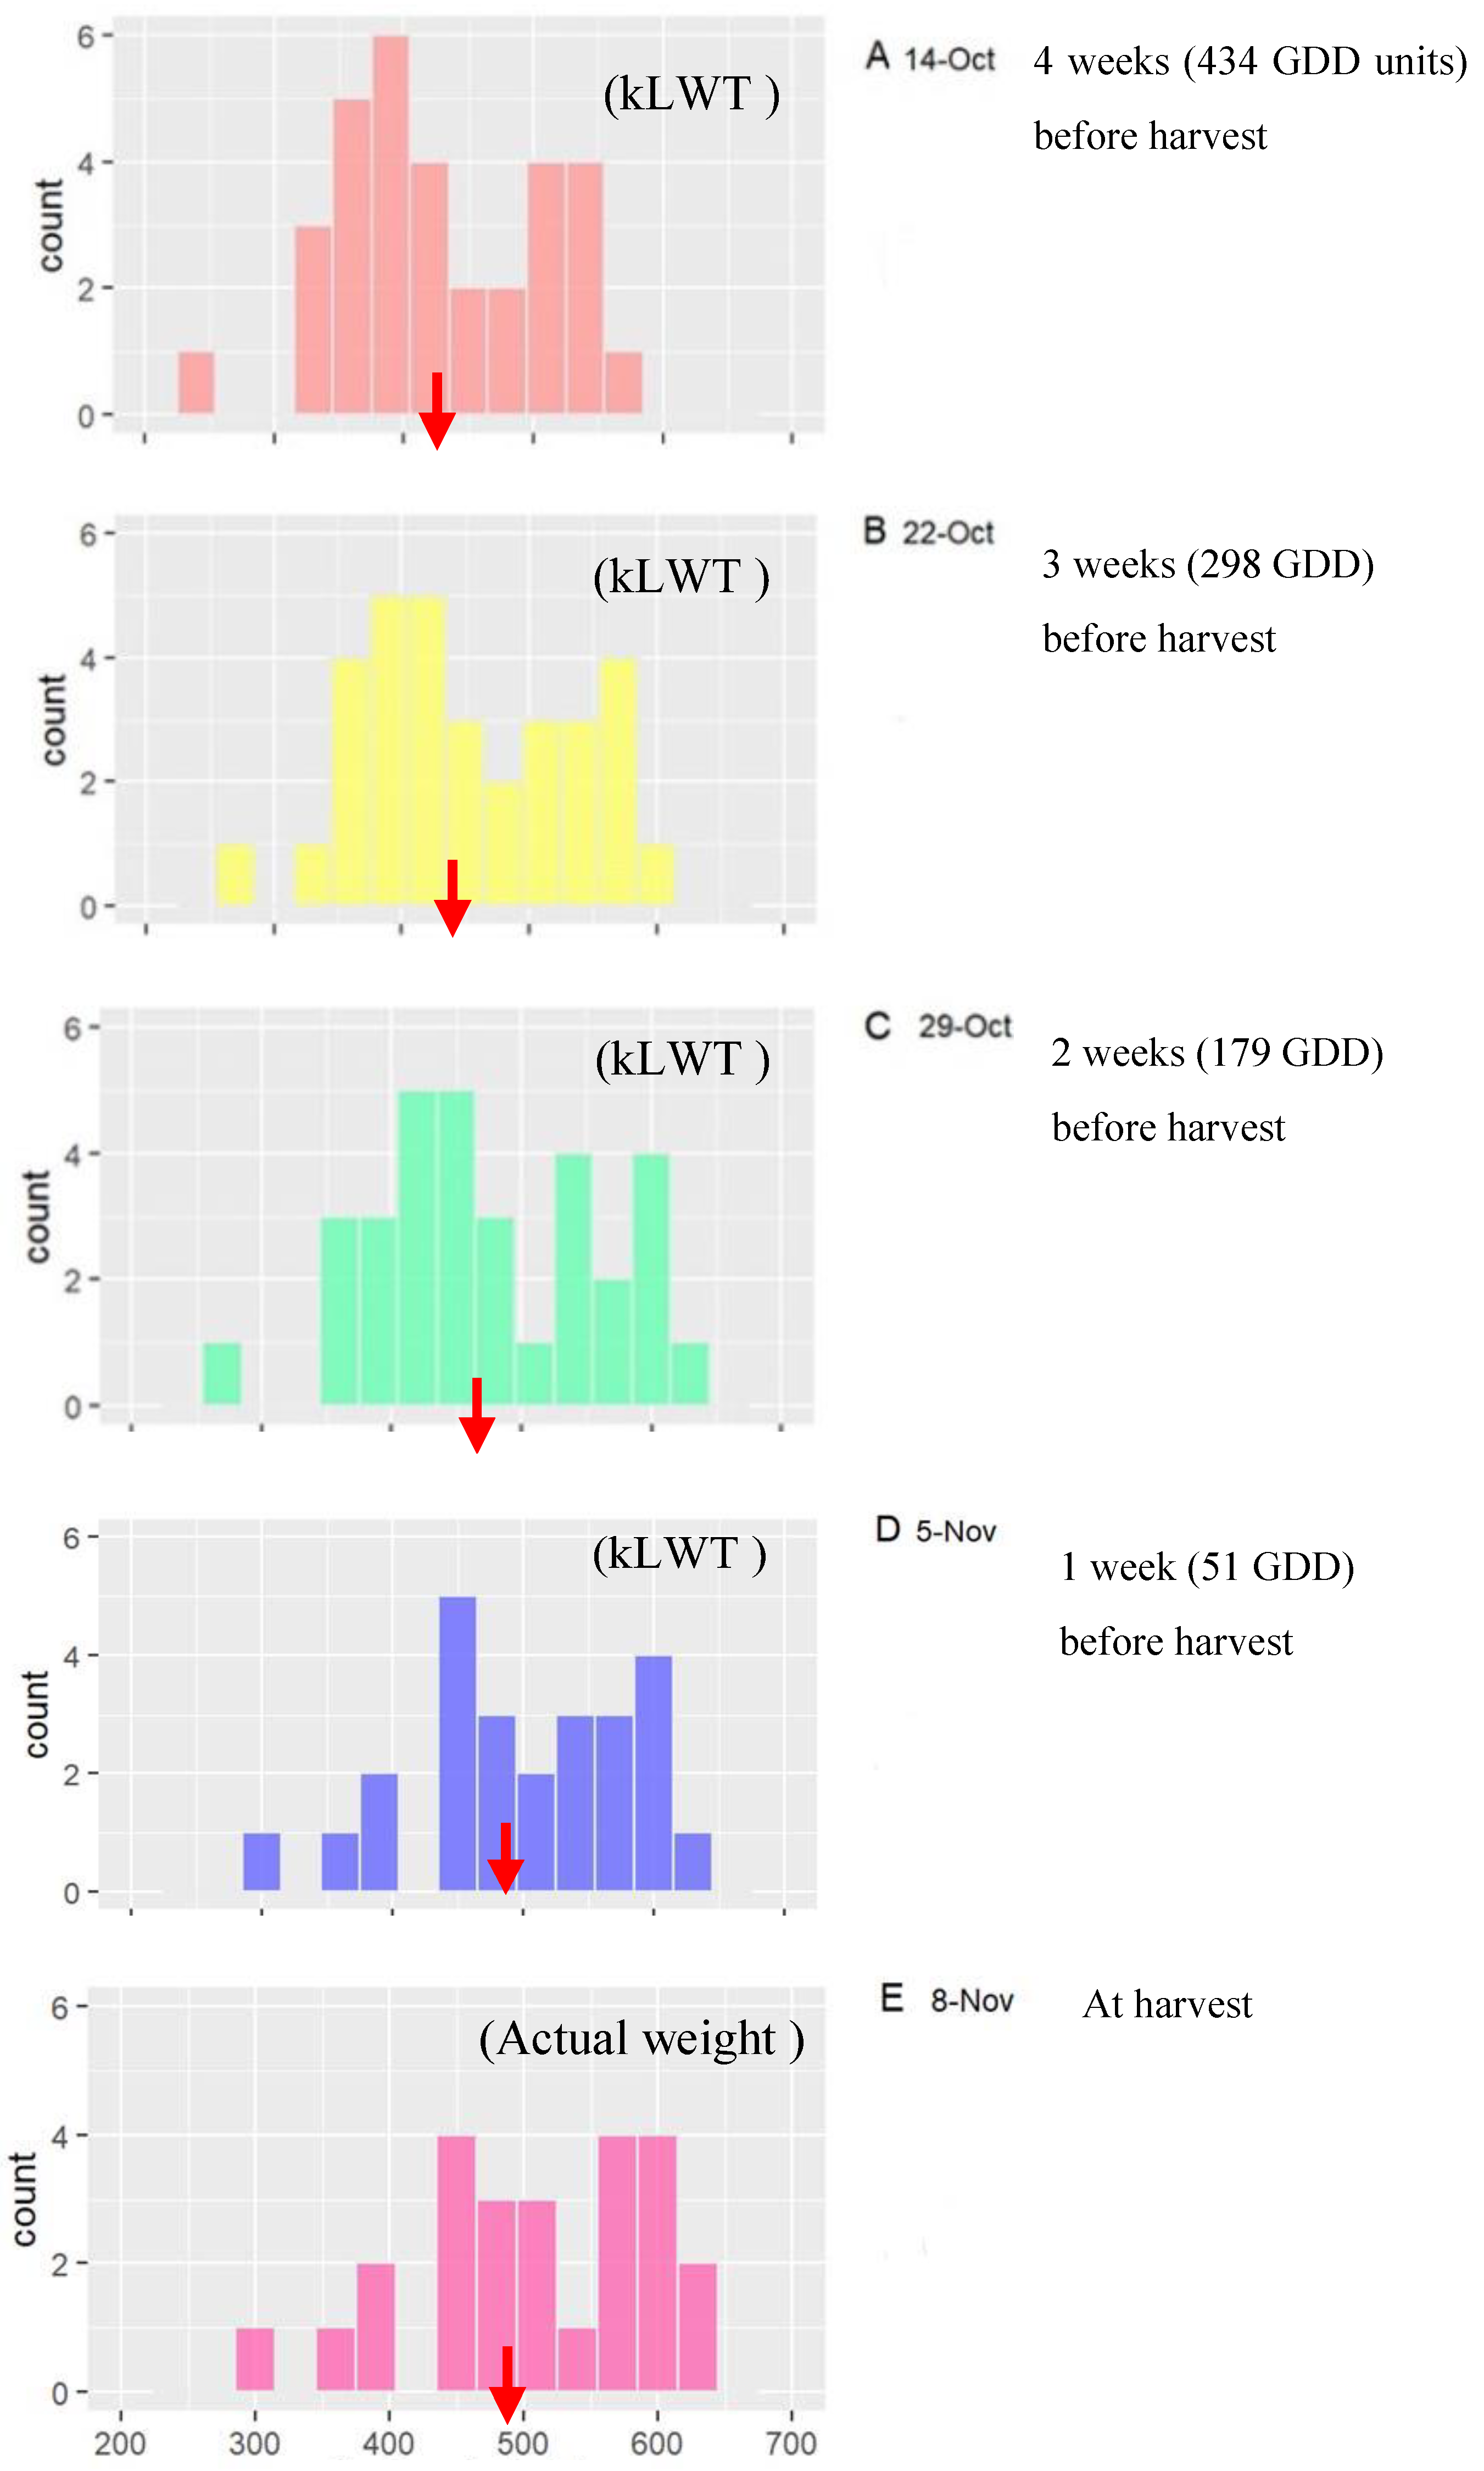
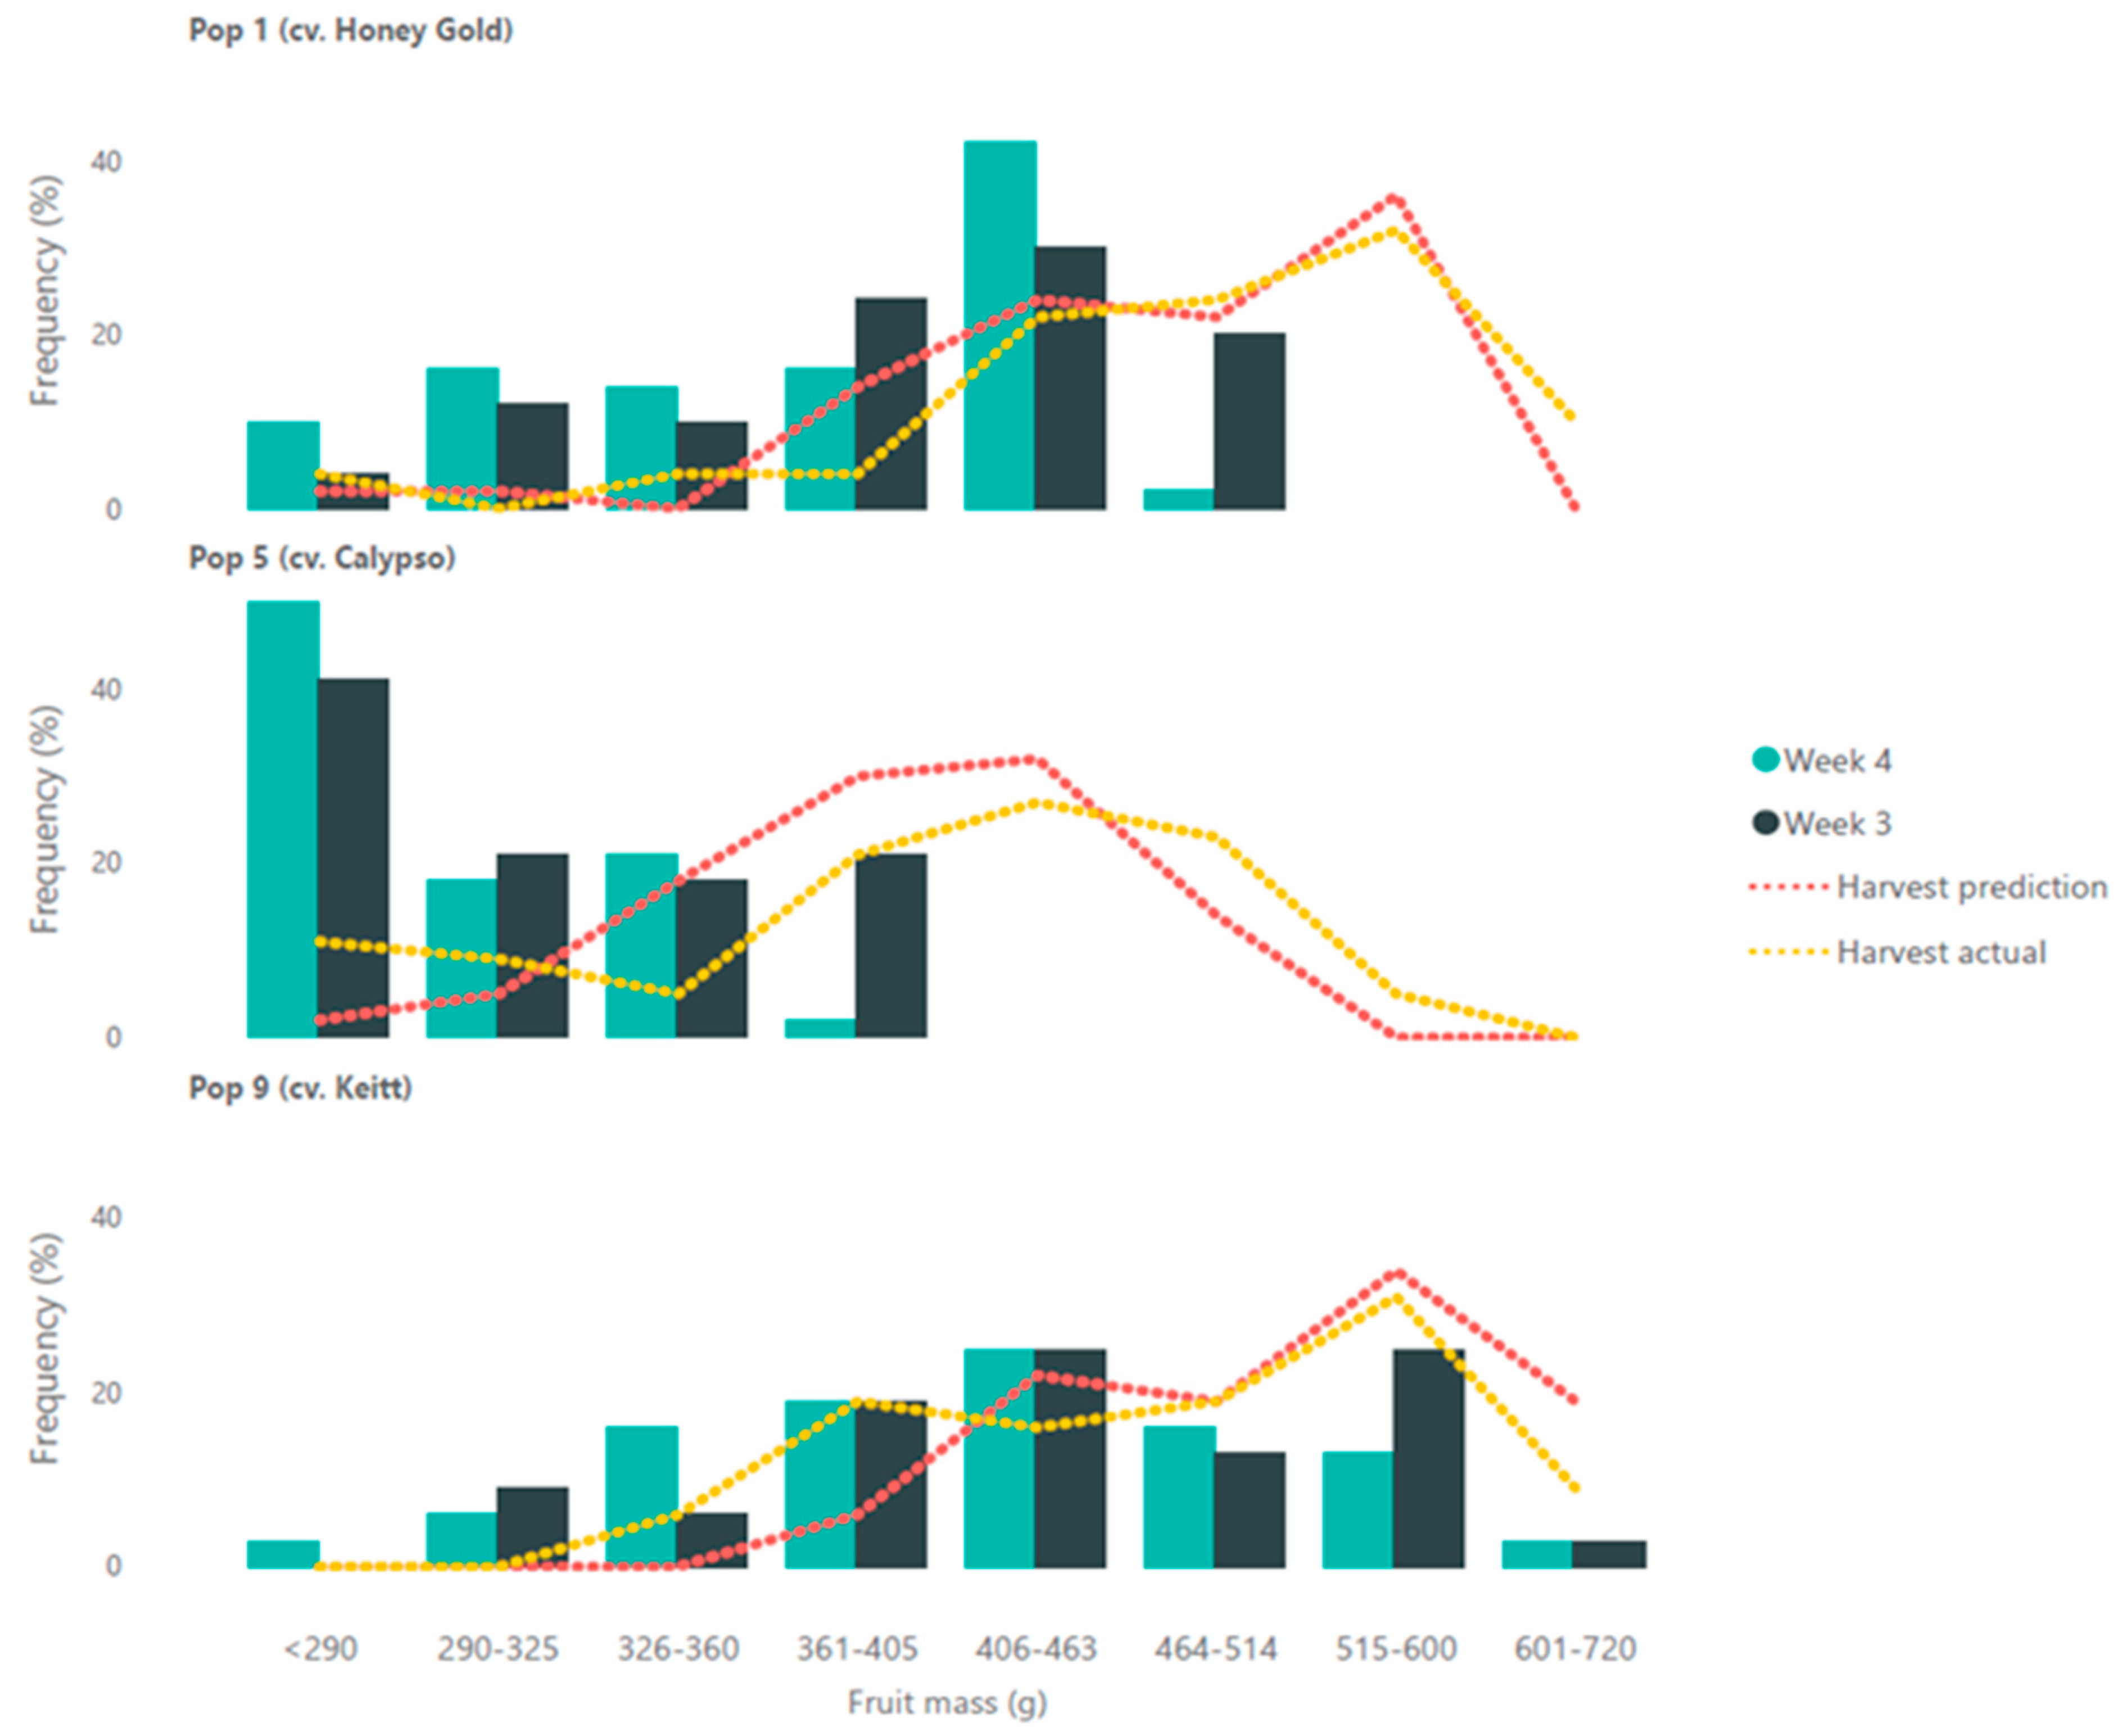
3.4. Prediction of Tray Size Distribution at Harvest

In the Australian industry, mango fruit are generally packed to 7 kg trays, using uniform size fruit. Typical fruit numbers per tray are 10, 12, 14, 16, 18, 20, 22 (Kernot and Meurant, [21]), with corresponding fruit mass limits of 720, 600, 514, 450, 400, 360 and 327 g. Note that mass range decreases as tray fruit number increases, to a minimum range of 52 g.
The percentage distribution of fruit by tray sizes was estimated at 4 and 3 weeks before harvest for example populations of three cultivars (Figure 6). A cultivar specific average growth rate as calculated from change across these measurement dates (Table 2) was used to project fruit sizes and tray size distribution at harvest, allowing comparison to actual harvest mass distribution (Figure 6). Pearson’s chi-squared test indicated a significant (p < 0.05) difference between actual and predicted harvest size frequency for the three cultivars (data not shown), however the distribution is sufficiently accurate to inform harvesting and marketing plans., e.g., a delay in harvest date for a low size distribution population.
The frequency distribution of fruit tray size classes based on estimation of fruit mass using L and the average of W and T (Equation (4)) was not significantly different (X2 test, p < 0.05) compared to use of kLWT (Equation (1)) (Figure 6, Table 3).

3.5. Recommendations for Future Work

Post stone-hardening growth conditions were reasonably stable for all populations assessed, as seen in the strength of linear regressions based on calendar days as well as GDD. Future studies should consider the impact of non-stable environmental conditions during the prediction interval, particularly plant water status. More sophisticated forecast models could accommodate for changes in factors such as crop load and tree water status.
Focus was given to assessment of fruit mass after stone hardening, i.e., after the likelihood of fruit drop decreased, on the logic that fruit drop can be selective based on fruit age, thus altering the fruit mass distribution. This assertion should be further documented, as earlier prediction of harvest time fruit size is of practical importance in harvest management. The manual measurement of fruit size using a statistically relevant sample size and strategy [18] is labour intensive, and this represents a barrier to farm adoption. The results of the current study are encouraging for use of in-orchard machine vision derived estimates of fruit lineal dimensions, as proposed by Wang et al. [4]. RMSE on fruit mass increased only slightly, from 23.9 to 25.0 g, for regressions based on kLWT and kL ( ( W + T ) 2 )2, respectively, and the frequency distribution of fruit tray size distributions was not significantly affected. Use of fruit area as a machine vision input, as suggested by Utai et al. [6], is also warranted.
The use of the in-field machine vision methodology for estimation of fruit size on tree orchard was proposed by Wang et al. [7] and Neupane et al. [8], for implementation on the farm vehicle mounted imaging platform driven at approx. 5 km/h as described by Anderson et al. [2]. This work was extended to a new generation of low-cost distance cameras in a companion paper to the current study [22]. Fruit size estimates made using these methodologies could be coupled to fruit growth models as described in this experiment, although it remains to be documented whether the accuracy of on-the-go measurements is a limitation on practical application. Decreased accuracy is expected, associated with the need to remove partly occluded fruit from consideration. Further, the in-orchard depth-camera based fruit sizing method of Wang et al. [4] may not be appropriate to assessment of small (pre-stone-hardening stage) fruit, given the RMSE of this measurement technique (ca. 5 mm).
The percentage absolute error on the forecast of mango fruit mass at harvest based on lineal measurements of L, W and T made at 5 and 4 weeks before harvest was, on average, 16.3%, while the estimate based on measurements taken at 4 and 3 weeks was, on average, 4.5% (Table 2). These mass estimates can be used in combination with estimates of the number of fruit in the orchard, made by manual or machine vision methods as described by Anderson et al. [2], for prediction of orchard yield in tonnes/ha. The accuracy of such predictions remains to be tested.

4. Conclusions

For practical implementation, it is recommended that a first measurement of fruit size be made at a GDD associated with stone hardening stage, i.e., at the harvest target GDD minus around 400 to 450 units for ‘Calypso’, ‘Honey Gold’ and ‘Keitt’ (Amaral, [17]). A second measure should then be made one week later. As development rates vary with temperature, this recommendation will be associated with a shorter calendar period between stone-hardening and harvest in warmer compared to cooler growing areas.

Supplementary Materials

The following supporting information can be downloaded at: https://fruitmaps.info/, accessed on 1 December 2022, Figure S1: ‘asparagus’, ‘christmas tree’; Table S1: ‘heat units target’; Video S1: ‘timelapse mango flower to fruit’.

Author Contributions

Conceptualization, M.H.A., and K.B.W.; methodology, M.H.A., and K.B.W.; investigation, M.H.A.; writing—original draft preparation, M.H.A.; writing—review and editing, M.H.A., and K.B.W.; supervision, K.B.W.; project administration, K.B.W.; funding acquisition, K.B.W. All authors have read and agreed to the published version of the manuscript.

Funding

Funding for this project (ST19009) was provided by Hort Innovation from the Australian Government Department of Agriculture, Fisheries and Forestry as part of its Rural R&D for Profit program with Central Queensland University, UNE, Mangoes Australia, NT DITT, NSW DPI and DAF Qld, and by Perfection Fresh, Manbullo and Pinata. Hort Innovation is the grower-owned, not-for-profit research and development corporation for Australian horticulture. M.H.A. acknowledges receipt of a CQU International tuition fee waiver.

Data Availability Statement

The data presented in this study are available on request from the corresponding author.

Acknowledgments

The work formed part of the master’s thesis of M.H.A. M.H.A. acknowledges the contribution in data collection and support given from from Agrodan, Brazil, Acacia Hills Farms Ltd., Australia and Geoff Dickinson and Dale Bennett from Queensland DAF.

Conflicts of Interest

The authors declare no competing interests in the undertaking of this work.

References

  1. Anderson, N.; Walsh, K.; Wulfsohn, D. Technologies for forecasting tree fruit load and harvest timing from ground, sky and time. Agronomy 2021, 11, 1409. [Google Scholar] [CrossRef]
  2. Anderson, N.; Walsh, K.; Koirala, A.; Wang, Z.; Amaral, M.H.; Dickinson, G. Estimation of fruit load in Australian mango orchards using machine vision. Agronomy 2021, 11, 1711. [Google Scholar] [CrossRef]
  3. Spreer, W.; Müller, J. Estimating the mass of mango fruit (Mangifera indica, cv. Chok Anan) from its geometric dimensions by optical measurement. Comput. Electron. Agric. 2011, 75, 125–131. [Google Scholar] [CrossRef]
  4. Wang, Z.; Walsh, K.B.; Verma, B. On-tree mango fruit size estimation using RGB-D images. Sensors 2017, 17, 2738. [Google Scholar] [CrossRef] [PubMed] [Green Version]
  5. Anderson, N.; Subedi, P.; Walsh, K. Manipulation of mango fruit dry matter content to improve eating quality. Sci. Hortic. 2017, 226, 316–321. [Google Scholar] [CrossRef]
  6. Utai, K.; Nagle, M.; Hämmerle, S.; Spreer, W.; Mahayothee, B.; Müller, J. Mass estimation of mango fruits (Mangifera indica L.; cv. ‘Nam Dokmai’) by linking image processing and artificial neural network. Eng. Agric. Environ. Food 2019, 12, 103–110. [Google Scholar] [CrossRef]
  7. Wang, Z.; Koirala, A.; Walsh, K.; Anderson, N.; Verma, B. In field fruit sizing using a smart phone application. Sensors 2018, 18, 3331. [Google Scholar] [CrossRef] [PubMed] [Green Version]
  8. Neupane, C.; Koirala, A.; Wang, Z.; Walsh, K. Evaluation of depth cameras for use in fruit localization and sizing: Finding a successor to Kinect v2. Agronomy 2021, 11, 1780. [Google Scholar] [CrossRef]
  9. Carella, A.; Gianguzzi, G.; Scalisi, A.; Farina, V.; Inglese, P.; Bianco, R. Fruit growth stage transitions in two mango cultivars grown in a Mediterranean environment. Plants 2021, 10, 1332. [Google Scholar] [CrossRef] [PubMed]
  10. Costa, G.; Noferini, M.; Bucchi, F.; Corelli-Grappadelli, L. Methods for early forecasting apple size at harvest. Acta Hortic. 2004, 636, 651–659. [Google Scholar] [CrossRef]
  11. Khurshid, T.; Braysher, B. Early fruit size prediction model using cubic smoothing splines for ‘Washington Navel’ (Citrus sinensis L. Osbeck) oranges in Australia. Int. J. Fruit Sci. 2009, 9, 394–408. [Google Scholar] [CrossRef]
  12. Da Silva, D.F.; Salomão, L.C.; Pereira, L.D.; Valle, K.D.; Assunção, H.F.; Cruz, S.C. Development and maturation of mango fruits CV. ‘ubá’ in Visconde do rio branco, Minas Gerais State, Brazil. Rev. Ceres 2018, 65, 507–516. [Google Scholar] [CrossRef]
  13. Souza, J.; Leonel, S.; Modesto, J.; Ferraz, R.; Gonçalves, B. Phenological cycles, thermal time and growth curves of mango fruit cultivars in subtropical conditions. Br. J. Appl. Sci. Technol. 2015, 9, 100–107. [Google Scholar] [CrossRef] [Green Version]
  14. Anila, R.; Radha, T. Studies on fruit drop in mango varieties. Coll. Hortic. J. Trop. Agric. 2003, 41, 30–32. [Google Scholar]
  15. Ometto, J. Bioclimatologia vegetal [Plant Bioclimatology]. Agron. Ceres 1981, 1, 129–155. [Google Scholar]
  16. Moore, C. Developing a Crop Forecasting System for the Australian Mango Industry. Available online: https://www.horticulture.com.au/globalassets/hort-innovation/historic-reports/developing-a-crop-forecasting-system-for-the-australian-mango-industry-mg05004.pdf (accessed on 3 March 2022).
  17. Amaral, M.H.P. Benchmarking New Methods for Estimation of Quantity and Harvest Timing of the Mango Crop. Master’s Thesis, Central Queensland University, Rockhampton, Australia, 2022. [Google Scholar]
  18. Walsh, K.B. In-field estimation of fruit quality and quantity. Agronomy 2022, 12, 1074. [Google Scholar] [CrossRef]
  19. Scalisi, A.; O’Connell, G.M.; Stefanelli, D.; Lo Biancco, R. Fruit and leaf sensing for continuous detection of Nectarine Water Status. Front. Plant Sci. 2019, 10, 805. [Google Scholar] [CrossRef] [PubMed] [Green Version]
  20. Walsh, K.B.; Long, R.L.; Middleton, S.G. Use of near infra-red spectroscopy in evaluation of source-sink manipulation to increase the soluble sugar content of stonefruit. J. Hortic. Sci. Biotechnol. 2007, 82, 316–322. [Google Scholar] [CrossRef]
  21. Kernot, I.; Meurant, N. Mango Information Kit; Agrilink, Dept. of Primary Industries: Nambour, Queensland, 1999. Available online: http://era.daf.qld.gov.au/id/eprint/1647/1/0tit-mango.pdf (accessed on 12 November 2021).
  22. Neupane, C.; Koirala, A.; Walsh, K.B. In-orchard sizing of Mango Fruit: 1. comparison of machine vision-based methods for on-the-go estimation. Horticulturae 2022, 8, 1223. [Google Scholar] [CrossRef]
Figure 1. Dimensions of length, width, and thickness of a mango fruit.
Horticulturae 09 00054 g001
Figure 2. Scatter plots of fruit mass (g) against LWT (cm3) for (a) ‘Honey Gold’ (populations 1a, 1b, 2a, 2b and 8 n = 110) (top panel), (b) ‘Keitt’ (populations 3, 4 and 9, n = 75); (c) ‘Calypso’ (population 5, 6 and 7, n = 100), and (d) all populations, i.e., combined cultivars (n = 285). Pearson’s linear regression fit, equation with SE of slope, R2 and RMSE are shown. Mean and SD of fruit mass of ‘Calypso’, ‘Honey Gold’ and ‘Keitt’ populations were 369 ± 74, 553 ± 118, and 524 ± 149 g, respectively.
Horticulturae 09 00054 g002
Figure 3. Scatter plot of fruit mass (g) against L ( ( W + T ) 2 )2 (cm3) for all populations, i.e., combined cultivar data. Pearson’s linear regression fit, equation and R2 shown on graph. Samples are common to those presented in Figure 2.
Horticulturae 09 00054 g003
Figure 4. Plot of fruit mass estimated from lineal measurements of L, W and T using a combined cultivar model against Growing Degree Days (GDD) from ‘asparagus’ stage. Measurements were made at intervals of 7 days. Top panel: ‘Calypso’ fruit from two blocks that flowered two weeks apart (pop. 5 and 6) in the same farm in NT, and from a FNQLD orchard (pop. 7). Middle panel: populations of Honey Gold fruit from two flowering events in each of two blocks in CQLD (pop. 1 and 2) and a block from FNQLD region (pop. 8). Bottom panel: ‘Keitt’ fruit from two blocks that flowered two weeks apart (pop. 3 and 4) and a block from Northeast, Brazil (pop. 9); Data is presented as mean with associated SE, for n = 17 to 44 (see Table 1). Harvest maturity date (by GDD) for each fruit cultivar is indicated by a vertical red line.
Horticulturae 09 00054 g004
Figure 5. Frequency distributions of fruit mass (kLWT) (using 30 g categories) of population 9 for each of four weeks (panels AD) and of actual mass at harvest (panel E). Mean fruit mass at each date is shown as a red arrow. Mean and SD of mass (kLWT) was 424 ± 79, 448 ± 86 and 469 ± 88, 479 ± 85 and 485 ± 88 g for panels A to E, respectively.
Horticulturae 09 00054 g005
Figure 6. kLWT estimate. Frequency (% of total fruit number) for fruit mass ranges equivalent to tray sizes for Populations 1 (top), 5 (middle) and 9 (bottom), i.e., example ‘Calypso’, ‘Honey Gold’ and ‘Keitt’ populations, respectively. Each panel displays a distribution for four and three weeks before harvest (bars), and for the forecast and actual fruit size at harvest (lines). Forecast size was based on a growth rate of 23.2, 32.7 and 25.1 g/week (as estimated from the mass change between weeks 4 and 3) for populations 1, 5 and 9, respectively. Fruit mass was calculated using fruit L, W and T (Equation (1)).
Horticulturae 09 00054 g006
Table 1. Fruit populations derived from separate orchards, cultivars, and flowering events, as used in sizing exercises. Farm A was in central Queensland, B in Northern Territory, C in Far North Queensland (Australia) and D in northern Brazil. In orchards 1 and 2, fruit from which of two flowering events (a,b) were monitored. The monitored period refers to the period (weeks before harvest) over which measurements were made. Dates of fruit size assessment refer to day-month and GDD units from asparagus stage of panicle development.
FarmPopulationCultivarSeasonFruit Sample Size
(n)
Monitored Period (weeks)Day-Month of
Initial Assessment (GDD)
Day-Month of Final Assessment
(GDD)
A 1aHoney Gold2020/2125719-11 (1250)14-01 (1886)
A1bHoney Gold2020/2125719-11 (1328)14-01 (1965)
A 2aHoney Gold2020/2125919-11 (1250)14-01 (1886)
A2bHoney Gold2020/2115919-11 (1318)14-01 (2141)
A 3Keitt2020/2126722-12 (1796)02-02 (2456)
A4Keitt2020/2117914-01 (2053)11-03 (2922)
B5Calypso2021/2244502-09 (1243)30-09 (1669)
B6Calypso2021/2227402-09 (1410)23-09 (1739)
C7Calypso2021/2229403-11 (1369)29-11 (1739)
C8Honey Gold2021/2220403-11 (1369)29-11(1739)
D9Keitt2021/2232514-10 (1755)8-11 (2188)
Table 2. Prediction of harvest fruit mass from pre-harvest measurements of fruit L, W and T dimensions at between 5 and 4, or 4 and 3, weeks before harvest. The GDD values for the start date of size measurements (nominally 4 and 5 weeks from target harvest date) are given. Percentage error is calculated as (predicted mass—actual mass) divided by actual mass × 100. Bottom rows (*) present mean and SD of absolute errors. Sample size per population varied between 17 and 44 (see Table 1).
PopulationGDD at Measurement Start (Weeks before Harvest)Period (Weeks before Harvest)Slope
(g/week)
Predicted Mass at Harvest MaturityActual Mass (LWT) at Harvest MaturityPercentage Error (%)
1a505.1 (5)5 and 442.659950618
1a421.2 (4)4 and 312.5479506−5
1b523.6 (5)5 and 441.556048715
1b418.5 (4)4 and 323.24874870
2a505.1 (5)5 and 452.268659016
2a421.2 (4)4 and 324.3574590−3
2b523.6 (5)5 and 41.2444526−15
2b431.0 (4)4 and 330.25605266
8371.3 (4)4 and 320.14654533
5443.1 (4)4 and 332.7402408−2
6434.0 (4)4 and 3 *16.0339353−4
7371.3 (4)4 and 322.63933677
3469.5 (4)4 and 38.1449479−6
4427.8 (4)4 and 326.95945724
9433.9 (4)4 and 325.15234858
Mean ± SD 514.3 ± 9.25 and 434.4 ± 22.0 16.3 ± 1.3 *
Mean ± SD422.1 ± 27.44 and 319.6 ± 7.1 4.5 ± 2.4 *
* Mean ± SD of absolute values of percentage errors.
Table 3. k L* ( ( W + T ) 2 )2 estimate. Frequency (% of total fruit number) fruit mass ranges equivalent to tray sizes at (i) four and (ii) three weeks before harvest, (iii) the forecast fruit size and (iv) for the actual harvest mass of fruit, for populations 1, 5 and 9, being example ‘Calypso’, ‘Honey Gold’ and ‘Keitt’ populations. Forecast fruit size was based on a growth rate of 17.9, 30.3 and 25.1 g/week, as estimated from the mass change between weeks 4 and 3, for the three populations, respectively. Fruit mass was calculated using fruit L and the average of W and T (Equation (4)). Each estimated distribution (i.e., each table column) was compared to that generated using kLWT (Equation (1)) to estimate mass, as displayed in Figure 6, using a chi-squared test.
Population111155559999
Fruit mass(i) week 4(ii) week 3(iii)
harvest prediction
(iv)
harvest actual
(i) week 4(ii) week 3(iii)
harvest prediction
(iv)
harvest actual
(i) week 4(ii) week 3(iii)
harvest prediction
(iv) harvest actual
(g)(%)(%)(%)(%)(%)(%)(%)(%)(%)(%)(%)(%)
<29010444593951160
290–3251612 18239939
325–3601010442018115166 6
361–405182418421834201616919
405–46340242422 322725281616
464–5146262824 92316132219
515–600 2232 516253131
601–720 10 33199
>720
Comparison to distribution based on kLWT estimated mass (as presented in Figure 6), by column.
X2 *2.81.411.3 0.00.65.5 2.80.31.9
p value *0.7230.9100.080 1.0000.8800.360 0.9001.0000.749
                       
* Pearson’s chi-squared test (X2) and p-value compared to data of Figure 6 (Equation (1)).
Disclaimer/Publisher’s Note: The statements, opinions and data contained in all publications are solely those of the individual author(s) and contributor(s) and not of MDPI and/or the editor(s). MDPI and/or the editor(s) disclaim responsibility for any injury to people or property resulting from any ideas, methods, instructions or products referred to in the content.

