Article

Growth, Phytochemicals, and Antioxidant Activity of Kale Grown under Different Nutrient-Solution Depths in Hydroponic

College of Horticulture, South China Agricultural University, Guangzhou 510642, China
*
Author to whom correspondence should be addressed.
Horticulturae 2023, 9(1), 53; https://doi.org/10.3390/horticulturae9010053
Submission received: 2 December 2022 / Revised: 15 December 2022 / Accepted: 23 December 2022 / Published: 3 January 2023

Abstract

:
To explore the effect of different nutrient-solution depths on the growth and phytochemicals accumulation of kale, three different nutrient-solution depth treatments (De-1: 1 cm, De-2: 2 cm, and De-3: 3 cm) were applied in the plant factory with artificial lighting. The maximum levels of plant height, stem diameter, total leaf area, total root length, and root surface area as well as fresh and dry weight of the shoot and root were all noted in De-2 at 24 days after treatment. Low nutrient-solution depth treatments (De-1 and De-2) were beneficial for total chlorophyll accumulation and nutrient ions uptake (N, P, K, Ca, S, and Zn). However, there were no obvious differences in DPPH and FRAP as well as contents of total polyphenols and flavonoids. In high nutrient-solution depth treatment (De-3), the contents of carotenoid, soluble sugars, and vitamin C were higher than those in De-1 and De-2. The contents of total glucosinolates (GLs), aliphatic GLs, and indole GLs significantly increased in kale under De-3. Higher contents of reactive oxygen species (ROS), hydrogen peroxide (H2O2), oxalate oxidase (OXO), and proline were observed in kale roots under De-2 and De-3. Overall, 2 cm of nutrient-solution depth could be used to promote kale growth, and 3 cm may represent a potential approach for improving kale quality in a plant factory.

1. Introduction

Despite an impressive increase in global grain production due to agricultural technology innovation, it is necessary to increase food production by 75% and world food reserves by 14% to feed 9.7 billion people worldwide by 2050 [1,2]. To sustainably feed the world’s growing population, hydroponics has been identified as one of the water-saving and promising cultivation methods to produce more from less [3]. Compared with traditional soil culture, crops in the hydroponic system require less growing time due to the efficient utilization of nutrients, and higher yields can be obtained since the planting density is higher [4]. Therefore, hydroponics is often used in plant factories, and nutrient solution management is considered a key way to regulate the yield and quality of crops.
Root-zone environmental factors such as pH, dissolved oxygen, electrical conductivity (EC), composition, and nutrient concentration have a direct impact on crop growth and quality [5,6,7]. In particular, low dissolved oxygen in nutrient solution can be detrimental to root growth and reduces the absorption of water and minerals by the plant, which might limit growth [8,9]. Furthermore, plant roots in a poor oxygen environment can remarkably decrease ATP production compared with well-oxygenated roots and lead to root rot due to anaerobic fermentation [10]. For roots respiration, the oxygen needed by hydroponic crops is obtained by the roots growing in the water and by the roots exposed to the air simultaneously [11,12]. The amount of oxygen dissolved in nutrient solution and the number of roots exposed to air could affect root respiration. According to Henry’s law, the solubility of oxygen in water is primarily determined by the temperature of water and the partial pressure of oxygen in the air [13]. Generally, the amount of oxygen dissolved in the nutrient solution is gradually reduced as the depth of the nutrient solution increases. At 4 cm depth, the content of dissolved oxygen decreases to 82% of oxygen saturation in the deep-flow technique system (DFT) [14]. Recycling the nutrient solution in a DFT system without aeration may not satisfy the oxygen demand of roots for all kinds of crops that floats on water, especially for Brassica [15].
Various attempts have been conducted to ensure enough dissolved oxygen content in the nutrient solution and prevent root rot. Aeration is one of the useful methods that generates bubbles by air pump or air sucker to oxygenate the nutrient solution. At the same temperature, generating smaller bubbles or enhancing aeration intensity can expand the gas–liquid exchange area to increase dissolved oxygen concentrations and promote crop growth [16,17]. Although the methods of increasing aeration and flow rate can increase the rate of oxygen diffusion in the nutrient solution, they require electricity, which increases operating costs for plant factories. Oxygen dissolved in water diffuses 10,000 times more slowly than in air, so dissolved oxygen in water is lower than in the atmosphere [18]. Thus, exposing entire roots or the upper part of roots in the air by adjusting nutrient-solution depth is a simple way to enlarge the surface area of roots for oxygen uptake in the hydroponic system, such as nutrient film technique and ebb-and-flow system [19]. For leafy vegetables cultivation, a modified DFT system, which is similar to the ebb-and-flow system, has been widely used in plant factories [20]. It supplies dissolved oxygen by nutrient-solution circulation and allows adjusting the water level by several sluice doors according to the cultivation crop and growth stages [21]. Appropriately, the length of hanging roots (2 cm) significantly increased the fresh weight of shoot and root as well as vitamin C content in lettuce (Lactuca sativa var. ramosa.) [22]. When evaluating the nutrient-solution depths in each recirculation interval, the highest plant height of coriander (Coriandrum sativum) and the effectiveness of water use were observed at 2 cm depth [23]. Hence, it is necessary to examine the effect of nutrient-solution depths on crop growth and quality to obtain the greatest yield and nutrition with the lowest cost. Previous studies on nutrient-solution management focused on how EC, pH, flow rate [24], and nutrient solution composition affected plant growth, but the effect of nutrient-solution depths on kale growth and quality has not yet been described in detail.
Kale (Brassica oleracea var. sabellica.), a leafy vegetable that belongs to the Brassicaceae family, is very popular with consumers around the world for its high nutritional value and low calories [25]. As a great micronutrient source, kale provides significant levels of vitamins (such as folate, vitamin A, C, and K) and mineral elements (including calcium, magnesium, potassium, iron, and zinc) to prevent the human body from hidden hunger. Diets rich in health-promoting phytochemicals such as glucosinolates and flavonoids found in kale leaves have the potential to reduce the risk of cancer and cardiovascular and other diseases [26,27]. The yield and quality of kale are closely related to cultivar type, growth stage, and environmental conditions. Due to higher total irradiance, kale grown in the field produces more at the same developmental stage than kale cultivated in a greenhouse or growth chamber, but the highest concentration of phytochemicals is found in kale grown in a growth chamber using hydroponics [28]. Compared with open fields and greenhouses, the plant factory offers optimal conditions that control crop growth and development in a closed environment by regulating environmental factors such as temperature, light, humidity, and nutrients [29]. However, improving the efficiency of resources in the plant factory and increase kale yield and nutrition still requires constant effort.
A hydroponic cultivation experiment was conducted in an artificial light plant factory to investigate the effects of different nutrient-solution depths on plant growth, root morphology, nutrient uptake, antioxidant enzyme activities of the root, and the production of health-promoting compounds in kale.

2. Materials and Methods

2.1. Plant Materials and Growth Condition

The experiment was carried out in South China Agricultural University’s artificial-light plant factory. The seeds of kale (Brassica oleracea var. sabellica. “Xianyu”) were sown in sponge cubes (polyurethane foam, 2 cm × 2 cm × 2 cm) and grown in a dark germination chamber at 25 °C with 75% relative humidity.
After 2 days, the germinated seeds with sponge blocks were placed in the DFT system with half-strength Hoagland’s nutrient solution (EC ≈ 1.5 mS·cm−1 and pH ≈ 6.5) and under white LED (300 µmol·m–2·s–1 photosynthetic photon flux density PPFD, 10 h per day). During the entire growth stage, the plant factory was maintained at an environment temperature of 19–23 °C, relative humidity of 65–75%, and a CO2 concentration of 500 µmol·mol−1.

2.2. Experimental Designs

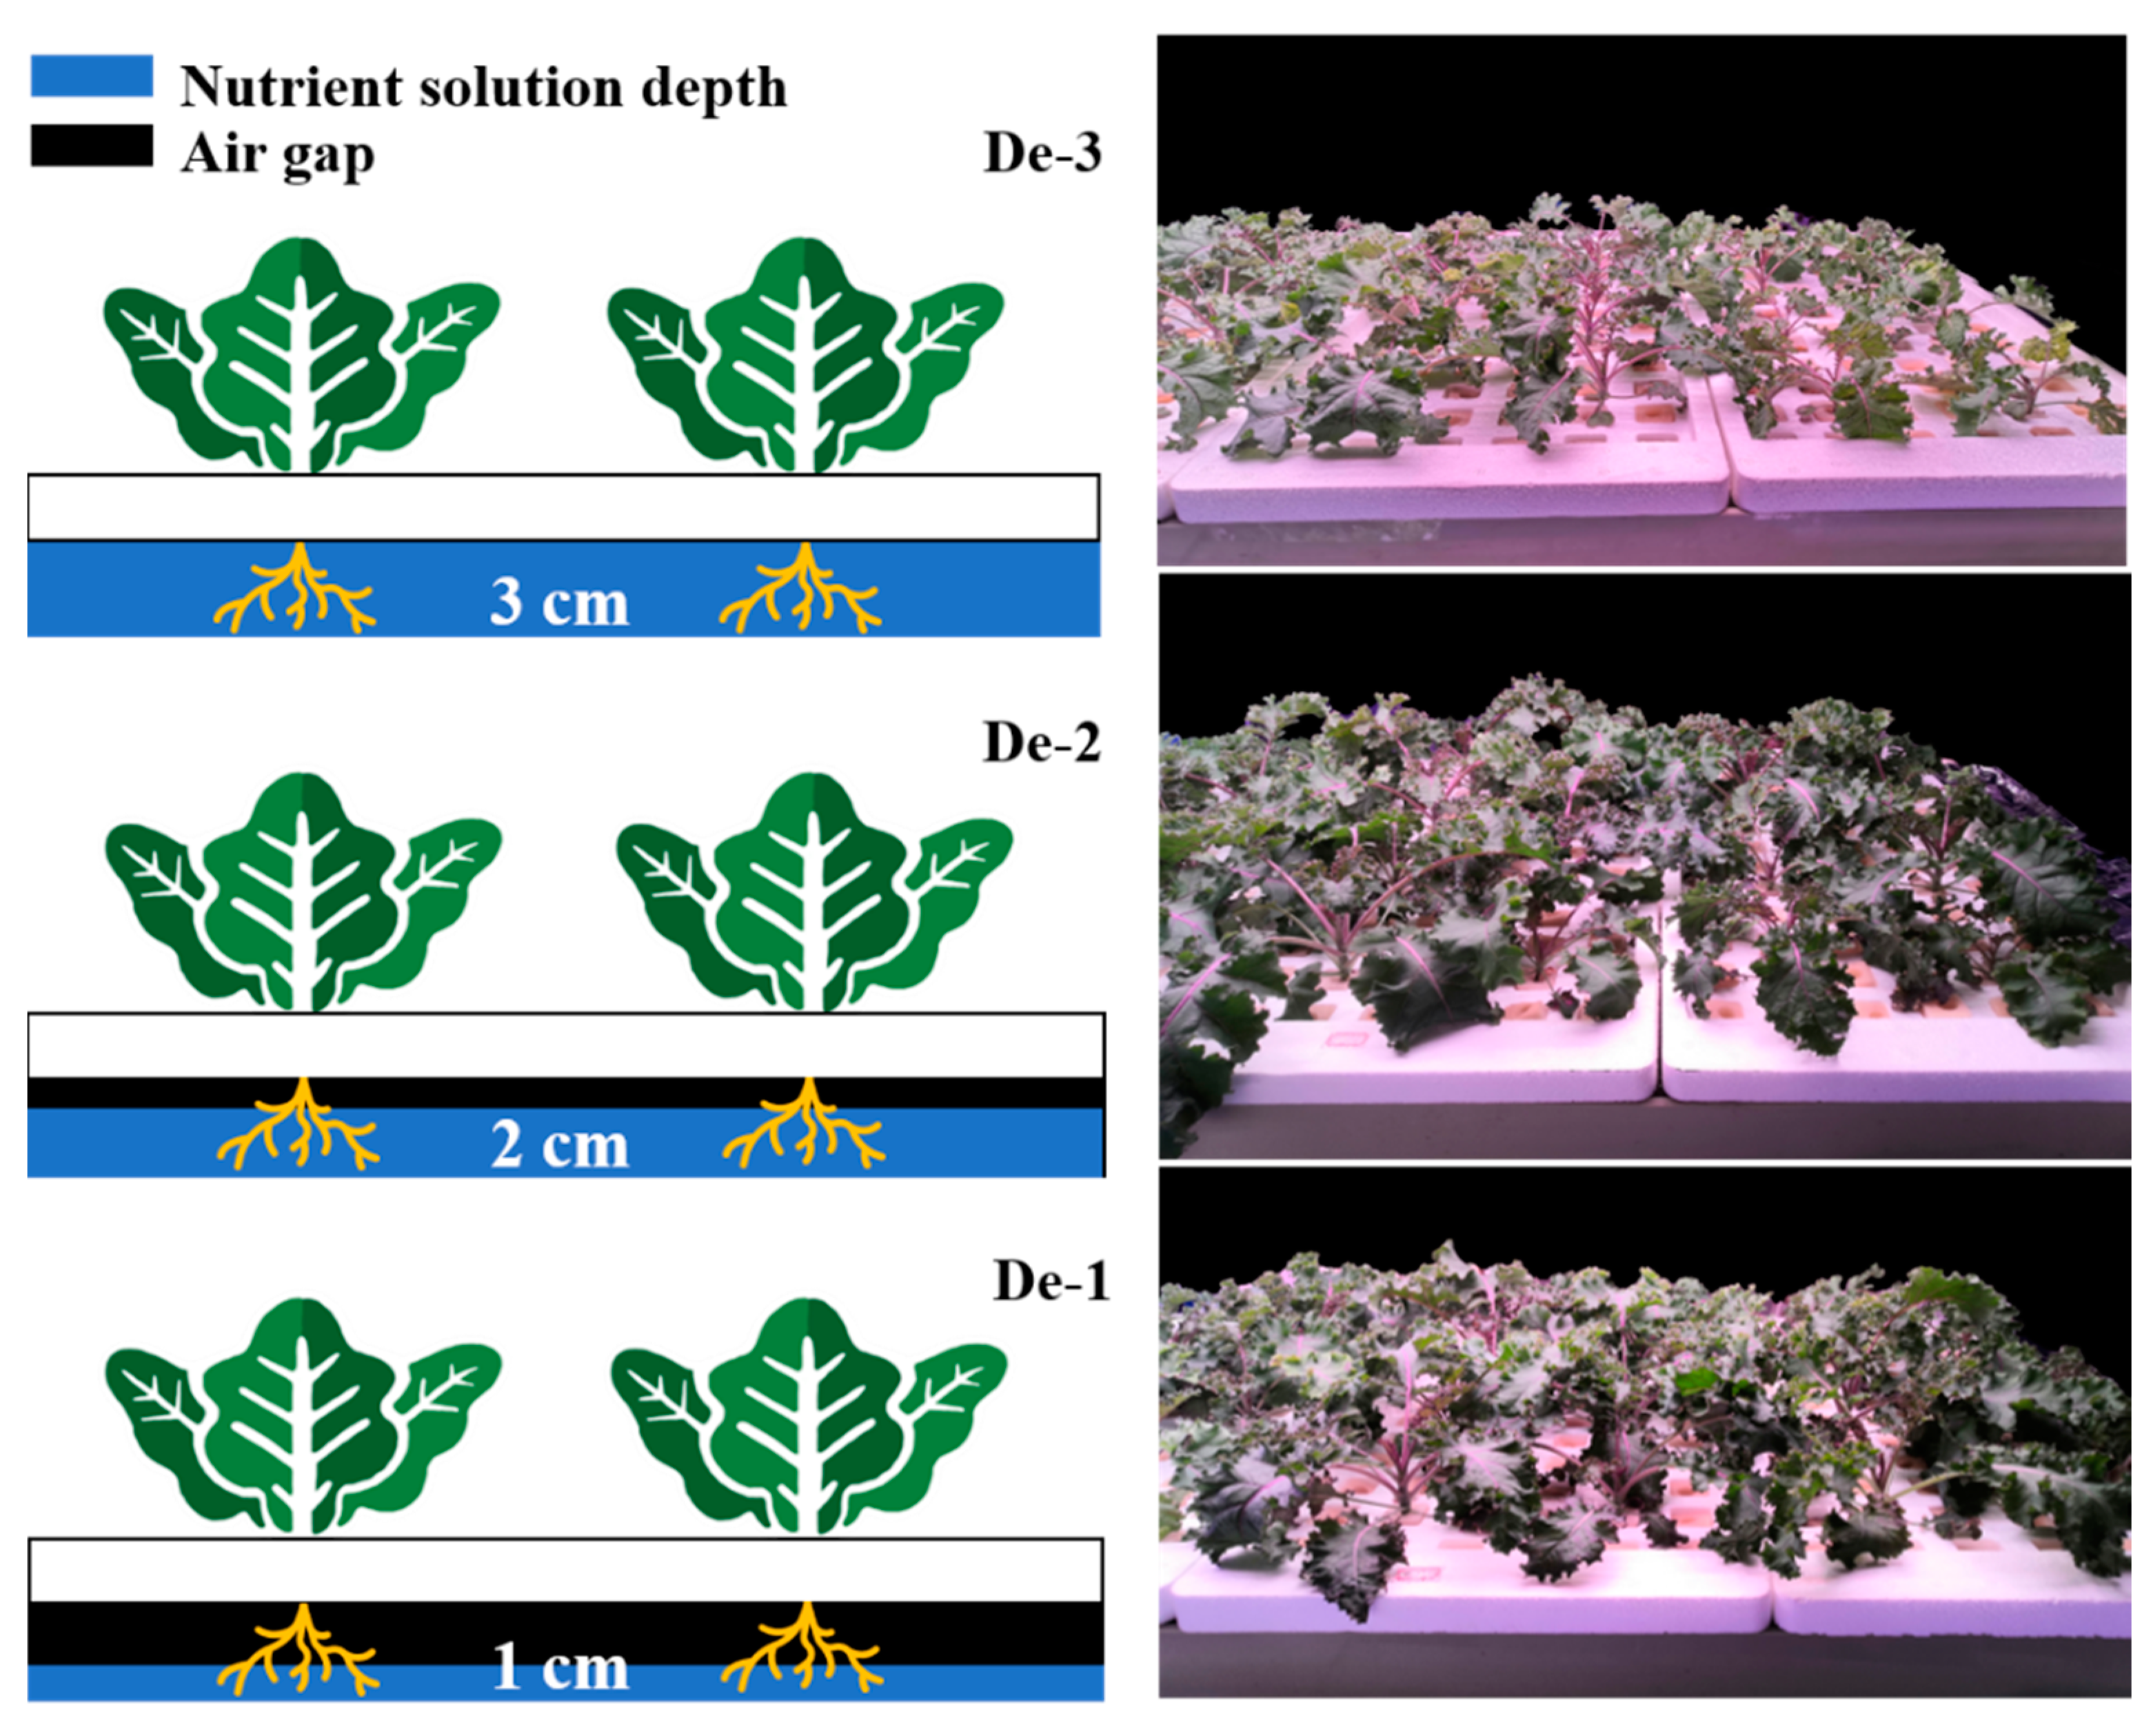
In the plant factory, three-layer cultivation shelves with twelve planting plates (30 cm × 60 cm × 4.5 cm) were installed, and each layer was outfitted with white and red LEDs (R: W = 3:2, Chenghui Equipment Co., Ltd., Guangzhou, China), with a PPFD of 250 µmol·m−2·s−1. Figure 1 shows light spectrograms obtained using a spectroradiometer (ALP-01, Asensetek, Taiwan). Each cultivation shelf consisted of a PVC trough (60 cm × 140 cm × 5.5 cm). In the experiment, depths of nutrient solution in the trough were established at 1 cm (De-1), 2 cm (De-2), and 3 cm (De-3) by an adjustable drainpipe (Figure 2). The three experimental treatments shared the same nutrient solution without aeration, and the dissolved oxygen was supplemented by the nutrient-solution circulation. The nutrient solution was circulated by a pump that operated for five minutes at 15 min intervals. After 14 days, similar seedlings with two extended true leaves were transplanted into the planting plate with 8 plants per planting plate, which represented one replicate. Four replications of 32 plants were in each treatment. During the growth phase, all kale seedlings were grown with half-strength Hoagland’s nutrient solution, with pH of 6.5–7.0 and electrical conductivity of 1.4–1.6 mS·cm−1.

2.3. Agronomy Traits Measurements

For the following measures, six kale plants from each treatment were randomly chosen at 38 days after seeding. The analytical balance was used to calculate the fresh weight of the shoot and root after using soft paper towels to remove surface moisture. Subsequently, these samples were packed in paper bags and dried at 105 °C for 3 h and then set to 75 °C until constant mass to measure dry weight. A ruler was used to measure the height of each plant from the surface of the sponge cube to the tip of the shoot, and a digital caliper was used to measure the diameter of each plant’s stem at its widest point. Using ImageJ 1.42 software (National Institutes of Health, Bethesda, MD, USA), it was feasible to determine the maximum root length and the total leaf area per plant.
The root architecture of kale was scanned by a root scanner (Seiko Epson Corp., Nagano, Japan). Total root length, root surface area, and root diameter of kale were analyzed using WinRHIZO software (Version 2016a, Regent Instruments Inc., Quebec, Canada).

2.4. Phytochemical Determinations

2.4.1. Chlorophyll (Chl) and Carotenoid Contents

The photosynthetic pigment content in mature kale leaves (0.2 g) was extracted with an 8 mL acetone–alcohol mixture (1:1, v:v) in darkness [30]. After 24 h, the absorbance of the supernatant was read at 440, 645, and 663 nm using a UV spectrophotometer (Shimadzu UV-16A, Shimadzu Corporation, Kyoto, Japan). The contents of chlorophyll a (Chl a), chlorophyll b (Chl b), chlorophyll (a + b) (Chl (a + b)), and carotenoid were quantified as follows:
Chl a (mg·g−1 FW) = (12.70 × OD663 − 2.69 × OD645) × V/1000 W
Chl b (mg·g−1 FW) = (22.88 × OD645 − 4.67 × OD663) × V/1000 W
Chl (a + b) (mg·g−1 FW) = (8.02 × OD663 + 20.20 × OD645) × V/1000 W
Car (mg·g−1 FW) = (4.70 × OD440 − 2.17 × OD663 − 5.45 × OD645) × V/1000 W
where V is the volume of extract solution (mL), and W is the fresh weight (g) of the sample.

2.4.2. Antioxidant Activity Measurements

The 2, 2-diphenyl-1-picrylhydrazyl (DPPH) radical scavenging rate assay was measured according to the method decried by Tadolini [31]. Frozen shoot samples (0.5 g) were extracted with 8 mL ethanol in the dark at 4 °C for 30 min, then centrifuged at 986× g for 15 min. The supernatant was used to make three types of mixture (Ai: supernatant of 2 mL with 2 mL 0.2 μM DPPH solution; Aj: supernatant of 2 mL with 2 mL ethanol; Ac: 2 mL 0.2 μM DPPH solution with 2 mL ethanol). The absorbance of the mixture was measured at 517 nm by UV spectrophotometer. The DPPH radical inhibition percentage was calculated as follows:
DPPH (%) = [1 − (Ai − Aj)/Ac] × 100%
The ferric ion-reducing antioxidant power (FRAP) was determined following Benzie and Strain [32]. The first extraction step was identical to DPPH. The sample supernatant (0.4 mL) was mixed with 3.6 mL solution containing 300 mM acetate buffer; 10 mM 2, 4, 6-tripyridyl-S-triazine (TPTZ) in 40 mM HCl; and 20 mM FeCl3 at a 10:1:1 ratio (v:v:v) for 10 min at 37 °C. The absorbance was read at 593 nm by spectrophotometer.

2.4.3. Antioxidant Components Measurements

Measuring the polyphenol content of kale was based on the Folin–Ciocalteu assay. [33]. The 0.5 mL foline-phenol and 1.5 mL 26.7% Na2CO3 were combined with 1 mL sample supernatant (the extraction method of polyphenol was the same as that of DPPH), then 7 mL distilled water was added into the reaction solution. The absorbance was read at 510 nm by UV spectrophotometer after 2 h.
The total flavonoid content in kale was determined by the method of Li [34]. The 1 mL extract solution (extracted as DPPH) was added to 0.7 mL 5% NaNO2. After 5 min, the mixed solution was combined with 0.7 mL 10% Al(NO3)3; 6 min later, the mixture was added to 5 mL 5% NaOH; and 10 min later, absorbance at 760 nm was measured using a UV spectrophotometer.

2.4.4. ROS, OXO, POD, H2O2, and Proline Assays

The activity of oxalate oxidase and peroxidase and the reactive oxygen species (ROS) content in the root was determined using an assay kit (Enzyme-linked Biotechnology Co., Ltd., Shanghai, China) in a 96-well clear plate. Powdered samples (50 mg) were mixed with 450 μL 10 mM phosphate buffer solution (pH = 7.2–7.4) and centrifuged at 1753× g for 20 min. The supernatant was collected. To 10 μL of the sample extract, 40 μL sample diluent and 100 μL HRP-conjugate reagent were added and incubated at 37 °C for 1 h. Then, each well was aspirated, filled with wash solution (400 μL), and washed five times. Then, 50 μL chromogen solution A and 50 μL chromogen solution B were dripped into each well and gently mixed. After 15 min incubation at 37 °C in dark, the stop solution (50 μL) was added to each well and measured at 450 nm using a microtiter plate reader (Multiskan FC, ThermoFisher Scientific Inc., Waltham, MA, USA) within 15 min.
The H2O2 content in kale root was determined using an H2O2 assay kit (Enzyme-linked Biotechnology Co., Ltd., Shanghai, China) in a 96-well clear plate. First, 0.1 g of freshly prepared sample powder was combined with 1 mL of acetone before being centrifuged at 8000× g for 10 min. The 250 μL supernatant was combined with 25 μL solution 2 and 50 μL solution 3. Then, the mixture was then centrifuged for 10 min at 4000× g while retaining precipitation. Adding solution 4 to the precipitation, the absorbance was taken at 415 nm using a microtiter plate reader after 5 min.

2.4.5. Proline Assays

Measuring the proline content in kale root was based on the method of Bates [35]. Frozen sample powder (0.5 g) from kale root was added into 5 mL 3% sulfosalicylic acid (w/v) and boiled for 20 min. The combined solution was centrifuged at a speed of 3944× g for 10 min after cooling to room temperature. The 0.5 mL supernatant was combined with 2 mL acetic acid and 2 mL 2.5% ninhydrin (w/v) in acetic acid and 6 M phosphoric acid at a 3:2 ratio (v/v). After 30 min of boiling, the mixture was allowed to cool at room temperature. The methylbenzene was added to the solution and put aside for 2 h in dark. The absorbance was recorded at 520 nm using a UV spectrophotometer.

2.4.6. Nutritional Compound Measurements

Soluble sugar content was determined using the sulfuric acid anthrone method [36]. First, 0.5 g fresh sample powder was added to 5 mL 80% ethanol and incubated in a water bath at 80 °C for 40 min. Another 5 mL 80% ethanol was added and kept in 80 °C water bath for another 40 min. After adding 10 mg of activated carbon powder, the solution was filtered using a funnel with double filter papers. The collected filtered solution was diluted with 80% ethanol to a total volume of 10 mL. Later, the diluent solution (0.2 mL), deionized water (0.8 mL), and sulfuric acid anthrone reagent (5 mL) were mixed and boiled for 10 min. After cooling to ambient temperature, the solution was read at 625 nm by a UV spectrophotometer.
Determination of soluble protein content was performed by Coomassie brilliant blue G-250 staining [37]. Fresh sample powder (0.5 g) was homogenized with 8 mL distilled water and then centrifuged at 986× g for 10 min at 4 °C. The 0.2 mL extract solution was combined with 0.8 mL distilled water and 5 mL Coomassie brilliant blue G-250 solution. After the reaction of 5 min, the absorbance was taken at 595 nm using a UV spectrophotometer.
The vitamin C content was determined by molybdenum blue spectrophotometry [38]. Fresh kale sample (0.5 g) was soaked in 25 mL oxalic acid EDTA solution (200 mM EDTA and 50 mM oxalic acid). After filtering, 10 mL supernatant was mixed with 1 mL 3% HPO3 solution (w/v), 2 mL 5% H2SO4 (v/v), and 4 mL 5% H8MoN2O4 (v/v). After 15 min, the absorbance was measured at 705 nm by the UV spectrophotometer.
Nitrate content was determined as the method described by Cataldo [39]. Fresh kale sample powder (0.5 g) was homogenized with distilled water (10 mL) and water bath at 100 °C for 30 min. After filtering, 0.1 mL extracted solution was added to 0.4 mL 5% salicylic and sulfuric acid and 9.5 mL 8% NaOH. The absorbance was detected at a wavelength of 410 nm by UV spectrophotometer.

2.5. Glucosinolates Measurements

Measurement of glucosinolates content in kale was conducted by the described by Grosser and Van Dam [40], with modifications. First, 0.2 g of freeze-dried samples were extracted for 20 min in an 80 °C water bath with 4 mL 70% methanol. To the mixture was then added 2 mL 0.4 M barium acetate, and it was centrifuged at 1753× g for 10 min. The aforementioned extraction procedures were repeated once. The supernatants were then mixed and placed onto a mini-column containing 500 μL DEAE-Sephadex A-25 that had been conditioned with 0.02 M acetic acid and washed with 6 M imidazole formate. After incubating overnight with 100 µL 0.1% arylsulphatase (Sigma, St. Louis, MO, USA), desulphoglucosinolates were eluted with 2 mL distilled water. The total eluate was filtered through a membrane filter of 0.22 µm. The HPLC analysis was carried out using the Waters e2695 liquid chromatograph (Waters Crop., Milford, MA, USA) with a reversed-phase C18 column (5µm, 250 mm × 4.6 mm; Waters SunFire C18, Waters, Milford, MA, USA). The column’s temperature was maintained at 30 °C and 20 µL injection volume. A binary gradient was used: 0–32 min 0–20% eluent A; 32–38 min 20% A; 39–40 min 20–100% A; the eluents were (A) acetonitrile and (B) ultra-pure water, with a flow rate of 1 mL·min−1. The detection wavelength was recorded at 229 nm. The retention durations and spectrum data of the different glucosinolate compounds were compared to standards to determine the contents of each glucosinolate.

2.6. Minerals Measurements

The measurement of the minerals was carried out in accordance with Waterland [41]. Oven-dried samples (0.5 g) were digested in 4 mL 70% HNO3 (v:v). Four hours later, the extract was filtered and mixed with deionized distilled water to a total volume of 20 mL. Mineral concentrations were determined by inductively coupled plasma spectrometry (Optima 2100DV; Perkin Elmer Corp., Waltham, MA, USA).

2.7. Statistical Analysis

Except where otherwise noted, all data were presented as means ± standard errors (SE) of three replications, and one-way analysis of variance (ANOVA) was performed using Duncan’s test at p < 0.05 by SPSS 26.0 software (SPSS Inc., Chicago, IL, USA). Origin 2021 software (Origin Lab, Northampton, MA, USA) was used to create all histograms. With the help of the program Origin 2021, a multivariate principal component analysis (PCA) was carried out. The TBtools software’s heatmap feature was employed to analyze the aggregate data [42].

3. Results

3.1. Effect of Nutrient-Solution Depth on Kale Plant Biomass and Root Morphological Properties

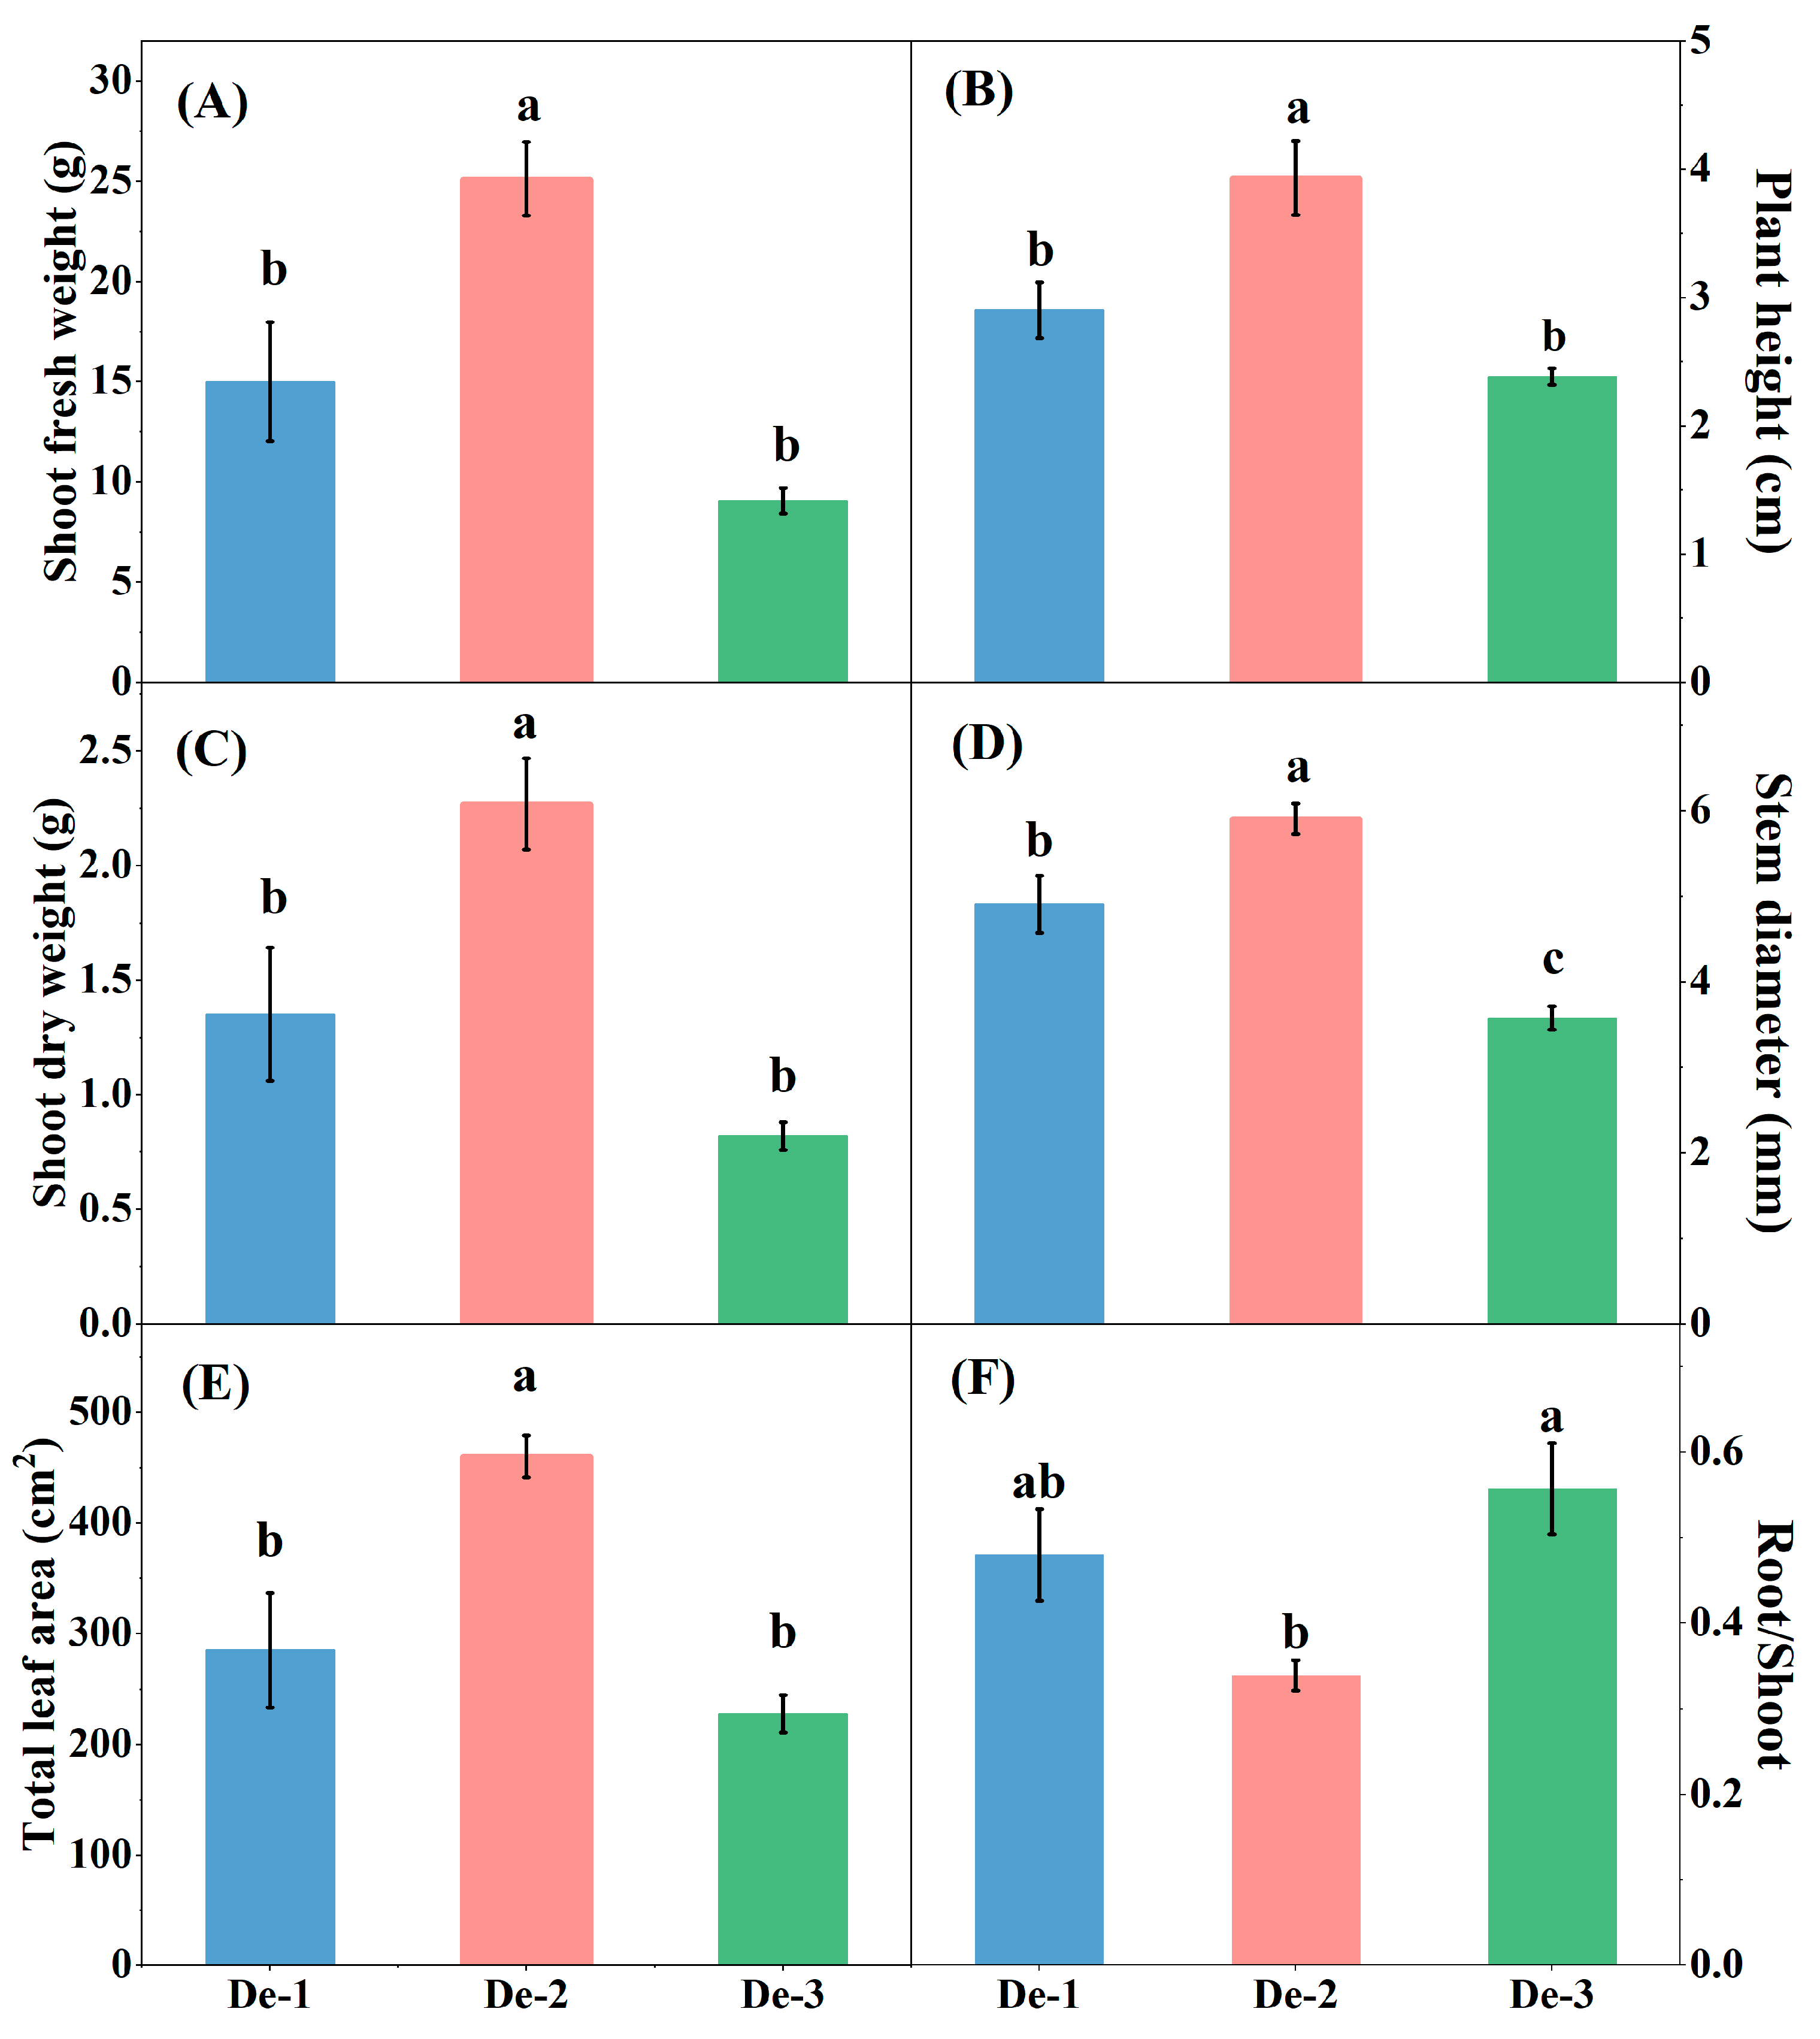
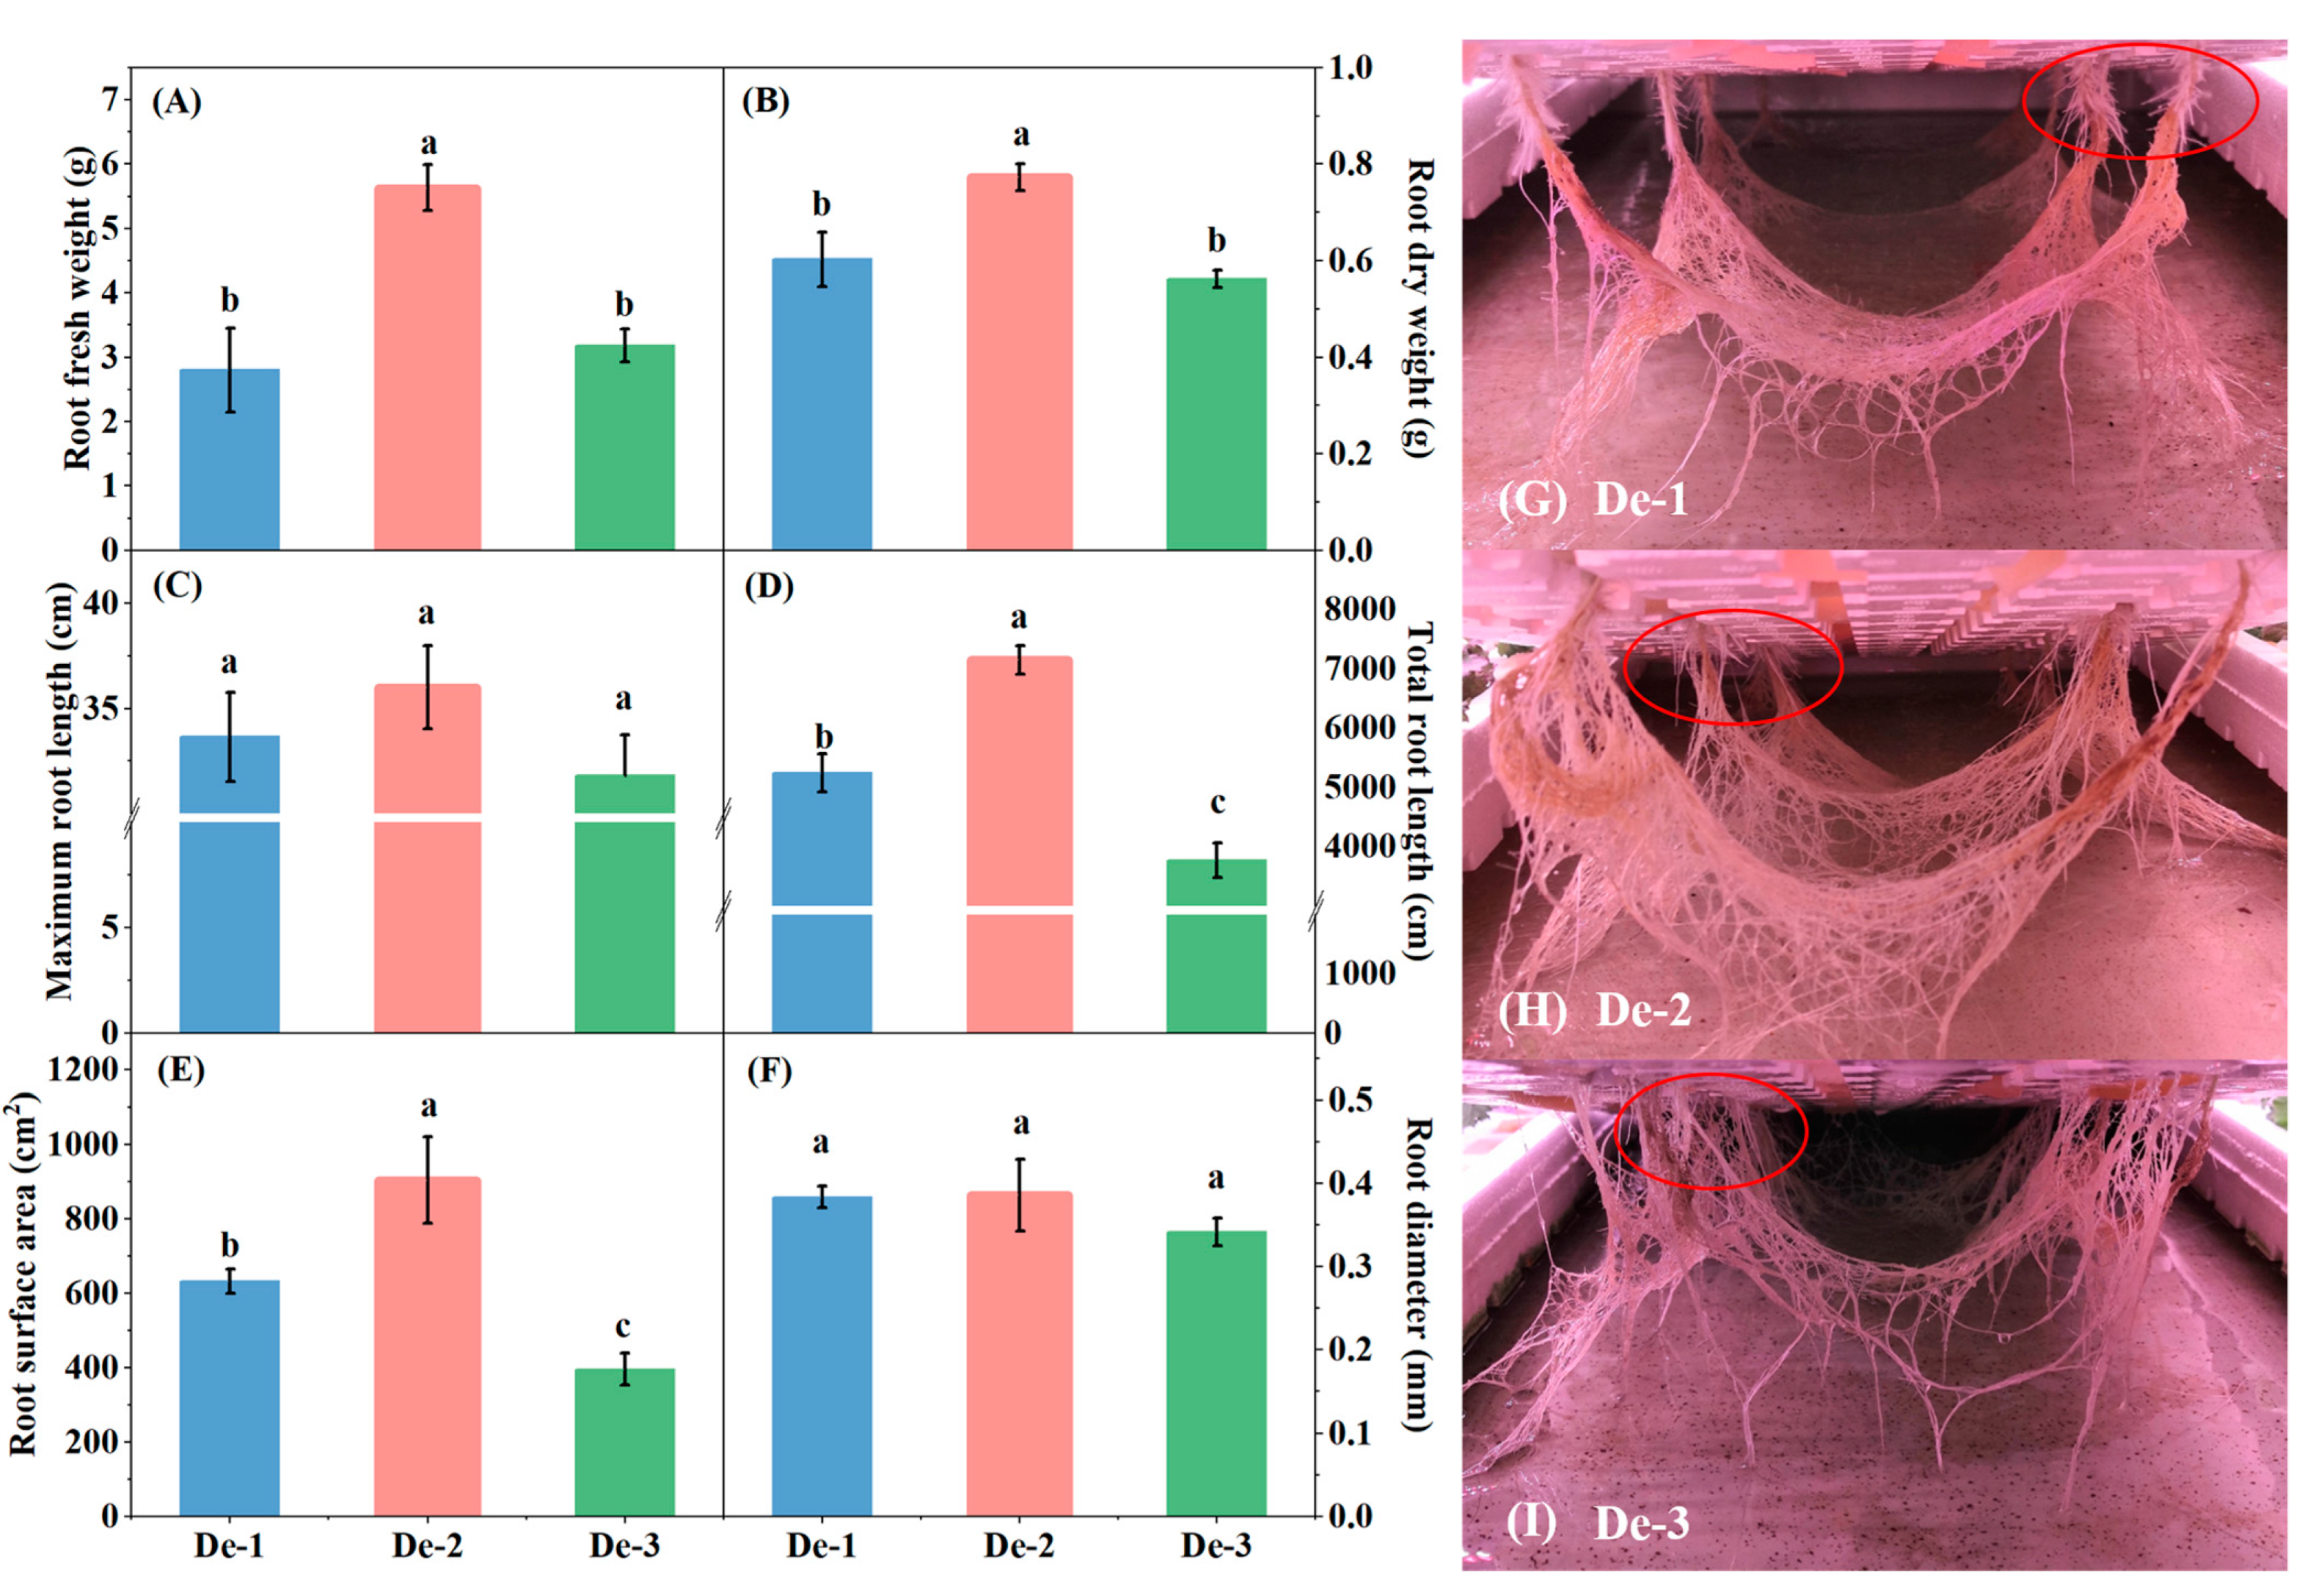
The nutrient-solution depths had a substantial impact on the kale’s growth and biomass (Figure 3). In comparison to other treatments, the plants under De-2 showed better fresh and dry weight, shoot elongation, and total leaf area. The plant height and total leaf area of kale were highly promoted by 35% and 61% when the solution depth increased from 1 cm to 2 cm, while they decreased by 65% and 51% when the solution depth increased from 2 cm to 3 cm (Figure 3B,E). Moreover, the stem diameter of kale under De-1 (37%) and De-2 (65%) was significantly higher than De-3 treatment (Figure 3D). When compared to the De-3 treatment, the fresh weight and dry weight of the shoot were unaffected under De-1 treatment but considerably increased by 177% and 176% with De-2 treatment. (Figure 3A,C). Similarly, there was no striking difference in the root fresh weight and dry weight under De-1, which significantly increased by 76% and 37% under De-2 (Figure 4A,B). Consequently, compared to De-3, the De-2 treatment considerably reduced the root-shoot ratio of kale, while De-1 had a negligible impact. (Figure 3F).
The root development of kale was significantly affected by different solution depth (Figure 4). Compared with De-3 treatment, total root length of kale under De-1 and De-2 was increased by 38% and 89%, respectively (Figure 4D). The highest root surface area was observed in De-2, with an increase of 128%, and De-1 resulted in an increase of 59% (Figure 4E). However, no obvious difference was observed in root diameter and maximum root length of kale among three treatments (Figure 4C,F). All treatments had tangled root mats, while De-1 and De-2 root mats were twined tighter than De-3. Furthermore, there were more lateral roots and root hair near the planting plate in De-1 and De-2 treatment than in De-3. (Figure 4G–I).

3.2. Effect of Nutrient-Solution Depth on the Photosynthetic Pigment Contents of Kale

Different nutrient-solution depths markedly influenced the pigment contents and pigment ratio of kale (Table 1). In comparison with De-3, the Chl a, Chl b, and Chl (a + b) contents under De-1 significantly rose by 4%, 18%, and 9%, respectively. In De-2 treatment, the contents of Chl a, Chl b, and Chl (a + b) were 4%, 14%, and 8% higher than those in De-3, respectively. As a result, the Chl a/Chl b ratios considerably rose along with the depth of the nutrient solution. However, the carotenoid content was significantly reduced in De-1 (14%) and De-2 (13%).

3.3. Effect of Nutrient-Solution Depth on Phytochemicals Contents of Kale

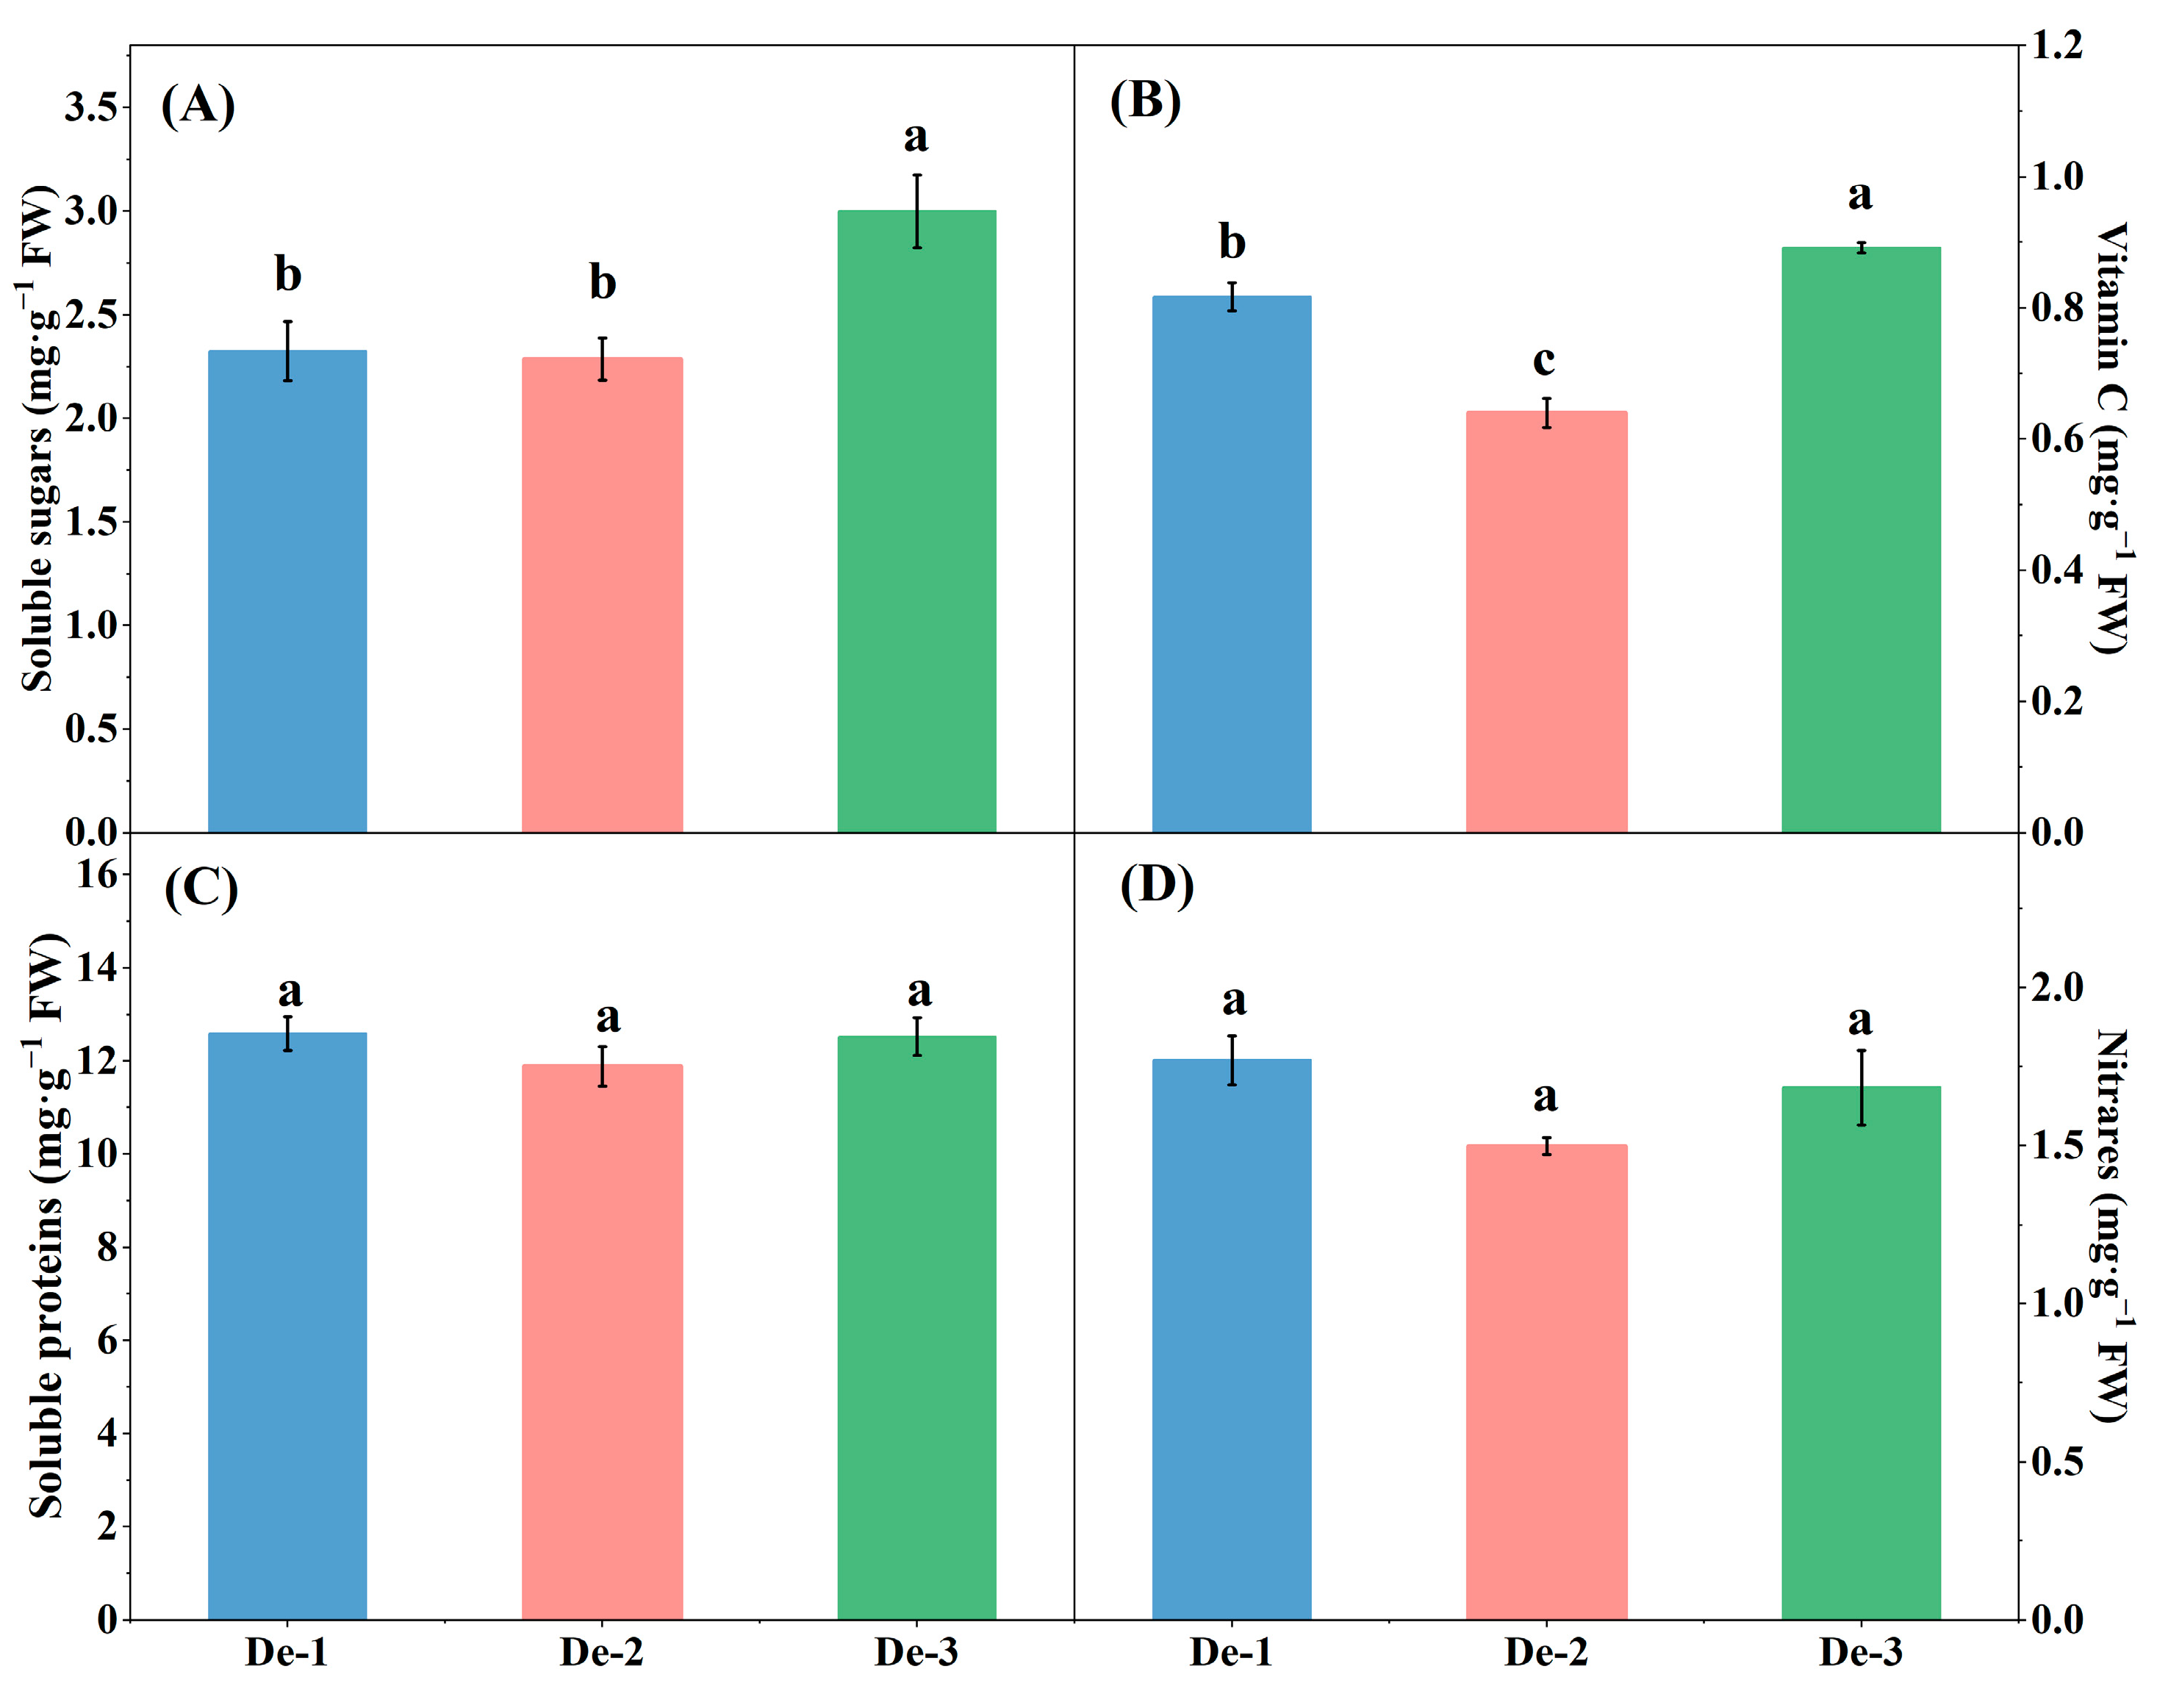
The kale in De-3 treatment possessed better nutritional qualities. Compared to De-3, the contents of soluble sugars were prominently reduced by 23% and 24% under De-1 and De-2, respectively (Figure 5A). The vitamin C content of kale was slightly reduced by 9% under De-1 and markedly reduced by 29% under De-2 (Figure 5B). However, there were no significant variations in the content of nitrate and soluble protein in kale among treatments (Figure 5C,D).
There was no discernible difference between any of the treatments in terms of antioxidant activities such as DPPH and FRAP or antioxidant compound levels such as total polyphenols and flavonoids in kale (Figure S1).

3.4. Effect of Nutrient-Solution Depths on Glucosinolate Composition and Content of Kale

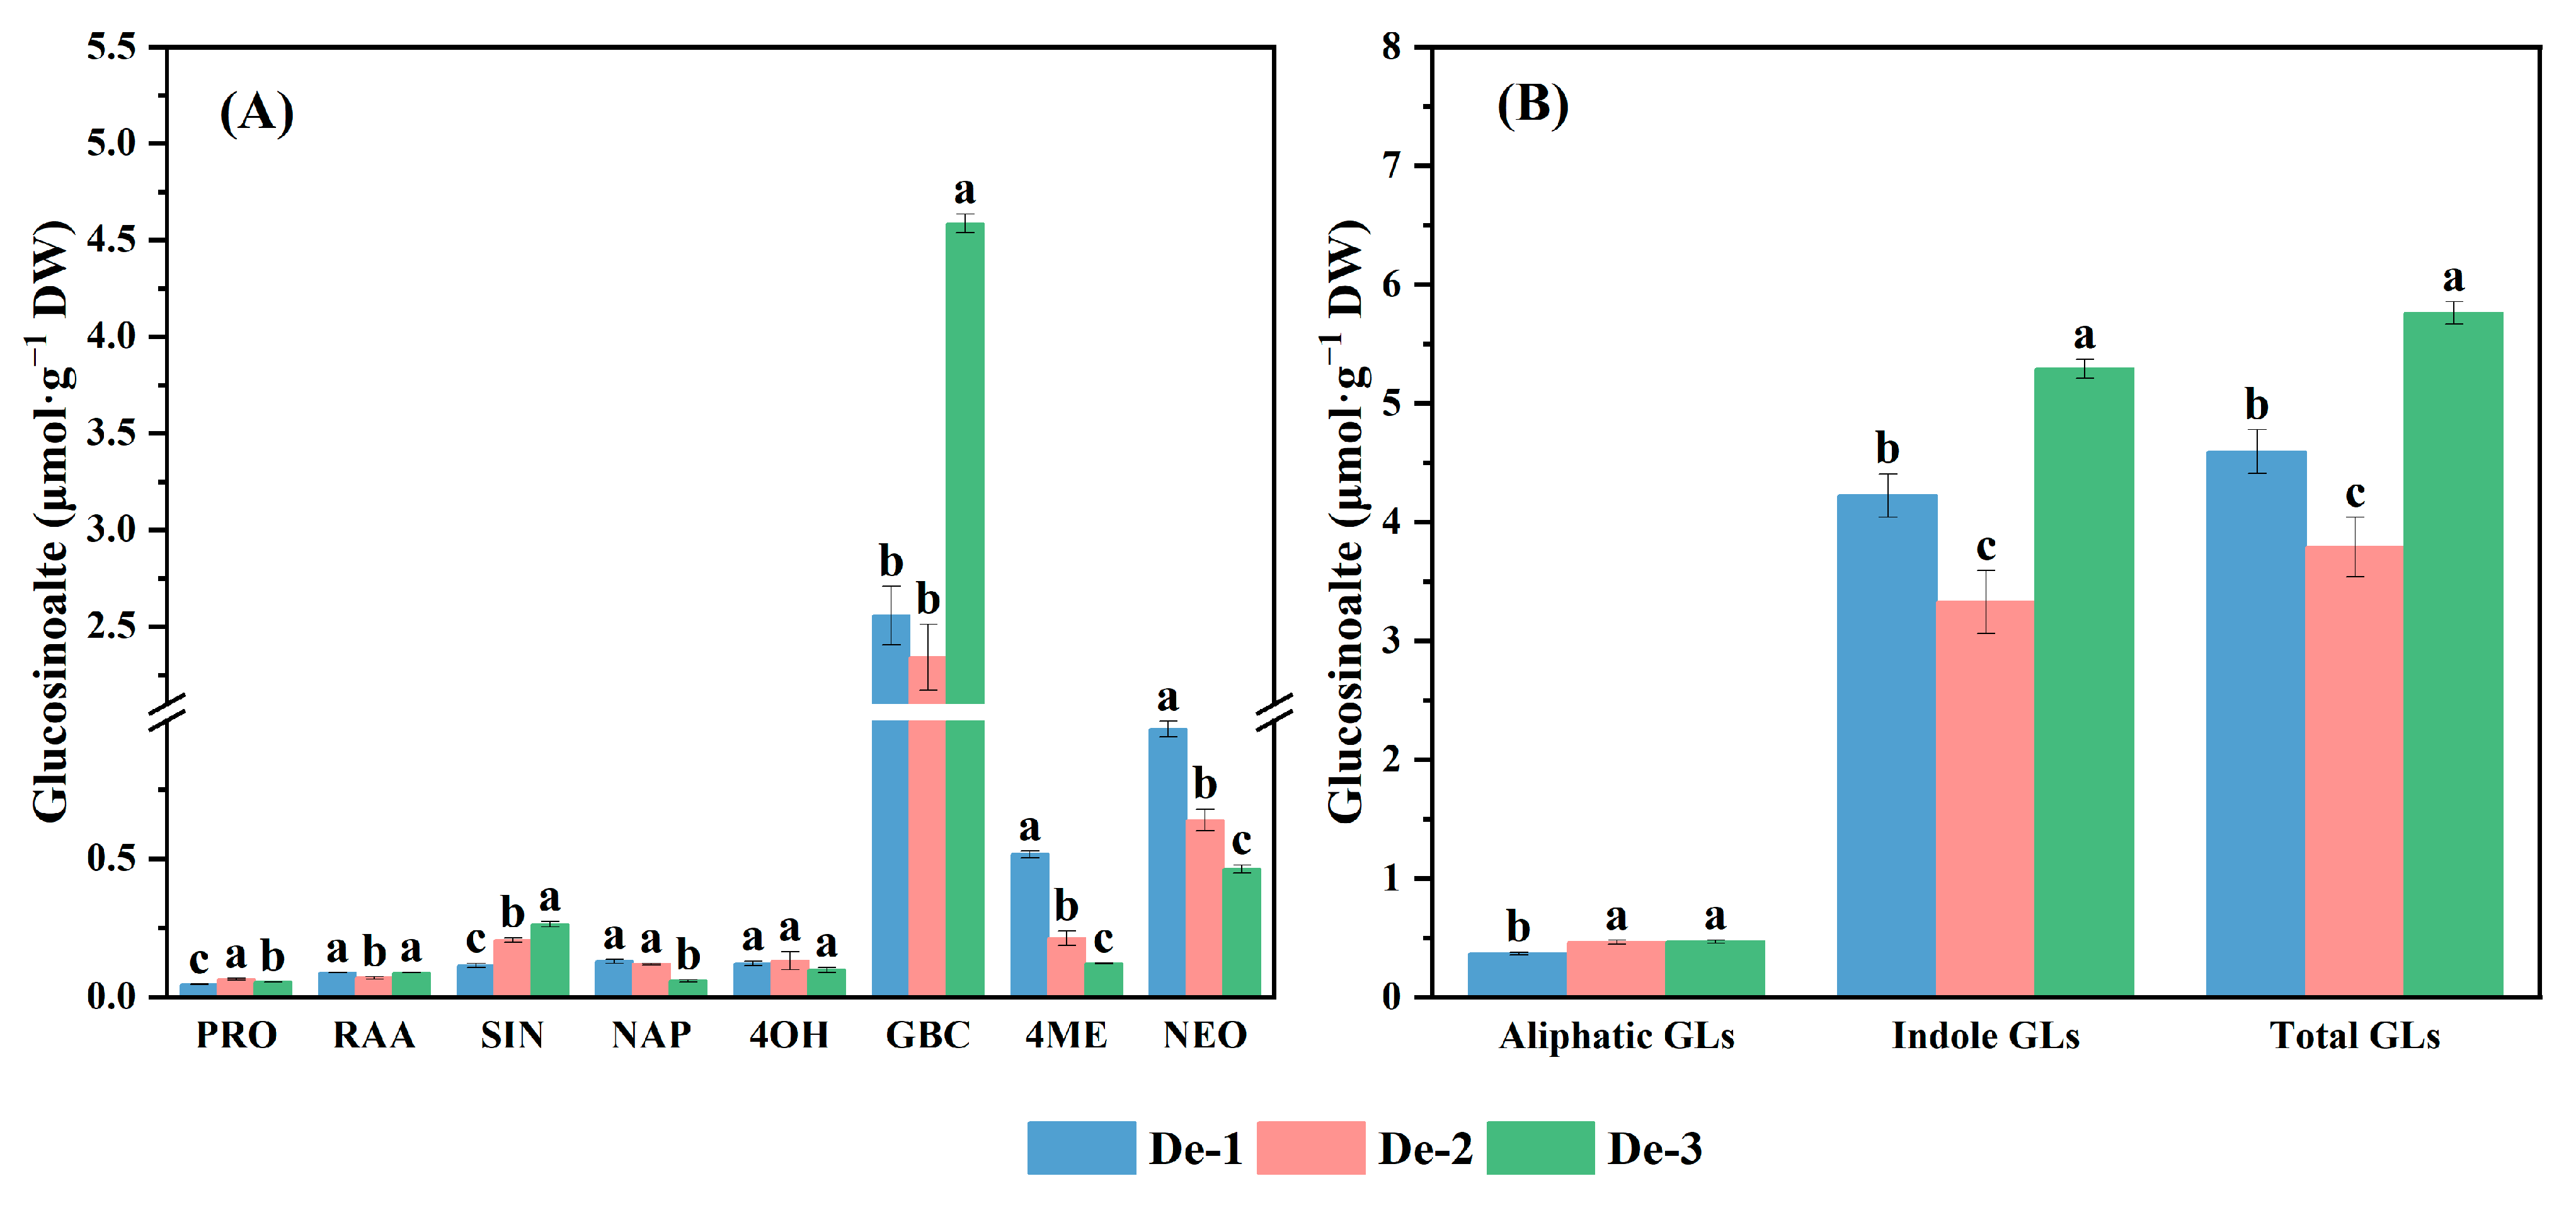
In kale, eight individual glucosinolates (GLs) were discovered by HPLC (Figure 6A), including four aliphatic GLs (progoitrin (PRO), glucoraphanin (RAA), sinigrin (SIN), and gluconapin (NAP)) and four indole GLs (4-hydroxy-glucobrassicin (4OH), glucobrassicin (GBC), 4-methoxyglucobrassicin (4ME), and neoglucobrassicin (NEO)). Aliphatic GLs and indole GLs comprised approximately 9.1% and 90.9% of the total GLs, respectively (Figure 6B). Among them, the great majority of GLs were GBC, accounting for around 66% of total GLs. Compared with De-3, the total GLs contents under De-1 and De-2 were markedly lower by 21% and 35%, respectively, and the content of aliphatic GLs more significantly decreased by 22% under De-1 than De-3, while those under De-2 exhibited no striking change. The SIN contents gradually increased with increasing solution depth, while the NAP content decreased with solution depth.
In comparison with De-1, the content of SIN under De-2 and De-3 remarkably increased by 80% and 129%, respectively, but the NAP content under De-3 was significantly decreased by 55%. The PRO contents exhibited a significant increase of 16%, while RAA content decreased by 22% under De-2. The lowest PRO content was found in De-1, which was 15% lower than De-3. However, no discernible variation in RAA was seen between De-1 and De-3.
The highest content of total indole GLs in De-3 treatment was mainly due to the enhancement of GBC accumulation, whereas there was no significant difference in 4OH content across all treatments. The 4ME and NEO contents significantly increased by 323% and 109%, respectively, compared to De-3, while the contents of GBC significantly fell by 45% under De-1. Similarly, contents of 4ME and NEO were 74% and 38% higher, respectively, but GBC was 49% lower under De-2.
Therefore, different nutrient-solution depths significantly affected the GLs content in kale. The increase in total GLs contents under De-3 treatment was due to the significant increase in GBC content, which was the predominant GLs in kale. However, the lower nutrient-solution depth reduced the content of aliphatic GLs in kale, especially the SIN content.

3.5. Effect of Nutrient-Solution Depth on Mineral Elements Contents of Kale

The nutrient-solution depth significantly affected the mineral element contents in kale (Table 2). With the increase of nutrient-solution depth, except for Mg, the N, P, K, and Zn content in kale decreased gradually, while the contents of Ca and S firstly increased and then decreased. The amount of N and K in kale treated with De-2 was similar to that of De-3, with no discernible differences, while it significantly increased by 2% and 10% in De-1, respectively. Meanwhile, the highest P content was found in De-1, which was 4% higher than in De-3, and P content in De-2 was 2% higher than in De-3. Similar to P content, the Zn content under De-1 and De-2 was notably 91% and 41% higher than De-3, respectively. The highest Ca and S contents of kale were simultaneously found in De-2 treatment: those were 5% and 23% higher than in De-3, respectively, and Ca and S contents under De-1 were significantly higher than those in De-3 by 1% and 19%. Therefore, the shallow nutrient solution (1 and 2 cm) had a positive effect that increased the contents of mineral elements in kale.

3.6. Effect of Nutrient-Solution Depth on Antioxidant Enzyme Activities, Reactive Oxygen Species, Content of Hydrogen Peroxide, and Proline in Kale Root

To acquire a better understanding of the stress changes caused by nutrient-solution depth in the root, the levels of ROS, H2O2, and proline and the activity of POD and OXO were measured (Figure 7). Compared with De-3, the ROS content in kale roots significantly increased by 15% under De-2, while it was reduced by 40% in De-1 (Figure 7A). H2O2 contents in kale roots showed a significant reduction under De-1 and De-2 compared with De-3 (Figure 7B). OXO activity was dramatically reduced by 33% under De-1 compared to De-3, while De-2 showed no significant changes. (Figure 7C), and POD activity was reduced by 42% under De-2, while no obvious difference was found between De-1 and De-3 (Figure 7D). The proline content gradually increased with increased nutrient-solution depth, and there were remarkable 44% and 94% increments in De-2 and De-3 than De-1, respectively (Figure 7E).

3.7. Heatmap Analysis of Growth and Nutritional Aspects of Kale under Different Nutrient-Solution Depths

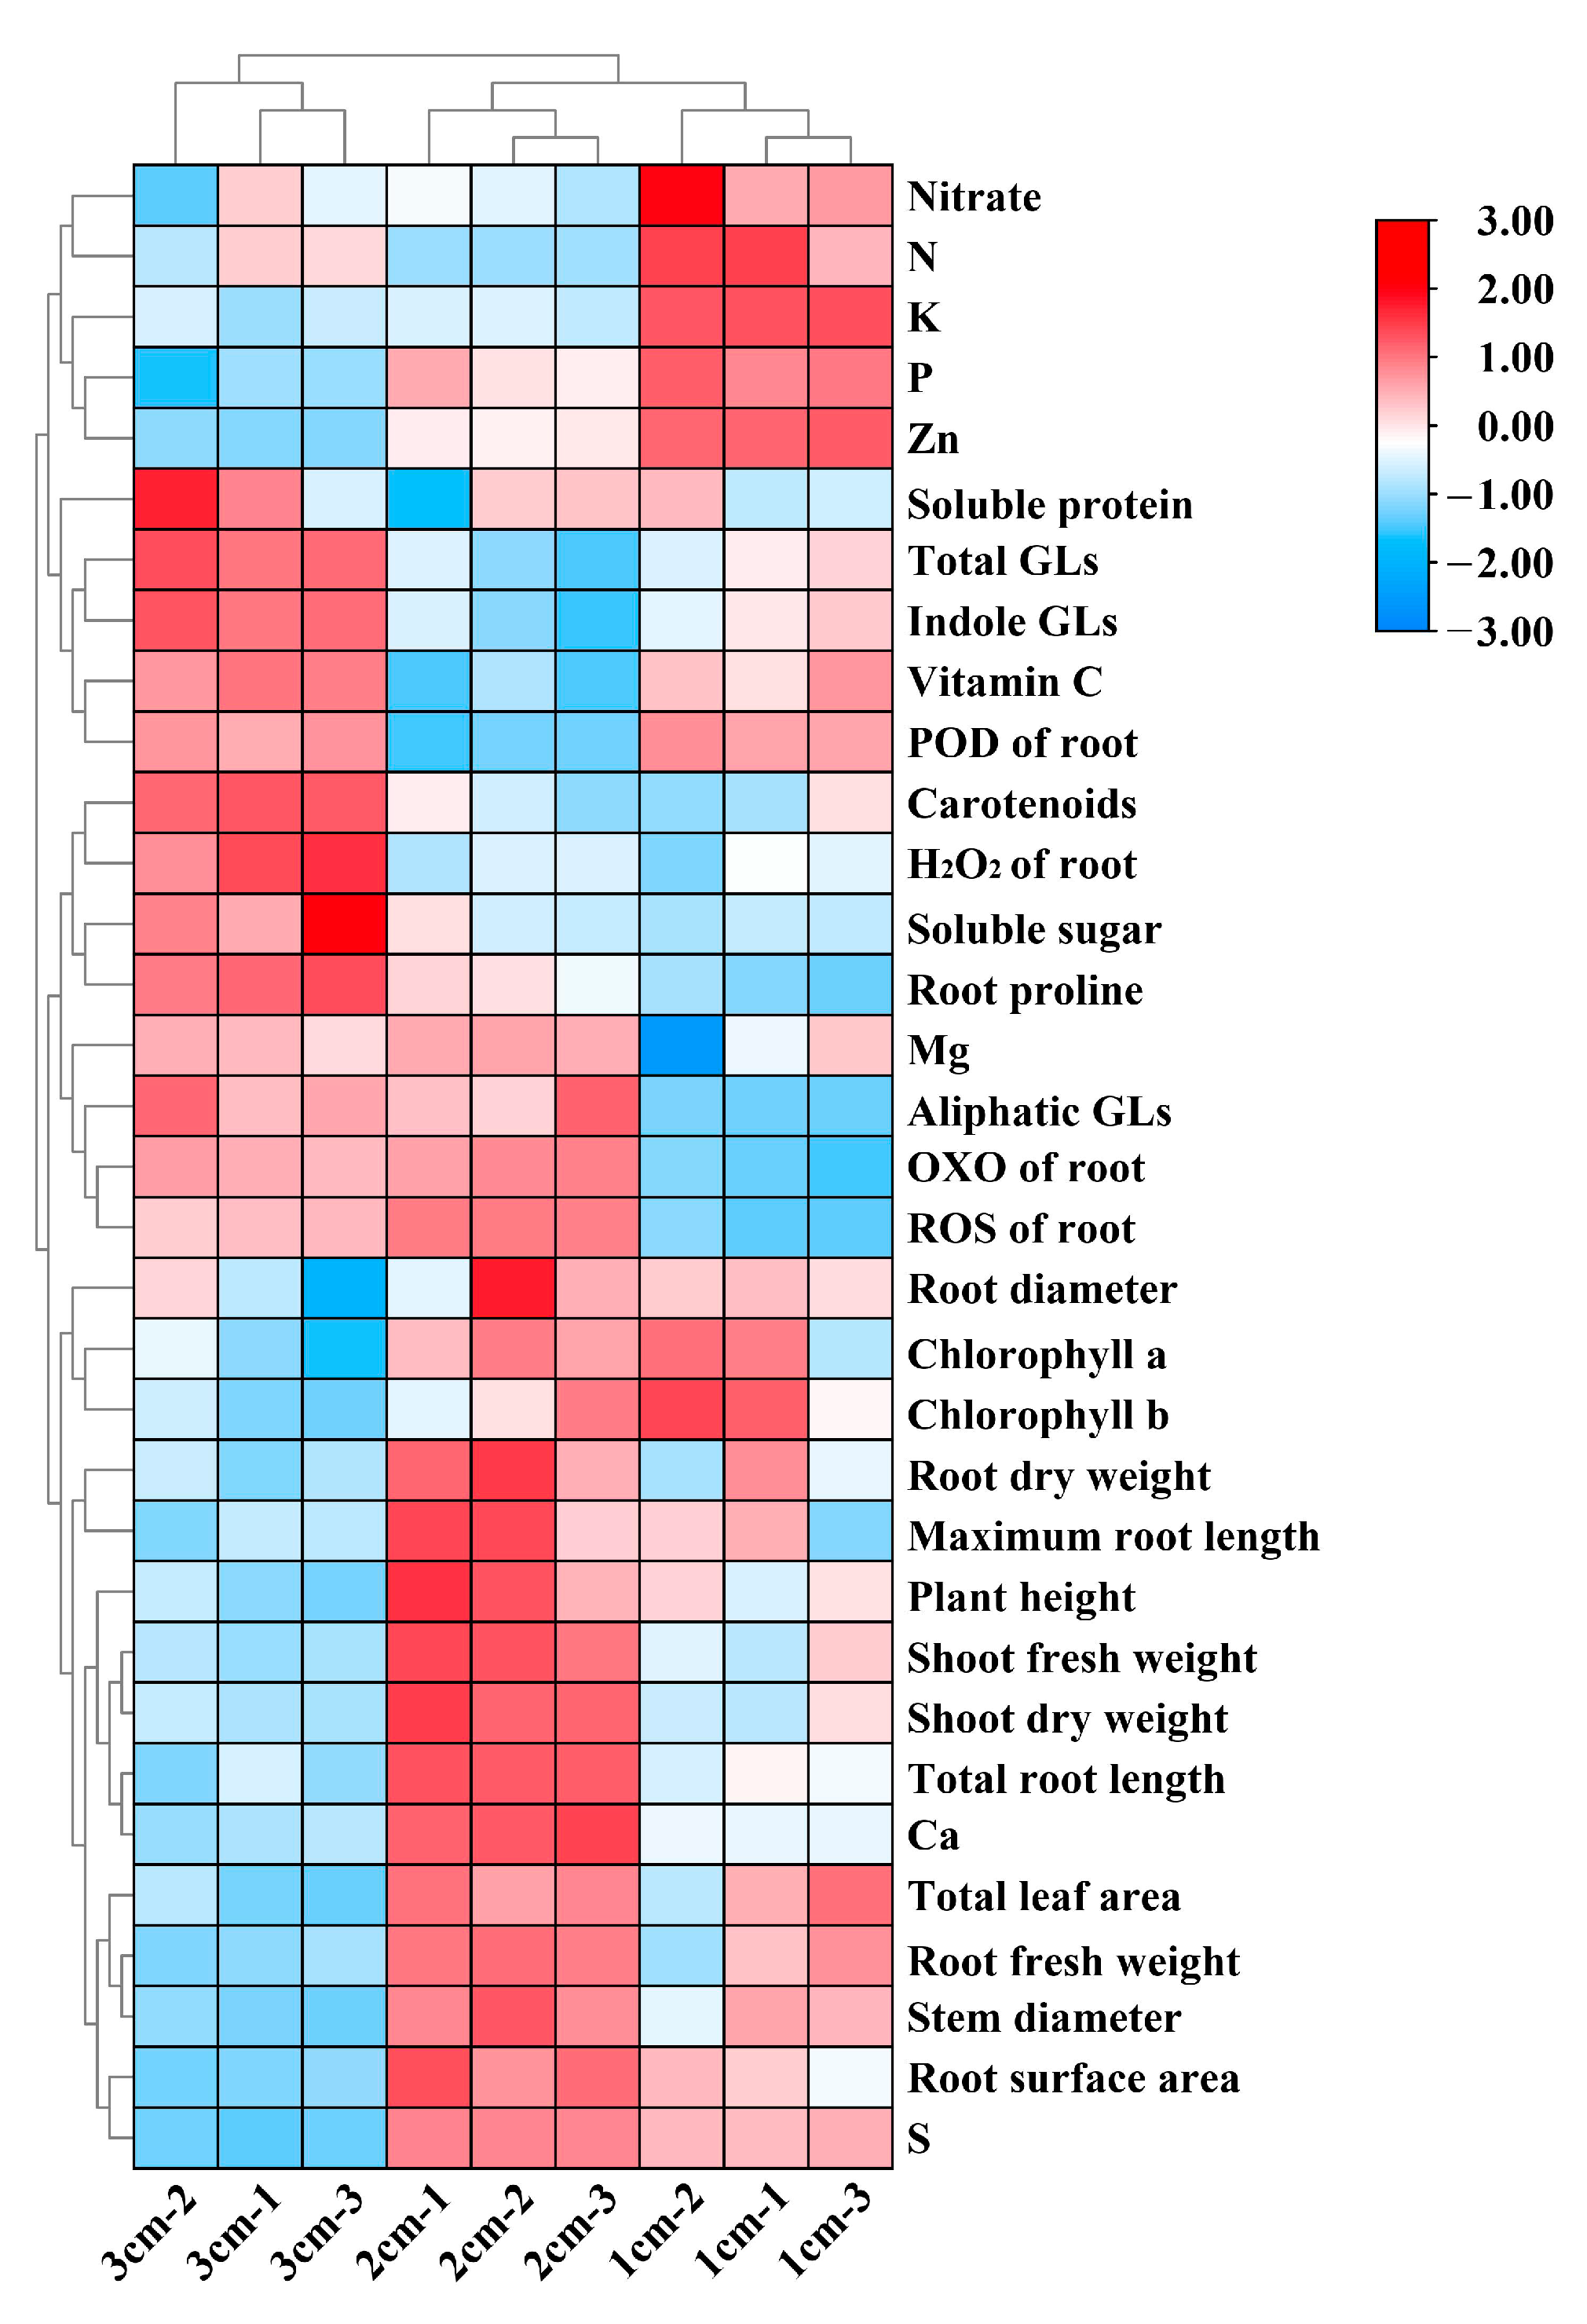
The impact of various nutrient-solution depths on the growth and quality of kale was visualized using a heat map (Figure 8). The cluster responded to various nutrient solution treatments with variable growth and quality responses. The De-1 and De-2 clusters both showed higher growth-related parameters and levels of chlorophyll a, chlorophyll b, Ca, and S, especially under De-2. Cluster De-3, nevertheless, was far away from the other two clusters. The De-3 cluster enhanced the contents of indole GLs, aliphatic GLs, total GLs, Mg, vitamin C, carotenoids, soluble sugar, proline, ROS, and H2O2 as well as the activities of OXO and POD in kale root. The De-1 cluster increased the content of nitrate, N, P, K, and Zn. These results indicated that lower nutrient-solution depth contributed to enhancing mineral element uptake and the growth of kale, while higher nutrient-solution depth enhanced the quality and stress response of kale.

3.8. Multivariate Principal Component Analysis

The principal component analysis was used to compare the correlation of all growth, quality, and stress-response parameters in kale response to varied nutrient-solution depth (Figure 9). Overall, 95% of the total variance is explained by the first five principal components, namely PC1 through PC5 (eigenvalues > 1), of which PC1 accounts for 51.6% and PC2 for 32.3. The PCA biplot showed three clusters for the De-1, De-2, and De-3 treatments, indicating noticeably varied reaction patterns. Kale plants in the right quadrants (De-2 and De-3 treatments) were characterized by higher agronomic performance, chlorophyll, and mineral element contents (P, K, Ca, S, and Zn), while De-3 located in the second quadrant showed higher nutritional components and antioxidant enzyme activities, such as glucosinolates, soluble sugar and protein, vitamin C, POD, and proline. Meanwhile, the longer vector length of parameters could better represent PC1 or PC2, and the results indicated the relationship between parameters by confirming the angle between two vectors (0° < positively correlated < 90°; uncorrelated, 90°; 90° < negatively correlated < 180°).
In the first quadrant, positive correlations were observed among the fresh and dry weight of shoot and root, total leaf area, stem diameter, plant height, total root length, root surface area, Ca, and ROS. These indices displayed a strong negative correlation with I-GLs, T-GLs, vitamin C, POD, and N, and they were connected to the forward axis of PC1. PC2 showed a positive correlation to carotenoids, soluble protein, soluble sugars, A-GLs, H2O2, OXO, proline, and Mg, and it negatively correlated to maximum root length, root diameter, chlorophyll a, chlorophyll b, nitrate, K, P, Zn, and S.

4. Discussion

4.1. Different Depths of Nutrient Solution Affected the Shoot Growth and Pigment in Kale

Different nutrient-solution depths change the proportion of roots exposed to air in addition to the amount of dissolved oxygen in the nutrient solution. Although hydrostatic culture had lower levels of dissolved oxygen in nutrient solution when compared with circulating nutrient solution treatment, the air-exposed section of the roots considerably improved the rhizosphere oxygen environment and raised the dry weight of the shoots and roots in lettuce [43]. Suitable parts of root exposed to the air massively increased lettuce biomass and quality [22]. In this study, nutrient-solution depth notably affected kale growth (Figure 3). Plant growth, plant biomass, plant height, stem diameter, and total leaf area of kale increased with increasing nutrient-solution depth (De-1 to De-2), while it was reduced after exceeding the suitable nutrient-solution depth (De-2 to De-3). Higher fresh weight in lettuce was detected when there was enough air space between the planting board and nutrient solution, while a 19% fresh weight loss was observed when the board floated on the nutrient solution without aeration. [44]. In pok choi (B. rapa var. chinensis.) and choy sum (B. rapa var. parachinensis.), the leaf area, plant height, and biomass of shoot were significantly improved under drained and half-flooded treatments when compared with the flooded treatment [45]. Thus, these studies revealed that short-term root hypoxia did not cause plant death, but the growth of shoots was hindered due to weakened root respiration, which contributes to the lower biomass [11].
In anoxic conditions, waterlogging stress was negative for plant height, chlorophyll content, biomass, as well as leaf area and number, while total carotenoid content was increased in cucumber plants [46]. In this study, carotenoid content in De-3 was significantly higher than in De-1 and De-2, while the chlorophyll contents were prominently reduced. The reduction in chlorophyll content might decrease the photosynthesis rate and further inhibit kale growth. However, carotenoid pigments inhibited oxidative damage by binding singlet oxygen to protect the photosynthetic structures [46], and an increment in carotenoid content might enhance the ability to cope with an anaerobic environment. Therefore, the low depth of nutrient solution (De-1 and De-2) was more conducive to kale growth, root respiration, and the accumulation of chlorophyll in leaves, which promoted shoot growth, while the high depth of nutrient solution (De-3) inhibited shoot growth due to root hypoxia.

4.2. Different Depths of Nutrient Solution Affected the Roots Growth and Antioxidant Activity in Kale

The capacity of roots to uptake water and nutrients relies on their development and morphology that are sensitively adjusted by the extrinsic environment [47]. Root growth and morphology in kale were considered to be sensitive to the rhizosphere oxygen environment. Higher total root length and root surface area of kale were found under De-1 and De-2, while the highest root fresh and dry weight was observed under De-2 (Figure 4). Meanwhile, more lateral roots and root hair were observed in De-1 and De-2 than in De-3 (Figure 4G–I). In the circulating nutrient solution, the hanging root length of 2 cm significantly increased the root volume, root surface area, root tips, and forks number of lettuce [43]. Compared with the hydroponics system treatment, the aeroponics system significantly promoted the ratio of root and shoot, root length, area, and volume in lettuce [48]. Surprisingly, the ratio of root and shoot significantly decreased under De-2 compared with De-3 treatment. It directly reflected a higher proportion of biomass that was distributed into shoots under an oxygen-rich environment, whereas plants allocate a higher proportion to roots under De-3, where there is lower oxygen content. Compared with DFT treatment, the ratio of shoot and root was decreased by DFT + air and wet-sheet culture treatment, and the proportion of short lateral root was lower in these treatments [49]. Tomato roots in humid air had more root hairs, more lignin lamellae accumulating in the exodermis, and larger cortical cells than those in the nutrient solution [49]. These results indicated that lack of oxygen in DFT inhibited lateral root growth, which was consistent with the results the of De-3 treatment, and the aeration environment was conducive to the development of root hairs and lateral roots.
The meristematic zone, elongation zone, and differentiation zone are dynamically balanced during root development [50]. Reactive oxygen species (ROS) are constantly created in the roots of plants by the enzymes located in mitochondria, peroxisome, and apoplast. Even though they are byproducts of aerobic metabolism that have the potential to be harmful, signaling molecules such as H2O2 are crucial for root growth at various phases of cell proliferation and differentiation [51]. In Arabidopsis root, the total root length and rate of root growth were significantly reduced under H2O2 for 24 h through downregulation of the expression of genes associated with the cell cycle, such as CyclinB1 and CDKA1 [52]. In the differentiation zone, lateral root primordia initiate in the pericycle and further develop into lateral roots (LR). Furthermore, transcription factor UPB1 controlled the accumulation of superoxide (O2-) in the meristematic zone and H2O2 in elongation zone by directly modulating the expression of a subset of peroxidase genes (PRXs), respectively [53]. In mutants upb1-1, higher lateral root density and number of lateral root primordia were observed, while those in UPB1 over-expressors were reduced [54]. These investigations demonstrated that the accumulation of ROS in the LR primordia’s later stages encourages the creation of new LR primordia and subsequent LR growth. In this study, high nutrient-solution depths that were similar to waterlogging might increase the content of H2O2 and POD in kale by downregulating UPB1 [55]. Though it is beneficial to enhance stress resistance and LR primordia emergence to adapt to the anoxic environment, an accumulation of H2O2 might alter the redox equilibrium in a way that favors differentiation over proliferation. In addition, in the double mutants of AtrbohD/F, the LR density significantly increased in comparison with the wild type by decreasing the ratio of H2O2 and O2- due to the activation of peroxidase [56]. Hence, low nutrient-solution depths might maintain a relatively low ratio of H2O2 and O2 in the lateral root and promote lateral root growth by regulation of peroxidase activity.
Plants’ antioxidant defense mechanisms allowed them to counteract the negative effects of reactive oxygen species in the absence of oxygen. Under hypoxia stress, lettuce enhanced its antioxidant ability to cope with an anoxic environment by increasing the contents of SOD, POD, and CAT [43]. In this study, the high nutrient solution significantly promoted the biosynthesis of secondary metabolites and antioxidant enzyme activities. Oxalate oxidases play a significant role in plant defense by catalyzing the breakdown of oxalate into H2O2 and CO2 [57]. Under the well-water condition, transgenic maize lines (Trans) expressing a wheat oxalate oxidase have longer roots and contained more H2O2 than those in the wild type. Contrarily, under conditions of water stress, root elongation of Trans decreased in comparison to the wild type [58]. Therefore, high nutrient-solution depths exerted a promoting effect on the OXO content in kale roots, and this might result in root development suppression due to the accumulation of H2O2.
Proline, a kind of osmolyte, is known to protect cells from cell-damaging stress factors such as ROS, and its increase has been considered a reflection of stress tolerance [59]. In this study, proline content in the root increased by 94% with the De-3 treatment compared to De-1. Thus, nutrient-solution depths could induce the stress response in kale roots through the accumulation of proline, which enhances osmosis and regulates water potential under stress.

4.3. Different Depths of Nutrient Solution Affected the Mineral Elements Contents in Kale

Unlike soil, the nutrient ions are delivered through turbulent diffusion to the root surface for absorption in hydroponics. The frequency and duration of contact between roots and nutrient ions have a substantial impact on the root’s ability to absorb nutrients. [60]. In this study, low depths of nutrient solution treatment might result in higher nutrient solution replacement efficiency in the same circulating system. Lower nutrient-solution depths (De-1 and De-2) significantly enhanced the nutrient ions uptake except for Mg. Under anoxic stress, the decrease in ATP availability during the mitochondrial transition from aerobic respiration to glycolysis causes a sharp loss in root activity and nutrient uptake. [61]. When the roots of pok choi and choy sum were flooded in the nutrient solution, the low level of dissolved oxygen in the nutrient solution may have suppressive effects on the contents of N, P, K, Fe, and Mn [45]. The metabolic activity of root cells was connected to the intake of potassium, phosphate, and sulfate. Because root tissues are oxygen-depleted, mitochondrial respiration is inhibited, and the active uptake of water and nutrients is disrupted [62]. Proper nutrient-solution depth improved root activity and further promoted nutrient uptake [22]. Through the engagement and modulation of a plant’s antioxidant system, Zn is essential in reducing waterlogging. In addition, Zn contributes to the synthesis of auxin, which controls the development of lateral roots and adventitious roots, and is a component of various enzymes, including superoxide dismutase zinc-copper (CuZn-SOD). [63,64]. A downward trend in the Zn content was found with increasing nutrient-solution depth in this study. These findings suggested that by boosting oxygen availability, the low depth of the nutrient solution (De-1 and De-2) significantly promoted nutrient uptake.

4.4. Different Depths of Nutrient Solution Affected the Kale Nutritive Quality

A variety of physiological and morphological changes occur in plants in response to anoxic environments. In this study, kale under De-3 had considerably higher soluble sugar and vitamin C levels. In the cucumber plant, glucose levels significantly increased after 10 days of waterlogging treatment [46]. Soluble sugars not only participated in the regulation of cell osmotic pressure as an osmotic regulator but also contributed significantly to auxin transportation and promoted the development of adventitious roots. Due to the activation of auxin polar transport-related genes (PIN1, LBD18, LBD25, and ARF5), waterlogged cucumber hypocotyls with higher fructose and glucose content generated adventitious roots [65]. Vitamin C is a crucial component of the plant antioxidant system and has a direct ability to scavenge ROS such as singlet oxygen, superoxide anions, hydroxyl radicals, and H2O2 [66]. Nutrient-solution depth decrease and partial roots air exposure had been considered as drought stress [67]. Seven days of such drought stress by decreasing the nutrient solution level to 4 cm significantly increased vitamin C and polyphenol contents in lettuce before harvesting. However, the vitamin C content declined after 9 days of drought stress and by the 14th day had reached the same level as the control treatment [68]. These showed that temporary drought stress increased the vitamin C content for protecting the plant. However, the increase of ROS in kale might be stimulated by the accumulation of vitamin C. Although the fresh weight of shoot in De-1 and De-3 was lower than that of De-2, there was no discernible difference between the treatments in antioxidant capacity or polyphenols and flavonoid content. Therefore, adjusting the depth of nutrient solution can improve the nutritional quality of kale, especially vitamin C content.

4.5. Different Depths of Nutrient Solution Affected the Glucosinolates Contents in Kale

Glucosinolates, a class of secondary metabolites, are paid close attention for their nutraceutical and pharmacological values in Brassica vegetables and have been implicated in biotic and abiotic stress [69]. In this study, high nutrient-solution depths could induce the accumulation of GLs, especially indole GLs, and the GBC content massively increased under De-3 treatment (Figure 6). However, De-1 significantly increased the accumulation of NAP, 4ME, and NEO. Similarly, short-term waterlogging (6 days) for juvenile kale increased total GLs noticeably and elevated the contents of glucoraphanin, sinigrin, and gluconasturtiin [70]. Two weeks of waterlogging had a noticeable positive impact on the accumulation of total GLs and sugar in Ethiopian mustard (Brassica carinata) as well as boosted the plant’s tolerance to aphids [71]. Furthermore, the external application of H2O2 significantly increased total glucosinolates content and caused upregulation of APK1 [72]. These indicated that H2O2 as an elicitor stimulated glucosinolate biosynthesis. The cluster analysis indicated that high nutrient-solution depth could be a potential strategy to increase glucosinolates content in kale (Figure 8). However, this study found a negative relationship between total GLs and shoot fresh weight (Figure 9). High nutrient-solution depth could induce the accumulation of GLs to enhance stress tolerance, but suppress kale growth.

5. Conclusions

We investigated how the depth of the nutrient solution affected the growth and phytochemical makeup of kale. The De-2 treatment was beneficial for kale biomass production and total chlorophyll content as well as root development, while it resulted in the reduction of phytochemicals. However, the De-3 treatment remarkably increased the contents of carotenoid, soluble sugar, vitamin C, and total glucosinolates, especially glucobrassicin (GBC). Meanwhile, the accumulation of ROS, H2O2, OXO, and proline in kale roots was elevated under the De-3 treatment. The De-1 treatment significantly enhanced the nutrient ions such as N, P, K, and Zn uptake, and the contents of Ca and S were higher under De-2. Overall, our results demonstrated that the regulation of nutrient-solution depth could be used as a tactic to increase the yield of kale in plant factories, and further studies should focus on the suitable depth of nutrient solution for higher nutrition quality without inhibiting the growth of kale.

Supplementary Materials

The following supporting information can be downloaded at: https://www.mdpi.com/article/10.3390/horticulturae9010053/s1, Figure S1: Total polyphenols and flavonoids content and antioxidant capacity of kale grown under different nutrient-solution depths.

Author Contributions

Conceptualization, methodology, validation, formal analysis, data curation, and writing—original draft, J.T.; methodology and writing—review and editing, Y.L.; methodology and validation, R.H., H.J. and K.L.; formal analysis, Y.C.; visualization, X.H. and X.L.; conceptualization, methodology, resources, supervision, project administration, and funding acquisition, H.L. All authors have read and agreed to the published version of the manuscript.

Funding

This work was supported by the National Key Research and Development of China (2021YFD2000701) and Key Research and Development Program of Guangdong (2019B020214005).

Data Availability Statement

Not applicable.

Conflicts of Interest

The authors declare no conflict of interest.

References

  1. Gu, D.; Andreev, K.; Dupre, M.E. Major trends in population growth around the world. China CDC Wkly. 2021, 3, 604. [Google Scholar] [CrossRef] [PubMed]
  2. Prosekov, A.Y.; Ivanova, S.A. Food security: The challenge of the present. Geoforum 2018, 91, 73–77. [Google Scholar] [CrossRef]
  3. Cifuentes-Torres, L.; Mendoza-Espinosa, L.G.; Correa-Reyes, G.; Daesslé, L.W. Hydroponics with wastewater: A review of trends and opportunities. Water Environ. J. 2020, 35, 166–180. [Google Scholar] [CrossRef]
  4. Sharma, N.; Acharya, S.; Kumar, K.; Singh, N.; Chaurasia, O.P. Hydroponics as an advanced technique for vegetable production: An overview. J. Soil Water Conserv. 2018, 17, 364–371. [Google Scholar] [CrossRef]
  5. Masaru, S.; Uenishi, M.; Miyamoto, K.; Suzuki, T. Effect of Root-Zone Temperature on the Growth and Fruit Quality of Hydroponically Grown Strawberry Plants. J. Agric. Sci. 2016, 8, 122–131. [Google Scholar] [CrossRef]
  6. Ikeura, H.; Takahashi, H.; Kobayashi, F.; Sato, M.; Tamaki, M. Effects of microbubble generation methods and dissolved oxygen concentrations on growth of Japanese mustard spinach in hydroponic culture. J. Hortic. Sci. Biotech. 2017, 93, 483–490. [Google Scholar] [CrossRef]
  7. Ren, X.; Lu, N.; Xu, W.; Zhuang, Y.; Takagaki, M. Optimization of the Yield, Total Phenolic Content, and Antioxidant Capacity of Basil by Controlling the Electrical Conductivity of the Nutrient Solution. Horticulturae 2022, 8, 216. [Google Scholar] [CrossRef]
  8. Chun, C.; Takakura, T. Rate of root respiration of lettuce under various dissolved oxygen concentrations in hydroponics. Environ. Control. Biol. 1994, 32, 125–135. [Google Scholar] [CrossRef]
  9. Ayi, Q.; Zeng, B.; Yang, K.; Lin, F.; Zhang, X.; van Bodegom, P.M.; Cornelissen, J.H.C. Similar Growth Performance but Contrasting Biomass Allocation of Root-Flooded Terrestrial Plant Alternanthera philoxeroides (Mart.) Griseb. in Response to Nutrient Versus Dissolved Oxygen Stress. Front. Plant Sci. 2019, 10, 111. [Google Scholar] [CrossRef]
  10. Tan, X.; Xu, H.; Khan, S.; Equiza, M.A.; Lee, S.H.; Vaziriyeganeh, M.; Zwiazek, J.J. Plant water transport and aquaporins in oxygen-deprived environments. J. Plant Physiol. 2018, 227, 20–30. [Google Scholar] [CrossRef]
  11. Morard, P.; Silvestre, J. Plant injury due to oxygen deficiency in the root environment of soilless culture: A review. Plant Soil 1996, 184, 243–254. [Google Scholar] [CrossRef]
  12. Ayi, Q.; Zeng, B.; Liu, J.; Li, S.; van Bodegom, P.M.; Cornelissen, J.H.C. Oxygen absorption by adventitious roots promotes the survival of completely submerged terrestrial plants. Ann. Bot. 2016, 118, 675–683. [Google Scholar] [CrossRef] [PubMed]
  13. Suyantohadi, A.; Kyoren, T.; Hariadi, M.; Purnomo, M.H.; Morimoto, T. Effect of high consentrated dissolved oxygen on the plant growth in a deep hydroponic culture under a low temperature. IFAC Proc. Vol. 2010, 43, 251–255. [Google Scholar] [CrossRef]
  14. Song, W.; Zhang, S.; Huang, Z. Principle and efficiency of oxygen enrichment of dynamic solution surface in nutrient solution. Trans. Chin. Soc. Agric. Eng. 2003, 19, 194–198. (In Chinese) [Google Scholar]
  15. Voesenek, L.; Armstrong, W.; Bögemann, G.; Colmer, T.; McDonald, M. A lack of aerenchyma and high rates of radial oxygen loss from the root base contribute to the waterlogging intolerance of Brassica napus. Funct. Plant Biol. 1999, 26, 87–93. [Google Scholar] [CrossRef]
  16. Baiyin, B.; Tagawa, K.; Yamada, M.; Wang, X.; Yamada, S.; Yamamoto, S.; Ibaraki, Y. Study on Plant Growth and Nutrient Uptake under Different Aeration Intensity in Hydroponics with the Application of Particle Image Velocimetry. Agriculture 2021, 11, 1140. [Google Scholar] [CrossRef]
  17. Park, J.-S.; Kurata, K. Application of microbubbles to hydroponics solution promotes lettuce growth. HortTechnology 2009, 19, 212–215. [Google Scholar] [CrossRef]
  18. Jackson, M.B. Ethylene and responses of plants to soil waterlogging and submergence. Annu. Rev. Plant Physiol. 1985, 36, 145–174. [Google Scholar] [CrossRef]
  19. Xu, Z.; Zhang, D.; Adams, P. Improving aeration in hydroponics—Principle and practice. Acta Agric. Urae Zhejiangensis 1994, 6, 44–48. [Google Scholar]
  20. Son, J.E.; Kim, H.J.; Ahn, T.I. Hydroponic systems. In Plant Factory; Elsevier: Amsterdam, The Netherlands, 2020; pp. 273–283. [Google Scholar]
  21. Lu, N.; Shimamura, S. Protocols, issues and potential improvements of current cultivation systems. In Smart Plant Factory; Springer: Berlin/Heidelberg, Germany, 2018; pp. 31–49. [Google Scholar]
  22. Fu, L.; Jia, F.; Yang, Z.; Su, F.; Chen, H.; Yin, M.; Chen, J.; Hong, L.; Hu, D. Effects of hanging roots with different length on yield, quality and water dissolved oxygen of romaine lettuce. Southwest China J. Agric. Sci. 2015, 28, 1775–1779. [Google Scholar]
  23. da Silva, M.G.; Soares, T.M.; Gheyi, H.R.; Costa, I.P.; Vasconcelos, R.S. Growth, production and water consumption of coriander grown under different recirculation intervals and nutrient solution depths in hydroponic channels. Emir. J. Food Agr. 2020, 32, 281–294. [Google Scholar] [CrossRef]
  24. Baiyin, B.; Tagawa, K.; Yamada, M.; Wang, X.; Yamada, S.; Shao, Y.; An, P.; Yamamoto, S.; Ibaraki, Y. Effect of Nutrient Solution Flow Rate on Hydroponic Plant Growth and Root Morphology. Plants 2021, 10, 1840. [Google Scholar] [CrossRef] [PubMed]
  25. Khalid, W.; Sajid Arshad, M.; Imran, M.; Shabir Ahmad, R.; Imran, A.; Qaisrani, T.B.; Asghar, Z.; Husain, A.; Muhammad Anjum, F.; Ansar Rasul Suleria, H. Kale (Brassica oleracea var. sabellica) as miracle food with special reference to therapeutic and nutraceuticals perspective. Food Sci. Nutr. 2021, 10, 3175. [Google Scholar] [CrossRef]
  26. Park, Y.J.; Lee, H.M.; Shin, M.; Arasu, M.V.; Chung, D.Y.; Al-Dhabi, N.A.; Kim, S.J. Effect of different proportion of sulphur treatments on the contents of glucosinolate in kale (Brassica oleracea var. acephala) commonly consumed in Republic of Korea. Saudi J. Biol. Sci. 2018, 25, 349–353. [Google Scholar] [CrossRef]
  27. Mageney, V.; Neugart, S.; Albach, D.C. A Guide to the Variability of Flavonoids in Brassica oleracea. Molecules 2017, 22, 252. [Google Scholar] [CrossRef] [PubMed] [Green Version]
  28. Ashenafi, E.L.; Nyman, M.C.; Holley, J.M.; Mattson, N.S.; Rangarajan, A. Phenotypic plasticity and nutritional quality of three kale cultivars (Brassica oleracea L. var. acephala) under field, greenhouse, and growth chamber environments. Environ. Exp. Bot. 2022, 199, 104895. [Google Scholar] [CrossRef]
  29. Islam, S.; Reza, M.N.; Chowdhury, M.; Chung, S.-O.; Choi, I.-S. A review on effect of ambient environment factors and monitoring technology for plant factory. Precis. Agric. 2021, 3, 84. [Google Scholar]
  30. Lichtenthaler, H.K.; Wellburn, A.R. Determinations of total carotenoids and chlorophylls a and b of leaf extracts in different solvents. Biochem. Soc. Trans. 1983, 11, 591–592. [Google Scholar] [CrossRef] [Green Version]
  31. Tadolini, B.; Juliano, C.; Piu, L.; Franconi, F.; Cabrini, L. Resveratrol inhibition of lipid peroxidation. Free Radical. Res. 2000, 33, 105–114. [Google Scholar] [CrossRef]
  32. Benzie, I.F.; Strain, J.J. The ferric reducing ability of plasma (FRAP) as a measure of “antioxidant power”: The FRAP assay. Anal. Biochem. 1996, 239, 70–76. [Google Scholar] [CrossRef] [Green Version]
  33. Singleton, V.L.; Orthofer, R.; Lamuela-Raventós, R.M. [14] Analysis of total phenols and other oxidation substrates and antioxidants by means of folin-ciocalteu reagent. Methods Enzymol. 1999, 299, 152–178. [Google Scholar]
  34. Li, C.; Ge, Y.; Wan, D.; Hu, J.; Ying, C.; Wang, L. Optimization of extraction condition and quantification of total flavonoids in Elaeagni folium. Pharmacogn. J. 2011, 3, 8–12. [Google Scholar] [CrossRef] [Green Version]
  35. Bates, L.S.; Waldren, R.P.; Teare, I. Rapid determination of free proline for water-stress studies. Plant Soil 1973, 39, 205–207. [Google Scholar] [CrossRef]
  36. Kohyama, K.; Nishinari, K. Effect of soluble sugars on gelatinization and retrogradation of sweet potato starch. J. Agric. Food Chem. 1991, 39, 1406–1410. [Google Scholar] [CrossRef]
  37. Blakesley, R.W.; Boezi, J.A. A new staining technique for proteins in polyacrylamide gels using Coomassie Brilliant Blue G250. Anal. Biochem. 1977, 82, 580–582. [Google Scholar] [CrossRef]
  38. Chanwitheesuk, A.; Teerawutgulrag, A.; Rakariyatham, N. Screening of antioxidant activity and antioxidant compounds of some edible plants of Thailand. Food Chem. 2005, 92, 491–497. [Google Scholar] [CrossRef]
  39. Cataldo, D.A.; Maroon, M.; Schrader, L.E.; Youngs, V.L. Rapid colorimetric determination of nitrate in plant tissue by nitration of salicylic acid. Commun. Soil Sci. Plant Anal. 2008, 6, 71–80. [Google Scholar] [CrossRef]
  40. Grosser, K.; van Dam, N.M. A straightforward method for glucosinolate extraction and analysis with high-pressure liquid chromatography (HPLC). JoVE (J. Vis. Exp.) 2017, 121, e55425. [Google Scholar] [CrossRef] [Green Version]
  41. Waterland, N.L.; Moon, Y.; Tou, J.C.; Kim, M.J.; Pena-Yewtukhiw, E.M.; Park, S. Mineral content differs among microgreen, baby leaf, and adult stages in three cultivars of kale. HortScience 2017, 52, 566–571. [Google Scholar] [CrossRef] [Green Version]
  42. Chen, C.; Chen, H.; Zhang, Y.; Thomas, H.R.; Frank, M.H.; He, Y.; Xia, R. TBtools: An Integrative Toolkit Developed for Interactive Analyses of Big Biological Data. Mol. Plant 2020, 13, 1194–1202. [Google Scholar] [CrossRef]
  43. Shang, C.; Yan, Y.n.; Chen, L.; Xu, R.; Lin, Y.; Shao, G.; Zhong, F. Effects of rhizosphere oxygen environment on growth, physiology and quality of hydroponic lettuce. Acta Bot. Boreali-Occident. Sin. 2018, 38, 1895–1904. [Google Scholar]
  44. Kratky, B.A. Growing Lettuce in Non-Aerated, Non-Circulated Hydroponic Systems. J. Veg. Sci. 2005, 11, 35–42. [Google Scholar] [CrossRef]
  45. Trang, N.T.D.; Schierup, H.-H.; Brix, H. Leaf vegetables for use in integrated hydroponics and aquaculture systems: Effects of root flooding on growth, mineral composition and nutrient uptake. Afr. J. Biotechnol. 2010, 9, 4186–4196. [Google Scholar]
  46. Barickman, T.C.; Simpson, C.R.; Sams, C.E. Waterlogging Causes Early Modification in the Physiological Performance, Carotenoids, Chlorophylls, Proline, and Soluble Sugars of Cucumber Plants. Plants 2019, 8, 160. [Google Scholar] [CrossRef] [PubMed] [Green Version]
  47. Altaf, M.A.; Shahid, R.; Ren, M.-X.; Altaf, M.M.; Jahan, M.S.; Khan, L.U. Melatonin Mitigates Nickel Toxicity by Improving Nutrient Uptake Fluxes, Root Architecture System, Photosynthesis, and Antioxidant Potential in Tomato Seedling. J. Soil Sci. Plant Nut. 2021, 21, 1842–1855. [Google Scholar] [CrossRef]
  48. Li, Q.; Li, X.; Tang, B.; Gu, M. Growth Responses and Root Characteristics of Lettuce Grown in Aeroponics, Hydroponics, and Substrate Culture. Horticulturae 2018, 4, 35. [Google Scholar] [CrossRef] [Green Version]
  49. Nakano, Y. Response of tomato root systems to environmental stress under soilless culture. Jpn. Agric. Res. Q. JARQ 2007, 41, 7–15. [Google Scholar] [CrossRef]
  50. Tsukagoshi, H. Control of root growth and development by reactive oxygen species. Curr. Opin. Plant Biol. 2016, 29, 57–63. [Google Scholar] [CrossRef]
  51. Mittler, R. ROS Are Good. Trends Plant Sci. 2017, 22, 11–19. [Google Scholar] [CrossRef] [Green Version]
  52. Tsukagoshi, H. Defective root growth triggered by oxidative stress is controlled through the expression of cell cycle-related genes. Plant Sci. 2012, 197, 30–39. [Google Scholar] [CrossRef]
  53. Tsukagoshi, H.; Busch, W.; Benfey, P.N. Transcriptional regulation of ROS controls transition from proliferation to differentiation in the root. Cell 2010, 143, 606–616. [Google Scholar] [CrossRef] [PubMed] [Green Version]
  54. Manzano, C.; Pallero-Baena, M.; Casimiro, I.; De Rybel, B.; Orman-Ligeza, B.; Van Isterdael, G.; Beeckman, T.; Draye, X.; Casero, P.; Del Pozo, J.C. The Emerging Role of Reactive Oxygen Species Signaling during Lateral Root Development. Plant Physiol. 2014, 165, 1105–1119. [Google Scholar] [CrossRef] [Green Version]
  55. Guo, Y.; Chen, J.; Kuang, L.; Wang, N.; Zhang, G.; Jiang, L.; Wu, D. Effects of waterlogging stress on early seedling development and transcriptomic responses in Brassica napus. Mol. Breed 2020, 40, 1–14. [Google Scholar] [CrossRef]
  56. Li, N.; Sun, L.; Zhang, L.; Song, Y.; Hu, P.; Li, C.; Hao, F.S. AtrbohD and AtrbohF negatively regulate lateral root development by changing the localized accumulation of superoxide in primary roots of Arabidopsis. Planta 2015, 241, 591–602. [Google Scholar] [CrossRef] [PubMed]
  57. Wan, X.; Tan, J.; Lu, S.; Lin, C.; Hu, Y.; Guo, Z. Increased tolerance to oxidative stress in transgenic tobacco expressing a wheat oxalate oxidase gene via induction of antioxidant enzymes is mediated by H2O2. Physiol. Plant 2009, 136, 30–44. [Google Scholar] [CrossRef] [PubMed]
  58. Voothuluru, P.; Makela, P.; Zhu, J.; Yamaguchi, M.; Cho, I.J.; Oliver, M.J.; Simmonds, J.; Sharp, R.E. Apoplastic Hydrogen Peroxide in the Growth Zone of the Maize Primary Root. Increased Levels Differentially Modulate Root Elongation Under Well-Watered and Water-Stressed Conditions. Front Plant Sci. 2020, 11, 392. [Google Scholar] [CrossRef] [PubMed] [Green Version]
  59. Dikilitas, M.; Simsek, E.; Roychoudhury, A. Role of proline and glycine betaine in overcoming abiotic stresses. Prot. Chem. Agents Amelior. Plant Abiotic Stress Biochem. Mol. Perspect. 2020, 59, 206–216. [Google Scholar]
  60. Baiyin, B.; Tagawa, K.; Yamada, M.; Wang, X.; Yamada, S.; Yamamoto, S.; Ibaraki, Y. Effect of Substrate Flow Rate on Nutrient Uptake and Use Efficiency in Hydroponically Grown Swiss Chard (Beta vulgaris L. ssp. cicla ‘Seiyou Shirokuki’). Agronomy 2021, 11, 2050. [Google Scholar] [CrossRef]
  61. Elzenga, J.T.M.; Veen, H.V. Waterlogging and plant nutrient uptake. In Waterlogging Signalling and Tolerance in Plants; Springer: Berlin/Heidelberg, Germany, 2010; pp. 23–35. [Google Scholar]
  62. Morard, P.; Lacoste, L.; Silvestre, J. Effect of Oxygen Deficiency on Mineral Nutrition of Excised Tomato Roots. J. Plant Nutr. 2004, 27, 613–626. [Google Scholar] [CrossRef]
  63. Yamauchi, T.; Tanaka, A.; Inahashi, H.; Nishizawa, N.K.; Tsutsumi, N.; Inukai, Y.; Nakazono, M. Fine control of aerenchyma and lateral root development through AUX/IAA-and ARF-dependent auxin signaling. Proc. Natl. Acad. Sci. USA 2019, 116, 20770–20775. [Google Scholar] [CrossRef] [Green Version]
  64. Arif, Y.; Singh, P.; Siddiqui, H.; Naaz, R.; Hayat, S. Transition metal homeostasis and its role in plant growth and development. In Microbial Biofertilizers and Micronutrient Availability; Springer: Berlin/Heidelberg, Germany, 2022; pp. 159–178. [Google Scholar]
  65. Qi, X.; Li, Q.; Shen, J.; Qian, C.; Xu, X.; Xu, Q.; Chen, X. Sugar enhances waterlogging-induced adventitious root formation in cucumber by promoting auxin transport and signalling. Plant Cell Environ. 2020, 43, 1545–1557. [Google Scholar] [CrossRef] [PubMed]
  66. Paciolla, C.; Fortunato, S.; Dipierro, N.; Paradiso, A.; De Leonardis, S.; Mastropasqua, L.; de Pinto, M.C. Vitamin C in Plants: From Functions to Biofortification. Antioxidants 2019, 8, 519. [Google Scholar] [CrossRef] [Green Version]
  67. Osmolovskaya, N.; Shumilina, J.; Kim, A.; Didio, A.; Grishina, T.; Bilova, T.; Keltsieva, O.A.; Zhukov, V.; Tikhonovich, I.; Tarakhovskaya, E.; et al. Methodology of Drought Stress Research: Experimental Setup and Physiological Characterization. Int. J. Mol. Sci. 2018, 19, 4089. [Google Scholar] [CrossRef] [Green Version]
  68. Koyama, R.; Itoh, H.; Kimura, S.; Morioka, A.; Uno, Y. Augmentation of antioxidant constituents by drought stress to roots in leafy vegetables. HortTechnology 2012, 22, 121–125. [Google Scholar] [CrossRef] [Green Version]
  69. Del Carmen Martinez-Ballesta, M.; Moreno, D.A.; Carvajal, M. The physiological importance of glucosinolates on plant response to abiotic stress in Brassica. Int. J. Mol. Sci. 2013, 14, 11607–11625. [Google Scholar] [CrossRef] [PubMed] [Green Version]
  70. Brazel, S.; Barickman, T.; Sams, C. Short-term waterlogging of kale (Brassica oleracea L. var. acephala) plants causes a decrease in carotenoids and chlorophylls while increasing nutritionally important glucosinolates. In Proceedings of the VIII International Symposium on Human Health Effects of Fruits and Vegetables-FAVHEALTH, Stuttgart, Germany, 3 December 2021; pp. 175–180. [Google Scholar]
  71. Mezgebe, A.; Azerefegne, F. Effect of water stress on glucosinolate content of Brassica carinata and performance of Brevicoryne brassicae and Myzus persicae. Int. J. Trop. Insect Sci. 2020, 41, 953–960. [Google Scholar] [CrossRef]
  72. Vanegas Torres, A.; Tish, N.; Rodov, V. Enhancement of Glucosinolate Formation in Broccoli Sprouts by Hydrogen Peroxide Treatment. Foods 2022, 11, 655. [Google Scholar] [CrossRef]
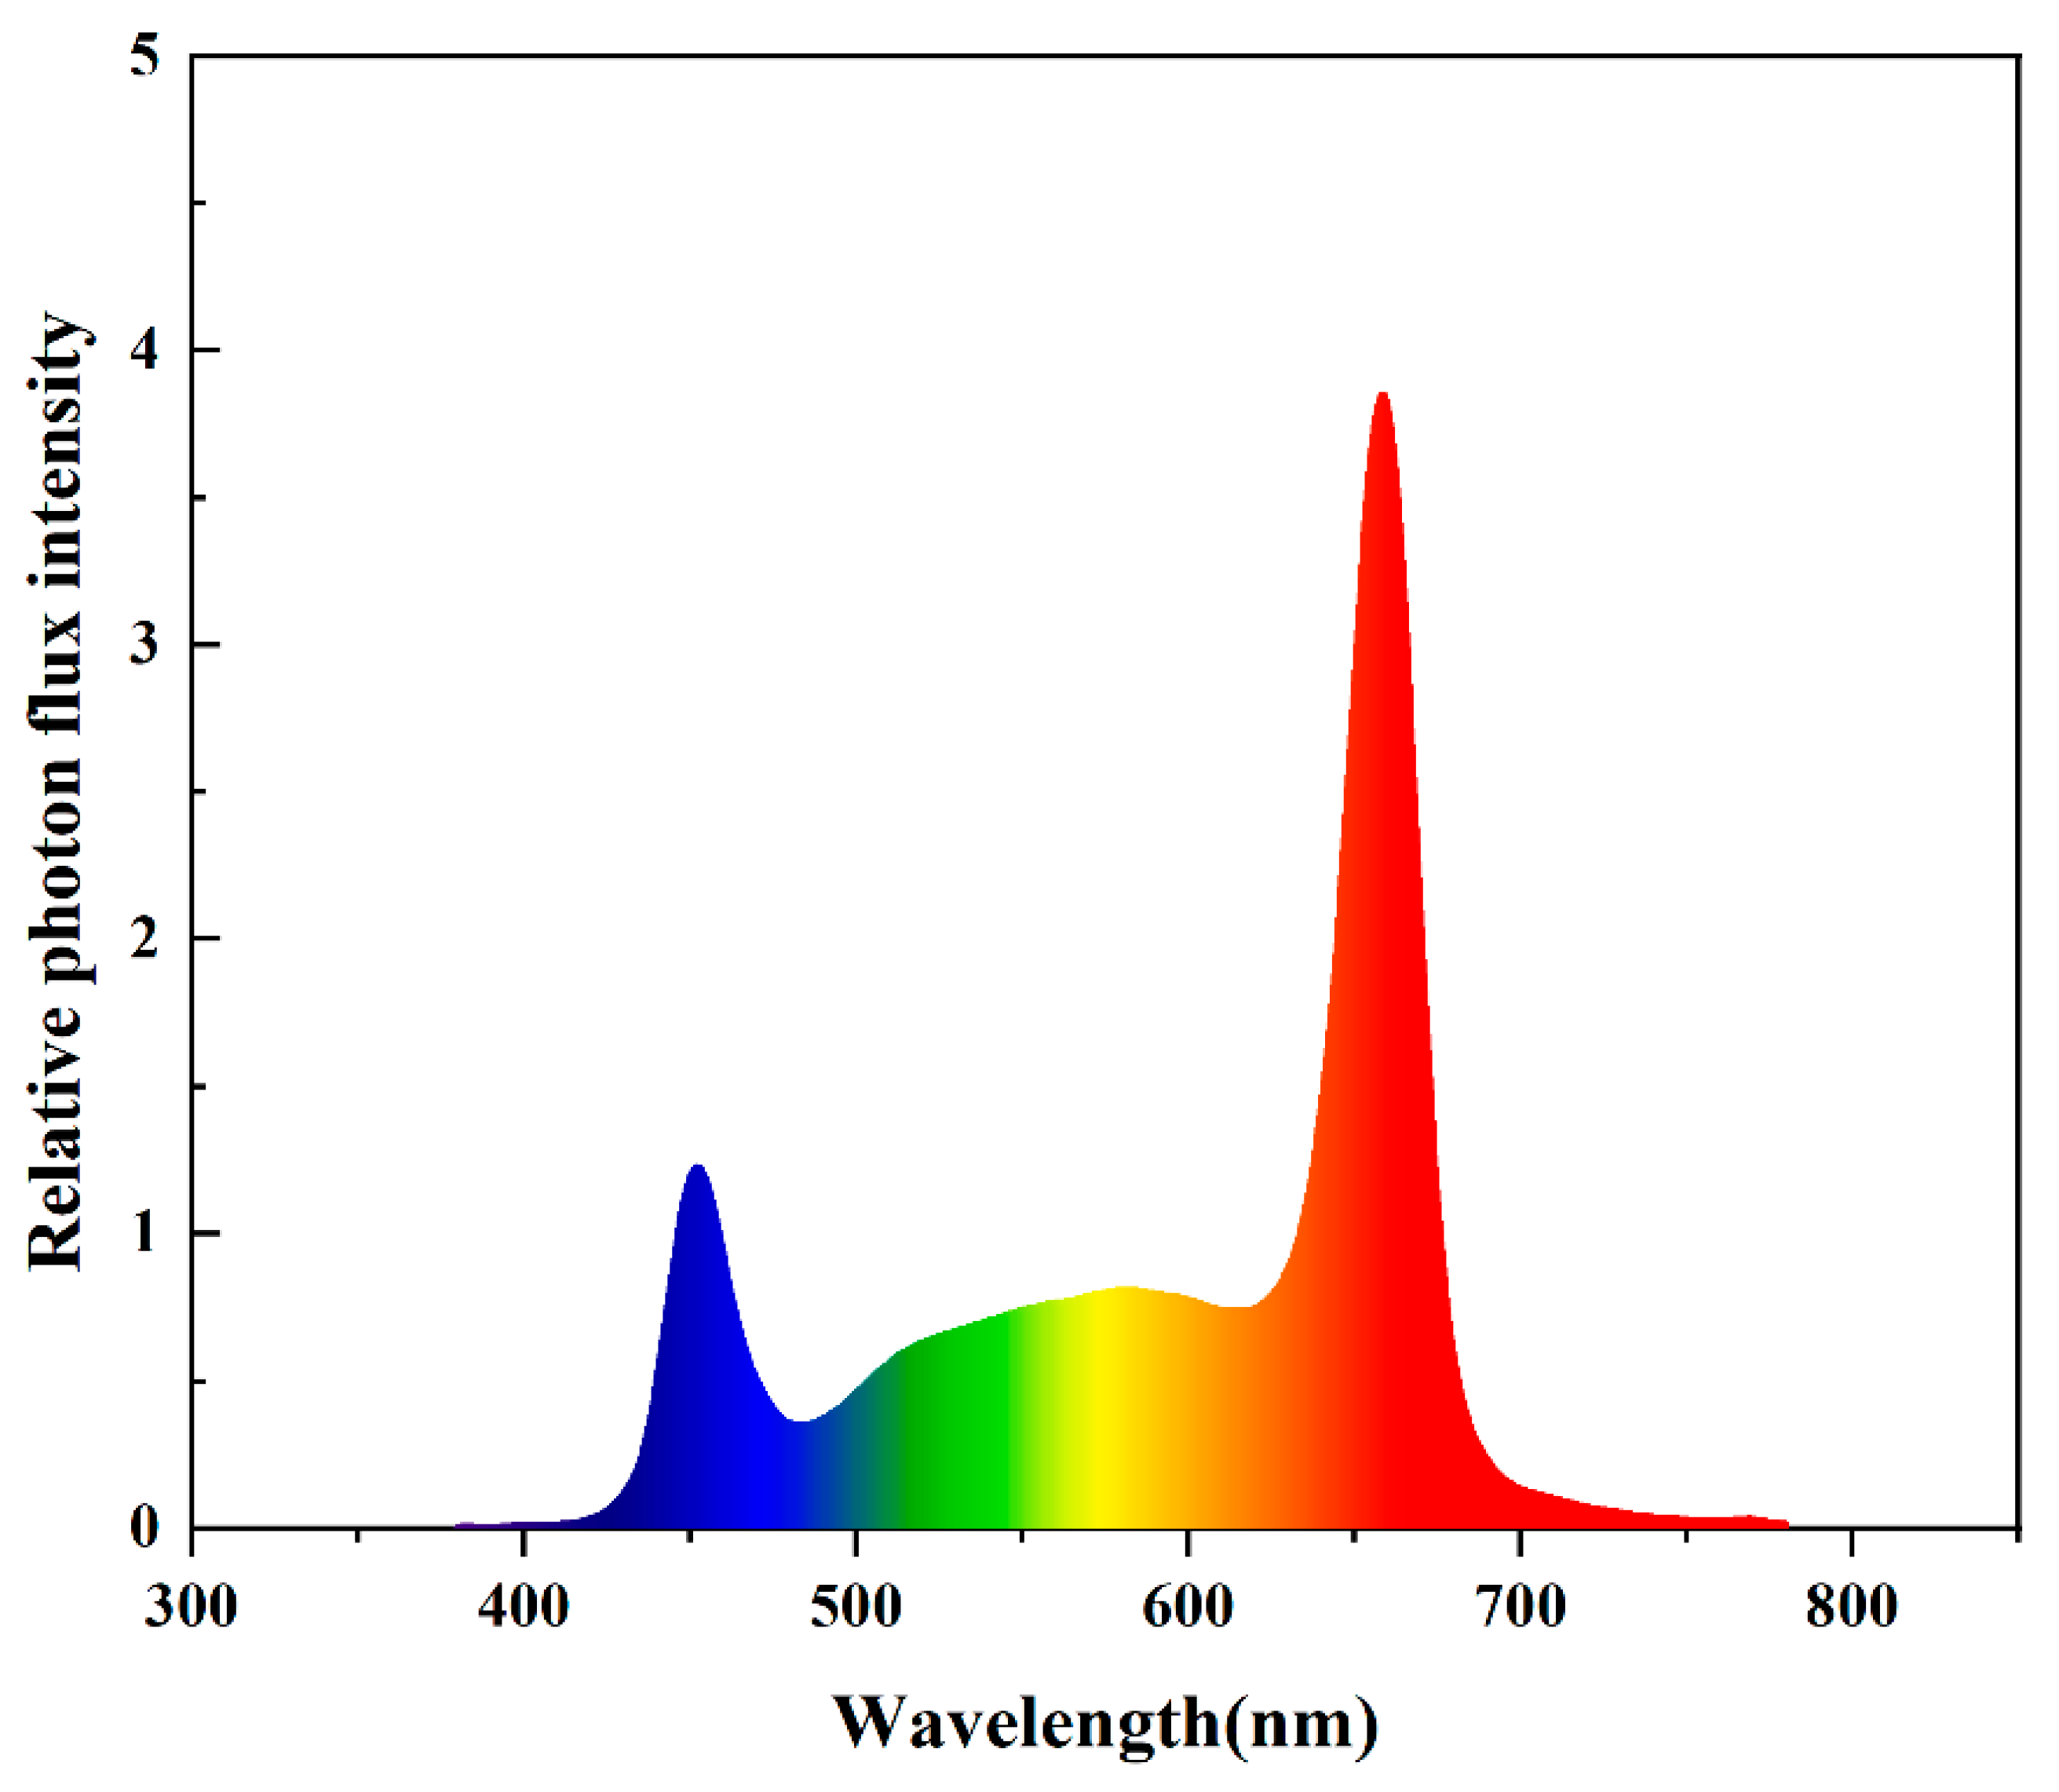
Figure 1. Spectral composition in this study. Different colors represent different wavelengths of light.
Horticulturae 09 00053 g001
Figure 2. Treatments imposed on kale plants are depicted schematically.
Horticulturae 09 00053 g002
Figure 3. Agronomy traits of kale under different nutrient-solution depths as measured by (A) shoot fresh weight; (B) plant height; (C) shoot dry weight; (D) stem diameter; (E) total leaf area; and (F) the ratio of root and shoot. Different letters (a–c) marked upon the columns in the figure indicate significant differences between treatments by Duncan’s multiple (p < 0.05), and vertical bars represent the standard margin of error.
Horticulturae 09 00053 g003
Figure 4. Root morphological properties of kale under different nutrient-solution depths as measured by (A) root fresh weight; (B) root dry weight; (C) maximum root length; (D) total root length; (E) root surface area; and (F) root diameter. Root morphology of kale 24 days after treatments: (G) De-1 treatment, (H) De-2 treatment, and (I) De-3 treatment. The red circles represent sprouting lateral roots in the air space. Different letters (a–c) marked upon the columns in the figure indicate significant differences between treatments by Duncan’s multiple (p < 0.05), and vertical bars represent the standard margin of error.
Horticulturae 09 00053 g004
Figure 5. The contents of (A) soluble sugars, (B) vitamin C, (C) soluble proteins, and (D) nitrates of kale grown under different nutrient-solution depths. Different letters (a–c) marked upon the columns in the figure indicate significant differences between treatments by Duncan’s multiple (p < 0.05), and vertical bars represent the standard margin of error.
Horticulturae 09 00053 g005
Figure 6. (A) Eight individual glucosinolates content in kale grown under different nutrient-solution depths. (B) Different sort of glucosinolate content in kale grown under different nutrient-solution depths. Different letters (a–c) marked upon the columns in the figure indicate significant differences between treatments by Duncan’s multiple (p < 0.05), and vertical bars represent the standard margin of error.
Horticulturae 09 00053 g006
Figure 7. The contents of (A) reactive oxygen species (ROS), (B) hydrogen peroxide (H2O2), (C) oxalate oxidase (OXO), (D) peroxidase (POD), and (E) proline in kale root grown under different nutrient-solution depths. Different letters (a–c) marked upon the columns in the figure indicate significant differences between treatments by Duncan’s multiple (p < 0.05), and vertical bars represent the standard margin of error.
Horticulturae 09 00053 g007
Figure 8. Cluster heat map analysis summarizing the growth and quality of kale grown under different nutrient-solution depths. Results are visualized using a false color scale with red as an increase parameter, while blue represents a decreased parameter.
Horticulturae 09 00053 g008
Figure 9. Principal component analysis (PCA) shows differences and correlations in kale grown under different nutrient-solution depths. Scatter plots with different colors indicated three treatments (n = 3). ROS, reactive oxygen species; H2O2, hydrogen peroxide; OXO, oxalate oxidase; POD, peroxidase; A-GLs, aliphatic glucosinolates; I-GLs, indole glucosinolates; T-GLs, total glucosinolates; N, nitrogen; P, phosphorous; K, potassium; Ca, calcium; Mg, magnesium; S, sulfur; Zn, zinc.
Horticulturae 09 00053 g009
Table 1. Pigment contents of kale grown under different depths of nutrient solution.
TreatmentsDe-1De-2De-3
Chl a (mg·g−1 FW)1.07 ± 0.01 a1.08 ± 0.01 a1.02 ± 0.01 b
Chl b (mg·g−1 FW)0.67 ± 0.03 a0.65 ± 0.02 a0.57 ± 0.01 b
Chl (a + b) (mg·g−1 FW)1.75 ± 0.04 a1.72 ± 0.02 a1.59 ± 0.02 b
Car (mg·g−1 FW)0.16 ± 0.01 b0.17 ± 0.01 b0.19 ± 0.00 a
Chl a/b1.60 ± 0.05 b1.71 ± 0.02 ab1.82 ± 0.02 a
Chl a, Chl b, Chl (a + b), and Car represent chlorophyll a, chlorophyll b, total chlorophylls, and carotenoid, respectively. Ch a/b represents the ratio between chlorophyll a and chlorophyll b. All values in table are expressed as mean ± standard error (n = 3). Different letters in the same row indicate significant differences between treatments by Duncan’s multiple range test (p < 0.05).
Table 2. The content of mineral elements of kale grown under different depths of nutrient solution.
TreatmentsDe-1De-2De-3
N (g·kg−1 DW)51.57 ± 0.29 a49.81 ± 0.01 b50.51 ± 0.27 b
P (g·kg−1 DW)6.19 ± 0.01 a6.09 ± 0.02 b5.93 ± 0.02 c
K (g·kg−1 DW)60.21 ± 0.04 a54.75 ± 0.19 b54.33 ± 0.36 b
Ca (g·kg−1 DW)39.14 ± 0.01 b40.67 ± 0.07 a38.71 ± 0.06 c
Mg (g·kg−1 DW)5.61 ± 0.09 a5.76 ± 0.01 a5.74 ± 0.01 a
S (g·kg−1 DW)17.74 ± 0.06 b18.47 ± 0.01 a14.91 ± 0.06 c
Zn (mg·kg−1 DW)58.21 ± 0.34 a43.04 ± 0.30 b30.33 ± 0.22 c
N, nitrogen; P, phosphorous; K, potassium; Ca, calcium; Mg, magnesium; S, sulfur; Zn, zinc. All values in the table are expressed as mean ± standard error (n = 3). Different letters in the same row indicate significant differences between treatments by Duncan’s multiple range test (p < 0.05).
Disclaimer/Publisher’s Note: The statements, opinions and data contained in all publications are solely those of the individual author(s) and contributor(s) and not of MDPI and/or the editor(s). MDPI and/or the editor(s) disclaim responsibility for any injury to people or property resulting from any ideas, methods, instructions or products referred to in the content.