
Evaluation of Computer Vision Systems and Applications to Estimate Trunk Cross-Sectional Area, Flower Cluster Number, Thinning Efficacy and Yield of Apple

 , ,
, ,
Abstract
1. Introduction
2. Materials and Methods
2.1. Plant Material and Sites
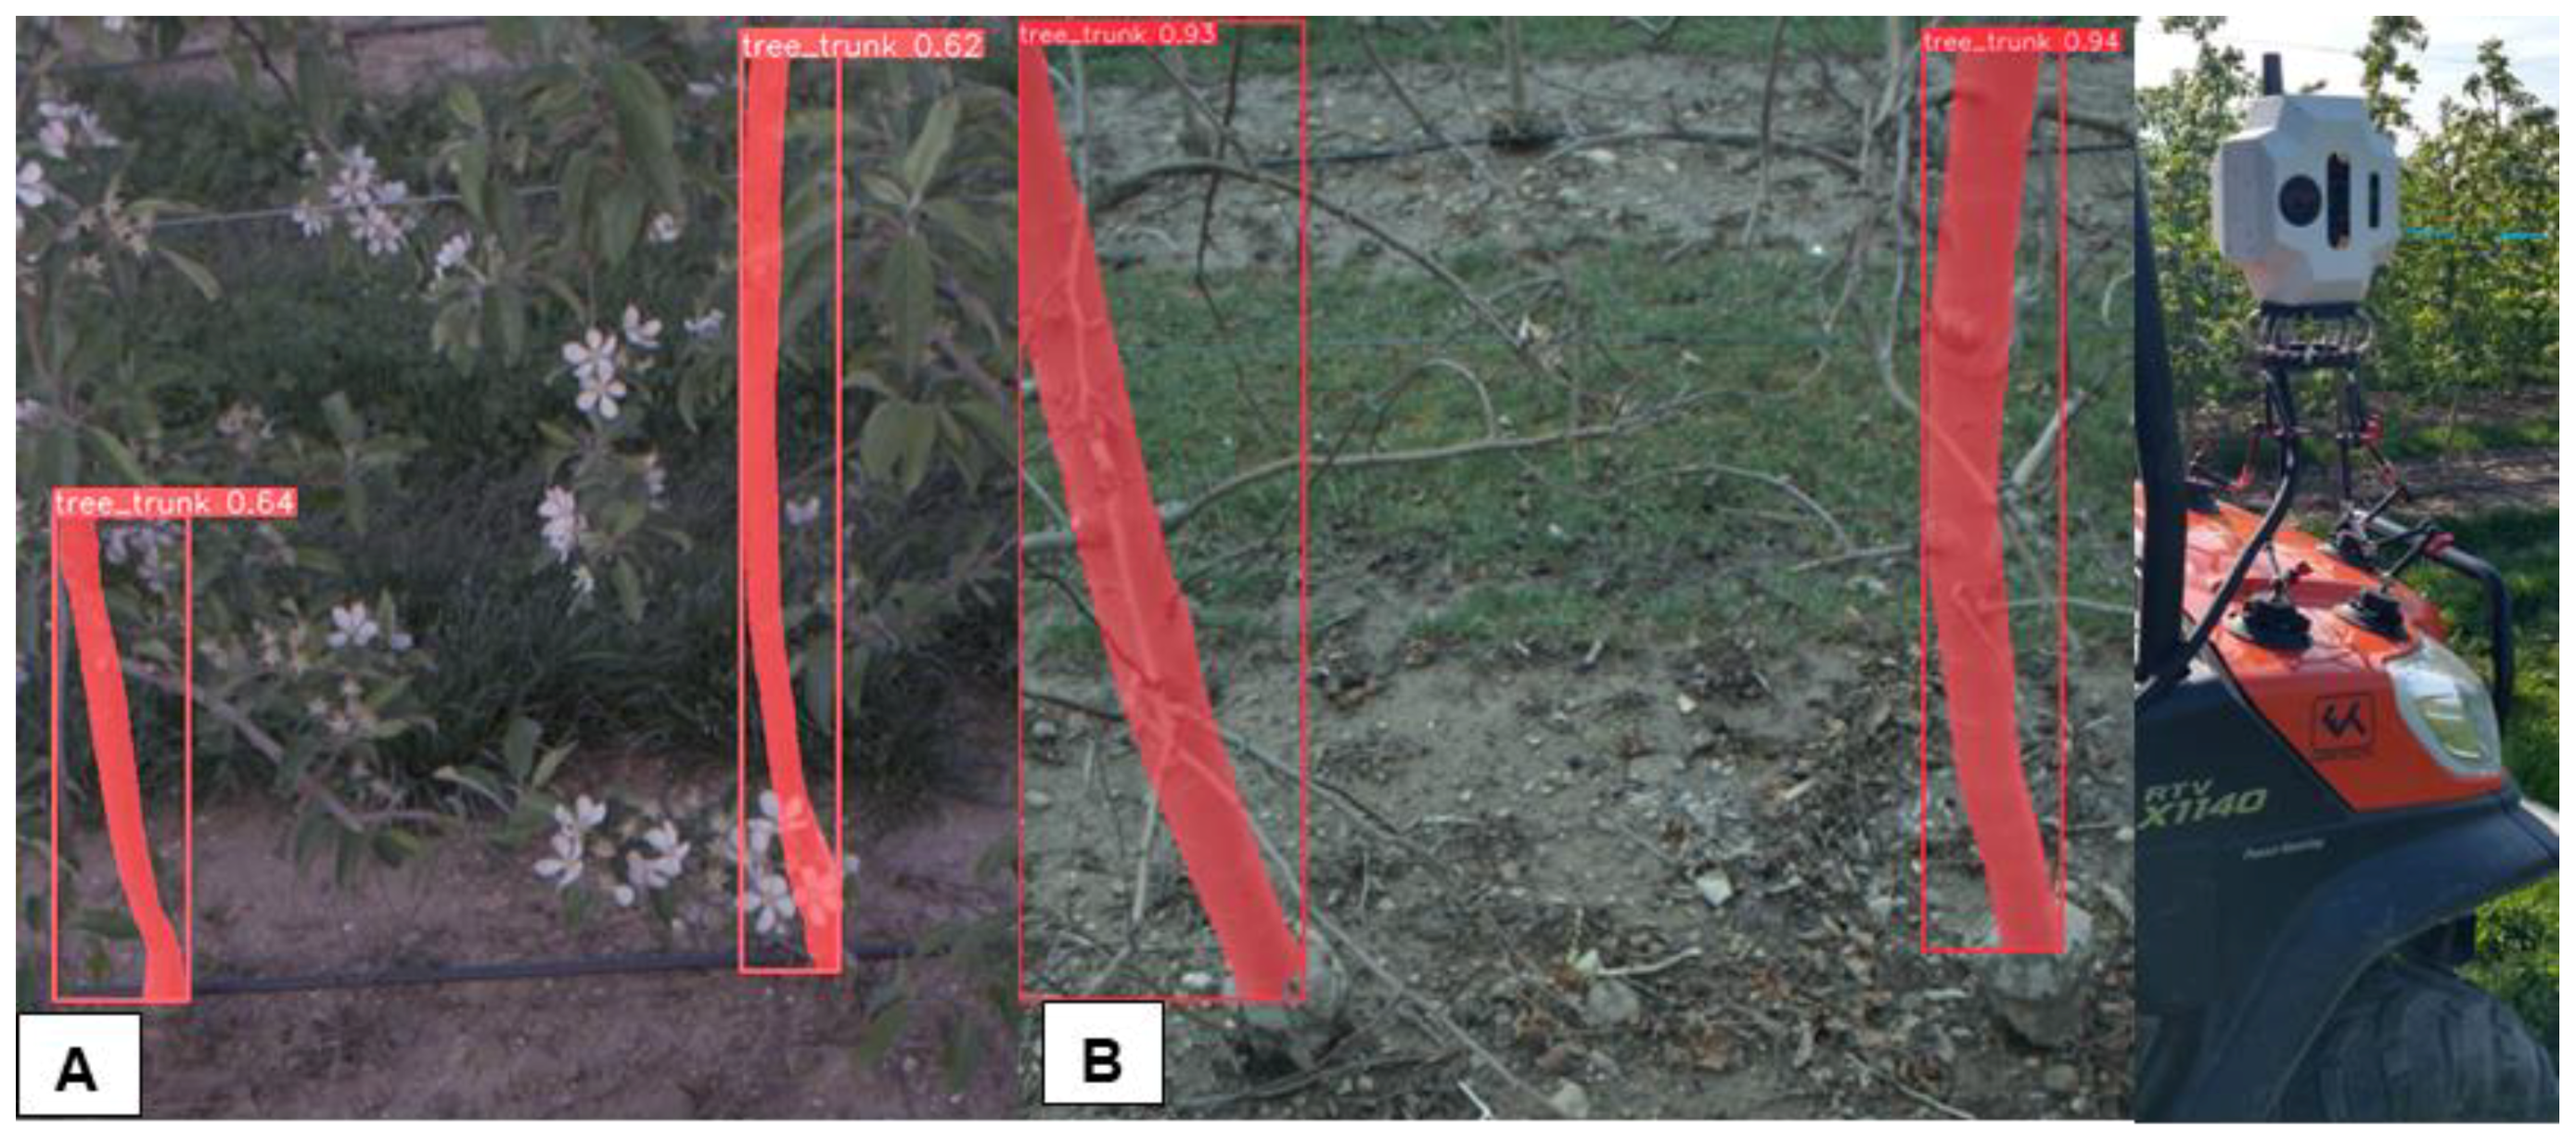
2.2. Trunk Cross-Sectional Area (TCSA)

| Location | Cultivar | Year Planted | Rootstock | System | Spacing (m) (Number Tree per Row) |
|---|---|---|---|---|---|
| New York | ‘Gala’-1 | 2006 | G.11 | Tall Spindle | 0.9 × 3.4 (97) |
| ‘Honeycrisp’ | 2006 | M.9 | Tall Spindle | 0.9 × 3.4 (97) | |
| ‘Gala’-2 | 2019 | G.41 | Tall Spindle | 0.9 × 3.4 (30) | |
| ‘Fuji’ | 2019 | G.41 | Tall Spindle | 0.9 × 3.4 (30) |
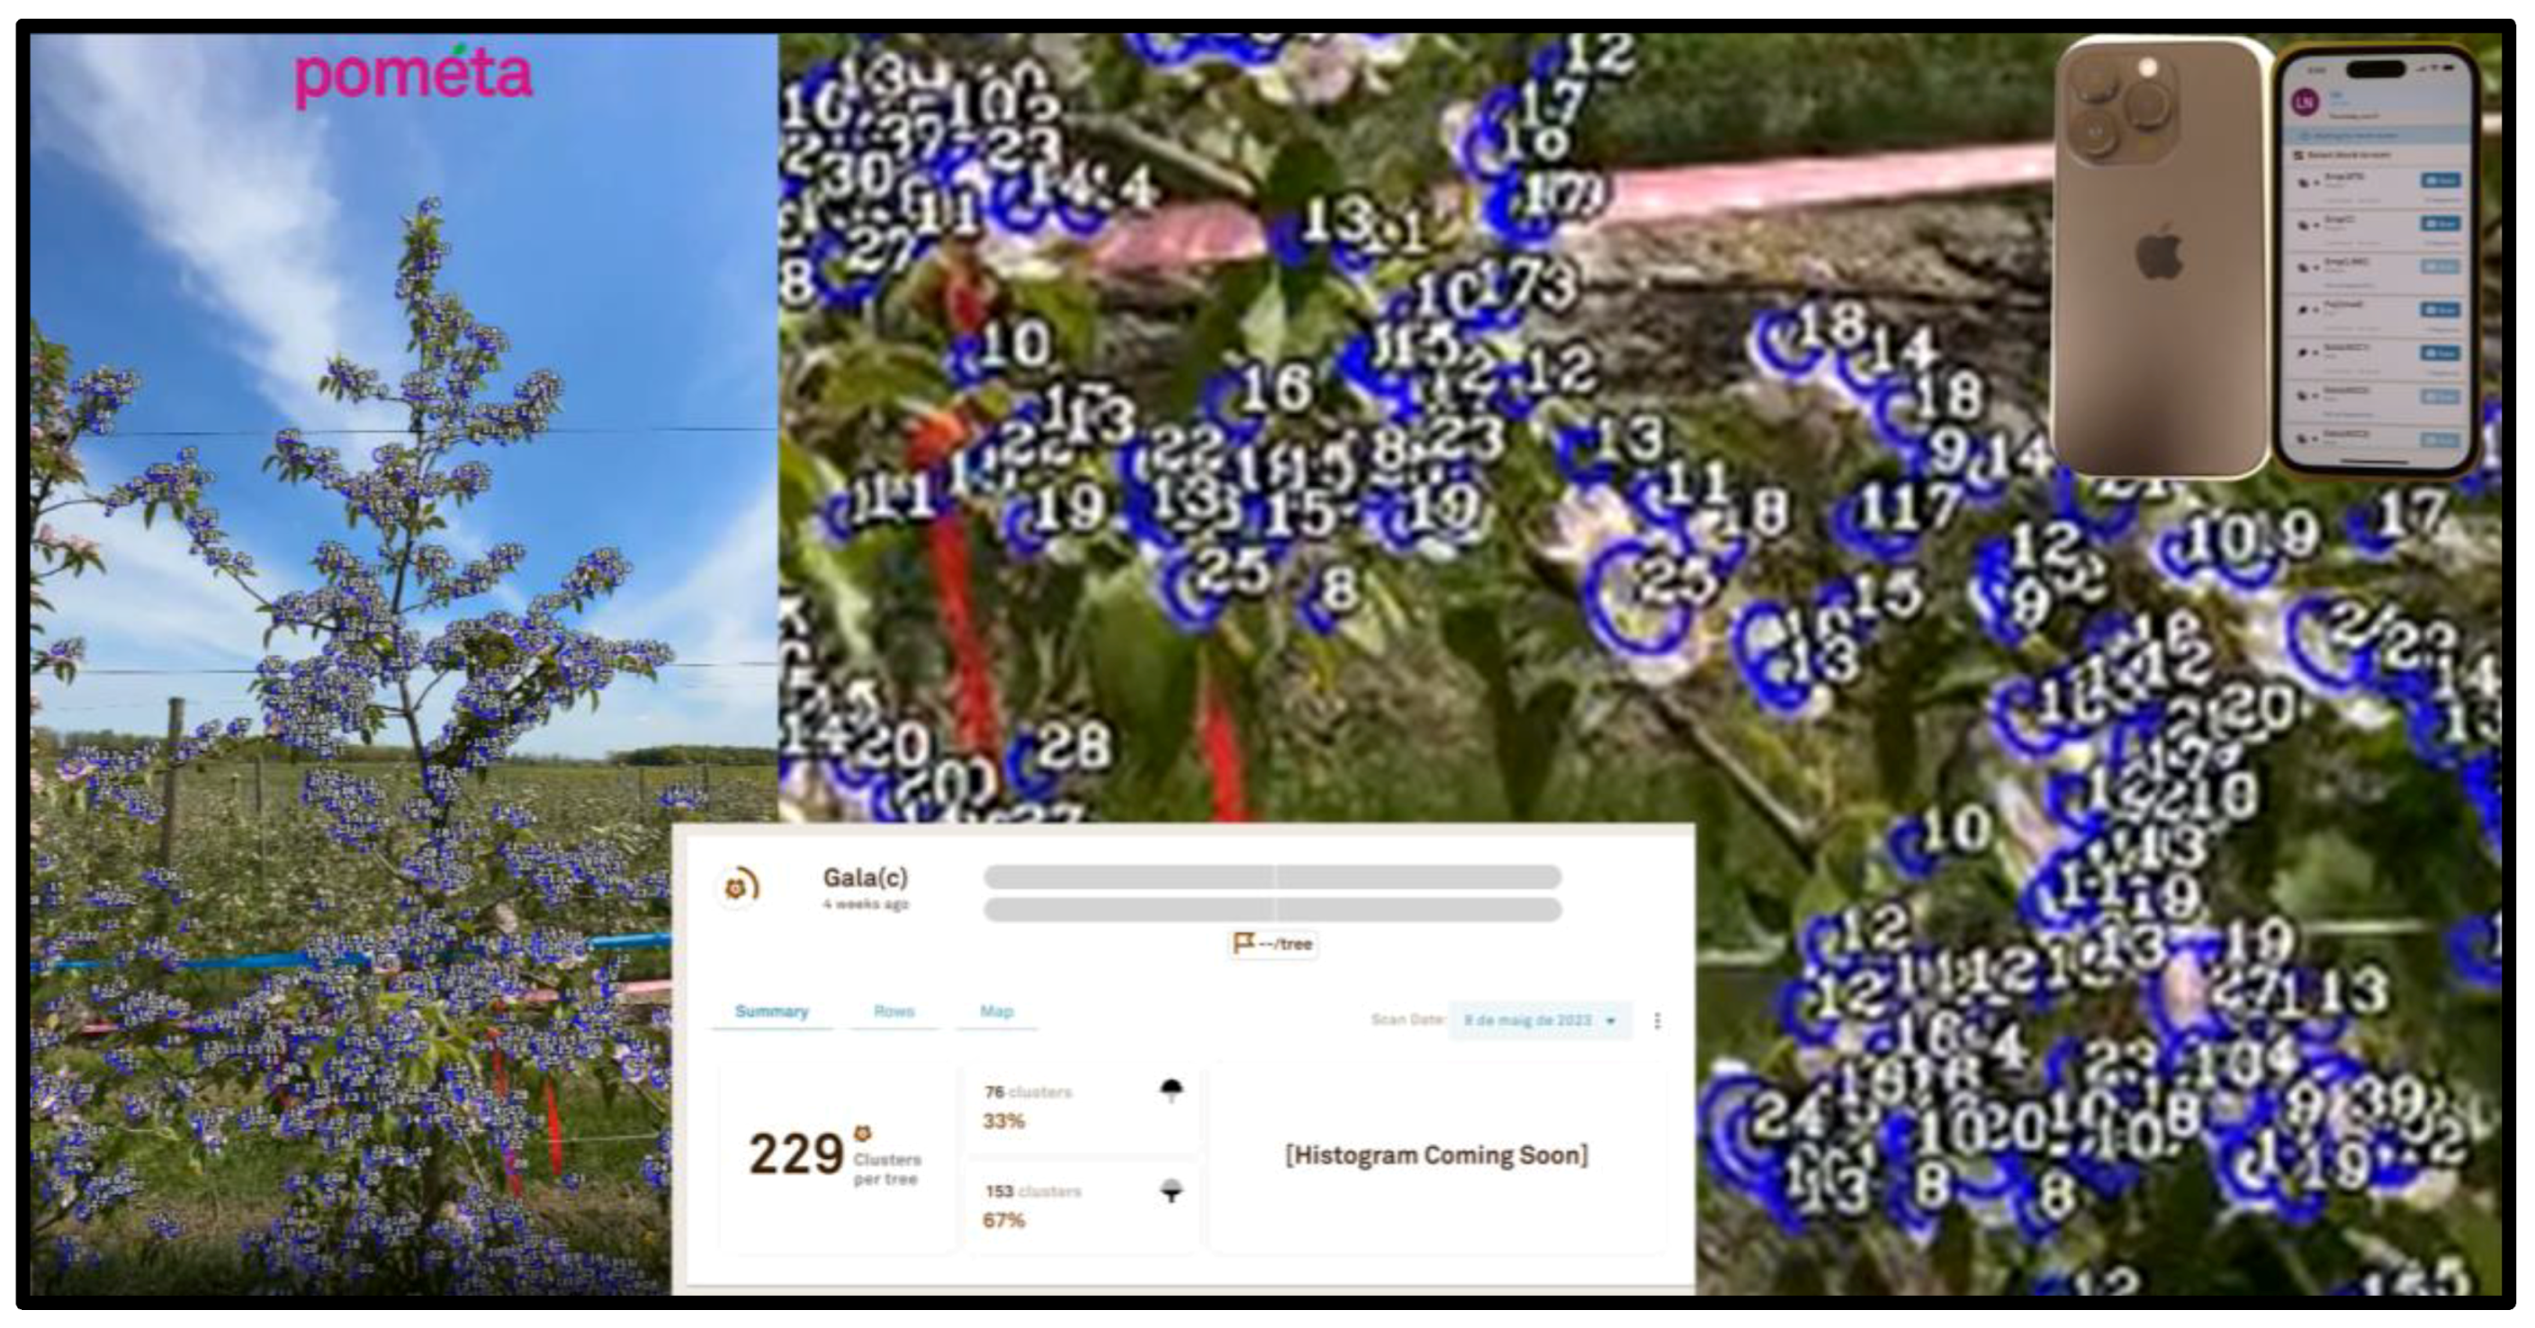
2.3. Blossom Counts
| Location | Cultivar | Rootstock | System | Spacing (m) | 2023 | |
|---|---|---|---|---|---|---|
| Pometa (n of Trees) | Orchard Robotics (n of Trees) | |||||
| New York | ‘NY1’ | G.41 | Tall Spindle | 0.9 × 3.4 | 4 | |
| ‘Gala’ | G.41 | Tall Spindle | 0.9 × 3.4 | 6 | 30 | |
| ‘Fuji’ | G.41 | Tall Spindle | 0.9 × 3.4 | 30 | ||
2.4. Thinning Efficacy
| Location | Cultivar | Rootstock | System | Spacing (m) |
|---|---|---|---|---|
| Massachusetts | ‘Gala’ | M.9 | Tall Spindle | 0.9 × 3.7 |
| ‘Fuji’ | M.9 | Tall Spindle | 0.9 × 3.7 | |
| ‘Honeycrisp’ | G.11 | Tall Spindle | 0.9 × 3.7 | |
| ‘Gala’ | G.41 | Tall Spindle | 0.9 × 3.7 | |
| ‘Honeycrisp’ | G.41 | Tall Spindle | 0.9 × 3.7 | |
| Michigan | ‘Honeycrisp’ | M.9 | Super Spindle | 0.6 × 3.4 |
| ‘Gala’ | G.11 | Super Spindle | 0.6 × 3.4 | |
| ‘Fuji’ | M.9 | Vertical Axe | 1.5 × 3.7 | |
| ‘Gala’ | M.9 | Tall Spindle | 1.2 × 3.7 | |
| New York | ‘Honeycrisp’ | B.9 | Tall Spindle | 1.5 × 3.5 |
| ‘Gala’ | G.11 | Tall Spindle | 0.9 × 3.4 | |
| ‘Honeycrisp’ | M.9 | Tall Spindle | 0.9 × 3.4 | |
| North Carolina | ‘Gala’ | M.9 | Tall Spindle | 0.9 × 4 |
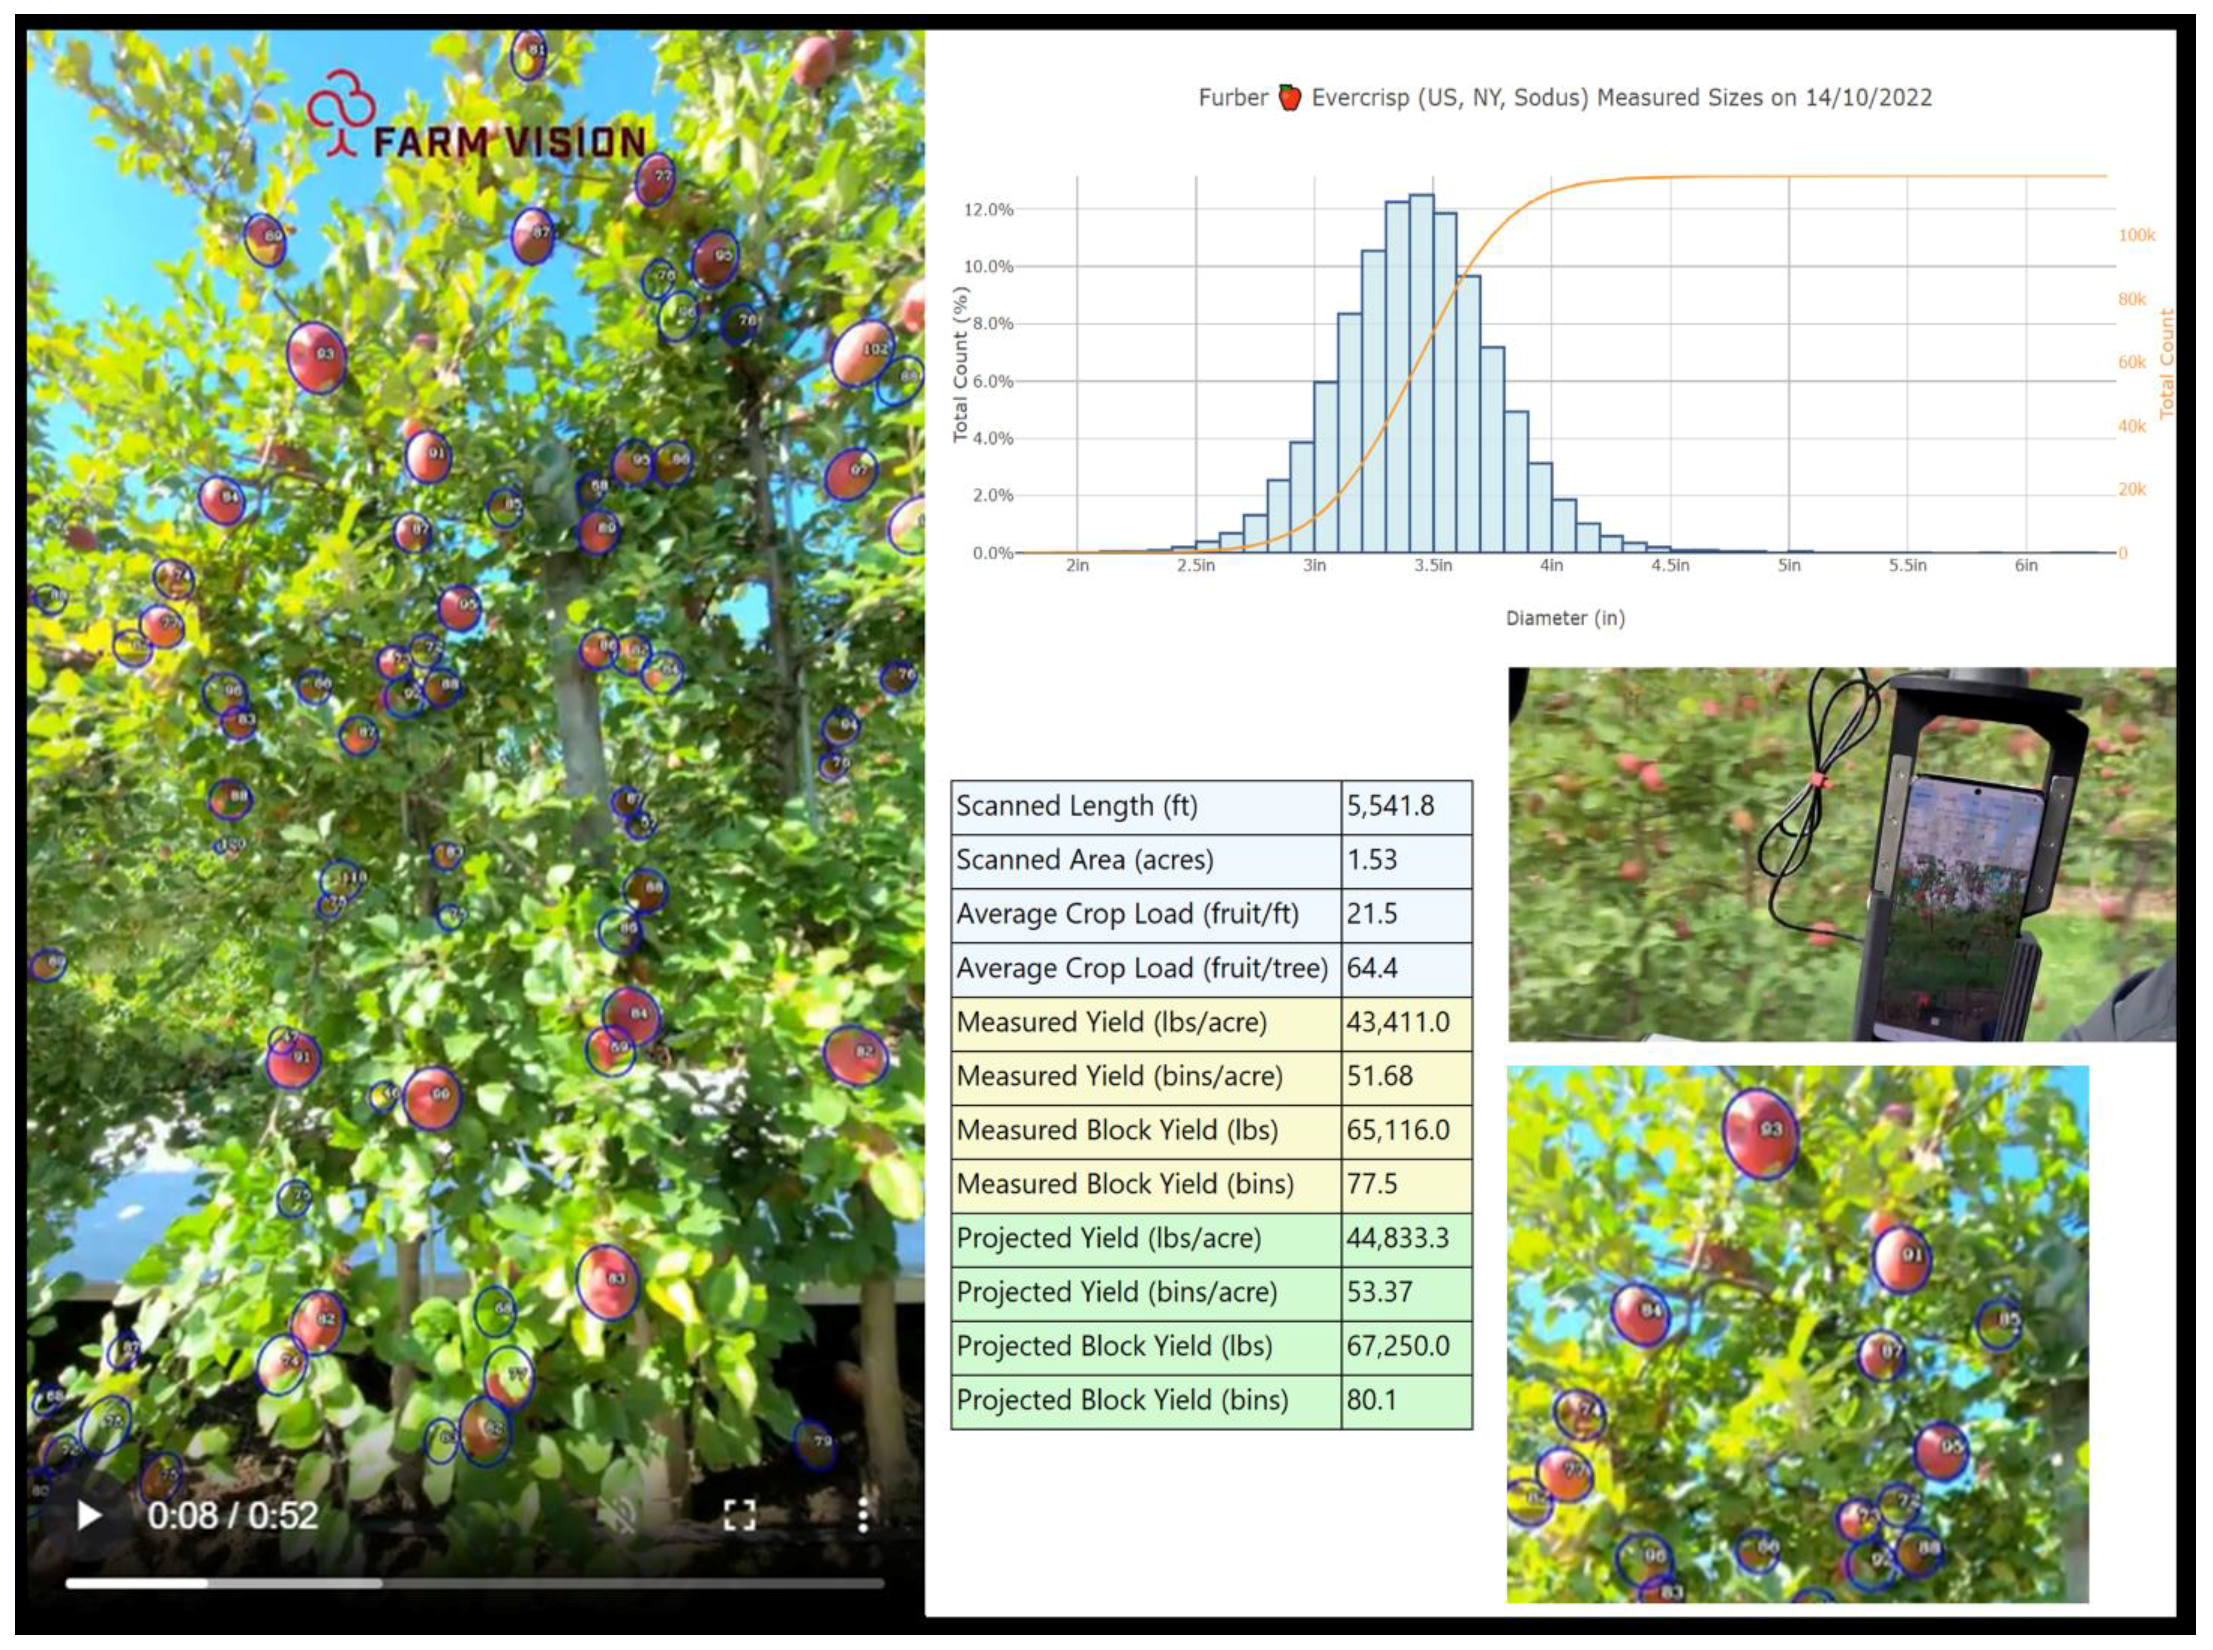
2.5. Yield Estimation
| Location | Cultivar | Rootstock | System | Spacing (m) |
|---|---|---|---|---|
| Michigan | ‘Honeycrisp’ | M.9 | Super Spindle | 0.6 × 3.4 |
| ‘Gala’ | G.11 | Super Spindle | 0.6 × 3.4 | |
| ‘Fuji’ | M.9 | Vertical Axe | 1.5 × 3.7 | |
| ‘Gala’ | M.9 | Tall Spindle | 1.2 × 3.7 | |
| New York | ‘Evercrisp’ | B.9 | Tall Spindle | 0.9 × 3.6 |
| ‘Fuji’ | B.9 | Tall Spindle | 0.6 × 3.4 | |
| ‘Gala’ | G.11 | Tall Spindle | 0.9 × 3.4 | |
| ‘Honeycrisp’ | M.9 | Tall Spindle | 0.9 × 3.4 | |
| North Carolina | ‘Gala’ | M.26 | Vertical Axis | 1.8 × 4.3 |
| ‘Honeycrisp’ | M.9 | Multi-leader | 1.8 × 4.3 | |
| ‘Granny Smith’ | B.9 | Tall Spindle | 0.9 × 3.7 |
2.6. Statistical Analysis
3. Results
3.1. Trunk Cross-Sectional Area
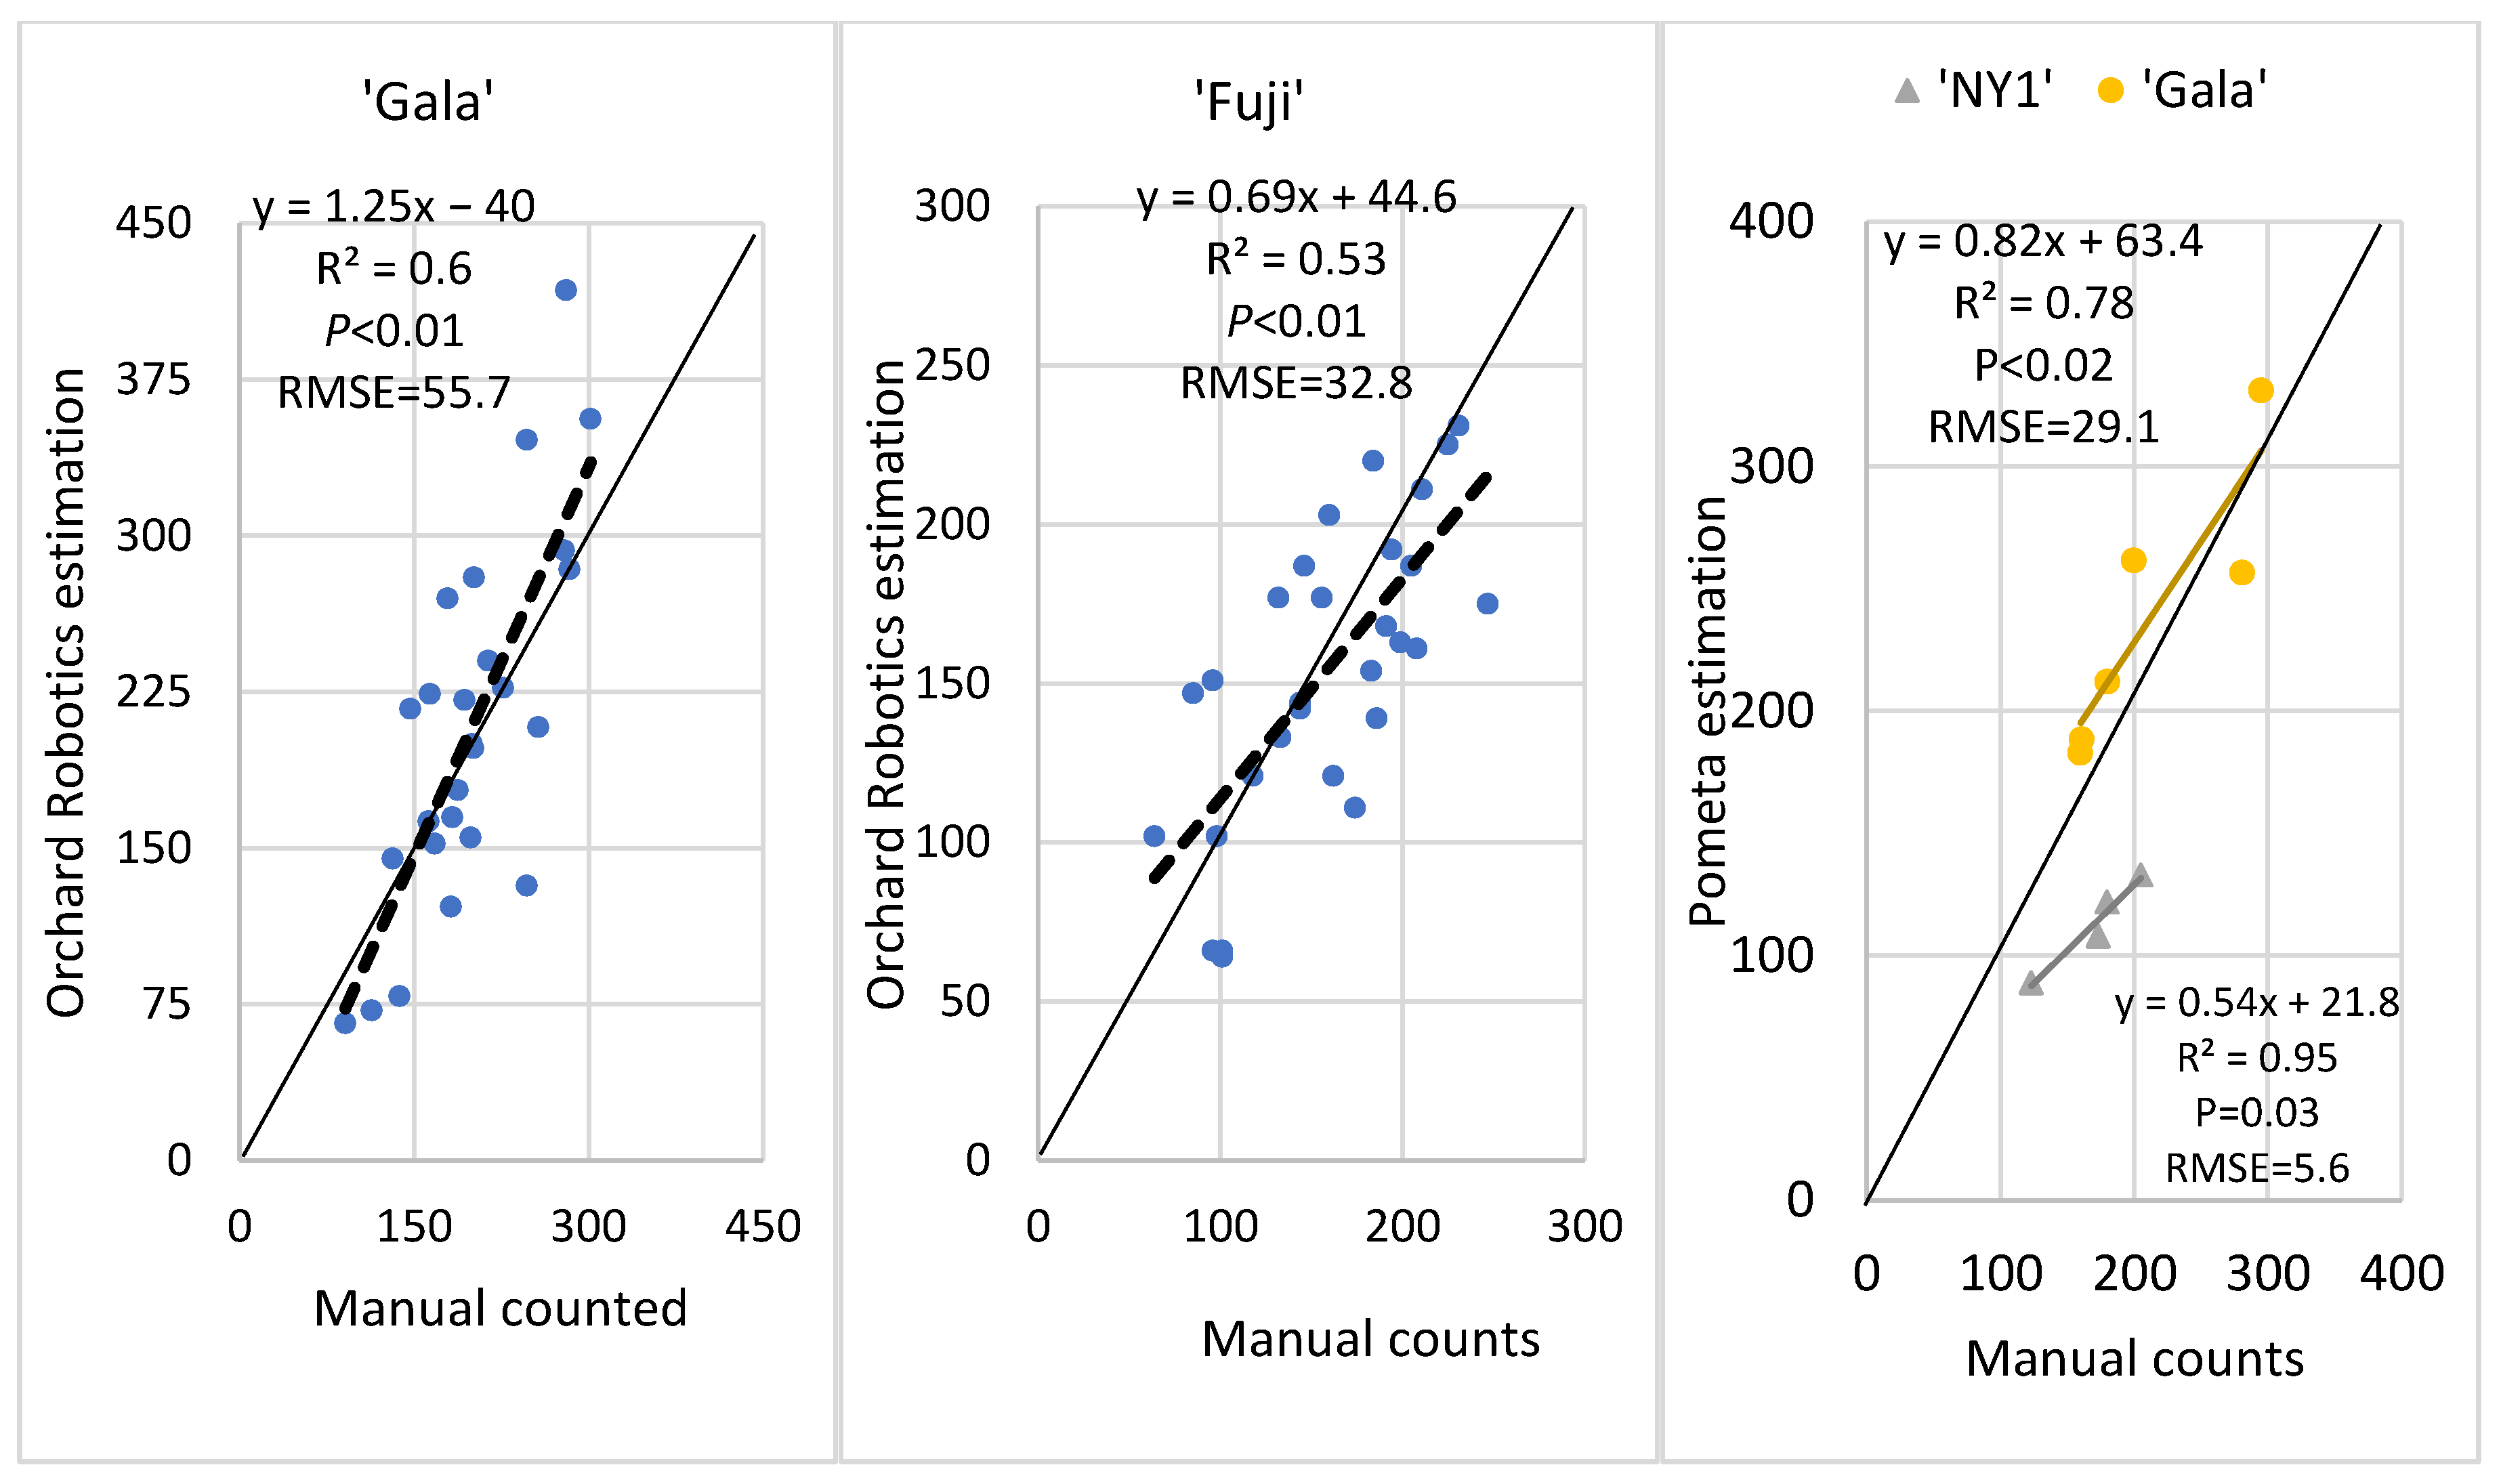
3.2. Blossom Counts
3.3. Thinning Efficacy
3.4. Yield Estimation
4. Discussion
5. Conclusions
Author Contributions
Funding
Data Availability Statement
Acknowledgments
Conflicts of Interest
References
- Robinson, T.L.; Gonzalez, L.; Cheng, L.; Ziang, Y.; Peck, G.; Arnoldussen, B.; Gomez, M.; Guerra, M.; Miranda Sazo, M.; Kahlke, C.; et al. Studies in precision crop load management of apple. Acta Hortic. 2023, 219–226. [Google Scholar] [CrossRef]
- Gonzalez, L.; Torres, E.; Àvila, G.; Bonany, J.; Alegre, S.; Carbó, J.; Martín, B.; Recasens, I.; Asin, L. Evaluation of chemical fruit thinning efficiency using Brevis® (Metamitron) on apple trees (‘Gala’) under Spanish conditions. Sci. Hortic. 2020, 261, 109003. [Google Scholar] [CrossRef]
- Gonzalez, L.; Torres, E.; Àvila, G.; Carbó, J.; Bonany, J.; Alegre, S.; Asin, L. Effect of thinning with metamitron, NAA, BA and naphthenic acids on apple (Malus domestica) trees. Plant Growth Regul. 2023. [Google Scholar] [CrossRef]
- Gonzalez, L.; Francescatto, P.; Lordan, J.; Robinson, T.L. Rate and timing of metamitron affect thinning efficacy of ‘Gala’ apple trees under American northeast conditions. Acta Hortic. 2022, 1344, 55–64. [Google Scholar] [CrossRef]
- Racskó, J. Crop load, fruit thinning and their effects on fruit quality of apple (Malus domestica Borkh.). Acta Agrar. Debreceniensis 2006, 29–35. [Google Scholar] [CrossRef]
- Wünsche, J.N.; Greer, D.H.; Laing, W.A.; Palmer, J.W. Physiological and biochemical leaf and tree responses to crop load in apple. Tree Physiol. 2005, 25, 1253–1263. [Google Scholar] [CrossRef]
- Verma, P.; Sharma, S.; Sharma, N.; Chauhan, N. Review on crop load management in apple (Malus × domestica Borkh.). J. Hortic. Sci. Biotechnol. 2023, 98, 299–321. [Google Scholar] [CrossRef]
- Ahmed, D.; Sapkota, R.; Churuvija, M.; Karkee, M. Machine Vision-Based Crop-Load Estimation Using YOLOv8. arXiv 2023, arXiv:2304.13282. [Google Scholar]
- Anthony, B.; Serra, S.; Musacchi, S. Optimizing Crop Load for New Apple Cultivar: “WA38”. Agronomy 2019, 9, 107. [Google Scholar] [CrossRef]
- Jung, S.-K.; Ryu, H.-U.; Gu, M.; Choi, H.-S.; Ryu, J.-H.; Cho, Y.-K. Growth and fruit production in young ‘Fuji’apple trees as affected by time of downward bending of branches. J. Hortic. Sci. Biotechnol. 2012, 87, 519–523. [Google Scholar] [CrossRef]
- Wang, T.; Sankari, P.; Brown, J.; Paudel, A.; He, L.; Karkee, M.; Thompson, A.; Grimm, C.; Davidson, J.; Todorovic, S. Automatic Estimation of Trunk cross Sectional Area Using Deep Learning; Collaborative Robotics & Intelligent Systems Institute, Oregon State University: Corvallis, OR, USA, 2023. [Google Scholar] [CrossRef]
- Bargoti, S.; Underwood, J.P.; Nieto, J.I.; Sukkarieh, S. A pipeline for trunk localisation using LiDAR in trellis structured orchards. In Field and Service Robotics, Proceedings of the 9th International Conference on Field and Service Robotics FSR, Brisbane, Australia, 9–11 December 2013; Springer: Berlin/Heidelberg, Germany, 2015; pp. 455–468. [Google Scholar]
- Robinson, T.; Lakso, A.; Greene, D.; Hoying, S. Precision crop load management. N. Y. Fruit Q. 2013, 21, 445–468. [Google Scholar]
- Allen, W.C.; Kon, T.; Sherif, S.M. Evaluation of Blossom Thinning Spray Timing Strategies in Apple. Horticulturae 2021, 7, 308. [Google Scholar] [CrossRef]
- Dennis, F.G. The history of fruit thinning. Plant Growth Regul. 2000, 31, 1–16. [Google Scholar] [CrossRef]
- Yoder, K.; Peck, G.; Combs, L.D.; Byers, R.E. Using a Pollen Tube Growth Model to Improve Apple Bloom Thinning for Organic Production. Acta Hortic. 2013, 1001, 207–214. [Google Scholar] [CrossRef]
- Peck, G.M.; Combs, L.D.; DeLong, C.; Yoder, K.S. Precision apple flower thinning using organically approved chemicals. Acta Hortic. 2016, 1137, 47–52. [Google Scholar] [CrossRef]
- Lakso, A.; Robinson, T. Decision support for apple thinning based on carbon balance modeling. Acta Hortic. 2015, 1068, 235–242. [Google Scholar] [CrossRef]
- Greene, D.W.; Lakso, A.N.; Robinson, T.L.; Schwallier, P. Development of a Fruitlet Growth Model to Predict Thinner Response on Apples. Hortscience 2013, 48, 584–587. [Google Scholar] [CrossRef]
- Janowski, A.; Kaźmierczak, R.; Kowalczyk, C.; Szulwic, J. Detecting Apples in the Wild: Potential for Harvest Quantity Estimation. Sustainability 2021, 13, 8054. [Google Scholar] [CrossRef]
- Mavridou, E.; Vrochidou, E.; Papakostas, G.; Pachidis, T.; Kaburlasos, V. Machine Vision Systems in Precision Agriculture for Crop Farming. J. Imaging 2019, 5, 89. [Google Scholar] [CrossRef] [PubMed]
- Wallis, A.; Clements, J.; Sazo, M.M.; Kahlke, C.; Lewis, K.; Kon, T.; Gonzalez, L.; Jiang, Y.; Robinson, T. Digital Technologies for Precision Apple Crop Load Management (PACMAN) Part I: Experiences with Tools for Predicting Fruit Set Based on the Fruit Growth Rate Model. N. Y. Fruit Q. 2023, 31, 8–13. [Google Scholar]
- Blanco, V.; Willsea, N.; Campbell, T.; Howe, O.; Kalcsits, L. Combining thermal imaging and soil water content sensors to assess tree water status in pear trees. Front. Plant Sci. 2023, 14, 1197437. [Google Scholar] [CrossRef]
- Gonzalez Nieto, L.; Huber, A.; Gao, R.; Biasuz, E.C.; Cheng, L.; Stroock, A.D.; Lakso, A.N.; Robinson, T.L. Trunk Water Potential Measured with Microtensiometers for Managing Water Stress in “Gala” Apple Trees. Plants 2023, 12, 1912. [Google Scholar] [CrossRef] [PubMed]
- Lombard, P.; Callan, N.W.; Dennis, F.; Looney, N.; Martin, G.; Renquist, A.; Mielke, E. Towards a standardized nomenclature, procedures, values, and units in determining fruit and nut tree yield performance. Hortscience 1988, 23, 813–817. [Google Scholar] [CrossRef]
- Schupp, J.R.; Winzeler, H.E.; Kon, T.M.; Marini, R.P.; Baugher, T.A.; Kime, L.F.; Schupp, M.A. A method for quantifying whole-tree pruning severity in mature tall spindle apple plantings. Hortscience 2017, 52, 1233–1240. [Google Scholar] [CrossRef]
- Serra, S.; Leisso, R.; Giordani, L.; Kalcsits, L.; Musacchi, S. Crop load influences fruit quality, nutritional balance, and return bloom in ‘Honeycrisp’apple. Hortscience 2016, 51, 236–244. [Google Scholar] [CrossRef]
- Lepsis, J.; Blanke, M. The trunk cross-section area as a basis for fruit yield modelling in intensive apple orchards. Acta Hortic. 2004, 707, 231–235. [Google Scholar] [CrossRef]
- Scalisi, A.; McClymont, L.; Underwood, J.; Morton, P.; Scheding, S.; Goodwin, I. Reliability of a commercial platform for estimating flower cluster and fruit number, yield, tree geometry and light interception in apple trees under different rootstocks and row orientations. Comput. Electron. Agric. 2021, 191, 106519. [Google Scholar] [CrossRef]
- Yuan, W.; Hua, W.; Heinemann, P.H.; He, L. UAV Photogrammetry-Based Apple Orchard Blossom Density Estimation and Mapping. Horticulturae 2023, 9, 266. [Google Scholar] [CrossRef]
- Penzel, M.; Pflanz, M.; Gebbers, R.; Zude-Sasse, M. Tree-adapted mechanical flower thinning prevents yield loss caused by over-thinning of trees with low flower set in apple. Eur. J. Hortic. Sci. 2021, 86, 88–98. [Google Scholar] [CrossRef]
- Penzel, M.; Kröling, C. Thinning efficacy of metamitron on young “RoHo 3615” (Evelina®) apple. Sci. Hortic. 2020, 272, 109586. [Google Scholar] [CrossRef]
- Costa, G.; Botton, A.; Vizzotto, G. Fruit thinning: Advances and trends. Hortic. Rev. 2018, 46, 185–226. [Google Scholar] [CrossRef]
- McArtney, S.; Obermiller, J. Evaluation of a model to predict the response of “Gala” apples to chemical thinners. Acta Hortic. 2010, 884, 581–586. [Google Scholar] [CrossRef]
- Rufato, A.; Robinson, T.; Rufato, L. Precision thinning of “Royal Gala” apple trees using the fruit growth model. Acta Hortic. 2017, 1177, 399–404. [Google Scholar] [CrossRef]
- Lordan, J.; Reginato, G.H.; Lakso, A.N.; Francescatto, P.; Robinson, T.L. Natural fruitlet abscission as related to apple tree carbon balance estimated with the MaluSim model. Sci. Hortic. 2019, 247, 296–309. [Google Scholar] [CrossRef]
- Qian, J.; Xing, B.; Wu, X.; Chen, M.; Wang, Y.a. A smartphone-based apple yield estimation application using imaging features and the ANN method in mature period. Sci. Agric. 2018, 75, 273–280. [Google Scholar] [CrossRef]
- Wang, Q.; Nuske, S.; Bergerman, M.; Singh, S. Automated Crop Yield Estimation for Apple Orchards. In Experimental Robotics, Proceedings of the the 13th International Symposium on Experimental Robotics, Québec City, QC, Canada, 18–21 June 2012; Springer: Berlin/Heidelberg, Germany, 2013; pp. 745–758. [Google Scholar] [CrossRef]
- Penzel, M.; Tsoulias, N. Annual shoot growth on apple trees with variable canopy leaf area and crop load in response to LiDAR scanned leaf area to fruit ratio. Int. Agrophysics 2022, 36, 173–180. [Google Scholar] [CrossRef]


Disclaimer/Publisher’s Note: The statements, opinions and data contained in all publications are solely those of the individual author(s) and contributor(s) and not of MDPI and/or the editor(s). MDPI and/or the editor(s) disclaim responsibility for any injury to people or property resulting from any ideas, methods, instructions or products referred to in the content. |
© 2023 by the authors. Licensee MDPI, Basel, Switzerland. This article is an open access article distributed under the terms and conditions of the Creative Commons Attribution (CC BY) license (https://creativecommons.org/licenses/by/4.0/).
Share and Cite
Gonzalez Nieto, L.; Wallis, A.; Clements, J.; Miranda Sazo, M.; Kahlke, C.; Kon, T.M.; Robinson, T.L. Evaluation of Computer Vision Systems and Applications to Estimate Trunk Cross-Sectional Area, Flower Cluster Number, Thinning Efficacy and Yield of Apple. Horticulturae 2023, 9, 880. https://doi.org/10.3390/horticulturae9080880
Gonzalez Nieto L, Wallis A, Clements J, Miranda Sazo M, Kahlke C, Kon TM, Robinson TL. Evaluation of Computer Vision Systems and Applications to Estimate Trunk Cross-Sectional Area, Flower Cluster Number, Thinning Efficacy and Yield of Apple. Horticulturae. 2023; 9(8):880. https://doi.org/10.3390/horticulturae9080880
Chicago/Turabian StyleGonzalez Nieto, Luis, Anna Wallis, Jon Clements, Mario Miranda Sazo, Craig Kahlke, Thomas M. Kon, and Terence L. Robinson. 2023. "Evaluation of Computer Vision Systems and Applications to Estimate Trunk Cross-Sectional Area, Flower Cluster Number, Thinning Efficacy and Yield of Apple" Horticulturae 9, no. 8: 880. https://doi.org/10.3390/horticulturae9080880
APA StyleGonzalez Nieto, L., Wallis, A., Clements, J., Miranda Sazo, M., Kahlke, C., Kon, T. M., & Robinson, T. L. (2023). Evaluation of Computer Vision Systems and Applications to Estimate Trunk Cross-Sectional Area, Flower Cluster Number, Thinning Efficacy and Yield of Apple. Horticulturae, 9(8), 880. https://doi.org/10.3390/horticulturae9080880