Article

Comparative Study of Different Crassulaceae Species for Their Potential Use as Plant Covers to Improve Thermal Performance of Green Roofs

by
Gonzalo Gurrea-Ysasi
,
Vicente Blanca-Giménez
,
Pascual Fernández de Córdova
,
Carles Cortés-Olmos
,
Adrián Rodríguez-Burruezo
and
Inmaculada C. Fita
*
Instituto Universitario de Conservación y Mejora de la Agrodiversidad Valenciana (COMAV), Universitat Politècnica de València (UPV), 46022 València, Spain
*
Author to whom correspondence should be addressed.
Horticulturae 2022, 8(9), 846; https://doi.org/10.3390/horticulturae8090846
Submission received: 25 July 2022 / Revised: 25 August 2022 / Accepted: 29 August 2022 / Published: 14 September 2022

Abstract

:
The presence of green roofs in urban areas improves the energy efficiency of buildings; contributes to the capture of CO2, decreasing pollution; and improves the appearance of cities, increasing their sustainability. Additionally, green roofs must include plant species with low requirements and maintenance, and thus, succulent species could be useful in Mediterranean semi-arid regions. In this work, the thermal inertia and the effect of different succulent species as thermal barriers on mitigating the increase in temperature inside experimental compartments were studied in comparison to conventional covers used in the Spanish Mediterranean for a whole year. In general, green covers were more efficient than conventional ones for controlling temperature. Thus, temperatures under green covers were up to 8 °C lower than conventional covers and 3–5 °C lower than the ambient temperature at noon on summer days. Furthermore, significant differences were found between green covers. Thus, despite having high thermal inertia, Aptenia cordifolia showed the worst temperature records, while Aeonium arboreum was the most efficient at mitigating temperature changes both on cold winter nights and hot summer days—even better than Sedum spp., a usual succulent used commercially. Our results demonstrate that succulent species are efficient materials to use as green covers to improve thermal conditions in buildings in Mediterranean cities. This also suggests that the mixture of succulent species (i.e., not only made of Sedum spp.) with different colors and textures could beautify green roofs without compromising their energy efficiency.

1. Introduction

Green roofs on buildings have been used for a long time. However, due to the large increase in energy demand in urban centers (especially in buildings which are responsible for more than 40% of the total energy consumption in cities), green roofs have become essential structures for mitigating the effects of overheating and pollution as a way to face climate change [1].
Beneficial effects of using green roofs in buildings as an alternative to conventional roofs are: (a) thermal insulation: green roofs can exert a regulating effect on temperature and humidity within buildings due to the thermal inertia that they provide. This involves an improvement in thermal comfort in both the winter season (due to the barrier effect of the roof limiting heat losses) and the summer season (preserving coolness inside regardless of the high solar radiation) [2,3,4,5,6]; (b) reduction of pollution by capturing CO2 [7,8]; (c) reduction of the heat island effect in cities as the presence of green roofs contributes to reducing this effect caused by the density of buildings, the use of air conditioning, and traffic—among other causes—and which may increase the average city temperature by up to 10 degrees [9,10,11]; (d) reduction in energy consumption by decreasing the needs of air conditioning in summer and heating in winter, i.e., following the recommendations to achieve the Zero Consumption Building objective [12,13]; (e) structural protection: green roofs contribute to protecting the waterproof layer against the damaging effect of external agents [14]; (f) decrease in noise pollution, i.e., in addition to the hygroscopic comfort associated to these covers, they can also limit noise, especially low frequency (up to 40 dB) noise [15,16]; and (g) visual impact, i.e., the beneficial psychosocial effects of the presence of green spaces in terms of reduction in stress, blood pressure, and/or negative thoughts [17,18,19].
Some studies have reported the effect of green roofs on mitigating temperatures in summer [20]. However, the beneficial effect of green roofs should be studied and extended to other seasons, because otherwise, it is very difficult to extrapolate the data observed in one season to the rest of the year. Moreover, knowledge on the ability of different plant species to mitigate thermal flow is quite limited.
In this regard, the plant species with potential use for green covers must be chosen with care and must fit several requirements: (i) adaptation to the climatic conditions of the region (e.g., sunlight intensity, rainfall regimes); (ii) low management and conservation requirements; (iii) long life; (iv) ability to grow and cover surfaces, but with limited biomass (and weight); and (v) small non-invasive root systems. In the case of dry Mediterranean climates, Crassulaceae species appear to be the most suitable, mainly due to their ability as CAM plants to store water in their vegetative structures and, therefore, having high water use efficiency and adaptation to drought periods while preserving remarkable biomass covering [21,22].
Therefore, the present work pioneers the comparative evaluation of the behavior of several Crassulaceae plant species with non-invasive root systems as part of green roof covers in terms of temperature. To our knowledge, this is the first study aimed at comprehensively evaluating 24 h a day for a whole year comprising conditions that varied from the maximum temperatures and solar irradiation of the summer to the minimum temperatures and solar irradiation of winter in the Mediterranean region.

2. Materials and Methods

2.1. Description of Experimental Structures

To evaluate the effects of different Crassulaceae species as thermal barriers, experimental structures reproducing a building model were prepared (Figure 1). Based on Euro-pallets (120 mm high, 1220 × 800 mm length × width/front), three articulated rectangular wooden bodies (250 mm high each) were placed (Figure 1a). The resulting inner space was divided down the middle into two halves by placing a wooden panel (15 mm thick) to reproduce two attached buildings (750 × 610 × 800 mm high × length × front) (Figure 1b). Two doors were prepared on each front side of the structure to facilitate access to the interior space, where measurement sensors were placed (Figure 1c). Furthermore, all the inner wood surfaces were covered with 40 mm of expanded polystyrene insulation (Figure 1d), with the only exception of the top, where a 20 mm wooden panel (without expanded polystyrene) was placed to serve as support for (i) the experimental roofs and (ii) the sensors inside the cabin (Figure 1e).
Therefore, four structures composed of two attached compartments each were prepared for the experiment, enabling a total of eight interior spaces covered with different experimental roofs, whose dimensions were 610 × 400 mm each. In this way, the cover was the only construction system that differed among the studied cubicles. Additionally, we sought to ensure the entry of heat through the upper part (i.e., coverings), minimizing the possibility of heating through the rest of the surfaces, including the lower one, which also shaded the floor and had natural ventilation thanks to its 120 mm elevation with Euro-pallets.

2.2. Experimental Covers

In order to carry out the experiment, several plant species (Crassulaceae) were chosen because of their potential as plant covers: low invasive root systems (to limit degradation of lower layers of the roof), good vegetative reproduction, and low nutrient-water requirements. Therefore, all of them were succulent perennial plants with a good response to Mediterranean climate and easy management. Specifically, the species evaluated were: (i) Aptenia cordifolia (Piteralandia nursery, Picanya, Valencia, Spain), suitable for covering walls, rockery, and bare areas of grass for their ease of growth, and highly adaptation to full sun exposure; (ii) Aeonium arboreum (Piteralandia nursery, Picanya, Valencia, Spain), characterized by bare stems bearing leaf rosettes at the apex, providing the plant a very pleasant visual effect, fairly heat resistant, which needs a good amount of sun. Its name comes from the fact that it takes the appearance of a small tree (arboreum = three-shaped in Latin); and (iii) commercial Sedum spp. (kindly provided by Sempergreen Spain, Constantí, Tarragona, Spain), currently used as the most common material for green roofs due to its adaptation to drought, the ability to store water in their fleshy leaves, the ability of reproduction by cuttings, seeds, or leaves, as well as its ornamental value due to flowering and color change in winter.
Two types of conventional covers were used as controls, reproducing the main alternative roofs used traditionally in the Valencian area: (i) gravel: 40 mm-thick coverage with coarse gravel (13 mm diameter, Leroy Merlin, Valencia, Spain) and (ii) red-polymer: AXTON red acrylic polymer waterproof coating with fibers (Leroy Merlin, Valencia, Spain) (Figure 2).
In all cases, green covers and controls were displayed on white growing trays as terraces, which were supported on the 20 mm wooden panel at the top of the experimental structures. In the case of green covers, a 20 mm layer of growing substrate and sand was used as support of the plants. The trays were perforated following a 50 × 50 mm pattern to provide good drainage for root development, reproducing green roofs as realistic as possible. These green covers were watered once a month, with the only exception of May and the summer season, when irrigation was increased twice a month. This minimum irrigation was enough to ensure good vegetative conditions of these species while also avoiding the accumulation of water in the substrate. All the measurements analyzed in this work correspond to, at least, two days after irrigation to avoid any bias due to humidity.

2.3. Equipment and Measurements

Temperature and relative humidity (RH) within each interior space were recorded with thermo-hygrometric TESTO 174H sensors/data-loggers (TESTO, Barcelona, Spain). The humidity sensor achieves an accuracy of up to ±3% RH during the measurement of ambient humidity. The internal NTC temperature sensor has an accuracy of ±0.5 °C, and covers a measurement range of −20 to +70 °C. Each sensor was placed in the center of the wooden top hanging 5 cm (Figure 1e). In addition, another sensor was placed outside in order to record variations in the ambient temperature.
Measurements on each interior space and the control/ambient were recorded by the data-loggers every 15 min throughout a year, from 1 September 2017 to 31 August 2018.

2.4. Experimental Design

Two repetitions of each cover were prepared and combined in pairs on eight attached structures with two isolated cabins each. Conventional covers and green covers were on separated structures, and they were distributed in pairs as follows: (a) gravel and red-polymer, (b) Aeonium and Aptenia, (c) Aeonium and Sedum, and (d) Sedum and Aptenia (Figure 2).
Average values measured every 15 min of each green cover (n = 2 repetitions) were computed. Then, in order to simplify statistical treatment and presentation of results, the 15 min-average data corresponding to each cover were grouped into twelve 2 h periods, from 0:00 h to 23:50 h. These values were averaged from eight measurements in every period. Finally, five days per month were chosen as the closest in temperature to the average daily temperature of the corresponding month recorded by the official meteo station of Valencia, Parque de Viveros and, therefore, representative of the month. This approach eliminates extreme unrepresentative days of each month (e.g., cloudy or rainy days).

2.5. Thermophysical Properties

Thermal diffusivity (α (m2/s)) is the ratio between the conducted and the stored heat in a cover [23]. Therefore, this parameter considers the capability to conduct thermal energy through a material (thermal conductivity, k (W/(m·K)) and the ability to store thermal energy in it, which depends on the density of the material ( ρ (kg/m3)) and its specific heat capacity (Cp (J/(kg·K))
α = k ρ · C p
Thermal diffusivity is a physical property that explains the ability of a material to conduct heat relative to its capacity to store thermal energy. Conductivity, density, and specific heat capacity are shown in Table 1. These data are reported in “Código Técnico de la Edificación” for polymer and gravel [24], and by Olivieri et al. for green covers [25]. Diffusivity increased in the following order: polymer, gravel, and green cover.

2.6. Dynamic Thermal Parameters

Dynamic thermal properties of green roofs compared to conventional roofs were measured by means of decrement factor and time lag. The decrement factor (f (-)) is defined as the ratio between the difference of maximum and minimum temperature in the interior spaces (Ti,max, Ti,min), compared with the difference calculated in the ambient temperatures (Ta,max, Ta,min) (Equation (1)). The time lag (Ø (h)) is defined as the time comprised between the maximum temperatures reached in the interior spaces ( t T i , max ) with respect to the reference of the ambient ( t T a , max ) (Equation (2)) [26].
f = T i , max T i , min T a , max T a , min
= t T i , max t T a , max

2.7. Statistics

Values of temperature were processed statistically using Statgraphics Centurion XVI (18.1.13 ver., Statgraphics Technologies, The Plains, VA, USA). Average temperatures for each combination of month × cover (or ambient) were estimated every 2 h-period (for the 5 selected days, n = 5), and significant differences among covers for each 2 h period were assessed by analysis of variance and the least significant difference test (LSD, p < 0.05).

3. Results and Discussion

3.1. Thermal Analysis

Figure 3 shows the distribution of ambient average temperature and average relative humidity in our trial in Valencia throughout a day (mean values, n = 5 representative days, every 15 min), over a 12-month period evaluated from September 2017 to August 2018. According to these records, August, July, and June exhibited higher temperatures than the rest of the months, being August the most critical month of the summer in terms of thermal comfort conditions because of its higher relative humidity, in comparison to July and June. In these months, temperature exceeded 30 °C from 11:00 in the morning to 19:30 in the afternoon. Nevertheless, other months also recorded relatively high temperatures, such as September and October, when temperature was higher than 25 °C during several hours around noon (Figure 3). Moreover, temperatures in May were similar to September and October, so it can be, as well, interesting measurements to take into consideration in the study of the effect of green roofs during these months. Finally, winter at the Mediterranean coast of Spain is usually mild and, as an example, our sensors recorded average minimum temperatures ≥ 5 °C at night and near 15 °C around noon in December or February.
Moreover, our records show a remarkable increase in temperature correlated to a sharp decrease in relative humidity, in the interval between 7:00 and 11:00 in most months. The beginning of such changes depended on the sunrise of the corresponding month, earlier in summer and later in winter.
Figure 4 shows the evolution of temperatures along the day (every 15 min, n = 5 representative days) of each month in the different covers. Data were arranged following the temporary sequence of the experiment and months were grouped by seasons. In general, regardless of the season, the lowest temperatures were registered early in the morning, from 6:00 to 8:30, and the highest temperatures in the middle hours of the day, around noon, between 11:00 and 16:00, with a period of high temperatures in cold months shorter than that observed in mild and warm months.
Our data indicate that temperatures under conventional covers were lower than ambient temperatures during night hours, particularly in autumn and winter (Figure 4a,b). However, temperatures were higher than those recorded in the ambient in the middle hours of the day, especially from May to September (Figure 4c,d). The impact on low temperatures at night under these conventional covers could be explained by thermal inversion (colder temperatures near the ground and higher temperatures at higher altitudes), which is due to the loss of infrared radiation (IR) towards the atmosphere. This phenomenon is exacerbated with clear sky and the lack of ventilation [27,28]. Likewise, overheating found in these experimental structures can be explained by null ventilation inside the space under the evaluated covers. These effects were also detected in the green roofs but at a lesser extent, showing an improvement of their performance.
In every month, the increase in temperature was first observed around the sunrise in the ambient sensor (positive slope), followed by the red-polymer with the highest slope and maximum temperatures among all the studied covers. Gravel cover, with both lower slope and maximum temperature, lags behind red-polymer. Finally, Aptenia showed the highest slope and maximum temperatures among the green covers, followed by Sedum and Aeonium in most months of the year.
At first sight, these data seem do not agree with those of diffusivity (Table 1). Nevertheless, they agree with the time needed by the cover materials to reach a steady state for the gradient of temperature between the external and the internal sides of the roof (time constant, tc). This characteristic time (tc) is calculated by the relationship between thermal diffusivity (α) and the thickness of the material (L) as follows:
t c = L 2 α
Thus, considering the thickness (L) of cover materials for both conventional covers: L = 1 mm for red-polymer and L = 40 mm for gravel, time constant is smaller for red-polymer (tc = 3.5–8 s) than for gravel (tc = 2077 s). This is in agreement with the lag and the slower rate of change in temperature (lower slope) observed in gravel with respect to red-polymer in the period (8–12 h), every season throughout the year (Figure 4).
Regarding green covers, thickness depends on the species. Thus, Aeonium plants are taller than Aptenia and Sedum (L = 15 cm vs. 6 cm). Thus, considering the same thermophysical properties for all green covers (Table 1), the estimated time constant is tc = 16,071 s for Aeonium and and tc = 2571 s for Aptenia/Sedum, respectively. As a result of this analysis, Aptenia and Sedum showed tc values near gravel, and Aeonium appeared as the slowest cover of all (the highest tc), which agrees with its slower rate of change in temperature (less pronounced slope) observed, particularly, in spring and summer in the central hours of the day (Figure 4c,d).
Finally, in comparison with green covers, the maximum temperatures reached under conventional roofs were considerably higher (i.e., May to August), with the only exception of Aptenia, which registered similar or even higher temperatures than gravel in some months (October to April). Even more, Aeonium showed the lowest time constant, slope, and maximum temperature among all the roofs from February to August. Our findings agree with other experiments with reported better energy performance of green roofs against conventional roofs [29,30,31] or even differences among different plant coverings [32].

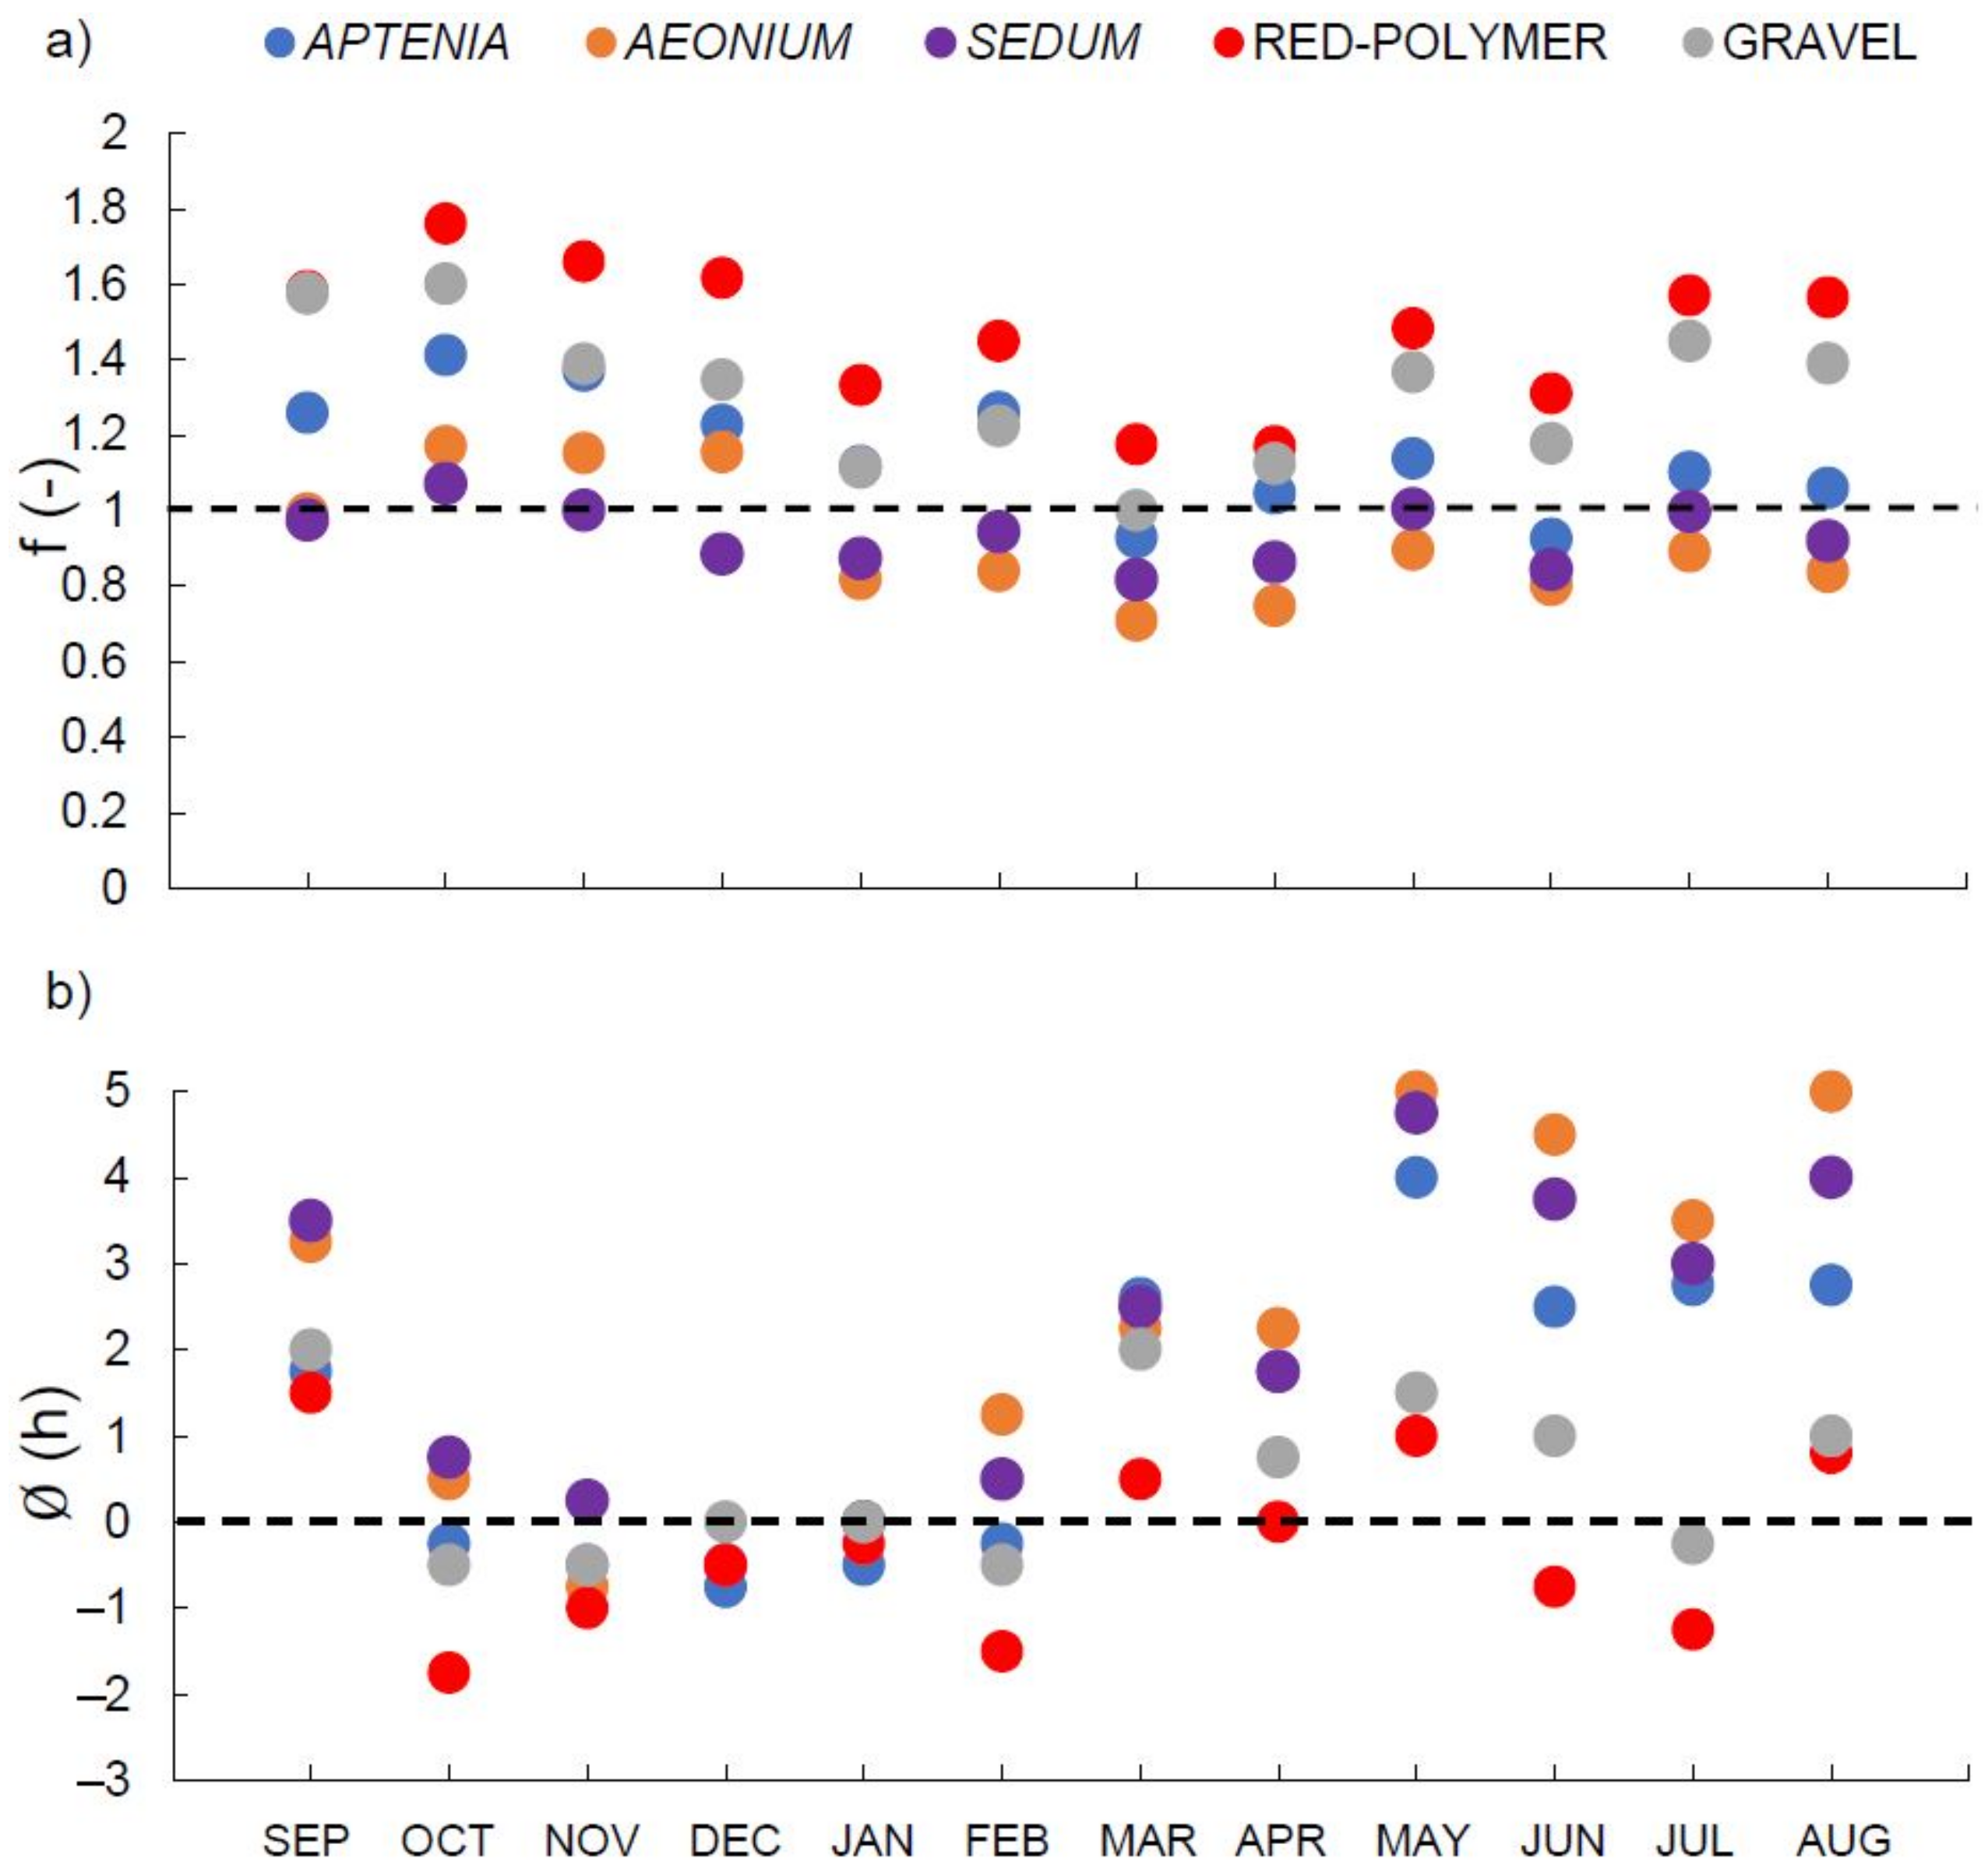
3.2. Dynamic Characterization of Temperature

Heat transfer from the ambient to the interior space of each compartment depends on the cover and can be represented by dynamic parameters. To assess these dynamic thermal properties of green covers in comparison to conventional covers, the heat storage capacity, expressed in terms of decrement factor (f) and time lag (Ø), was estimated and is shown in Figure 5. The higher the heat storage capacity, the better the cover, which is related with a decrement factor lower than 1 and a time lag higher than 0, which are the control values referred to the ambient.
Decrement factor was <1 only in Aeonium and Sedum covers in most of the year, and at a lesser extent Aptenia in March and June, which indicates that the maximum change of temperature under these green covers was lower than the increase of ambient temperature (Figure 5a). By contrast, these results show that conventional covers experienced higher changes in temperature than ambient, providing worse temperature conditions in their compartments than those obtained under green covers throughout the year. Therefore, green covers showed a high efficiency on mitigating the increase in temperature, with Aeonium showing the best performance among all the studied roofs.
Differences in time lag were lower in the coldest months (e.g., December and January) than in the hottest months (e.g., June and July) (Figure 5b). Red-polymer showed the lowest values in most cases, which indicates that their maximum temperatures were reached much faster than the ambient. Differences in this parameter between conventional and green covers were particularly remarkable from April to August. Thus, time lag was, in general, higher in Aeonium, followed by Sedum and Aptenia and, finally, by gravel and red polymer (Figure 5b), confirming the good performance of Aeonium in comparison to the rest of the covers.
Our results on dynamic performance of the covers mostly agree with those from Bevilacqua et al. [26] based on realistic proofs on building roofs. Thus, these authors reported better thermal dynamic performance of green roofs against conventional black bituminous roofs in different seasons of the year, particularly in summer. Moreover, they found considerable differences in time lag values for different green roof solutions, ranging from 3.1 to 4.8 h, while the values for our experimental green coverings were comprised between 2 and 5 h in warm months (from March to August) (Figure 5b). Therefore, in summer, the ability of Aeonium reducing temperature changes is confirmed by the results of this analysis, with the lowest decrement factor and the highest lag time. Sedum had close values, but not as satisfactory as Aeonium. Finally, Aptenia had better results than conventional covers but comparatively worse than Aeonium and Sedum.

3.3. Descriptive Statistics

In this section, differences in temperature among conventional and green experimental covers are explained statistically, considering the average values every 2 h periods and the ambient temperature as a reference.

3.3.1. Autumn

Autumn is a mild season in the Mediterranean climate, although temperatures can be still high in the central hours of the day, particularly in September, and even, depending on the year, in October [33]. During the experiment, in both months the lowest average temperatures were recorded in the 6–8 h period, i.e., last period of the night (19.8 °C in September, 16.9 °C in October), while the highest temperatures were found in the periods comprised between 10 h and 16 h (28.2–29.3 °C in September and 24.2–27.0 °C in October) (Table 2). From 16 h on, temperatures decreased gradually, with the decrease of IR radiation, to temperatures about 20–22 °C during the night. In comparison, and as expected, November was a colder month, with temperatures comprised between 8.7 and 10.7 °C in the early morning (0–8 h), maximum temperatures ranging 17.3–18.8 °C in the periods from 10 h to 16 h, and remarkable decrease after sunset (18–20 h period) (Table 2).
In this season, average differences in temperature between the ambient and the experimental roofs were significant in many periods of the day. Thus, average temperatures under the conventional roofs were slightly lower than those recorded at the ambient in the early morning hours (4–8 h): 18.2–19.2 °C in September, 15–16.5 °C in October, and 6–7.3 °C in November (Table 2), being temperatures of gravel covers slightly higher than red-polymer.
In September and October, the period 10–12 h, when the ambient temperature increased remarkably, red-polymer and particularly gravel provided considerably lower temperatures, i.e., 2 °C and 4 °C less, respectively. However, temperatures at the periods comprised between 12 h and 18 h were higher than the ambient under these conventional covers, with red-polymer reaching the highest values (32–33 °C, 5–6 °C higher than ambient), followed by gravel (29–33 °C, 2–5 °C higher) (Table 2). From that time on, conventional roofs showed temperatures similar to those of the ambient (i.e., about 20–22 °C).
By contrast, temperatures in November under conventional roofs were similar or lower than the ambient at any period of the day, with the only exception of the 12–14 h period, when temperatures provided by these covers were 21–22 °C (2–3 °C higher than ambient) (Table 2). This was probably due to the fact that November was the coldest month of this season, i.e., lower IR radiation and consequently a lower mitigation effect of the covers [34]. This was particularly obvious in gravel cover with a thicker physical barrier than red-polymer, which provided a greater time constant tc as mentioned in the thermal analysis section.
On the whole, green covers provided temperatures closer to comfort temperatures than conventional covers, higher during the night and late afternoon and considerably lower in the hottest periods. The best temperatures were found in Sedum and Aeonium covers, while Aptenia showed a slightly worse performance, more similar to the conventional covers. Probably, the very dense covering of Sedum (surface) and Aeonium (umbrella) provided a better thermophysical properties than Aptenia, which showed a lower covering ability in our experiment (data not shown) and higher diffusivity than the others (Table 1), and also agrees with some reports [35].
Finally, November provided lower temperatures than September and October. Temperatures under green covers were low at night and late afternoon, although higher than the values of conventional covers and closer to ambient records in the central hours of the day, when considerable differences among green covers were found. Thus, average temperatures in the 10–12 h period ranged from 15 °C to 16.9 °C in Sedum and Aeonium, and Aptenia, respectively, in contrast to gravel (14 °C) and red-polymer (18 °C). Moreover, Aptenia showed the highest temperature values in the 12–14 h period. These findings confirm those found in September and October, being Aptenia the green cover with the highest significant temperatures around 14 h among green covers, even higher than conventional cover (Table 2).

3.3.2. Winter

As expected, and according to the records of the ambient, the winter season was the coldest of the year, although, as usual in the Mediterranean area of Spain, temperatures may reach relatively comfortable records at noon and even the afternoon (12–18 h, 13.6–16.7 °C) (Table 3). The coldest temperatures were found during the 0–8 h period: 6.1–7.0 °C, 8.3–9.6 °C, and 5.8–8.0 °C in December, January, and February, respectively. These results, with relatively mild temperatures in the coldest hours of the winter, confirm the effect of climate change in the Mediterranean area of Spain [36].
Regarding conventional roofs, we found a similar trend than that observed in November (Figure 4). Although, due to thermal inversion, their temperatures were lower than the ambient in the cold periods of the day, significant differences were only found from 2 h to 8 h in February, particularly in 6–8 h: 3.8 °C, 4.4 °C, and 5.8 °C for red-polymer, gravel, and ambient, respectively (Table 3). The period 12–14 h was the only one when temperatures under conventional covers were higher than the ambient, particularly the red-polymer, which reached 2.4–4.0 °C higher than ambient in December and February (Table 3).
In general, green covers showed a better thermal performance and kept temperatures close to the ambient during the night and, therefore, higher than conventional covers. Nevertheless, Aptenia and Sedum experienced a slightly significant temperature decrease with respect to ambient temperature in February between 2 h and 8 h, while, on the contrary, Aeonium provided significant higher temperatures than ambient from 20 h to 4 h (Table 3). Therefore, Aeonium, as found in November, appears to be the green cover that had fewer heat losses throughout winter nights.
Compared to conventional covers, green covers showed significantly lower temperatures in the periods comprised between 8 h and 14 h (Table 3, Figure 4), which reinforces their ability as thermal barriers. In addition, despite low temperatures in winter, significant differences could be found among green covers, particularly in January in the 12–14 h period and in February from 10 h to 16 h, when temperatures increased gradually, being Aeonium the most efficient green cover, i.e., higher thermal inertia, followed by Sedum and, finally, Aptenia (Table 3).
Thus, Aptenia, followed by Sedum, enabled the highest average temperatures among green covers, with the highest and significant differences in February records (Table 3). As a result, Aptenia, apart from having a high rate of temperature changes similar to the red-polymer (Figure 4), also reached higher temperatures than gravel in the hottest hours of the day not only in January and February, but also in November. By contrast, Aeonium, with the only exception of December, showed lower temperatures than the other green covers in the central hours of the day. For example, in February, Aeonium provided 13.4 °C at the 12–14 h period, i.e., 3.4 °C and 5.5 °C lower than Sedum and Aptenia, respectively, and 4 °C and 6.5 °C lower than gravel and red-polymer covers (Table 3). These results in winter indicate that Aeonium could be the cover with the highest ability to absorb any change of ambient temperature, in both cold and mild periods.
On the whole, green covers work as efficient barriers against heating around noon, as well as they mitigate the dramatic decrease of temperature at night hours observed in conventional covers (quite remarkable in February). Therefore, this fact could be considered positive in terms of energy efficiency in buildings as this performance indicates that Crassulaceae green covers, Aeonium in particular, may help mitigate the heat loss on winter nights, as reported in some studies for cold climates [37].

3.3.3. Spring

In spring, it was obvious that ambient temperatures increased gradually from March towards the summer months. Thus, in all 2 h periods, March showed the lowest averages, followed by April and, finally, May with the highest values. Moreover, despite average differences between March and April/May that ranged between 3 and 6 °C, the average temperatures never decreased below 12 °C in this season, even in the coldest hours, i.e., right before sunrise, and reached >20 °C at noon (Table 4). Thus, minimum temperatures (at 6–8 h) and maximum temperatures (at 14–16 h) were comprised between 12.1 and 21.5 °C in March, 13.9 and 25.3 °C in April, and 16.0 and 26.9 °C in May (Table 4). Therefore, compared to winter, the total increase in temperature observed throughout the day was considerably greater (9 °C in winter vs. 13 °C in spring) (Table 3 and Table 4).
Regarding conventional covers, average temperatures were similar or slightly different than those of the ambient during the night and early morning (20 h to 8 h) and slightly higher during the afternoon-night (18–22 h). However, differences with the ambient were not significant in March, and only differed significantly in April and May from sunrise (8–10 h) to the afternoon (16–18 h), particularly in May, when higher temperatures in this month exacerbated the differences (Table 4). Thus, in comparison to ambient temperatures, and as observed in other cases, temperatures under conventional covers in these months were considerably lower at the beginning of the day (5–6 °C lower than the ambient), and then increased in the next hours until the maximum average temperatures at 12–14 h in May and at 14–16 h in March and April (Table 4). In warm periods of the day, gravel showed significantly lower temperatures than red-polymer, as a result of its higher thermal inertia. Thus, for example, gravel provided 2–4 °C less than the ambient in the periods 10–14 h in March and April, while red-polymer provided similar or higher temperatures than the ambient (Table 4). However, in May, both conventional covers reached temperatures 4–5 °C higher than the ambient in the periods comprised between 12 h and 16 h (Table 4).
Considering green covers in March, significant differences were found in comparison to ambient and conventional covers in the 12–16 h periods, with temperatures similar or even lower than those of gravel and considerably lower than those of the red-polymer and ambient. Thus, Aeonium, as in other seasons, showed the highest thermal inertia, i.e., the lowest significant temperatures in these middle hours of the day (14.7–16.7 °C), followed by Sedum (15.8–17.9 °C) and, finally, Aptenia (16.7–19.1 °C). There were no significant differences between green covers vs. ambient and conventional covers in the cold periods of the day, i.e., from 16 h to 10 h in March, from 0 h to 10 h in April, and in a narrower range, from 4 h to 10 h in May (Table 4). By contrast, significant differences were found for the remaining periods, when Aeonium had the lowest significant temperatures among all the studied covers, while Aptenia had significantly higher temperatures than the other green covers (Table 4).
In April, Aptenia showed the highest values among green covers, similar to those for conventional covers until 18–20 h, and being also the closest to the ambient from 10:00 to 18:00. By contrast, Sedum, and particularly Aeonium, showed the lowest average temperatures during the hottest periods of the day, keeping comfortable values of 20–24 °C in the 12–18 h periods, which were 2–3 °C (Sedum) and 4–5 °C (Aeonium) lower than the ambient. At sunset and night, i.e., 18–24 h, thanks to their thermal inertia, green covers kept comfortable temperatures of 17–24 °C, 2–3 °C higher than those found in the ambient and even higher than conventional covers (Table 4).
Finally, the high temperatures of May underlined the advantage of green covers compared to conventional covers, in particular Aeonium and Sedum. Thus, in the 10–18 h periods, Aeonium and Sedum, with average temperatures of 21.8–26.5 °C and 23.4–27.6 °C, enabled, respectively, 4–6 °C and 2–4 °C lower temperatures than conventional covers. Even from 18 h to 0 h, green covers kept comfortable temperatures of 20–26 °C, comparatively higher than those of the ambient and conventional covers, confirming their higher thermal inertia (Table 4).

3.3.4. Summer

As usual in the Mediterranean coast of Spain, July and August were the hottest summer months [38] and, therefore, the best ones to assess the impact of alternative covers to reduce the effect of high temperatures. According to the ambient records (Table 5), the lowest temperatures corresponded to the 0–8 h periods, particularly at 6:00 a.m. Then, the temperature increased dramatically in the 8–10 h period during the sunrise, 5 °C in June (from 21 to 26 °C) and particularly 7.5 °C in July and August (from 24–25 °C to 31 °C), and increased gradually until noon reaching the maximum temperatures of the day (12–14 h period, 32–35 °C). Finally, from the 14–16 h period on, temperatures decreased gradually to 24 °C and 27 °C at 22–24 h in June and August, respectively, with a remarkable decrease (2.5–3 °C) after sunset (Table 5).
In the case of conventional covers, some differences were found in the evolution of temperature compared to ambient temperature. Thus, gravel and, particularly, red-polymer showed remarkable temperature variations during the day. On the whole, temperatures for gravel were similar to those of the ambient during the night, although slightly lower for red-polymer covers (0.5–1 °C) (Table 5). By contrast, temperatures increased fast during the morning and reached values considerably higher than the ambient in the afternoon (14–16 h): 1.8 °C, 4.6 °C, and 4.5 °C higher under gravel cover than the ambient in June, July, and August, respectively. This was still more obvious under red-polymer cover, with temperatures 3.5 °C and even 5.4 °C higher than the ambient, in June and July/August (reaching > 40 °C) (Table 5), indicating that red-polymer is the worst conventional alternative on mitigating heat in summer. Moreover, this behavior can be explained by analyzing the time constant that results from the ratio between diffusivity and material thickness. Thus, as reported in previous sections, the time constant calculated in gravel was higher than in red-polymer, which correlates to heat mitigation. Moreover, this thermal behavior agrees with the thermal transmittance coefficient U (W/m2 K) measured for gravel roofs and bituminous roofs [24]. Gravel roofs have a value of this coefficient slightly lower than that of a roof without any type of protection element or with a simple red-polymer on the pavement. A lower value of thermal transmittance coefficient confers better thermal performance, and, therefore, gravel roof can mitigate the high external temperatures somewhat better than red-polymer roof, which also has the added detrimental effect of dark-red color (red-polymer) vs. pale grey color (gravel) as an absorber of a greater amount of solar radiation.
Regarding the performance of green covers, significant differences were found in comparison to conventional covers, especially in July and August in many periods of the day. Thus, the higher differences were found around noon, when higher temperatures appeared.
In July, temperatures under green covers in the 10–12 h period were considerably lower than ambient and gravel roof (2.2–4 °C) and much lower than red-polymer (4.5–6 °C). Even in the 12–14 h, 14–16 h, and 16–18 h periods, differences in temperature between green covers and conventional covers were significant. Thus, while the average ambient temperature in 12–14 h was 34.4 °C and conventional roofs reached 39–40 °C, temperatures under green roofs were comprised between 32.6 and 35.81 °C (Table 5). A similar outcome was found in the 14–16 h period, with green covers showing temperatures comprised between 33 and 36.7 °C, close to the ambient, but considerably lower than those measured for conventional covers (close to 39 °C). Finally, the temperatures of green covers in the 16–18 h, when ambient temperatures start to decrease clearly, were still lower than those of conventional roofs (Table 5). A similar performance was found in the hottest periods of the day in August (10–16 h), when temperatures under green covers were lower or slightly higher (29.5–36.7 °C) than those for ambient (34–35 °C) and much lower than those for conventional covers (32.7–40.6 °C) (Table 5). Therefore, their performance attenuating high temperatures was considerably much better than conventional covers.
To a lower extent, the same performance was found in June in the periods comprised between 10 h and 18 h, with green covers recording similar or lower temperatures (25.4–32 °C) than those of the ambient (30–32.6 °C) and considerably lower than conventional covers (28.5–36 °C) (Table 5). All these findings support the fact that green roofs may mitigate efficiently the increase in temperature compared to conventional covers, particularly in the hottest hours of the summer days. This effect was in agreement with the reports of other authors [39,40,41], and it is due to the better thermal behavior of green roofs compared with conventional roofs [24].
In addition, our results even indicate significant differences among the species utilized as green covers from 12 h to 18 h in all summer months. Thus, Aeonium showed the lowest temperature averages in the hottest hours of the day in the three months, followed by Sedum and Aptenia. Average temperature differences in June were comprised between 1 and 2 °C (compared to Sedum) and 1.3–2.7 °C (compared to Aptenia) and reached much higher values in July and August 1.8 to 2.4 °C (compared to Sedum) and 2.7–3.4 °C (compared to Aptenia) (Table 5). These findings, together with the study of decrement factor (f) and lag time (Ø) (Figure 5), suggest that Aeonium has a better performance to weaken heat transfer to its interior compartment in summer. Probably, some reasons may be the differences in the ability to capture IR radiation, or even its tree morphology offering a shading effect, instead of a mere surface coverage such as Sedum or Aptenia. Furthermore, it exhibits a great thickness (which improves its time constant) and an additional air chamber through which the air can also circulate [42,43].
Data presented in this work for green covers were significantly different in summer between 10 h and 18 h with a decrease in temperature of 4 °C and 6 °C compared with gravel and red-polymer. These findings are in agreement with recent studies summarized in the review of Nguyen et al. [44] in which the quantification of the thermal improvement by green roof states that the increase in indoor temperature between green roofs and insulated bare roofs ranged from around 1 °C to 5 °C. More specifically, major differences were found in daytime much greater than in night time (75% lower).
To summarize the descriptive statistical analysis, the most relevant results of temperature for green covers were produced in hot months and central hours of the day, while the weakest effect was found in the nights and cold months. In those periods, the main significant differences between green covers and conventional covers were obtained mainly between Sedum/Aeonium and red-polymer. Therefore, the effect of Aptenia and conventional covers in temperature was not significant in most cases. These results lead to consider Sedum and Aeonium as the best Crassulaceae species to use in extensive green roofs in the Mediterranean cities. As a result, the use of a mixture of both species would be particularly advisable because of the benefits of reducing the use of air conditioning in buildings, together with the creation of new habitats that support biodiversity that enriches the essential ecosystem service in urban areas. In conclusion, the choice of the most suitable green cover not only improves insulation and energy efficiency in buildings, but also does provide a way to restore ecosystems and biological systems in urban sites. These effects contribute to reducing the high impact that human activities produce on climate change, as indicated in the United Nations Sustainable Development Goals (13th: Climate Action and 15th: Biodiversity, forest, and desertification) [45].

4. Conclusions

Among conventional covers, gravel cover experienced lower differences of temperature between the hottest and the coldest hours of the day which produced a lower decrement factor than red-polymer. Furthermore, gravel showed greater time constant and time lag than red-polymer which means to have more thermal inertia than red-polymer.
In comparison, green covers were more efficient in the control of temperature, as they had better dynamic factors, i.e., lower decrement factor and higher time lag than conventional covers. Particularly, Aeonium and Sedum showed decrement factors lower than 1 in most of the year and time lags comprised between 2 and 5 during the hottest months. However, Aptenia showed the worst decrement factor and time lag among all green covers, being the one with the lowest thermal inertia and reaching the highest temperatures of the evaluated species.
Specifically, Aeonium was found the most efficient green cover, absorbing any change of ambient temperature in both cold and hot periods of the day most of the year. As a result, Aeonium had the lowest heat losses in the winter nights and was also found the best significant thermal barrier against temperature increases around noon in all the seasons.
It should be noted that Sedum is also a succulent specie to take into consideration due to its good results in both dynamic factors and significant differences in temperatures.
Finally, in view of the results, we suggest that a mixture of Sedum and Aeonium might be a good choice as a green cover in the Mediterranean cities, due to the good isolation that both species offer and also the enrichment of biodiversity, that are essential to improve ecosystem services which fight the high impact of human activities on climate change.

Author Contributions

Conceptualization, A.R.-B., P.F.d.C. and C.C.-O.; methodology, G.G.-Y., A.R.-B. and P.F.d.C.; software, V.B.-G.; validation, G.G.-Y., V.B.-G. and I.C.F.; formal analysis, A.R.-B. and I.C.F.; investigation, G.G.-Y., V.B.-G., A.R.-B. and I.C.F.; resources, P.F.d.C., C.C.-O. and A.R.-B.; data curation, V.B.-G. and G.G.-Y.; writing—original draft preparation, I.C.F., A.R.-B. and G.G.-Y.; writing-review and editing I.C.F., A.R.-B. and C.C.-O.; visualization, V.B.-G. and I.C.F.; supervision, I.C.F.; project administration, A.R.-B. and I.C.F.; funding acquisition, A.R.-B. All authors have read and agreed to the published version of the manuscript.

Funding

This research was developed in the facilities of the Universitat Politècnica de València and with the resources provided by Fondo de Sostenibilidad I+D+I UPV 88702681.

Institutional Review Board Statement

Not applicable.

Informed Consent Statement

Not applicable.

Data Availability Statement

Not provided.

Acknowledgments

The authors are grateful to Sempergreen Spain, Constantí, Tarragona, Spain that kindly provided Sedum spp. samples.

Conflicts of Interest

The authors declare no conflict of interest.

References

  1. PANACC. Plan Nacional de Adaptación al Cambio Climático. 2020. Available online: https://www.miteco.gob.es/es/cambio-climatico/temas/impactos-vulnerabilidad-y-adaptacion/pnacc-2021-2030_tcm30-512163.pdf (accessed on 11 August 2022).
  2. Wong, N.H.; Chen, Y.; Ong, C.L.; Sia, A. Investigation of thermal benefits of rooftop garden in the tropical environment. Build. Environ. 2003, 38, 261–270. [Google Scholar] [CrossRef]
  3. Hien, W.N.; Yok, T.P.; Yu, C. Study of thermal performance of extensive rooftop greenery systems in the tropical climate. Build. Environ. 2007, 42, 25–54. [Google Scholar] [CrossRef]
  4. Jim, C.Y.; Peng, L.L.H. Weather effect on thermal and energy performance of an extensive tropical green roof. Urban For. Urban Green. 2012, 11, 73–85. [Google Scholar] [CrossRef]
  5. Lin, B.S.; Yu, C.C.; Su, A.T.; Lin, Y.J. Impact of climatic conditions on the thermal effectiveness of an extensive green roof. Build. Environ. 2013, 67, 26–33. [Google Scholar] [CrossRef]
  6. Saadatian, O.; Sopian, K.; Salleh, E.; Lim, C.H.; Riffat, S.; Saadatian, E.; Toudeshki, A.; Sulaiman, M.Y. A review of energy aspects of green roofs. Renew. Sustain. Energy Rev. 2013, 23, 155–168. [Google Scholar] [CrossRef]
  7. Shafique, M.; Xue, X.; Luo, X. An overview of carbon sequestration of green roofs in urban areas. Urban For. Urban Green. 2020, 47, 126515. [Google Scholar] [CrossRef]
  8. Martini, A.N.; Papafotiou, M.; Massas, I.; Chorianopoulou, N. Using the Halophyte Crithmum maritimum in Green Roofs for Sustainable Urban Horticulture: Effect of Substrate and Nutrient Content Analysis including Potentially Toxic Elements. Sustainability 2022, 14, 4713. [Google Scholar] [CrossRef]
  9. Alchapar, N.L.; Correa, E.N.; Cantón, M.A. Índice de reflectancia solar de revestimientos verticales: Potencial para la mitigación de la isla de calor urbana. Ambient. Construído 2012, 12, 107–123. [Google Scholar] [CrossRef]
  10. Li, D.; Bou-Zeid, E.; Oppenheimer, M. The effectiveness of cool and green roofs as urban heat island mitigation strategies. Environ. Res. Lett. 2014, 9, 055002. [Google Scholar] [CrossRef]
  11. Park, J.; Shin, Y.; Kim, S.; Lee, S.W.; An, K. Efficient Plant Types and Coverage Rates for Optimal Green Roof to Reduce Urban Heat Island Effect. Sustainability 2022, 14, 2146. [Google Scholar] [CrossRef]
  12. Yang, W.; Wang, Z.; Cui, J.; Zhu, Z.; Zhao, X. Comparative study of the thermal performance of the novel green (planting) roofs against other existing roofs. Sustain. Cities Soc. 2015, 16, 1–12. [Google Scholar] [CrossRef]
  13. Campiotti, C.A.; Gatti, L.; Campiotti, A.; Consorti, L.; De Rossi, P.; Bibbiani, C.; Muleo, R.; Latini, A. Vertical Greenery as Natural Tool for Improving Energy Efficiency of Buildings. Horticulturae 2022, 8, 526. [Google Scholar] [CrossRef]
  14. He, C.; He, L.; Zhang, Y. Problems and benefits of using green roofs in Poland. In Proceedings of the IOP Conference Series: Earth and Environmental Science., Moscow, Russia, 27 May–6 June 2019; Volume 214, p. 012076. [Google Scholar]
  15. Peck, S.W.; Callaghan, C.; Kuhn, M.E.; Bass, B. Greenbacks from green roofs: Forging a new industry in Canada. Canada Mortgage and Housing corporation. March 1999. Available online: https://commons.bcit.ca/greenroof/files/2012/01/Greenbacks.pdf (accessed on 15 August 2022).
  16. Van Renterghem, T. Green Roofs for Acoustic Insulation and Noise Reduction. Chapter 3.8; In Nature Based Strategies for Urban and Building Sustainability; Butterworth-Heinemann: Oxford, UK, 2018; pp. 167–179. ISBN 9780128123249. [Google Scholar]
  17. Ulrich, R.S.; Simons, R.F.; Losito, B.D.; Fiorito, E.; Miles, M.A.; Zelson, M. Stress recovery during exposure to natural and urban environments. J. Environ. Psychol. 1991, 11, 201–230. [Google Scholar] [CrossRef]
  18. Beauchemin, K.M.; Hays, P. Sunny hospital rooms expedite recovery from severe and refractory depressions. J. Affect. Disord. 1996, 40, 49–51. [Google Scholar] [CrossRef]
  19. Varni, J.W.; Burwinkle, T.M.; Dickinson, P.; Sherman, S.A.; Dixon, P.; Ervice, J.A.; Leyden, P.A.T.A.; Sadler, B.L. Evaluation of the Built Environment at a Children’s Convalescent Hospital: Development of the Pediatric Quality of Life InventoryTM Parent and Staff Satisfaction Measures for Pediatric Health Care Facilities. J. Dev. Behav. Pediatr. 2004, 25, 10–20. [Google Scholar] [CrossRef]
  20. Huang, Y.Y.; Chen, C.T.; Liu, W.T. Thermal performance of extensive green roofs in a subtropical metropolitan area. Energy Build. 2018, 159, 39–53. [Google Scholar] [CrossRef]
  21. Zhang, P.; Bai, J.; D, Y.L.; Meng, Y.; Yang, Z.; Liu, T. Drought resistance of ten ground cover seedling species during roof greening. PLoS ONE 2020, 15, e0220598. [Google Scholar] [CrossRef]
  22. Giordano, M.; Petropoulos, S.A.; Cirillo, C.; Rouphael, Y. Horticulturae Biochemical, Physiological, and Molecular Aspects of Ornamental Plants Adaptation to Deficit Irrigation. Horticulturae 2021, 7, 107. [Google Scholar] [CrossRef]
  23. Carslaw, H.S.; Jaeger, J.C. Conduction of Heat in Solids, 2nd edOxford University Press: Oxford, UK, 1986; ISBN 0198533683. [Google Scholar]
  24. CTE Código Técnico de la Edificación. Instituto Eduardo Torroja, CEPCO y AICIA. 2010. Available online: http://anape.es/pdf/Catalogo%20de%20Elementos%20Constructivos%20CAT-EC-v06.3_marzo_10.pdf (accessed on 11 August 2022).
  25. Olivieri, F.; di Perna, C.; D’Orazio, M.; Olivieri, L.; Neila, J. Experimental measurements and numerical model for the summer performance assessment of extensive green roofs in a Mediterranean coastal climate. Energy Build. 2013, 63, 1–14. [Google Scholar] [CrossRef]
  26. Bevilacqua, P.; Mazzeo, D.; Bruno, R.; Arcuri, N. Experimental investigation of the thermal performances of an extensive green roof in the Mediterranean area. Energy Build. 2016, 122, 63–79. [Google Scholar] [CrossRef]
  27. Espinal-Montes, V.; López-Cruz, L.; Rojano-Aguilar, A.; Romatchik-Kriuchova, E.; Ramírez-Arias, A. Determinación de los gradientes térmicos nocturnos en un invernadero usando dinámica de fluidos computacional. Agrociencia 2015, 49, 233–247. Available online: https://agrociencia-colpos.mx/index.php/agrociencia/article/view/1143/1143 (accessed on 28 April 2022).
  28. Munar, E.A.V.; Aldana, C.R.B. Numerical evaluation of passive strategies for nocturnal climate optimization in a greenhouse designed for rose production (Rosa spp.). Ornam. Hortic. 2019, 25, 351–364. [Google Scholar] [CrossRef]
  29. Maiolo, M.; Pirouz, B.; Bruno, R.; Palermo, S.A.; Arcuri, N.; Piro, P. The Role of the Extensive Green Roofs on Decreasing Building Energy Consumption in the Mediterranean Climate. Sustainability 2020, 12, 359. [Google Scholar] [CrossRef]
  30. Peñalvo-López, E.; Cárcel-Carrasco, J.; Alfonso-Solar, D.; Valencia-Salazar, I.; Hurtado-Pérez, E. Study of the Improvement on Energy Efficiency for a Building in the Mediterranean Area by the Installation of a Green Roof System. Energies 2020, 13, 1246. [Google Scholar] [CrossRef]
  31. Polo-Labarrios, M.A.; Quezada-Garciá, S.; Sánchez-Mora, H.; Escobedo-Izquierdo, M.A.; Espinosa-Paredes, G. Comparison of thermal performance between green roofs and conventional roofs. Case Stud. Therm. Eng. 2020, 21, 100697. [Google Scholar] [CrossRef]
  32. Eksi, M.; Rowe, D.B.; Wichman, I.S.; Andresen, J.A. Effect of substrate depth, vegetation type, and season on green roof thermal properties. Energy Build. 2017, 145, 174–187. [Google Scholar] [CrossRef]
  33. Agencia Estatal de Meteorología-AEMET. Gobierno de España. Available online: https://www.aemet.es/es/portada (accessed on 9 July 2022).
  34. Feofilov, A.G.; Kutepov, A.A. Infrared Radiation in the Mesosphere and Lower Thermosphere: Energetic Effects and Remote Sensing. Surv. Geophys. 2012, 336, 1231–1280. [Google Scholar] [CrossRef]
  35. Di Miceli, G.; Id, N.I.; Id, M.L.; la Bella, S.; Tuttolomondo, T.; Aprile, S. Growth and development of succulent mixtures for extensive green roofs in a Mediterranean climate. PLoS ONE 2022, 17, e0269446. [Google Scholar] [CrossRef]
  36. Lionello, P.; Scarascia, L. The relation between climate change in the Mediterranean region and global warming. Reg. Environ. Chang. 2018, 18, 1481–1493. [Google Scholar] [CrossRef]
  37. Tang, X.; Qu, M. Phase change and thermal performance analysis for green roofs in cold climates. Energy Build. 2016, 121, 165–175. [Google Scholar] [CrossRef]
  38. Pérez, J.J.M. Downscaling Estadístico de Series Climáticas Mediante Redes Neuronales: Reconstrucción en Alta Resolución de la temperatura diaria para la Comunidad Valenciana. Interpolación Espacial y Análisis de Tendencias (1948–2011). Unpublished Doctoral Dissertation. Instituto Interuniversitario de Geografía, Universidad de Alicante, Fundación Centro de Estudios Ambientales del Mediterráneo, Departamento de Geografía de la Universidad de Valencia, Valencia, Spain, 2014. Available online: http://hdl.handle.net/10045/36538 (accessed on 15 August 2022).
  39. Antrop, M. Landscape change and the urbanization process in Europe. Landsc. Urban Plan. 2004, 67, 9–26. [Google Scholar] [CrossRef]
  40. Getter, K.L.; Rowe, D.B.; Cregg, B.M. Solar radiation intensity influences extensive green roof plant communities. Urban For. Urban Green. 2009, 8, 269–281. [Google Scholar] [CrossRef]
  41. Shafique, M.; Kim, R.; Rafiq, M. Green roof benefits, opportunities and challenges—A review. Renew. Sustain. Energy Rev. 2018, 90, 757–773. [Google Scholar] [CrossRef]
  42. Costa, J.M.; Grant, O.M.; Chaves, M.M. Thermography to explore plant–environment interactions. J. Exp. Bot. 2013, 64, 3937–3949. [Google Scholar] [CrossRef] [PubMed]
  43. He, Y.; Yu, H.; Ozaki, A.; Dong, N.; Zheng, S. Influence of plant and soil layer on energy balance and thermal performance of green roof system. Energy 2017, 141, 1285–1299. [Google Scholar] [CrossRef]
  44. Nguyen, C.N.; Muttil, N.; Tariq, M.A.U.R.; Ng, A.W.M. Quantifying the Benefits and Ecosystem Services Provided by Green Roofs—A Review. Water 2022, 14, 68. [Google Scholar] [CrossRef]
  45. United Nations Sustainable Development Goals. Available online: https://www.un.org/en/sustainable-development-goals (accessed on 24 August 2022).
Figure 1. Euro-pallet support. (a) three wooden rectangular articulated bodies (image courtesy of www.rotomshop.es accessed on 4 January 2020); (b) interior space divided into two compartments; (c) access door; (d) expanded polystyrene insulation; (e) thermo-hygrometric TESTO 174H sensors/data-loggers hanging on the wood ceiling.
Horticulturae 08 00846 g001
Figure 2. Experimental roofs over structures composed of two attached cabins covered with: (a) conventional covers: coarse gravel and red-polymer; green covers: (b) Aeonium and Aptenia, (c) Aeonium and Sedum, (d) Sedum and Aptenia; (e) general view of the distribution of four structures of the eight of the experiment.
Horticulturae 08 00846 g002
Figure 3. (a) Ambient average temperature (°C) and (b) average relative humidity (%) every 15 min during the day, comparing the 12 months of the year.
Horticulturae 08 00846 g003
Figure 4. Average temperatures registered every 15 min during the day in the ambient, and under different covers: conventional (red-polymer, gravel) and green (Aptenia, Aeonium and Sedum) in a) autumn 2017, b) winter 2017–18, c) spring 2018, and d) summer 2018.
Horticulturae 08 00846 g004
Figure 5. a) Decrement factor and b) time lag for conventional (red-polymer and gravel) and green covers (Aptenia, Aeonium, and Sedum). Dashed lines are plot as a reference with respect to ambient (f = 1, Ø = 0).
Horticulturae 08 00846 g005
Table 1. Thermophysical properties for material covers, thermal conductivity (k), density ( ρ ), specific heat capacity (Cp), and diffusivity (α). Data taken from “Codigo Técnico de la Edificación” for polymer and gravel [24] and Olivieri et al. for a reference green cover [25], and presented as indicative data.
k (W/(m·K)) ρ Cp (J/(kg·K))α (m2/s)
Polyethylene HDPE0.598018002.8·10−7
Gravel2220011807.7·10−7
Green cover0.750010001.4·10−6
Table 2. Average temperatures (°C) every 2 h-periods during the day (n = 5 days) in autumn.
ApteniaAeoniumSedumRed-Polymer GravelAmbient
September
0–2 h22.46a 122.48a22.66a21.23a21.26a22.04a
2–4 h21.54a21.61a21.72a20.09a20.14a21.25a
4–6 h20.63a20.72a20.78a19.04a19.23a20.27a
6–8 h19.61abc19.67abc19.81bc18.24a18.37ab19.84c
8–10 h19.94a19.73a20.11a19.06a18.80a23.24b
10–12 h26.54bc24.12a23.12ab27.33c25.20ab29.30d
12–14 h31.60b28.46a28.95a33.48b32.37b28.71a
14–16 h31.98b29.25a29.07a33.66b33.89b28.20a
16–18 h30.71bc28.70ab29.18b29.96bc31.46c26.64a
18–20 h26.73d25.78bcd26.67cd24.92ab25.67bc24.13a
20–22 h24.11b23.91b24.38b22.68a22.85a23.03a
22–24 h23.01b22.98b23.30b21.75a21.71a22.62ab
October
0–2 h19.94cd20.22d20.13d17.82a18.44ab19.04bc
2–4 h18.84c19.13c19.06c16.84a17.37ab18.35bc
4–6 h17.99c18.30c18.22c15.98a16.50ab17.61bc
6–8 h17.15c17.47c17.35c15.07a15.59ab16.85bc
8–10 h16.75b16.88b16.91b15.03a14.99a18.32c
10–12 h22.74b20.82a21.08a23.22bc20.30a24.23c
12–14 h29.62c27.17b25.75a32.49d29.30c27.04ab
14–16 h31.43c29.05b27.49a32.33c31.78c26.98a
16–18 h29.03d27.36bc27.49bc26.78b28.69cd25.10a
18–20 h25.11c24.48bc24.94bc23.46a24.35b23.17a
20–22 h23.17c23.05c23.24c21.36a22.11b22.00b
22–24 h21.97d22.03d22.09d20.11a20.74ab21.12b
November
0–2 h10.69a11.26a10.75a8.84a9.50a10.68a
2–4 h9.55a10.11a9.61a7.51a8.26a9.69a
4–6 h8.61ab9.19b8.75ab6.52a7.26ab9.01b
6–8 h8.05ab8.55b8.20ab6.08a6.70ab8.73b
8–10 h9.00a9.09a9.32ab8.32a7.53a11.70b
10–12 h16.85bc15.29ab14.96ab17.98c14.19a17.28bc
12–14 h22.61d20.02ab18.74a21.92cd20.84bc18.84a
14–16 h19.18a17.49a17.99a17.46a17.79a18.74a
16–18 h17.28a16.98a17.02a16.62a16.75a17.77a
18–20 h15.60a15.92a15.42a13.58a14.74a15.22a
20–22 h13.47a14.12a13.38a10.54a11.78a12.98a
22–24 h11.95a12.65a11.98a9.47a10.23a12.13a
1 Average values with different letters within each row (i.e., among coverings within each 2 h period) indicates significant differences at the probability threshold p < 0.05, according to the Least Significant Difference (LSD) statistic test.
Table 3. Average temperatures (°C) every 2 h-periods during the day (n = 5 days) in winter.
ApteniaAeoniumSedumRed-Polymer GravelAmbient
December
0–2 h6.07a 17.05a6.32a4.11a4.56a6.96a
2–4 h5.58a6.51a5.88a3.91a4.37a6.64a
4–6 h5.03a5.90a5.35a3.43a3.87a6.07a
6–8 h4.81a5.63a5.20a3.52a3.88a6.12a
8–10 h5.28ab5.86ab5.96ab4.87a4.45a9.53b
10–12 h11.38abc10.96ab10.66ab12.87bc9.83a14.00c
12–14 h16.03abc15.98abc13.81a18.00c16.27bc15.61ab
14–16 h14.41a14.28a13.78a15.22a15.25a15.44a
16–18 h13.82a13.98a13.53a14.01a14.36a14.15a
18–20 h11.79a12.37a11.59a9.98a11.31a11.18a
20–22 h9.80a10.70a9.78a7.73a8.72a9.35a
22–24 h8.22a9.17a8.31a6.04a6.81a8.33a
January
0–2 h9.28a9.81a9.38a8.21a8.47a9.55a
2–4 h8.50a9.04a8.59a7.29a7.63a8.63a
4–6 h7.96a8.47a8.10a6.90a7.12a8.55a
6–8 h7.59a8.07a7.72a6.53a6.79a8.30a
8–10 h7.51ab7.92ab7.69ab6.83a6.83a9.75b
10–12 h11.49a10.42a10.95a11.85a10.49a14.26b
12–14 h16.74ab14.51a14.89ab17.33b15.70ab16.67ab
14–16 h15.42a14.63a15.01a15.51a15.36a16.33a
16–18 h14.43a14.25a14.31a14.22a14.33a14.78a
18–20 h12.86a13.08a12.86a11.96a12.45a12.54a
20–22 h11.63a12.03a11.71a10.61a11.04a11.73a
22–24 h10.89a11.38a10.99a9.97a10.40a11.23a
February
0–2 h8.06ab8.45b8.09ab6.29a6.88ab7.95ab
2–4 h7.67abc7.67bc7.26bc5.44a5.97ab7.84c
4–6 h6.63bc7.21c6.73bc5.23a5.69ab7.00c
6–8 h5.64bc6.18c5.68bc3.83a4.42ab5.79c
8–10 h5.86a5.93a5.81a4.97a4.66a8.032b
10–12 h13.19bc9.73a11.44ab14.18c11.46ab12.63bc
12–14 h18.93cd13.44a15.35ab19.91d17.42bcd15.95abc
14–16 h19.36b15.08a16.09ab17.70ab17.58ab16.33ab
16–18 h15.53a14.12a14.51a13.38a14.00a13.55a
18–20 h12.55a12.31a12.28a10.63a11.21a11.43a
20–22 h10.64ab10.82b10.59ab8.64a9.15ab10.02ab
22–24 h9.30a9.65a9.32a7.59a8.03a8.93a
1 Average values with different letters within each row (i.e., among coverings within each 2 h period) indicates significant differences at the probability threshold p < 0.05, according to the Least Significant Difference (LSD) statistic test.
Table 4. Average temperatures (°C) every 2 h-periods during the day (n = 5 days) in spring.
ApteniaAeoniumSedumRed-Polymer GravelAmbient
March
0–2 h12.69a 112.93a12.86a11.98a12.16a12.99a
2–4 h12.46a12.73a12.67a11.92a12.09a13.29a
4–6 h12.31a12.60a12.53a11.85a12.05a12.98a
6–8 h11.70a12.00a11.87a11.16a11.43a12.09a
8–10 h12.05a12.07a12.11a12.18a11.83a17.24b
10–12 h16.65ab14.67a15.79ab18.09b15.97ab20.61c
12–14 h19.08bc16.68a17.86ab21.15d18.88b21.05cd
14–16 h20.34bc18.15a19.15ab22.38c20.67bc21.54c
16–18 h20.35a18.51a19.48a21.10a20.44a19.75a
18–20 h17.08a16.43a16.89a16.07a16.42a15.58a
20–22 h14.48a14.53a14.54a13.01a13.65a13.85a
22–24 h12.91a13.21a13.05a11.39a11.98a12.66a
April
0–2 h16.12a16.51a16.43a15.14a15.51a16.08a
2–4 h15.50a15.88a15.80a14.83a15.11a15.48a
4–6 h14.81a15.13a15.06a14.01a14.36a14.53a
6–8 h13.92a14.26a14.02a13.01a13.34a13.88a
8–10 h13.91a14.12a14.19a13.75a13.61a18.60b
10–12 h19.18ab17.50a18.60a21.14bc19.14ab23.12c
12–14 h24.29b20.38a22.48ab27.15c24.36b24.85bc
14–16 h25.91c21.98a23.90b28.28d26.45c25.28bc
16–18 h25.85c22.83a24.11abc26.35c25.69bc23.17ab
18–20 h23.87c22.25ab23.10ab22.42ab22.88ab20.42a
20–22 h19.98c19.57b19.86b17.78ab18.69ab17.19a
22–24 h17.12ab17.26b17.28b15.15a15.87ab15.89ab
May
0–2 h18.47bc18.76c18.60bc16.25a16.80ab17.12abc
2–4 h17.41bc17.75c17.59bc15.61a15.91ab16.69abc
4–6 h16.60a16.91a16.73a14.94a15.17a15.96a
6–8 h15.99a16.32a16.16a14.61a14.79a16.41a
8–10 h17.50a17.23a17.83a17.72a17.08a23.46b
10–12 h23.84bc21.80a23.42ab27.33d25.45cd26.58d
12–14 h28.29bc24.89a26.78ab31.48d30.24cd26.85ab
14–16 h29.03bc25.99a27.39ab29.96c29.88c25.96a
16–18 h28.68bc26.54ab27.59bc28.70bc29.08c24.79a
18–20 h26.06b25.18b25.82b24.86b25.83b21.71a
20–22 h22.68c22.56bc22.68c21.00ab21.90bc19.34a
22–24 h20.02b20.19b20.19b18.02a18.77ab18.11a
1 Average values with different letters within each row (i.e., among coverings within each 2 h period) indicates significant differences at the probability threshold p < 0.05, according to the Least Significant Difference (LSD) statistic test.
Table 5. Average temperatures (°C) every 2 h-periods during the day (n = 5 days) in summer.
ApteniaAeoniumSedumRed-Polymer GravelAmbient
June
0–2 h22.70a 122.49a22.69a20.64a21.18a21.57a
2–4 h21.50a21.42a21.53a19.96a20.30a20.74a
4–6 h20.34b20.22b20.35b18.79a19.22ab19.78ab
6–8 h19.58ab19.55ab19.63ab18.20a18.47a21.07b
8–10 h21.48a20.95a22.26a21.57a20.64a26.12b
10–12 h26.72ab25.39a26.72ab30.78b28.45ab30.02bc
12–14 h30.49ab27.86a29.65ab35.59c33.18bc32.44bc
14–16 h31.81b29.06a30.06ab35.98d34.38cd32.59bc
16–18 h32.17abc29.99a31.06a34.50c33.93bc31.6ab
18–20 h31.76a30.44a31.04a32.11a32.39a29.55a
20–22 h28.59b28.22ab28.11ab27.39ab28.36ab26.06a
22–24 h25.23b25.02ab25.07ab23.73a24.45ab24.23ab
July
0–2 h26.99b26.64b26.84b24.74a25.34a25.20a
2–4 h25.84c25.52c25.66c23.63a24.19ab24.37b
4–6 h24.81c24.46c24.60c22.69a23.17ab23.57b
6–8 h23.86b23.58b23.71b21.76a22.10a23.82b
8–10 h25.56bc24.87ab26.07c25.25bc24.16a31.29d
10–12 h31.90b30.04a31.84b36.38d33.94c34.12c
12–14 h35.81c32.56a34.92b40.18e38.93d34.39b
14–16 h36.71c33.31a35.33bc38.77d38.61d34.03ab
16–18 h36.78cd34.04ab35.44bc36.93d37.42d32.95a
18–20 h35.67b34.03b34.94b34.37b35.41b30.99a
20–22 h32.50c31.74bc32.12bc30.58b31.86bc27.73a
22–24 h28.98cd28.31c28.66cd26.46a27.44b26.17a
August
0–2 h27.44b27.43b27.31b25.71a25.98ab26.14ab
2–4 h26.45b26.46b26.33b24.92a25.00a25.42ab
4–6 h25.74bc25.76bc25.61c24.42ab24.37a24.97abc
6–8 h25.21a25.22a25.07a23.98a24.00a24.92a
8–10 h26.05a25.68a26.16a25.79a25.48a31.48b
10–12 h31.45bc29.52a31.27ab34.47e32.72cd34.21de
12–14 h35.79c32.43a34.63ab40.56e38.28d35.16bc
14–16 h36.78bc33.56a35.14ab39.55d38.74cd34.20a
16–18 h36.58bc34.30ab35.12ab37.35c37.40c32.91a
18–20 h34.88b33.85b34.04b33.89b34.88b30.39a
20–22 h31.67a31.51a31.16a29.81a30.79a28.15a
22–24 h29.16a29.10a28.86a27.12a27.82a27.20a
1 Average values with different letters within each row (i.e., among coverings within each 2 h period) indicates significant differences at the probability threshold p < 0.05, according to the Least Significant Difference (LSD) statistic test.
Publisher’s Note: MDPI stays neutral with regard to jurisdictional claims in published maps and institutional affiliations.

