Article

Hydroponic Basil Production: Temperature Influences Volatile Organic Compound Profile, but Not Overall Consumer Preference

by
Kellie J. Walters
1 and
Roberto G. Lopez
2,*
1
Plant Sciences Department, University of Tennessee, Knoxville, TN 37996, USA
2
Department of Horticulture, Michigan State University, East Lansing, MI 48824, USA
*
Author to whom correspondence should be addressed.
Horticulturae 2022, 8(1), 76; https://doi.org/10.3390/horticulturae8010076
Submission received: 27 July 2021 / Revised: 7 September 2021 / Accepted: 9 September 2021 / Published: 14 January 2022
(This article belongs to the Special Issue Urban Horticulture - New Trends and Technologies)

Abstract

:
Altering the growing temperature during controlled-environment production not only influences crop growth and development, but can also influence volatile organic compound (VOC) production and, subsequently, sensory attributes of culinary herbs. Therefore, the objectives of this study were to (1) quantify the influence of mean daily temperature (MDT) and daily light integral (DLI) on key basil phenylpropanoid and terpenoid concentrations, (2) determine if differences in sensory characteristics due to MDT and DLI influence consumer preference, and (3) identify the sweet basil attributes consumers prefer. Thus, 2-week-old sweet basil ‘Nufar’ seedlings were transplanted into deep-flow hydroponic systems in greenhouses with target MDTs of 23, 26, 29, 32, or 35 °C and DLIs of 7, 9, or 12 mol·m−2·d−1. After three weeks, the two most recently mature leaves were harvested for gas chromatography–mass spectrometry (GC–MS) and consumer sensory analysis. Panel evaluations were conducted through a sliding door with samples served individually while panelists answered Likert scale and open-ended quality attribute and sensory questions. The DLI did not influence VOC concentrations. Increasing MDT from 23 to 36 °C during production increased 1,8 cineole, eugenol, and methyl chavicol concentrations linearly and did not affect linalool concentration. The increases in phenylpropanoid (eugenol and methyl chavicol) were greater than increases in terpenoid (1,8 cineole) concentrations. However, these increases did not impact overall consumer or flavor preference. The MDT during basil production influenced appearance, texture, and color preference of panelists. Taken together, MDT during production influenced both VOC concentrations and textural and visual attribute preference of basil but did not influence overall consumer preference. Therefore, changing the MDT during production can be used to alter plant growth and development without significantly affecting consumer preference.

1. Introduction

Interest in controlled-environment agriculture (CEA) is increasing due to demand for year-round and consistent supply of locally grown food, recent supply chain issues, food-borne illnesses, and technological innovations improving the economic feasibility of CEA [1,2,3]. Producing crops in controlled environments has the potential to improve production efficiencies by precisely manipulating the growing environment to obtain desired yield and quality attributes [2]. While technology exists to precisely control the greenhouse environment, knowledge of specific crop requirements that would allow growers to utilize the technology to its greatest potential is lacking. If known, increased production efficiencies and higher-quality products could be realized. Additionally, with potentially greater capital and operating costs for CEA compared to conventional (field) production, producing a higher-value product is highly advantageous. One potential method to increase the quality of a food crop is by improving flavor. In a recent survey, 90% of grower participants in the United States (U.S.) stated that their customers would pay more for crops with increased flavor [4]. This allows us to hypothesize that consumers would prefer basil (Ocimum basilicum) with a more intense flavor.
The main contributors to basil flavor are volatile organic compounds (VOCs). Based on a preliminary analysis of ‘Nufar’ sweet basil secondary metabolite concentrations, two phenylpropanoids (eugenol and methyl chavicol) and two terpenoids (1,8 cineole and linalool) make up a large proportion of the total VOC content (data not shown). Eugenol is the major VOC in cloves (Syzygium aromaticum) and contributes a clove-like flavor and aroma to basil [5]. The anise-like aroma and flavor characteristic of basil can be attributed to methyl chavicol (estragole) [6]. The monoterpenoid linalool is commonly found in many plants, contributing a flavor and aroma that has been described as having an aroma and flavor of floral or spicy [7] or Fruit Loops® cereal. Finally, 1,8 cineole or eucalyptol has an aroma and flavor analogous to eucalyptus (Eucalyptus globulus), whose essential oil contains 70% to 80% 1,8 cineole [8].
Increasing temperature can increase VOC production. For example, dill (Anethum graveolens) VOC content increased with increasing temperature [9]. As temperature increases, enzymatic activity and the production of VOCs can increase to a point. Chang et al. [10] determined that the concentration of VOCs in basil ‘Sweet Genovese’ grown at 25 or 30 °C for two weeks was 3-fold higher than in plants grown at 15 °C, but not all compounds responded the same. Basil grown at 15 °C had more camphor and trans-farnesene, while basil grown at 25 or 30 °C had higher eugenol and cis-ocimene, and temperature did not affect the concentration of 1,8-cineole or linalool. Another study reported that basil grown at 27 °C had a greater concentration of terpene VOCs compared to plants grown at 21 or 32 °C [11].
Growers often manipulate the growing environment to improve yield without considering how it will affect flavor, aroma, and ultimately consumer preference. Researchers have analyzed changes in specific secondary metabolites in response to changing environmental conditions, but that may not correlate with consumer preference. Other factors influencing consumer preference include sensory thresholds of specific compounds, the interaction of these compounds, variation in sensory ability, and preference in general.
Previous basil sensory evaluation studies have largely focused on aroma. Chang et al. [12] conducted a study in which 21 trained panelists and 64 untrained consumer panelists both identified that basil plants grown at 25 °C had a stronger aroma than those grown at 15 °C. However, due to large variation in the frequency of basil use among consumer panelists, researchers were unable to draw conclusions on consumer aroma preference.
An improved understanding of the extent to which individual environmental parameters, e.g., temperature or radiation intensity, could aid growers in minimizing quality differences throughout the year, potentially improving their ability to market their crop based on “improved flavor,” and finding a balance between crop quality, yield, and energy efficiency. Therefore, connecting the analytical data on the concentration of VOCs that contribute to flavor with consumer preferences is integral to improving crop flavor. Thus, the objectives of this study were to (1) quantify the influence of mean daily temperature (MDT) and daily light integral (DLI) on key basil phenylpropanoid and terpenoid concentrations, (2) determine if differences in sensory characteristics due to MDT and DLI influence consumer preference, and (3) identify the sweet basil attributes consumers prefer. We hypothesized that increasing both MDT and DLI would increase VOC concentrations and impact sensory characteristics. Additionally, we hypothesized that consumers would prefer more flavorful basil.

2. Materials and Methods

2.1. Growing Environment

Sweet basil ‘Nufar’ seeds (Johnny’s Selected Seeds; Winslow, MA, USA) were sown in stone wool cubes (2.5 × 2.5 × 4 cm, AO plug; Grodan, Roermond, The Netherlands) and grown for two weeks with a target air temperature of 23 °C and was measured by 0.13-mm type E thermocouples (Omega Engineering). Seeds and seedlings were irrigated overhead daily with reverse osmosis water supplemented with 12N-1.8P-13.4K water-soluble fertilizer as reported by Walters et al. [13]. High-pressure sodium (HPS) lamps provided a photosynthetic photon flux density (PPFD) of ~80 µmol·m−2·s−1, as measured with a quantum sensor (LI-190R Quantum Sensor; LI-COR Biosciences, Lincoln, NE, USA) every 15 s, and means were logged every hour by a CR-1000 datalogger (Campbell Scientific, Logan, UT, USA) to create a 16 h photoperiod and maintain a target DLI of 10 mol·m−2·d−1.
Two weeks after sowing, 12 seedlings per treatment were transplanted on 20 October 2017 (rep 1) and 19 September 2018 (rep 2) into raft hydroponic systems (Active aqua premium high-rise flood table; Hydrofarm) and the growing environment was monitored and controlled as reported by Walters and Lopez [14]. Five greenhouse compartments contained target air MDTs of 23, 26, 29, 32, or 35 °C. Each greenhouse contained three hydroponic systems under 0%, ~30%, or ~50% shade cloth (Solaro 3215 D O FB and Solaro 5220 D O; Ludvig Svensson, Kinna, Sweden) used to create target DLIs of 12, 9, or 7 mol·m−2·d−1, respectively, with actual DLIs and MDTs reported in Table 1.

2.2. GC–MS Analysis

Three weeks after transplant, the two most recent, fully mature leaves of five plants from each treatment were detached, frozen, and stored at −20 °C until gas chromatography–mass spectrometry (GC–MS) analysis as reported by Walters et al. [13] with a method derived from Schilmiller et al. [15]. In brief, tissue was ground in liquid nitrogen, and an aliquot was placed in a 1.5 mL microcentrifuge tube containing 500 µL of methyl tert-butyl ether (MTBE) and a tetradecane internal standard and rocked for 3 min. Samples were centrifuged and supernatant was transferred to GC auto sampler vials. Samples were analyzed using an Agilent 7890A GC and single-quadrupole MS (Agilent, Santa Clara, CA, USA). Metabolites were identified using standards and m/z values in the ChemStation database. The tetradecane internal standard and leaf dry weight were used to normalize compound concentrations. Compounds were quantified based on a standard response curve containing the compounds of interest and the internal standard.

2.3. Sensory Analysis

The protocol for the sensory analysis portion of this study was approved by the Institutional Review Board of Michigan State University (MSU; East Lansing, MI, USA; STUDY00000169). The experimental procedure was thoroughly explained to all participants and a written informed consent was obtained from each prior to participation. Eighty-six participants were recruited through the MSU Communication Arts and Sciences Paid Research Pool and screened prior to participation to ensure they had eaten basil in the four months prior. The sensory panel was conducted using the Sensory Evaluation Laboratory in the Department of Food Science and Human Nutrition at MSU. On 10 October 2018 (rep 2), the two most recent, fully mature leaves of each plant were harvested 1 to 4 h prior to sampling to ensure freshness. The leaves were removed from the plant and rinsed in deionized water. The samples were dried through air-drying and gentle patting with a towel. One leaf was placed on a plate for panelist evaluation. The participants sampled the basil leaves as described by Walters et al. [13] and answered Likert, open-ended, and demographic questions.

2.4. Experimental Design and Statistical Analysis

The experiment was organized in a split-plot design with each of five MDTs in separate greenhouse sections and three DLI treatments in each section. Only the highest DLI in each MDT treatment in replication 2 was used for consumer sensory analysis (Table 1). The experiment was completed twice in time for GC–MS analysis (reps 1 and 2) and once for consumer sensory analysis (rep 2).
Analysis of variance was performed on VOC and Likert data using JMP (version 12.0.1, SAS Institute Inc., Cary, NC, USA). When interactions were not present, data were pooled. Linear regression analyses were conducted on VOC data using Sigma Plot (version 11.0, Systat Software Inc., San Jose, CA, USA) and Tukey’s honestly significant difference test (p < 0.05) was conducted on Likert data using JMP. Data were transformed to account for differences in values, variation, and sample size [(sample value–parameter average)/parameter sd], then principal component analysis was conducted (using JMP). Biplots were created combining principal component analysis with loading plots (JMP). Factor analysis was conducted to determine the significant factors based on a rotated factor loading value of >0.7. Correlations were determined by Pearson’s correlation coefficient p < 0.05 (JMP).

3. Results

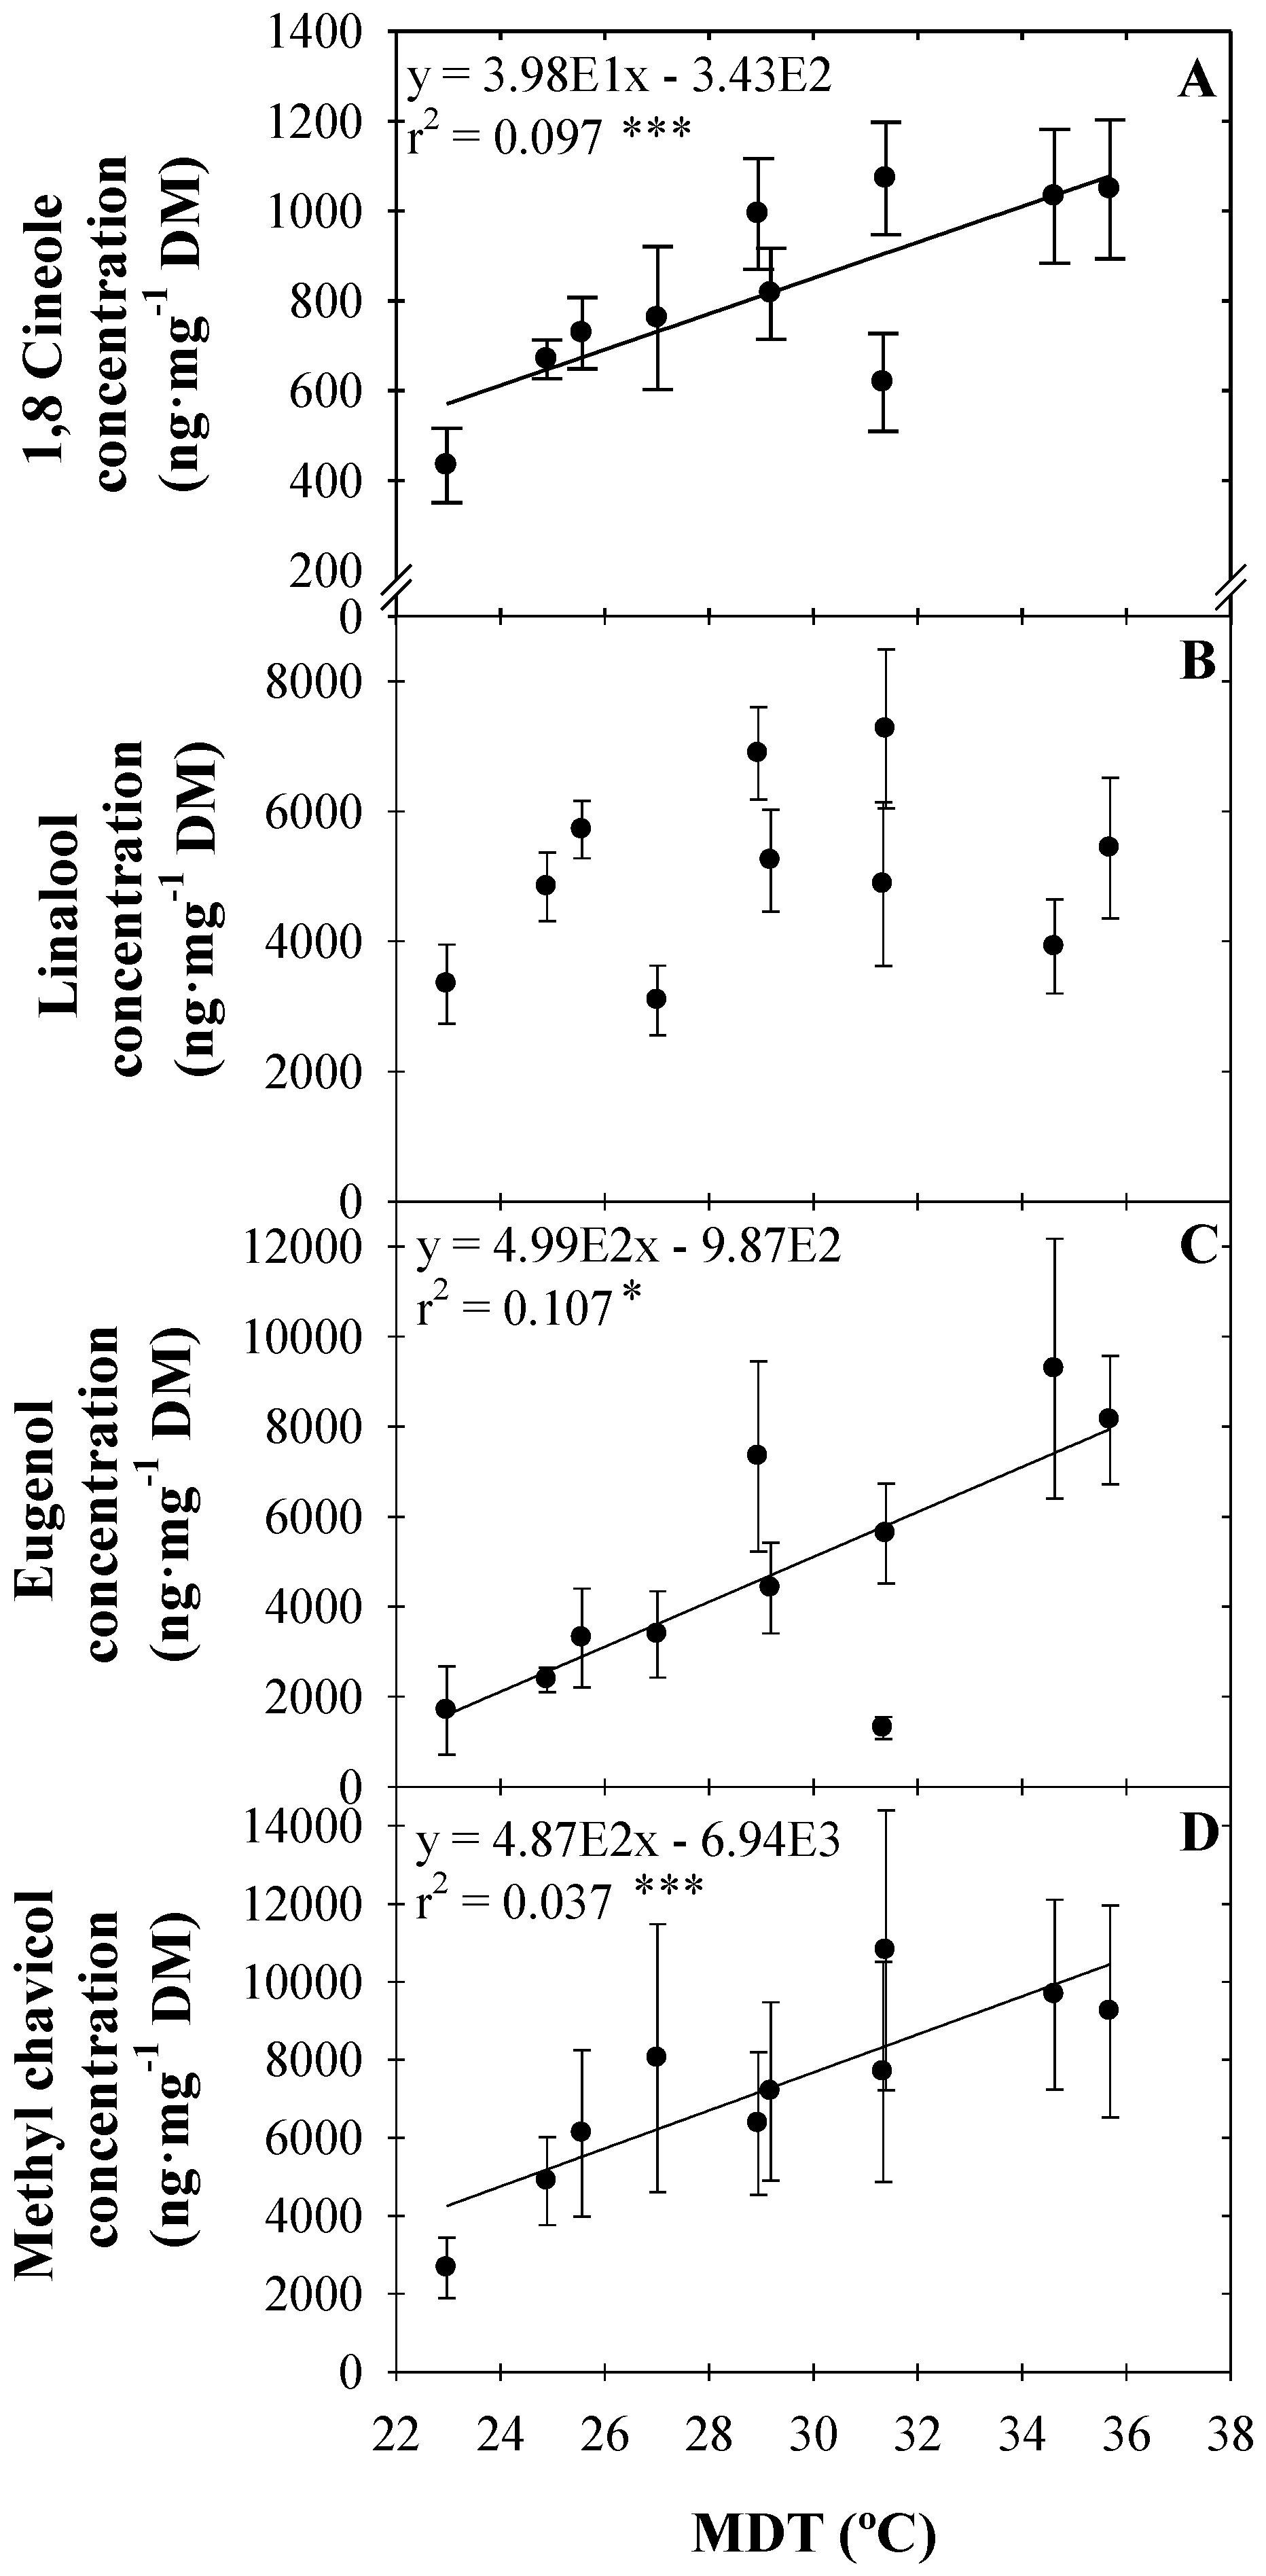
3.1. VOC Concentration

Due to the lack of a DLI×MDT interaction and main effect of DLI for any of the VOCs quantified, DLIs were pooled for GC–MS analysis. As MDT increased from 23 to 36 °C, 1,8 cineole, eugenol, and methyl chavicol concentrations increased linearly; linalool concentration was not affected (Figure 1A–D). Eugenol and methyl chavicol concentration increased at similar rates as temperature increased [487 to 499 ng·mg−1 dry mass (DM) per 1 °C], while 1,8 cineole concentration increased at a lower rate (40 ng·mg−1 DM per 1 °C).

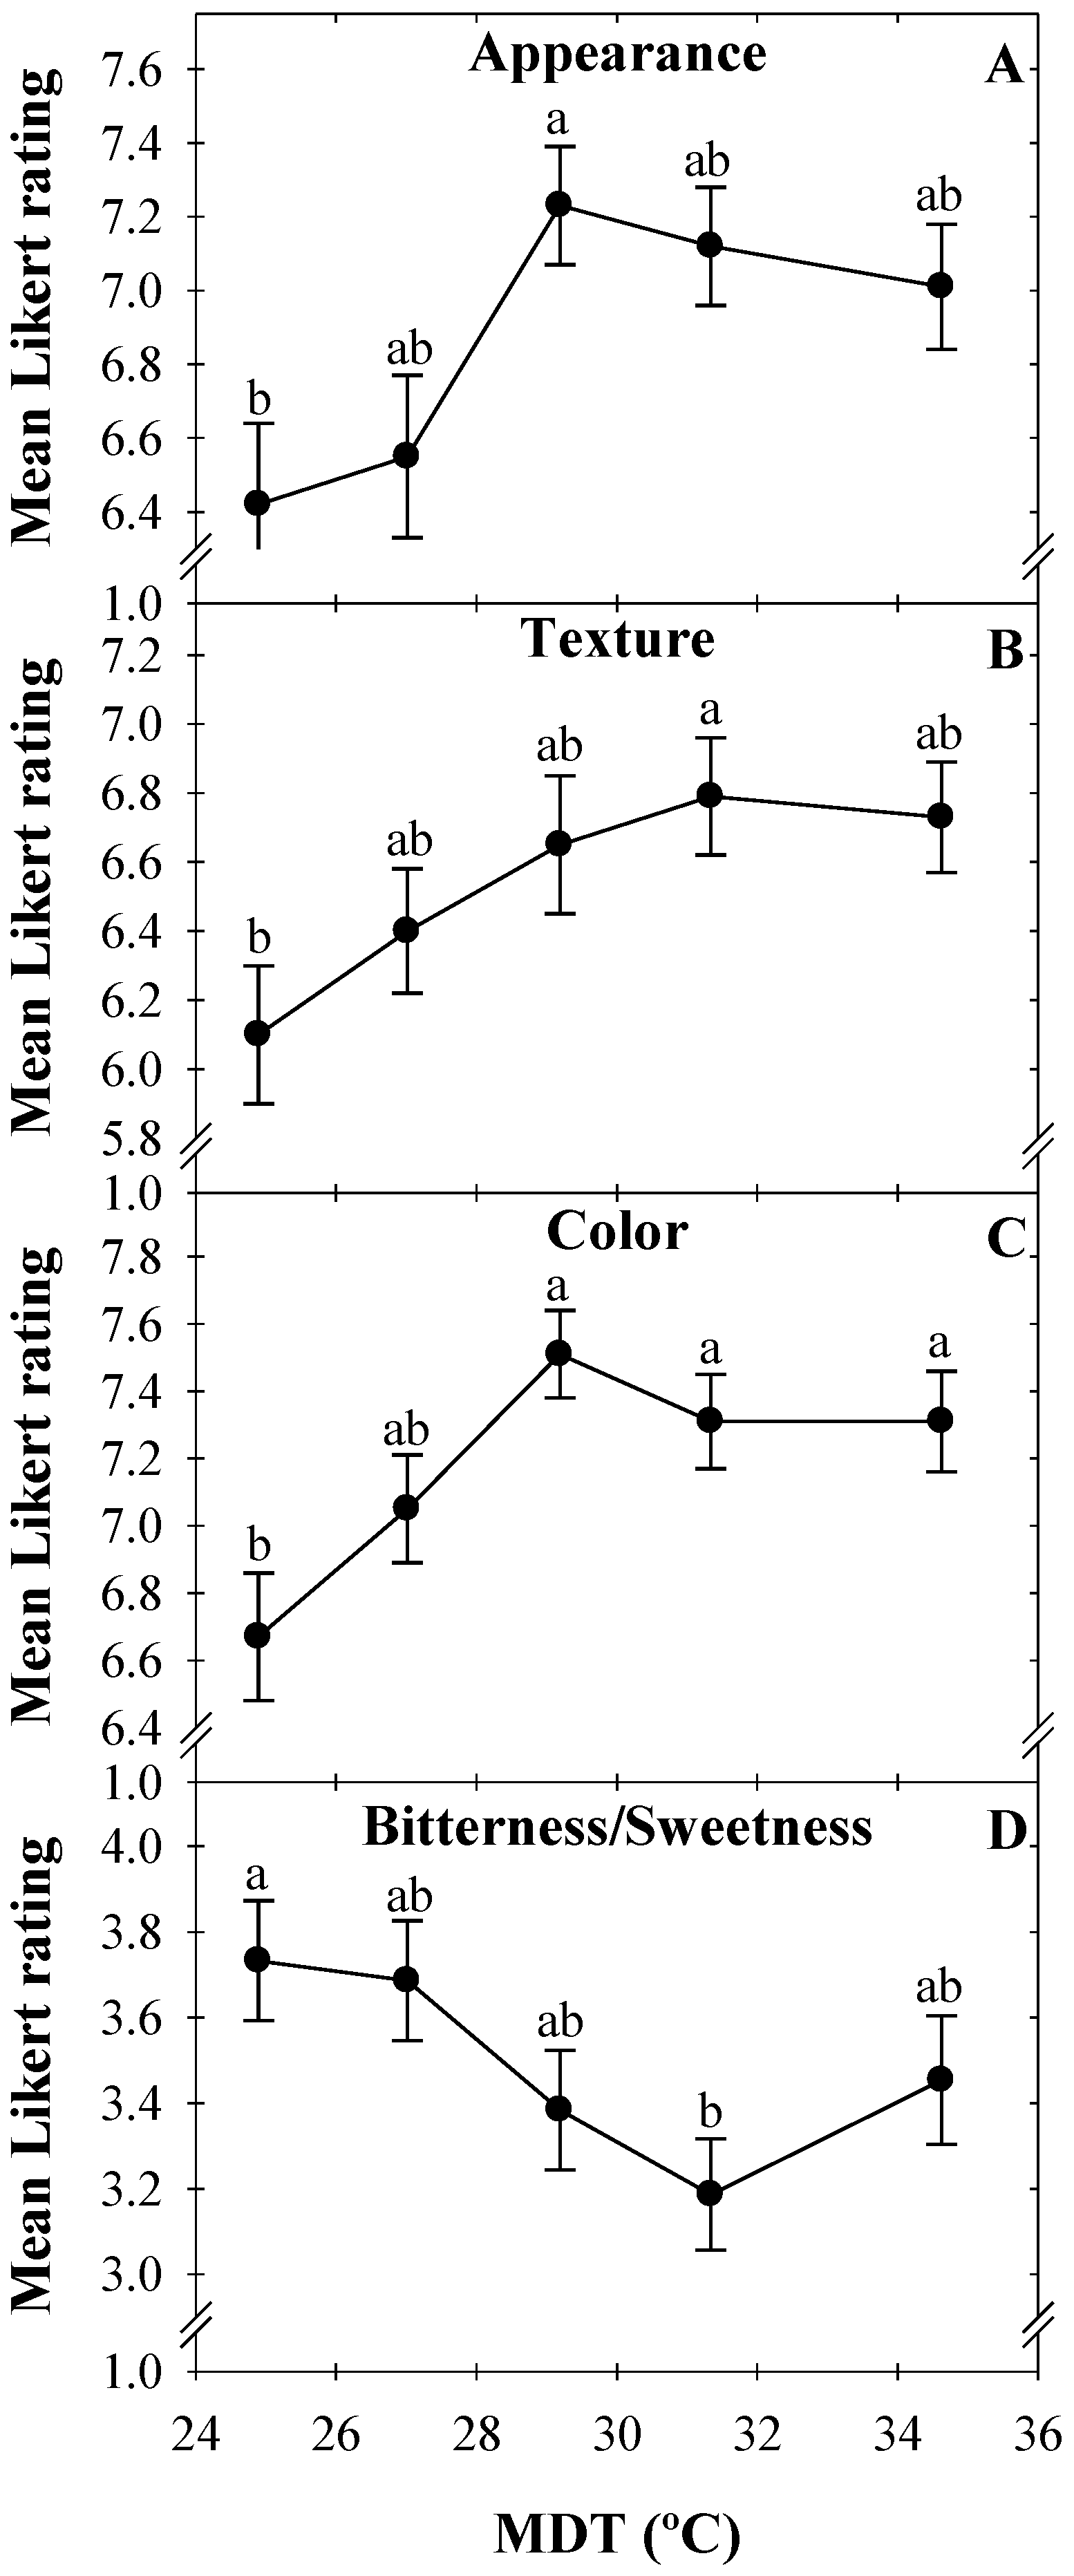
3.2. Consumer Preference

The mean age of consumer panelists was 32.4 years, with an average of 1.3 adults and 0.5 minors in the household. Fifty-eight percent of panelists were female, 41% were male, 67% were Caucasian, and 19% were Asian. Average household income was $50,000, and 64% had at least a 4-year post-secondary education.
Consumers indicated no differences in flavor, aftertaste, aroma, leaf size, or overall preference among basil grown from 25 to 35 °C (data not shown). However, they preferred the appearance, texture, and color of basil grown at some of the higher MDTs compared to 25 °C (Figure 2A–C). Plants grown at a MDT of 25 °C were considered less bitter (more sweet) than those grown at 31 °C (Figure 2D).

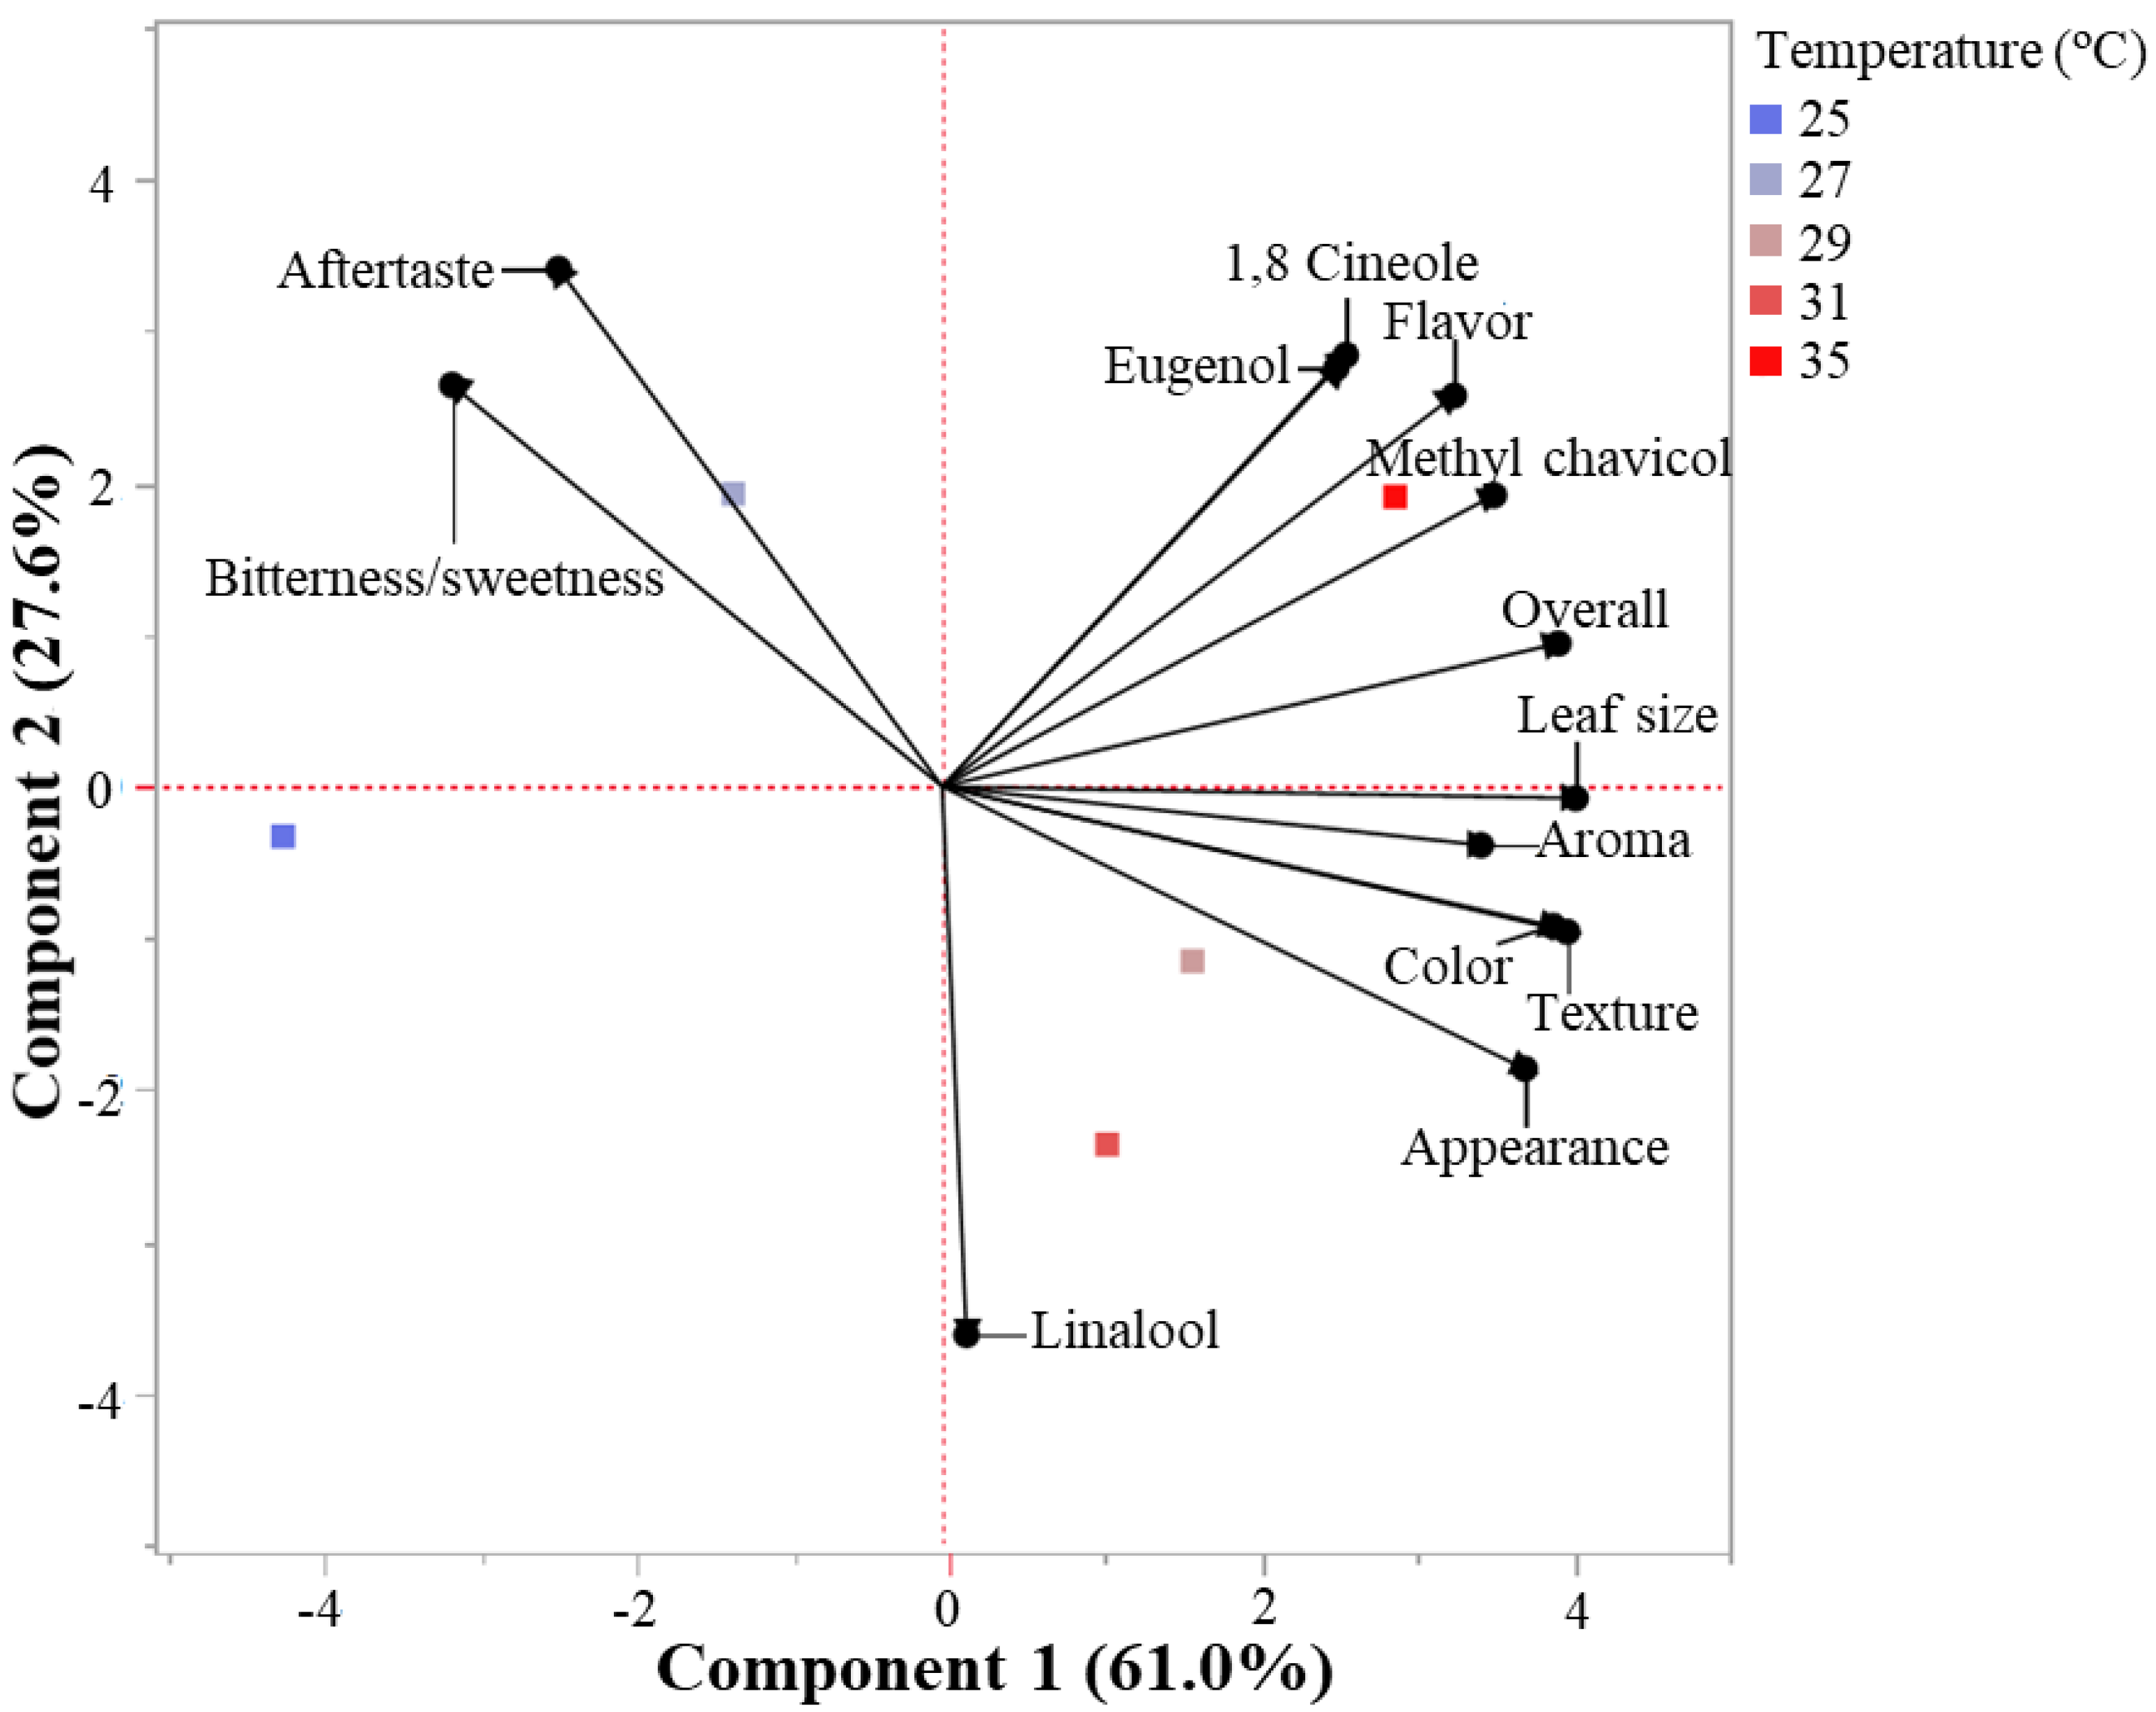
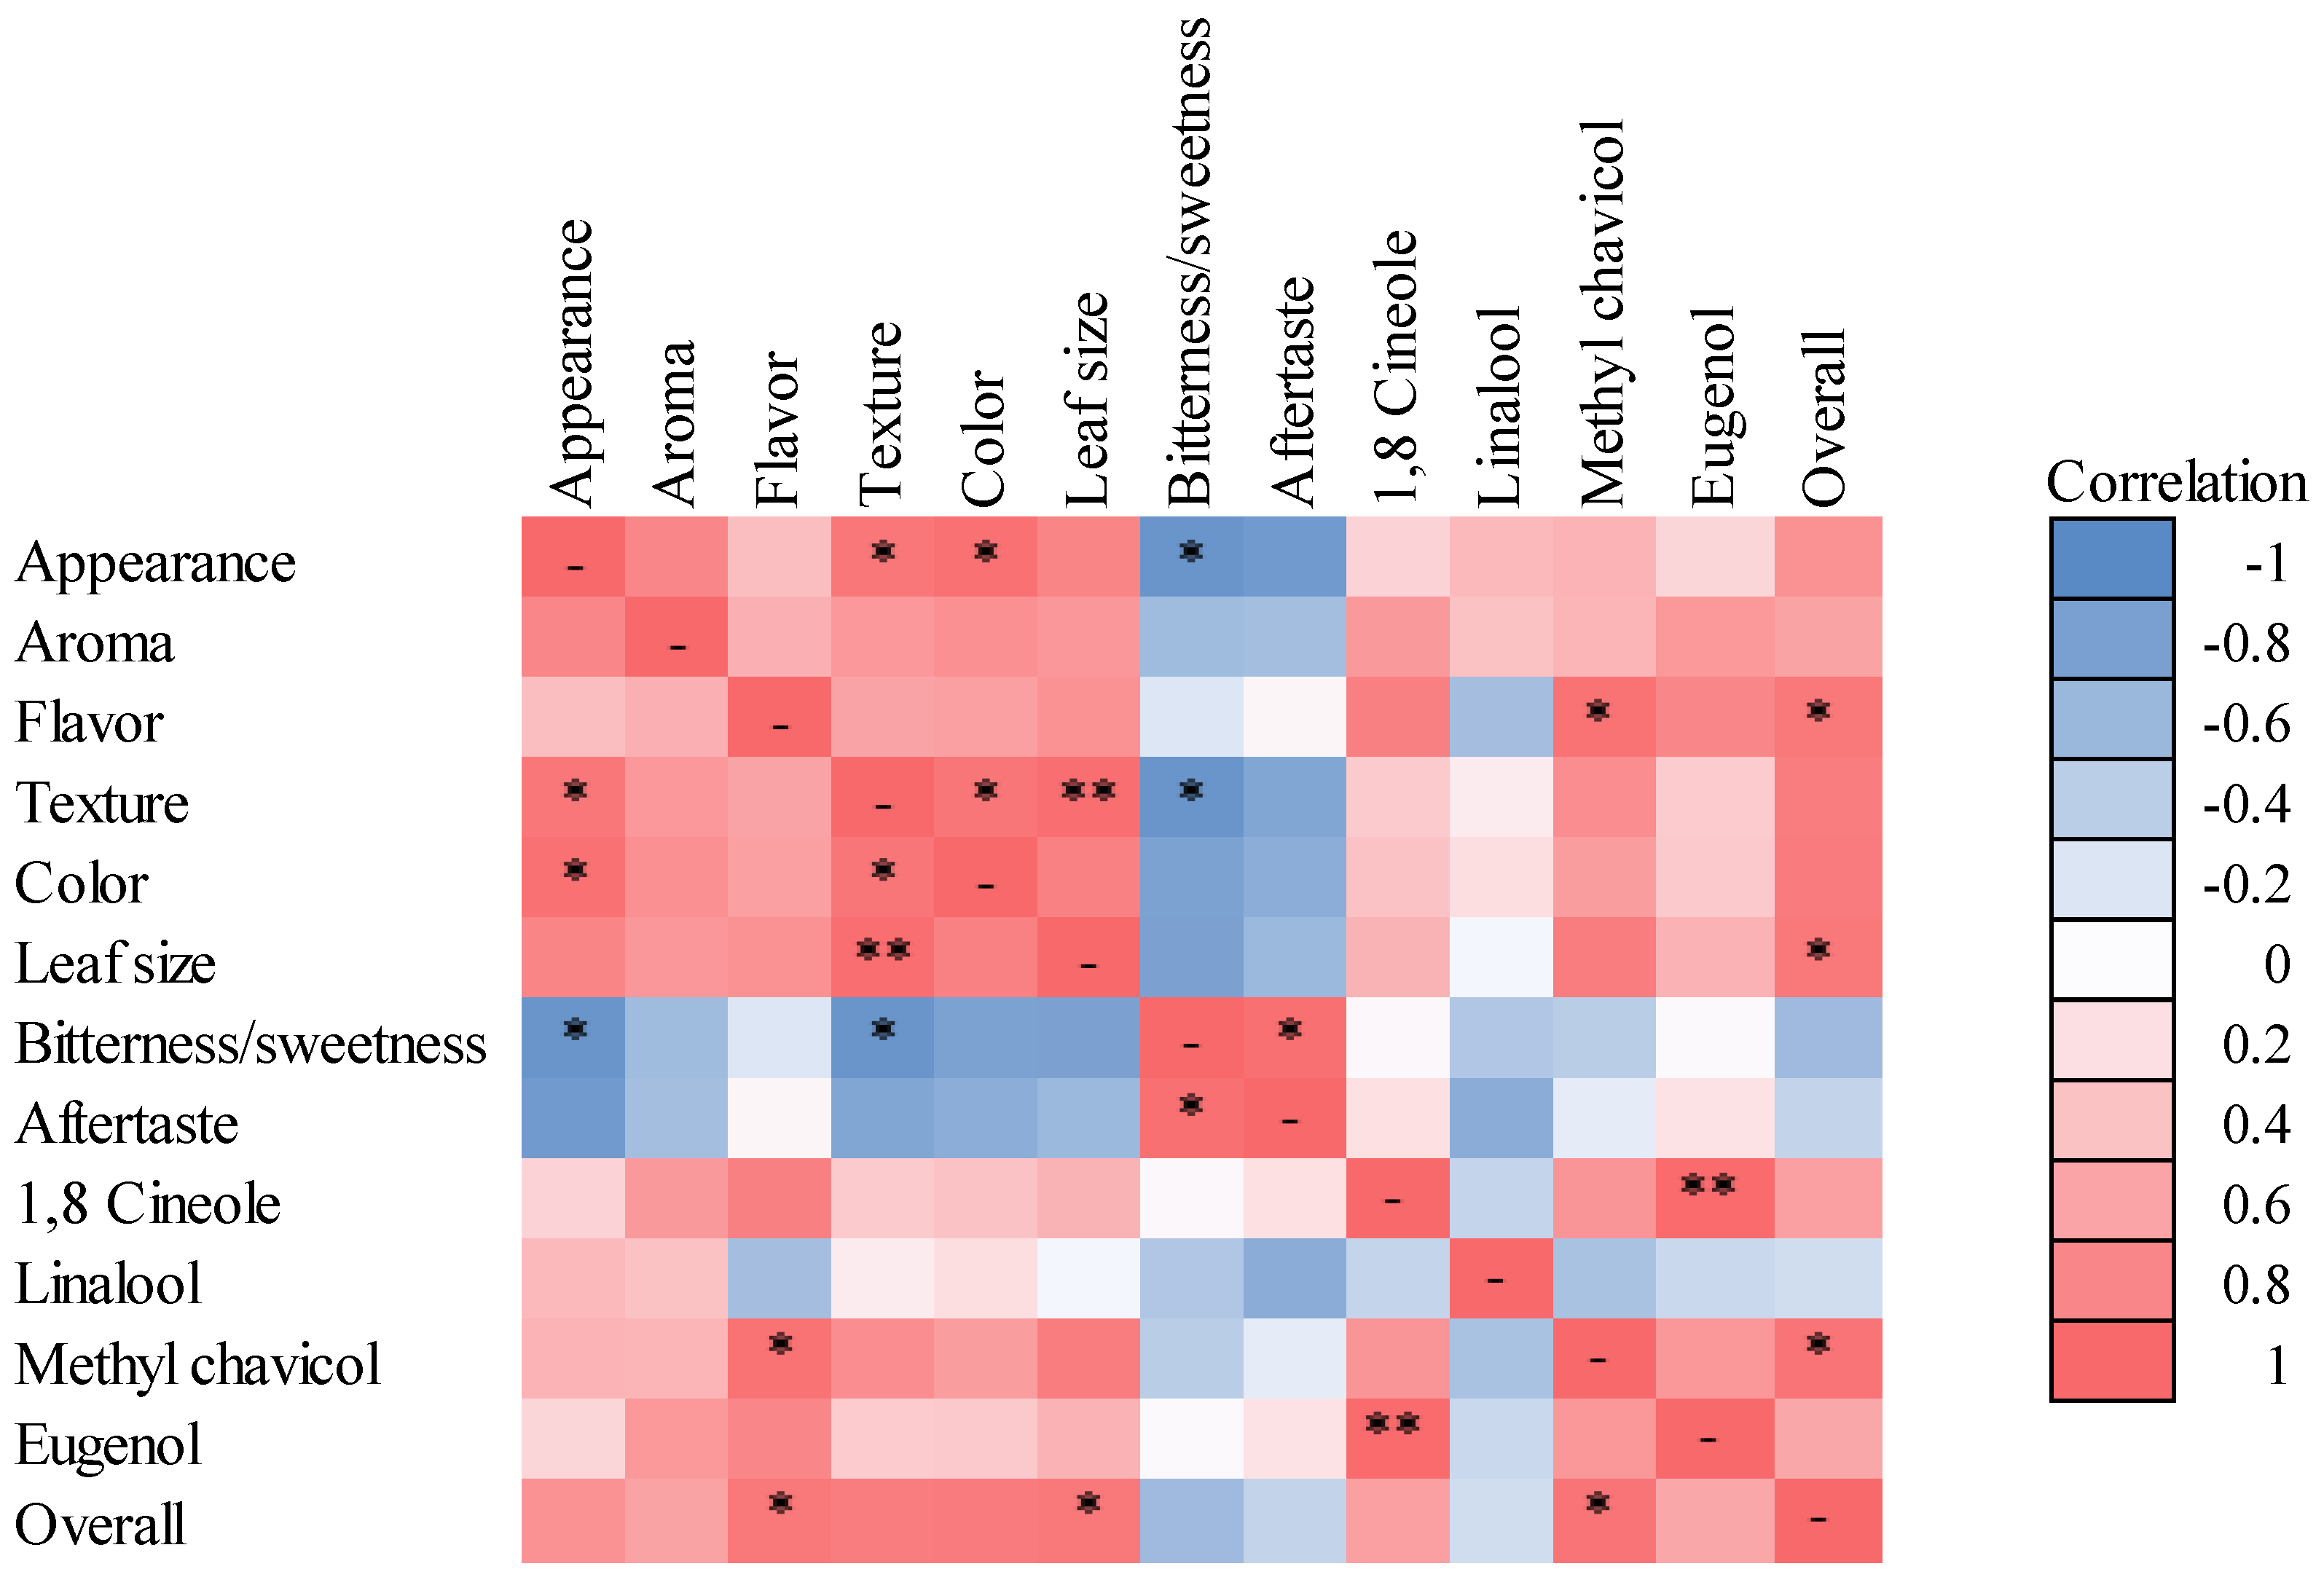
3.3. Comparison—Biplot and Correlations

A principal component analysis comparison of VOCs and consumer sensory preferences, represented by a biplot including basil samples grown at 25, 27, 29, 31, and 35 °C, determined that two components accounted for 88.6% of the total data variability (Figure 3). Component 1 separated basil grown at low MDT (25 °C) from those grown at higher MDTs (e.g., 35 °C). Positive discriminating factors for component 1 were preference for appearance, texture, color, and leaf size while negative discriminating factors were bitterness/sweetness and aftertaste preference. Component 2 positive discriminating factors were flavor preference, overall liking, and 1,8 cineole, eugenol, and methyl chavicol concentration, while there was no significant negative discriminating factor.
Appearance, texture, and color were positively correlated with each other, but appearance and texture were negatively correlated with bitterness/sweetness (increased sweetness; Figure 4). Aftertaste preference was positively correlated with bitterness/sweetness (increased sweetness). Additionally, methyl chavicol concentration was positively correlated with flavor preference and overall liking, and 1,8 cineole and eugenol concentrations were positively correlated with each other (Figure 4).

4. Discussion

4.1. Volatile Organic Compound Concentration

The linear increase in 1,8 cineole, eugenol, and methyl chavicol concentrations in response to MDT (Figure 1) may be partially explained by a commonly referred to plant development temperature–response curve. Temperature–response curves are often used to describe the relationship between plant growth or development and MDT [16,17,18,19,20], but can also be adapted to describe enzyme kinetics and other processes involving enzymatic regulation, including the biosynthesis of VOCs such as terpenoids and phenylpropanoids. Temperature plays a large role in plant enzymatic activity; as temperature increases, enzymatic activity increases up to an enzyme-dependent maximum. Above that point, many enzymes cease to function regularly [21]. Therefore, based on the temperature–response curve for VOCs (Figure 1), MDTs in the present study fall in the linear range between Tb and Topt.
The linear increase in 1,8 cineole concentration as MDT increased from 23 to 36 °C was less than the increases in eugenol and methyl chavicol concentrations. Similar results have been documented. Chang et al. [10] reported that increasing the air temperature from 15 to 25 °C increased basil ‘Basil Sweet Genovese’ eugenol concentration while 1,8-cineole and linalool concentrations were unaffected. Though they documented no differences in 1,8 cineole concentrations, their temperature range was lower (15 to 25 °C) than the present study (23 to 36 °C).
Differences in the magnitude of change (regression slope) between terpenoids and phenylpropanoids stem from the biosynthetic pathways. In addition to temperature affecting enzymatic catalysis rate, specific enzyme concentrations can be directly regulated by temperature. For example, phenylalanine ammonia lyase (PAL) catalyzes the first committed step of phenylpropanoid biosynthesis and is a key regulatory enzyme for many compounds in addition to phenylpropanoids. PAL catalyzes the removal of ammonia (NH3) from phenylalanine [22] and is positively regulated by decreasing temperatures [23]. However, this regulation affects many secondary metabolites and does not necessarily increase phenylpropanoids. For example, eugenol concentration in basil was higher when the growing temperature was higher [10]. This may be caused by different PALs playing a role in different biosynthetic pathways. However, terpene concentration is largely regulated by enzymatic activity and resource competition; the total amount of terpenes positively correlated with terpene synthase activities and negatively correlated with phenylpropanoid concentrations and PAL activity [24].
Walters et al. [13] found that VOC concentrations increased as radiation intensity increased from 100 to 600 µmol·m−2·s−1 PPFD (DLI of 6 to 35 mol·m−2·d−1). The lack of differences between DLI treatments in the current study may be due to the more narrow DLI range (5.5 to 14.8 mol·m−2·d−1), increased radiation intensity variability due to solar radiation in greenhouse production compared to sole-source lighting, or a plant age of 5 weeks compared to 2 weeks used by Walters et al. [13].

4.2. Consumer Preferences and Correlations

Though the concentrations of three compounds that contribute to the characteristic flavor of basil increased as MDT increased from 25 to 35 °C, consumer preference for flavor, aroma, and aftertaste did not change. Previously, researchers determined that consumers can detect an increase in basil aroma as growing temperatures increase from 15 to 25 °C, but there was no difference in consumer preference [12]. However, consumers are more sensitive to flavor than aroma [25]. As Walters et al. [13] found, though VOC concentrations increased as radiation intensity increased from 100 to 600 µmol·m−2·s−1 PPFD (DLI of 6 to 35 mol·m−2·d−1), the aroma of basil grown under 100 µmol·m−2·s−1 was the least-preferred and likability was similar among plants grown under 200, 400, or 600 µmol·m−2·s−1. Therefore, though consumers may perceive an increase in aroma intensity, if the aroma exhibits the characteristic aroma they expect, they may not have a concentration preference.
Previous research found that the concentration of linalool, 1,8 cineole, and eugenol of indoor-grown basil increased with increasing radiation intensity and the concentrations influenced consumer’s flavor preference [13]. However, in this study, while the concentrations of 1,8 cineole, eugenol, and methyl chavicol increased with increasing temperature, flavor preference was not influenced. Eugenol and methyl chavicol concentrations were higher in the greenhouse-grown plants in this study compared to the indoor-grown seedlings, with eugenol concentrations up to 225-fold higher and methyl chavicol concentrations ~1 to 6-fold higher. These differences may be due to plant age, as the seedlings grown indoors were two weeks old and the greenhouse-grown plants were five weeks old. Previous research demonstrated that terpenoid and phenylpropanoid concentrations of basil ‘Caesar’ were much greater in 4- to 6-week-old plants compared to 2- to 3-week-old plants [26]. In contrast, 1,8 cineole concentrations overall were comparable between the seedling radiation intensity study and the current study, but the concentration increased more in response to increasing radiation intensity during seedling production than increasing MDT during finished production. Taken together, the higher phenylpropanoid concentrations and attenuated increase in 1,8 cineole concentration may account for the lack of differences in flavor preference attributed to MDT during production.
Even though overall preference was not significantly different between basil grown at different MDTs, principal component and Pearson correlation analyses indicated that methyl chavicol concentration was positively correlated with flavor and overall preference (Figure 4). Thus, increasing the anise or licorice flavor correlated with improved consumer flavor and overall preference. Similarly, in a study comparing the oil aroma profile of basil, methyl chavicol was the compound most positively correlated with overall preference [27].
Though bitterness has evolutionarily been an indicator of the presence of harmful secondary metabolites and used in plant defense mechanisms, it is a characteristic of many preferred foods and beverages today. However, it is still generally negatively correlated with consumer preference. In the present study, consumers indicated that basil grown at 31 °C was slightly bitter while basil grown at 25 °C was more neutral, neither sweet nor bitter (Figure 2D). Additionally, aftertaste preference was positively correlated with less bitterness (Figure 4). Researchers have determined that bitter tastes tend to be perceived after other tastes and linger longer contributing to aftertaste [28]. Therefore, since increased bitterness is commonly associated with negative consumer preference, it can also be associated with a reduced aftertaste preference.
Positive discriminating factors associated with higher MDTs are greater preference for appearance, texture, color, and leaf size (Figure 3). Though these were different among basil grown at different temperatures, these factors did not influence overall preference. While visual and textural attributes can contribute to overall consumer preference, unless the appearance, texture, or color is deemed unacceptable, the correlation data indicate that factors including flavor preference may be larger indicators of overall preference (Figure 4).

5. Conclusions

Increasing MDT from 25 to 35 °C during basil production increased 1,8 cineole, eugenol, and methyl chavicol concentrations linearly. This temperature range did not affect linalool concentration. Increases in phenylpropanoids (eugenol and methyl chavicol) were greater than increases in terpenoid (1,8 cineole) concentrations. However, these increases did not influence overall consumer preference or flavor preference. MDT during basil production influenced appearance, texture, and color preference although these parameters, again, did not influence overall consumer preference. Taken together, MDT during production does influence both VOC concentrations and textural and visual attributes of basil but did not influence overall consumer preference. Therefore, changing MDT during production can be used to alter plant growth, morphology, development, and yield [14], without influencing consumer preference.

Author Contributions

Conceptualization, K.J.W. and R.G.L. conceptualized and designed the study; K.J.W. performed the experiments, conducted the data analysis, and prepared the manuscript; R.G.L. obtained funding and revised the manuscript. All authors have read and agreed to the published version of the manuscript.

Funding

This work was supported by Michigan State University AgBioResearch (including Project GREEEN GR19-019), the USDA National Institute of Food and Agriculture Hatch project nos. MICL02472, MICL02589, and MICL02473, and USDA-NIFA Specialty Crop Research Initiative award no. 2018-51181-28377, and The Fred C. Gloeckner Foundation.

Institutional Review Board Statement

The protocol for the sensory analysis portion of this study was deemed exempt and approved by the Institutional Review Board of Michigan State University on 10 September 2018 (MSU; East Lansing, MI, USA; STUDY00000169).

Informed Consent Statement

The experimental procedure was thoroughly explained to all participants and a written informed consent was obtained from each prior to participation.

Data Availability Statement

The data supporting the conclusions of this article will be made available by the authors, without undue reservation, to any qualified researcher.

Acknowledgments

We gratefully acknowledge Sean Tarr, Nate DuRussel, Cassandra Johnny, Bridget Behe, Randy Beaudry, Philip Engelgau, and Alex Renny for assistance, Jennifer Boldt, Erik Runkle, and Randy Beaudry for their thoughtful edits, JR Peters for fertilizer, Grodan for substrate, Hydrofarm for hydroponic production systems, Ludvig Svensson for shade cloth, and the Michigan State University Research Technology Support Facility Mass Spectrometry and Metabolomics Core for GC–MS access and method guidance. The use of trade names in this publication does not imply endorsement by Michigan State University of products named nor criticism of similar ones not mentioned.

Conflicts of Interest

The authors declare no conflict of interest.

References

  1. Engler, N.; Krarti, M. Review of energy efficiency in controlled environment agriculture. Renew. Sustain. Energy Rev. 2021, 141, 110786. [Google Scholar] [CrossRef]
  2. Gomez, C.; Currey, C.J.; Dickson, R.W.; Kim, H.; Hernandez, R.; Sabeh, N.C.; Raudales, R.E.; Brumfield, R.G.; Laury-Shaw, A.; Wilke, A.K.; et al. Controlled environment food production for urban agriculture. HortScience 2019, 54, 1448–1458. [Google Scholar] [CrossRef]
  3. Kolodinsky, J.; Sitaker, M.; Chase, L.; Smith, D.; Wang, W. Food systems disruptions. J. Agric. Food Syst. Community Dev. 2020, 9, 5–8. [Google Scholar] [CrossRef]
  4. Walters, K.J.; Behe, B.K.; Currey, C.J.; Lopez, R.G. Historical, current, and future perspectives for controlled environment hydroponic food crop production in the United States. HortScience 2020, 55, 758–767. [Google Scholar] [CrossRef]
  5. Santos, A.; Chierice, G.; Alexander, K.; Riga, A.; Matthews, E. Characterization of the raw essential oil eugenol extracted from Syzygium aromaticum L. J. Therm. Anal. Calorim. 2009, 96, 821–825. [Google Scholar] [CrossRef]
  6. Simon, J.E.; Morales, M.R.; Phippen, W.B.; Vieira, R.F.; Hao, Z. Basil: A source of aroma compounds and a popular culinary and ornamental herb. Perspect. New Crop. New Uses 1999, 16, 499–505. [Google Scholar]
  7. Arena, E.; Guarrera, N.; Campisi, S.; Asmundo, C.N. Comparison of odour active compounds detected by gas-chromatography–olfactometry between hand-squeezed juices from different orange varieties. Food Chem. 2006, 98, 59–63. [Google Scholar] [CrossRef]
  8. De Vincenzi, M.; Silano, M.; de Vincenzi, A.; Maialetti, F.; Scazzocchio, B. Constituents of aromatic plants: Eucalyptol. Fitoterapia 2002, 73, 269–275. [Google Scholar] [CrossRef]
  9. Hälvä, S.; Craker, L.E.; Simon, J.E.; Charles, D.J. Growth and essential oil in dill, Anethum graveolens L., in response to temperature and photoperiod. J. Herbs Spices Med. Plants 1993, 1, 47–56. [Google Scholar] [CrossRef]
  10. Chang, X.; Alderson, P.; Wright, C. Effect of temperature integration on the growth and volatile oil content of basil (Ocimum basilicum L.). J. Hortic. Sci. Biotechnol. 2005, 80, 593–598. [Google Scholar] [CrossRef]
  11. Pogany, D.; Bell, C.L.; Kirch, E.R. Composition of oil of sweet basil (Ocimum basilicum L.) obtained from plants grown at different temperatures. Perfum. Essent. Oil Rec. 1968, 59, 858–865. [Google Scholar]
  12. Chang, X.; Alderson, P.G.; Hollowood, T.A.; Hewson, L.; Wright, C.J. Flavour and aroma of fresh basil are affected by temperature. J. Sci. Food Agric. 2007, 87, 1381–1385. [Google Scholar] [CrossRef]
  13. Walters, K.J.; Lopez, R.G.; Behe, B.K. Leveraging controlled-environment agriculture to increase key basil terpenoid and phenylpropanoid concentrations: The effects of radiation intensity and CO2 concentration on consumer preference. Front. Plant Sci. 2021, 11, 1641. [Google Scholar] [CrossRef] [PubMed]
  14. Walters, K.J.; Lopez, R.G. Modeling growth and development of hydroponically grown dill, parsley, and watercress in response to photosynthetic daily light integral and mean daily temperature. PLoS ONE 2021, 16, e0248662. [Google Scholar] [CrossRef]
  15. Schilmiller, A.; Shi, F.; Kim, J.; Charbonneau, A.L.; Holmes, D.; Jones, A.D.; Last, R.L. Mass spectrometry screening reveals widespread diversity in trichome specialized metabolites of tomato chromosomal substitution lines. Plant J. 2010, 62, 391–403. [Google Scholar] [CrossRef] [PubMed] [Green Version]
  16. Adams, S.R.; Pearson, S.; Hadley, P. The effects of temperature, photoperiod and light integral on the time to flowering of pansy cv. Universal Violet (Viola × wittrockiana Gams.). Ann. Bot. 1997, 80, 107–112. [Google Scholar] [CrossRef] [Green Version]
  17. Karlsson, M.G.; Heins, R.D.; Erwin, J.E. Quantifying temperature controlled leaf unfolding rates in Lilium longiflorum Thunb. J. Am. Soc. Hortic. Sci. 1988, 113, 70–74. [Google Scholar]
  18. Pramuk, L.A.; Runkle, E.S. Modeling growth and development of celosia and impatiens in response to temperature and photosynthetic daily light integral. J. Am. Soc. Hortic. Sci. 2005, 130, 813–818. [Google Scholar] [CrossRef] [Green Version]
  19. Tollenaar, M.; Daynard, T.B.; Hunter, R.B. Effect of temperature on rate of leaf appearance and flowering date in maize. Crop. Sci. 1979, 19, 363–366. [Google Scholar] [CrossRef]
  20. Warner, R.M. Differential temperature sensitivity of flowering time and crop quality parameters of 20 seed-propagated petunia cultivars. HortScience 2020, 55, 362–367. [Google Scholar] [CrossRef]
  21. Cseke, L.J.; Kirakosyan, A.; Kaufman, P.B.; Warber, S.; Duke, J.A.; Brielmann, H.L. Natural Products from Plants; CRC Press: Boca Raton, FL, USA, 2016. [Google Scholar]
  22. Weisshaar, B.; Jenkins, G.I. Phenylpropanoid biosynthesis and its regulation. Curr. Opin. Plant Biol. 1998, 1, 251–257. [Google Scholar] [CrossRef]
  23. Leyva, A.; Jarillo, J.A.; Salinas, J.; Martinez-Zapater, J.M. Low temperature induces the accumulation of phenylalanine ammonia-lyase and chalcone synthase mRNAs of Arabidopsis thaliana in a light-dependent manner. Plant Physiol. 1995, 108, 39–46. [Google Scholar] [CrossRef]
  24. Iijima, Y.; Davidovich-Rikanati, R.; Fridman, E.; Gang, D.R.; Bar, E.; Lewinsohn, E.; Pichersky, E. The biochemical and molecular basis for the divergent patterns in the biosynthesis of terpenes and phenylpropenes in the peltate glands of three cultivars of basil. Plant Physiol. 2004, 136, 3724–3736. [Google Scholar] [CrossRef] [Green Version]
  25. Choi, N.E.; Han, J.H. How Flavor Works: The Science of Taste and Aroma; John Wiley & Sons: Chichester, UK, 2015. [Google Scholar]
  26. Carvalho, S.D.; Schwieterman, M.L.; Abrahan, C.E.; Colquhoun, T.A.; Folta, K.M. Light quality dependent changes in morphology, antioxidant capacity, and volatile production in sweet basil (Ocimum basilicum). Front. Plant Sci. 2016, 7, 1328. [Google Scholar] [CrossRef] [PubMed] [Green Version]
  27. Sheen, L.Y.; Ou, Y.H.T.; Tsai, S.J. Flavor characteristic compounds found in the essential oil of Ocimum basilicum L. with sensory evaluation and statistical analysis. J. Agric. Food Chem. 1991, 39, 939–943. [Google Scholar] [CrossRef]
  28. Naim, M.; Nir, S.; Spielman, A.I.; Noble, A.C.; Peri, I.; Rodin, S.; Samuelov-Zubare, M. Hypothesis of receptor-dependent and receptor-independent mechanisms for bitter and sweet taste transduction: Implications for slow taste onset and lingering aftertaste. In Chemistry of Taste: Mechanisms, Behaviors, and Mimics; Given, P., Paredes, D., Eds.; American Chemical Society: Washington, DC, USA, 2002; pp. 2–17. [Google Scholar]
Figure 1. Volatile Concentrations influenced by MDT. Concentrations [ng·mg−1 dry mass (DM)] of 1,8 cineole (A), linalool (B), eugenol (C), and methyl chavicol (D) of sweet basil (Ocimum basilicum ‘Nufar’) grown at mean daily temperatures (MDT) from 23 to 36 °C for three weeks. Symbols represent the mean of 15 plants ± se. Lines represent linear regression. * and *** indicate significant at p ≤ 0.05 or 0.001, respectively.
Horticulturae 08 00076 g001
Figure 2. Consumer preference influenced by MDT. Appearance (A), texture (B), color (C), and bitterness/sweetness (D) of sweet basil (Ocimum basilicum ‘Nufar’) grown at mean daily temperatures (MDT) from 25 to 35 °C for three weeks, based on a 9-point Likert scale ranging from dislike extremely (1) to like extremely (9). Means not followed by the same letter are significantly different by Tukey’s honestly significant difference test (p < 0.05). Each bar represents 86 responses ± sd.
Horticulturae 08 00076 g002
Figure 3. Sensory preference and volatile organic compound principal component analysis. Principal component analysis showing biplot differentiation of sweet basil (Ocimum basilicum ‘Nufar’) grown at mean daily temperatures (MDT) from 23 to 36 °C for three weeks, based on consumer sensory preferences (n = 86) and the concentration of two terpenoids and two phenylpropanoids (n = 15).
Horticulturae 08 00076 g003
Figure 4. Sensory preference and volatile organic compound correlation. Heat map illustrating the correlation between volatile organic compounds (VOCs) and sensory preference characteristics of sweet basil (Ocimum basilicum ‘Nufar’) grown at mean daily temperatures (MDT) from 23 to 36 °C for three weeks. Blue and red represent negative and positive correlations, respectively. Asterisks indicate significant correlations based on Pearson’s correlation *, p < 0.05; **, p < 0.01.
Horticulturae 08 00076 g004
Table 1. Mean daily light integral (DLI; mol·m−2·d−1 ± sd) and mean daily air temperature (MDT), leaf, and nutrient solution temperatures during the three-week growing period for sweet basil (Ocimum basilicum ‘Nufar’) with two replications in over time. Data were collected every 15 s with means logged every hour.
Rep.DLIMDT °C
TargetActualTarget AirActual AirLeafSolution
11212.9 ± 1.12323.0 ± 1.326.3 ± 1.321.7 ± 1.4
910.1 ± 1.02323.0 ± 1.3- z21.5 ± 1.1
77.4 ± 0.82323.0 ± 1.3-21.4 ± 1.3
1211.1 ± 1.12625.6 ± 0.627.7 ± 0.923.9 ± 0.7
99.2 ± 1.02625.6 ± 0.6-23.4 ± 0.7
78.0 ± 0.82625.6 ± 0.6-23.5 ± 0.7
1211.3 ± 1.22928.9 ± 1.930.5 ± 0.826.0 ± 1.0
98.9 ± 1.12928.9 ± 1.9-25.9 ± 0.9
76.6 ± 0.92928.9 ± 1.9-25.7 ± 1.0
1213.2 ± 1.33231.4 ± 0.735.7 ± 1.228.7 ± 0.8
99.2 ± 1.03231.4 ± 0.7-27.3 ± 0.8
77.2 ± 0.73231.4 ± 0.7-26.2 ± 0.8
1212.0 ± 1.33535.7 ± 0.836.6 ± 0.830.3 ± 0.8
98.5 ± 0.935 35.7 ± 0.8-29.6 ± 0.7
75.5 ± 0.83535.7 ± 0.8-29.2 ± 0.6
21212.4 ± 3.22324.9 ± 2.226.5 ± 1.524.6 ± 1.7
99.3 ± 2.32324.9 ± 2.2-22.9 ± 1.0 y
77.8 ± 2.02324.9 ± 2.2-23.0 ± 1.2
1213.4 ± 3.52627.0 ± 1.227.1 ± 2.026.4 ± 0.8
99.9 ± 2.92627.0 ± 1.2-25.3 ± 1.1
77.1 ± 2.32627.0 ± 1.2-24.9 ± 1.0
1214.0 ± 4.12929.2 ± 0.630.2 ± 0.926.8 ± 0.6
99.3 ± 2.92929.2 ± 0.6-26.6 ± 0.8
76.1 ± 2.12929.2 ± 0.6-26.6 ± 0.6
1214.8 ± 3.83231.3 ± 1.032.0 ± 1.828.9 ± 0.3
99.8 ± 2.53231.3 ± 1.0-28.7 ± 0.5
77.3 ± 2.03231.3 ± 1.0-28.6 ± 0.6 y
12-3534.6 ± 1.833.6 ± 0.931.6 ± 1.3
910.3 ± 2.73534.6 ± 1.8-30.2 ± 0.7
77.7 ± 2.43534.6 ± 1.8-29.5 ± 0.8
z Data not collected; y partial data reported.
Publisher’s Note: MDPI stays neutral with regard to jurisdictional claims in published maps and institutional affiliations.

