Abstract
Flaxseed could be suitable for obtaining high-quality sprouts and microgreens thanks to high amounts of nutrients and antioxidant, antidiabetic, and anticancer compound content in its seeds. Recent studies highlighted that seedling growth, nutritional compound, and secondary metabolite content can be strongly managed by regulation of the light spectrum used during germination. The present study intended to shed light on flaxseed as emerging and novel species for sprouts and microgreens and to evaluate the effect of light, with different spectrum compositions (100% blue, 100% red, 100% green, and red:green:blue—1:1:1) on the performance of flax microgreens and sprouts grown indoors under controlled conditions. Microgreens showed, compared to sprouts, a higher chlorophyll (+62.6%), carotenoid (+24.4%), and phenol content (+37.8%), antioxidant capacity (+25.1%) and a lower dry matter content (−30.7%). Besides, microgreens treated with 100% blue light were characterized by the highest content of flavonoids (2.48 mg CAE g−1 FW), total phenols (3.76 mg GAE g−1 FW), chlorogenic acid (1.10 mg g−1 FW), and antioxidant capacity (8.06 µmol TEAC g−1 FW). The paper demonstrates the feasibility of obtaining flax sprouts and microgreens indoors with a considerable antioxidant capacity and health-promoting compounds by modulating the light spectrum.
1. Introduction
Sprouts and microgreens have gained an ever-increasing popularity over the last few decades as emerging types of specialty vegetable and new functional foods. Sprouts are young seedlings obtained from seed germination with a very short growth cycle (4–10 days), while microgreens (a marketing term) are young and tender greens without roots that are harvested 10–14 days from sowing, after the development of the cotyledon leaves, and first true leaves [1].
Beside their unique taste and flavor, both sprouts and microgreens have a higher nutritional and health profile compared to seeds or mature plants, thanks to the germination process. The germination process, in fact, generally improves the overall nutritional quality by reducing the amounts of antinutrients, such as cyanogenic glycosides (CNGs), protease inhibitors and phytates, and by increasing the levels of desired compounds. Sprouting induces activation and de novo synthesis of hydrolytic enzymes that make nutrients available for plant growth and development, thus, consumption of sprouted grains is suggested to be beneficial for human health [2]. Sprouting of seeds is known to increase, in a natural way, the nutritive and nutraceutical value in terms of improved levels of oligo- and monosaccharides [3], free fatty acids [4], oligopeptides, amino acids [5], vitamins, available carbohydrates, dietary fibers, and phytochemicals such as polyphenols (flavonoids, phenolic acids, lignans, phytoestrogens). Therefore, sprouts and microgreens show very high antioxidant, antidiabetic, and anticancer properties [6], and, in the specific case of microgreens, the greater content of phytochemicals and antioxidants were found in the first pair of leaves than in the mature ones [7]. The relative amounts of all these health-promoting compounds depend on the plant species, cultivar, environmental conditions, germination performances (germination percentage and mean germination time), storage, and processing.
The number of plant species that can be consumed as sprouts or microgreens is huge and the most exploited include cereals, legumes, crucifers, oilseeds [2,8]. Among the latter, flaxseed (Linum usitatissimum L., Linaceae family), although little investigated for sprouting purposes, could represent an appreciated plant species for obtaining high-quality sprouts and microgreens thanks to several peculiar traits of its seeds. Flaxseed has regained, in recent years, a growing interest as an important functional food ingredient owing to the presence, in its seeds, of high amounts of nutrients and biologically active compounds such as high-quality proteins, a very high amount of polyunsaturated fatty acids (PUFAs), especially α-linolenic acid (>50% of total fatty acids), dietary fibers and phenolic compounds, such as phenolic acids (mainly ferulic acid, chlorogenic acid, and gallic acid), flavonoids (belonging to the sub-group of flavones), and lignans (mainly secoisolariciresinol diglucoside) [9,10,11]. Finally, flaxseed contains carotenoids such as β-carotene [12] and water-soluble and fat-soluble vitamins, mostly represented by vitamin E, in its γ-tocopherol form, responsible for protection of cell proteins and fats against oxidation processes [11]. Beside their content in functional elements, flaxseed is not totally free of anti-nutritional factors, such as cyanogenic glycosides (CNGs) and phytates. To overcome this, the germination process could be adopted also in flaxseed in order to obtain sprouts and microgreens with reduced levels of antinutrients [13,14], as done for other plant species [15,16]. To date, flaxseed sprouts have been little investigated, and the few studies carried out on this topic have shown higher content of essential micronutrients (Fe, Mn, and Zn) compared to the seed themselves [17], high level of phenolic compounds [18], water-soluble proteins and free amino acids [13], free fatty acids, glycolipid fractions, lysophosphatidylcholine, and phospholipids [19]. On the other hand, biochemical composition can be strongly influenced by environmental factors, such as light (exposure to different light spectrum, intensity, or dosage) [1], since light plays a crucial role in modulating the concentration of plant secondary metabolism.
Recent studies have highlighted the possibility of regulating seedling growth and increasing the content of pivotal nutritional compounds and secondary metabolites through appropriate regulation of the light spectrum used during germination. Many recent studies underlined the diversity of response of several crops towards different light conditions, in terms of both quality (wavelength) and dose (intensity and duration of exposure) [20,21]. Particularly, recent studies on microgreens and sprouts have shown the strong influence of red- and blue-light supplementation on carotenoids, chlorophylls, and phenolics accumulation in several plants of food interest, e.g., soybean, mustard, beet, pak choi, and parsley [22,23,24]. To the best of our knowledge, there are no data in the literature about the effect of different light spectra on growth and quality of sprouts and microgreens deriving from flaxseed. Therefore, the present study intends to shed light on flaxseed as emerging and novel species for sprouts and microgreens and to evaluate the effect of light, with different spectrum compositions, on the performance of flaxseed microgreens and sprouts grown indoors under controlled conditions. The variant effect of light treatment, on pigments and antioxidant compounds, was compared in microgreens and sprouts.
2. Materials and Methods
2.1. Plant Material and Growth Conditions
Two experiments were conducted, so that the second one was the replication of the first one, at the Department of Agriculture, Food and Environment of the University of Pisa, Italy (latitude 43°40′ N) during December 2020 and January 2021. Seeds of flaxseed (Linum usitatissimum L.) were used as starting material.
The brown seeds, of the commercial variety Sideral, (Semfor s.r.l., Verona, Italy), were preliminary tested for germination (G%) and mean germination time (MGT, days), according to the International Rules for Seed Testing [25]. For each accession, four replications of 100 seeds each were placed on Petri dishes on filter paper soaked in water (5 mL) and incubated for 16 h dark at 20 °C and 8 h light at 30 °C in germination cabinets. Germination was monitored every 2 days up to 21 days. Germination ended with the appearance of cotyledons. Germinated seeds were daily counted, and germination counts were stopped when final germination percentages were reached.
Germination percentage averaged 98% (±2.36) and mean germination time 3.00 (±0.17) days.
For the experiments, the seeds were sown in plastic trays (10 × 6.5 cm), on a substrate consisting of moistened filter paper placed on a jute felt (for sprout production) or directly on the jute felt (air porosity 87.6%, free porosity at pF1 46.5%, water-retention capacity 41.1%, Green Felt, http://www.maiano.it/eng/nursery.html, accessed on 18 January 2022) (for microgreen production). Before sowing, seeds were soaked in distilled water for 2 h at room temperature (18 °C) in the dark and then thoroughly rinsed with distilled water to remove seed-coat mucilage. In order to obtain about 2 seeds cm−2, 1 g of seeds (about 130 seeds) was sown on each tray (replicate), and watered with distilled water. After sowing, the trays were moved in a growth chamber, and kept in the dark at 20 °C for 72 h. Then, LED lights (AMBRALIGHT, LED AE80), with different spectrum compositions (detailed below), were used to provide 200 PPFD with a photoperiod of 24 h for 4 days, and 16 h for the next 7 days. The 16 h photoperiod was chosen since it is commonly used for the cultivation of microgreens, and we have previously used this photoperiod in others experiments with microgreens [26].
Before starting the experiments, the seeds were characterized in terms of fatty-acid composition and phytochemical properties. The results obtained from these assays are reported in Table 1.

Table 1.
Chemical characterization of flaxseed seeds: fat (%), most-representative fatty acids (relative %), total phenols, and total flavonoids.
2.2. Experimental Design
Three replicates, composed of two trays of seedlings, were used for each treatment (six trays of each treatment in each experiment). The light spectrum of the different treatments was: 100% blue (peak at 450 nm) (B), 100% red (peak at 660 nm) (R), 100% green (peak at 520 nm) (G), and R:G:B—1:1:1 (RGB). Trays were watered using a half-strength Hoagland’s nutrient solution with this composition: N-NO3 7.5 mM, P-H2PO4 0.5 mM, K 3.0 mM, Ca 2.5 mM, Mg 1.0 mM, Fe 25.0 µM, B 23.1 µM, Mn 4.6 µM, Zn 0.39 µM, Cu 0.16 µM, Mo 0.06 µM. The pH was 5.56, and the electrical conductivity (EC) was 1.15 mS cm−1.
2.3. Determinations
2.3.1. Biomass Production
Sprouts and microgreens were harvested 4 (7 days after sowing) and 11 (14 days after sowing) days after turning on the lights, respectively, and fresh weight (FW) was determined. Sprouts were constituted by shoots and rootlets, otherwise, microgreens were cut just above the growth substrate and were constituted only by shoots. After drying in a ventilated oven at 70 °C, for 4 days, till constant weight, dry weight (DW) of samples was measured. The fresh and dry biomass production were expressed as g FW m−2 and g DW m−2, respectively.
2.3.2. Total Phenol and Flavonoid Content
Total phenol and flavonoid contents were determined in fresh samples of sprouts and microgreens at harvest. An aliquot of 100 mg of vegetable tissues (FW) was extracted with 5 mL methanol 99% (v/v).
Total phenolic content was measured using the Folin–Ciocalteau reagent [27], and calculated using the calibration curve containing 0, 50, 100, 150, and 250 mg gallic acid equivalents (GAE) L−1. Values were expressed as mg of GAE g−1 FW.
For the determination of flavonoid content, 0.1 mL of the methanolic extract was added to 60 µL of NaNO2 (5%), 40 µL of AlCl3 (10%), and after 5 min, 0.4 mL of NaOH and 0.2 mL of H2O. Then, the absorbance was read at 510 nm. The results were expressed as mg catechin (CAE) g−1 FW [28].
2.3.3. Chlorogenic Acid Content
The chlorogenic acid content of the methanolic extracts was evaluated by HPLC. The chromatographic apparatus (Jasco, Tokyo, Japan) included a PU-2089 four-solvent low-pressure gradient pump and an MD-4010 diode array detector. The HPLC separation was performed using a Macherey–Nagel C18 250/4.6 Nucleodur® 100–5 Isis column equipped with a guard column, at a flow rate of 1 mL min−1. Injection volume was 20 µL and the working wavelength range was 220–550 nm. Acetonitrile (solvent A) and 0.1% phosphoric acid (solvent B) were used for elution, with the following gradient: 0–12 min, A 10–25%; 12–13 min, A 25–95%; 13–16 min, A 95%; 16–17 min, A 95–100%, followed by 5 min equilibration (A 100%). Based on the chromatographic profile that was observed, standard solutions of chlorogenic acid (Sigma-Aldrich, Milano, Italy) in the range 5–20 mg L−1 were used for calibration.
2.3.4. Antioxidant Capacity
The leaf antioxidant capacity was measured using both the FRAP [29] and the ABTS [30] assays. In the former method, 0.1 mL of the methanol extract was added to 0.9 mL of FRAP reagent, which consisted of 1 mM 2,4,6-tripyridyl-2-triazine (TPTZ) and 2 mM ferric chloride in 250 mM sodium acetate (pH 3.6), then mixed and kept at 20 °C for 4 min. The absorbance was read at 593 nm, and the results were expressed as µmol of Fe(II) mg−1 FW. The ABTS assay is based on the decolorization of ABTS˙+, the cationic radical of 2,2′-azinobis-(3-ethylbenzothiazoline-6-sulphonic acid), at 30 °C. The radical solution, containing 7 mM ABTS and 2.45 mM potassium persulfate, was prepared 16 h before use and was diluted immediately before the assay to an absorbance value of about 0.7 at 734 nm. The absorbance was measured 1 min after addition of 100 µL methanol (blank) or properly diluted methanolic extract (sample) to 1.0 mL ABTS˙+ solution, and the percentage inhibition was calculated as % Inhibition = (Ablank − Asample)/Asample ∗ 100. A concentration–response curve was obtained in the same way using standard Trolox solutions (0–16 µM) and the results were expressed as μmol Trolox equivalents g−1 FW.
2.3.5. Chlorophyll, Carotenoid, and Anthocyanin Content
Total chlorophyll, chlorophyll a, b, and carotenoid content were determined in fresh samples according to the Lichtenthaler method [31]. Foliar fresh tissues (100 mg) were extracted with 5 mL methanol 99% v/v. The concentrations of chlorophyll a, chlorophyll b, and carotenoids were calculated using the Welburn and Lichtenthaler equation [32].
The total anthocyanin content was assessed in fresh samples of the second experiment. A 100 mg measure of fresh microgreens was extracted using 5 mL of acidified 80% methanol (containing 1% hydrochloric acid). The absorbance of acid extract was read at 530 nm and the results were expressed as mg cyanidin-3-glucoside (C3G) g−1 FW, using the value 38,000 M−1 cm−1 for the molar absorptivity [33].
2.4. Statistical Analysis
Since the second experiment was the replication of the first one and the results obtained from the two experiments agreed, the data of the both experiments were analyzed together, and thus, the final value is the result of the mean of six replicates. The data of the anthocyanin content were separately analyzed since it was measured only in the second experiment, and in this case the replicates are three. Data were subjected to two-way ANOVA, with stage and light treatment as variables. Mean values were separated by LSD test (p < 0.05). A principal component analysis (PCA) was also performed on the measured parameters, after standardization of data. Statistical analysis was performed using R Statistical Software.
3. Results
The differences reported in the following sections refer to average values of the two experiments.
3.1. Effect of Harvest Stage
The harvest stage significantly affected the fresh biomass and the dry matter content. The fresh biomass (FW) was higher in microgreens than in sprouts (Table 2). Besides, the dry matter content was 44.7% higher in sprouts than in microgreens (Table 2).
Table 2.
Fresh (FW) and dry (DW) biomass and dry matter content (DW/FW) of microgreens of flaxseed grown indoors under controlled conditions with different light-spectrum compositions (100% blue (peak at 450 nm) (B), 100% red (peak at 660 nm) (R), 100% green (peak at 520 nm) (G), and R:G:B—1:1:1 (RGB)).
Microgreens showed a higher content of chlorophyll a, b, total chlorophylls, and a lower amount of carotenoids, compared to sprouts (Table 3). Otherwise, in the second experiment, the anthocyanin content was 45.2% lower in microgreens compared to sprouts (Figure 1).
Table 3.
Chlorophyll a (Chl a), chlorophyll b (Chl b), total chlorophylls (Chls tot), and carotenoids (Car) content, in microgreens of flaxseed grown indoors under controlled conditions with different light-spectrum compositions (100% blue (peak at 450 nm) (B), 100% red (peak at 660 nm) (R), 100% green (peak at 520 nm) (G), and R:G:B—1:1:1 (RGB)).
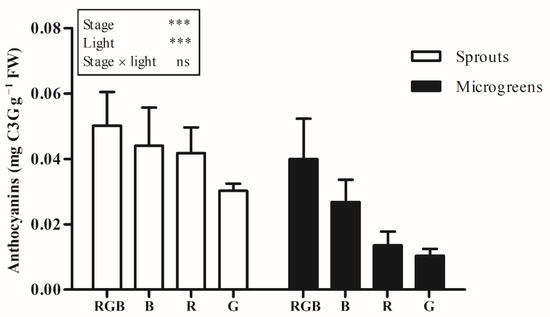
Figure 1.
Anthocyanin content, in sprouts and microgreens of flaxseed grown indoors under controlled conditions with different light-spectrum compositions (100% blue (peak at 450 nm) (B), 100% red (peak at 660 nm) (R), 100% green (peak at 520 nm) (G), and R:G:B—1:1:1 (RGB)), during the second experiment. Means (n = 3) followed by the same letter are not statistically different for p = 0.05 after LSD test. Significance level: *** p ≤ 0.001; ns = not significant. Bars represent the standard error.
Higher total phenol and flavonoid content, respectively, was detected in microgreens compared to sprouts (Figure 2).
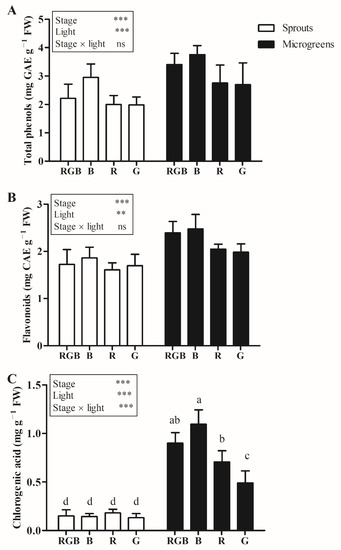
Figure 2.
Total phenols (A), flavonoids (B), and chlorogenic acid—(C) content in sprouts and microgreens of flaxseed grown indoors under controlled conditions with different light-spectrum compositions (100% blue (peak at 450 nm) (B), 100% red (peak at 660 nm) (R), 100% green (peak at 520 nm) (G), and R:G:B—1:1:1 (RGB)). Means (n = 6) flanked by the same letter are not statistically different for p = 0.05 after LSD test. Significance level: *** p ≤ 0.001; ** p ≤ 0.01; ns = not significant. Bars represent the standard error.
3.2. Effect of Light Treatments
Treatment with B light increased the dry matter content of sprouts and microgreens, compared to R (+17.7%) and G (+14.2%) light. Besides, no differences in dry matter content were detected between RGB and the other treatments (Table 2).
The carotenoid content in RGB treatment was 15.4 and 27.2% higher than in B and G treatment, respectively, and there were no differences between RGB and R treatments (Table 3). Sprouts and microgreens treated with RGB light also showed a higher anthocyanin content in compared to R and G treatment and the lowest content of anthocyanin was detected in G treatment. (Figure 1).
Light treatments significantly affected the total phenol and flavonoid content, which showed the highest value in B treatment (Figure 3).
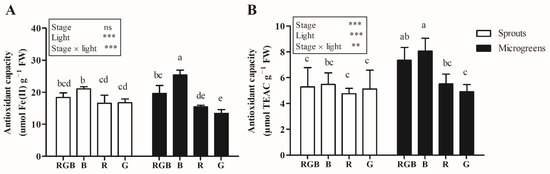
Figure 3.
Antioxidant capacity, measured by FRAP (A) or ABTS (B) assay, in sprouts and microgreens of flaxseed grown indoors under controlled conditions with different light-spectrum compositions (100% blue (peak at 450 nm) (B), 100% red (peak at 660 nm) (R), 100% green (peak at 520 nm) (G), and R:G:B—1:1:1 (RGB)). Means (n = 6) followed by the same letter are not statistically different for p = 0.05 after LSD test. Significance level: *** p ≤ 0.001; ** p ≤ 0.01; ns = not significant. Bars represent the standard error.
Besides, no differences were detected between the content of total phenols and flavonoids in sprouts and microgreens treated with B and RGB and between the RGB, B, and R treatments (Figure 3).
3.3. Effect of Interaction of Harvest Stage and Light Treatment
Light treatment significantly affected the chlorogenic acid content only in microgreens, where treatment with B light showed a higher chlorogenic acid content compared to treatment R (+54.9%) and G (+123.0%). No significant differences were detected between microgreens treated with RGB or B light (Figure 2).
The interaction between the harvest stage and the light treatment significantly affected the antioxidant capacity. The antioxidant capacity, measured by FRAP assay, of microgreens grown under B light was higher compared to the other treatments. Besides, in sprouts treated with B light, the antioxidant capacity, measured by FRAP assay, was higher only than sprouts grown under G light. When measured by ABTS assay, the antioxidant capacity was affected by light treatment only in microgreens, where treatment with B light induced a higher antioxidant capacity compared to R (+46.3%) and G (+64.3%) light (Figure 3).
3.4. Principal Component Analysis (PCA)
A PCA was carried out in order to investigate whether there were factors grouping correlated qualitative characteristics, of sprouts and microgreens, together and to identify clusters across species and stages of harvest. Since we measured the anthocyanin content only in the second experiment, those data were excluded from the PCA. The first two principal components (PCs), explaining a cumulative variance of 76.7%, were identified based on a screen plot of eigenvalues. PC1, which explained 61.4% of the total variance, was positively correlated with chlorophyll a, b, total chlorophylls, carotenoids, flavonoids, chlorogenic acid, and antioxidant capacity, measured by ABTS assay, and negatively to dry matter content, while PC2 (15.3% of the total variance) was negatively correlated to dry matter content and antioxidant capacity, measured by FRAP assay.
The loadings reported in Figure 4 illustrate the relationships between the parameters measured in this study. Parameters located close to each other had a strong co-variance. Moreover, parameters far from the origin contributed more to the PCs than parameters close to it. In the right half of Figure 4, a cluster, with chlorophylls a, b, and total, and carotenoids and a second cluster with total phenols, flavonoids, and antioxidant capacity, measured by ABTS assay, suggested a strong co-variance between these variables, as well as a strong contribution of these clusters, together with chlorogenic acid to PC1, and on the opposite side, dry matter content. The most important variable contributing to PC2 was antioxidant capacity, measured by FRAP assay.
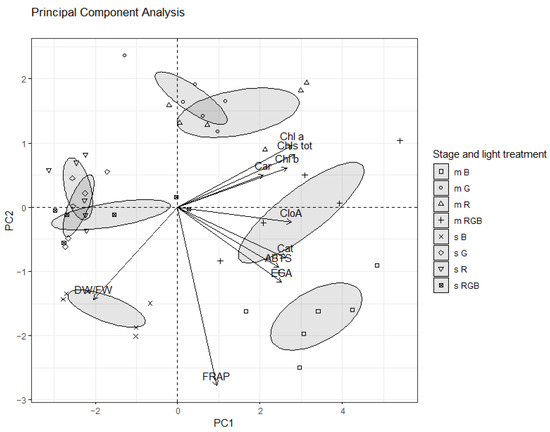
Figure 4.
Loading and score plot for PC 1 and 2, describing variation in qualitative characteristics of sprouts (s) and microgreens (m) of flaxseed grown indoors under controlled conditions with different light-spectrum compositions (100% blue (peak at 450 nm) (B), 100% red (peak at 660 nm) (R), 100% green (peak at 520 nm) (G), and R:G:B—1:1:1 (RGB)).
The scores reported in Figure 4 show the relationship existing between the analyzed samples. PC1 and PC2 discriminated five main groups: sprouts treated with R (sR), G (sG), and RGB (sRGB) light, sprouts treated with B (sB) light, microgreens treated with G (mG) and R (mR) light, microgreens treated with RGB (mRGB) light, and microgreens treated with B (mB) light. sB were positioned in the down-left half of the plot (negative side of PC1), and were characterized by the highest dry matter content, followed by sR, sG, and sRGB. Sprouts were characterized by the lowest content of chlorophylls and carotenoids. sR, sG, and sRGB also showed the lowest content of chlorogenic acid, flavonoids, total phenols, and antioxidant capacity, measured by ABTS assay (Figure 4).
All microgreens were located in the right half of the plot (positive side of PC1). Besides, microgreens treated with B light were separated from the other treatments, and were characterized by the highest content of flavonoids, total phenols, chlorogenic acid, and antioxidant capacity. mRGB showed a higher content of chlorogenic acid, total phenols, flavonoids, and antioxidant capacity compared to mG and mR (Figure 4).
In general, microgreens showed the highest values of chlorophylls, carotenoids, phenols, antioxidant capacity, and the lowest dry matter content (Figure 4).
4. Discussion
4.1. Sprouts and Microgreens Characterization
The higher fresh biomass production of microgreens is due to the most advanced growth stage though, conversely from sprouts, roots were not harvested. A higher production of microgreens compared to sprouts has been already detected in Brassica oleracea L. [34]. In our experiments, the dry matter content of flax sprouts was higher than the values reported by Wang et al. [18,35] and Wu et al. [36], and lower than those reported by Narina et al. [17], showing that the dry matter content of flax sprouts could be quite variable, ranging from 5.5 [36] to 24% [17]. The lower dry matter content observed in our study in comparison with Narina et al. [17] could be due to the older sprouts harvested in our experiment (7 vs. 4 days in [17]). In fact, the dry matter content decreases going from sprouts to microgreens, and a higher dry matter content in sprouts was already detected in sprouts of Amaranthus tricolor compared to microgreens [37]. In the literature, there is no information about the dry matter content of flaxseed microgreens. Besides, among different species of microgreens tested by Xiao et al. [38], pea microgreens showed a dry matter content close to that detected in our experiments. Otherwise, microgreens of other species showed lower dry matter content [26,38].
The color of sprouts and microgreens is one of the first attributes that affects consumers’ choice and, consequently, the acceptability of the product, and, thus, it represents a key parameter determining their quality. Microgreens could be more attractive for consumers than sprouts due to their higher content of photosynthetic pigments, which could be due to the longer light exposure [39] and to the higher ratio between the leaf biomass and stem plus roots, the latter with a lower content of pigments. Total phenolic content in sprouts detected in our experiment results were higher compared to the values reported by Wu et al. [36], although the chlorogenic acid content was in the range reported by the same authors. Similarly, the sprout flavonoid content detected in our study was higher than that reported by Wang et al. [35] and very close to the findings of Wang et al. [18]. Besides, the chlorogenic acid content reported in sprouts resulted higher compared to the content found by Wu et al. [36] in flax sprouts. Wang et al. [18] investigated the dynamic of accumulation of phytochemical compounds in flaxseed sprouts during germination. These authors observed, at eighth of germination, a 22.1-fold increase in vitamin C, 2.67-fold increase in total phenol, and 5.48-fold increase in flavonoid contents as compared to initial concentration in seeds. According with our experiment, an increase in total phenols and flavonoids occurred passing from seeds to sprouts, and a further increase was also observed passing from sprouts to microgreens, irrespective of the light spectrum.
Interestingly, Wang et al. [18] registered a change in the ratio between free and bound phenols, from an initial value of 68.46% to 85.29% on the eighth day of germination, suggesting greater bio-accessibility and digestibility for the gastrointestinal absorption, due to the germination process. Similar behavior was also observed in free and bound flavonoid ratio. To the best of our knowledge, conversely, no data are available in the literature about the phenolic content of flaxseed microgreens. The phenolic content of microgreens detected in our experiment was lower compared to the phenolic content found in broccoli microgreens [40], higher than the phenolic content detected in red pak choi and tatsoi [41], chicory, lettuce, and brassica [42], and close to that of mustard [41] and Brassica oleracea microgreens [34].
The higher phenolic content in microgreens than in sprouts could be due to the longer exposure to light. This is in agreement with the results obtained by Ebert et al. [37], with amaranth microgreens that showed a higher phenolic content compared to sprouts. The higher antioxidant activity detected in microgreens, compared to sprouts, may be due to their higher concentration of total phenols, flavonoids, and chlorogenic acid. Nevertheless, in another study conducted with Brassica oleracea, a higher phenolic content has been detected in sprouts than in microgreens [34]. Compared to other species, the flavonoid content in microgreens found in our experiments were lower than those found in green and red basil microgreens [43], and higher than the values detected in radish [44] and broccoli microgreens [45]. Chlorogenic acid content of microgreens, detected in our experiments, was higher than the values reported in other studies conducted with amaranth [37], Brassica oleracea [34], coriander, cress, jute, kohlrabi, komatsuna, mibuna, mustard, pak choi, radish, swiss chard [46], green basil, purple basil, and tatsoi microgreens [46,47]. Conversely, in another study, Pannico et al. [47] detected a higher content of chlorogenic acid in coriander microgreens compared to our results.
The higher antioxidant capacity of microgreens, compared to sprouts, measured by ABTS assay is confirmed by the FRAP assay, if the results are expressed on a dry weight basis (Table S1). The higher antioxidant capacity may be due to the higher phenol content in flaxseed microgreens than in sprouts, given that, in plant cells, phenolic compounds take part in the antioxidant system [48], and their increment can determine an increase in antioxidant capacity [49].
4.2. Effect of Light Treatment
Considering the overall performance, no differences were detected among all treatments, although RGB and B lights were more effective in enhancing sprout and microgreens quality. Growth and developmental processes of plants, such as chloroplast movements, suppression of stem elongation, stomatal operations, phototropisms, and genetic expression are strongly controlled by light stimuli [50]. Photosynthesis is more efficiently improved by red light than blue or green light [51], but the red light alone may cause elongated hypocotyls and cotyledons [52]. Green light is also essential for plants to sense the environment and it is involved in the regulation of the morphology of cells, tissues, and organs. It also affects photosynthesis, respiration, and the duration of stages of plant ontogenesis [53].
Light treatments did not affect the fresh and dry biomass of flax sprouts and microgreens in our experiment, as previously detected in broccoli [54] and lettuce microgreens [55]. Besides, in an experiment conducted with amaranth microgreens, treatments with blue light did not affect biomass production, but it was increased by treatment with red light [56]. In agreement with our results, in previous studies a higher dry matter content has been detected in microgreens of red amaranth treated with a higher percentage of blue light [57]. In contrast, treatment with only blue light induced a lower dry matter content in mustard microgreens, compared with treatment with both red and blue light [58]. To the best of our knowledge, there are no data in the literature about the effects of green light on dry matter content of microgreens. In any case, in our experiment, the reduction in dry matter content in flax microgreens treated only with green light was due to the absence of red and blue light, fundamental for the photosynthesis process. In the literature, contrasting results are reported in microgreens treated with different lights. No differences in beta-carotene content have been detected in brassica microgreens treated with different lights compositions in an experiment conducted by Kamal et al. [59]. On the contrary, in an experiment conducted by Brazaitytė et al. [58], light with different blue/red ratio induced significant differences in chlorophyll index of brassica microgreens. In another study, the carotenoid content of broccoli microgreens was increased by blue light exposure [54]. Samuolienė et al. [60] found a positive relationship between the rate of blue light and the content of photosynthetic pigments in beet microgreens, but no significant differences were detected in mustard and parsley microgreens. Thus, different compositions of light may have different effect on photosynthetic pigment content depending on plant species.
The higher total phenol, flavonoid content, and antioxidant activity of sprouts and microgreens treated with RGB and B light may be due to the presence of blue light in the spectrum. In fact, phenolic compounds, that in plants take part to the antioxidant system and increase the antioxidant capacity [48], could be enriched by blue light more efficiently than red light. Previous studies suggest that blue light could be mediated by transcription factor family genes [61], acting as a signal to increase the production of phenolic compounds [62]. This may also explain the higher antioxidant capacity in B than in RGB treatment detected in our experiments. Treatment with blue light increased the concentrations of phenols in basil [63], Chinese foxglove [64], perilla plants [65], and lettuce [66]. Besides, a higher antioxidant activity has been previously detected in amaranth microgreens [56], lettuce seedlings [67], and coriander plants [68] treated with a higher percentage of blue light. To the best of our knowledge, there are not published data about the effect of light on chlorogenic acid content of seedlings. Despite that, according with our results, in previous works it has been reported that blue light promotes chlorogenic acid synthesis in strawberry [69] and lettuce [62]. It has been previously reported that blue and red light can increase the anthocyanins content of strawberry [70] and lettuce [71], and this may explain the lower anthocyanin content detected in G treatment in our experiment compared to the other treatments. In addition, green light reduced the anthocyanins content in plants of Brassica oleracea L. [72].
5. Conclusions
Definitively, the present study highlighted the possibility to successfully grow flaxseed sprouts and microgreens indoors by modulating the light spectrum. Microgreens showed a higher productivity (+43.8%), content of pigments (Chl tot +62.6%, Car +24.2%), and secondary metabolites (Phen tot. +37.8%, Flav. +84.9%, CGA +638.9%), compared to sprouts, with the best results obtained when 100% blue light was used for the cultivation. Both sprouts and microgreens were rich in natural antioxidants, including phenolic compounds (1.98–3.76 mg GAE g−1 FW), flavonoids (1.61–2.48 mg CAE g−1 FW), chlorogenic acid (0.13–1.10 mg g−1 FW), carotenoids (0.134–0.205 mg g−1 FW), and chlorophylls (0.780–1.415 mg g−1 FW), that contribute to their considerable antioxidant capacity (13.4–25.4 µmol Fe(II) g−1 FW and 4.76–8.06 µmol TEAC g−1 FW), and make flaxseed sprouts and microgreens a good source of health-promoting compounds.
Supplementary Materials
The following supporting information can be downloaded at: https://www.mdpi.com/article/10.3390/horticulturae8020098/s1, Table S1: Total phenols (Phen tot.), flavonoids (Flav), chlorogenic acid (CGA) content, antioxidant capacity (FRAP and ABTS) (mean values of first and second experiment), and anthocyanin (Anth.) (data of the second experiment), in sprouts and microgreens of flaxseed grown indoors under controlled conditions with different light-spectrum compositions (100% blue (peak at 450 nm) (B), 100% red (peak at 660 nm) (R), 100% green (peak at 520 nm) (G), and R:G:B—1:1:1 (RGB)).
Author Contributions
Conceptualization, M.P., R.M., M.S., L.G.A., A.C., L.I. and M.L.; methodology, M.P. and R.M.; formal analysis, M.P., R.M. and S.T.; investigation, M.P., M.S., L.G.A., A.C., S.T., L.I. and R.M.; resources, L.I., A.C. and L.G.A.; data curation, M.P. and R.M.; writing—original draft preparation, M.P., L.G.A., S.T., M.S. and R.M.; writing—review and editing, M.P., M.S., L.G.A., S.T., R.M., A.C. and M.L.; supervision, M.P. and L.I.; project administration, L.G.A., A.C. and L.I.; funding acquisition, L.G.A., A.C. and L.I. All authors have read and agreed to the published version of the manuscript.
Funding
This research was funded by UNIVERSITY OF PISA, “Progetti di Ricerca di Ateneo—PRA 2018” (“Valorizzazione agronomica e nutraceutica del lino da olio—Linum usitatissimum L.”) grant number PRA_2018_25.
Institutional Review Board Statement
Not applicable.
Informed Consent Statement
Not applicable.
Data Availability Statement
The data presented in this study are available within the article and Supplementary Materials.
Conflicts of Interest
The authors declare no conflict of interest.
References
- Samuolienė, G.; Brazaitytė, A.; Viršilė, A.; Miliauskienė, J.; Vaštakaitė-Kairienė, V.; Duchovskis, P. Nutrient Levels in Brassicaceae Microgreens Increase Under Tailored Light-Emitting Diode Spectra. Front. Plant Sci. 2019, 10, 1475. [Google Scholar] [CrossRef] [PubMed]
- Benincasa, P.; Falcinelli, B.; Lutts, S.; Stagnari, F.; Galieni, A. Sprouted Grains: A Comprehensive Review. Nutrients 2019, 11, 421. [Google Scholar] [CrossRef] [PubMed]
- Koehler, P.; Hartmann, G.; Wieser, H.; Rychlik, M. Changes of Folates, Dietary Fiber, and Proteins in Wheat as Affected by Germination. J. Agric. Food Chem. 2007, 55, 4678–4683. [Google Scholar] [CrossRef] [PubMed]
- Kim, S.L.; Kim, S.K.; Park, C.H. Introduction and Nutritional Evaluation of Buckwheat Sprouts as a New Vegetable. Food Res. Int. 2004, 37, 319–327. [Google Scholar] [CrossRef]
- Urbano, G.; Aranda, P.; Vílchez, A.; Aranda, C.; Cabrera, L.; Porres, J.M.; López-Jurado, M. Effects of Germination on the Composition and Nutritive Value of Proteins in Pisum sativum, L. Food Chem. 2005, 93, 671–679. [Google Scholar] [CrossRef]
- Wojdyło, A.; Nowicka, P.; Tkacz, K.; Turkiewicz, I.P. Sprouts vs. Microgreens as Novel Functional Foods: Variation of Nutritional and Phytochemical Profiles and Their In Vitro Bioactive Properties. Molecules 2020, 25, 4648. [Google Scholar] [CrossRef]
- Xiao, Z.; Rausch, S.R.; Luo, Y.; Sun, J.; Yu, L.; Wang, Q.; Chen, P.; Yu, L.; Stommel, J.R. Microgreens of Brassicaceae: Genetic Diversity of Phytochemical Concentrations and Antioxidant Capacity. LWT 2019, 101, 731–737. [Google Scholar] [CrossRef]
- Abellán, Á.; Domínguez-Perles, R.; Moreno, D.A.; García-Viguera, C. Sorting out the Value of Cruciferous Sprouts as Sources of Bioactive Compounds for Nutrition and Health. Nutrients 2019, 11, 429. [Google Scholar] [CrossRef]
- Tavarini, S.; de Leo, M.; Matteo, R.; Lazzeri, L.; Braca, A.; Angelini, L.G. Flaxseed and Camelina Meals as Potential Sources of Health-Beneficial Compounds. Plants 2021, 10, 156. [Google Scholar] [CrossRef]
- Sanmartin, C.; Taglieri, I.; Venturi, F.; Macaluso, M.; Zinnai, A.; Tavarini, S.; Botto, A.; Serra, A.; Conte, G.; Flamini, G.; et al. Flaxseed Cake as a Tool for the Improvement of Nutraceutical and Sensorial Features of Sourdough Bread. Foods 2020, 9, 204. [Google Scholar] [CrossRef]
- Tavarini, S.; Castagna, A.; Conte, G.; Foschi, L.; Sanmartin, C.; Incrocci, L.; Ranieri, A.; Serra, A.; Angelini, L.G. Evaluation of Chemical Composition of Two Linseed Varieties as Sources of Health-Beneficial Substances. Molecules 2019, 24, 3729. [Google Scholar] [CrossRef] [PubMed]
- Goyal, A.; Sharma, V.; Upadhyay, N.; Gill, S.; Sihag, M. Flax and Flaxseed Oil: An Ancient Medicine & Modern Functional Food. J. Food Sci. Technol. 2014, 51, 1633–1653. [Google Scholar] [CrossRef]
- Wanasundara, P.K.J.P.D.; Shahidi, F.; Brosnan, M.E. Changes in Flax (Linum usitatissmum) Seed Nitrogenous Compounds during Germination. Food Chem. 1999, 65, 289–295. [Google Scholar] [CrossRef]
- Kajla, P.S.; Sharma, A.; Sood, D.R. Effect of Germination on Proximate Principles, Minerals and Antinutrients of Flaxseeds. Asian J. Dairy Food Res. 2017, 36, 52–57. [Google Scholar] [CrossRef]
- Lemmens, E.; Moroni, A.V.; Pagand, J.; Heirbaut, P.; Ritala, A.; Karlen, Y.; Lê, K.-A.; van den Broeck, H.C.; Brouns, F.J.P.H.; de Brier, N.; et al. Impact of Cereal Seed Sprouting on Its Nutritional and Technological Properties: A Critical Review. Compr. Rev. Food Sci. Food Saf. 2019, 18, 305–328. [Google Scholar] [CrossRef] [PubMed]
- Bouajila, A.; Ammar, H.; Chahine, M.; Khouja, M.; Hamdi, Z.; Khechini, J.; Salem, A.F.Z.M.; Ghorbel, A.; López, S. Changes in Phytase Activity, Phosphorus and Phytate Contents during Grain Germination of Barley (Hordeum vulgare L.) Cultivars. Agrofor. Syst. 2020, 94, 1151–1159. [Google Scholar] [CrossRef]
- Narina, S.S.; Hamama, A.A.; Bhardwaj, H.L. Nutritional and Mineral Composition of Flax Sprouts. J. Agric. Sci. 2012, 4, 60–65. [Google Scholar] [CrossRef][Green Version]
- Wang, H.; Qiu, C.; Abbasi, A.M.; Chen, G.; You, L.; Li, T.; Fu, X.; Wang, Y.; Guo, X.; Liu, R.H. Effect of Germination on Vitamin C, Phenolic Compounds and Antioxidant Activity in Flaxseed (Linum usitatissimum L.). Int. J. Food Sci. Technol. 2015, 50, 2545–2553. [Google Scholar] [CrossRef]
- Wanasundara, P.K.J.P.D.; Wanasundara, U.N.; Shahidi, F. Changes in Flax (Linum usitatissimum L.) Seed Lipids during Germination. JAOCS J. Am. Oil Chem. Soc. 1999, 76, 41–48. [Google Scholar] [CrossRef]
- Santin, M.; Ranieri, A.; Castagna, A. Anything New under the Sun? An Update on Modulation of Bioactive Compounds by Different Wavelengths in Agricultural Plants. Plants 2021, 10, 1485. [Google Scholar] [CrossRef]
- Kuleshova, T.E.; Udalova, O.R.; Balashova, I.T.; Anikina, L.M.; Kononchuk, P.Y.; Mirskaya, G.V.; Panova, G.G. Influence of Different Light Sources on the Production Process of Tomato in Intensive Photoculture. Veg. Crops Russ. 2021, 2, 65–70. [Google Scholar] [CrossRef]
- Samuoliene, G.; Brazaityte, A.; Viršile, A.; Jankauskiene, J.; Sakalauskiene, S.; Duchovskis, P. Red Light-Dose or Wavelength-Dependent Photoresponse of Antioxidants in Herb Microgreens. PLoS ONE 2016, 11, e0163405. [Google Scholar] [CrossRef] [PubMed]
- Frede, K.; Schreiner, M.; Zrenner, R.; Graefe, J.; Baldermann, S. Carotenoid Biosynthesis of Pak Choi (Brassica Rapa Ssp. Chinensis) Sprouts Grown under Different Light-Emitting Diodes during the Diurnal Course. Photochem. Photobiol. Sci. 2018, 17, 1289–1300. [Google Scholar] [CrossRef]
- Zhang, X.; Bian, Z.; Li, S.; Chen, X.; Lu, C. Comparative Analysis of Phenolic Compound Profiles, Antioxidant Capacities, and Expressions of Phenolic Biosynthesis-Related Genes in Soybean Microgreens Grown under Different Light Spectra. J. Agric. Food Chem. 2019, 67, 13577–13588. [Google Scholar] [CrossRef] [PubMed]
- ISTA. International Rules for Seed Testing; The International Seed Testing Association: Bassersdorf, Switzerland, 2015; ISBN 9783906549699. [Google Scholar]
- Puccinelli, M.; Pezzarossa, B.; Pintimalli, L.; Malorgio, F. Selenium Biofortification of Three Wild Species, Rumex Acetosa L., Plantago coronopus L., and Portulaca oleracea L., Grown as Microgreens. Agronomy 2021, 11, 1155. [Google Scholar] [CrossRef]
- Kang, H.M.; Saltveit, M.E. Wound-Induced Increases in Phenolic Content of Fresh-Cut Lettuce Is Reduced by a Short Immersion in Aqueous Hypertonic Solutions. Postharvest Biol. Technol. 2003, 29, 271–277. [Google Scholar] [CrossRef]
- Kim, D.O.; Chun, O.K.; Kim, Y.J.; Moon, H.Y.; Lee, C.Y. Quantification of Polyphenolics and Their Antioxidant Capacity in Fresh Plums. J. Agric. Food Chem. 2003, 51, 6509–6515. [Google Scholar] [CrossRef]
- Benzie, I.F.F.; Strain, J. The Ferric Reducing Ability of Plasma (FRAP) as a Measure of “Antioxidant Power”: The FRAP Assay. Anal. Biochem. 1996, 239, 70–76. [Google Scholar] [CrossRef]
- Re, R.; Pellegrini, N.; Proteggente, A.; Pannala, A.; Yang, M.; Rice-Evans, C. Antioxidant Activity Applying an Improved ABTS Radical Cation Decolorization Assay. Free Radic. Biol. Med. 1999, 26, 1231–1237. [Google Scholar] [CrossRef]
- Lichtenthaler, H.K. [34] Chlorophylls and Carotenoids: Pigments of Photosynthetic Biomembranes. Methods Enzymol. 1987, 148, 350–382. [Google Scholar] [CrossRef]
- Wellburn, A.R.; Lichtenthaler, H. Formulae and Program to Determine Total Carotenoids and Chlorophylls A and B of Leaf Extracts in Different Solvents. In Advances in Photosynthesis Research; Springer: Berlin/Heidelberg, Germany, 1984; pp. 9–12. [Google Scholar]
- Hrazdina, G.; Marx, G.A.; Hoch, H.C. Distribution of Secondary Plant Metabolites and Their Biosynthetic Enzymes in Pea (Pisum sativum L.) Leaves. Plant Physiol. 1982, 70, 745–748. [Google Scholar] [CrossRef] [PubMed]
- Di Bella, M.C.; Niklas, A.; Toscano, S.; Picchi, V.; Romano, D.; Lo Scalzo, R.; Branca, F. Morphometric Characteristics, Polyphenols and Ascorbic Acid Variation in Brassica Oleracea L. Novel Foods: Sprouts, Microgreens and Baby Leaves. Agronomy 2020, 10, 782. [Google Scholar] [CrossRef]
- Wang, H.; Wang, J.; Guo, X.; Brennan, C.S.; Li, T.; Fu, X.; Chen, G.; Liu, R.H. Effect of Germination on Lignan Biosynthesis, and Antioxidant and Antiproliferative Activities in Flaxseed (Linum usitatissimum L.). Food Chem. 2016, 205, 170–177. [Google Scholar] [CrossRef]
- Wu, Y.; Wang, H.; Wang, Y.; Brennan, C.S.; Anne Brennan, M.; Qiu, C.; Guo, X. Comparison of Lignans and Phenolic Acids in Different Varieties of Germinated Flaxseed (Linum usitatissimum L.). Int. J. Food Sci. Technol. 2021, 56, 196–204. [Google Scholar] [CrossRef]
- Ebert, A.W.; Org Wu, A.E.; Org Yang, T.-H.W. Amaranth Sprouts and Microgreens—A Homestead Vegetable Production Option to Enhance Food and Nutrition Security i n the Rural-Urban Continuum. In Proceedings of the Regional Symposium on Sustaining Small-Scale Vegetable Production and Marketing Systems for Food and Nutrition Security (SEAVEG 2014), Bangkok, Thailand, 25–28 February 2014; pp. 233–244. [Google Scholar]
- Xiao, Z.; Lester, G.E.; Luo, Y.; Wang, Q. Assessment of Vitamin and Carotenoid Concentrations of Emerging Food Products: Edible Microgreens. J. Agric. Food Chem. 2012, 60, 7644–7651. [Google Scholar] [CrossRef] [PubMed]
- Nishio, J.N. Why Are Higher Plants Green? Evolution of the Higher Plant Photosynthetic Pigment Complement. Plant Cell Environ. 2000, 23, 539–548. [Google Scholar] [CrossRef]
- Tan, L.; Nuffer, H.; Feng, J.; Kwan, S.H.; Chen, H.; Tong, X.; Kong, L. Antioxidant Properties and Sensory Evaluation of Microgreens from Commercial and Local Farms. Food Sci. Hum. Wellness 2020, 9, 45–51. [Google Scholar] [CrossRef]
- Vaštakaite, V.; Viršile, A.; Brazaityte, A.; Samuoliene, G.; Jankauskiene, J.; Novičkovas, A.; Duchovskis, P. Pulsed Light-Emitting Diodes for a Higher Phytochemical Level in Microgreens. J. Agric. Food Chem. 2017, 65, 6529–6534. [Google Scholar] [CrossRef] [PubMed]
- Paradiso, V.M.; Castellino, M.; Renna, M.; Gattullo, C.E.; Calasso, M.; Terzano, R.; Allegretta, I.; Leoni, B.; Caponio, F.; Santamaria, P. Nutritional Characterization and Shelf-Life of Packaged Microgreens. Food Funct. 2018, 9, 5629–5640. [Google Scholar] [CrossRef] [PubMed]
- Lobiuc, A.; Vasilache, V.; Oroian, M.; Stoleru, T.; Burducea, M.; Pintilie, O.; Zamfirache, M.-M.; Lobiuc, A.; Vasilache, V.; Oroian, M.; et al. Blue and Red LED Illumination Improves Growth and Bioactive Compounds Contents in Acyanic and Cyanic Ocimum basilicum L. Microgreens. Molecules 2017, 22, 2111. [Google Scholar] [CrossRef] [PubMed]
- Zhang, X.; Wei, J.; Tian, J.; Li, N.; Jia, L.; Shen, W.; Cui, J. Enhanced Anthocyanin Accumulation of Immature Radish Microgreens by Hydrogen-Rich Water under Short Wavelength Light. Sci. Hortic. 2019, 247, 75–85. [Google Scholar] [CrossRef]
- Gao, M.; He, R.; Shi, R.; Zhang, Y.; Song, S.; Su, W.; Liu, H. Differential Effects of Low Light Intensity on Broccoli Microgreens Growth and Phytochemicals. Agronomy 2021, 11, 537. [Google Scholar] [CrossRef]
- Kyriacou, M.C.; El-Nakhel, C.; Graziani, G.; Pannico, A.; Soteriou, G.A.; Giordano, M.; Ritieni, A.; de Pascale, S.; Rouphael, Y. Functional Quality in Novel Food Sources: Genotypic Variation in the Nutritive and Phytochemical Composition of Thirteen Microgreens Species. Food Chem. 2019, 277, 107–118. [Google Scholar] [CrossRef]
- Pannico, A.; El-Nakhel, C.; Graziani, G.; Kyriacou, M.C.; Giordano, M.; Soteriou, G.A.; Zarrelli, A.; Ritieni, A.; de Pascale, S.; Rouphael, Y. Selenium Biofortification Impacts the Nutritive Value, Polyphenolic Content, and Bioactive Constitution of Variable Microgreens Genotypes. Antioxidants 2020, 9, 272. [Google Scholar] [CrossRef]
- Sakihama, Y.; Cohen, M.F.; Grace, S.C.; Yamasaki, H. Plant Phenolic Antioxidant and Prooxidant Activities: Phenolics-Induced Oxidative Damage Mediated by Metals in Plants. Toxicology 2002, 177, 67–80. [Google Scholar] [CrossRef]
- Shimizu, H. Effect of Light Quality on Secondary Metabolite Production in Leafy Greens and Seedlings. In LED Lighting for Urban Agriculture; Springer: Singapore, 2016; pp. 239–260. ISBN 9789811018480. [Google Scholar]
- Baum, G.; Long, J.C.; Jenkins, G.I.; Trewavas, A.J. Stimulation of the Blue Light Phototropic Receptor NPH1 Causes a Transient Increase in Cytosolic Ca2+. Proc. Natl. Acad. Sci. USA 1999, 96, 13554–13559. [Google Scholar] [CrossRef]
- Sager, J.C.; Smith, W.O.; Edwards, J.L.; Cyr, K.L. Photosynthetic Efficiency and Phytochrome Photoequilibria Determination Using Spectral Data. Trans. ASAE 1988, 31, 1882–1889. [Google Scholar] [CrossRef]
- Darko, E.; Heydarizadeh, P.; Schoefs, B.; Sabzalian, M.R. Photosynthesis under Artificial Light: The Shift in Primary and Secondary Metabolism. Philos. Trans. R. Soc. B Biol. Sci. 2014, 369, 20130243. [Google Scholar] [CrossRef]
- Golovatskaya, I.F.; Karnachuk, R.A. Role of Green Light in Physiological Activity of Plants. Russ. J. Plant Physiol. 2015, 62, 727–740. [Google Scholar] [CrossRef]
- Kopsell, D.A.; Sams, C.E. Increases in Shoot Tissue Pigments, Glucosinolates, and Mineral Elements in Sprouting Broccoli after Exposure to Short-Duration Blue Light from Light Emitting Diodes. J. Am. Soc. Hortic. Sci. 2013, 138, 31–37. [Google Scholar] [CrossRef]
- Yorio, N.C.; Goins, G.D.; Kagie, H.R.; Wheeler, R.M.; Sager, J.C. Improving Spinach, Radish, and Lettuce Growth under Red Light-Emitting Diodes (LEDs) with Blue Light Supplementation. HortScience 2001, 36, 380–383. [Google Scholar] [CrossRef] [PubMed]
- Meas, S.; Luengwilai, K.; Thongket, T. Enhancing Growth and Phytochemicals of Two Amaranth Microgreens by LEDs Light Irradiation. Sci. Hortic. 2020, 265, 109204. [Google Scholar] [CrossRef]
- Lau, T.Q.; Tang, V.T.H.; Kansedo, J. Influence of Soil and Light Condition on the Growth and Antioxidants Content of Amaranthus Cruentus (Red Amaranth) Microgreen. IOP Conf. Ser. Mater. Sci. Eng. 2019, 495, 012051. [Google Scholar] [CrossRef]
- Brazaitytė, A.; Miliauskienė, J.; Vaštakaitė-Kairienė, V.; Sutulienė, R.; Laužikė, K.; Duchovskis, P.; Małek, S. Effect of Different Ratios of Blue and Red LED Light on Brassicaceae Microgreens under a Controlled Environment. Plants 2021, 10, 801. [Google Scholar] [CrossRef]
- Kamal, K.Y.; Khodaeiaminjan, M.; El-Tantawy, A.A.; Moneim, D.A.; Salam, A.A.; Ash-shormillesy, S.M.A.I.; Attia, A.; Ali, M.A.S.; Herranz, R.; El-Esawi, M.A.; et al. Evaluation of Growth and Nutritional Value of Brassica Microgreens Grown under Red, Blue and Green LEDs Combinations. Physiol. Plant. 2020, 169, 625–638. [Google Scholar] [CrossRef] [PubMed]
- Samuolienė, G.; Viršilė, A.; Brazaitytė, A.; Jankauskienė, J.; Sakalauskienė, S.; Vaštakaitė, V.; Novičkovas, A.; Viškelienė, A.; Sasnauskas, A.; Duchovskis, P. Blue Light Dosage Affects Carotenoids and Tocopherols in Microgreens. Food Chem. 2017, 228, 50–56. [Google Scholar] [CrossRef]
- Mohanty, B.; Lakshmanan, M.; Lim, S.-H.; Kim, J.K.; Ha, S.-H.; Lee, D.-Y. Light-Specific Transcriptional Regulation of the Accumulation of Carotenoids and Phenolic Compounds in Rice Leaves. Plant Signal. Behav. 2016, 11, e1184808. [Google Scholar] [CrossRef]
- Shimomura, M.; Yoshida, H.; Fujiuchi, N.; Ariizumi, T.; Ezura, H.; Fukuda, N. Continuous Blue Lighting and Elevated Carbon Dioxide Concentration Rapidly Increase Chlorogenic Acid Content in Young Lettuce Plants. Sci. Hortic. 2020, 272, 109550. [Google Scholar] [CrossRef]
- Bantis, F.; Ouzounis, T.; Radoglou, K. Artificial LED Lighting Enhances Growth Characteristics and Total Phenolic Content of Ocimum Basilicum, but Variably Affects Transplant Success. Sci. Hortic. 2016, 198, 277–283. [Google Scholar] [CrossRef]
- Manivannan, A.; Soundararajan, P.; Halimah, N.; Ho Ko, C.; Jeong, B.R. Blue LED Light Enhances Growth, Phytochemical Contents, and Antioxidant Enzyme Activities of Rehmannia Glutinosa Cultured In Vitro Introduction. Environ. Biotechnol. 2015, 56, 105–113. [Google Scholar] [CrossRef]
- Lee, J.S.; Lee, C.A.; Kim, Y.H.; Yun, S.J. Shorter Wavelength Blue Light Promotes Growth of Green Perilla (Perilla Frutescens). Int. J. Agric. Biol. 2014, 16, 1177–1182. [Google Scholar]
- Kitazaki, K.; Fukushima, A.; Nakabayashi, R.; Okazaki, Y.; Kobayashi, M.; Mori, T.; Nishizawa, T.; Reyes-Chin-Wo, S.; Michelmore, R.W.; Saito, K.; et al. Metabolic Reprogramming in Leaf Lettuce Grown Under Different Light Quality and Intensity Conditions Using Narrow-Band LEDs. Sci. Rep. 2018, 8, 7914. [Google Scholar] [CrossRef] [PubMed]
- Vänninen, I.; Pinto, D.M.; Nissinen, A.I.; Johansen, N.S.; Shipp, L. In the Light of New Greenhouse Technologies: 1. Plant-Mediated Effects of Artificial Lighting on Arthropods and Tritrophic Interactions. Ann. Appl. Biol. 2010, 157, 393–414. [Google Scholar] [CrossRef]
- Naznin, M.T.; Kitaya, Y.; Shibuya, T.; Hirai, H. Growth and Ajoene Concentrations in Garlic Plants Cultured Hydroponically with Different Aeration Regimes. J. Hortic. Sci. Biotechnol. 2010, 85, 161–165. [Google Scholar] [CrossRef]
- Chen, X.; Cai, W.; Xia, J.; Yu, H.; Wang, Q.; Pang, F.; Zhao, M. Metabolomic and Transcriptomic Analyses Reveal That Blue Light Promotes Chlorogenic Acid Synthesis in Strawberry. J. Agric. Food Chem. 2020, 68, 12485–12492. [Google Scholar] [CrossRef]
- Zhang, Y.; Jiang, L.; Li, Y.; Chen, Q.; Ye, Y.; Zhang, Y.; Luo, Y.; Sun, B.; Wang, X.; Tang, H. Effect of Red and Blue Light on Anthocyanin Accumulation and Differential Gene Expression in Strawberry (Fragaria × Ananassa). Molecules 2018, 23, 820. [Google Scholar] [CrossRef]
- Garrett Owen, W.; Lopez, R.G. End-of-Production Supplemental Lighting with Red and Blue Light-Emitting Diodes (LEDs) Influences Red Pigmentation of Four Lettuce Varieties. HortScience 2015, 50, 676–684. [Google Scholar] [CrossRef]
- Mizuno, T.; Amaki, W.; Watanabe, H. Effects of Monochromatic Light Irradiation by LED on the Growth and Anthocyanin Contents in Leaves of Cabbage Seedlings. Acta Hortic. 2011, 907, 179–184. [Google Scholar] [CrossRef]
Publisher’s Note: MDPI stays neutral with regard to jurisdictional claims in published maps and institutional affiliations. |
© 2022 by the authors. Licensee MDPI, Basel, Switzerland. This article is an open access article distributed under the terms and conditions of the Creative Commons Attribution (CC BY) license (https://creativecommons.org/licenses/by/4.0/).