1. Introduction
Many plants are very sensitive to environmental changes. Monitoring environmental changes with plants is one of the hotspots and frontiers of future research [
1]. Plants in natural or agricultural environments are exposed to short-term changes in environmental conditions, and the adaptability of plants often depends on their rapid response to these highly variable conditions [
2]. There are many different types of signal transduction in plants, among these, the electrical signal is a detectable physical quantity or pulse, such as voltage or current, and information can be transmitted through it [
3]. Research on plant electrical signals helps to reveal the essence of information exchange in plant cells and organs [
4]. Electrical signals regulate and reflect changes in physiological processes such as photosynthesis, substance transport, growth and metabolism in plants and regulate plant gene expression to adapt to the external environment [
4,
5]. Retivin et al. [
6] have hypothesized that electrical signals are the mechanism of rapid and nonspecific adaptation to stress sources in higher plants; that is, electrical signals can not only transmit specific information about stimulation types but can also contribute to plant tolerance to the effects of various stress sources. Plants have to undergo various stresses in the environment. Understanding stress signals and responses will help to improve plant stress resistance. Plant stress signals evolve from cell energy perception, so understanding the interaction between the stress signal pathways and the growth and development signal pathways is greatly significant [
7].
Plant photosynthesis can reflect the potential of plant productivity, and the morphological changes of plants under adversity can directly reflect the resistance of plants [
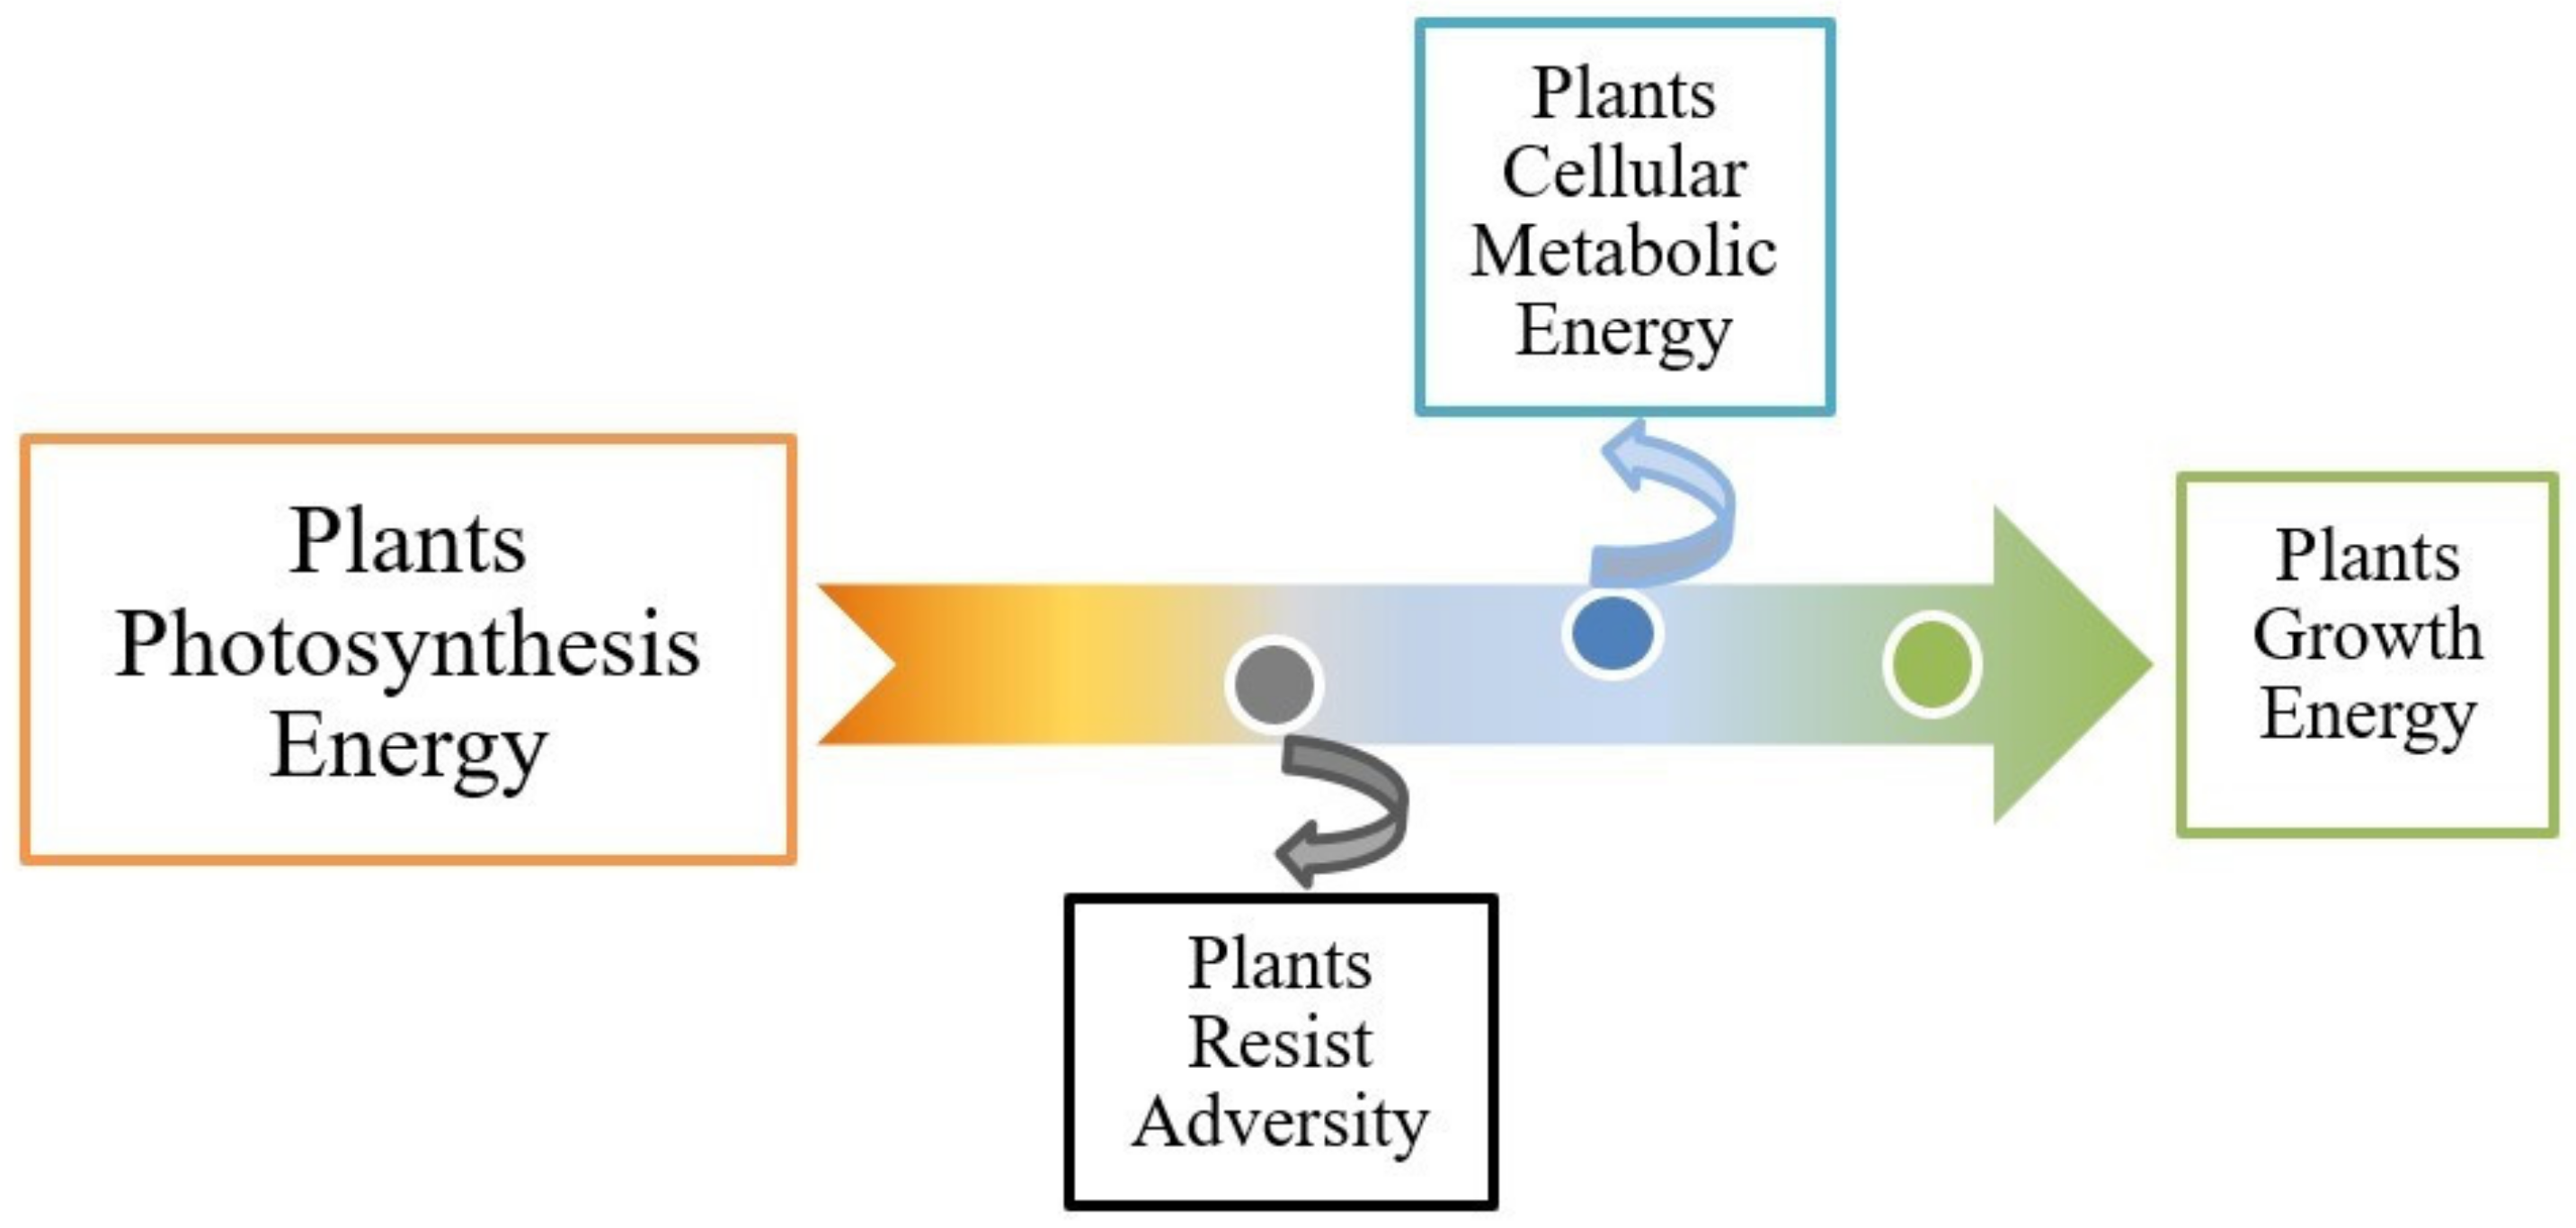
8]. Plants convert light energy into chemical energy by photosynthesis, supporting all energy metabolism in plants. Energy-supporting processes in plants include growth, substance metabolism, ion absorption, resistance to adversity and so on. The cellular metabolic energy of plant leaves is used as the evaluation index of basic plant metabolism. According to the energy conservation law, it can be roughly concluded that the energy consumed by plants to resist adversity under different environmental conditions is equal to the difference between the energy produced by photosynthesis and growth energy consumption and the cellular metabolic energy in plants (
Figure 1). The energy required for plant growth and development is called the metabolic energy of plant cells [
9]. Metabolic energy can be directly utilized by cell metabolism, and it is also an energy form used by organisms to build themselves and maintain life activities. The process of plant growth and development is supported by the cellular metabolism of plants [
10], including physiological and biochemical processes in plants, such as water metabolism, the synthesis and transformation of organic compounds and the assimilation and utilization of inorganic compounds [
11].
SO
2 is a common atmospheric pollutant, one of the main components of acid rain, that is also widely distributed worldwide. Due to the different resistances of different organisms to SO
2 and its derivatives, some sensitive species will disappear, the structure and function of the ecosystem will be affected [
12]. Sulfur dioxide is easily dissolved in water to produce sulfuric acid [
13]. Under physiological conditions (pH 7.4 and 37 °C), the mixture of sulfite ions (SO
32−) and bisulfite anions (HSO
3−) dominates, and acidification will release sulfur dioxide vapor. Sulfite, bisulfite and metabisulfite are produced in alkali conditions [
14], but they are all tetravalent sulfur (S
4+) substances at different pH values [
15]. Plants absorb sulfur dioxide in the air then convert it into sulfate and sulfite in cells. The membrane of mesophyll cells has strictly selective permeability to various ions. When plant leaves are stimulated by the external environment, the permeability of the cytomembrane changes immediately. Leaf resistance (R), impedance (Z) and capacitance (C) are related to cell membrane permeability, ion concentration and cell turgor pressure. These changes can be reflected by electrical parameters. Studies have shown that the toxicity of SO
2 to plants is mainly attributed to the highly active intermediate bisulfite [
16]. NaHSO
3 (NaHSO
3) is one of the most commonly used sulfites. Sulfite in plants can be reduced to sulfide by sulfite reductase or oxidized to sulfate by sulfite oxidase [
17]. Low-concentration bisulfite can be used as a photosynthetic accelerator in agricultural production [
18]. It has been reported that sulfite (Na
2SO
3) and bisulfite (NaHSO
3) are sprayed on plant leaves to simulate the SO
2 environment. When studying its physiological growth characteristics, it is found that low-concentration treatment can promote the photosynthesis and growth of plants [
19]. Previous studies have also proved that it is feasible to enhance photobiological H
2 production by decreasing the O
2 content in
Anabaena 7120 cells with NaHSO
3 treatment [
20]. However, the bisulfite compounds are inhibitors of photosynthetic CO
2 fixation, ATP formation in photosynthesis and respiration, H
+ fluxes and of Cl
- transport at cell membranes; they may act by way of effects on photosynthetic CO
2 fixation or on the ionic relations of the guard cells [
21]. The severe damage appeared in the chloroplast of
Pinus massoniana by the action of simulated SO
2, which led to the swelling or disorder of chloroplast and thylakoid [
22]. Diversely, toxicity tests showed that situations with an overfeed of sodium thiosulfate or sodium bisulfite can depress pH and dissolve oxygen, causing the mortality of fish [
23]. In addition, some studies have shown that NaHSO
3, a derivative of SO
2 in living organisms, can induce chromosome aberrations in mammalian cells [
24], cause an increase in the sister chromatid exchange (SCE) and micronucleus (MN) rate of human lymphocytes in a dose-dependent manner and cause a delay in mitosis and a decrease in the mitotic index [
25].
The impact of NaHSO
3 on plants and animals has two sides, and its widespread use in agriculture as a growth promoter is bound to cause some environmental pollution. However, there is a lack of systematic and in-depth research on the toxicity mechanism or promoting effect of the NaHSO
3 that is discharged into the environment onto animals and plants. Current studies on NaHSO
3 focus on the effects it has on photosynthesis but have not paid attention to the accumulation of S element, and there are few studies on aquatic plants. The impact of polluted water sources on the aquatic environment can be evaluated by ecotoxicological tests, and various studies conducted in many countries worldwide have confirmed the importance of applying ecotoxicological tests in practice [
26], such as the application of the highly sensitive aquatic biota
Chlorella vulgaris to the assessment of biological toxicity in river water [
27], so the effects of polluted aquatic environments on plant growth can be better characterized by ecotoxicology tests.
Iris pseudocorus L. is a tall perennial emergent plant and a common plant in ecological landscape construction, often used to remove water pollutants, but its response mechanism to sulfur pollution in water condition is still not clear. In this study, NaHSO
3 was used as the sulfur pollution source in water, the response of
I. pseudocorus to the water environment was monitored. To explore the effect of the concentration range of NaHSO
3 on plant growth, the cellular metabolic energy and photosynthesis for toxic or promoting effects, the growth of
I. pseudocorus and the internal mechanism of the relationship between cellular metabolic energy, photosynthesis and growth under different concentrations of NaHSO
3 were investigated, in order to provide a basis for determining the best culture conditions for aquatic plants subjected to bisulfite pollution.
2. Materials and Methods
2.1. Experimental Materials and Treatment
The I. pseudocorus seedlings used in this experiment were purchased from a hydrophyte center in Jiangsu, China. Before the experiment, the I. pseudocorus seedlings were precultured in 1/2 Hoagland’s solution for 30 days, and the plants with good uniform growth were selected for the experiment.
The experiment was conducted using a hydroponic system with standard Hoagland’s solution. The treatment was performed in 10 L buckets with NaHSO3 concentrations of 0 (control), 0.5, 2.0, 4.0 and 10.0 mmol·L−1 (hereinafter referred to as T0, T0.5, T2.0, T4.0 and T10.0). Three replicates per group and 7 seedlings per bucket were prepared to ensure the consistency of the individuals. NaHSO3 was dissolved in the liquid nutrient solution, and the volume was fixed at 10 L. During the 20-day experimental period, the nutrient solutions were aerated for half an hour per day to prevent rot development. In addition, the standard Hoagland’s solution was replaced once on the 10th day to ensure that the nutrients met the needs of plants and that the nutrient contents for different groups of plants were consistent. The nutrient content was calculated based on the total amount.
2.2. Measurement of Growth Index
During the 20-day experiment period, the changes in plant leaf number (the total leaf number of 5 plants in each treatment, taking the average value) and total tiller number were recorded, and the total fresh weight of the treated plants was weighed with an analytical balance (ML503, Mettler Toledo Instrument Co., Ltd., Shanghai, China) every 10 days.
2.3. Measurement of Photosynthetic Parameters
The photosynthetic parameters measurement was conducted with a portable Li-6400XT photosynthetic measurement system (Li-COR Inc., Lincoln, NE, USA). The second fully expanded leaf of I. pseudocorus plants was selected for measurement on sunny days. The photosynthetic parameters were measured at 9:30–11:30 a.m. on day 0 and on the 10th and 20th day. Using a natural light source for measurement, the leaf temperature was 29 ± 2 °C, and the flow rate was set to 500 μmol·s−1. The net photosynthetic rate (PN), stomatal conductance (gs), intercellular CO2 concentration (Ci) and transpiration rate (E) were recorded.
2.4. Measurement of Electrophysiological Parameters and Calculation of Cellular Metabolic Energy
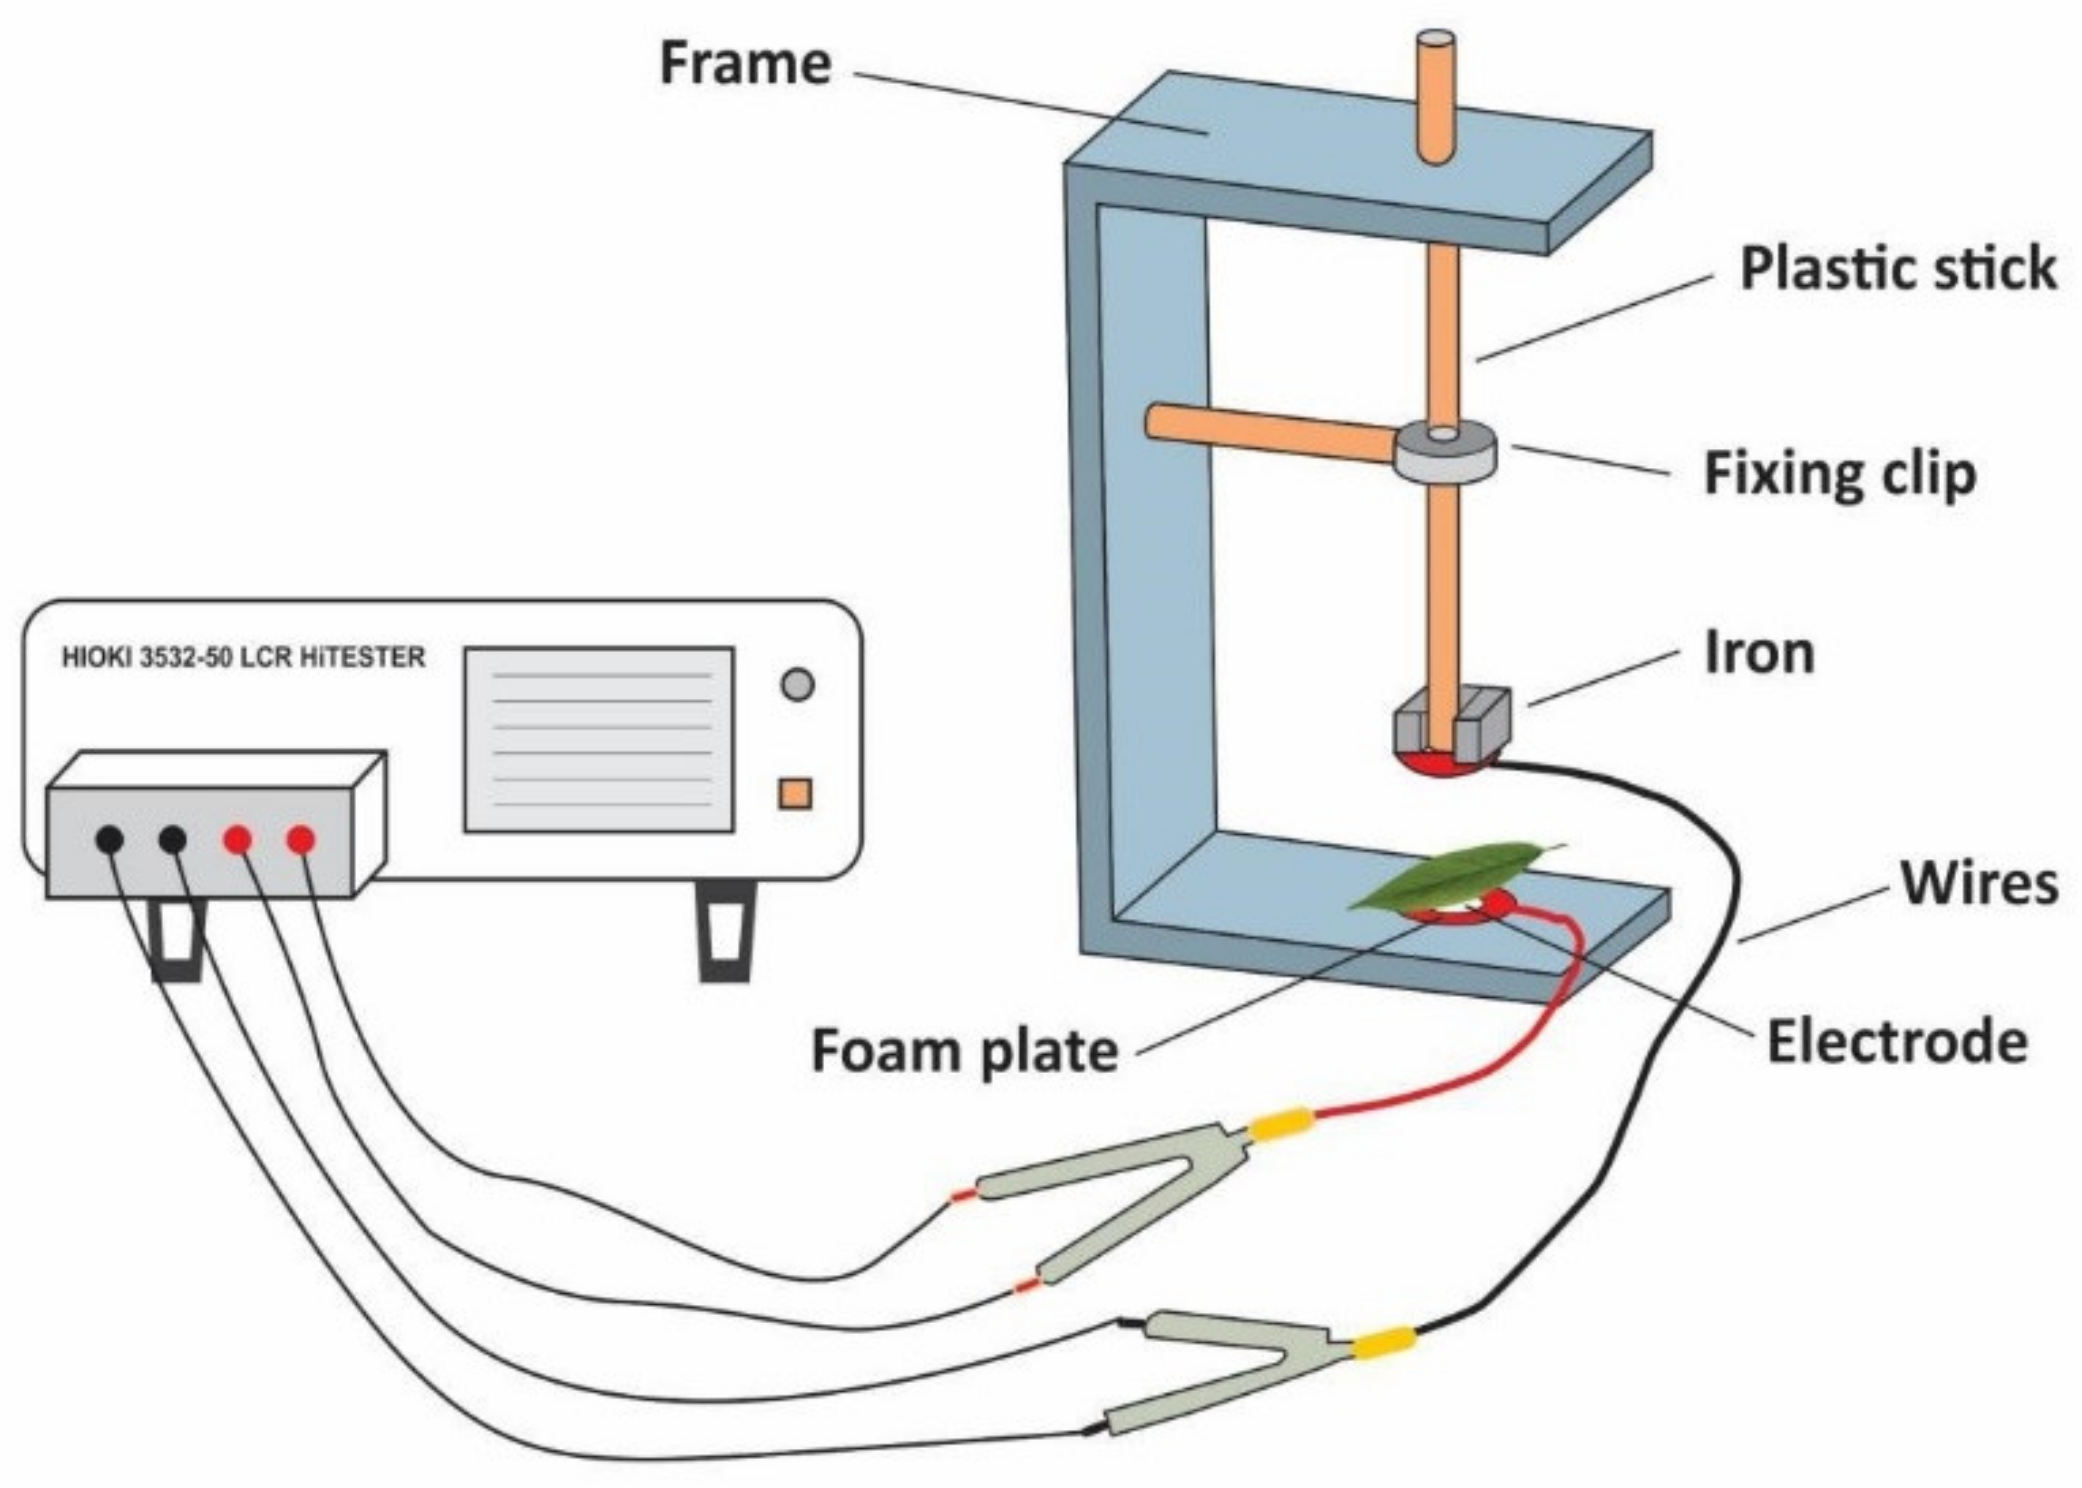
The electrophysiological parameters were measured by a HIOKI 3532-50 LCR tester made in Japan according to Wu et al. [
28]. The measurement was performed on day 0, 10 and 20 during the experiment. The second leaf of
I. pseudocorus was randomly selected and kept wet with distilled water for 30 min. Then, the water on the leaf surface was sucked up, and the leaf was immediately clamped between the parallel electrode plates of the measuring device. The diameter of the electrode plate was 10 mm, the measuring voltage was set to 1.5 V and the measuring frequency to 3000 Hz, changing the pressure of the device by adding the number of iron blocks with a known mass of 0.1 kg (in Newton, N), the physiological capacitance, resistance and impedance of plant leaves under different clamping forces were simultaneously measured in parallel mode (
Figure 2).
The Gibbs free energy equation is expressed as
, plant cells can be regarded as spherical capacitors, and its energy formula is expressed as
.
is the energy of the capacitor, equal to the work done by the Gibbs free energy, that is
;
is the internal energy of the system (plant leaf system composed of cells),
is the pressure on plant cells,
is the volume of plant cells,
is the test voltage and
is the physiological capacitance of plant leaves; The pressure
on plant cells can be calculated by the pressure formula:
, where
is the clamping force and
is the effective area under the action of the polar plate; Variation model of physiological capacitance
of plant leaves with clamping force
:
Assuming that
represents the specific effective thickness of plant leaves, then
; Formula (1) is deformable to:
Keeping
,
, Formula (2) can be deformed as follows:
Formula (3) is a linear model, and and are model parameters. As , .
Because the resistive current is caused by ion transfer, it is determined by the permeability of the membrane to various ions and the existence of a large number of permeable ions. External excitation changes the permeability of ions and affects the concentration of internal and external ions. The concentration difference of internal and external ions obeys the Nernst equation, and the physiological resistance is inversely proportional to the electrical conductivity, while the electrical conductivity is directly proportional to the ion concentration in cells. Therefore, the relationship between the physiological resistance of cells and external excitation can be deduced.
Under different clamping forces, the permeability of different plant cell membranes changes differently, so their physiological resistance is different.
The expression of the Nernst equation is shown in Formula (4):
where
is the electromotive force;
is the standard electromotive force;
is the ideal gas constant, equal to 8.314570 J·K
−1·mol
−1,
is the temperature, unit is K;
is the permeable ion concentration inside the cytomembrane in response to physiological resistance,
is the permeable ion concentration outside the cytomembrane in response to physiological resistance, the total amount of permeable ions inside and outside the membrane in response to physiological resistance
,
is the Faraday constant, equal to 96,485 C·mol
−1;
is the number of permeable ion transfers in response to physiological resistance, unit is mol.
The internal energy of electromotive force
can be converted into work done under pressure, which is directly proportional to
,
, that is:
where
is the pressure on plant cells,
is the energy coefficient of electromotive force conversion and
is the volume of plant cell.
The pressure on plant cells can be derived from the pressure formula: , where is the clamping force and is the effective area under the action of the polar plate.
In mesophyll cells, vacuoles and cytoplasm occupy most of the space in the cell. For mesophyll cells, the sum of
and
is a constant, which is equal to the total amount of permeable ions
in response to physiological resistance inside and outside the membrane.
is directly proportional to the conductivity, and the conductivity is the reciprocal of resistance
. Therefore,
can be expressed as
, where
is the resistance and
is the proportional coefficient of the transformation between the permeable ion concentration
in the cell membrane in response to the physiological resistance and the resistance. Therefore, (5) can be rewritten as:
Formula (6) can be rewritten as:
Taking the logarithm on both sides of Formula (7), we obtain:
Order
,
β =
; then, Equation (8) can be deformed as follows:
Taking the index on both sides of Formula (9), it can become:
Further deformation can result in:
In Equation (10),
is the physiological resistance, and because
,
in Equation (9) can be deformed as:
For the same leaf to be tested under the same environment,
d,
a,
E0,
R0,
T,
,
F0,
and
in Equations (11) and (12) are fixed values. Keeping
,
,
. Therefore, Equation (13) can be deformed as:
In Formula (14), , and are the parameters of the model. Thus, the unit metabolic energy of plant leaf cells is based on physiological resistance . Metabolic energy of plant leaf cells based on physiological resistance .
Similarly, the model of physiological impedance
of plant leaves varying with clamping force can be constructed as follows:
In Formula (15), , and are the parameters of the model. Therefore, the unit metabolic energy of plant leaf cells is based on physiological impedance . The metabolic energy of plant leaf cells is based on physiological impedance .
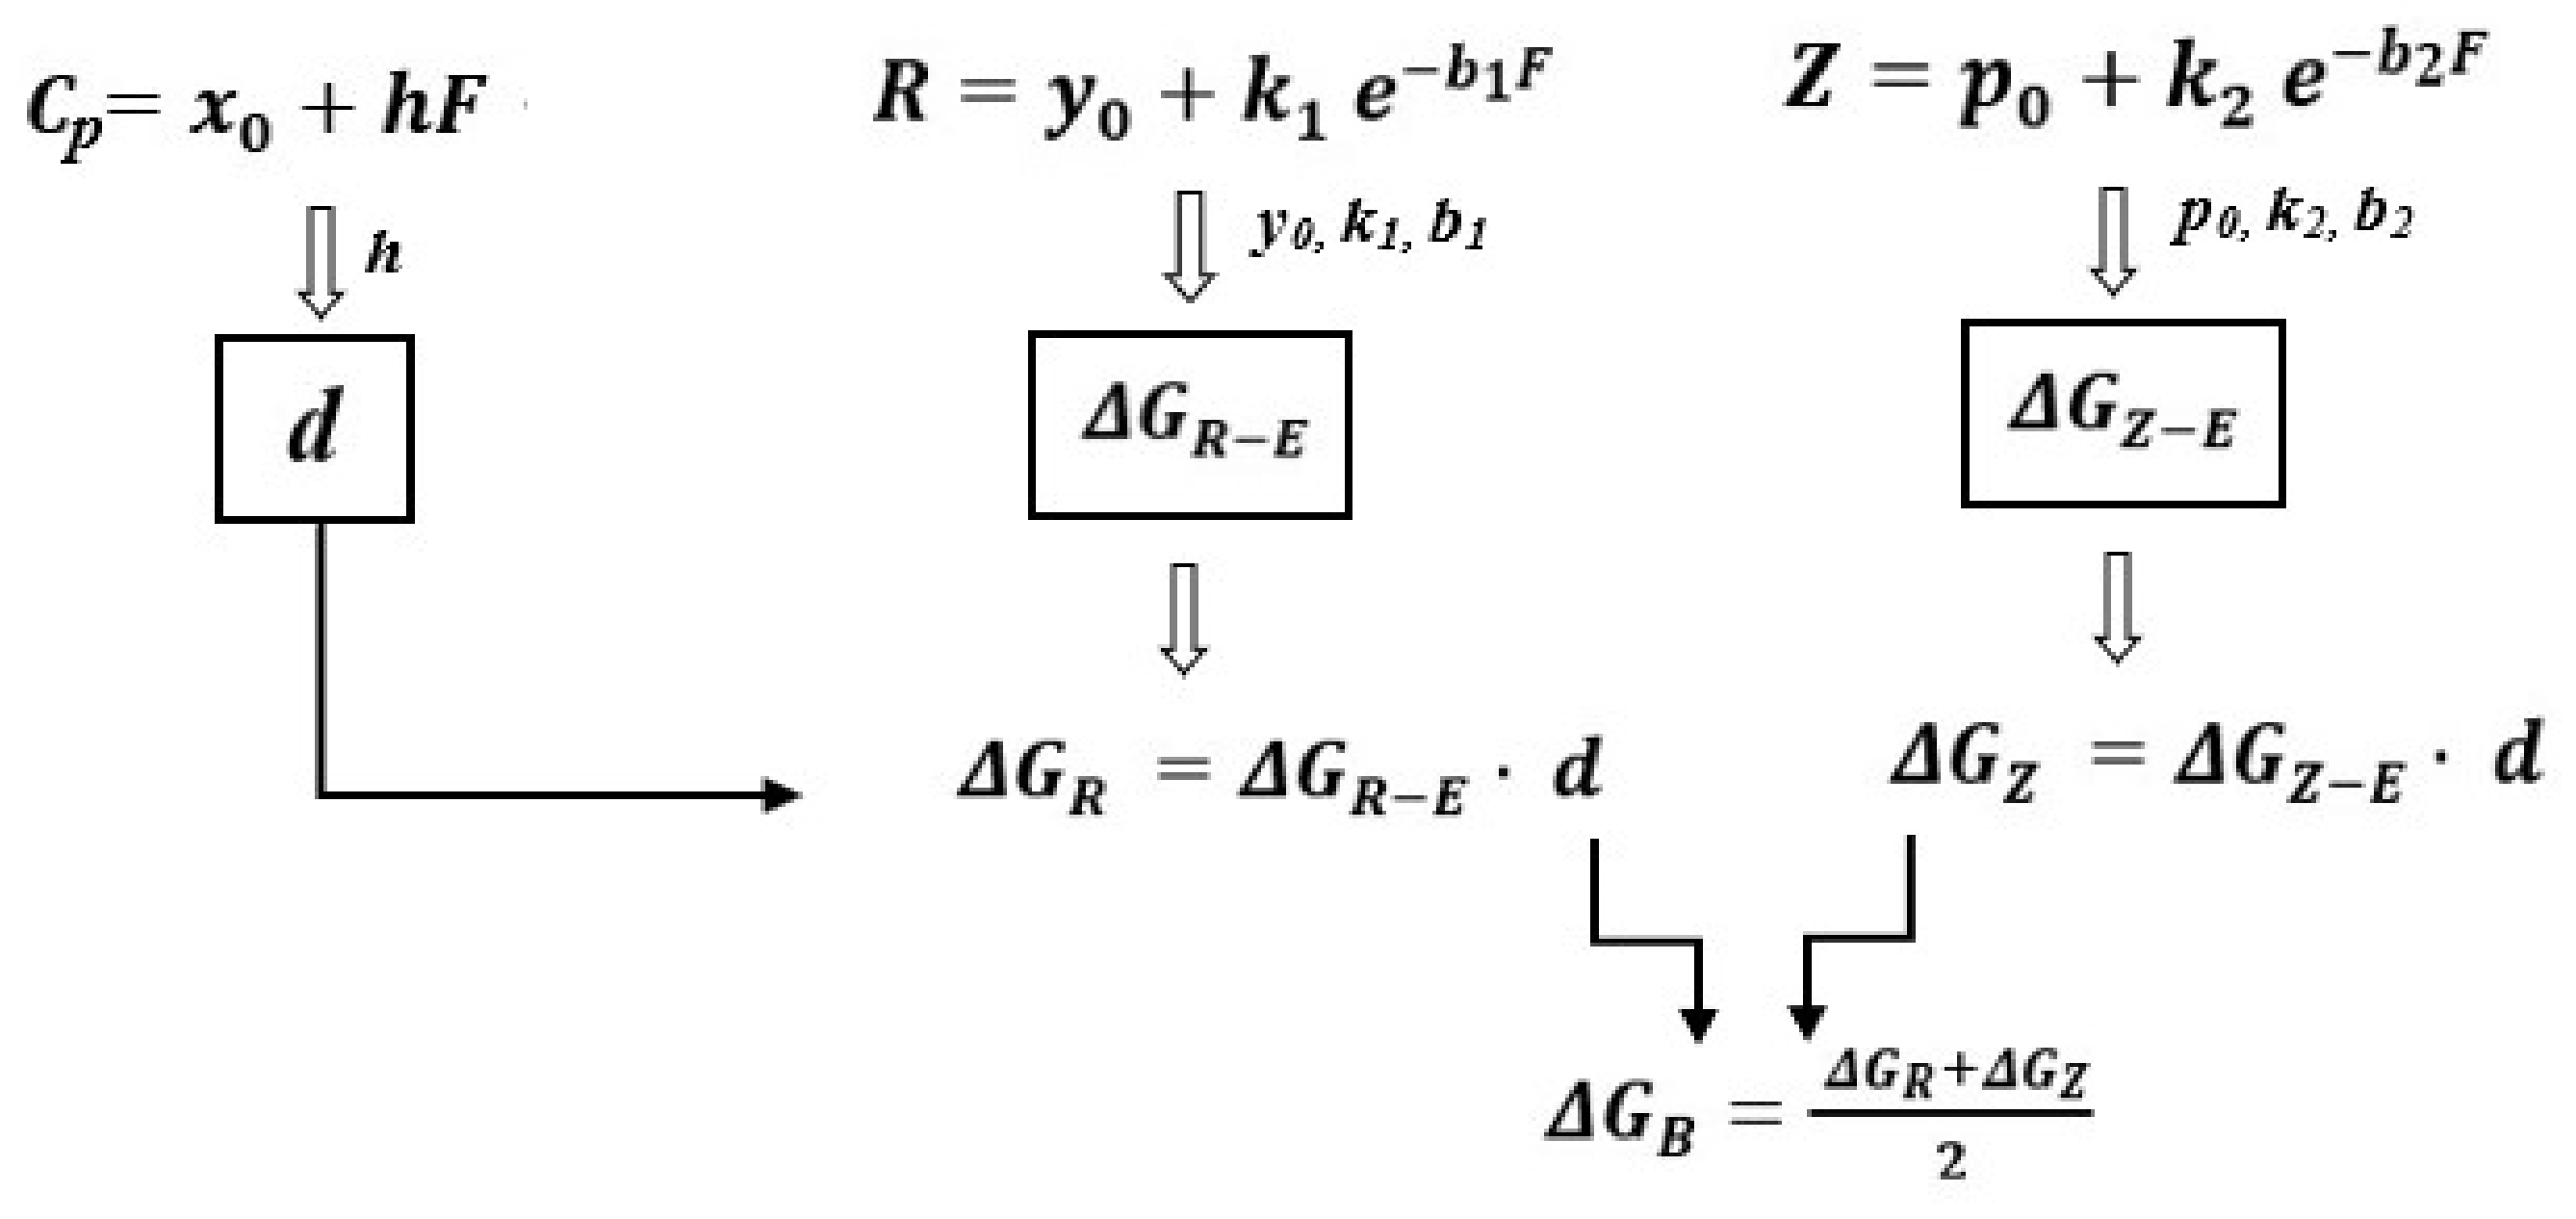
In this paper, the cellular metabolic energy is the mean value of , based on physiological resistance, and , based on physiological impedance.
The critical steps in calculating cellular metabolic energy are shown in
Figure 3.
2.5. Determination of the pH Value of the Tested Environment and Kinetic Model of Sulfur Absorption
In the 20-day experiment, the pH value changes of the Hoagland’s solution containing NaHSO
3 were detected and recorded from day 0 to the 10th day using a pH meter (PHSJ-3F, INESA Scientific Instrument Co., Ltd., Shanghai, China). A 20 mL water sample was taken every day in each treatment group to measure the total sulfur content of the treated water samples. The measurement refers to the method of Zhang et al. [
30]. The steps are as follows: take an appropriate amount of water sample and add distilled water to 50 mL, add the supernatant of calcium oxide to the water sample, then add the potassium permanganate solution, adjust the solution with sodium hydroxide until the solution is slightly alkaline, then heat it on an electric heating plate and keep it slightly boiling for 15 min. If the color purple disappears during the heating process, add a small amount of potassium permanganate to maintain light purple. Replenish the volume of water sample with distilled water, add nitric acid solution to the water sample, keep it in a slightly boiling state for 10 min. Replenish the volume of water sample with distilled water, add hydrochloric acid solution to the water sample and heat it for 5 min, remove the water sample, use the Barium Chromate Spectrophotometry method to measure the sulfate in the water sample, then convert it into sulfur content. It is generally believed that the absorption of inorganic ions by plants is an active process. The ion absorption kinetic model is constructed based on the measurement of total sulfur content in water samples. The method is as follows:
It is described quantitatively in the Michaelis–Menten equation shown in formula (16) or the modified form shown in formula (17).
In the formula,
is the ion absorption rate (mg·L
−1·D
−1);
is the maximum absorption rate (mg·L
−1·D
−1);
is the ion concentration in extracellular solution (mg·L
−1);
is the Michaelis constant (mg·L
−1);
is the net absorption rate;
is the critical concentration or balanced concentration of the ion in extracellular solution (mg·L
−1), that is, the ion concentration in extracellular solution when
. The smaller its value is, the stronger the ability of plants to absorb nutrients at low concentrations.
,
and
are three parameters characterizing the kinetic characteristics of plant nutrient absorption. The method is as follows [
31,
32,
33,
34]:
First, the ion consumption curve is drawn according to the concentration of absorption solution and the absorption time, and then the ion consumption curve equation is obtained. The common ion consumption curve equation is a unary quadratic polynomial:
Here, is the concentration of absorbed ions, is the absorption time, and , and are equation coefficients.
Taking the first negative derivative from Equation (18), the ion consumption rate equation is obtained:
Formula (19) is treated as follows: let
→0; then,
, which is the maximum change rate of concentration. Afterwards, according to the water sample dilution concentration
(
), the maximum absorption rate
(specific maximum absorption rate) of
I. pseudocorus per day was calculated, i.e.,
Put into Equation (19) to deduce , and then put back into Formula (18) to deduce , that is, the value of .
Let , obtain the time when the absorption rate is 0, replace back into Formula (18), and calculate the value of equilibrium concentration .
To better evaluate and compare the nutrient absorption rate of plants, parameter
based on two basic kinetic parameters,
and
, was introduced.
is usually used as the evaluation index of plant affinity for nutrient ions, but when
and
change cooperatively,
cannot well reflect the actual affinity, and the ratio of
and
is
, which is a better affinity evaluation index [
35,
36]. The higher the value of
, the stronger the affinity, and the faster the rate of ions entering the plant.
The critical steps in calculating the kinetic model of sulfur absorption are shown in
Figure 4.
2.6. Normalization of Experimental Data
Although we can use different physiological indices to characterize the productivity, resistance and growth efficiency of
I. pseudocorus, there are obvious differences between different physiological indices, such as units, dimensions and thresholds. Therefore, the net photosynthetic rate (
PN), the cellular metabolic energy of plant leaf (
) and the fresh weight of plants all need to be normalized in a unified mode.
WPN represents the energy produced by photosynthesis,
represents the cellular metabolic energy,
represents the energy consumption for plant growth and
WS represents the energy required to resist adversity.
is expressed as the growth rate of plant fresh weight, representing the energy required for plant growth and development:
where
is the fresh weight of each treatment and control group on the 10th and 20th days, and
is the fresh weight of each treatment and control group within 2 h.
According to the law of conservation of energy, the equation is constructed:
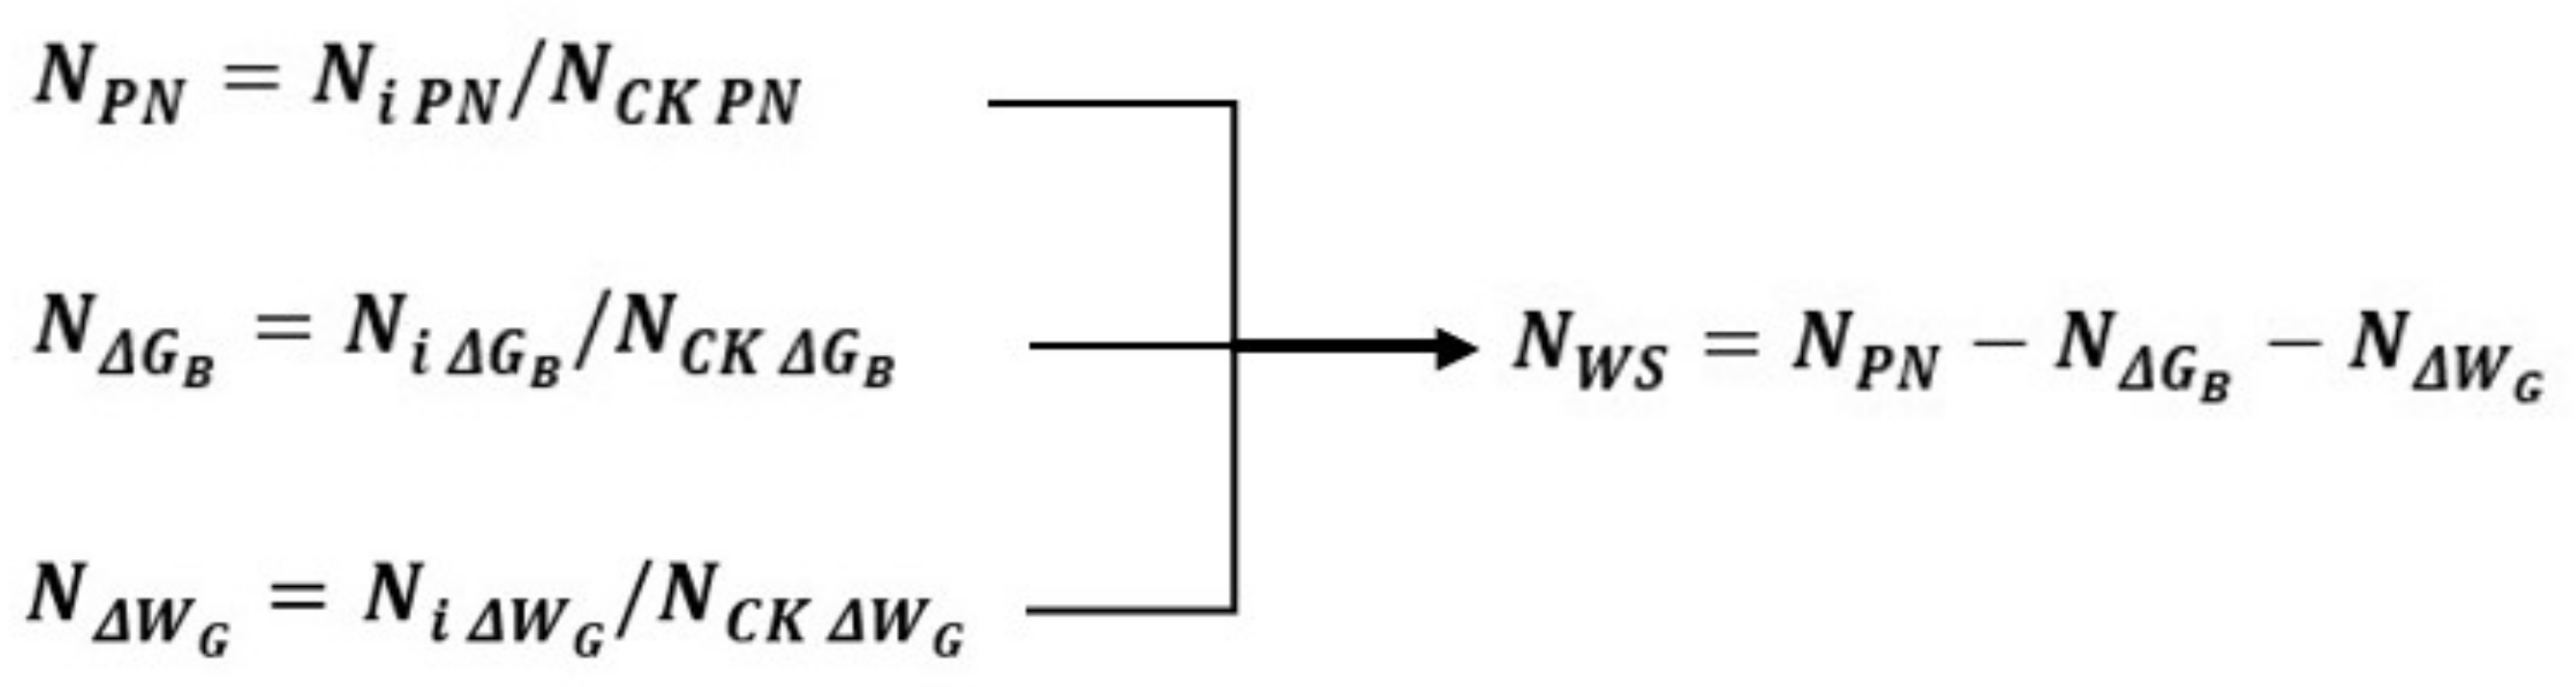
The measured data were normalized to better compare the plant growth conditions characterized by different physiological indices. The method is:
is the value after normalization. If the PN is normalized, represents , represents the PN of each effective sample, and represents the PN of the control group in the same period of each effective sample. If the ΔGB is normalized, and stands for and represents the ΔGB of each effective sample, represents the ΔGB in the control group in the same period of each effective sample. By analogy, the ΔWG can be normalized.
According to Formula (23), after normalization, the energy required to resist adversity
is as follows:
After normalization, the
value of the control group was −1 on the 10th and 20th days. To facilitate comparison,
, based on the parameter
, was introduced,
Compared with , can more intuitively evaluate and compare the additional energy consumed by plants in the environment.
The critical steps in normalization are shown in
Figure 5.
2.7. Statistical Analysis
All experiments were conducted at least three times. The data are expressed as the means ± SE. The results are calculated and plotted with Origin 9.0. IBM SPSS Statistics version 23.0 was used for one-way ANOVA to compare the differences among different treatments. The significance level was p < 0.05.
3. Results
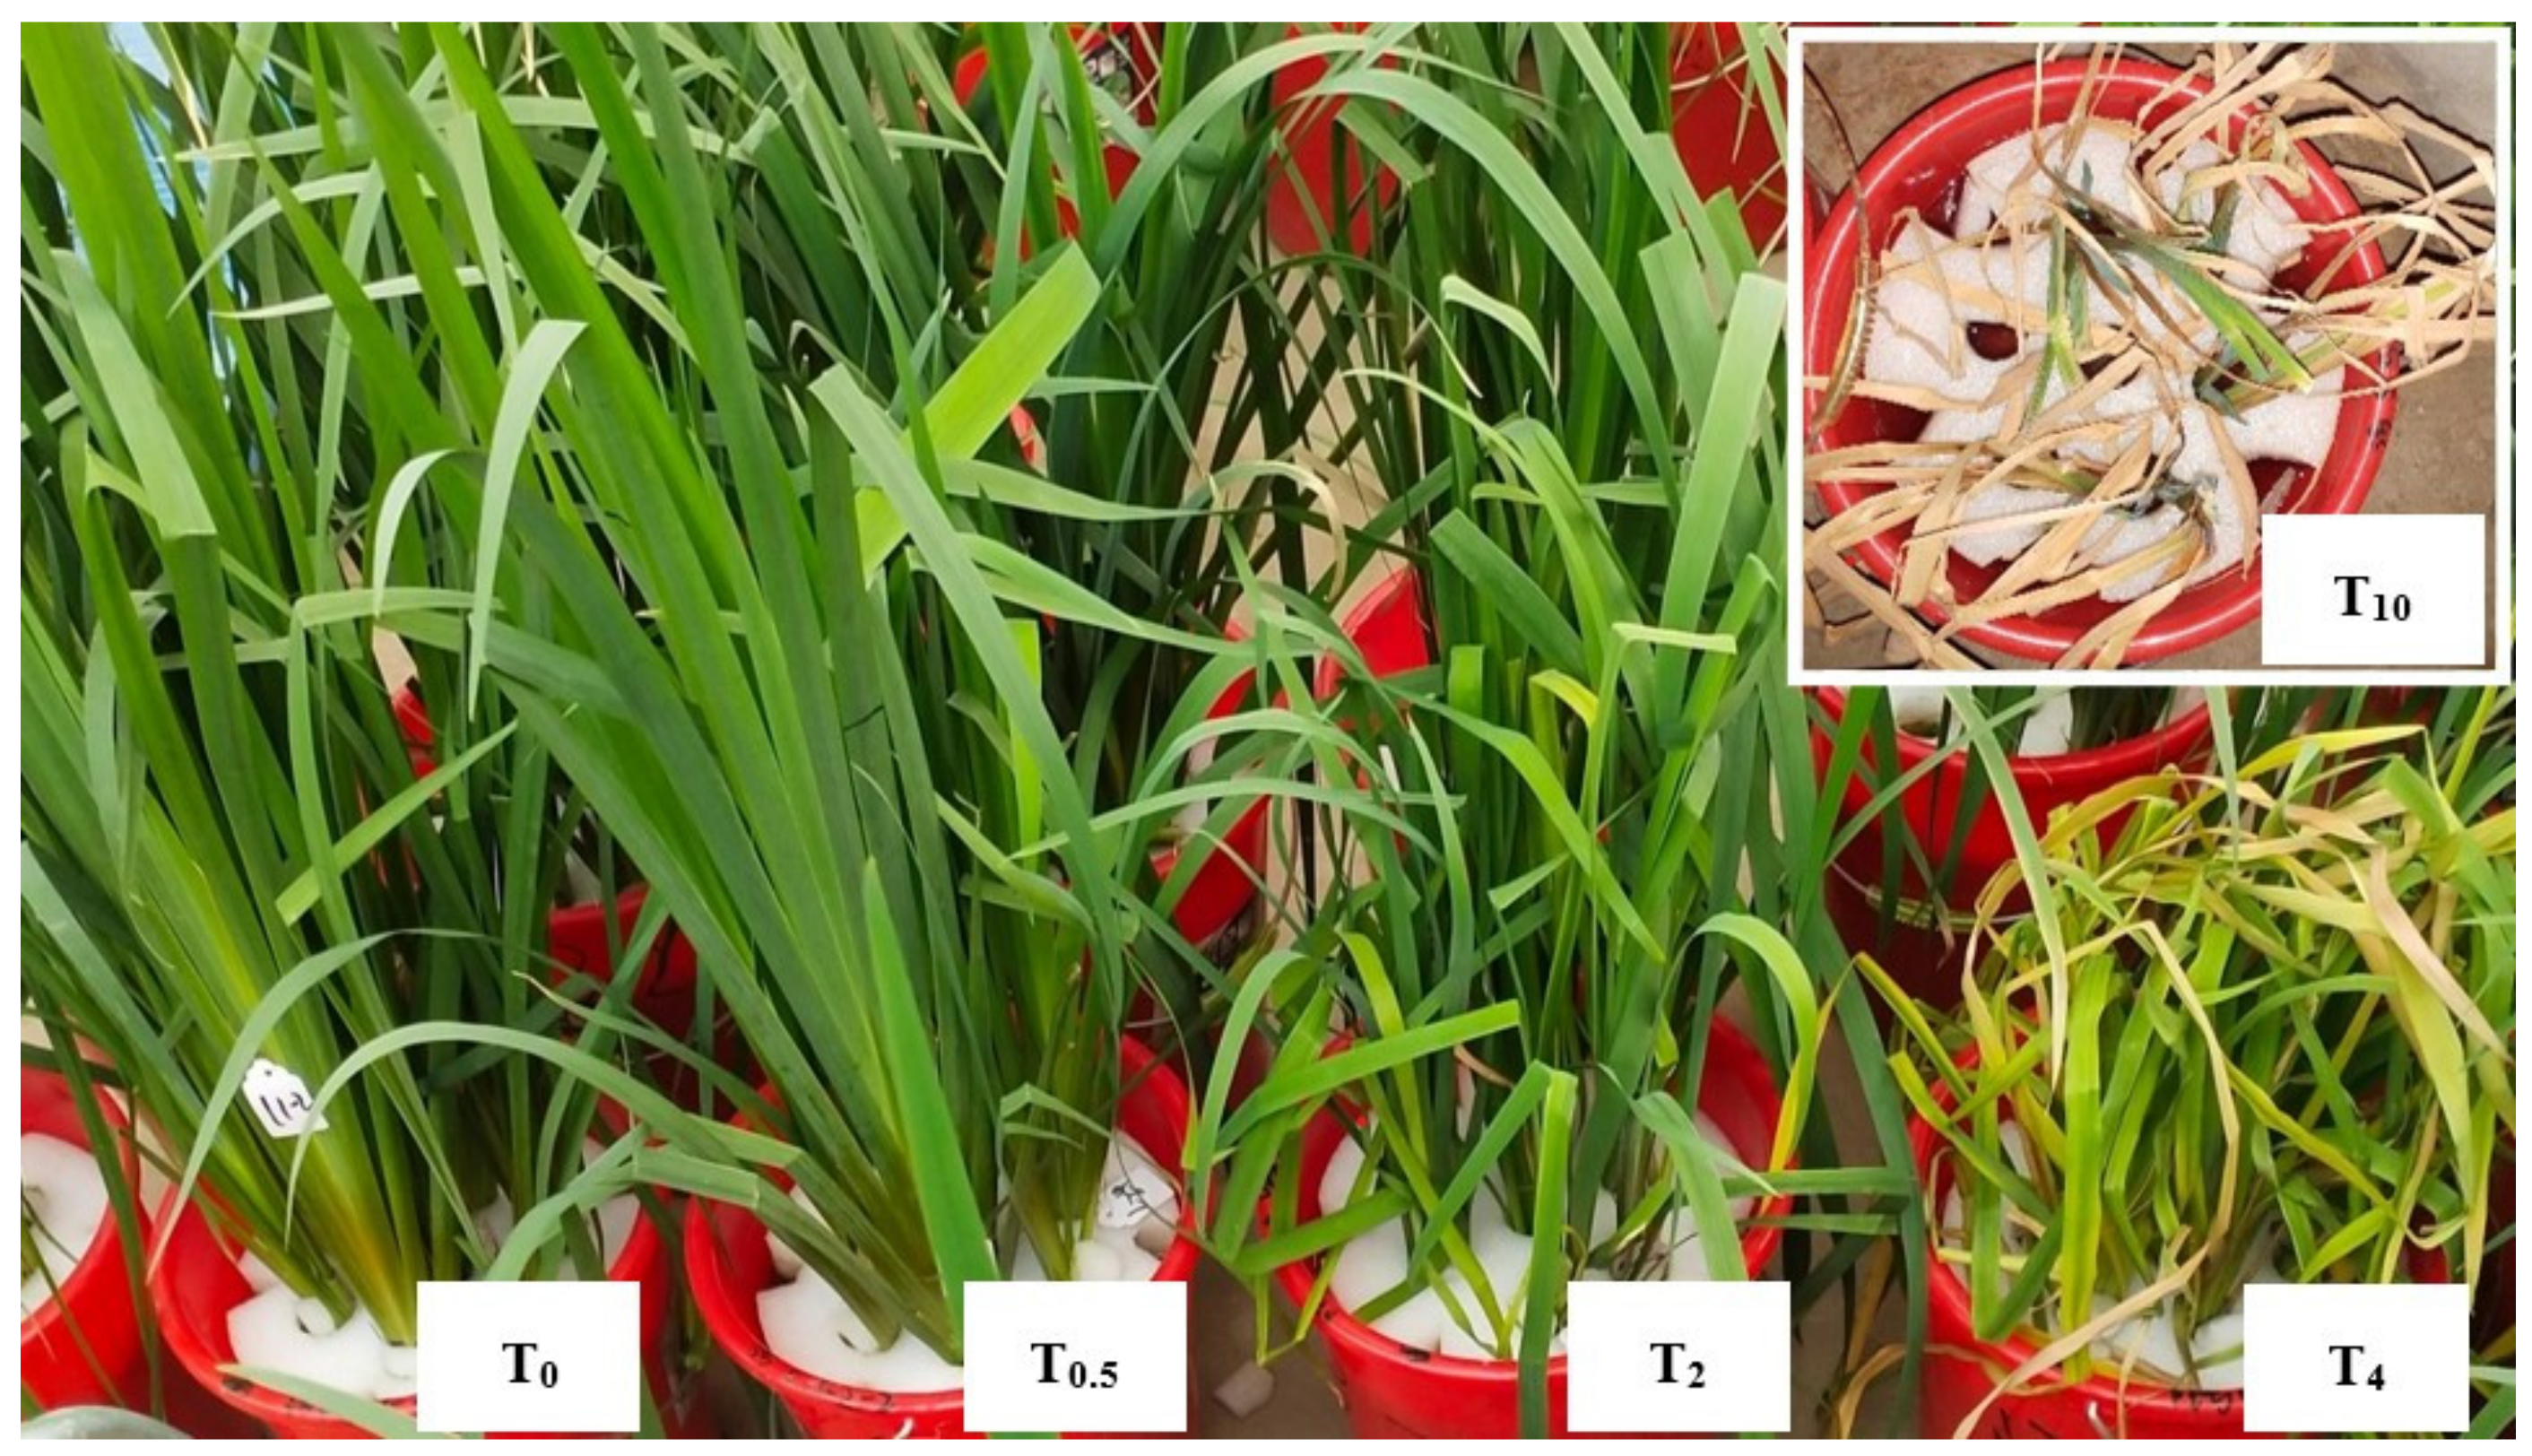
3.1. Effects of Different Treatments on the Growth of I. pseudocorus
The growth of
I. pseudocorus after the 20-day treatment is shown in
Figure 6. The fresh weight of
I. pseudocorus was related to plant activity of life, and adverse environmental factors can inhibit the increase in fresh weight.
Table 1 shows the effect of different NaHSO
3 treatments on the fresh weight of
I. pseudocorus over time.
In the experimental period, the plants showed a significantly lower fresh weight in all treatment groups compared with that of the control. With increasing treatment time, the fresh weight increased significantly at T0.5 and T2.0 treatment levels, while the fresh weight decreased significantly at T4.0 and T10.0 treatment levels, and the higher the treatment concentration, the lower the fresh weight.
With increasing concentrations of NaHSO3, the fresh weight of I. pseudocorus exhibited a sharp decrease. Under severe stress, shrinkage and dehydration occurred in the plants, and the plants dried up and died in the latter period of the experiment.
The inhibition on leaf growth was clearly observed in the presence of NaHSO
3 (
Table 2). In the absence of NaHSO
3, the number of plant leaves in the control group remained stable. With increasing concentration of NaHSO
3, the number of plant leaves showed no significant difference at T
0.5, T
2.0 levels, but exhibited significant decrease at T
4.0 and T
10.0 levels. When the NaHSO
3 concentration increased to 4 mmol·L
−1, dehydration and shrinkage occurred in the leaves on the 10th day from the onset of the treatment, and the time was reduced to 5 days when the bisulfite concentration increased to 10 mmol·L
−1.
The effect of NaHSO
3 on the average tillers of
I. pseudocorus is shown in
Table 3. Plants produce tillers through vegetative propagation, and the number of vegetative tillers can indicate the ability of vegetative propagation [
37]. The number of plant tillers under different NaHSO
3 treatments was significantly lower than that of the control group. The results indicated that the growth of vegetative tillers tended to decrease when NaHSO
3 was added to the treatment groups. Therefore, NaHSO
3 has inhibitory effects on the growth and development of
I. pseudocorus leaves and tillers.
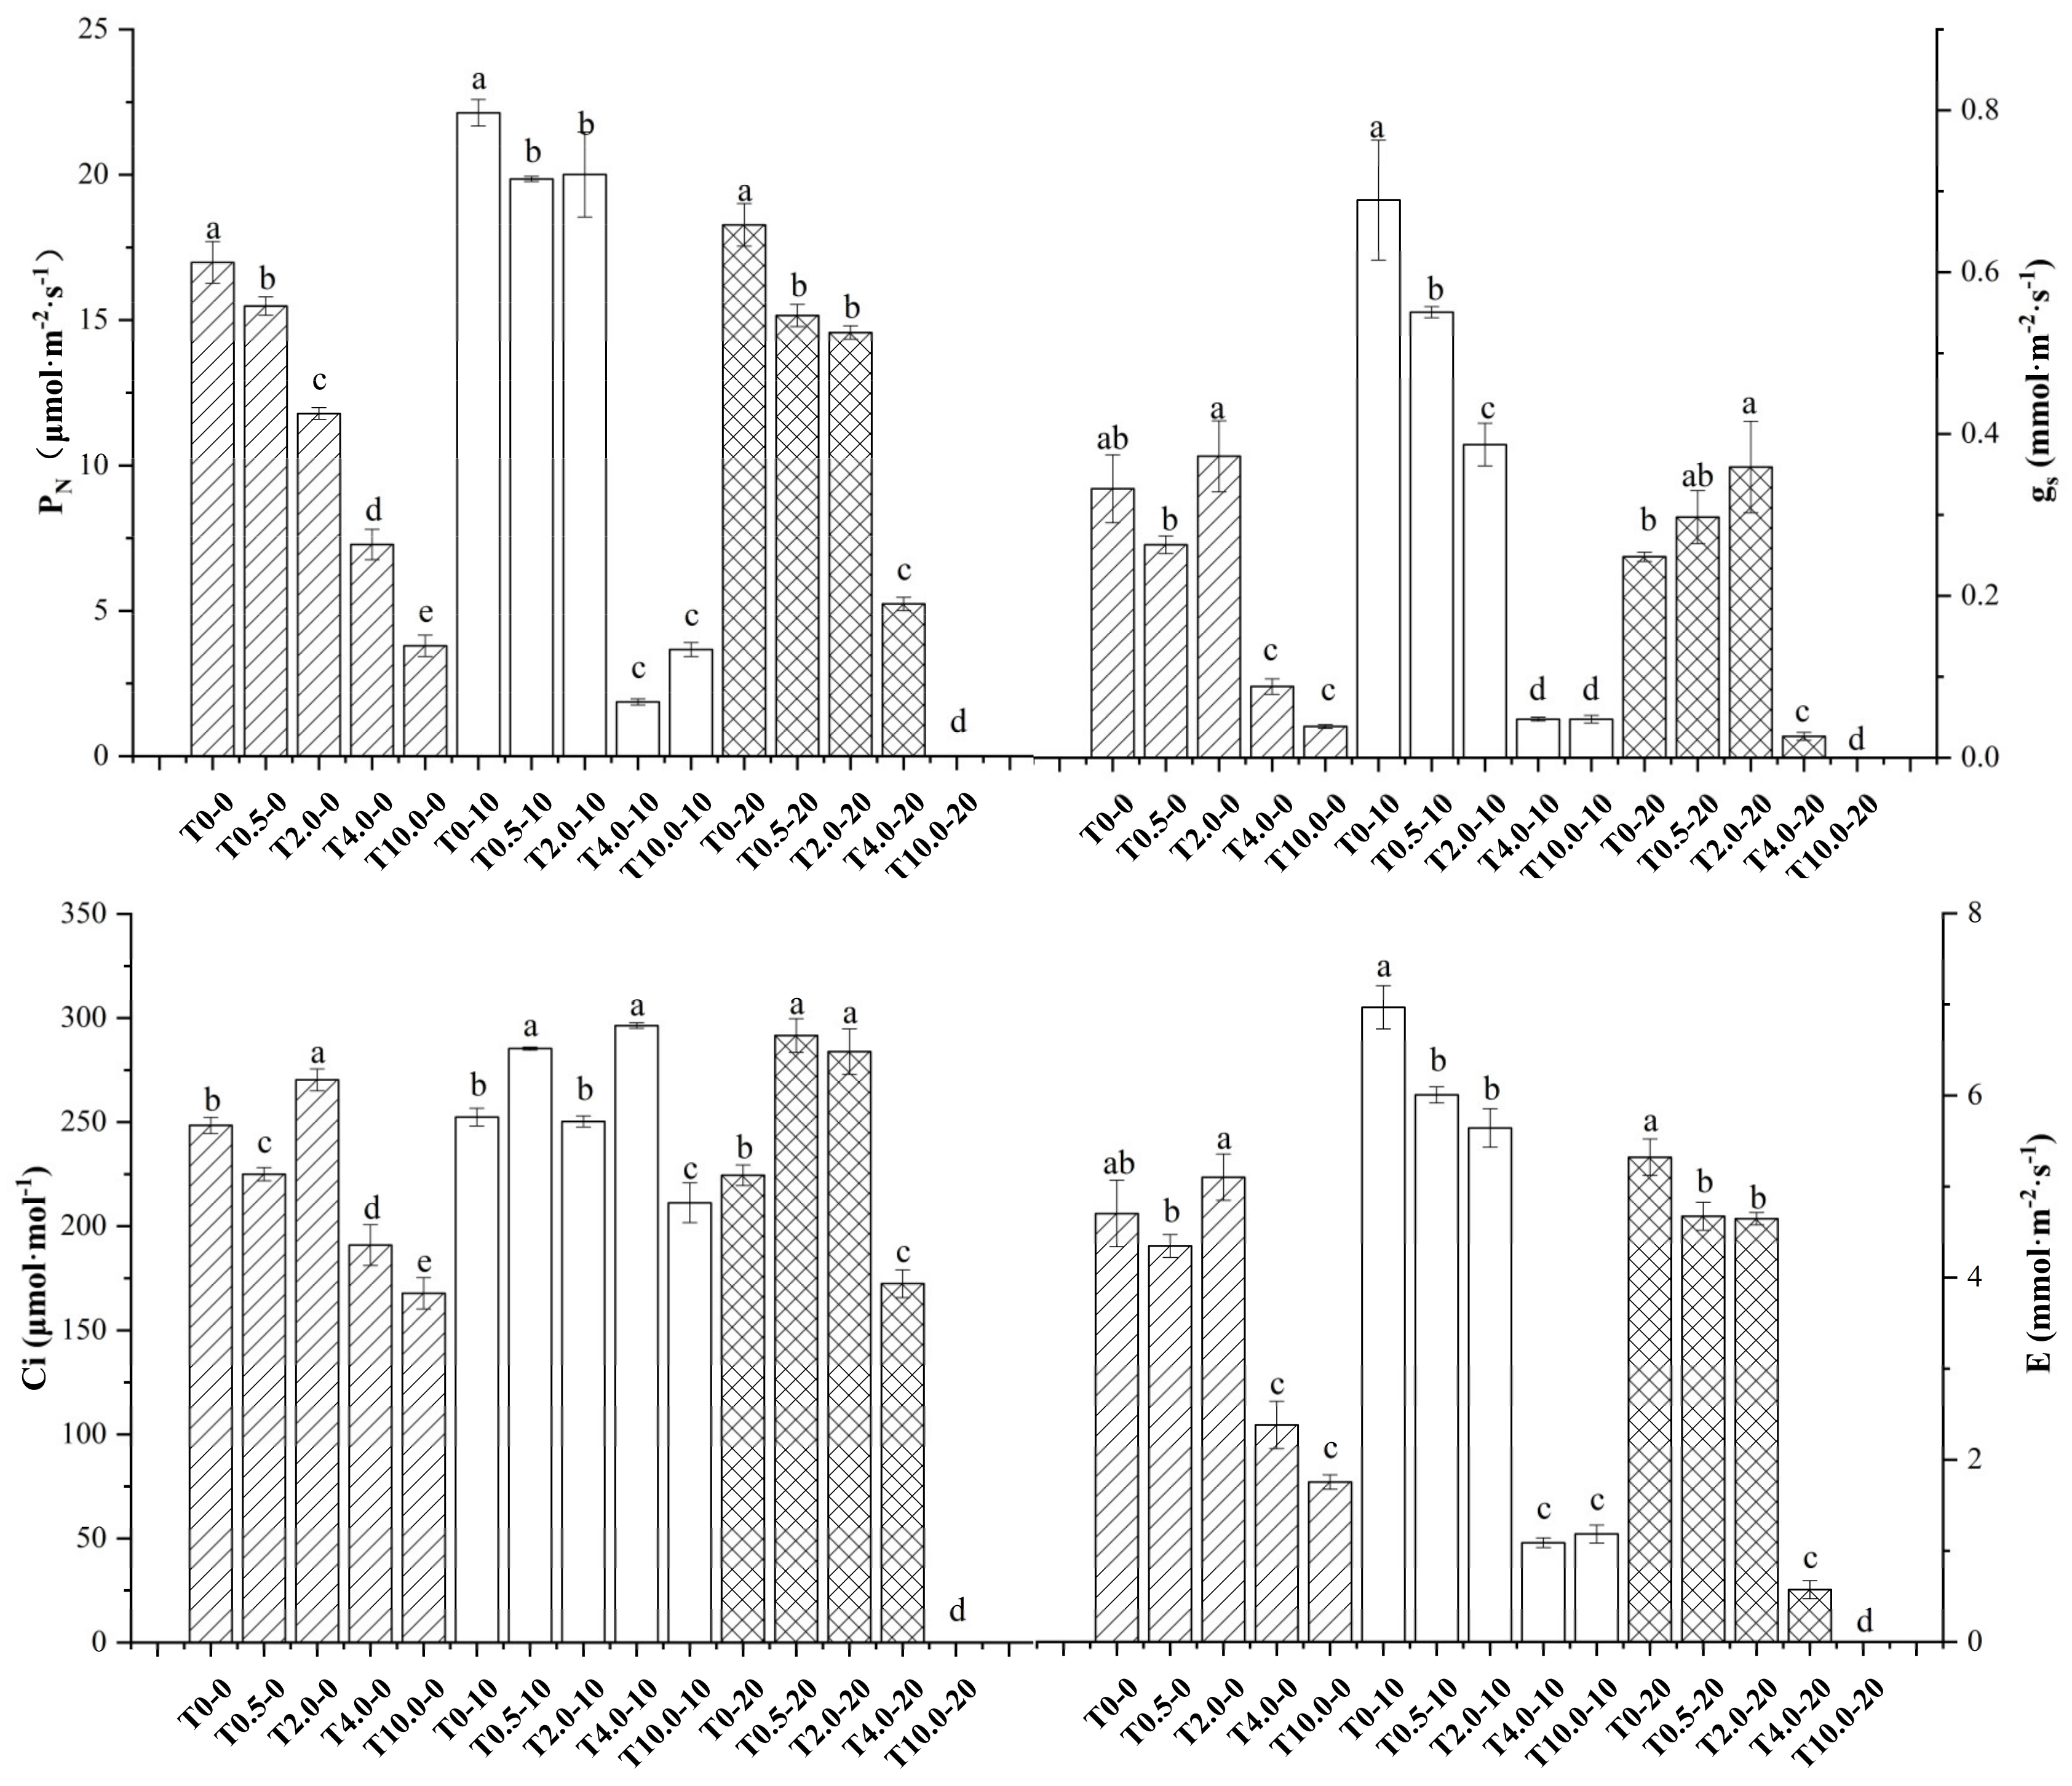
3.2. Effects of Different Concentrations of NaHSO3 on the Photosynthesis of I. pseudocorus
The accumulation of plant biomass is closely related to photosynthesis.
Figure 7 shows the changes in the photosynthetic characteristics of
I. pseudocorus under NaHSO
3 treatment. Within 2 h of the treatment, the net photosynthetic rate (
PN) significantly decreased with increasing treatment concentration (
p < 0.05). The stomatal conductance (gs), intercellular CO
2 concentration (Ci) and transpiration rate (E) exhibited similar trends with
PN, while those in T
2.0 were higher than those in the other treatment groups.
After 10 days of NaHSO3 exposure, PN, gs and E in the low-concentration treatment groups of T0.5 and T2.0 were significantly higher than those in the high-concentration treatment groups of T4.0 and T10.0 (p < 0.05), while T0 was significantly higher than that in the low-concentration treatment groups (p < 0.05).
After receiving treatment for 20 days, PN, gs, Ci and E in the low-concentration treatment groups of T0.5 and T2.0 were significantly higher than those in the high-concentration treatment groups of T4.0 and T10.0. PN and E under T0 were significantly higher than those in the low-concentration treatment groups, and gs and Ci under T0 were lower than those in the low-concentration treatment groups.
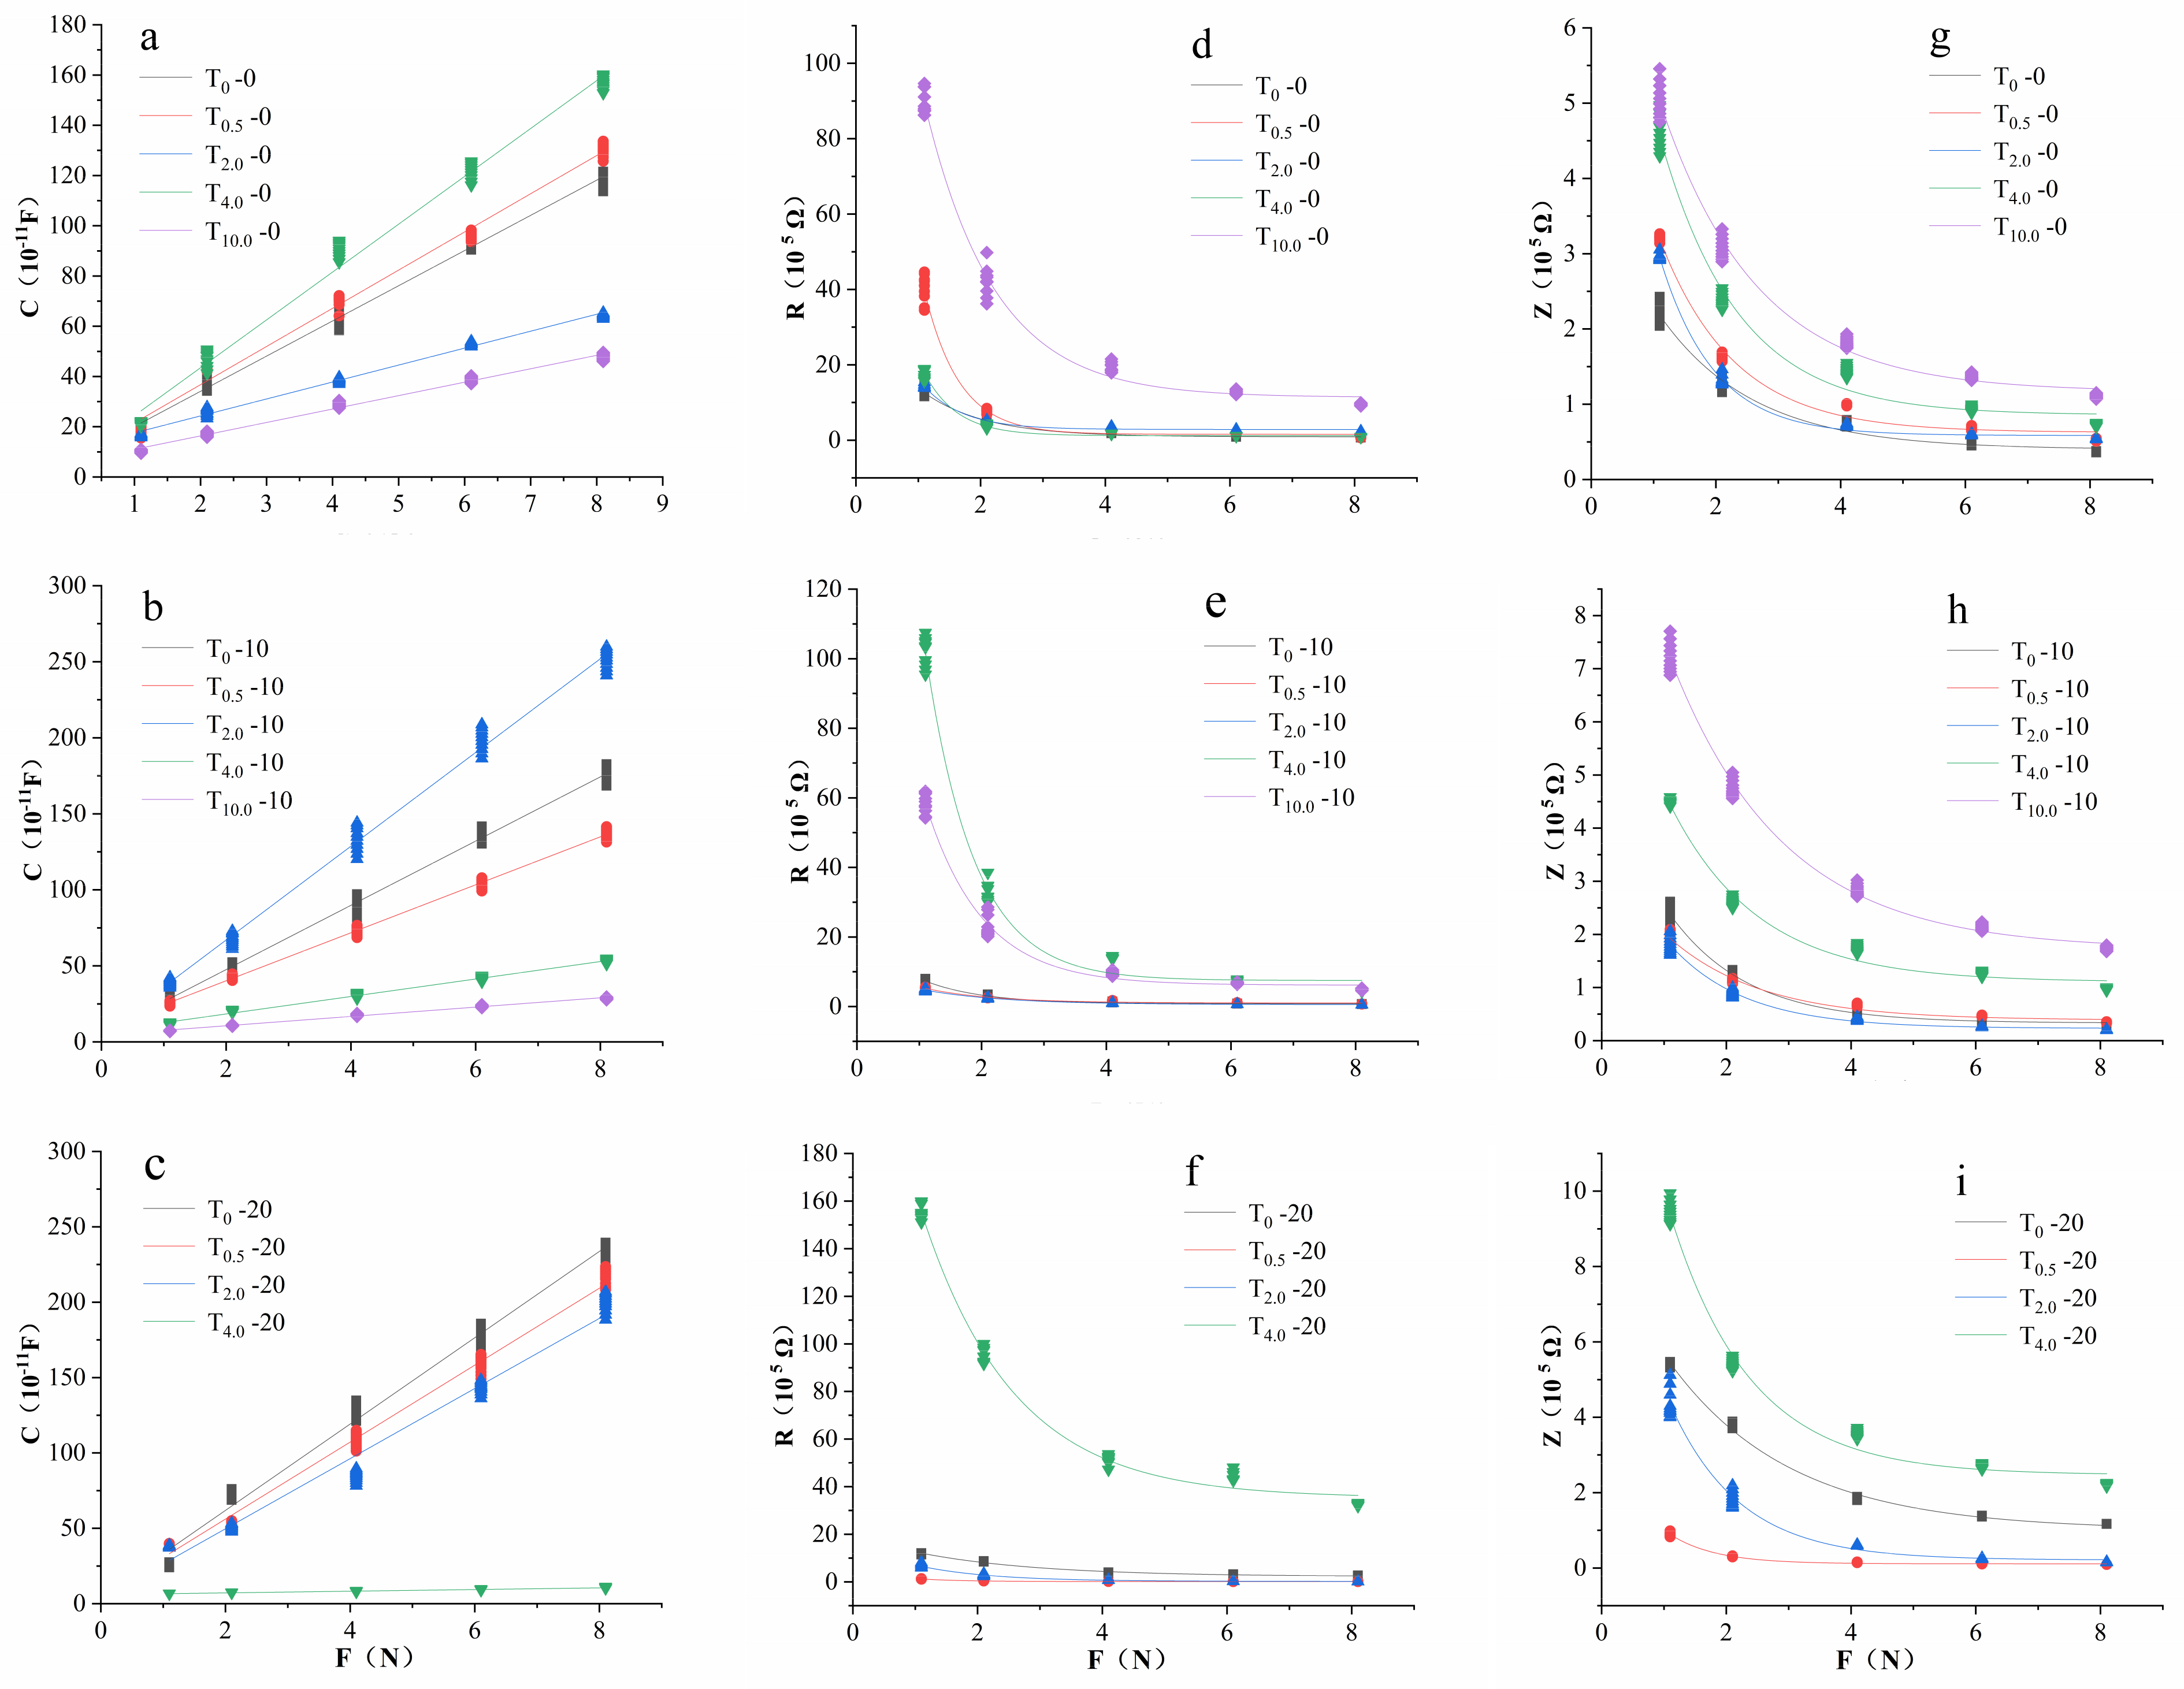
3.3. Effects of Different Concentrations of NaHSO3 on the Cellular Metabolic Energy of I. pseudocorus
The energy in plants used for growth and development is called cellular metabolic energy [
10]. One leaf sample of
I. pseudocorus at each treatment group was taken as an example. Under each treatment concentration of NaHSO
3 and each treatment time, the fitting curves C-F, R-F and Z-F between the clamping force F on the leaf and the capacitance C, resistance R and impedance Z of the leaf are shown in
Figure 8. The correlation coefficient R
2 of the fitting equation was greater than 0.9, and the
p value was less than 0.0001. After receiving treatment for 20 days, the leaves of
I. pseudocorus under T
10.0 had completely withered, so there were no electrophysiological parameters in T
10.0-20.
It can be seen from
Figure 9 that cellular metabolic energy under NaHSO
3 treatment levels showed significantly lower values than that at T
0 level within 2 h of treatment, among which the values at T
2.0 was significantly lower than that of the other treatment groups. On the 10th day of the treatment, the cellular metabolic energy under the low-concentration treatment groups (T
0 and T
0.5) was significantly higher than that under the high-concentration treatment groups (T
4.0 and T
10.0) (
p < 0.05). The cellular metabolic energy under T
2.0 was significantly higher than that under the other treatment groups.
After receiving treatment for 20 days, the cellular metabolic energy showed no significant difference between T2.0 and T0, and the value at T0.5 was significantly lower than those at T0 and T2.0. Under the high-concentration treatment groups (T4.0 and T10.0), the cellular metabolic energy was almost equal to 0.
The results indicate that the plants suffered from stress conditions caused by high concentrations of NaHSO
3. In
Figure 6, the metabolic energy of plants under the low-concentration treatment groups (T
0.5, T
2.0 and T
0) progressively increased with increasing treatment time, while the high-concentration treatment groups (T
4.0 and T
10.0) decreased gradually. Although the increase of the NaHSO
3 concentration could increase the metabolic energy when the NaHSO
3 was not higher than 2 mmol·L
−1, the promoting effect of NaHSO
3 on plants was time-limited.
3.4. Variations of pH Value in Treatment Solutions
pH is one of the most important conventional indicators to evaluate water quality, as it can affect the growth of aquatic plants. During the exposure experiments, the change in pH of the nutrient solution with different concentrations of NaHSO
3 was detected every other day within the first 10 days. The results are shown in
Table 4.
The treatment nutrient solution was an SO2-aqueous solution of NaHSO3, with an initial pH value of approximately 6.80 under T0, and the higher the concentration was, the lower the pH value in the treatment nutrient solutions. At 10 mmol·L−1, the initial pH value was approximately 3.21. In addition, the pH value decreased over time in the treatment nutrient solutions, while the control group showed a fluctuating trend.
The plants at T0 and T0.5 levels grew well in a weakly acidic environment. Although the plants had certain resistance to a stressful environment, as T2.0 treatment showed little inhibition on the growth, an acidic environment could also cause adverse effects on the growth of the plants, as plant leaves at T4.0 and T10.0 levels showed dehydration and shrinkage. These results confirmed the conclusion that high concentrations of NaHSO3 could inhibit the growth of I. pseudocorus.
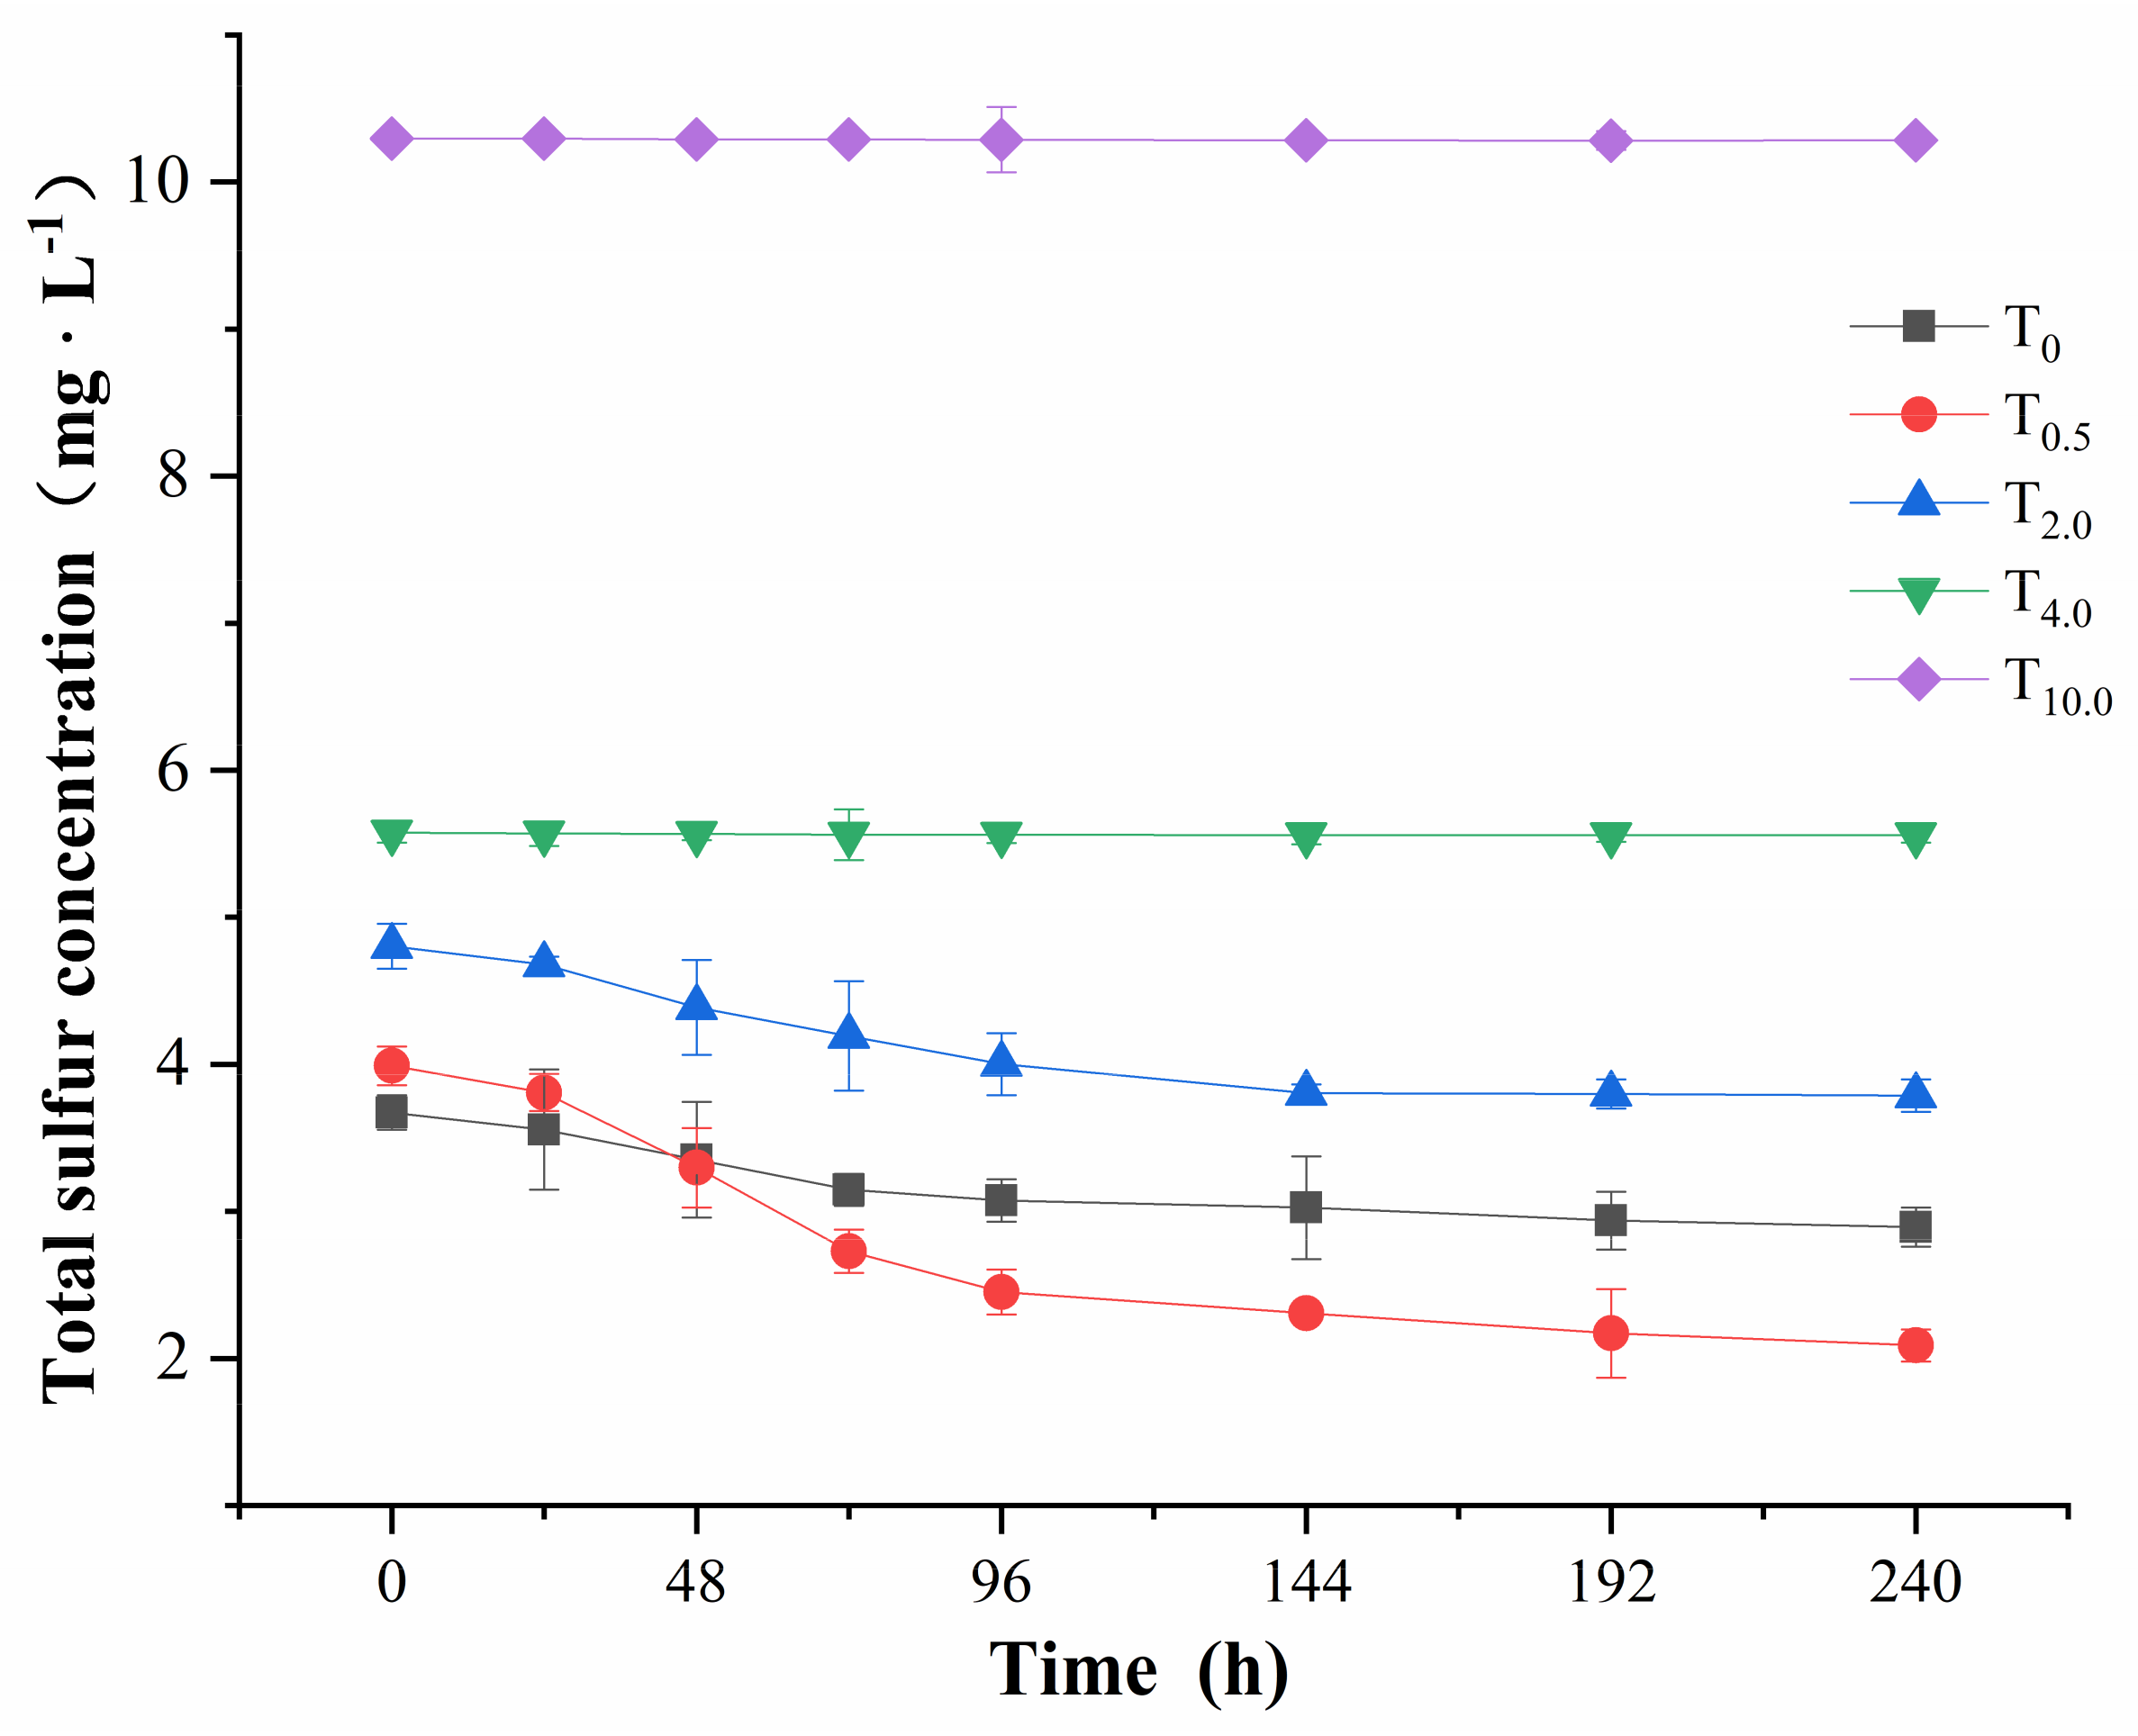
3.5. Sulfur Content in Treatment Solutions
NaHSO
3 may affect the nutrient absorption capacity of
I. pseudocorus by affecting the growth and development of the plants, and the total sulfur consumption in treatment solutions was related to the nutrient absorption capacity. The total sulfur consumption curve of
I. pseudocorus is shown in
Figure 10. The total sulfur concentration of T
0 level and the low-concentration treatment groups (T
0.5, T
2.0) decreased over treatment time, the decrease was severe in the first 4 days, then slowed down to a stable level, indicating that the
I. pseudocorus absorbed sulfur in the treatment solutions in the process of plant development. The total sulfur concentration under the high-concentration treatment groups (T
4.0 and T
10.0) changed little in the 10-day treatment cycle, reflecting that the high-concentration treatment adversely affected the growth of
I. pseudocorus.
When referring to Formula (18), the relationship between the total sulfur concentration and time was analyzed by nonlinear regression analysis (
Figure 10), and the fitting equation for the total sulfur consumption curve in Hoagland’s solutions with different concentrations of NaHSO
3 was obtained, as shown in
Table 5. The kinetic parameters for total sulfur absorption were derived from the equation, as shown in
Table 6.
The R
2 of each fitting equation ranged from 0.970 to 0.989,
p < 0.001 (
Table 5). Therefore, the change in total sulfur concentration in Hoagland’s solution over time at each NaHSO
3 treatment group conformed to the univariate quadratic equation, so the estimated kinetic parameters were of high reliability.
The maximum total sulfur absorption rate of I. pseudocorus was equal to the product of the absolute value of the coefficient derived from the primary term of the equation and the dilution factor (diluted 5 times); the larger the absolute value was, the larger the maximum absorption rate of total sulfur. The largest absorption rate of sulfur in I. pseudocorus was observed at T0.5 level. Compared with the control group (T0), the absolute value of the primary term coefficient decreased, indicating that the absorption rate of sulfur in I. pseudocorus decreased with increasing NaHSO3 concentration.
The kinetic parameters
Vmax and
α at T
0.5 level were the largest, while the
Km and
Cmin were the smallest compared with those values under the control and other treatment groups (
Table 6), which indicated that 0.5 mmol·L
−1 NaHSO
3 promoted the absorption of sulfur by
I. pseudocorus, and the promotion effect was the greatest; The kinetic parameters
Vmax and
α at T
2.0 level were higher, but the
Km and
Cmin were lower than the value under the control group, which indicated that 2 mmol·L
−1 NaHSO
3 promoted the absorption of sulfur by
I. pseudocorus. At T
4.0 and T
10.0 levels, the kinetic parameters
Vmax and
α were lower, but the
Km and
Cmin were higher compared with that under the control group, this showed that the 4 mmol·L
−1 and 10 mmol·L
−1 NaHSO
3 inhibited the absorption of sulfur by
I. pseudocorus, and the higher the concentration of NaHSO
3, the greater the inhibition effect. Moreover, the sulfur absorption capacity and growth of
I. pseudocorus decreased with increasing NaHSO
3 concentration.
3.6. Results of Data Normalization
The data were normalized using methods described in 2.6. The comprehensive analyses and inferences on growth inhibition, photosynthesis, cellular metabolic energy and nutrient absorption show that NaHSO
3 could significantly inhibit the growth and development of
I. pseudocorus, as shown in
Table 7.
Within 2 h of the treatment,
Table 7 shows that the net photosynthetic rate of the high-concentration treatment groups was less than 50% of that of the control group, while that of the low-concentration treatment groups was more than 50%, reflecting that the short-term inhibitory effect of the high-concentration treatment on
I. pseudocorus was stronger than that of the low-concentration treatment groups. The cellular metabolic energy of the treatment groups all decreased, and the greatest reduction was observed at T
2.0 level, which was only 30.75% of that under the control group. From the value of N
WS, plants at T
2.0 level showed the most energy consumption for adversity resistance among all treatment groups, plants in the two low-concentration treatment groups showed higher energy consumption for adversity resistance than those in the control group, while the plants in the two high-concentration treatment groups showed lower energy consumption for adversity resistance than those in the control group.
After receiving treatment for 10 days, the net photosynthetic rate of the low-concentration treatment groups was close to 90% of that of the control group, while the two high-concentration treatment groups showed less than 20% of that of the control group. The cellular metabolic energy at T2.0 level was 130.41% of that of the control group, the value at T0.5 level was 83.17% of that of the control group, while high-concentration treatment groups showed less than 20% of that of the control group. The growth rate of the treatment groups was lower than that of the control group; the values at T0.5 and T2.0 levels were 87.21% and 68.18% of that of the control group, respectively. The energy consumption for adversity resistance was close to that of the control group under the low-concentration treatment groups, while the two high-concentration treatment groups showed higher energy consumption for adversity resistance than the control group.
After receiving treatment for 20 days, T10.0 was excluded from the measurement. The net photosynthetic rate of the low-concentration treatment groups was close to 80% of that of the control group, while the value at T4.0 level was 28.65% of that of the control group. The cellular metabolic energies of treatment groups were all lower than that of the control group, the values at T0.5 and T2.0 levels were 70.72% and 96.18% of that of the control group, respectively. The value at T4.0 level showed less than 1% of that of the control group. The growth rates of the treatment groups were lower than that of the control group; the values at T0.5 and T2.0 levels were 88.14% and 50.61% of that of the control group, respectively. The energy consumptions for adversity resistance in the treatment groups were higher than that in the control group.
3.7. Correlation Analysis of Photosynthetic Parameters and Cellular Metabolic Energy under Different NaHSO3 Treatments
The Pearson correlation coefficients for the relationship of the net photosynthetic rate (
PN), stomatal conductance (gs), transpiration rate (E), intercellular CO
2 concentration (Ci) and cellular metabolic energy (ΔG
B) under different NaHSO
3 treatments are shown in
Table 8. PN had a significant positive correlation with gs, E, Ci and ΔG
B, gs was significantly correlated with E, Ci and ΔG
B, and E was significantly correlated with Ci and ΔG
B. However, Ci exhibited no significant correlation with ΔG
B.
4. Discussion
This paper mainly studied the effects of NaHSO
3 on the growth, photosynthesis and cellular metabolic energy of the aquatic plant
I. pseudocorus and discussed the relationship mechanism between growth, photosynthesis and cellular metabolic energy in the process of plant development. The use of bisulfite-contaminated water for the planting and cultivation of plants may have adverse effects, but the impact of NaHSO
3 on plant photosynthesis or growth depends on its concentration, which may have a two-way impact. Previous studies have shown that NaHSO
3 treatment at low concentrations increased cyclic electron transfer around photosystem I, optimized the ATP/NADPH ratio and improved photosynthesis [
38], and it can also be used as a nutrient element [
39]. The sulfite sulfur is a potent oxygen acceptor which may also interfere with redox reactions [
21], NaHSO
3 treatment at high concentrations was mainly shown to be an oxidant, resulting in excessive acidity and toxic effects on plants. According to the apparent phenomenon of this experiment, the addition of NaHSO
3 could reduce substance accumulation in
I. pseudocorus, but plants grew well under a low concentration of NaHSO
3 (<2 mmol·L
−1), and a high concentration of NaHSO
3 (>4 mmol·L
−1) caused the plant to dry up and die. It was obvious that the higher concentration of NaHSO
3 (>4 mmol·L
−1) inhibited the growth of
I. pseudocorus leaves, but growth was inhibited first and then promoted under the low-concentration treatment (<2 mmol·L
−1). The number of leaves and tillers indicate that NaHSO
3 treatment of low concentration had no significant effect on plant growth but did reduce the ability of plant tillering. Severe damage appeared in
I. pseudocorus leaves under high-concentration treatment. With the increase of NaHSO
3 concentration, plant growth, tillering and fresh matter accumulation were inhibited.
NaHSO
3 can be used as a photosynthetic promoter in agricultural production [
18,
19,
39,
40]. Results in other studies showed that 0.5 mmol·L
−1 NaHSO
3 was the optimal concentration to promote the photosynthetic oxygen release of
Anabaena, and 1 mmol·L
−1 NaHSO
3 could increase the net photosynthetic rate of
Satsuma mandarin by approximately 15% [
20,
41]. In general, a low concentration of NaHSO
3 (<1 mmol·L
−1) can significantly improve the photosynthetic oxygen release rate and dry matter accumulation of lower plants, such as algae [
20,
38,
39], while most higher plants can significantly improve their photosynthetic carbon assimilation ability after being sprayed with NaHSO
3 (<8 mmol·L
−1) [
18,
19,
41,
42]. A high concentration of NaHSO
3 (>8 mmol·L
−1) has certain a toxicity to photosynthesis and other physiological processes in plants. NaHSO
3 (10 mmol·L
−1) significantly reduced the net photosynthetic rate of strawberry leaves [
41]. High concentrations of sulfite inhibited photosynthetic electron transfer in pea leaves [
43]. Bisulfite is also a sulfur source for plants,
Botryococcus braunii stopped growing after 12 days in sulfur-free medium but grew well under bisulfite treatment at 0.1 or 0.8 mmol·L
−1 [
39]. However, the addition of low concentrations of NaHSO
3 to promote plant growth works due to the supply of sulfur nutrition. Meanwhile, Kang et al. [
19] showed that NaHSO
3 inhibited the photorespiration rate of
Caragana korshinskii, and the glyoxylic acid content decreased significantly. The results of Wei et al. showed that HSO
3− could react with superoxide anion at photosystem I to produce SO
42− [
44], while Chen et al. [
18] showed that a low concentration of NaHSO
3 increased the photosynthetic rate of soybean leaves, but the photorespiration rate also increased synchronously. Under normal conditions, photorespiration consumes approximately one quarter of the total photosynthetic yield, while higher temperatures, low CO
2 concentrations and stomatal closure, will increase Rubisco oxygenation beyond a flux beneficial for overall plant performance [
45]. Therefore, the photosynthetic parameters of plants are of great significance when studying the effects of NaHSO
3 on plants.
When referring to the cellular metabolic energy, a high concentration of NaHSO
3 could have an adverse effect, whereas a low concentration of NaHSO
3 may have a favorable effect. In this paper, the cellular metabolic energy was calculated on the basis of electrical signals. Plant leaves of
I. pseudacorus were investigated, and the equation of the cellular metabolic energy was jointly deduced according to the Gibbs free energy equation and the Nernst equation [
46]. By substituting the parameters of the models for the changes of physiological capacitance, resistance and impedance with clamping force into the expression of cellular metabolic energy, the metabolic energy of different plant leaf cells in different environments can be quickly detected online without causing destruction [
28]. At present, the existing studies reflect the metabolic energy of cells in vivo by using the intracellular energy charge state [
47]. However, it cannot truly represent the metabolic energy of the plant cell solely by measuring the intracellular energy state. It is also difficult to measure the state of intracellular energy charge in vivo by current techniques. In this study, by measuring the electrophysiological indices of living leaves, the metabolic energy can be measured rapidly under different environments. Thus, the combination of the cellular metabolic energy and photosynthetic parameters can more accurately evaluate the growth status of plants.
The addition of NaHSO
3 could decrease the net photosynthetic rate of
I. pseudocorus, the intercellular CO
2 concentration at T
0.5 level after the 10- and 20-day treatments and that at T
2.0 level after the 20-day treatment were all significantly higher than that of the control group. NaHSO
3 could inhibit the photosystem II activity and increase the respiration rate [
20], and the proportional increase in photorespiration can be derived. The stomatal conductance of the low-concentration treatment groups was significantly lower than that of the control group after 10 days, and higher than that of the control group after 20 days, which could also offer some support for this speculation. High-concentration NaHSO
3 treatment can destroy the structure of plant cell membrane by interfering with membrane proteins and lipids, bleach its chlorophyll and thus alter membrane integrity [
20,
21], therefore, under high-concentration (T
4.0, T
10.0) treatment, the cellular metabolic energy gradually decreased with the increase of treatment time, the net photosynthetic rate decreased, and the plants gradually dried up and died.
In addition, the growth of aquatic plants is greatly affected by environmental factors, among which the pH value is one of the most important traditional water quality indicators and one of the most important factors affecting nutrient absorption. A decrease in pH will be conducive to anion transmembrane transport and will have a relative effect on the inhibition of ion absorption, while an increase in pH will lead to the opposite effect [
35]. Conversely, the absorption of nutrients by plants will also affect the pH value of the water environment. According to the degree of harm, acid rain was divided into three grades: pH ≤ 4.5 was strong acid rain, 4.5 < pH ≤ 5.6 was weak acid rain and pH > 5.6 was normal [
48]. In this study, from the average pH value in the treatment cycle, the control group and T
0.5 belonged to the normal range, T
2.0 was in the pH range of weak acid rain, and T
4.0 and T
10.0 were in the pH range of strong acid rain. The sulfur ions in the treatment solutions were absorbed by
Acorus calamus L. during its growth. According to the total sulfur concentration, both T
0.5 and T
2.0 treatments promoted the sulfur absorption by
I. pseudocorus compared with the control group, and T
0.5 had the best effect on promoting the absorption of sulfur. Combined with the value of N
WS obtained by normalization, T
0.5 on the 10th day needed 0.1934 unit more energy than the control group to deal with the environment (adversity), and T
2.0 needed 0.0817 unit less energy than the control group, this was presumably because T
0.5 had a greater affinity to sulfur than T
2.0, and it needed more energy to absorb sulfur ions in the lower sulfur concentration solutions. It can be seen that the role that the NaHSO
3 in the low-concentration treatment groups plays in promoting the growth of
I. pseudocorus is much greater than its toxic effect, so there is no need to allocate extra energy for
I. pseudocorus to deal with adversity. NaHSO
3 at this concentration plays a role as a growth promoter to stimulate plant growth and energy storage. In the high-concentration treatment groups (T
4.0 and T
10.0), the absorption of sulfur was very low, which proved that NaHSO
3 had a toxic effect on
I. pseudocorus.


