Article

Comparative Transcriptomic Analysis Provides Insight into the Key Regulatory Pathways and Differentially Expressed Genes in Blueberry Flower Bud Endo- and Ecodormancy Release

1
College of Chemistry and Life Sciences, Zhejiang Normal University, Jinhua 321004, China
2
Zhejiang Provincial Key Laboratory of Biotechnology on Specialty Economic Plants, Zhejiang Normal University, Jinhua 321004, China
3
Dinghai Agricultural Technology Extension Center, Zhoushan 316000, China
4
School of Agriculture, Jinhua Polytechnic, Jinhua 321007, China
*
Authors to whom correspondence should be addressed.
Horticulturae 2022, 8(2), 176; https://doi.org/10.3390/horticulturae8020176
Submission received: 19 December 2021 / Revised: 18 February 2022 / Accepted: 18 February 2022 / Published: 20 February 2022
(This article belongs to the Special Issue Genetics and Breeding of Fruit Trees)

Abstract

:
Endodormancy is the stage that perennial plants must go through to prepare for the next seasonal cycle, and it is also an adaptation that allows plants to survive harsh winters. Blueberries (Vaccinium spp.) are known to have high nutritional and commercial value. To better understand the molecular mechanisms of bud dormancy release, the transcriptomes of flower buds from the southern highbush blueberry variety “O’Neal” were analyzed at seven time points of the endo- and ecodormancy release processes. Pairwise comparisons were conducted between adjacent time points; five kinds of phytohormone were identified via these processes. A total of 12,350 differentially expressed genes (DEGs) were obtained from six comparisons. Gene Ontology analysis indicated that these DEGs were significantly involved in metabolic processes and catalytic activity. KEGG pathway analysis showed that these DEGs were predominantly mapped to metabolic pathways and the biosynthesis of secondary metabolites in endodormancy release, but these DEGs were significantly enriched in RNA transport, plant hormone signal transduction, and circadian rhythm pathways in the process of ecodormancy release. The contents of abscisic acid (ABA), salicylic acid (SA), and 1-aminocyclopropane-1-carboxylate (ACC) decreased in endo- and ecodormancy release, and the jasmonic acid (JA) level first decreased in endodormancy release and then increased in ecodormancy release. Weighted correlation network analysis (WGCNA) of transcriptomic data associated with hormone contents generated 25 modules, 9 of which were significantly related to the change in hormone content. The results of this study have important reference value for elucidating the molecular mechanism of flower bud dormancy release.

1. Introduction

Bud dormancy can be divided into three types: paradormancy, endodormancy, and ecodormancy [1]. During paradormancy, also named “summer dormancy” [2], the break of the axillary bud is repressed by the surrounding organs, similarly to apical dominance. In late fall, plants constantly respond to changes in photoperiod and temperature, and buds enter the endodormancy stage. Endodormancy is the evolutionary adaptation of perennial woody plants to survive the harsh winter. A certain amount of chilling accumulation during the winter is crucial for the transition from endodormancy to ecodormancy. Upon the arrival of warm temperatures in spring, bud break open and flowering begins, so dormancy throughout the bud life cycle ensures that buds can break at the right time. Correct flowering timing is a critical determinant of the adaptation of plants to different environments [3].
Endodormancy is a special characteristic of perennial woody plants from temperate zones, and chilling accumulation is vital for bud endodormancy release. Global climate warming has led to insufficient chilling in certain years and an inability to completely break endodormancy. It can also lead to early bud break during transient warm spells in the middle of winter. Subsequent freezing spells can then damage opening flower buds, which are more vulnerable to freezing damage than closed endodormant or ecodormant buds. These kinds of events can result in large economic losses in fruit tree yield; thus, bud dormancy research has been a major focus for decades. The study of hormones has also been important in the understanding of dormancy, especially abscisic acid (ABA) catabolism and gibberellic acid (GA) biosynthesis in bud or seed dormancy release [4,5]. In recent years, with the development and application of RNA sequencing (RNA-seq) technology, transcriptome studies have been widely applied in investigation of bud dormancy release, including in pear [6,7], cherry [8,9], peach [10], grape [11,12], Japanese apricot [4], and litchi [13]. Identifying differentially expressed genes (DEGs) and their functions is an important part of dormancy research. Significant progress in functional genomics research on transcription factors has been made recently through the application of RNA interference, transgenic plants, and protein–protein interaction approaches. The well-known dormancy-associated MADS box genes (DAM genes) can be regulated by CRT-binding factor (CBF) [14,15], ABRE-binding factors 3 (ABF3) [16], and TEOSINTE BRANCHED1/CYCLOIDEA/PROLIFERATING CELL FACTOR transcription factor 20 (TCP20) [17], and can promote the expression of 9-CIS-EPOXYCAROTENOID DIOXYGENASE (NCED) and BRANCHED 1 (BRC1) [18] to maintain bud dormancy. Nevertheless, more details on gene function need to be confirmed, and more key pathways should be studied in relation to dormancy induction, maintenance, and release. Due to the complex genomes of woody plants and the low transformation efficiency for many perennial woody plants, research on bud dormancy remains quite limited. Therefore, research on bud dormancy induction and release is still a young field.
Blueberries are known to have high nutritional and commercial value. The cultivated area of highbush blueberries has expanded dramatically in recent years [19]. Some northern highbush blueberry (NHB) cultivars, such as “Chandler” and “Bluecrop”, have fruits that are large and delicious; however, the climate of Zhejiang Province (southeastern China) fails to meet their chilling requirements (CR) during winter, resulting in bud break delay and low bud break rate. Although most southern highbush blueberry (SHB) cultivars can be grown well in southern China, some outstanding cultivars, such as “Emerald” and “Springhigh”, exhibit early flowering in winter. Fluctuating warm and cold spells in winter can cause flowers to suffer frost damage, which not only consumes nutrients in the bush but also causes pathogen attacks on the remaining flowers, leading to disease outbreaks and decreased fruit quality and yield. This is a major problem affecting various kinds of fruit trees and bushes [20,21].
To date, although the mechanisms and the functions of some key genes in dormancy release have been revealed, the temporal variations in key metabolic pathways from endodormancy to flowering have not been studied in detail. This research focused on the process of blueberry flower bud endo- and ecodormancy release through transcriptome sequencing and explored the similarities and differences in metabolic pathways, as well as the DEGs between the two types of dormancy release. These results were used to identify the key genes for which expression matched the timeline of flower bud maturity from endodormancy to bud break. By performing weighted correlation network analysis (WGCNA), we explored modules that are highly correlated with hormones and searched for new gene regulation patterns. The research findings can be used in the future to generate new cultivars with different chilling requirements through genetic breeding. Moreover, these results can provide candidate genes for screening early-generation materials through crossbreeding. These results will also be of great help in the regulation of endodormancy to cope with climate change and improve fruit production.

2. Materials and Methods

2.1. Plant Materials

Shoots and flower buds of “O’Neal”, one of the most popular southern highbush blueberry (SHB), were collected from the blueberry orchard (N 29°1′39.05′′, E 119°44′18.17′′) of the Zhejiang Provincial Key Laboratory of Biotechnology on Specialty Economic Plants in China. Healthy shoots with a length of 25 cm and 8–10 flower buds were pruned from blueberry tree. 100 shoots were sampled respectively on the following dates: 19 November, and 1, 8, 15, 22, 29 December in 2018, and 7 January in 2019. Shoots collected from multiple plants were pooled as a single sample, and samples collected from different locations in the field were used to create three biological replicates [22]. Flower buds were frozen immediately in liquid nitrogen after being detached from the shoots and were then stored at −80°C until RNA isolation.

2.2. Identification of the Chilling Requirement and Dormancy Status of O’Neal

The annual temperature and humidity in the orchard were recorded using a temperature recorder (DSR-THUA, ZOGLAB China), and the chilling accumulation was calculated using the Utah model [23]. To determine the optimal period of endodormancy release for detection of associated gene expression, we measured the percentage of bud break using the following method [8]. Pruned shoots were placed in a 500 mL glass beaker with 5 cm length at the bottom immersed in water. Those shoots were kept under the following conditions: light/darkness 16/8 h, light intensity: 320 μmol·m−2·s−1, and relative air humidity 75%. The water in the glass beaker was changed every 2 days, and the ends of the shoots were recut. Dormancy status were evaluated according to the percentage of bud break after 25 days. The end of endodormancy was considered to have been reached when the percentage of bud break was 50% [24]. Three biological replicates were performed for all of the above treatments.

2.3. Artificial Warming Treatment

For artificial warming accumulation, on 29 December 2018, 1 year old shoots (flower buds at the endodormancy stage) of O’Neal trees were collected, incubated at 15 °C for 3 d, and then transferred to 25 °C. The shoots were kept following the conditions described in Section 2.2. After 6, 12, 18, and 24 h, 30 flower buds were collected and frozen in liquid nitrogen. Tissues were stored at −80 °C for later use. Other shoots were exposed to forcing conditions for bud break measurements. Three biological replicates were performed for all the above treatments.

2.4. Preparation of the RNA-seq Library

Total RNA was extracted with an isolation kit (Foregene Co., Ltd., Chengdu, China), and mRNA was enriched with magnetic beads containing oligo(dT). The mRNA was fragmented into short segments of 150~200 nt by adding fragmentation buffer. Short segments of mRNA were used as templates to synthesize cDNA using random six-base hexamers. A two-stranded synthesis reaction system was then prepared to synthesize double-stranded cDNA. The purified cDNA was first repaired with an adhesive end, followed by adding an A base to the 3′ end and connecting the cDNA to the connector. Finally, fragment size selection and PCR amplification were performed.
The RNA from 21 samples (19 November, 8 December, 29 December, 6 h, 12 h, 18 h, and 24 h; 7 bud development stages × 3 replicates) was sequenced on an Illumina HiSeqTM 4000 (Illumina, San Diego, CA, USA) after the libraries were qualified using an Agilent 2100 Bioanalyzer (Agilent Technologies, Inc., Santa Clara, CA, USA) and ABI Step One Plus Real-Time PCR System (Applied Biosystems, Waltham, MA, USA).

2.5. Data Quality Control and Functional Annotation

The original FASTQ reads (raw reads) were filtered for nonconforming sequence reads, such as those containing adapters, those with poly-N greater than 5%, and low-quality reads (the number of bases with a mass value Q ≤ 10 accounting for more than 20% of the whole read). After the data quality assessment was performed, clean reads were compared to the V. corymbosum (NHB “Draper”) reference genome sequence (https://www.vaccinium.org (accessed on 2 September 2019)) using HISAT2 (version 2.0.4) to evaluate the overall quality of the sequencing library. The clean reads were deposited in the National Center for Biotechnology Information (NCBI) Sequence Read Archive (accession number PRJNA762194).

2.6. Screening and Analysis of Differentially Expressed Genes

The number of reads aligned to each gene was counted using HTSeq V0.6.1 [25]. RSEM software was used for quantitative analysis, and the level of gene expression was measured using the FPKM (fragments per kb per million fragments) value. According to the expression results for all genes in each sample, DESeq2 software was used to screen DEGs between samples, with cutoffs of |log2FC| 1 or higher and FDR < 0.05 representing significant DEGs. Noiseq [26] and DESeq2 [27] were used to analyze the differences between repeated samples.
Gene Ontology (GO) analysis was performed with Blast2GO software (V2.5.0) [28,29]. Kyoto Encyclopedia of Genes and Genomes (KEGG) pathway annotation was performed with Blastall [30]. After the GO annotation of each unigene was obtained, the GO function of all unigenes was classified by WEGO to investigate the gene function of distributed species [31]. GO enrichment analysis was performed via the GO seq R package. When the GO term padj (corrected p-value) was <0.05, it was considered to be significantly enriched. KOBAS software was used for enrichment analysis of the DEGs in KEGG pathways.

2.7. Hormone Profiling

The phytohormone (ABA: abscisic acid, SA: salicylic acid, JA: jasmonic acid, ACC: 1-aminocyclopropane-1-carboxylic acid, and CTK: cytokinin) extraction was done following a previously described method [32]. A 100 mg aliquot of ground tissues was mixed with 1 mL of 80% methanol with internal standards (45 pg of 2H5-tZ, 2H5-tZR, 2H6-iP, 2H6-iPR, and 100 pg of [2H6] ABA), and subsequently extracted twice using a laboratory rotator for 2 h at 4 °C. After centrifugation (10 min, 15,000× g, and 4 °C), the supernatant was collected and dried with nitrogen gas. The pellet was then resolved in 300 μL of 30% methanol and filtered through a filter membrane (0.22 μm).
The phytohormones were separated and analyzed using an Exion LCTM (AB SCIEX, Framingham, MA, USA) equipped with an Acquity UPLC BEH C18 column (2.1 × 100 mm, particle size of 1.7 μm), following a method previously described by [33]. The column was maintained at 40 °C and the mobile phases for cytokinins were composed of water (A) and MeOH (B) using a multistep linear gradient elution: 5% B at 0–2.5 min, 5–20% B at 2.5–3 min, 20–50% B at 3–12.5 min, 50–100% B at 12.5–13 min, 100% B at 13–15 min, 100–5% B at 15–15.2 min, and 5% B at 15.2–18 min. The mobile phases were composed of water (A) with 0.1% formic acid and MeOH (B) with 0.1% formic acid using a multistep linear gradient elution: 20% B at 0 to 1 min, 20 to 100% B at 1 to 7 min, 100% B at 7 to 9 min, 100 to 20% B at 9 to 9.3 min and 20% B at 9.3 to 12 min. The flow rate was 0.3 mL min−1.
The phytohormones were analyzed using the triple quadrupole mass spectrometer QTRAP 5500 system (AB SCIEX, Framingham, MA, USA) following a method previously described [34]. The optimized conditions were as follows: curtain gas, 40 psi; ion spray voltage, 5000 V (CTK, ACC) for positive ion mode; 4500 V (ABA, SA, and JA) for negative ion mod [35]; turbo heater temperature, 600 °C; nebulizing gas (Gas 1), 60 psi; heated gas (Gas 2), 60 psi. Analyst software (version1.6.3, AB SCIEX, Framingham, MA, USA) was used. The data analysis was processed using MultiQuant software (version3.0.2, AB SCIEX, Framingham, MA, USA). Hormones were accurately quantified through internal standards.

2.8. WGCNA

Weighted gene correlation network analysis (WGCNA) was performed using the “WGCNA” R package as previously described [36]. Changes in the contents of five hormones (ABA, SA, JA, ACC, and CTK) at six time points (19 November, 8 December, 29 December, 6 h, 18 h, and 24 h) of dormancy release were used as phenotypic data, and the gene expression level based on RNA-seq was used as the database. The soft threshold, β, was calculated using the Pick Soft Threshold function in the WGCNA package to make the coexpression network conform to the scale-free topology.

2.9. Quantitative RT–PCR (qRT–PCR) Validation

Total RNA extraction and 1st-strand cDNA synthesis were performed according to a previous report [37]. Synthesized first-strand cDNAs were diluted 3-fold for qPCR validation. Specific primers (Supplementary Table S1) of 20 randomly selected DEGs were designed using Primer-BLAST (https://www.ncbi.nlm.nih.gov/tools/primer-blast/ (accessed on 6 October 2019)), and VcGAPDH was used to normalize the amount of cDNA among the samples [38]. qPCRs were performed on an ABI Step One PlusTM RT–PCR system (Applied Biosystems, USA). The PCR system, procedures, and data analysis were performed according to [39]. Data analyses were performed using the relative quantitative method (2−ΔΔCt).

2.10. Statistical Analysis

Statistical analyses were performed using SPSS Statistics 21 software. The data are expressed as the mean value and standard deviation (mean ± SD, n ≥ 3). Statistical significance was evaluated via an independent sample t-test (confidence interval = 95%) using Statistics 21 software. Figures were plotted using Prism and Tbtools software.

3. Results

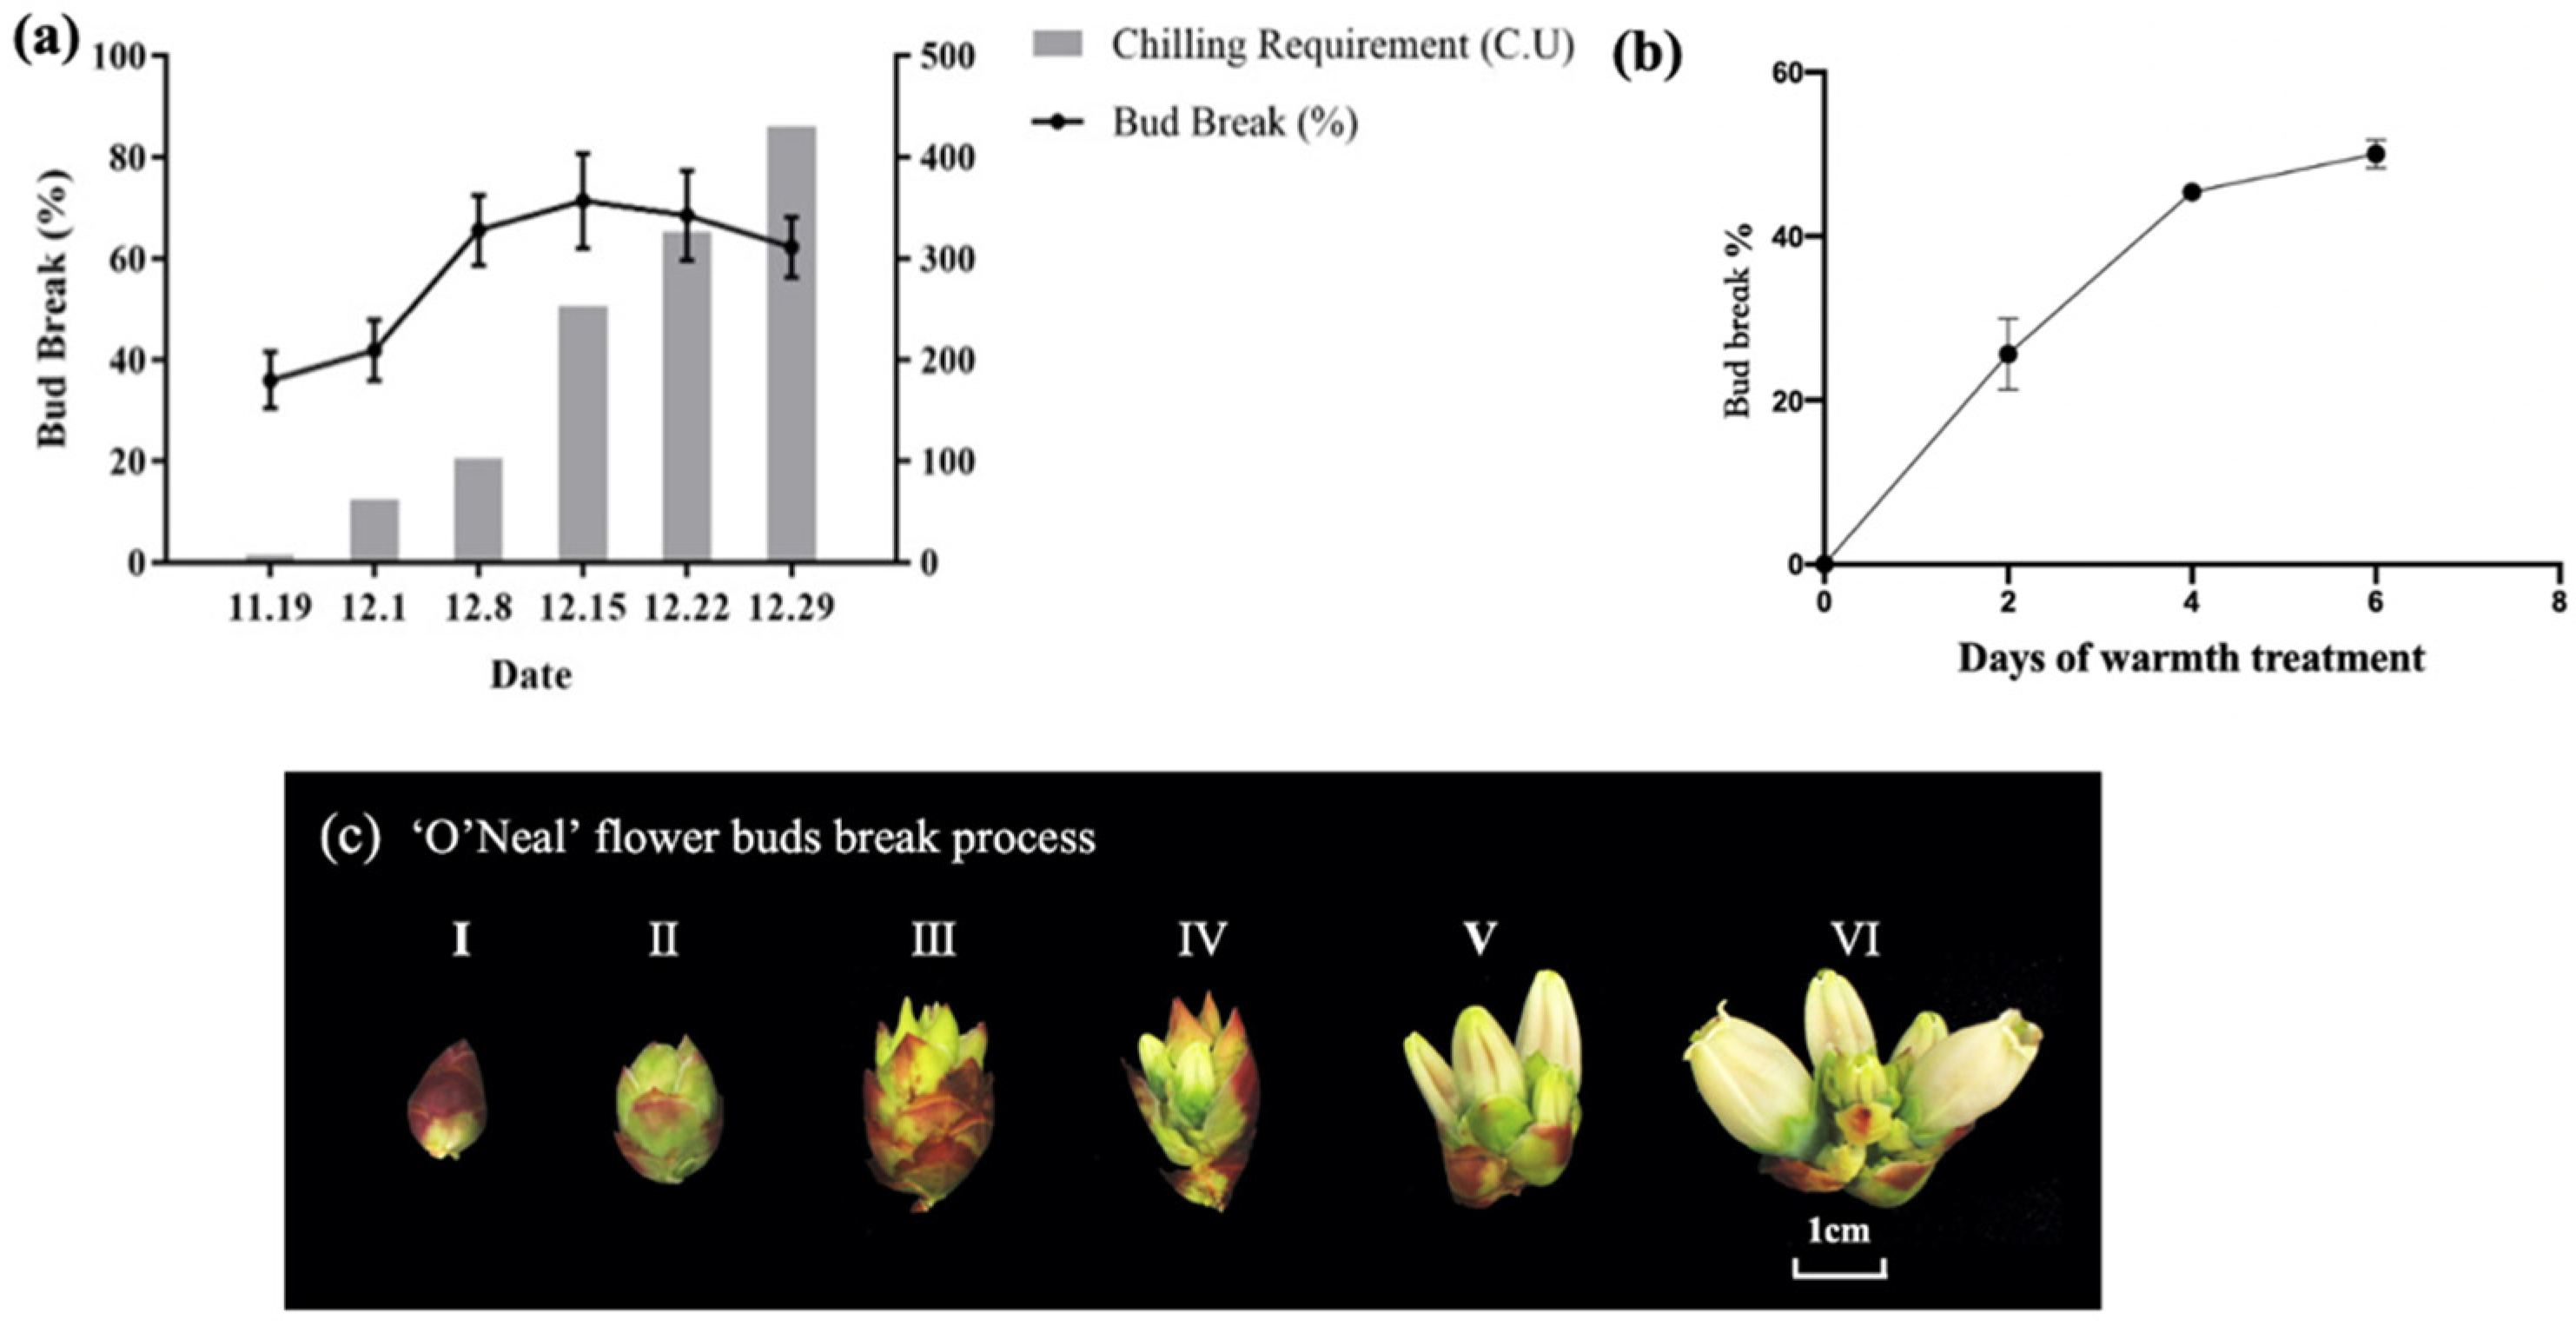
3.1. Identification of the Dormancy Stage of Blueberry Flower Buds

Shoots were cut from field plants after different periods of chilling and warm temperature treatment, and bud development was monitored (Figure 1c) to determine the best treatments for RNA-seq. As of 19 November 2018, the chilling accumulation for field plants of the O’Neal variety was 0 CU. The flower buds were at the endodormant stage, and the sample was marked as Nov. 19. On 1 December 2018, chilling accumulation had reached 72.9 CU, and the final bud break percentage was 41.85%. On 8 December 2018, chilling accumulation reached 102.6 CU, the sample was labeled Dec. 8, and the final bud break rate was 65.64% (Figure 1a), exceeding 50% for the first time. Therefore, the time to break endodormancy was reached between 1 December and 8 December 2018. On 29 December 2018, the bud break percentage of the samples reached 62.31%, and the bud break rate did not improve with longer chilling accumulation. After that point, the flower buds of the blueberries had strong sprouting potential, and the bud stage was considered to be ecodormancy; the sample was labeled Dec. 29. When the ecodormant buds were transferred to 25 °C treatment for 2 d, 25.62% of the flower buds sprouted (Figure 1b); considering that the expression of genes occurs earlier than morphological changes, it was decided that samples would be taken every 6 h (6 h, 12 h, 18 h, and 24 h) after warm temperature treatment to screen for key DEGs involved in the process of ecodormancy release. Flower buds collected at the above seven time points (19 November, 8 December, 29 December, 6 h, 12 h, 18 h, and 24 h) from endodormancy to flowering were used as experimental materials for subsequent transcriptome sequencing.

3.2. RNA Sequencing Data Analysis

The range of raw reads from a single library produced by transcriptome sequencing was 40,117,154-41,356,720 (Table 1). Raw reads were filtered to remove low-quality reads. The range of high-quality clean reads (Phred value > Q30) was 40,111,158~41,351,040, accounting for 99.99% of the raw data; subsequent analyses were based on clean reads. The GC content was approximately 47%, and the percentage of bases with a quality value of up to Q30 was more than 93%. Following quality assessment, HisAT2 software was used to compare the clean reads to blueberry genome sequences, and the percentage of mapped clean reads was 72.04%~79.71%. The above results indicated that we obtained high-quality transcriptomes of blueberry flower bud dormancy release that could be used for subsequent analyses.

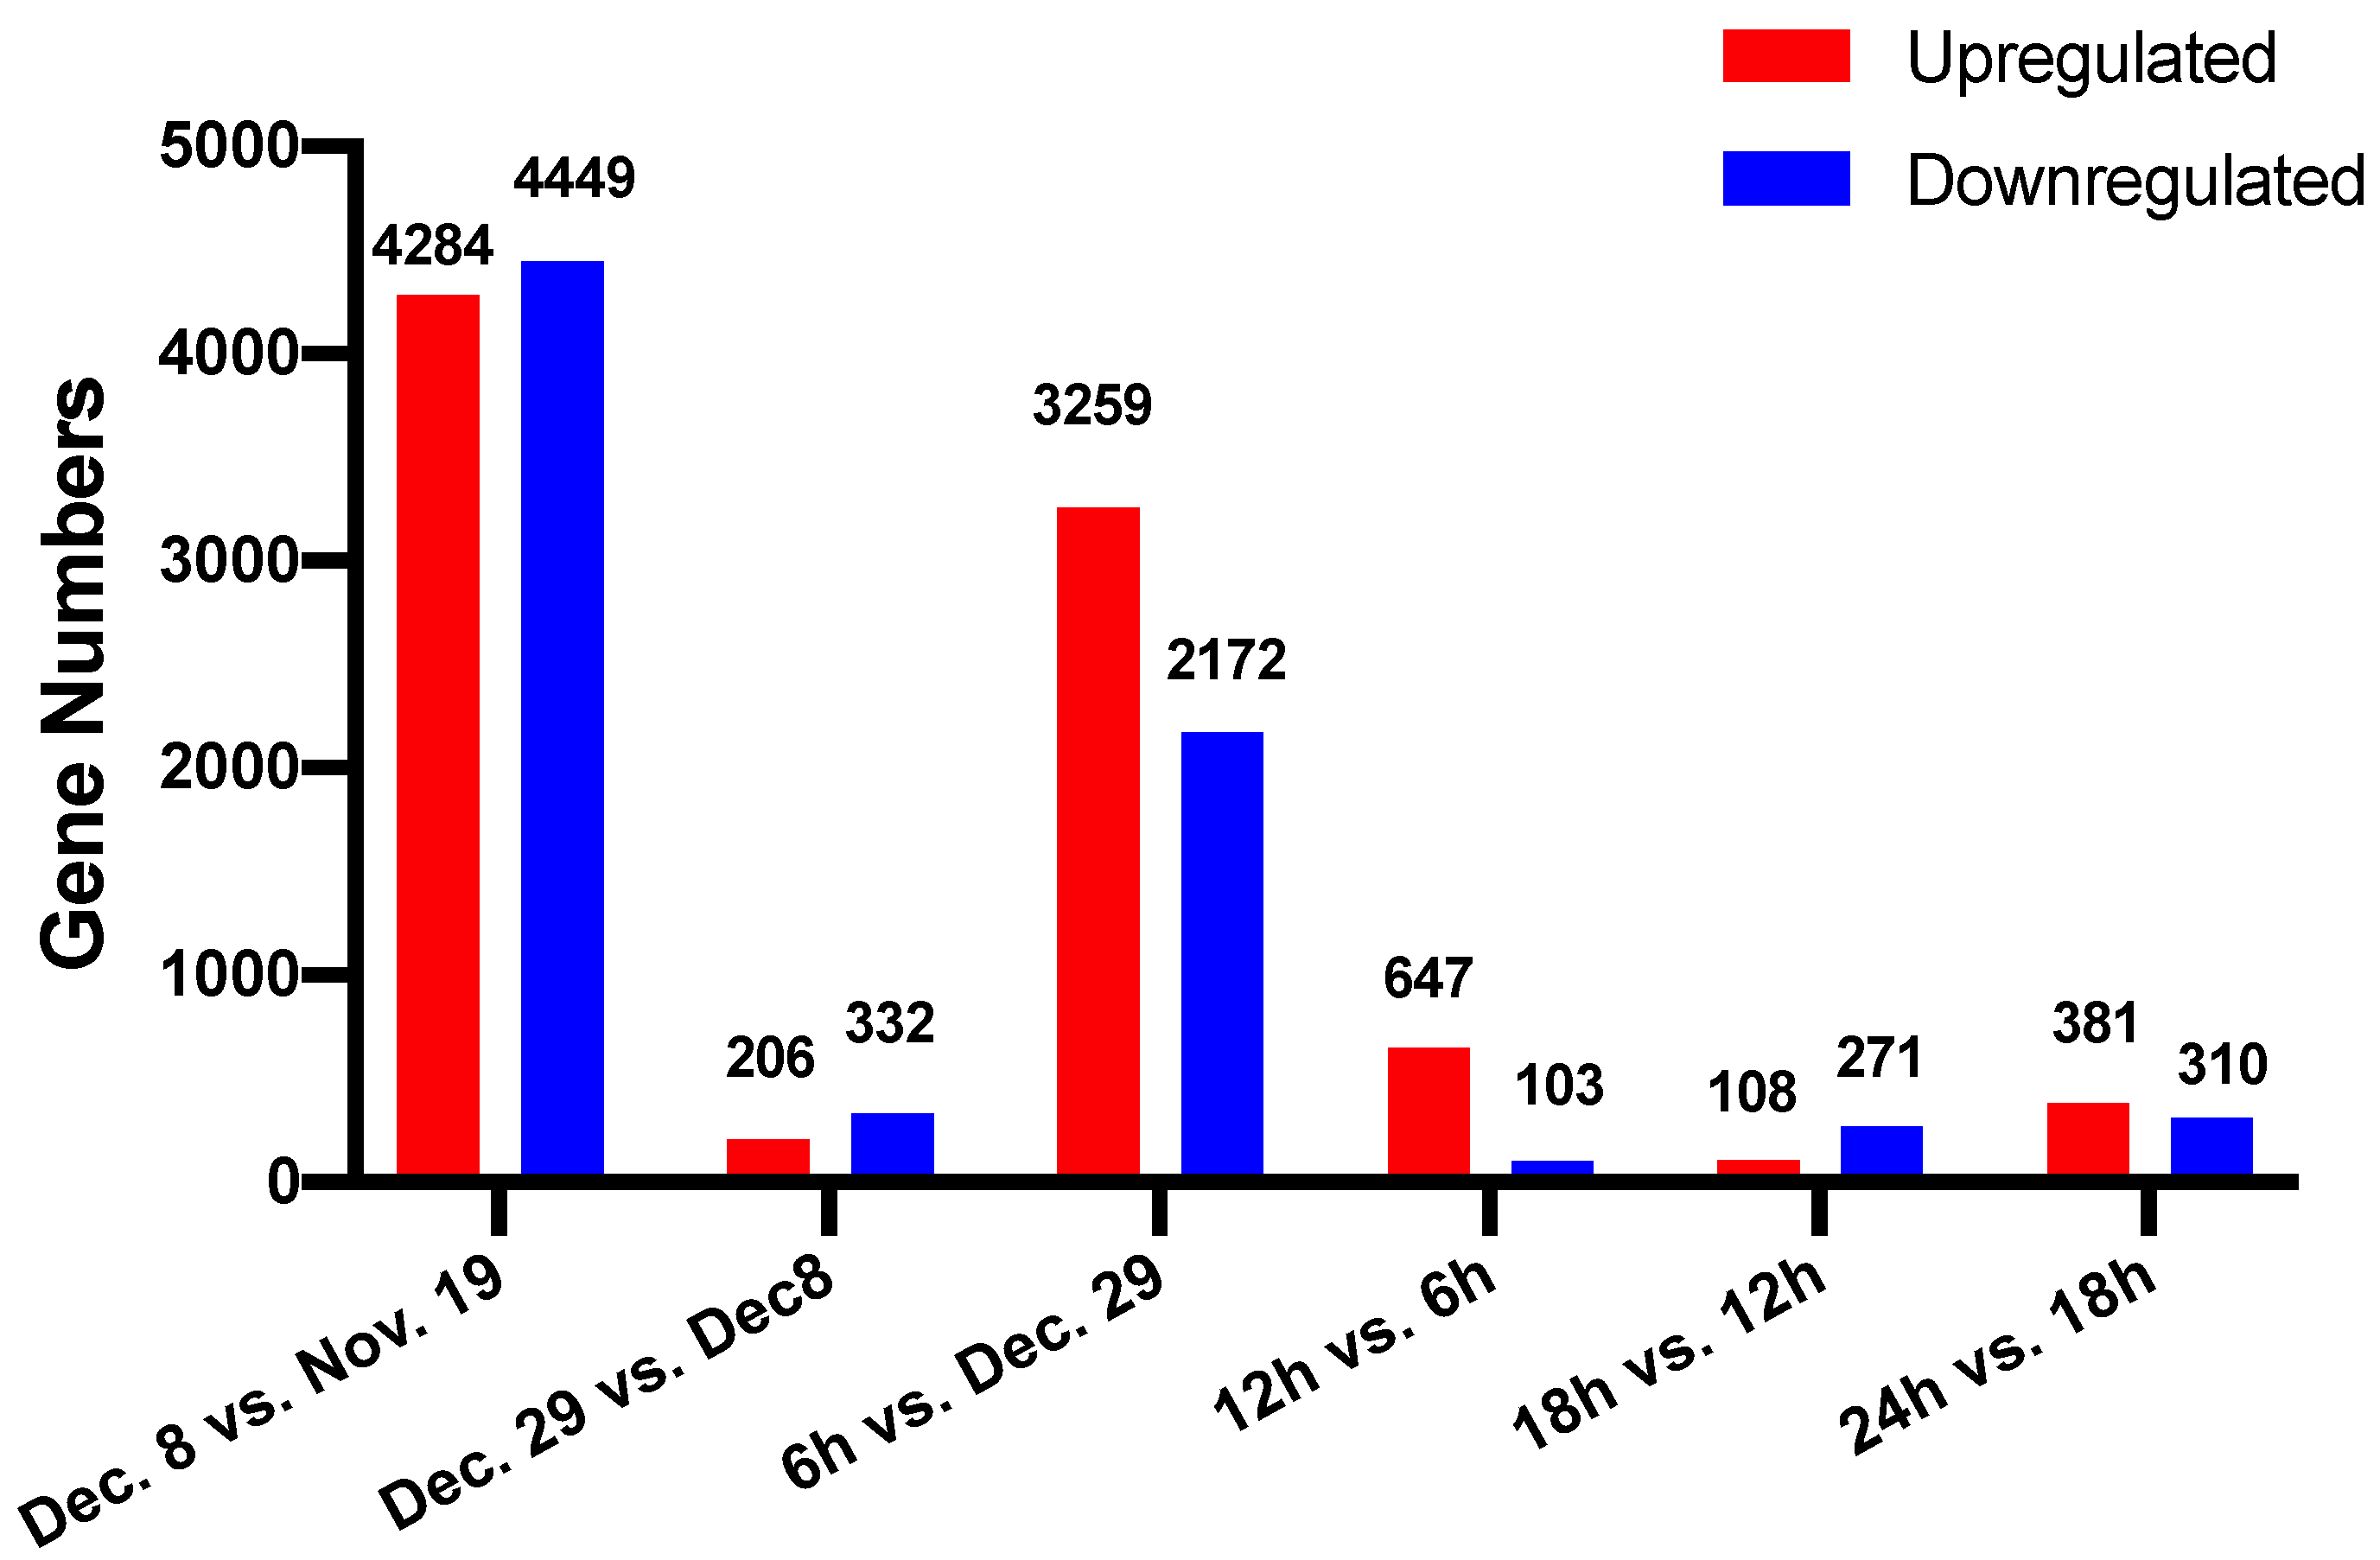
3.3. Screening of Differentially Expressed Genes during Dormancy Release

The goal of the differential expression analysis was to identify the genes that were significantly differentially expressed among the samples. According to the FPKM values of all the genes in each sample (Supplementary Table S2), DESeq2 software was used to screen DEGs between the samples. The adjacent expression libraries were pair-matched: Dec. 8 vs. Nov. 19; Dec. 29 vs. Dec. 8; 6 h vs. Dec. 29; 12 h vs. 6 h; 18 h vs. 12 h; 24 h vs. 18 h. According to a cutoff of |log2FC|≥ 1 with an FDR < 0.05 threshold, significant DEGs in the process of flower bud dormancy release were filtered.
As shown in Figure 2, during the process of endodormancy release, there were 8733 DEGs in Dec. 8 vs. Nov. 19, among which 4284 genes were upregulated and 4449 genes were downregulated. There were 538 DEGs in Dec. 29 vs. Dec. 8, of which 206 were upregulated and 332 were downregulated, indicating that the gene expression changes were most obvious upon endodormancy release. However, the gene expression changes were not obvious after entering the ecodormancy stage. In the process of ecodormancy release, 3259 genes were upregulated and 2172 genes were downregulated in 6 h vs. Dec. 29. There were 750 DEGs in 12 h vs. 6 h, while the number of DEGs did not exceed 700 in subsequent comparisons, indicating that the release from ecodormancy does not involve as many DEGs.

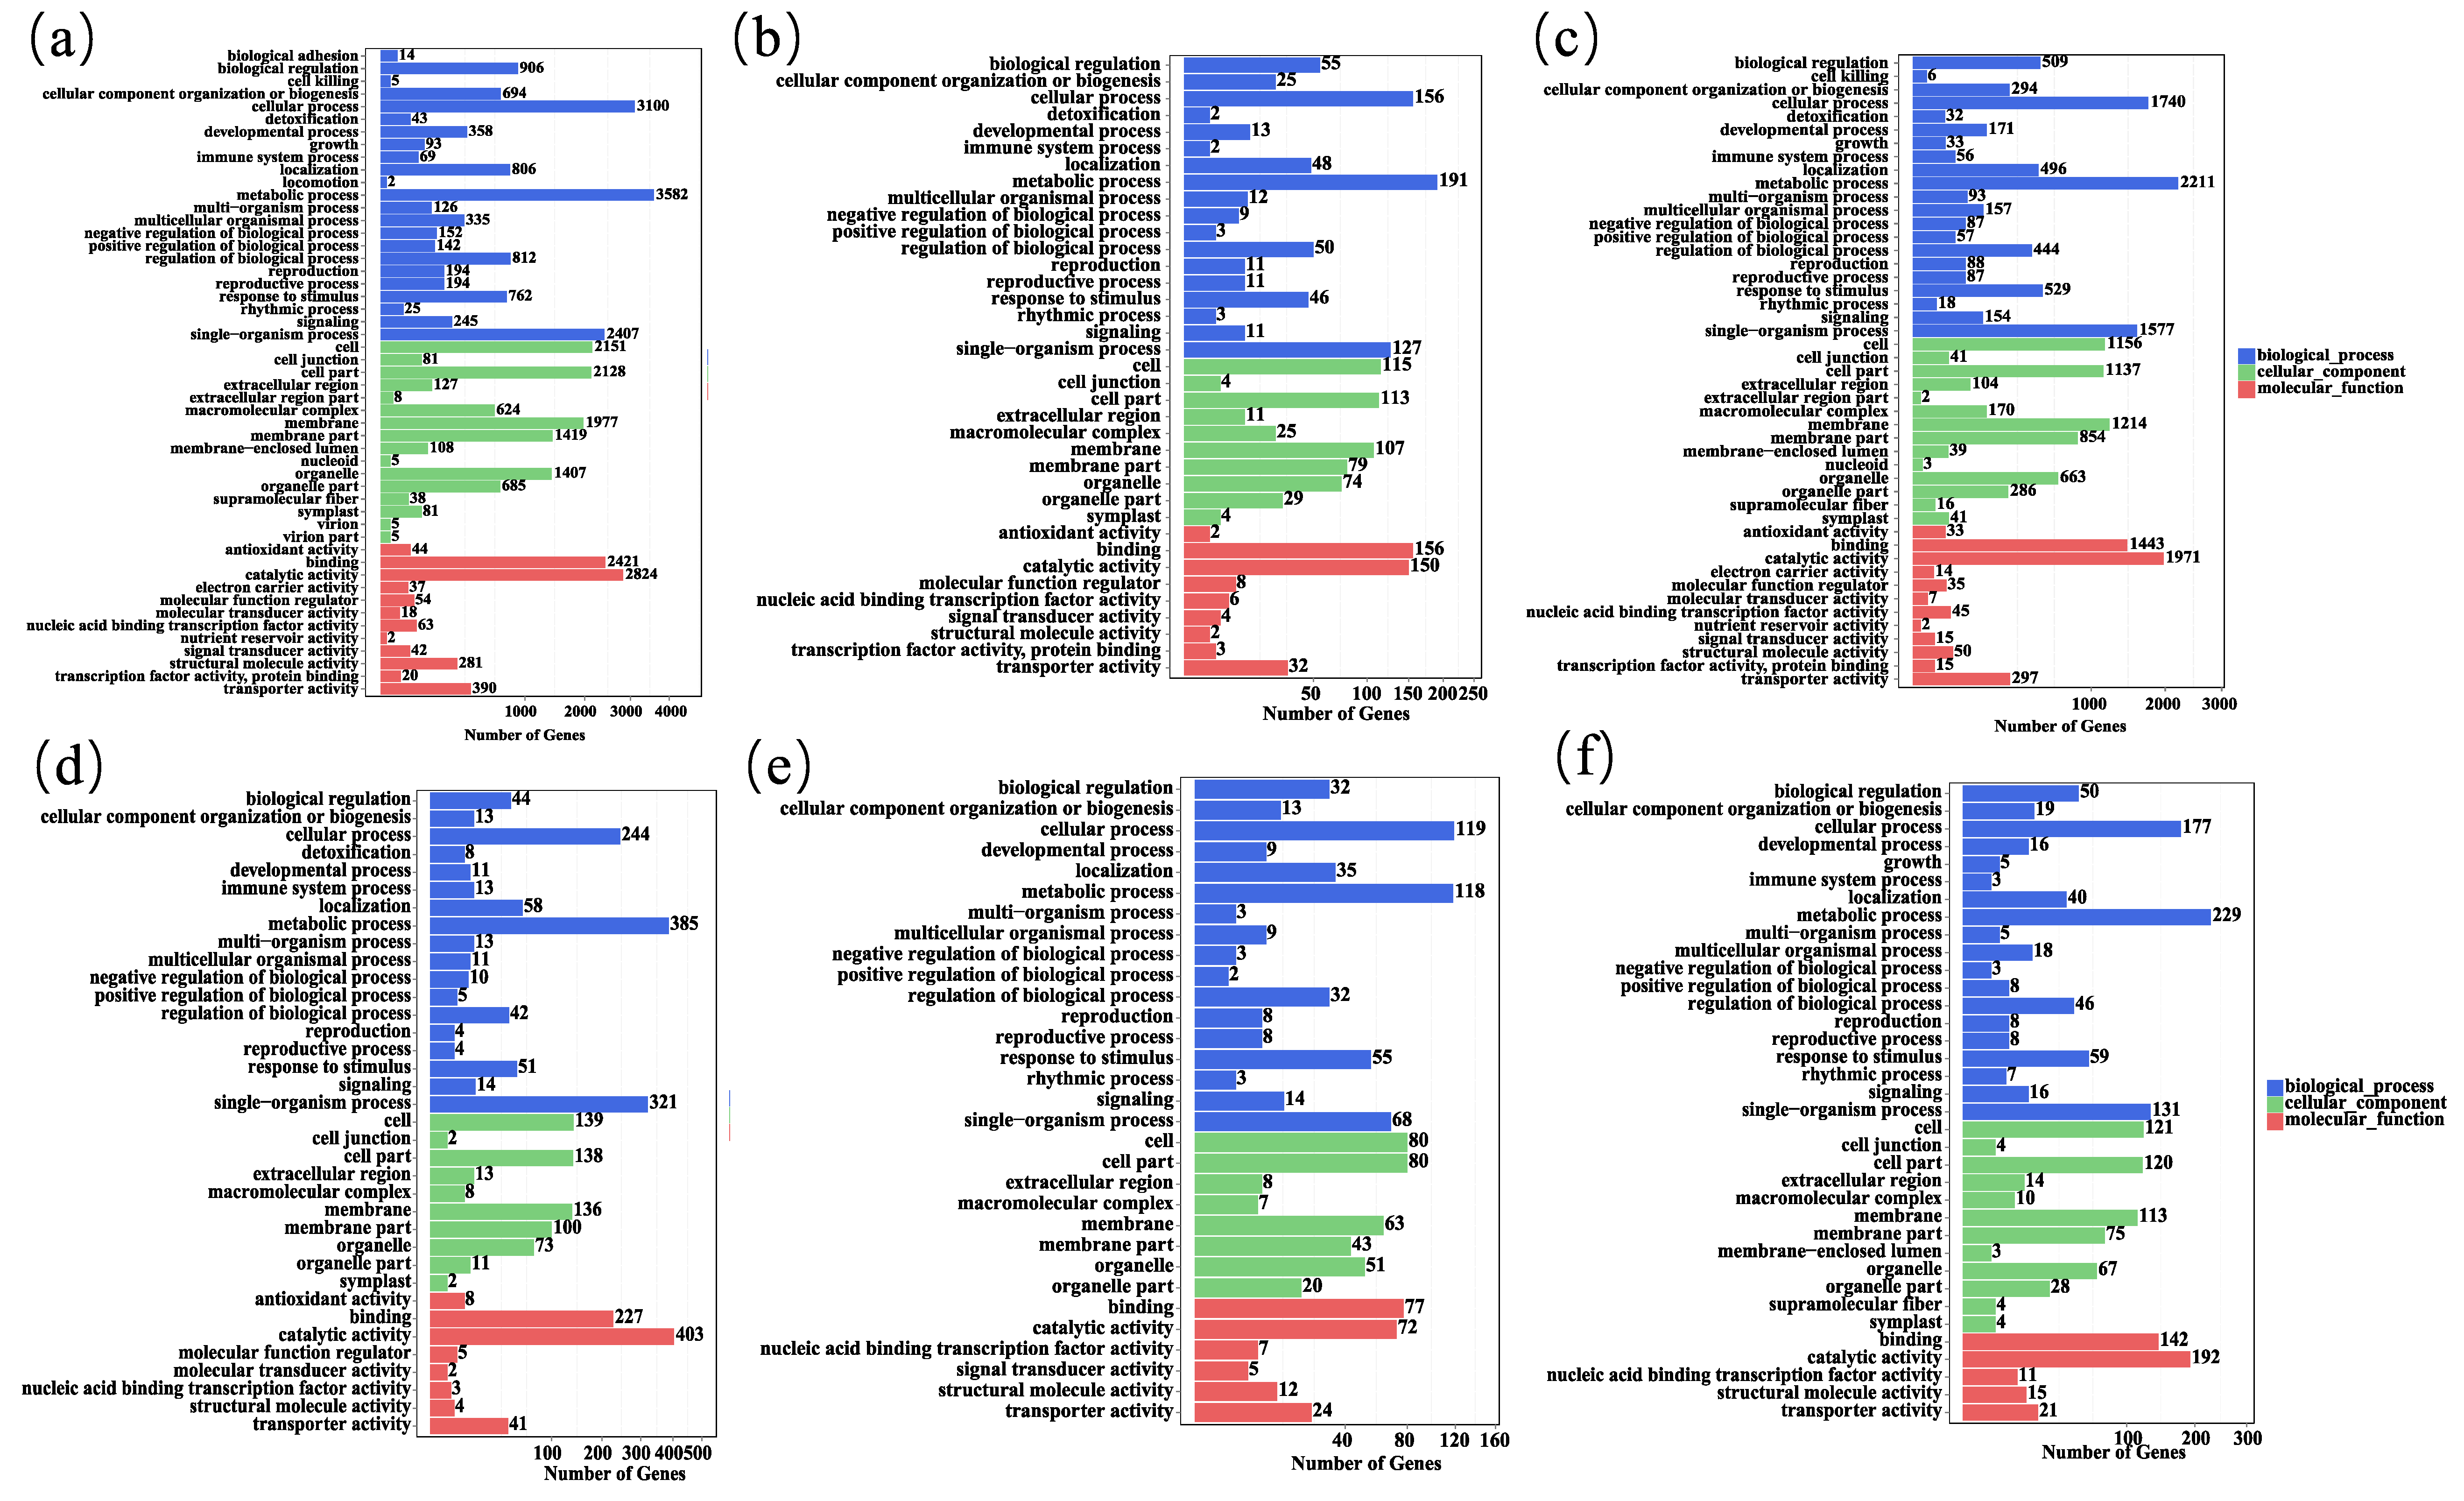
3.4. GO Enrichment Analysis of Differentially Expressed Genes

To analyze the metabolic pathways and biological functions of the DEGs, GO enrichment analysis was performed (Figure 3 and Supplementary Table S3). The results are displayed for biological processes, cellular components, and molecular functions. In the process of endodormancy release, the most significantly enriched GO term was metabolic processes in the biological process category (3582 DEGs in Dec. 8 vs. Nov. 19). Among the cellular components, the top four enriched GO terms were cell, cell part, membrane, and membrane part. For molecular functions, DEGs were significantly enriched in binding and catalytic activity, and the number of DEGs in the catalytic activity term was greater than that of the binding term. Throughout the GO classification, metabolic processes and catalytic activity were significantly enriched, suggesting that the process of endodormancy release requires the activation of many energy metabolic pathways and related enzymes. During the process of ecodormancy release, the results of GO enrichment were similar to those for endodormancy release (Figure 3c–e).

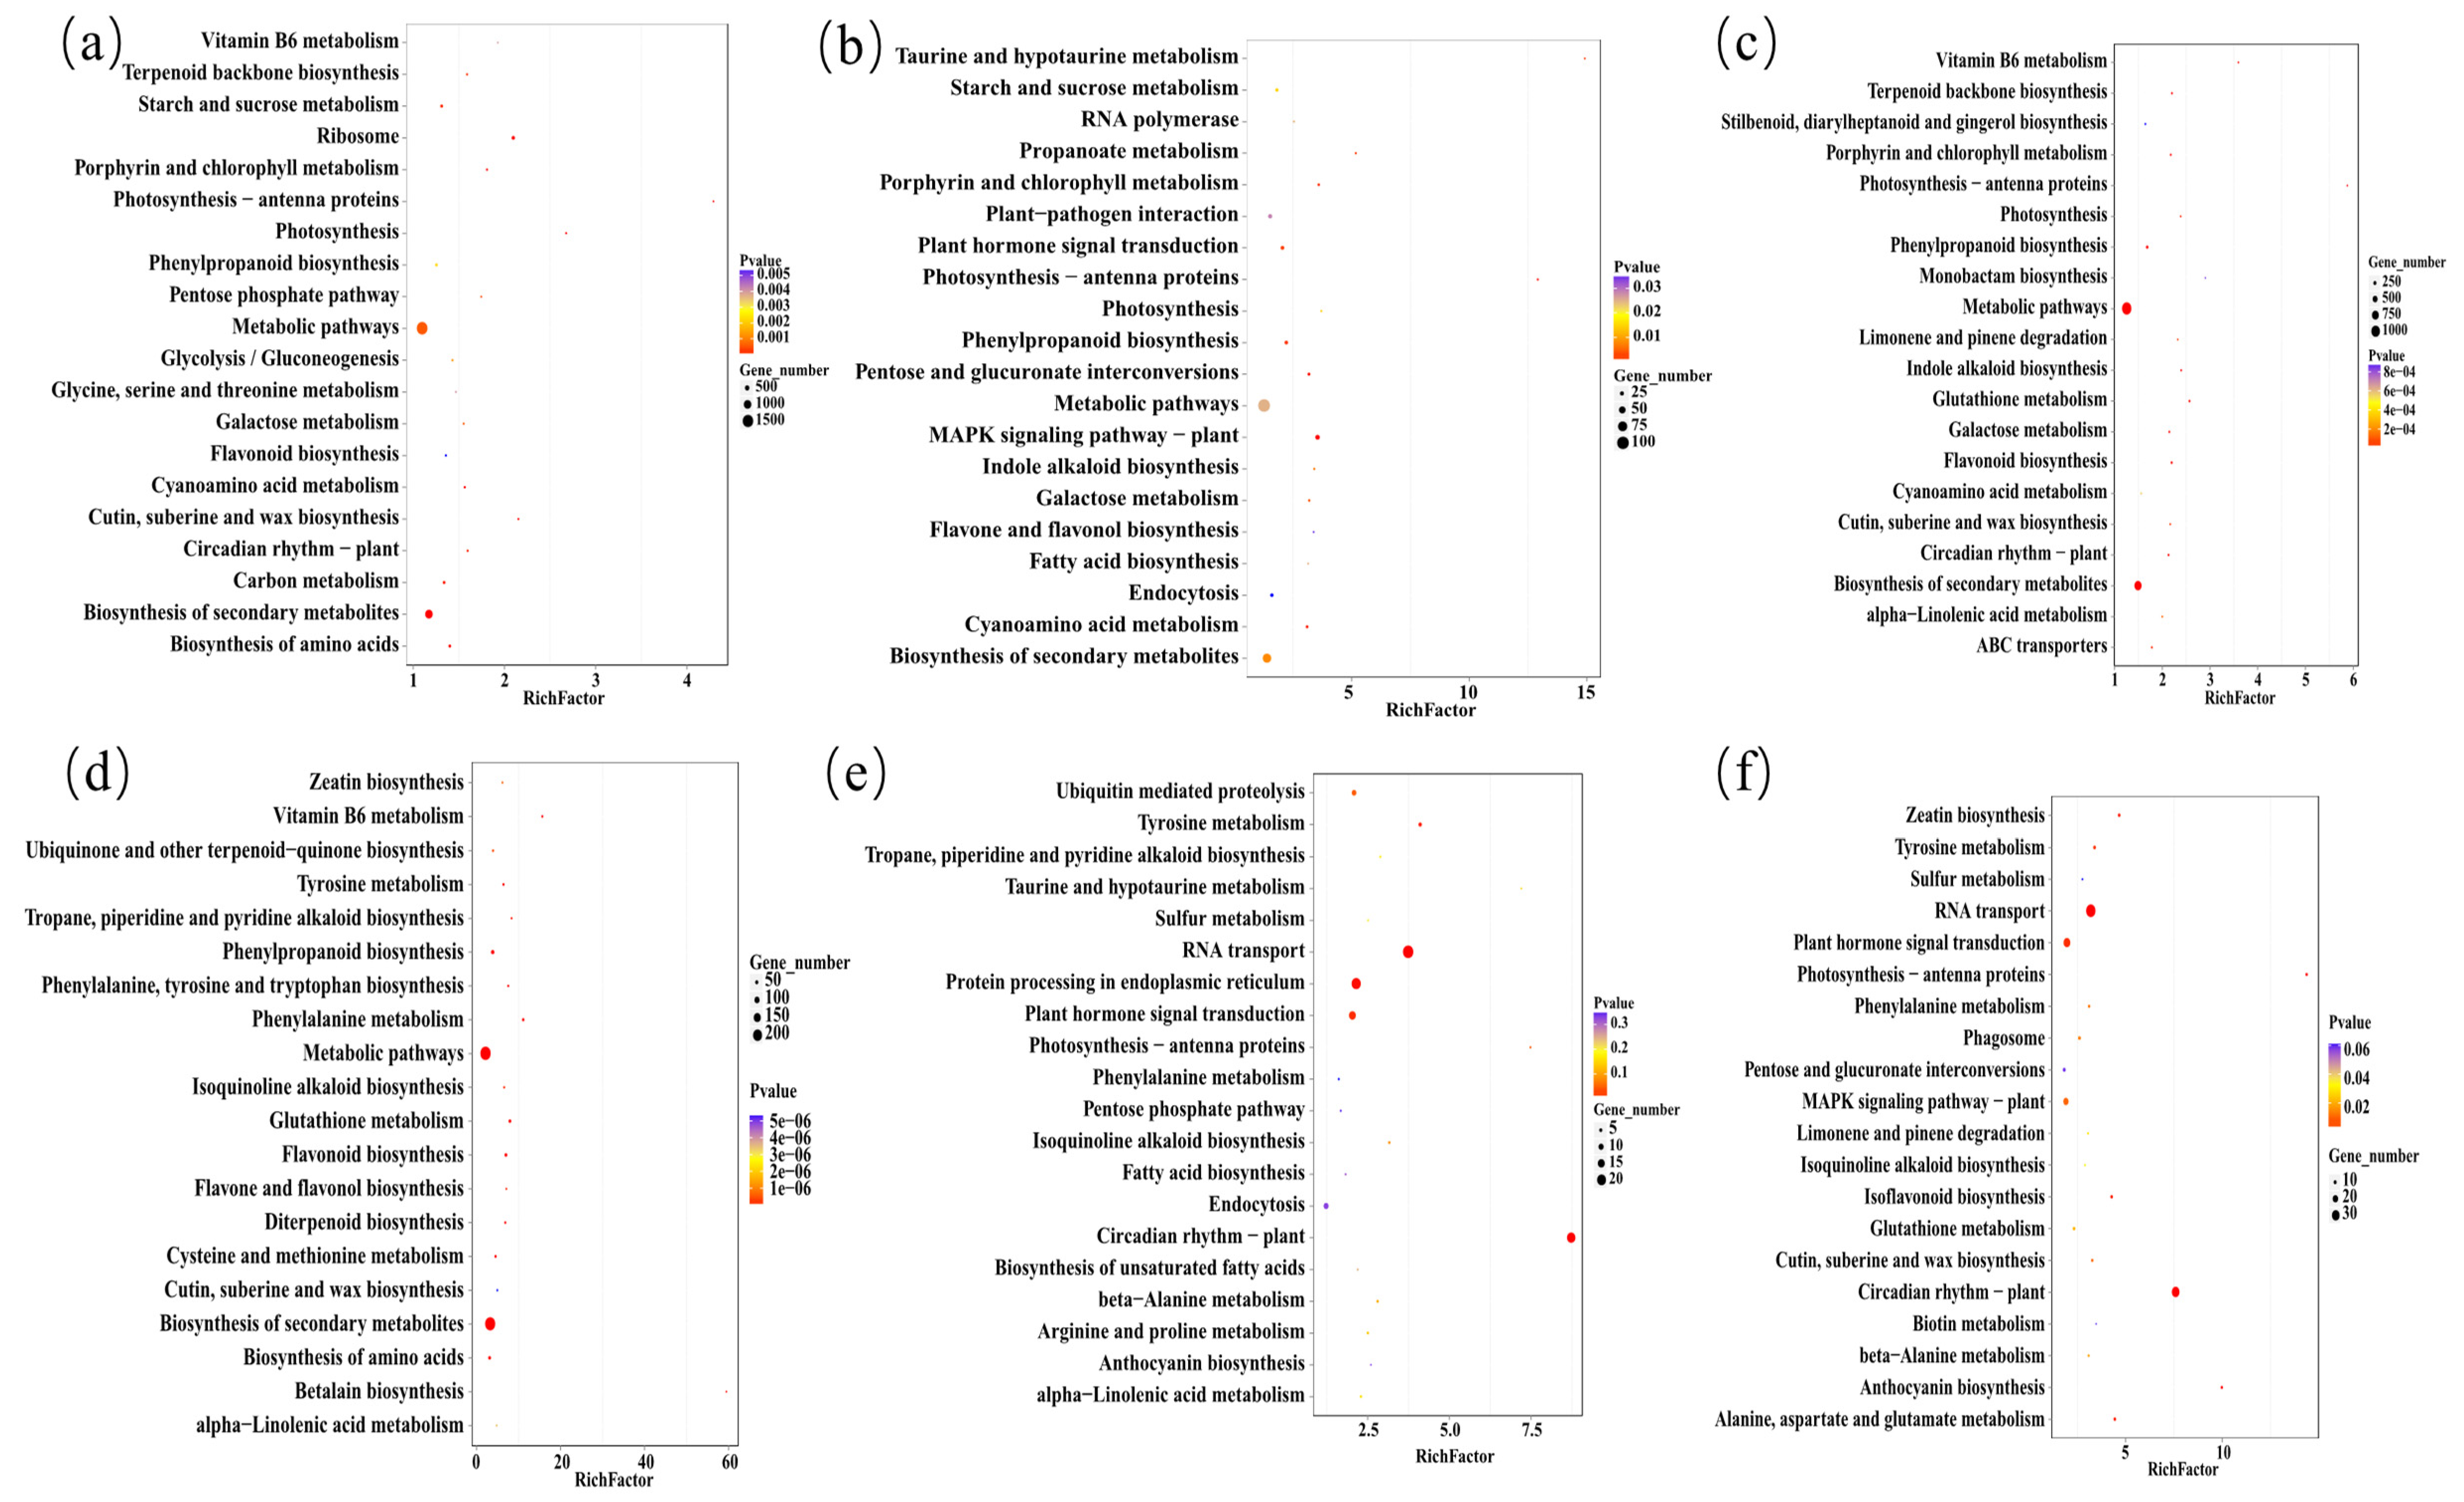
3.5. KEGG Enrichment Analysis of the DEGs

During the endodormancy release process, the enrichment results showed that 9372 and 636 DEGs were mapped to 133 and 89 KEGG pathways in Dec. 8 vs. Nov. 19 and Dec. 29 vs. Dec. 8, respectively (Supplementary Table S4). Figure 4 shows the top 20 pathways in the KEGG classification. The smaller the p-value, the more reliable the enrichment significance of DEGs in the pathway. The rich factor refers to the ratio between the number of DEGs annotated to a certain pathway and the number of all genes annotated to this pathway. The higher the enrichment factor, the more significant the enrichment level of DEGs in this pathway. Dec. 8 vs. Nov. 19 was a critical phase of endodormancy release, and 5222 (55.7%) DEGs were significantly associated with 30 pathways (p < 0.05). The most mapped pathways were metabolic pathways and the biosynthesis of secondary metabolites; others included ribosomes, photosynthesis, amino acid biosynthesis, carbon metabolism, plant circadian rhythms, terpenoid biosynthesis, starch and sucrose metabolism, pentose phosphate pathway, galactose metabolism, glycolysis and glycosylation, vitamin B6 metabolism, flavonoid biosynthesis, and peroxisomes. The comparison of the four sequential libraries (Dec. 29 vs. Dec. 8, 6 h vs. Dec. 29, and 12 h vs. 6 h) showed that the metabolic pathway of DEG enrichment was the same as that for Dec. 8 vs. Nov. 19. However, the proportion of DEGs enriched in the metabolic pathways and biosynthesis of secondary metabolites based on the total number of DEGs increased significantly.
The comparison of the two libraries for warming accumulation for 18 h and 12 h (18 h vs. 12 h) showed that there were significant differences from the previous four comparisons. The top four metabolic pathways with DEG enrichment were RNA transport, protein processing in the endoplasmic reticulum, plant hormone signal transduction, and circadian rhythm. In the comparison between 24 h and 18 h of warming accumulation (24 h vs. 18 h), the metabolic pathways with DEG enrichment were similar to the previous comparison. Among the top four metabolic pathways with the most enrichment, the MAPK signaling pathway-plant replaced protein processing in the endoplasmic reticulum. The results indicated that there were significant metabolic differences in flower buds after 18 h of warming accumulation, which may represent the initiation of flowering.

3.6. Analysis of Differentially Expressed Genes in Circadian Rhythm and Key Metabolic Pathways during Dormancy Release

The circadian rhythm is thought to be important in the regulation of dormancy onset and release in some species, and we found DEGs that were significantly enriched in the circadian rhythm pathway during the process of dormancy release. Consequently, we focused on genes involved in the circadian rhythm to validate their roles in blueberry flower bud dormancy release. A total of 85 DEGs related to circadian rhythm were found in the comparison of Dec. 8 vs. Nov. 19 (Supplementary Table S5). We selected 11 representative genes and analyzed their expression patterns; the results indicated that the expression levels of a large number of circadian-rhythm-related genes differed from endodormancy to endodormancy release, e.g., FT: Vaccdscaff28-snap-gene-259.27; ELF3: VaccDscaff36-snap-gene-15.50; HY5: VaccDscaff28-snap-gene-90.32; and CO: VaccDscaff1-augustus-gene-404.27. As shown in Figure 5a, the expression patterns of circadian rhythm genes were grouped into two categories, with one group downregulated and the other upregulated during endodormancy release, for which CO and FT are examples, respectively. The expression level of CO was high in the endodormancy stage, and that of FT was low. The expression of the CO gene was downregulated during the endodormancy release, while the change of expression of FT was opposite. The results showed that their expression patterns are negatively correlated and FT may be inhibited by CO. During the transition of ecodormancy release, the expression levels of COP1, TCP21, and HY5 were downregulated from 18 h to 24 h, while other genes’ expression levels were upregulated with warm treatment.
It takes substantial energy for flower buds to proceed from endodormancy to bloom, and we also found DEGs that were significantly enriched in the metabolic pathway during the process of dormancy release. The TCA cycle, also known as the citric acid cycle, is the final metabolic pathway of three classes of biological macromolecules (carbohydrates, lipids, and amino acids), as well as the metabolic hub and connection for sugars, lipids, and amino acids. Accordingly, we focused on genes involved in the TCA cycle to validate their roles in blueberry flower bud dormancy release. We selected six representative genes for analysis (Supplementary Table S6). As shown in Figure 5b, from Nov. 19 to Dec. 8, nearly all genes related to the TCA cycle pathway appeared to be upregulated, indicating that the metabolism of energy was active during the process of endodormancy release. There was only one DEG (citrate synthase gene: VaccDscaff11-augustus-gene-378.31) related TCA pathway in the comparison of Dec. 29 vs. Dec. 8, indicating that the expression levels of TCA-pathway-related genes in the ecodormant stage were similar to those during endodormancy release. The expression levels of pckA, IDH3, SDHA, and DLAT were upregulated during the process of ecodormancy release, which lasted from Dec. 29 until warm treatment for 24 h.

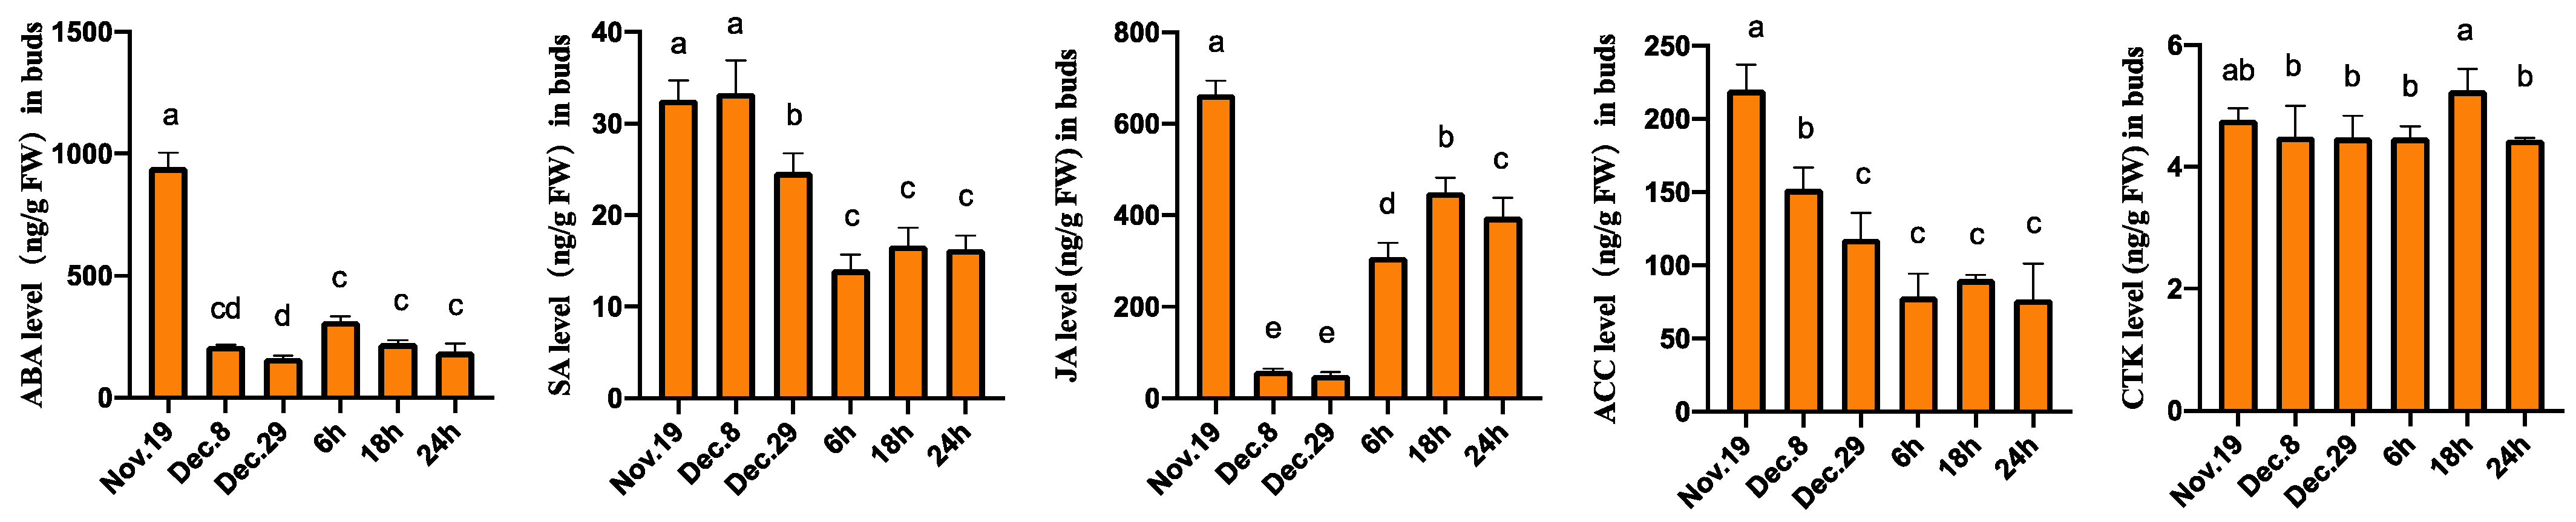
3.7. Changes in Hormone Levels during the Dormancy Release of Flower Buds

Hormone levels were measured during flower bud dormancy release, as shown in Figure 6. ABA levels were higher during the endodormant stage but decreased rapidly with the accumulation of low temperatures. On 8 December, the level of ABA in flower buds decreased significantly and was only one-quarter of that in the previous stage. With the continuous accumulation of low temperatures, the ABA level on 29 December (ecodormant stage) decreased slightly compared with that on 8 December, but there was no significant difference. The change in the JA level was similar to that in the ABA level, which decreased significantly upon endodormancy release, but JA levels increased during ecodormancy release. Although the gaseous hormone ethylene has a simple structure, it plays an important role in plant growth, development, and stress responses, and has been the focus of recent research. ACC is a precursor to ethylene synthesis and is used to reflect the change in ethylene content. Within the flower bud endodormancy release process, the ACC level decreased; however, unlike the lower levels of ABA and JA, the level of ACC was consistently lower with low temperature accumulation, and all three stages had significant differences, demonstrating that when flower bud endodormancy was released to ecodormancy, ethylene was still involved in metabolism and gene regulation. The level of SA did not change significantly during the process of endodormancy release but decreased from ecodormancy to flowering. CTK levels did not change significantly during the process of endodormancy but increased at 18 h in the process of ecodormancy release.

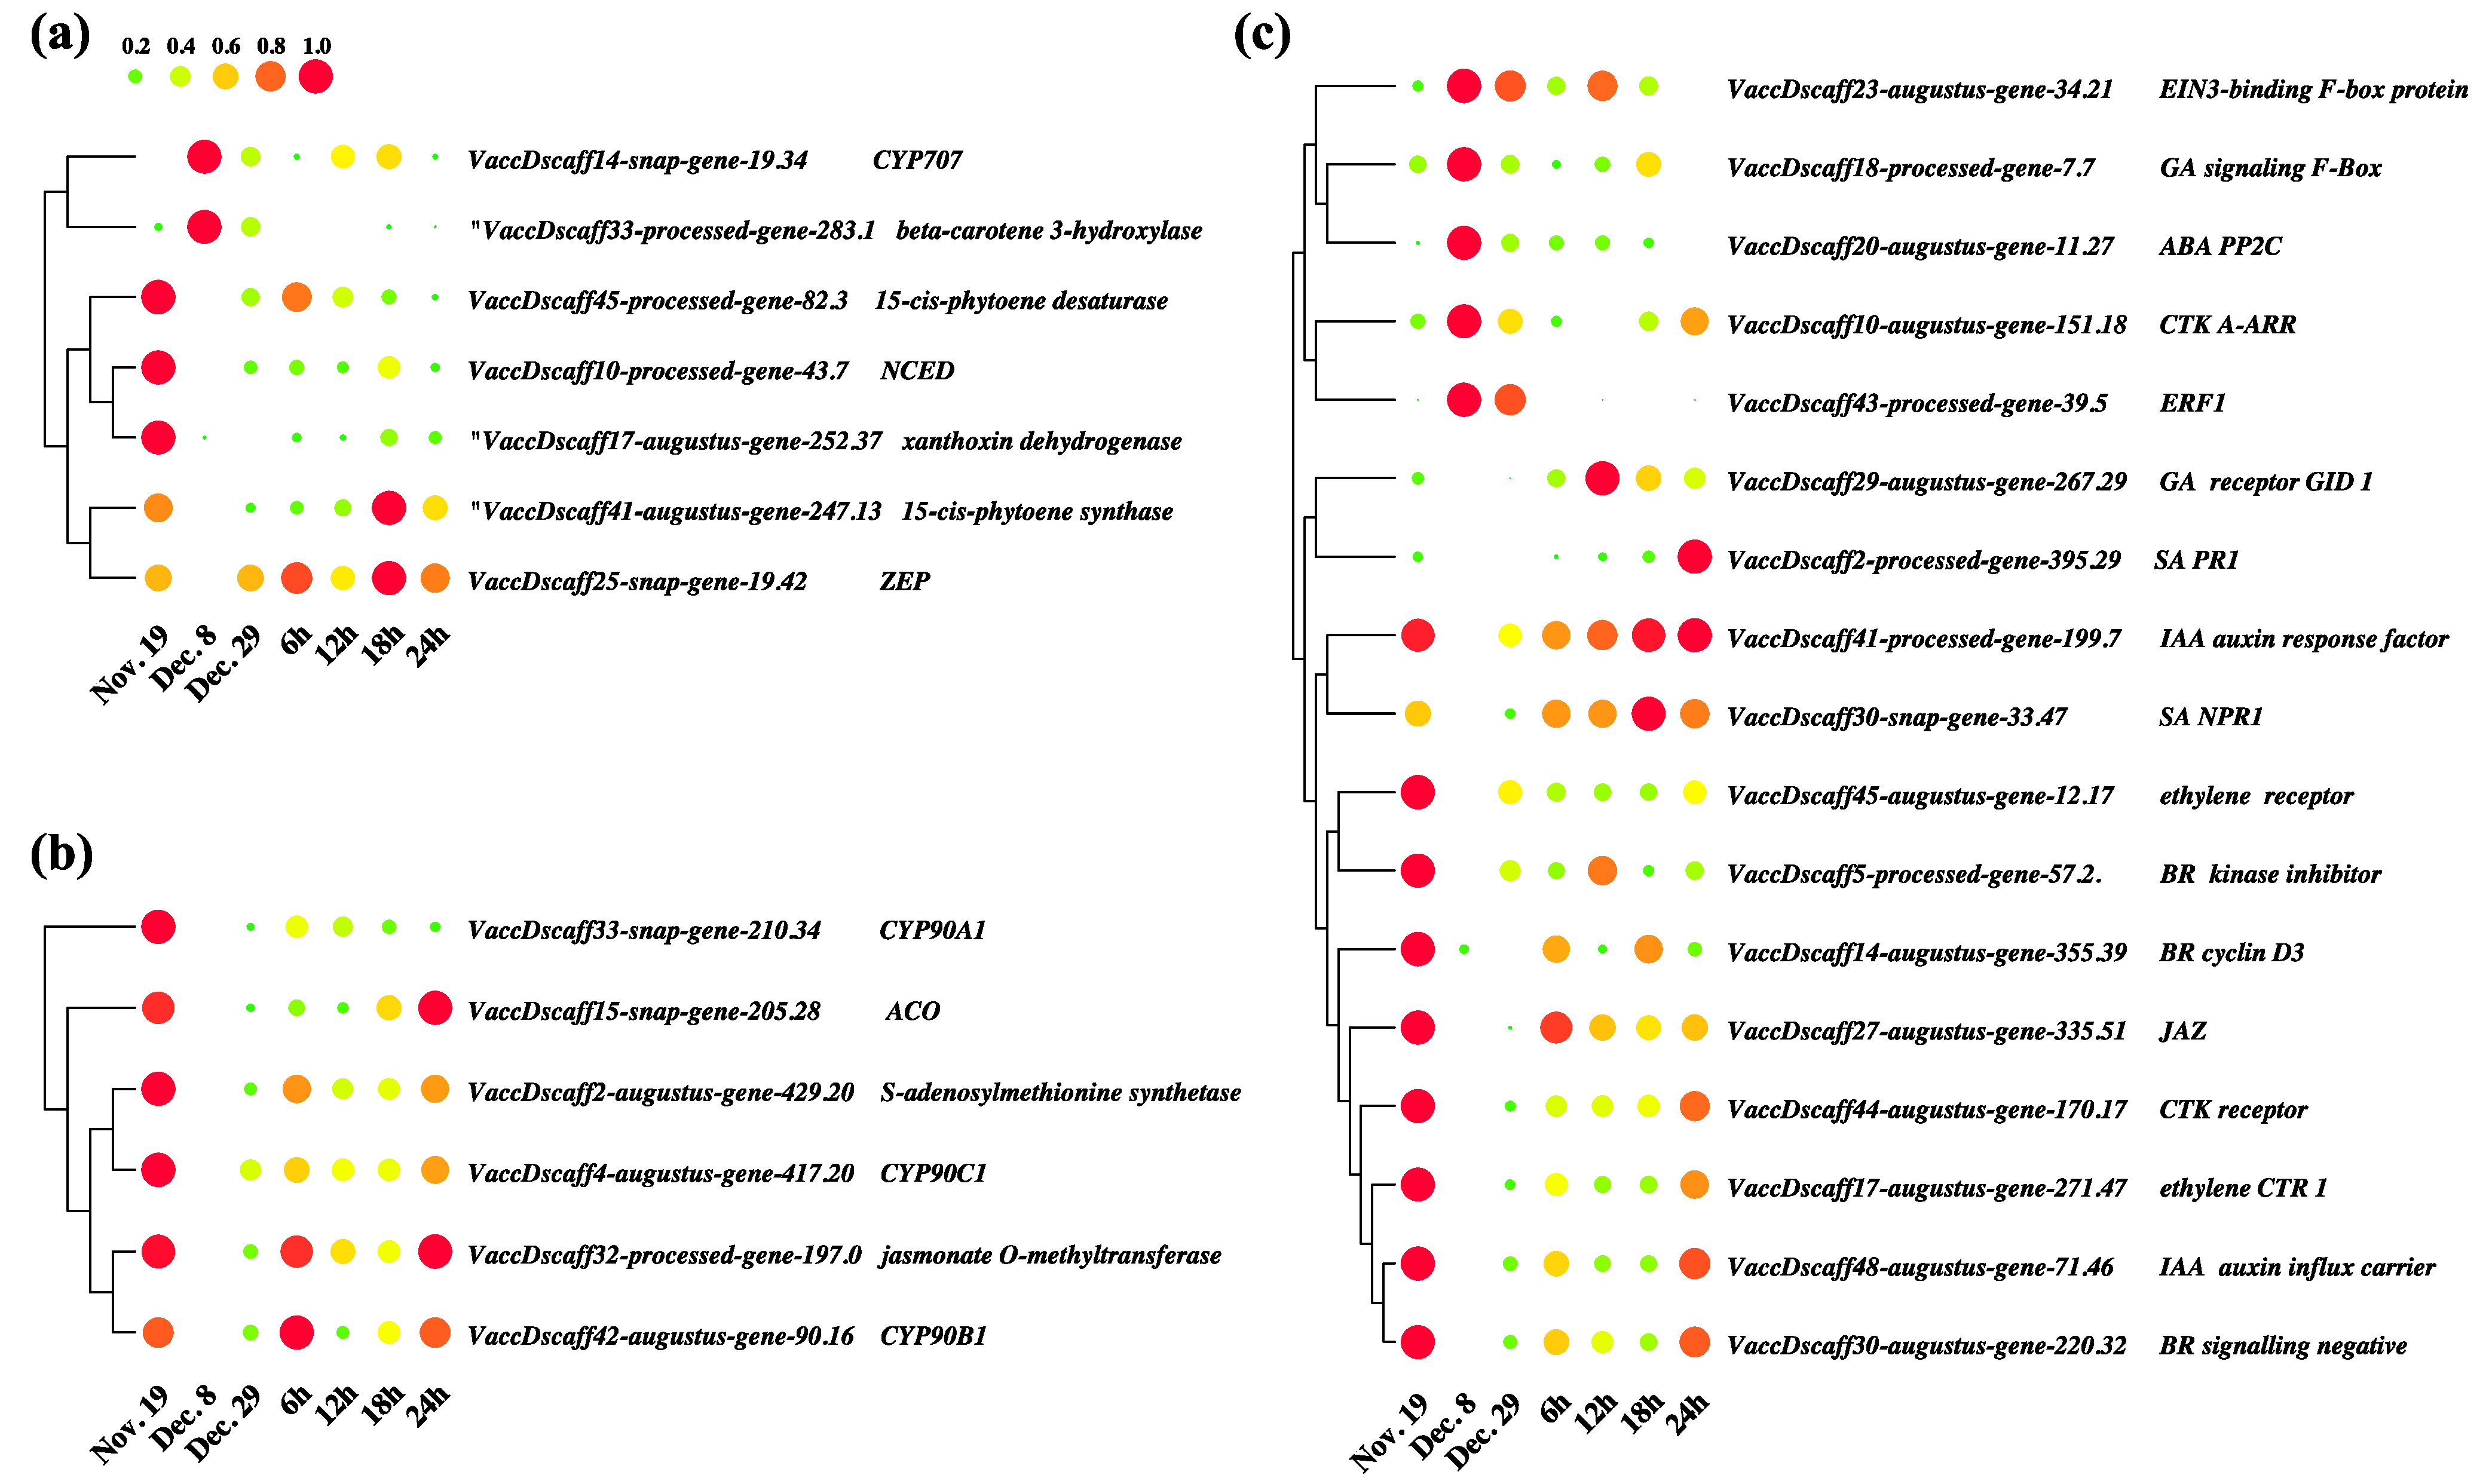
3.8. Key Differentially Expressed Genes in Hormone Anabolism and Signal Transduction Pathways

Due to significant changes in hormone contents (Figure 6), some DEGs in hormone anabolism and signal transduction pathways were significantly enriched during the process of dormancy release. We investigated genes involved in the hormone anabolism and signal transduction to validate their expression patterns in blueberry flower bud dormancy release. The carotenoid biosynthesis pathway plays an important role in plant growth and development and is directly involved in the biosynthesis of abscisic acid. A total of 31 DEGs of this pathway were found in the comparison of Dec. 8 vs. Nov. 19, among which 18 genes were upregulated and 13 genes were downregulated (Supplementary Table S7). We selected seven representative genes of them and showed their expressions in the dormancy release. For example, ABA biosynthetic genes such as 15-Cis-phytoene synthase (VaccDscaff41-augustus-gene-247.13), 15-cis-phytoene desaturase (Vaccdscaff45-processed-gene-82.3), and NCED (Vaccdscaff10-processed gene-43.7), as shown in Figure 7a: the expression levels of both genes were significantly downregulated during endodormancy release. In contrast, the expression level of the ABA-degrading enzyme gene CYP707A (Vaccdscaff14-snap-gene-19.34) was significantly increased during the same process. Transcriptome data showed that there were only three DEGs of the pathway in Dec. 29 vs. Dec. 8; among them, the beta-carotene 3-hydroxylase gene (Vaccdscaff33-processed-gene-283.1) was downregulated while the zeaxanthin cyclase gene (VaccDscaff25-snap-gene-19.42) was upregulated. In the process of ecodormancy release, some of the ABA biosynthetic genes were upregulated, but the specific functions of these genes in the process remain to be studied.
Figure 7b shows the expressions of selected DEGs involved in ethylene, JA, brassinolide (BR) biosynthesis. ACS is a key enzyme for ACC synthesis, and its gene Vaccdscaff2-augustus-gene-429.20 was downregulated in Dec. 8 vs. Nov. 19. ACC oxidase (ACO) (Vaccdscaff15-snap-gene-205.28), which is a key enzyme in ethylene biosynthesis, is involved in the conversion of ACC to ethylene, and the expression level of ACO was also significantly decreased in Dec. 8 vs. Nov. 19. The genes involved in the precursor and final synthesis of ethylene were downregulated in the process of chilling accumulation, which was consistent with the results of ACC content levels described in Section 3.7. CYP90 is a BR synthesis gene. In Dec. 8 vs. Nov. 19, the CYP90 family genes Vaccdscaff33-snap-gene-210.34, Vaccdscaff46-augustus-gene-90.16, and Vaccdscaff4-augustus-gene-417.20 were all downregulated (Figure 7b). Jasmonate O-methyltransferase is a key gene for JA synthesis; with the chilling accumulation, the expression of Vaccdscaff32-processed-gene-197.0 was significantly downregulated. After entering ecodormancy, the expression levels of the above genes increased with warming accumulation, which was consistent with the changes in the measured hormone contents.
There were 184 DEGs in the plant hormone signal transduction pathway (Supplementary Table S8), covering the signal transduction of auxin, gibberellin, ABA, ethylene, brassinolide, JA, and SA. In ABA signal transduction, PP2C protein phosphatase is a serine/threonine residue protein phosphatase that negatively regulates the ABA signal transduction pathway. In Dec. 8 vs. Nov. 19, the expression of P2CC: Vaccdscaff20-augustus-gene-11.27 was significantly upregulated, indicating not only that the ABA level was decreased, but also that the signal transduction pathway was inhibited during the endodormancy release of flower buds. In ethylene signal transduction, the Dec. 8 vs. Nov. 19 comparison showed that ETR(Vaccdscaff45-augustus-gene-12.17), CTR1(VaccDscaff17-augustus-gene-271.47), and MPK6(Vaccdscaff36-augustus-gene-293.29), which are upstream of ethylene signal transduction, were all downregulated; however, the downstream genes EBF1/2(Vaccdscaff23-augustus-gene-34.21), EIN3-bingding F-box protein (VaccDscaff23-augustus-gene-34.21), and ERF1 (Vaccdscaff43-processed gene-39.5) were all upregulated.

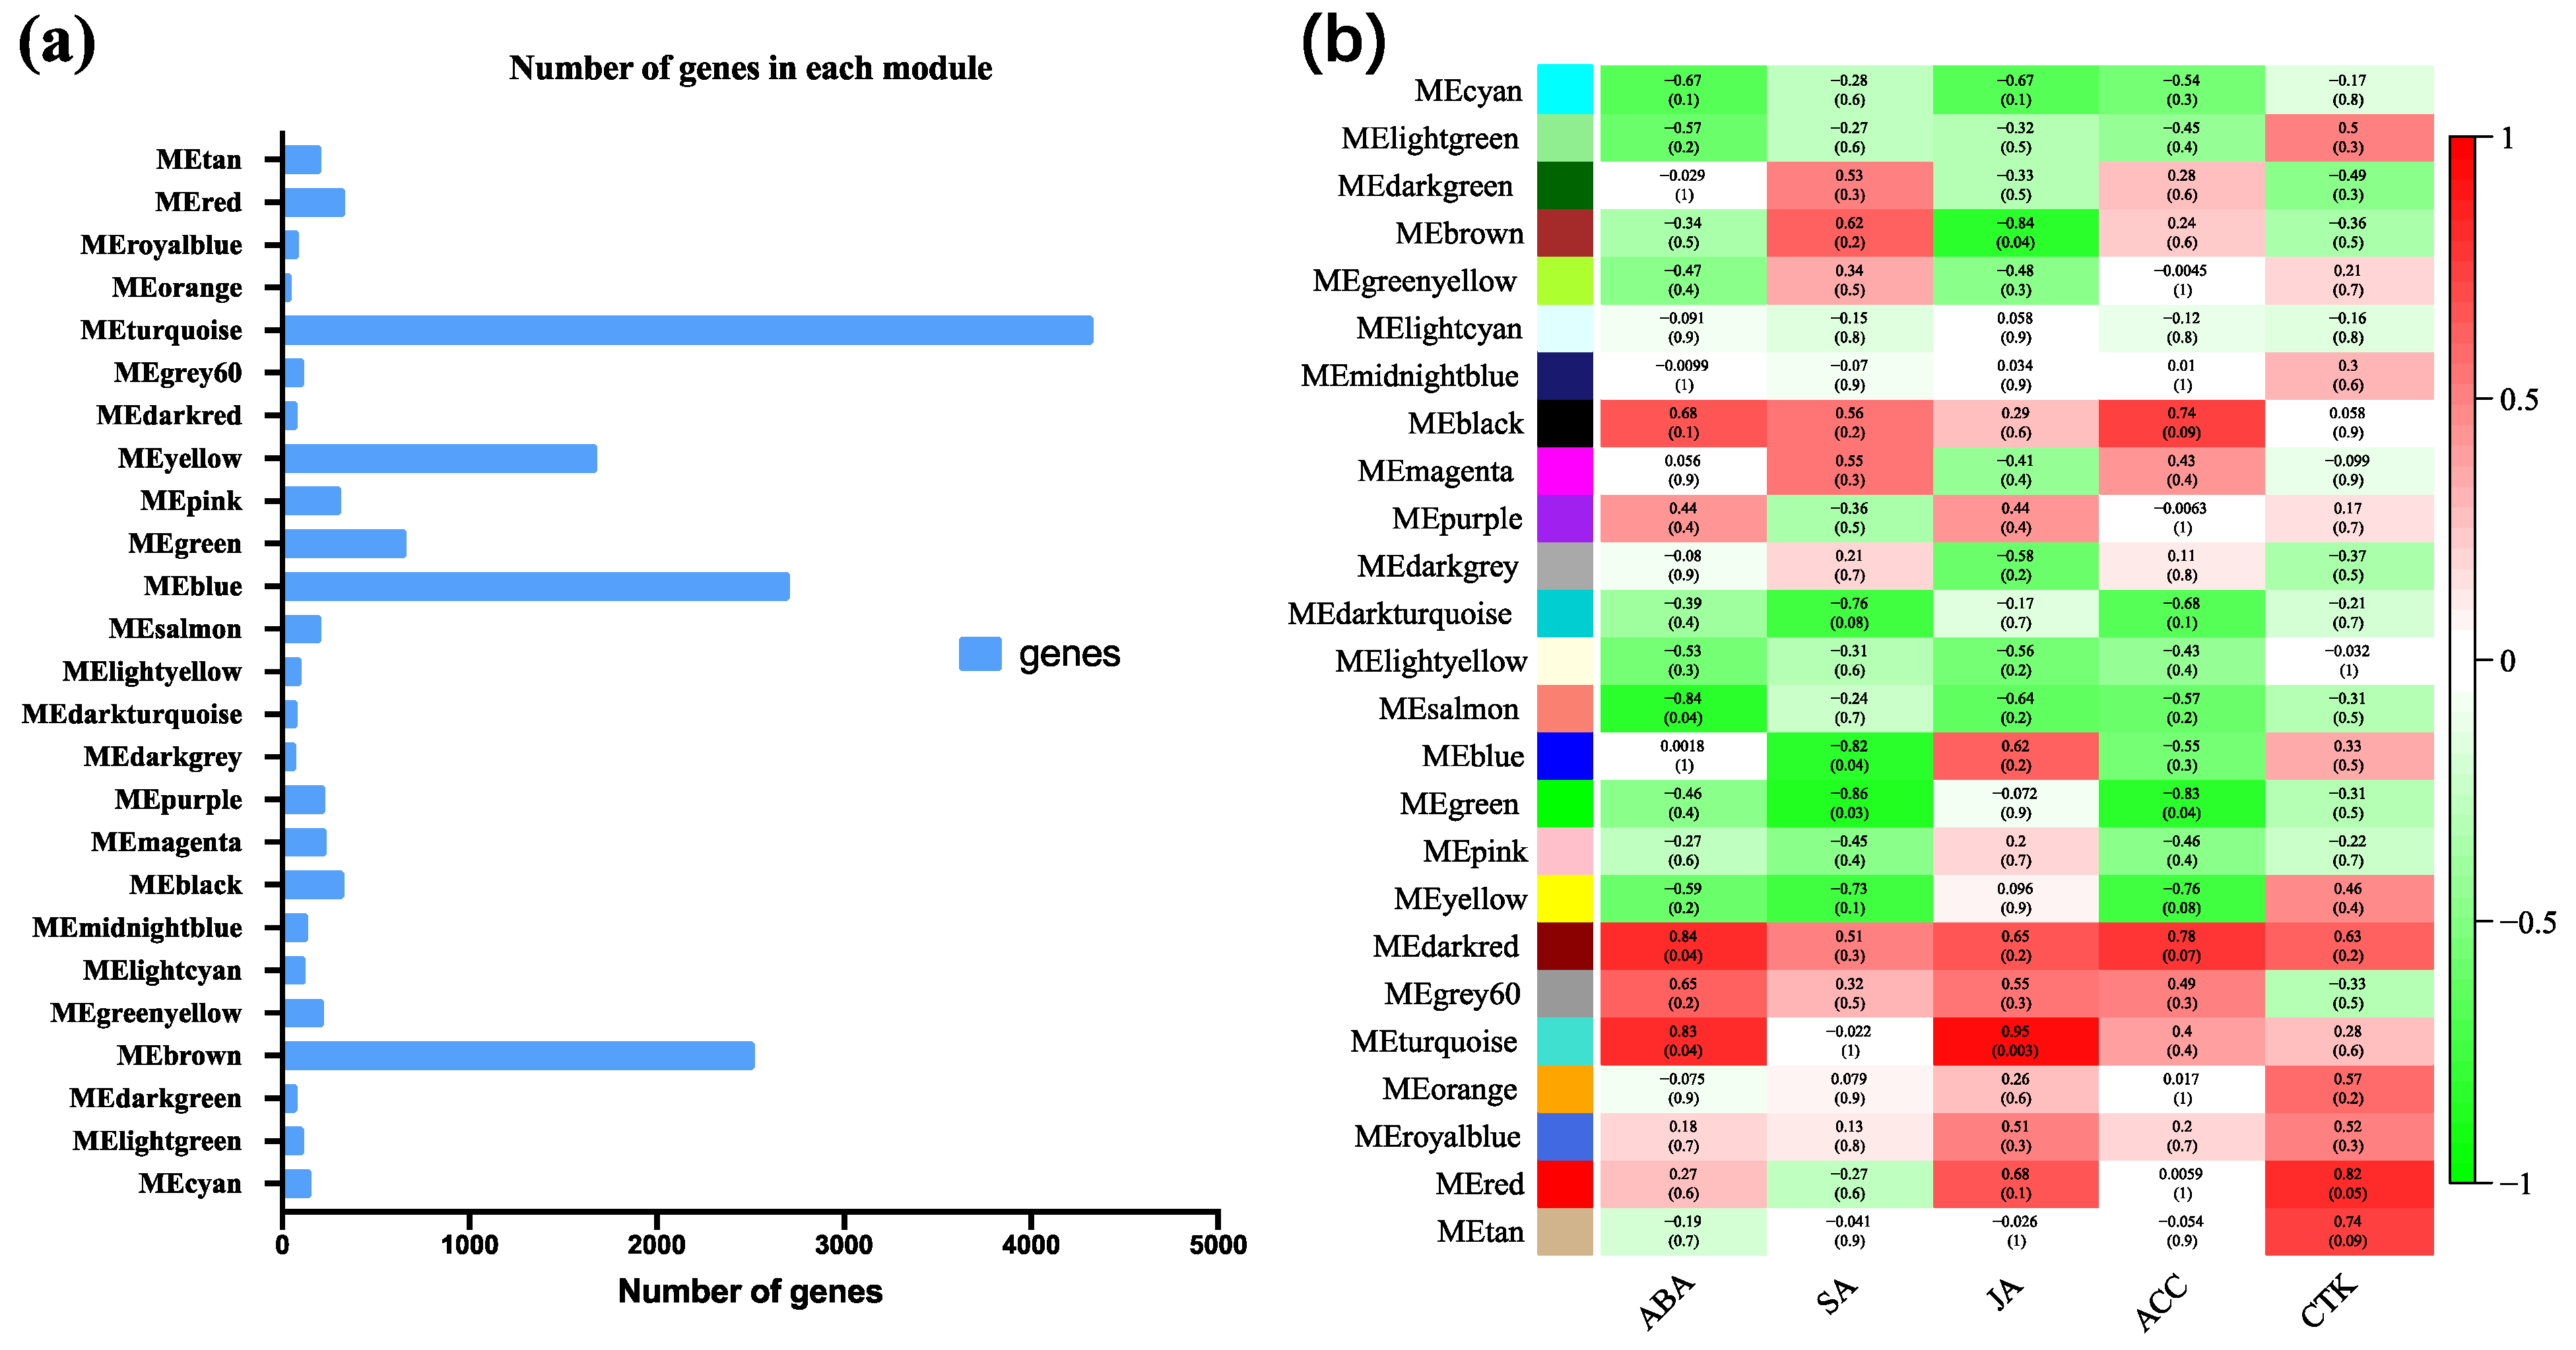
3.9. Coexpression Analysis Identified Hormone-Related Genes in Dormancy Release

Through coexpression clustering, we were able to better understand the effect of gene expression modules on the change in hormone contents during the process of dormancy release. The expression matrix was 98,994 rows and six columns. Because there were too many genes, and the expression levels of most genes were very low and their effects on the phenotype were minimal, we extracted genes with an FPKM average of more than 10 for subsequent analysis. The final total was 15,201 genes. When the β value was 12, the gene relationship network was closest to the scale-free distribution (Supplementary Figure S1).
After multiple parameter adjustments, 25 effective coexpression modules were obtained by clustering (Supplementary Figure S2). As shown in Figure 8a, the number of genes in the modules ranged from 50 (MEorange) to 4333 (MEturquoise). According to the correlation value (Figure 8b), we determined that MEdarkred (82 genes) was the most positively correlated with ABA, and MEsalmon (207 genes) was the most negatively correlated with ABA. MEBrown (2521 genes) had a positive correlation with SA content change, while MEgreen (663 genes) had the highest negative correlation. MEturquoise (4333 genes) was positively correlated with the change in JA content, and its correlation coefficient reached 0.95, which was the highest among all the module factors. The change in the ACC content was similar to that of ABA, and the highest correlation module was also the same; both of these were MEdarkred. From these results, it is suggested that ethylene and ABA may have a synergistic effect in the process of dormancy release.
The transcript levels of genes in MEdarkred were shown in Figure S3. According to expression patterns, the genes can be classified into two classes. The expression patterns of the class I genes were more similar to the changes of ABA and ACC contents; interestingly, almost all transcription factors were clustered in this class. Table 2 lists the GO classification and KEGG annotation information for transcription factors in MEdarkred, including ethylene response factor 12 (ERF12): VaccdScaff33-process-gene-241.9, elongation factor G-2: Vaccdscaff43-augustus-gene-228.38, ABC transporter F family member 1 ISOFORM X1: Vaccdscaff-augustus-gene-87.38, and homeobox-leucine zipper protein REVOLUTA: Vaccdscaff47-augustus-gene-75.30. These genes were highly correlated with the changes in ABA and ACC contents and were also associated with ethylene and ABA signal transduction based on KEGG annotation.

3.10. RT-qPCR Verification

To verify the accuracy of the transcriptome analysis results, 15 DEGs were randomly selected for RT–qPCR analysis (Supplementary Figure S4). Although few genes differed at different sampling points, the expression patterns of these 15 DEGs were basically consistent between the RT–qPCR and RNA-seq results, indicating that the expression data estimated by RNA-seq were reliable.

4. Discussion

Although the transcriptomes of flower buds in endo- and ecodormancy have been widely reported in other species [40,41,42], few studies have been conducted on the process of floral bud break. Recently, in tea [22] and grape [42], transcriptome studies were performed on different states of flower buds from dormancy to bloom, covering paradormancy, endodormancy, ecodormancy, and bud break with flower buds sampled by month, reflecting the gene expression of different states of buds. Due to the lack of detailed sampling at key dormancy breaking times, the detailed process of gene expression regulation by temperature during bud dormancy release cannot be determined. In this study, samples of flower buds from endodormancy to flowering included two processes: endodormancy release under chilling accumulation and ecodormancy release under warming accumulation. A total of 21 libraries were constructed for RNA-seq analysis, and the ratio of clean reads to the reference genome sequence was 72.04%~79.71%. A total of 12,350 DEGs were found in the different libraries. A large number of transcripts produced in the study were attributed to the deep RNA sequencing of blueberry.
The results showed that the bud break percentage of samples collected on 8 December exceeded 50% first, which was the critical moment for endodormancy release. The number of DEGs in Dec. 8 vs. Nov. 19 reached 8733, which was the largest number of genes among all library comparisons. The comparison between the ecodormancy state and the endodormancy transition stage (Dec. 29 vs. Dec. 8) showed that 538 genes were differentially expressed. During the process of ecodormancy release, there were 5431 DEGs in the initial 6 h of warm treatment and 750 DEGs in 12 h vs. 6 h. However, the number of DEGs did not exceed 700 in the subsequent comparisons. The change trends for the DEGs in the above process are similar to those described in previous reports [6,8]. The metabolism of starch and sucrose and the signal transduction of plant hormones were also enriched. The former regulates plant energy metabolism and the latter regulates endogenous hormone synthesis. These metabolic pathways interact to form a complex dormancy regulatory network [43].
The circadian rhythm is an important regulatory mechanism by which perennial plants adapt to seasonal cyclical changes. Plants regulate the synthesis of hormones, proteins, and sugars related to dormancy by regulating the expression of a series of genes, such as TOC1, PRR, and LHY, and sense the correct time to enter and break dormancy in order to adapt to seasonal and environmental changes. Therefore, it can be understood that a certain diurnal duration and chilling accumulation are necessary for the induction and release of plant dormancy [44]. In the transition from bud endodormancy to ecodormancy, light signal-transduction- and circadian-rhythm-related genes were differentially expressed. In this study, genes related to PHYA, FT, COP1, LHY, ELF3, and CO were enriched during dormancy release. These genes are a major component of the circadian rhythm. The roles of the CO/FT module in flowering regulation have been well described [45]. Recent studies have found that the CO/FT module has multiple roles in the regulation of flowering and dormancy of perennial plants [46,47]. CO can directly interact with DELLA and the histone marker reader MRG1/2 to regulate the expression of FT [48]. In this study, the expression of CO was significantly downregulated during endodormancy release, and the expression of FT was significantly upregulated upon the same process, which suggests that the CO/FT module plays an important role in the dormancy release of blueberries. During the dormancy release, floral buds require significant carbon and energy metabolism to resist the chilling winter conditions [49]. The expression levels of pckA, IDH3, SDHA, and DLAT were upregulated during the process of endo- and ecodormancy release, indicating that expressions of these genes are important for energy metabolism in order to synthesize various compounds for bloom [50].
ABA is considered to be a plant hormone that controls dormancy in woody plants [51]. When perennial plants enter the endodormant stage, the increase of ABA activates downstream transcription factors which activate the plant’s response to cold stress, making the dormant plants resistant to low temperatures [52]. In pear, the ABA content increased during endodormancy maintenance and decreased during endodormancy release [53], and the results of ABA content change in the present study are in accordance with their findings. In recent years, many genes and signaling pathways activated in response to cold stress have been revealed by transcriptomic analysis. For example, the ICE-CBF-COR signaling pathway is activated by cold resistance [54]. Puig et al. [55] studied the transcriptome changes in peach and revealed that auxin signal transduction may play a role in cold sensitivity and tolerance. RNA-seq analyses of apple plants grown under drought, cold, or acute high-salinity stress revealed five common DEGs involved in multiple pathways and improved comprehensive resistance to stress. Among these are PP2C and ABI5 family members related to ABA signaling [56]. In this study, we found that the expression levels of VcNCED and VcCYP707A were significantly decreased and increased, respectively, during the process of endodormancy release. The results were consistent with previous research in pear [53]. In some SHB cultivars with low CR, fluctuating warm and cold spells in winter can cause flowers to suffer frost damage. Our previous research-based transcriptome indicated that the exogenous application of ABA could promote the transition of blueberry (“Emerald”) flower buds into a deep endodormant state through regulation of the expression of flower bud dormancy-related genes and inhibition of blueberry early flowering [57]. Similar observations have been made in pear [16]. Experiments have proven that exogenous application of ABA can prolong bud dormancy in response to climate change.
JA is a universal phytohormone that plays a key role in stress defense as well as seed germination, plant growth, abscission, and senescence [58]. In recent years, the involvement and regulation of JA in bud dormancy has attracted much attention [22,59]. The present results showed that the contents of JA in blueberry flower buds decreased with the dormancy release; jasmonate O-methyltransferase (Vaccdscaff32-processed-gene-197.0) is a key gene that is critical for JA synthesis. The expression levels of the gene were consistent with the changes in JA content. It retained low expression levels during the process of dormancy release and was upregulated from ecodormancy to bloom; these results are similar to those of previous research [42]. It has been speculated that JA may play an important role in the process of dormancy release. Ethylene is known to interact with ABA and play a central role in various developmental, stress responses, and seed germination in plants [60,61]. Our experimental results showed that the contents of ABA and ACC decreased in the process of dormancy release in blueberry flower buds, and we found changes in ERF12, which is a hormone-related gene, through WGCNA. Changes in expression level of the gene were the most positively correlated with ABA and ACC, similarly to the transcriptome studies of tea. The evidence showed that ERFs were downregulated during endodormancy release [22]. Light, ethylene, and abscisic acid signal transduction pathways consecutively control bud development by setting, modifying, or terminating these processes [41]. ERFs are important transcription factors in ethylene signal transduction, as they regulate downstream genes to complete the ethylene response. Therefore, the relationship and roles of ERF, ABA, and ethylene in bud dormancy induction and release need further study.
This study provides a better understanding of the transcriptomic changes that occur from bud endodormancy to flowering. Our analyses using transcriptomic profiles and WGCNA identified modules and candidate genes associated with hormone changes and dormancy release; however, it remains unclear whether the candidate genes may interact with other genes in the same pathway in additive and epistatic ways, which could lead to gene expression profiles’ linkage disequilibrium. Further studies are required to confirm this. Moreover, key genes controlling dormancy-related traits need to be predicted and examined further for molecular breeding. Expression genome-wide association studies (eGWAS), genomic prediction (GP), and machine learning (ML) and transgenic experiments have been widely used in investigations of forest trees [62,63]. Expression mapping via eGWAS and genomic prediction of expression profiles are the subjects of our future works. These integrative approaches will be extremely useful for a better comprehension of complex phenological processes in many species.

5. Perspective

Floral bud endodormancy in deciduous fruit trees is an essential process, and it is a biological characteristic of higher plants adapted to seasonal environmental changes through long-term natural selection [64]. SHB is a cultivar group that is better adapted to warm climates than the original northern highbush blueberry (NHB) [65]. The interspecific hybridization and nutrient culture of Vaccinium species have played a major role in blueberry cultivation at low latitudes [66,67,68]. Breeding low-CR varieties is the main goal of SHB breeding. Although many new blueberry varieties with low CR have been bred, their adaptability to the environment is not ideal, especially in the context of global climate change, and early flowering in winter and frost damage often occur. It is imperative to study the mechanism of CR and use it to cultivate more suitable varieties to manipulate chilling requirements and develop improved freezing-tolerant cultivars that can be considered to be long-term solutions. Chilling requirements are a complex quantitative trait. Although recent QTL analyses have provided useful information, the detailed genetic basis of CR traits remains obscure. The mechanisms underlying the formation of CR traits in floral buds need further study using newer genetic approaches such as gene editing, genome-wide association studies, and genome-wide environmental association studies [69]. Identification of the key candidate genes in the dormancy release transcriptome maybe used in genetic breeding efforts to generate new blueberry cultivars with different chilling requirements which can adapt to lower latitudes.

6. Conclusions

Dormancy is an important part of the fruit tree life cycle, and sufficient chilling accumulation is needed to trigger the release of dormancy. In this study, RNA-seq and RT–qPCR were used to systematically study the dormancy release process of blueberry flower buds. By comparing the transcripts of seven dormancy stages, we found some possible pathways related to dormancy release, such as circadian rhythm, plant hormone signal transduction, and so on, which are closely related to the dormancy release process. By measuring the changes in hormone content in the process of dormancy release, WGCNA was used to obtain the genes related to these changes in hormone contents. The results of this study have important reference value for elucidating the molecular mechanisms of dormancy release in blueberry flower buds. The hormone-related gene modules mined through WGCNA will reveal the mechanisms of the hormones involved in the regulation of bud dormancy release.

Supplementary Materials

The following supporting information can be downloaded at: https://www.mdpi.com/article/10.3390/horticulturae8020176/s1, Additional file 1: Table S1: qRT-PCR primer sequences. Table S2: FPKM values of all genes. Table S3: GO analysis data of each comparison. Table S4: KEGG analysis data of each comparison. Table S5: DEGs in Circadian rhythm-plant. Table S6: DEGs in Citrate cycle (TCA cycle). Table S7: DEGs in Carotenoid biosynthesis. Table S8: DEGs in Plant hormone signal transduction. Additional file 2: Figure S1: Determination of soft threshold. The abscissa represents the soft threshold (β). (a) Ordinate corresponds to the index of the scale free network model; (b) The average link degree of each soft threshold. Figure S2: Gene cluster dendrograms and module relationships. (a) Clustering of genes based on the topological overlap. (b) Correlation analysis among 25 modules. Figure S3: RNA-seq validated by RT–qPCR. The histogram and the primary vertical axis show the relative expression values from RT–qPCR, and the line chart and the secondary vertical axis show the FPKM value from RNA-seq. Figure S4: Analysis of changes in the expression levels of genes in MEdarkred. Each column represents different sampling points, and each row represents a gene. The mean expression values were calculated using zero to one. Genes and expression patterns were hierarchically clustered based on the average Pearson’s metric. Red indicates high expression, and green indicates low expression.

Author Contributions

Conceptualization, Y.L.; Data curation, Q.Z. and F.L.; Formal analysis, R.L.; Funding acquisition, Y.L. and W.G.; Investigation, Z.Z. and Y.Z. (Yu Zong); Methodology, L.Y. (Linbo Yao), L.Y. (Li Yang) and Y.Z. (Youyin Zhu); Project administration, Y.L.; Resources, W.G.; Software, Y.L.; Supervision, W.C.; Visualization, Y.L.; Writing—original draft, Y.L.; Writing—review & editing, Y.L. and R.M. All authors have read and agreed to the published version of the manuscript.

Funding

This research was funded by Zhejiang Public Welfare Technology Application Research Project (LGN21C150011), and the Project of the Major Program for Science and Technology of Zhejiang Province (2021C02066-9).

Institutional Review Board Statement

Not applicable.

Informed Consent Statement

Not applicable.

Data Availability Statement

In this study, all materials were obtained from Zhejiang Normal University (Jinhua, Zhejiang Province, China), and the samples collection were complied with relevant institutional, national, and international guidelines and legislation. The raw transcriptomic data can be accessed from the NCBI Sequence Read Archive (SRA) platform (http://www.ncbi.nlm.nih.gov/sra/ (accessed on 28 December 2021)) under accession numbers SRR16017035, SRR16017046, SRR16017047 (Nov.19); SRR16017031, SRR16017032, SRR16017033 (Dec.8); SRR16017028, SRR16017029, SRR16017030 (Dec.29); SRR16017027, SRR16017044, SRR16017045 (6 h); SRR16017041, SRR16017042, SRR16017043 (12 h); SRR16017038, SRR16017039, SRR16017040 (18 h), and SRR16017034, SRR16017036, SRR16017037 (24 h).

Conflicts of Interest

The authors declare that they have no competing interest.

References

  1. Lang, G.A.; Early, J.D.; Martin, G.C.; Darnell, R.L. Endo-, Para-, and Ecodormancy: Physiological Terminology and Classification for Dormancy Research. Hortscience 1987, 22, 271–277. [Google Scholar]
  2. Cline, M.G.; Deppong, D.O. The Role of Apical Dominance in Paradormancy of Temperate Woody Plants: A Reappraisal. J. Plant Physiol. 1999, 155, 350–356. [Google Scholar] [CrossRef]
  3. Qin, Z.; Bai, Y.; Muhammad, S.; Wu, X.; Deng, P.; Wu, J.; An, H.; Wu, L. Divergent roles of FT-like 9 in flowering transition under different day lengths in Brachypodium distachyon. Nat. Commun. 2019, 10, 812. [Google Scholar] [CrossRef] [Green Version]
  4. Zhuang, W.; Gao, Z.; Wang, L.; Zhong, W.; Ni, Z.; Zhang, Z. Comparative proteomic and transcriptomic approaches to address the active role of GA4 in Japanese apricot flower bud dormancy release. J. Exp. Bot. 2013, 64, 4953–4966. [Google Scholar] [CrossRef]
  5. Liu, Y.; Ye, N.; Liu, R.; Chen, M.; Zhang, J. H2O2 mediates the regulation of ABA catabolism and GA biosynthesis in Arabidopsis seed dormancy and germination. J. Exp. Bot. 2010, 61, 2979–2990. [Google Scholar] [CrossRef] [PubMed] [Green Version]
  6. Liu, G.; Li, W.; Zheng, P.; Xu, T.; Chen, L.; Liu, D.; Hussain, S.; Teng, Y. Transcriptomic analysis of ‘Suli’ pear (Pyrus pyrifolia white pear group) buds during the dormancy by RNA-Seq. BMC Genom. 2012, 13, 700. [Google Scholar] [CrossRef] [PubMed] [Green Version]
  7. Gao, Y.; Yang, Q.; Yan, X.; Wu, X.; Yang, F.; Li, J.; Wei, J.; Ni, J.; Ahmad, M.; Bai, S.; et al. High-quality genome assembly of ‘Cuiguan’ pear (Pyrus pyrifolia) as a reference genome for identifying regulatory genes and epigenetic modifications responsible for bud dormancy. Hortic. Res. 2021, 8, 197. [Google Scholar] [CrossRef]
  8. Zhu, Y.; Li, Y.; Xin, D.; Chen, W.; Shao, X.; Wang, Y.; Guo, W. RNA-Seq-based transcriptome analysis of dormant flower buds of Chinese cherry (Prunus pseudocerasus). Gene 2015, 555, 362–376. [Google Scholar] [CrossRef]
  9. Ionescu, I.A.; López-Ortega, G.; Burow, M.; Bayo-Canha, A.; Junge, A.; Gericke, O.; Møller, B.L.; Sánchez-Pérez, R. Transcriptome and Metabolite Changes during Hydrogen Cyanamide-Induced Floral Bud Break in Sweet Cherry. Front. Plant Sci. 2017, 8, 1233. [Google Scholar] [CrossRef]
  10. Yu, J.; Conrad, A.O.; Decroocq, V.; Zhebentyayeva, T.; Williams, D.E.; Bennett, D.; Roch, G.; Audergon, J.-M.; Dardick, C.; Liu, Z.; et al. Distinctive Gene Expression Patterns Define Endodormancy to Ecodormancy Transition in Apricot and Peach. Front. Plant Sci. 2020, 11, 180. [Google Scholar] [CrossRef] [Green Version]
  11. Khalil-Ur-Rehman, M.; Sun, L.; Li, C.-X.; Faheem, M.; Wang, W.; Tao, J.-M. Comparative RNA-seq based transcriptomic analysis of bud dormancy in grape. BMC Plant Biol. 2017, 17, 18. [Google Scholar] [CrossRef] [PubMed] [Green Version]
  12. Min, Z.; Zhao, X.; Li, R.; Yang, B.; Liu, M.; Fang, Y. Comparative transcriptome analysis provides insight into differentially expressed genes related to bud dormancy in grapevine (Vitis vinifera). Sci. Hortic. 2017, 225, 213–220. [Google Scholar] [CrossRef]
  13. Zhang, H.; Li, H.; Lai, B.; Xia, H.; Wang, H.; Huang, X. Morphological Characterization and Gene Expression Profiling during Bud Development in a Tropical Perennial, Litchi chinensis Sonn. Front. Plant Sci. 2016, 7, 1517. [Google Scholar] [CrossRef] [PubMed] [Green Version]
  14. Niu, Q.; Li, J.; Cai, D.; Qian, M.; Jia, H.; Bai, S.; Hussain, S.; Liu, G.; Teng, Y.; Zheng, X. Dormancy-associated MADS-box genes and microRNAs jointly control dormancy transition in pear (Pyrus pyrifoliawhite pear group) flower bud. J. Exp. Bot. 2016, 67, 239–257. [Google Scholar] [CrossRef] [PubMed] [Green Version]
  15. Saito, T.; Bai, S.; Imai, T.; Ito, A.; Nakajima, I.; Moriguchi, T. Histone modification and signalling cascade of thedormancy-associated MADS-boxgene, PpMADS13-1, in Japanese pear (Pyrus pyrifolia) during endodormancy. Plant Cell Environ. 2014, 38, 1157–1166. [Google Scholar] [CrossRef]
  16. Yang, Q.; Yang, B.; Li, J.; Wang, Y.; Tao, R.; Yang, F.; Wu, X.; Yan, X.; Ahmad, M.; Shen, J.; et al. ABA-responsive ABRE-BINDING FACTOR3 activates DAM3 expression to promote bud dormancy in Asian pear. Plant Cell Environ. 2020, 43, 1360–1375. [Google Scholar] [CrossRef]
  17. Wang, Q.; Xu, G.; Zhao, X.; Zhang, Z.; Wang, X.; Liu, X.; Xiao, W.; Fu, X.; Chen, X.; Gao, D.; et al. Transcription factor TCP20 regulates peach bud endodormancy by inhibiting DAM5/DAM6 and interacting with ABF2. J. Exp. Bot. 2019, 71, 1585–1597. [Google Scholar] [CrossRef]
  18. Singh, R.; Maurya, J.P.; Azeez, A.; Miskolczi, P.; Tylewicz, S.; Stojkovič, K.; Delhomme, N.; Busov, V.; Bhalerao, R.P. A genetic network mediating the control of bud break in hybrid aspen. Nat. Commun. 2018, 9, 4173. [Google Scholar] [CrossRef] [Green Version]
  19. Lobos, G.A.; Hancock, J.F. Breeding blueberries for a changing global environment: A review. Front. Plant Sci. 2015, 6, 782. [Google Scholar] [CrossRef] [Green Version]
  20. Bigler, C.; Bugmann, H. Climate-induced shifts in leaf unfolding and frost risk of European trees and shrubs. Sci. Rep. 2018, 8, 9865. [Google Scholar] [CrossRef] [Green Version]
  21. Legave, J.-M.; Guédon, Y.; Malagi, G.; EL Yaacoubi, A.; Bonhomme, M. Differentiated Responses of Apple Tree Floral Phenology to Global Warming in Contrasting Climatic Regions. Front. Plant Sci. 2015, 6, 1054. [Google Scholar] [CrossRef] [PubMed] [Green Version]
  22. Hao, X.; Yang, Y.; Yue, C.; Wang, L.; Horvath, D.P.; Wang, X. Comprehensive Transcriptome Analyses Reveal Differential Gene Expression Profiles of Camellia sinensis Axillary Buds at Para-, Endo-, Ecodormancy, and Bud Flush Stages. Front. Plant Sci. 2017, 8, 553. [Google Scholar] [CrossRef] [PubMed] [Green Version]
  23. Richardson, E.A. A Model for Estimating the Completion of Rest for “Redhaven” and “Elberta” Peach Trees. HortScience 1974, 9, 331–332. [Google Scholar]
  24. Yooyongwech, S.; Sugaya, S.; Sekozawa, Y.; Gemma, H. Differential adaptation of high- and low-chill dormant peaches in winter through aquaporin gene expression and soluble sugar content. Plant Cell Rep. 2009, 28, 1709–1715. [Google Scholar] [CrossRef]
  25. Anders, S.; Pyl, P.T.; Huber, W. HTSeq—A Python framework to work with high-throughput sequencing data. Bioinformatics 2015, 31, 166–169. [Google Scholar] [CrossRef]
  26. Tarazona, S.; García, F.; Ferrer, A.; Dopazo, J.; Conesa, A. NOIseq: A RNA-seq differential expression method robust for sequencing depth biases. EMBnet. J. 2012, 17, 18. [Google Scholar] [CrossRef]
  27. Love, M.I.; Huber, W.; Anders, S. Moderated Estimation of Fold Change and Dispersion for RNA-Seq Data with DESeq2. Genome Biol. 2014, 15, 550. [Google Scholar] [CrossRef] [Green Version]
  28. Conesa, A.; Götz, S.; García-Gómez, J.M.; Terol, J.; Talón, M.; Robles, M. Blast2GO: A universal tool for annotation, visualization and analysis in functional genomics research. Bioinformatics 2005, 21, 3674–3676. [Google Scholar] [CrossRef] [PubMed] [Green Version]
  29. Aparicio, G.; Götz, S.; Conesa, A.; Segrelles, D.; Blanquer, I.; García, J.M.; Hernandez, V.; Robles, M.; Talon, M. Blast2GO goes grid: Developing a grid-enabled prototype for functional genomics analysis. Stud. Health Technol. Inf. 2006, 2006, 120. [Google Scholar]
  30. Minoru, K.; Michihiro, A.; Susumu, G.; Masahiro, H.; Mika, H.; Masumi, I.; Toshiaki, K.; Shuichi, K.; Shujiro, O.; Toshiaki, T. KEGG for Linking Genomes to Life and the Environment. Nucleic Acids Res. 2008, 36, 480–484. [Google Scholar]
  31. Ye, J.; Fang, L.; Zheng, H.; Zhang, Y.; Chen, J.; Zhang, Z.; Wang, J.; Li, S.; Li, R.; Bolund, L.; et al. WEGO: A web tool for plotting GO annotations. Nucleic Acids Res. 2006, 34, W293–W297. [Google Scholar] [CrossRef] [PubMed]
  32. Zhaoyun, C.; Youning, M.; Renxiang, M.; Shasha, Y.; Mingxue, C. Analysis of 17 Cytokinins in Rice by Solid Phase Extraction Purification and Liquid Chromatography-Tandem Mass Spectrometry. Chin. J. Chromatogr. 2015, 33, 715–721. [Google Scholar]
  33. Zhao, J.; Yu, N.; Ju, M.; Fan, B.; Zhang, Y.; Zhu, E.; Zhang, M.; Zhang, K. ABC transporter OsABCG18 controls the shootward transport of cytokinins and grain yield in rice. J. Exp. Bot. 2019, 70, 6277–6291. [Google Scholar] [CrossRef] [PubMed] [Green Version]
  34. Šimura, J.; Antoniadi, I.; Široká, J.; Tarkowská, D.; Strnad, M.; Ljung, K.; Novák, O. Plant Hormonomics: Multiple Phytohormone Profiling by Targeted Metabolomics. Plant Physiol. 2018, 177, 476–489. [Google Scholar] [CrossRef] [Green Version]
  35. Hellens, R.P.; Allan, A.C.; Friel, E.N.; Bolitho, K.; Grafton, K.; Templeton, M.D.; Karunairetnam, S.; Gleave, A.P.; Laing, W.A. Transient expression vectors for functional genomics, quantification of promoter activity and RNA silencing in plants. Plant Methods 2005, 1, 13. [Google Scholar] [CrossRef] [Green Version]
  36. Langfelder, P.; Horvath, S. WGCNA: An R package for weighted correlation network analysis. BMC Bioinform. 2008, 9, 559. [Google Scholar] [CrossRef] [Green Version]
  37. Yang, L.; Chen, M.; Cai, K.; Zhang, L.; Zhu, Y.; Ye, Q.; Lü, M.; Liao, F.; Chen, W.; Guo, W. VcFAS, VcSUN and VcOVATE orchestrated the fruit morphogenesis in southern highbush blueberry during the pre-anthesis and fruit development. Sci. Hortic. 2018, 240, 109–115. [Google Scholar] [CrossRef]
  38. Die, J.V.; Rowland, L.J. Superior Cross-Species Reference Genes: A Blueberry Case Study. PLoS ONE 2013, 8, e73354. [Google Scholar] [CrossRef]
  39. Yang, L.; Liu, L.; Wang, Z.; Zong, Y.; Yu, L.; Li, Y.; Liao, F.; Chen, M.; Cai, K.; Guo, W. Comparative anatomical and transcriptomic insights into Vaccinium corymbosum flower bud and fruit throughout development. BMC Plant Biol. 2021, 21, 289. [Google Scholar] [CrossRef]
  40. Bai, S.; Saito, T.; Sakamoto, D.; Ito, A.; Fujii, H.; Moriguchi, T. Transcriptome Analysis of Japanese Pear (Pyrus pyrifolia Nakai) Flower Buds Transitioning Through Endodormancy. Plant Cell Physiol. 2013, 54, 1132–1151. [Google Scholar] [CrossRef] [Green Version]
  41. Ruttink, T.; Arend, M.; Morreel, K.; Storme, V.; Rombauts, S.; Fromm, J.; Bhalerao, R.; Boerjan, W.; Rohde, A. A Molecular Timetable for Apical Bud Formation and Dormancy Induction in Poplar. Plant Cell 2007, 19, 2370–2390. [Google Scholar] [CrossRef] [PubMed] [Green Version]
  42. Shangguan, L.; Chen, M.; Fang, X.; Xie, Z.; Gong, P.; Huang, Y.; Wang, Z.; Fang, J. Comparative transcriptome analysis provides insight into regulation pathways and temporal and spatial expression characteristics of grapevine (Vitis vinifera) dormant buds in different nodes. BMC Plant Biol. 2020, 20, 390. [Google Scholar] [CrossRef] [PubMed]
  43. Aguilar-Martínez, J.A.; Poza-Carrión, C.; Cubas, P. Arabidopsis BRANCHED1Acts as an Integrator of Branching Signals within Axillary Buds. Plant Cell 2007, 19, 458–472. [Google Scholar] [CrossRef] [PubMed]
  44. Cooke, J.E.K.; Eriksson, M.E.; Junttila, O. The dynamic nature of bud dormancy in trees: Environmental control and molecular mechanisms. Plant Cell Environ. 2012, 35, 1707–1728. [Google Scholar] [CrossRef] [PubMed]
  45. Pin, P.A.; Nilsson, O. The multifaceted roles of FLOWERING LOCUS T in plant development. Plant Cell Environ. 2012, 35, 1742–1755. [Google Scholar] [CrossRef]
  46. Böhlenius, H.; Huang, T.; Charbonnel-Campaa, L.; Brunner, A.M.; Jansson, S.; Strauss, S.H.; Nilsson, O. CO/FT Regulatory Module Controls Timing of Flowering and Seasonal Growth Cessation in Trees. Science 2006, 312, 1040–1043. [Google Scholar] [CrossRef] [Green Version]
  47. Xu, F.; Li, T.; Xu, P.-B.; Li, L.; Du, S.-S.; Lian, H.-L.; Yang, H.-Q. DELLA proteins physically interact with CONSTANS to regulate flowering under long days inArabidopsis. FEBS Lett. 2016, 590, 541–549. [Google Scholar] [CrossRef] [Green Version]
  48. Zhongyuan, B.; Yu, Y.; Zepeng, L.; Yanchao, L.; Wen, J.; Ying, H.; Ai-Wu, D. Regulation of Arabidopsis Flowering by the Histone Mark Readers MRG1/2 via Interaction with CONSTANS to Modulate FT Expression. PLoS Genet. 2014, 10, e1004617. [Google Scholar]
  49. Ben Mohamed, H.; Vadel, A.M.; Geuns, J.M.; Khemira, H. Biochemical changes in dormant grapevine shoot tissues in response to chilling: Possible role in dormancy release. Sci. Hortic. 2010, 124, 440–447. [Google Scholar] [CrossRef]
  50. Ben Mohamed, H.; Vadel, A.M.; Geuns, J.M.; Khemira, H. Carbohydrate changes during dormancy release in Superior Seedless grapevine cuttings following hydrogen cyanamide treatment. Sci. Hortic. 2012, 140, 19–25. [Google Scholar] [CrossRef]
  51. Guak, S.; Fuchigami, L.H. Effects of Applied ABA on Growth Cessation, Bud Dormancy, Cold Acclimation, Leaf Senescence and N Mobilization in Apple Nursery Plants. J. Hortic. Sci. Biotechnol. 2001, 76, 459–464. [Google Scholar] [CrossRef]
  52. Ma, Y.; Szostkiewicz, I.; Korte, A.; Moes, D.; Yang, Y.; Christmann, A.; Grill, E. Regulators of PP2C Phosphatase Activity Function as Abscisic Acid Sensors. Science 2009, 324, 1064–1068. [Google Scholar] [CrossRef] [PubMed]
  53. Li, J.; Xu, Y.; Niu, Q.; He, L.; Teng, Y.; Bai, S. Abscisic Acid (ABA ) Promotes the Induction and Maintenance of Pear (Pyrus pyrifolia White Pear Group) Flower Bud Endodormancy. Int. J. Mol. Sci. 2018, 19, 310. [Google Scholar] [CrossRef] [PubMed] [Green Version]
  54. Chinnusamy, V.; Zhu, J.; Zhu, J.-K. Cold stress regulation of gene expression in plants. Trends Plant Sci. 2007, 12, 444–451. [Google Scholar] [CrossRef] [PubMed]
  55. Puig, C.P.; Dagar, A.; Ibanez, C.M.; Singh, V.; Crisosto, C.H.; Friedman, H.; Lurie, S.; Granell, A. Pre-symptomatic transcriptome changes during cold storage of chilling sensitive and resistant peach cultivars to elucidate chilling injury mechanisms. BMC Genom. 2015, 16, 245. [Google Scholar] [CrossRef] [PubMed] [Green Version]
  56. Li, X.; Li, M.; Zhou, B.; Yang, Y.; Wei, Q.; Zhang, J. Transcriptome analysis provides insights into the stress response crosstalk in apple (Malus × domestica) subjected to drought, cold and high salinity. Sci. Rep. 2019, 9, 9071. [Google Scholar] [CrossRef] [PubMed] [Green Version]
  57. An, S.; GAO, Y.; Maidunur, Y.; PAN, Y.; SHAO, W.; ZONG, Y.; CHEN, W.; YANG, L.; GUO, W.; LI, Y. Research on Application Exogenous Abscisic Acid in Inhibiting Early Flowering and Associated Genes Expression Characteristics in Blueberry. J. Fruit Sci. 2020, 38, 325–334. [Google Scholar] [CrossRef]
  58. Davies, P.J. The Plant Hormones: Their Nature, Occurrence, and Functions. In Plant Hormones; Springer: Dordrecht, The Netherlands, 1995. [Google Scholar]
  59. Howe, G.T.; Horvath, D.P.; Dharmawardhana, P.; Priest, H.D.; Mockler, T.C.; Strauss, S.H. Extensive Transcriptome Changes During Natural Onset and Release of Vegetative Bud Dormancy in Populus. Front. Plant Sci. 2015, 6, 989. [Google Scholar] [CrossRef] [Green Version]
  60. Bleecker, A.B.; Kende, H. Ethylene: A Gaseous Signal Molecule in Plants. Annu. Rev. Cell Dev. Biol. 2000, 16, 1–18. [Google Scholar] [CrossRef] [Green Version]
  61. Stepanova, A.N.; Alonso, J.M. Alonso Ethylene Signalling and Response Pathway: A Unique Signalling Cascade with a Multitude of Inputs and Outputs. Physiol. Plant. 2005, 123, 195–206. [Google Scholar] [CrossRef]
  62. Arenas, S.; Cortés, A.J.; Mastretta-Yanes, A.; Jaramillo-Correa, J.P. Evaluating the accuracy of genomic prediction for the management and conservation of relictual natural tree populations. Tree Genet. Genomes 2021, 17, 12. [Google Scholar] [CrossRef]
  63. Cortés, A.J.; Restrepo-Montoya, M.; Bedoya-Canas, L.E. Modern Strategies to Assess and Breed Forest Tree Adaptation to Changing Climate. Front. Plant Sci. 2020, 11, 583323. [Google Scholar] [CrossRef] [PubMed]
  64. Samish, M.R. Dormancy in Woody Plants. Annu. Rev. Plant Physiol. 1954, 5, 183–204. [Google Scholar] [CrossRef]
  65. Nishiyama, S.; Fujikawa, M.; Yamane, H.; Shirasawa, K.; Babiker, E.; Tao, R. Genomic insight into the developmental history of southern highbush blueberry populations. Heredity 2020, 126, 194–205. [Google Scholar] [CrossRef] [PubMed]
  66. Medina Cano, C.I.; Lobo Arias, M.; Castaño Colorado, Á.A.; Cardona, L.E. Development analysis of Mortiño (Vaccinium meridionale Swart.) plants derived from clonal and sexual propagation. CTA 2015, 16, 65–77. [Google Scholar] [CrossRef] [Green Version]
  67. Cappai, F.; Garcia, A.; Cullen, R.; Davis, M.; Munoz, P.R. Advancements in Low-Chill Blueberry Vaccinium corymbosum L. Tissue Culture Practices. Plants 2020, 9, 1624. [Google Scholar] [CrossRef]
  68. Frías-Ortega, C.E.; Alejo-Santiago, G.; Bugarín-Montoya, R.; Aburto-González, C.A.; Juárez-Rosete, C.R.; Urbina-Sánchez, E.; Sánchez-Hernández, E. Nutrient Solution Concentration and Its Relationship with Blueberry Production and Quality. Cienc. Tecnol. Agropecu. 2020, 21, e1296. [Google Scholar]
  69. Yang, Q.; Gao, Y.; Wu, X.; Moriguchi, T.; Bai, S.; Teng, Y. Bud endodormancy in deciduous fruit trees: Advances and prospects. Hortic. Res. 2021, 8, 139. [Google Scholar] [CrossRef]
Figure 1. Bud break percentage of blueberries after different periods of chilling and warming accumulation. (a) Comparison of the flower bud break percentage of O’Neal in 2018–2019. (b) Bud break percentage of blueberry flower buds on 29 December under warming accumulation. (c) Flower bud break process. Stages III and above are criteria for bud break statistics.
Horticulturae 08 00176 g001
Figure 2. Statistical analyses of the quantity of differentially expressed genes (DEGs) during different dormancy stages. DEGs were identified by pairwise comparisons of the seven libraries.
Horticulturae 08 00176 g002
Figure 3. GO enrichment diagrams. (af) represents the secondary GO term annotation for DEGs in Dec. 8 vs. Nov. 19, Dec. 29 vs. Dec. 8, 6 h vs. Dec. 29, 12 h vs. 6 h, 18 h vs. 12 h, and 24 h vs. 18 h respectively.
Horticulturae 08 00176 g003
Figure 4. KEGG pathway enrichment results of DEGs. The ordinate represents pathway entry, and the abscissa represents the rich factor. Dots represent significant DEG classes, and the size of a dot represents the number of significant DEGs in that class. The larger the dot, the greater the number of significant DEGs. Different colored dots represent different p values. (af) represents the pathways for DEGs in Dec. 8 vs. Nov. 19, Dec. 29 vs. Dec. 8, 6 h vs. Dec. 29, 12 h vs. 6 h, 18 h vs. 12 h, and 24 h vs. 18 h respectively.
Horticulturae 08 00176 g004
Figure 5. Analysis of changes in the expression levels of key genes in different metabolic pathways. Each column represents different sampling points, and each row represents a gene. The mean expression values were calculated using zero to one. Genes and expression patterns were hierarchically clustered based on the average Pearson’s metric. Red indicates high expression, and green indicates low expression. (a) Key DEGs in circadian rhythm. (b) Key DEGs in the TCA cycle.
Horticulturae 08 00176 g005
Figure 6. Hormone and ACC contents (ng/g FW) during flower bud endo- and ecodormancy release. Hormone types: ABA, abscisic acid; SA, salicylic acid; JA, jasmonic acid; CTK, cytokinin. ACC, 1-aminocyclopropane-1-carboxylic acid, an ethylene precursor. Values are the means of three biological replicates of flower buds from different plants. Error bars represent ± SD. Data were analyzed using one-way ANOVA followed by Duncan’s test. a, b, c, d and e indicate significant differences at p < 0.05.
Horticulturae 08 00176 g006
Figure 7. Analysis of changes in the expression levels of key genes in different hormone metabolic pathways. Each column represents a different sampling point, and each row represents a gene. The mean expression values were calculated using 0 to 1. Genes and expression patterns were hierarchically clustered based on the average Pearson’s metric. Red indicates high expression and blue indicates low expression. (a) Key differentially expressed genes in the ABA biosynthesis pathway. (b) Key differentially expressed genes in the ethylene, JA, and BR biosynthesis pathways. (c) Key differentially expressed genes in the plant hormone signal transduction pathway.
Horticulturae 08 00176 g007
Figure 8. Coexpression module analysis. (a) The number of genes in each module. (b) Diagram of associations between gene modules and hormone contents. The X axis represents the information of each phenotype value and the Y axis represents the module. Red indicates a positive correlation, green indicates a negative correlation, and a correlation value close to 1 indicates a high correlation. The p-value of each significant correlation is shown in parentheses.
Horticulturae 08 00176 g008
Table 1. Statistical results of data quality.
Sample NameRaw DataClean DataClean Data Ratio (%)Clean Data Q20 (%)Clean Data Q30 (%)GC Content (%)Mapped ReadsPercentage of Mapped ReadsMapped Genome (%)Mapped Gene (%)
Nov. 19-141,082,38441,078,45699.9997.5393.9146.8429,594,33672.04%72.04%59.60%
Nov. 19-240,638,85840,635,40299.9997.4893.8247.1232,048,46878.87%78.87%68.31%
Nov. 19-341,003,18440,999,15699.9997.4793.8147.332,364,24478.94%78.94%68.54%
Dec. 8-140,359,73440,354,47699.9997.3693.6347.829,287,92072.58%72.58%61.09%
Dec. 8-240,379,52840,373,46699.9897.2793.4747.7130,525,00475.61%75.61%63.26%
Dec. 8-340,117,15440,111,15899.9997.5794.0647.5930,338,44875.64%75.64%62.35%
Dec. 29-141,356,72041,351,04099.9997.6794.2847.2832,701,50679.08%79.08%65.14%
Dec. 29-241,127,70641,122,63099.9997.6294.1347.2832,066,61477.98%77.98%63.66%
Dec. 29-341,169,84041,163,93299.9997.6194.1147.6432,503,73678.96%78.96%66.26%
6 h-140,431,51440,428,06899.9997.8394.546.6129,676,10473.40%73.40%59.28%
6 h-240,489,88440,486,18699.9997.2393.1646.6930,991,37276.55%76.62%65.72%
6 h-340,486,65840,482,47899.9997.1993.0847.331,017,54676.62%76.55%64.33%
12 h-141,321,01441,316,89299.9997.3193.3147.0832,476,74278.60%78.60%68.04%
12 h-240,172,08440,168,20099.9997.393.3147.2430,641,34476.28%76.28%65.73%
12 h-341,155,51641,149,57299.9997.293.1647.7732,798,90879.71%79.71%68.83%
18 h-140,407,68240,404,32899.9997.4193.5346.6329,553,02073.14%73.14%61.94%
18 h-240,400,51840,397,04499.9997.3193.346.6629,263,82872.44%72.44%61.06%
Table 2. Information on transcription factors in MEdarkred.
Gene IDGOKEGG Annotation
VaccDscaff33-processed-gene-241.9GO:0050794 regulation of cellular processethylene response factor 12
VaccDscaff43-augustus-gene-228.38GO:0045893 positive regulation of transcriptionelongation factor G-2
VaccDscaff8-snap-gene-394.21GO:0007165 signal transduction|GO:0006351 transcriptiontwo-component response regulator ARR1 isoform X2
VaccDscaff13-augustus-gene-302.19GO:0042787 protein ubiquitination involved in ubiquitin-dependent protein catabolic processE3 ubiquitin-protein ligase UPL3
VaccDscaff46-augustus-gene-87.38GO:0008152 metabolic processABC transporter F family member 1 isoform X1
VaccDscaff46-augustus-gene-19.24GO:0045893 positive regulation of transcriptionelongation factor G-2, chloroplastic
VaccDscaff47-augustus-gene-75.30GO:0048519 negative regulation of biological processhomeobox-leucine zipper protein REVOLUTA
VaccDscaff5-augustus-gene-239.20-----E3 ubiquitin protein ligase RIE1-like
VaccDscaff703-augustus-gene-0.9GO:0006355 regulation of transcription, DNA-templatedhomeobox-leucine zipper protein HOX11-like
Publisher’s Note: MDPI stays neutral with regard to jurisdictional claims in published maps and institutional affiliations.

