Article

Monitoring Stem Water Potential with an Embedded Microtensiometer to Inform Irrigation Scheduling in Fruit Crops

by
Alan N. Lakso
1,2,*,
Michael Santiago
1 and
Abraham D. Stroock
3
1
FloraPulse Co., Davis, CA 95616, USA
2
Horticulture, Agritech Campus, Cornell University, Geneva, NY 14456, USA
3
School of Chemical Engineering, Cornell University, Ithaca, NY 14853, USA
*
Author to whom correspondence should be addressed.
Horticulturae 2022, 8(12), 1207; https://doi.org/10.3390/horticulturae8121207
Submission received: 7 November 2022 / Revised: 8 December 2022 / Accepted: 12 December 2022 / Published: 16 December 2022

Abstract

:
The water status of fruit and nut crops is critical to the high productivity, quality and value of these crops. Water status is often estimated and managed with indirect measurements of soil moisture and models of evapotranspiration. However, cultivated trees and vines have characteristics and associated cultural practices that complicate such methods, particularly variable discontinuous canopies, and extensive but low-density, variable root systems with relatively high hydraulic resistance. Direct and continuous measurement of plant water status is desirable in these crops as the plant integrates its unique combination of weather, soil and cultural factors. To measure plant water potential with high temporal sampling rates, a stem-embedded microchip microtensiometer sensor has been developed and tested in several fruit crops for long-term continuous monitoring of stem water potential. Results on several fruit crops in orchards and vineyards have been good to excellent, with very good correlations to the pressure chamber standard method. The primary challenge has been establishing and maintaining the intimate contact with the xylem for long periods of time, with variable stem anatomies, stem growth and wound reactions. Sources of variability in the measurements and utilization of the continuous data stream, in relation to irrigation scheduling, are discussed. Direct continuous and long-term field measurements are possible and provide unique opportunities for both research and farming.

1. Introduction

The water status of fruit and nut crops is critical to vegetative growth, yield and crop quality, sustainability, and management challenges [1,2,3]. The water status at any moment is the complex integration of the effects of soils, rainfall, evaporative demand, plant development and radiation interception, crop and vegetative management, irrigation and competing floor management, and the unique physiological characteristics of a species. As perennial crops, they have processes, such as the initiation and development of flower buds and the development of carbon and mineral nutrient reserves, that span and affect more than one year. For example, early season water stress in grapevines was shown to have strong negative effects on bud fruitfulness, cropping and vegetative growth in the following year [4,5]. Consequently, optimizing the water status of fruit crops is important to support a current crop and its growth, but also to ensure sustained cropping.
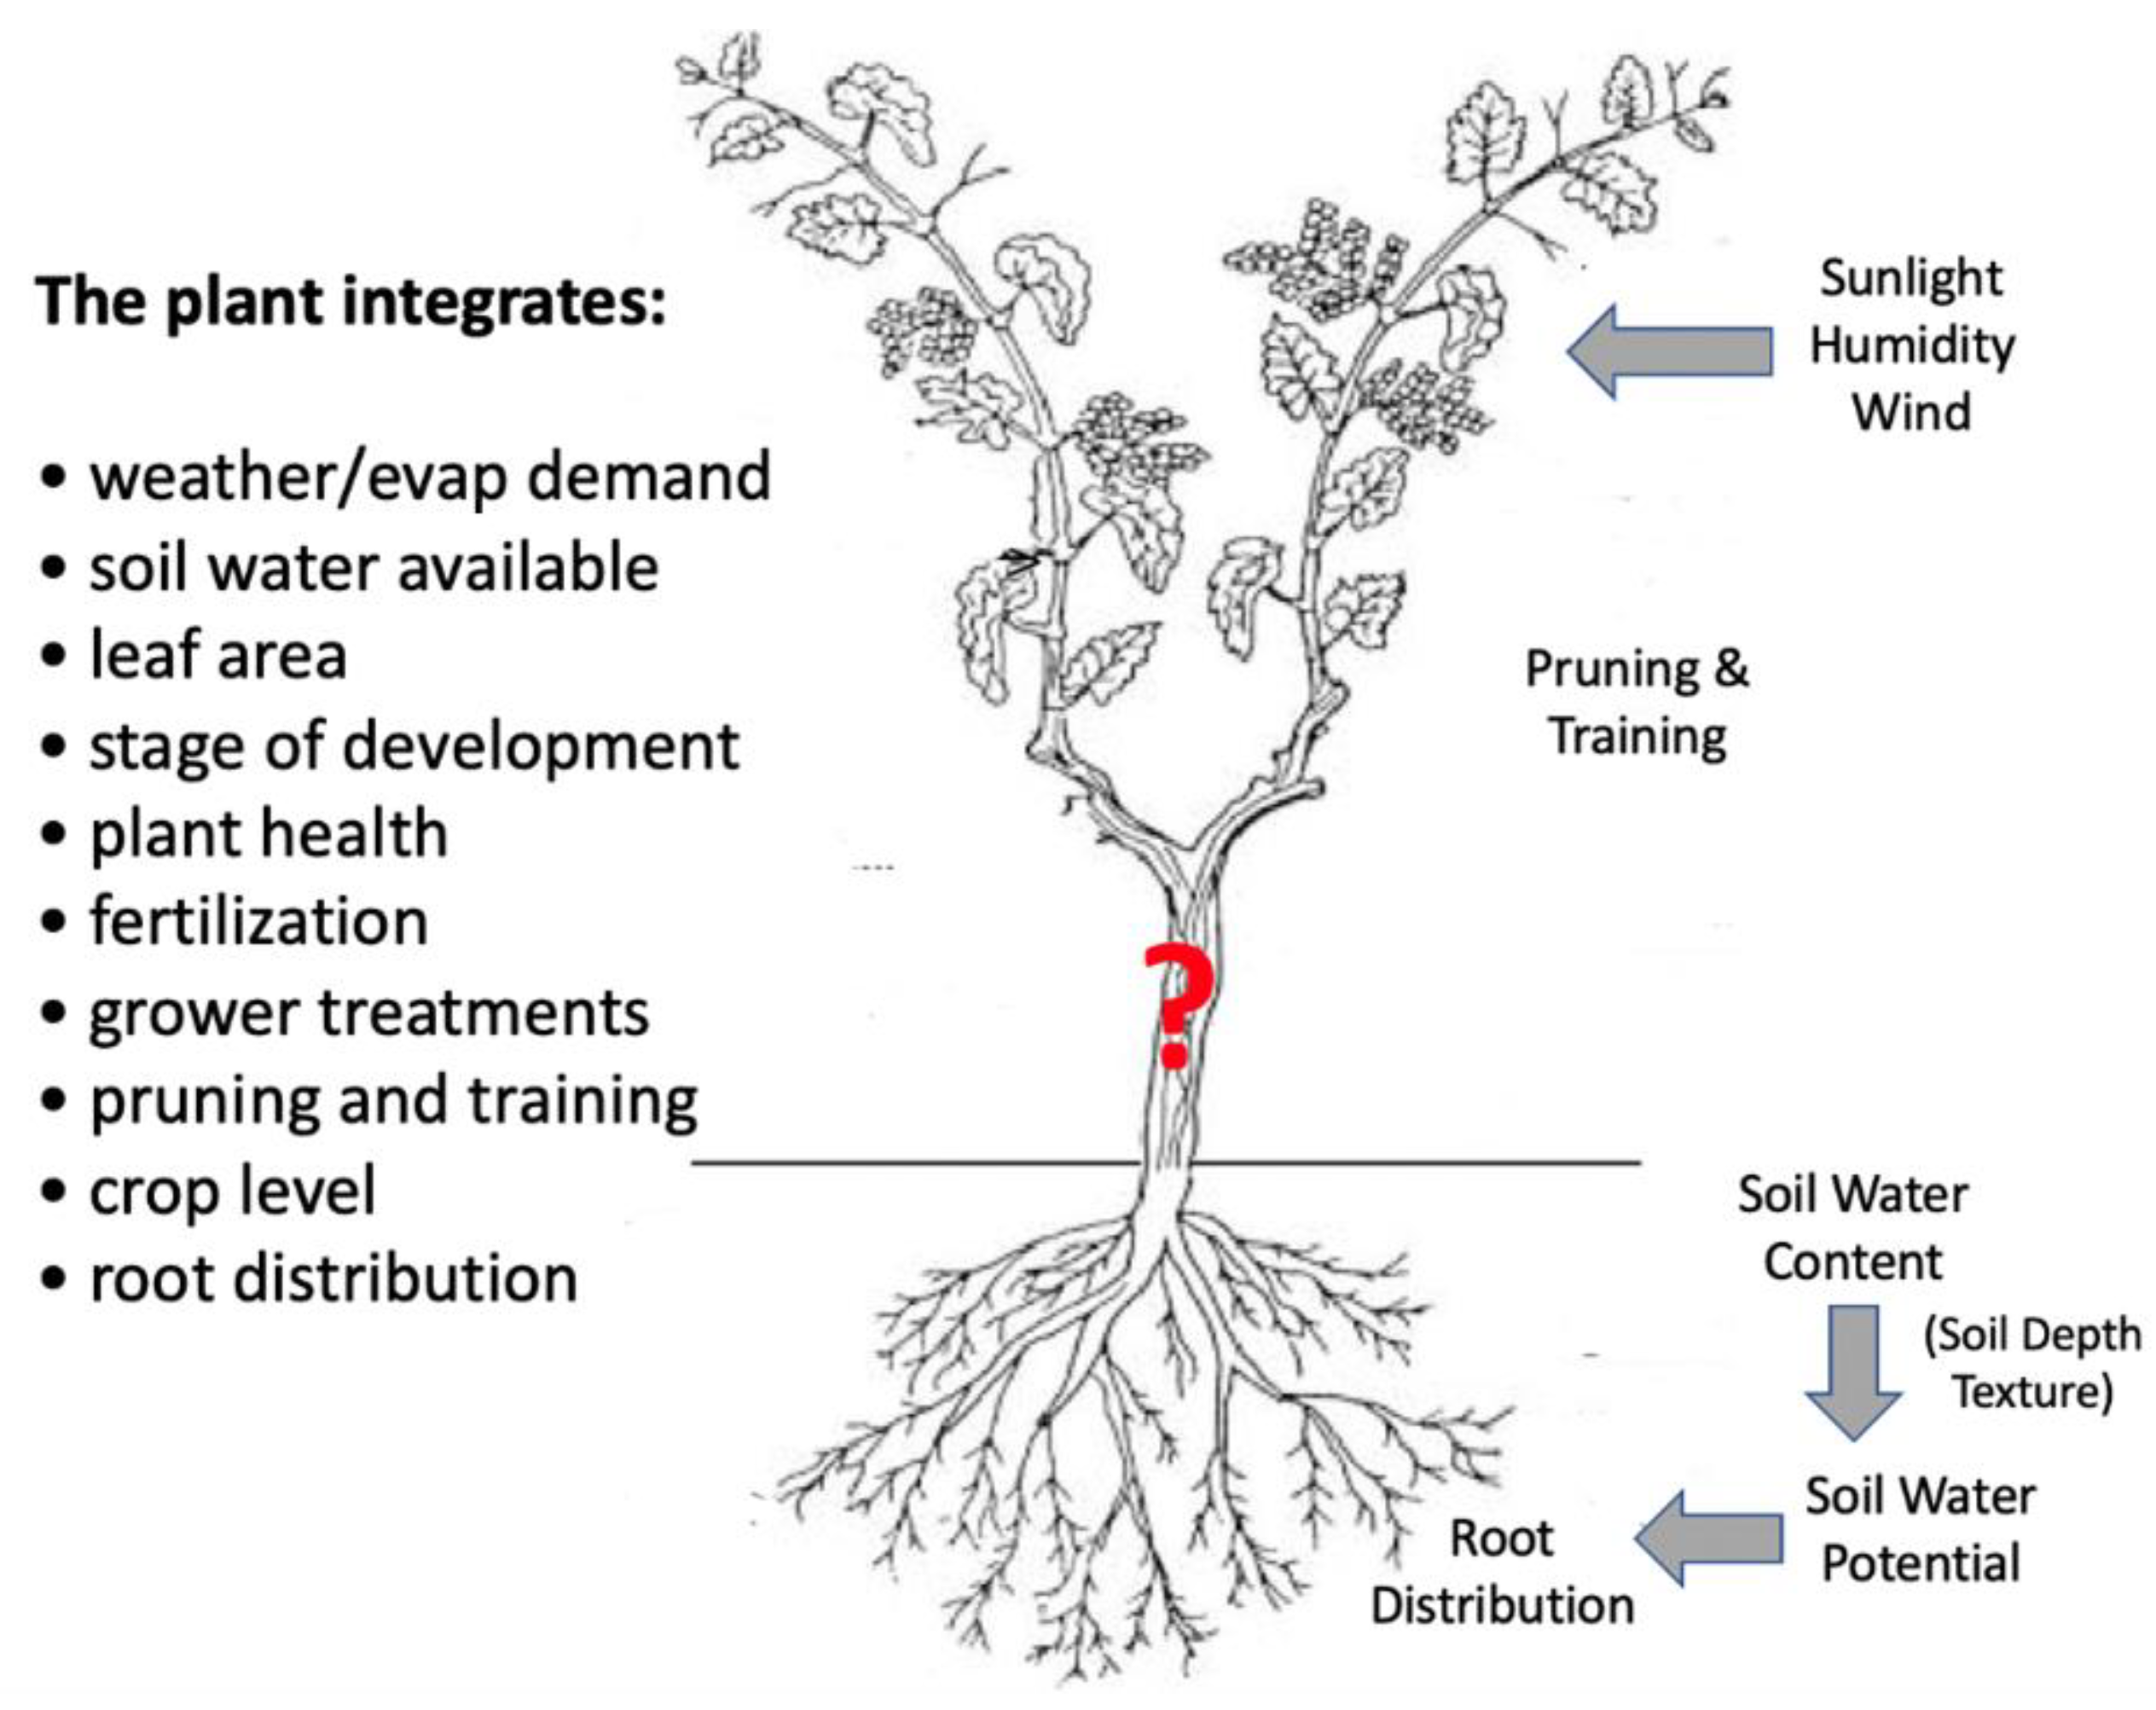
Fruit and nut crops are complex perennial systems with discontinuous canopies and often competing plants in the alleyways that make accurate estimations of water use and plant water stress more difficult than continuous canopy monocultures (Figure 1). Large plants with root systems that are large, often deep, low density, and sometimes very erratic in distribution with soil structure or nutrients, make the placement of soil moisture probes uncertain [6,7]. We estimate that the rhizosphere (the 1 mm zone around the roots) of a mature apple tree may only represent about 2% of the rooting volume of soil. Consequently, the very low root length densities (RLD—total root length per surface area or volume of soil) that supply large canopies with water can lead to localized drying around the few roots that must have very high intakes rates of water per length of root [6]. This means that the effective soil moisture of the rhizosphere at mid-day may not be represented by the bulk soil moisture we measure with soil probes. Species such as grasses, that have 50–500 times the RLD, will likely have the same rhizosphere water potential as the bulk soil.
The discontinuous canopies of fruit crops are in some cases strongly manipulated by growers into unnatural forms such as thin vertical, V, Y, U or T shapes [8,9] with varying planting densities and on varying rootstocks [10] having large effects on water use. Winter and summer pruning and shoot positioning may affect leaf area densities and solar radiation interception that affects water use rates. The level of cropping can also affect stomatal opening, and thus water use and potentials [11]. Although meteorological methods have been developed to estimate the water use of fields, the combined use of the trees or vines and the cover crops, weeds or bare soil of the alleyways make the interpretation of whole-field data more difficult when using drip irrigation of only the trees.
In addition to the structural aspects, somewhat higher plant hydraulic resistances (Rplant) in many fruit crops than annuals make them sensitive to dynamic atmospheric evaporative demands, regardless of soil water status [12,13]. This leads to very dynamic water stress patterns, especially in humid climates with variable radiation and evaporative demands. Such dynamic behavior of water stress requires a high sampling rate to be able to understand how water status can affect cumulative processes such as fruit or shoot growth.
Water management is difficult to optimize without having appropriate and timely measurements of plant water status to determine how the plants respond to the natural environment. Another critical, yet rarely attempted, method is to determine if the irrigation actually has had the intended effect of regulating stress, and avoiding over-irrigation and possible pollution by leaching. Due to this complexity, it is difficult to model the interactions of all the factors that may affect the ultimate water stress in the orchards and vineyards. So, it is preferable to let the plant integrate the many influences and then measure it directly.
Figure 1. Representation of the many factors that affect the water status of a fruit tree or vine. Determining the plant water status directly (the red ?) is preferable to the many correlations of indirect factors. Figure modified from similar figure in Lakso and Intrigliolo [14].
Horticulturae 08 01207 g001
For irrigation management, the primary questions are: (1) how much to irrigate; (2) when to irrigate; (3) whether the irrigation gave the intended effect on plant water status; and (4) was there any waste of water, giving negative environmental impacts?
How much to irrigate? Many methods of soil moisture monitoring or ET modeling with data from ag weather systems have been commonly used for many years [1,2], as well as general experiences of the grower. More recently, research methods such as sap flow [15,16] or surface renewal estimation of field water use [17,18] have been developed for grower use. All of these techniques are useful to estimate the amount of irrigation needed to replace the water use when there is no significant stress. However, each has its limitations especially when deficit irrigation is used, which is fairly often in fruit and nut crops. Deficit irrigation is used to obtain desired stress levels that will provide specific outcomes such as restricting vegetative growth, improving fruit quality, or saving limited water [19,20,21,22,23].
When to irrigate? And does it give the desired level of stress? Irrigation scheduling is more difficult unless there is some measurement or estimate from a dynamic model. Since the root zone is not well defined, it is not inherently clear with large deep-rooted crops how much of the measured soil water should be depleted before irrigation. Weather has a large effect on fruit crop water stress during the day, so combining soil and forecasted meteorological models can be used to decide on when to irrigate. Again, grower experience is often used.
Many research studies of water stress effects on plants find that growth or function (photosynthesis, transpiration) is best related to a fundamental measure of plant water status, i.e., water potential, than to soil water or weather correlations which can vary in each situation or time. Additionally, the goal of water management can differ with the species and markets. For example, apple has a basically linear fruit weight growth over most of the season, and market demands are for large crops of large fruit. So, the goal is, generally, to limit significant water stress as fruit growth must be maintained at a fairly high level all season without waste [3,24]. However, in grapes and stone fruits that have a lag period of fruit growth in the middle of the season, deficit irrigation can be applied to control excessive vegetative growth, while having little to some effect on fruit growth [19,22,25]. Regulated water status in wine grapes has been found to have strong impacts on fruit and wine composition, quality, and value, though the optimal values appear to vary with cultivar [19,22,26,27]. Thus, optimizing water management for precise stress targets, based on plant water status, requires accurate measurements of plant water status. It is also important to avoid the waste of limited water resources and to avoid pollution from leaching [28].
Lakso and Intrigliolo [14] reviewed many of the methods tested to estimate the water status of fruit crops. Briefly, soil water potentials may be well correlated to plant water potentials, but in fruit crops with deep and low root density these correlations may be very poor. Remote sensing based on spectral reflection has been examined many times and found to correlate in some cases to plant water potentials, especially when the water potentials are manifested as larger canopies (see also review by Gautam and Pagay [29]). However, the generality seems to be limited, as typically the R2 values do not exceed about 0.7 due to many variable interferences (e.g., variations in radiation, humidity, restrictive plant forms, wind, crop load effects on stomatal conductance, anisohydric stomatal behavior) requiring local calibrations. Additionally, the temporal sampling by remote sensing is generally very limited. The very high spatial sampling, however, is a great advantage over limited plants with direct measurement. Since there is often large temporal and spatial variability in fruit crop plantings, the optimal approach should be a combination of soil methods such as detailed mapping, remote sensing, atmospheric and physiological modeling with bench-marking by direct measurement of the plant water potential, and growth. New machine learning approaches show promise for integrating the many factors involved [30].

Plant Measurements to Estimate or Measure Water Status

A key question for scheduling irrigation or other water management is whether the action actually gives the desired water status of the crop. There are several methods that measure the plant directly to provide answers. One type of measurement is the monitoring of shoot or fruit growth rates, or changes in tissue dimensions (stem, leaf or fruit shrink/swell) as a response to stress. They are valuable as they measure, directly, some key processes of fruit production such as fruit growth. However, they are only correlated to water potentials, and tissue physical properties can change during the season, so correlations to water potential can change, necessitating re-calibration [14,31,32]. Additionally, two-dimensional dendrometry on three-dimensional fruit becomes much less sensitive in the late season. For example, measuring commercial-sized apple growth, we found diameter changes of 1.1 mm/day 2–3 weeks after bloom, but only 0.2 mm/day in the weeks before harvest, increasing the noise-to-signal ratio.
The standard for practical field measurements of water status is the Scholander Pressure Chamber (SPC) developed in the 1960s [33,34], which is a manual instrument that gives spot measurements of plant water status. With proper precautions and operator training [35] the SPC has underpinned most of the progress in plant water relations for the past 50 years, and the relationships between water stress and plant responses.
SPC measurements made on exposed leaves are considered leaf total water potential, which is the water potential in the stem plus the additional drop in potential across the petiole and the leaf blade [35]. If the leaf is covered in reflective polyethylene bags to stop transpiration after about 30 min or more, the leaf equilibrates with the stem and provides a more integrated measurement of the stem water potential [35,36]. Similarly, if SPC measurements are made pre-dawn when there is little or no transpiration, the plant equilibrates with the wettest soil around the root system to give a measure of “effective” soil water potential, though there are issues of interpretation discussed below.
Of the choices of leaf versus stem water potential, the best single measure is that of stem water potential as: (1) it integrates the water status of many or all of the canopy better than that of a single exposed leaf that is affected strongly by its unique exposure and location; (2) it is more stable for that reason than exposed leaf potentials as sunlight moves across a canopy; (3) it is a better measure of the water potentials of slowly-transpiring organs such as shoot tips and fruit that are more closely equilibrated with the stem; and (4) at pre-dawn it is the estimate of the effective soil moisture. Patakas [37] found that stem potentials were a more reliable indicator of plant water status among different irrigation treatments, as partial stomatal closure gave the same mid-day leaf water potentials, obscuring the differences in well-watered and stressed grapevines. For these reasons stem water potentials have become the preferred measurement of water stress in fruit crops [36,38,39,40,41].
As mentioned above, the water potential of a field tree or vine is very dynamic. Consequently, to appropriately measure a dynamic system, a high frequency of sampling is needed. With the amount of variation in water potential over the day in fruit crops sampling at no less than two times, the pre-dawn maximum and mid-day minimum, would be needed to generally understand daily stress patterns. Of course, sampling more often would help identify the daily pattern in more detail, including when the daily minimum actually occurs which may depend on canopy structure and row orientation [42]. The term “mid-day” has been used loosely to mean from solar noon to late afternoon.
Fernandez [43] has outlined the following major characteristics of an ideal water status sensor for use in the field (lightly edited by senior author):
  • capable of direct measurement of plant water potential;
  • accurate (0.01 MPa or better) and stable over the full physiologically relevant range of plant water potential (0 to −3 MPa or lower);
  • produces continuous, real-time measurements over months to years;
  • simple to install and operate with minimal sensitivity to temperature variations and contaminants;
  • as small as possible to allow precise spatial measurements and to minimize disruption of tissue upon embedding;
  • reasonable cost to manufacture and deploy; many sensors may be needed to resolve spatial variations;
  • compatible with wireless networks for real-time data collection and spatial integration.
The objective of this report is to provide information on innovation in water relations; the microtensiometer and how it works; examples of the kind of data it provides; a discussion of how to interpret the data in relation to other methods; what the limitations and sources of variation or error are; and its potential value to irrigation scheduling.

2. Materials and Methods

The Microtensiometer for Monitoring Stem Water Potential—Based on 15 years of research and development by the authors at Cornell University and FloraPulse Company (www.florapulse.com), a practical microtensiometer has become commercially available for woody plants [44,45,46,47,48]. The microchip sensor is based on the same principle as the classic soil tensiometer, but is only 5 × 5 mm. The water volume is estimated to be between 5 and 10 nL, and the pressure is measured by a piezoresistive pressure transducer. The chip is held in an 8 mm diameter cylindrical probe exposing the chip edge that is the site of water exchange (Figure 2).
Installation—The probe is embedded in the stem of woody plants, and possibly annuals with relatively woody stems. Since the cylindrical sensor probe is about 8 mm in diameter, it is recommended for use in stems that are at least 5 cm in diameter to avoid excess injury that may affect the readings. A stainless-steel sleeve with barbs provides a drill guide and holds the sensor unit against the xylem. A fine clay paste is inserted between the sensor edge and the xylem tissue, and helps to maintain good liquid contact with the sensor as drilling into wet xylem tissue leaves imperfect surfaces. After installation, all interfaces are covered well with silicone caulk material to stop water exchange and reduce the chances of disease entry.
The sensor unit is available as a wired sensor for connection to normal data loggers or is connected to a dedicated solar-powered wireless data logger. The logged data from the sensor is cellularly transmitted to the cloud and can be accessed via a user interface on the FloraPulse website, as shown in the example dashboard below (Figure 3). Since the mid-day minimum value is a key parameter, it can be displayed for easier interpretation with additional color-coded bands of stress levels defined for the crop by prior published research. Baseline stress levels that estimate the expected stress of a well-irrigated plant under those weather conditions, discussed below, are shown by the blue line to look for deviations that indicate soil moisture limitations. Additional data on irrigation amounts applied and any SPC readings conducted can be added to the database. The full 20 min reading dataset can be downloaded if desired (right side of the dashboard). The microtensiometers have been tested in a range of crops over the last 5 years. These characteristics meet most of the criteria proposed by Fernandez above.
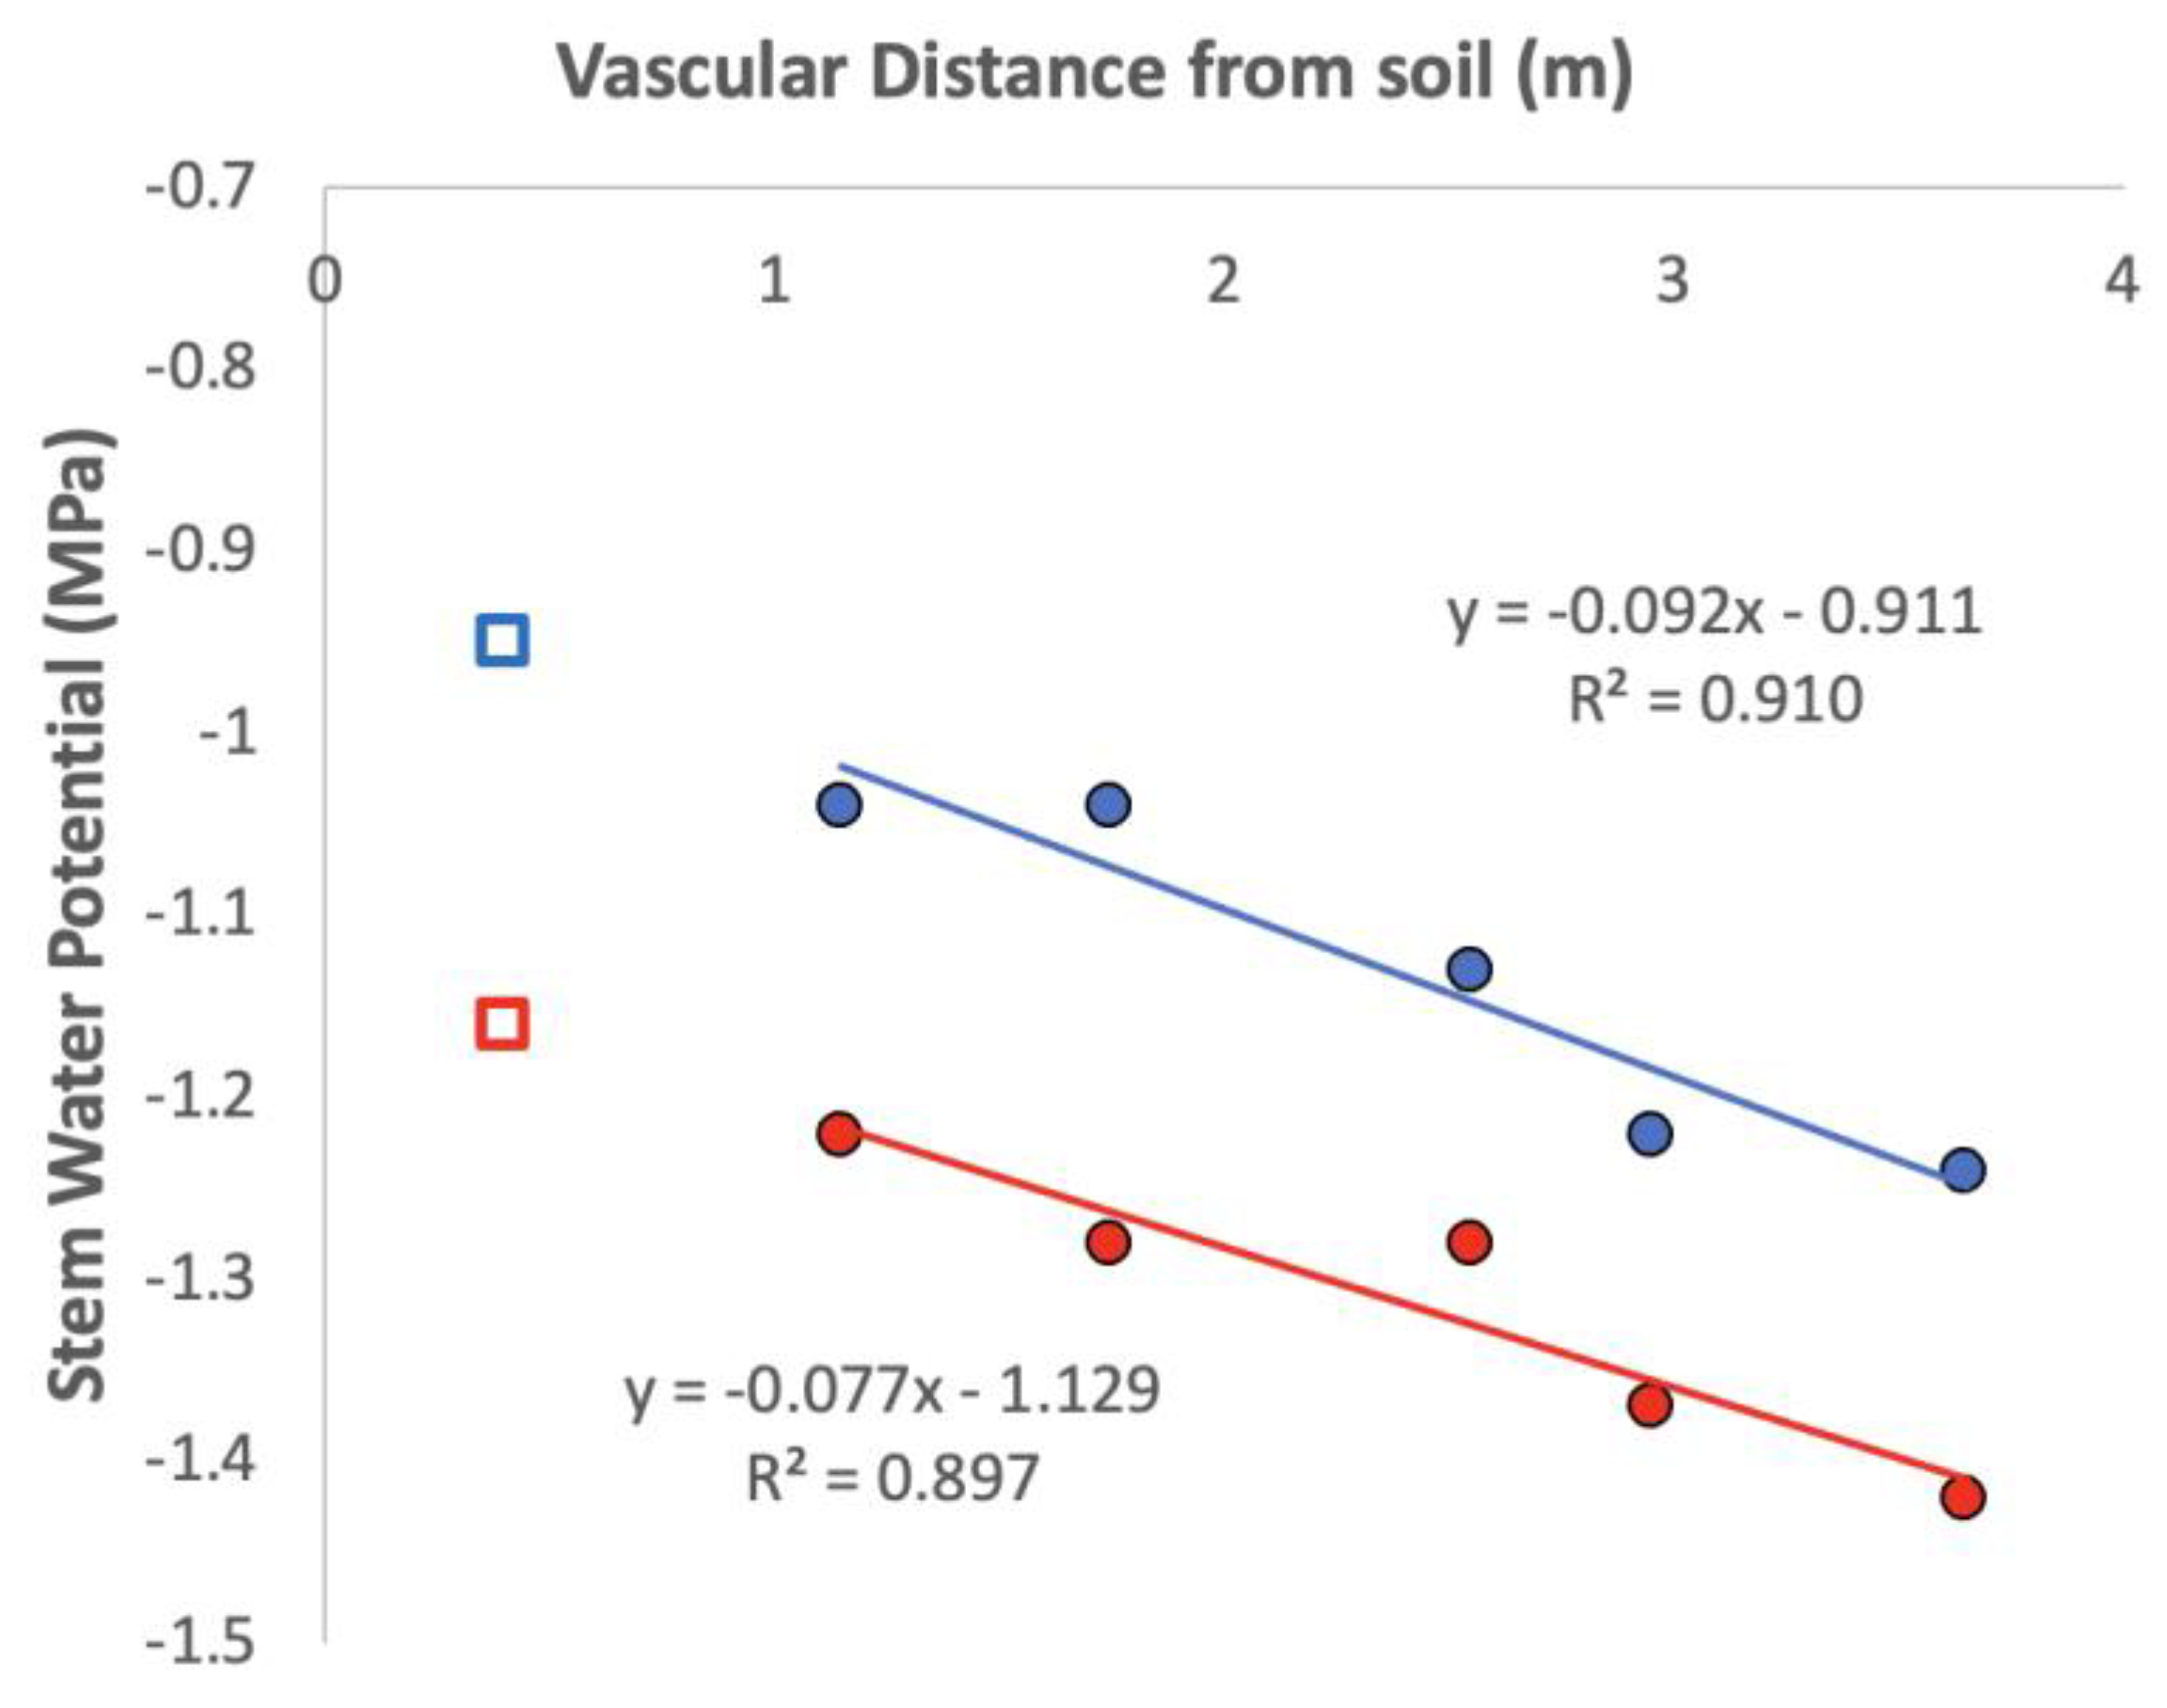
Previous research has shown that there can be significant variability in the stem water potential within an apple tree [49] that may affect the relationship of stem water potentials via microtensiometer versus by SPC. The variability in stem water potential, as a function of the vascular distance from the soil, was tested by bagging leaves in ‘Gala’/M.9 tall spindle apple trees at different vascular distances above the soil. This was conducted on two days in late summer in New York, by measuring mid-day stem potentials under consistently sunny, but varying evaporative demands.

3. Results

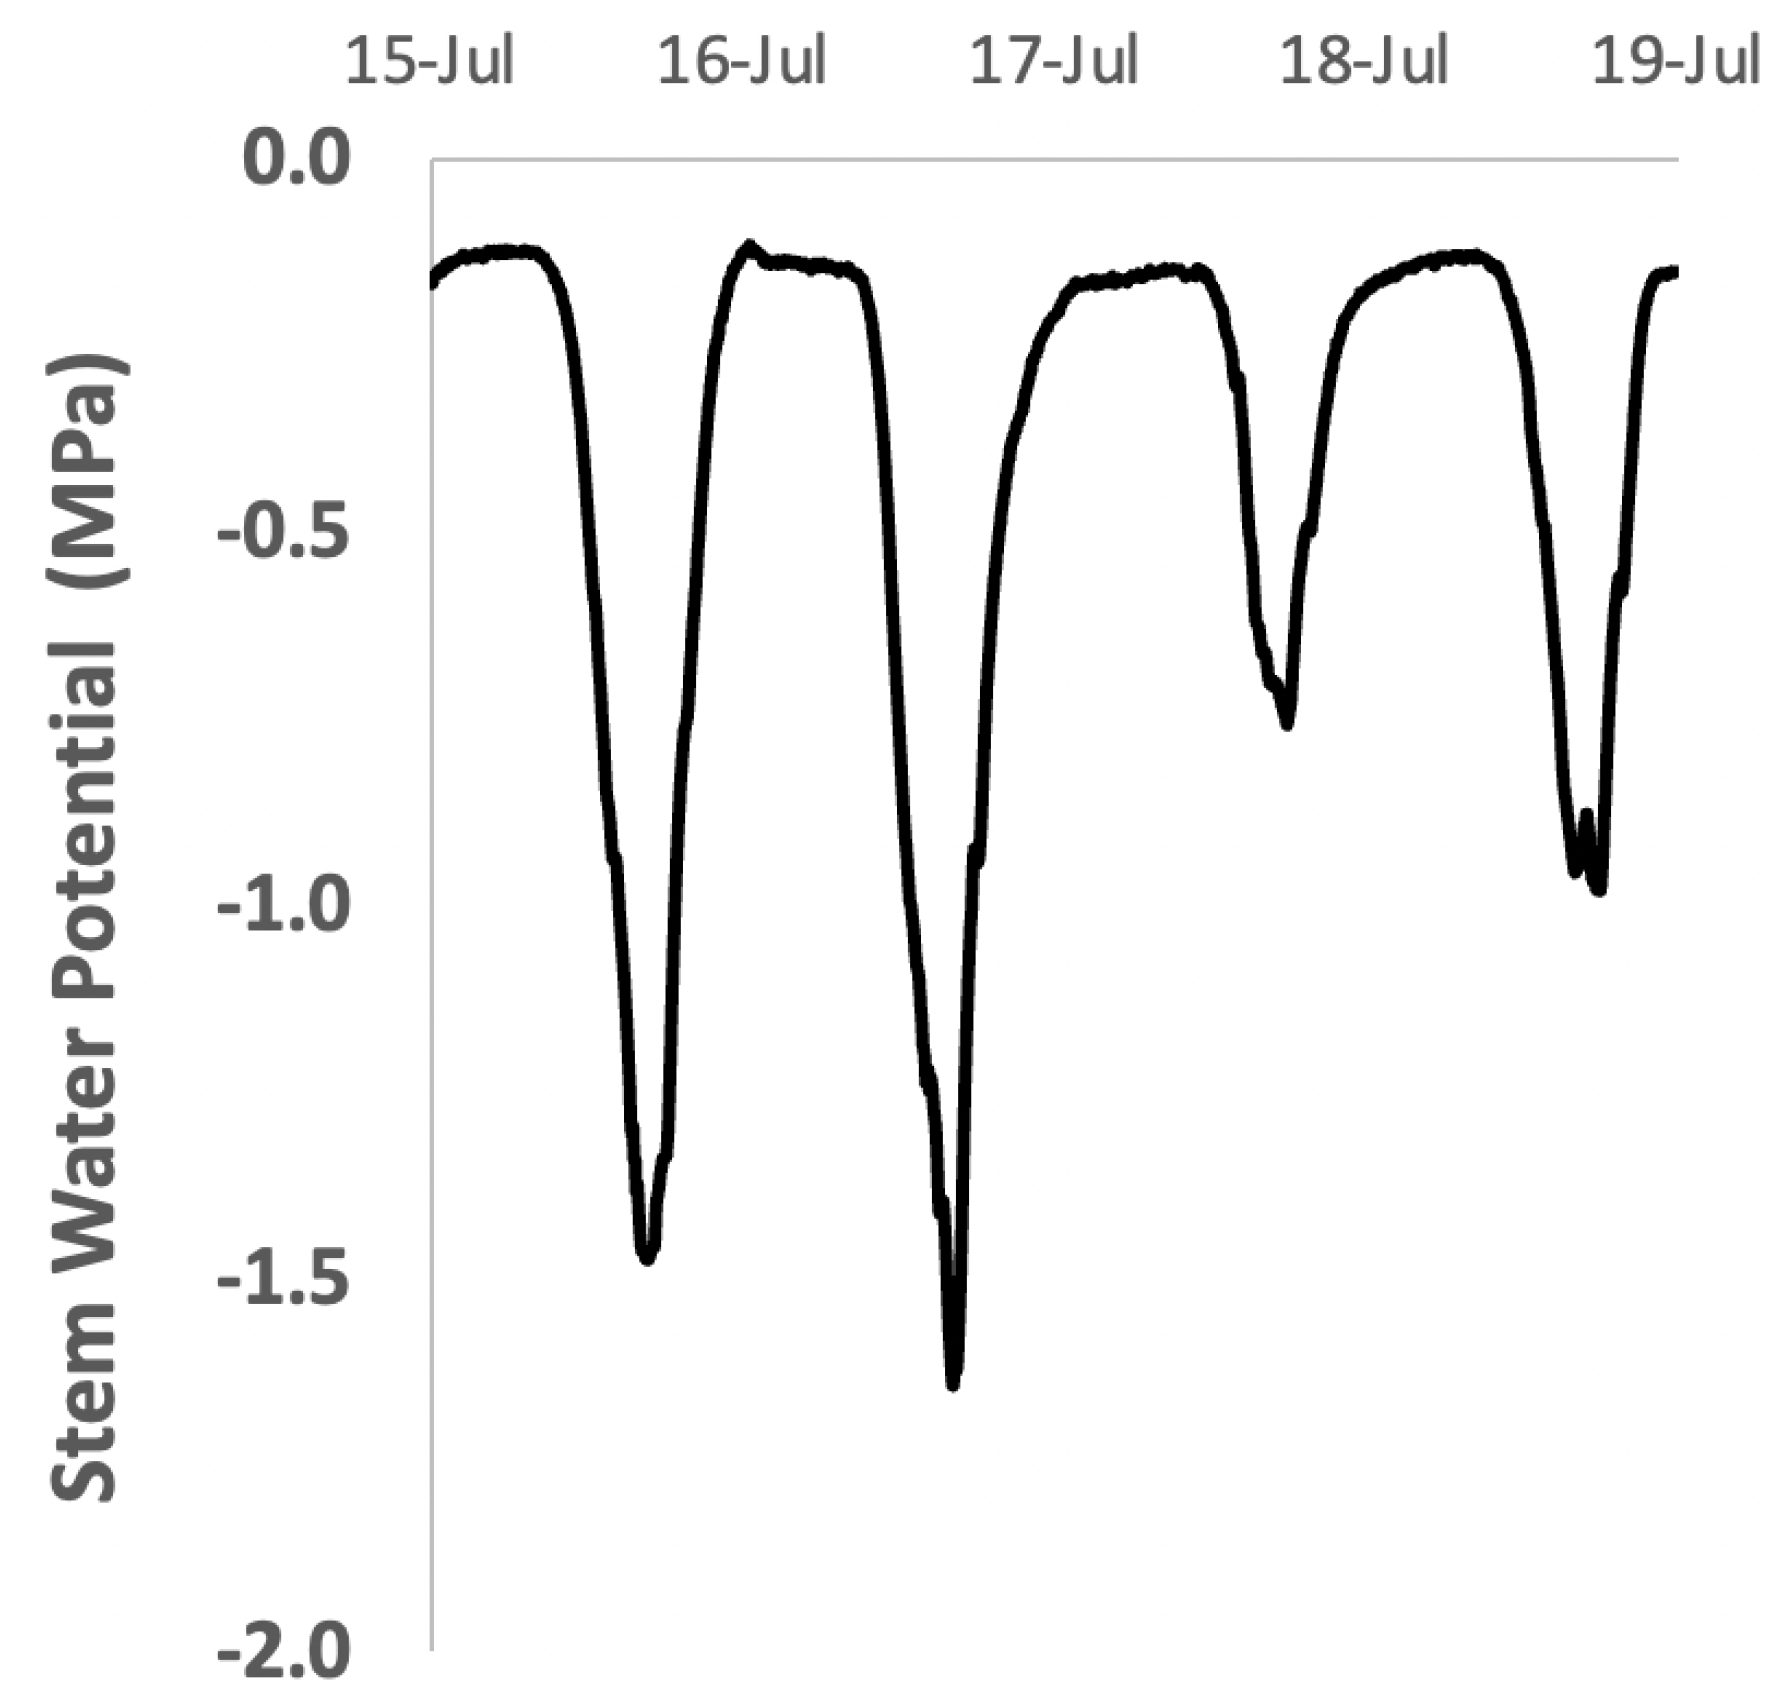
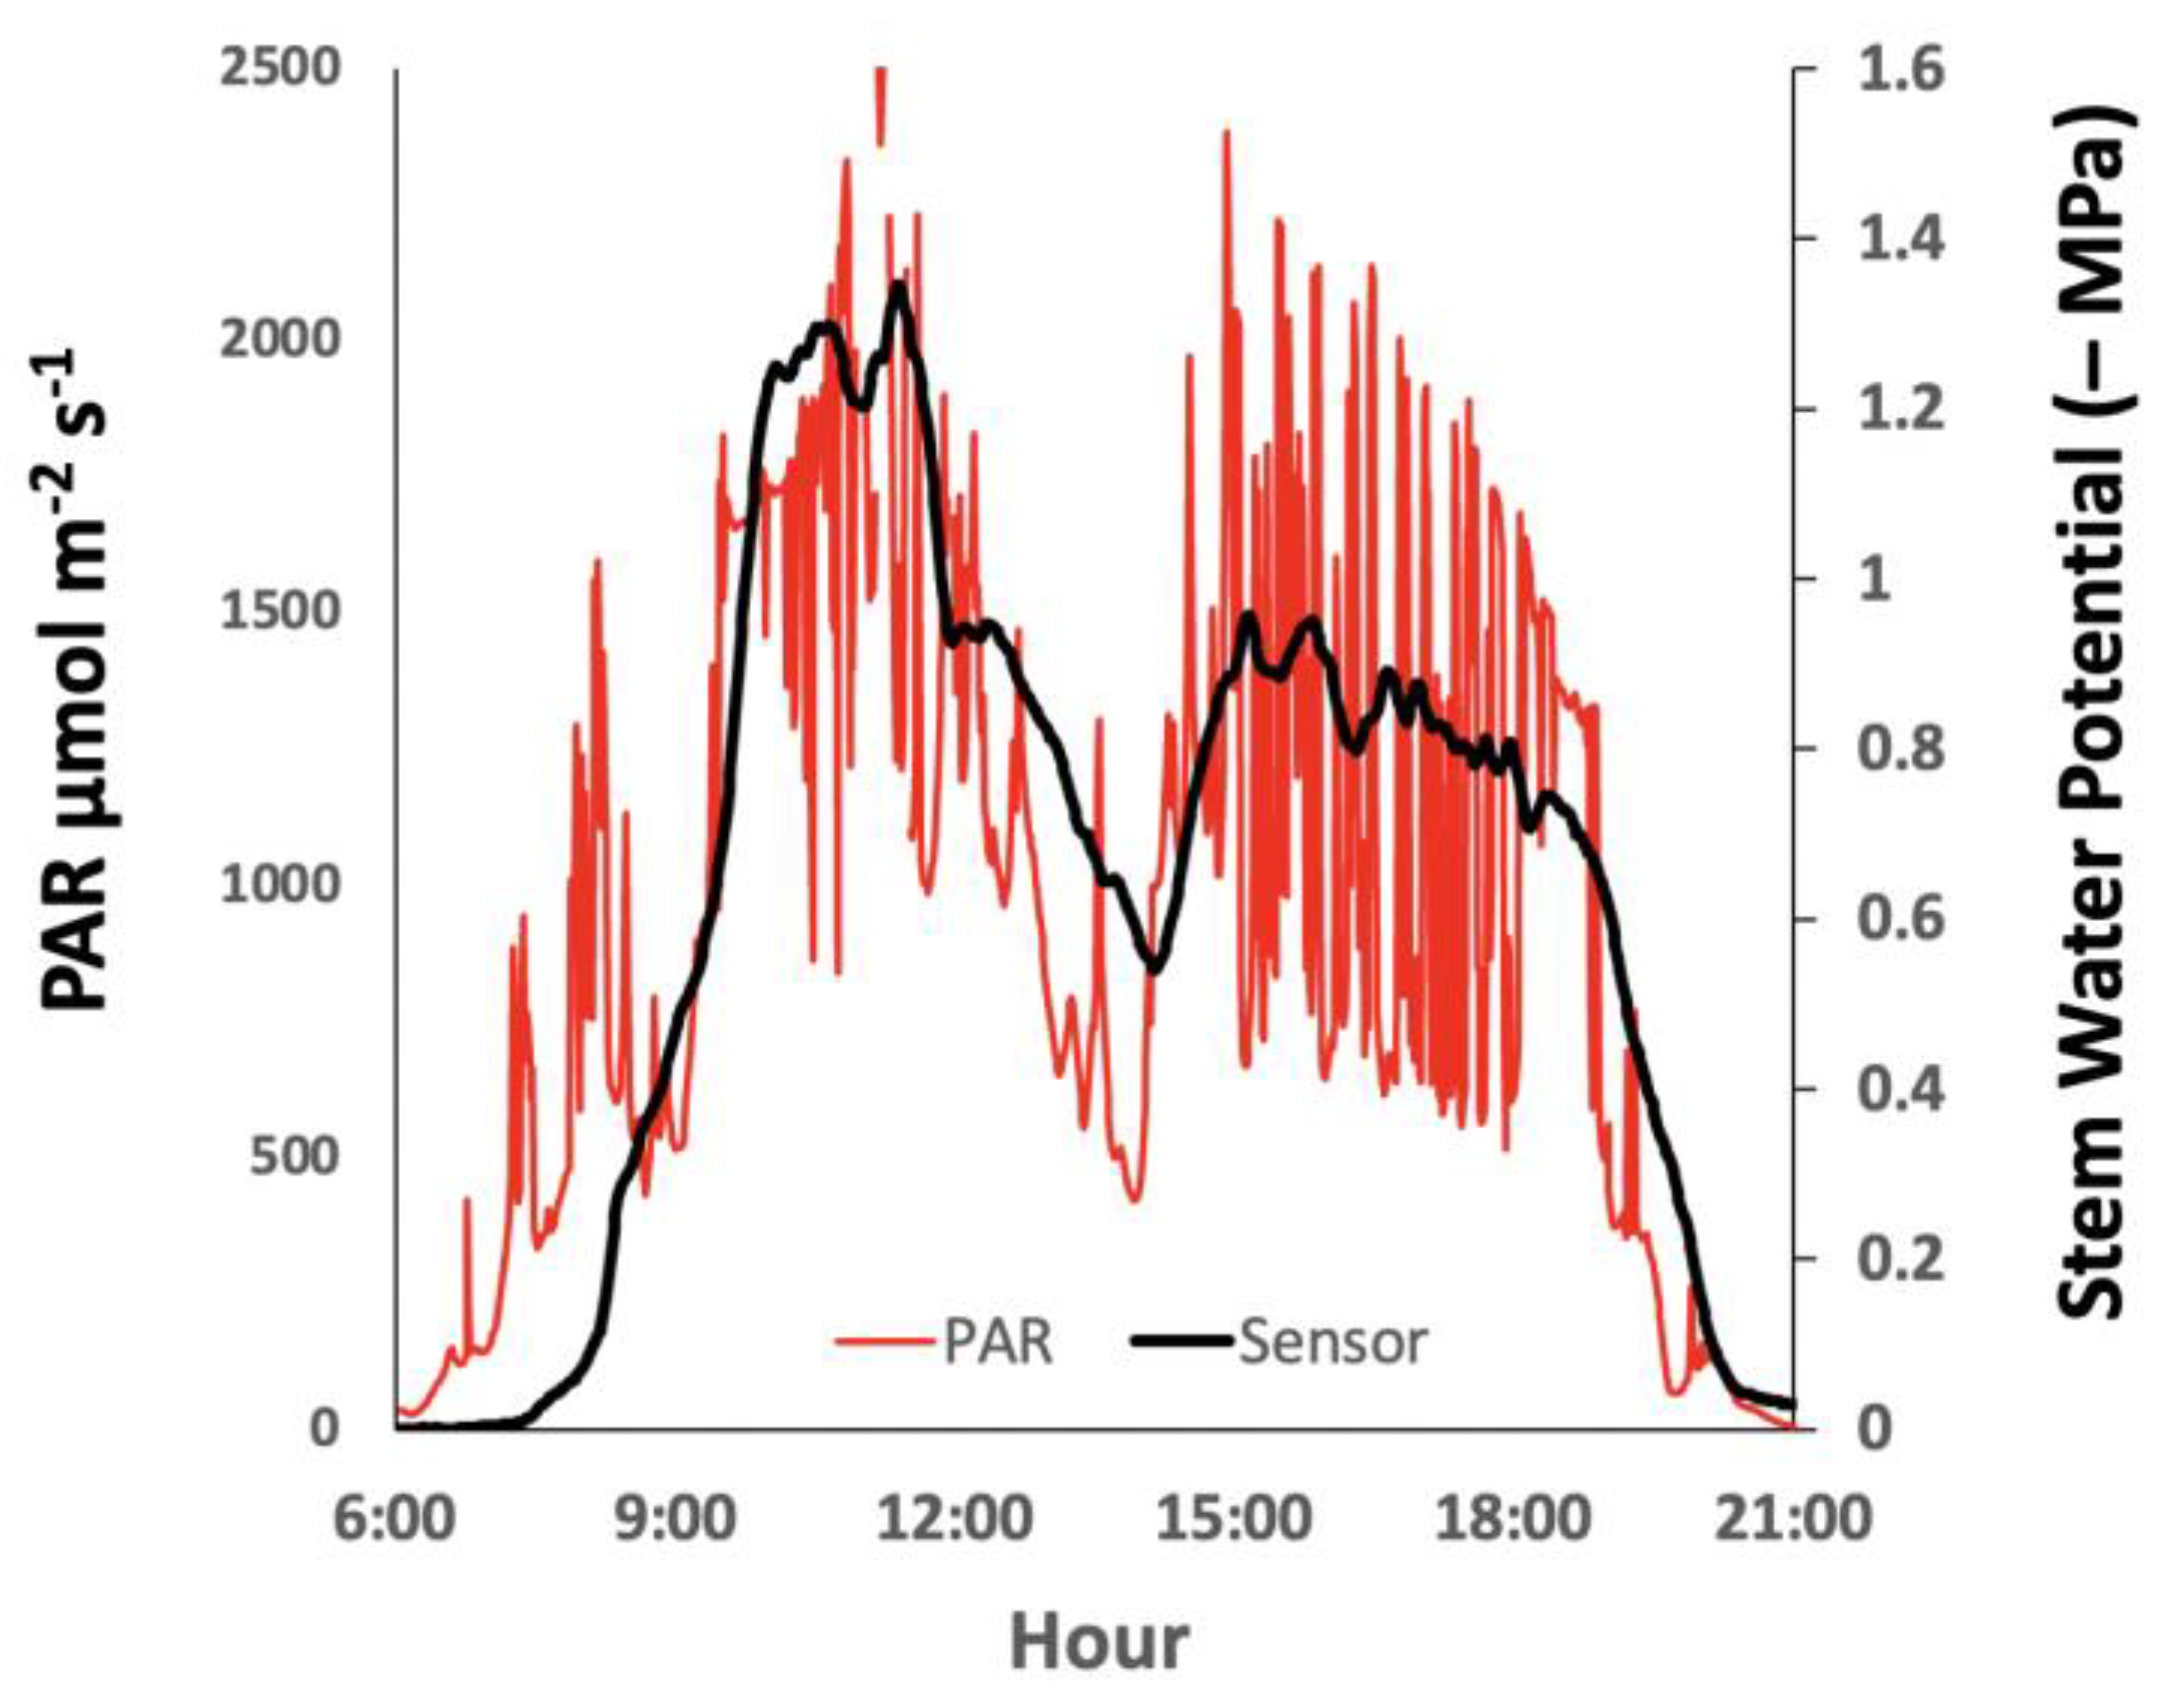
Field Testing - The daily pattern of stem potential variations, diurnally and with different weather, measured with the microtensiometer are demonstrated in Figure 4. In this example, in an N–S oriented orchard, the diurnal minima were typically found at about 16:00 h. The sensor does show somewhat of a lag, discussed below, buffering out rapid changes in radiation (Figure 5). In that study, we found that stem potentials conducted on bagged leaves with the SPC were able to respond somewhat faster. Nonetheless, greater time sensitivity is not needed for using continuous data to guide irrigation.
An example of long-term monitoring and differential irrigation is shown in Figure 6 where seasonal trends are seen in a wine grape vineyard trial in California, with two deficit irrigation regimes that allowed stress to begin early or mid-season. If a grower has an ideal seasonal stress pattern, this allows precise monitoring to be able to attain their goal.
The microtensiometer has been tested in many field trials with a range of fruit and nut species in arid zones. In general, the results have been most consistently accurate in apple and almond plants that have quite a uniform xylem in the stems, with many small vessels. Though we have less experience with other stone fruits such as cherry and plum, the results have been very good with these species (data not shown). Results have been less consistent with grapevines. Walnuts have been a major challenge as any drilling into the trunk leads to excessive liquid exudation, even though SPC measurements show expected xylem tensions. Preliminary results with citrus, avocado, hazelnut, blueberry and kiwi have shown promise but need further trials.

4. Discussion

Interpreting Results. -Although the microtensiometer can provide data every minute if desired, we currently only have significant experience from pressure chambers in relating water potentials to plant response at two times diurnally—pre-dawn at the time of minimal transpiration and stress, and at mid-day around the time of maximal stress.
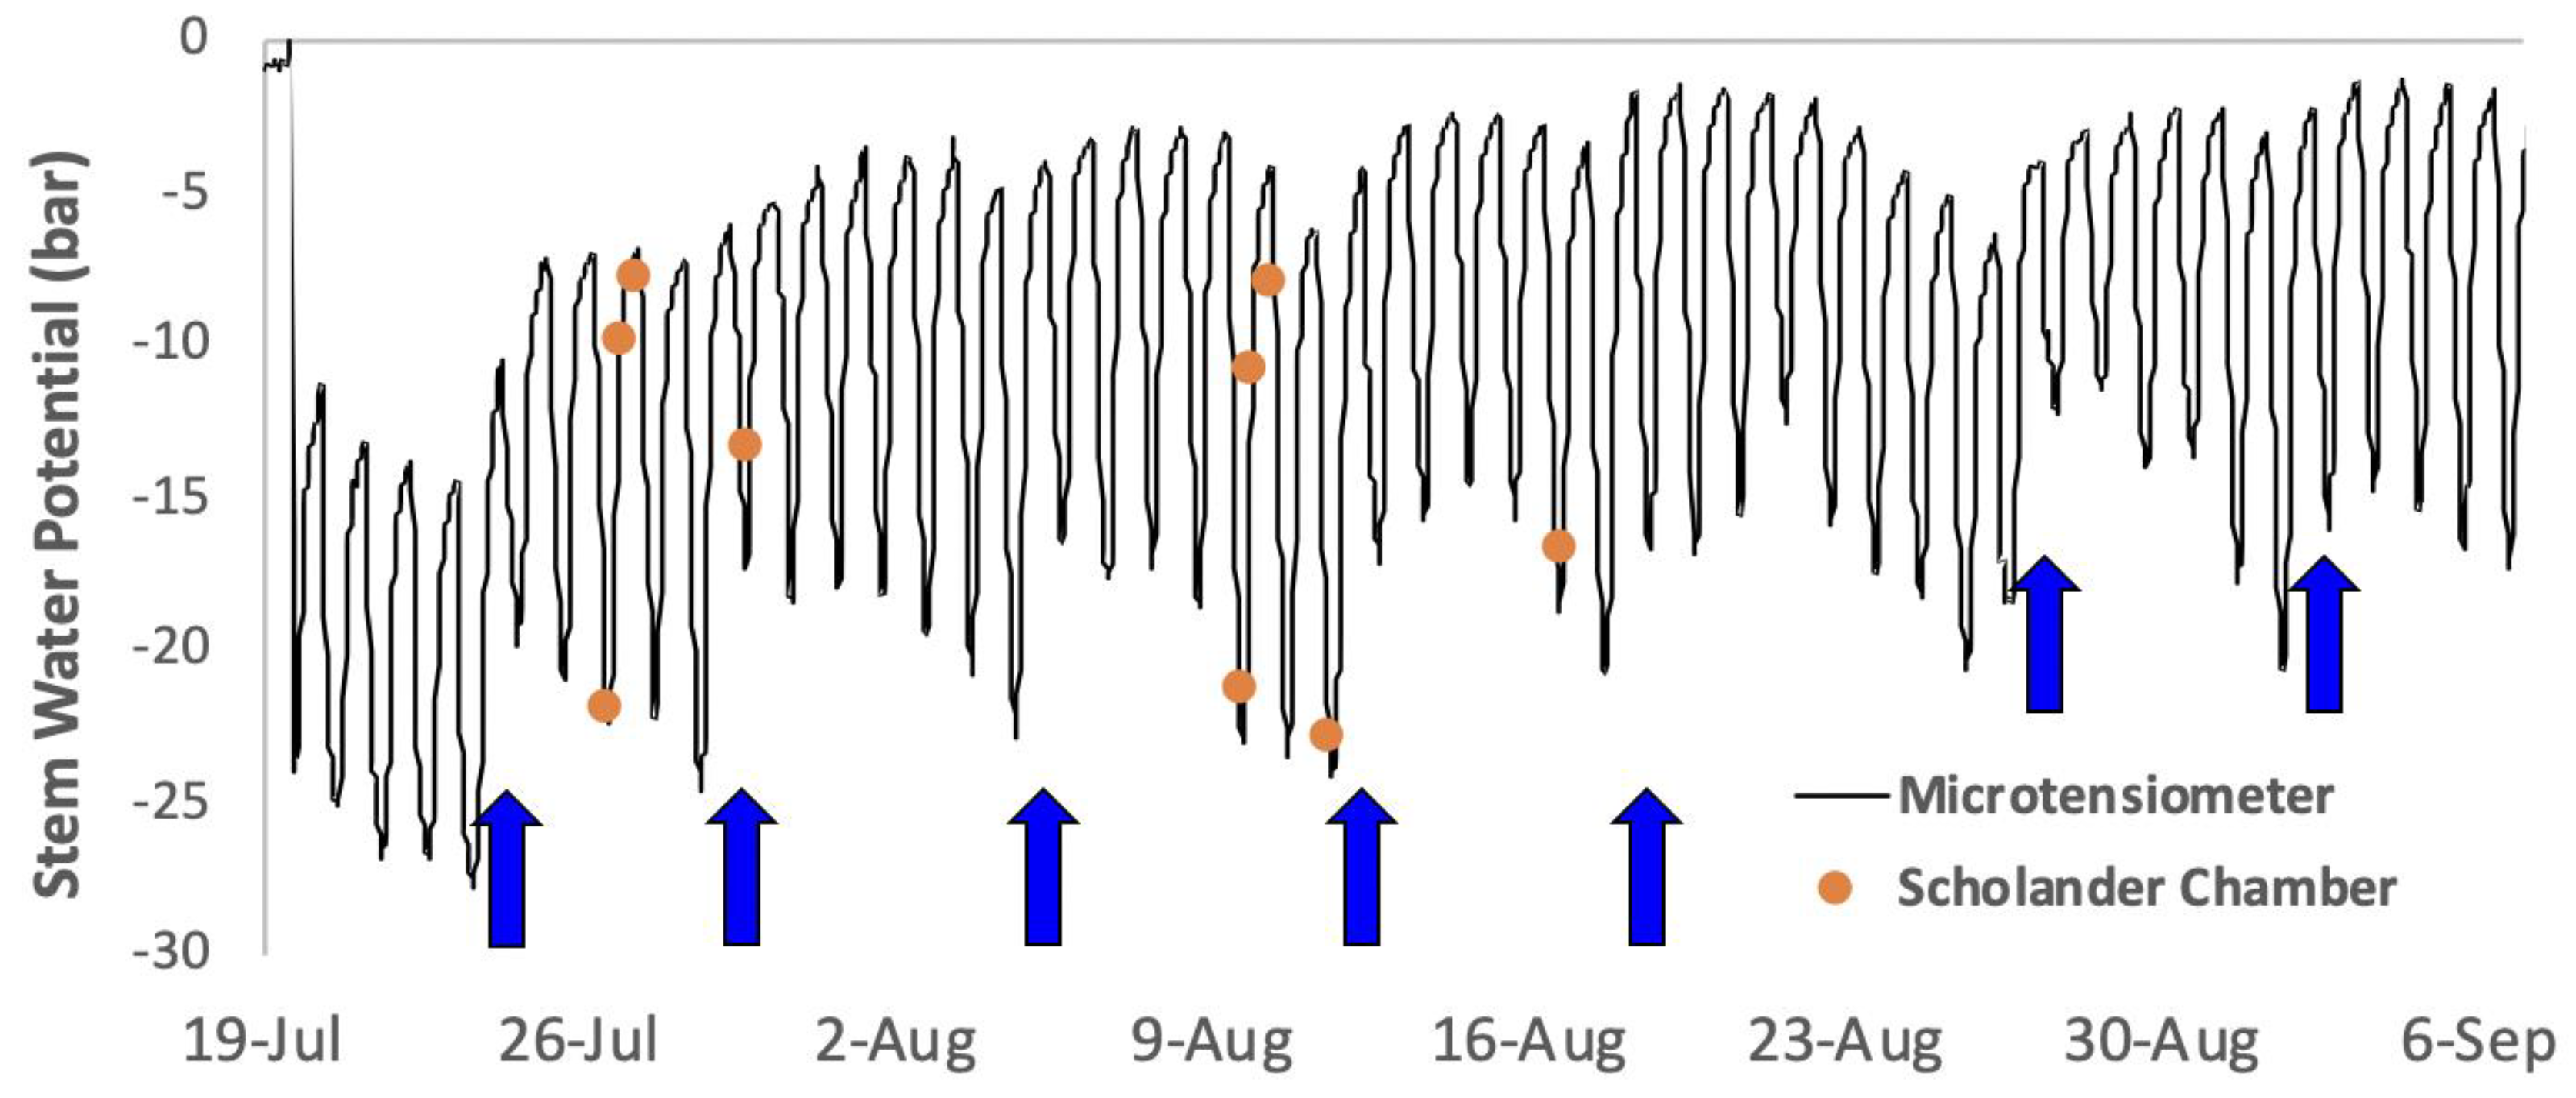
The pre-dawn values are interpreted as the root zone water potential with the whole plant acting as a soil tensiometer if there is no transpirative flux, an assumption that may not be safe [50]. In this example (Figure 7), note that in July not only were the mid-day stem potentials quite low, but the pre-dawn stem potentials were also low indicating significant soil moisture deficit. After irrigation, both pre-dawn and mid-day values increased, but the pre-dawn values were still not as high as desired. A shorter interval before the next irrigation was able to restore the pre-dawn values to, basically, well-watered soil levels. This is the type of real-time information that can provide guidance to optimize irrigation.
Since perennial plants such as fruit crops have large and deep root systems, direct measurement of the plant water potentials is considered preferable to soil moisture probes where positioning the probes is problematic. In arid regions where water is primarily available in the drip zone, roots often concentrate. However, in humid regions root growth may occur anywhere the soil water, nutrients, oxygen and bulk density allow. As shown by Ameglio et al. [51], in heterogeneous soils, small sources of water may be able to rehydrate the plant pre-dawn indicating good soil water availability, but under high evaporative demands during mid-day those small volumes may not be able to sustain normal transpiration fluxes. So, it is best to interpret the minimal stress values around dawn as reflecting the wettest soil in the root zone.
Since the greatest dry matter production and largest amounts of water use occur around mid-day, the water potentials at that time are critical to growth and productivity. Mid-day minimum stem potential values integrate the soil potential limitations, the evaporative demand, and other factors that may affect gas exchange and stomatal opening, complicating interpretation. To help differentiate these effects, a baseline water potential has been defined as the mid-day stem water potential that would be expected for plants with non-limiting soil moisture, with an adjustment for the evaporative demand due to vapor pressure deficit (VPD) [36,52]. If the measured stem potential is more negative than the baseline after adjusting for VPD, that indicates that soil water has become limited to some extent, and irrigation may be needed. It should be noted that this approach is only based on VPD response and assumes sunny conditions, which may not be the case on cloudy days in humid climates.
Sources of Variation or Error—The term “error” implies that there is a true accurate measurement for comparison. As mentioned above, the SPC is the standard, though due to variations in operator procedures and variation within a tree, a single SPC measurement cannot be called truly accurate. So, we will use the term variation except for in controlled tests of the sensor chips. After many refinements in the micro-electro-mechanical systems (MEMS) manufacture and testing to eliminate those chips that do not meet specifications, we find that the inherent sensor error under controlled testing is quite small compared to other sources of error. The sensor time constant (tau—the time to reach about 63% of the total response to a stepwise change in potential) is less than 15 min for the sensor itself. The tau of the entire sensor, mating paste and plant tissue is difficult to determine and likely varies with each species—and perhaps plant—possibly due to a response of stem capacitance to changes in stem potential or tissue transmission of water potentials, though that is not clear. However, observations of the response of the sensor to rapid changes in solar radiation and the close correlation to the SPC indicate that the tau is fast enough to respond adequately for irrigation management or most water stress research (Figure 5). Such rapid changes are likely not very significant to the integrated processes of growth or daily dry matter production. Field measurements in apple trees during rapid changes in radiation found that pressure chamber measurements on leaves could respond within 1–2 min. Consequently, the stem microtensiometer lags somewhat behind pressure chamber values. This has been seen also during rapid changes in the morning or evening, but we find very good correlations with pre-dawn minimal and late afternoon maximal stress values which are the key values for irrigation management as mentioned above.
Clearly, variation in the installers’ choice of stem or branch location, and condition and consistency of the installation method (sleeve insertion, precision drilling of the hole to the xylem, insertion of enough mating compound, etc.) is a potential source of variation especially if the process is new to the installer. Variation of the plant stem anatomy appears to be another source of variation, as we have generally found that fine uniform wood, as in apple, gives the most consistently good installations. Besides variable stem structure, grapevines also have large vessels in variable arrangements which may lead to single and chains of embolisms of the very large vessels [23,53] that may disrupt the hydraulic interface with the sensor. Finally, the plant response to sensor installation and longer-term growth or wound response appears to be the major source of variation or error. Walnut is especially difficult due to excessive exudation from the xylem, presumably parenchyma, after drilling, even though leaf pressure chamber readings show expected xylem tensions. The apparent co-existence of significant negative and positive pressures in adjacent portions of the same tissue, likely in ray parenchyma, is not well understood. Since this type of internal water potential sensor has never been used before, and fruit crop stem structure variation and wounding responses rarely examined, extensive empirical testing of many species will be required to optimize sensor use in each species.
Correlation to the Pressure Chamber—The pressure chamber has been the standard field method, especially for stem potential more recently. The microtensiometer uses a different principle of measurement, but they both measure water potential. So, it is desirable for the two methods to be highly correlated to allow users to apply the prior knowledge and critical water potential values learned from previous research, and field experience to the newly available data stream. We and our collaborators have conducted many field calibrations between the pressure chamber and the microtensiometer, and found good to excellent correlations when the sensors are performing normally (Figure 8) and in pear [46].
However, there is good reason to question whether the microtensiometer and the SPC should give exactly the same values. The pressure chamber method uses leaves from different parts of the canopy which may induce variation in stem potentials, compared to the typical trunk location of the microtensiometer. In the case of apple trees, we have found that under high evaporative conditions the stem potential drops about 0.07 to 0.09 MPa per meter of vascular distance from the soil level [49] (Figure 9). We measured the variation in stem water potentials with the SPC in a narrow tall spindle ‘Gala’/M9 apple tree, 3 m tall, on two sunny days of mild temperature and VPD (upper line) and warmer and higher VPD (lower line), and found similar values of the slope of 0.08–0.09 MPa m−1. It should be noted that grapevines have much lower potential drops with vascular distance due to their large vessels, about 0.015 MPa per meter (data not shown), a negligible variation across a normal grapevine.
Additionally, there can be very significant variation in pressure chamber readings due to operator variation in the many subtle techniques of leaf selection, handling before pressurizing, protective enclosures, rate of pressurization and determining endpoints [35,54]. Levin et al. [55] concluded that operator variation affected potential readings more than any specific technique of the method, which supports the extensive experience of the senior author. Nonetheless, the correlations with the SPC indicate that prior experience can be applied to the microtensiometer data.

General Limitations of Plant Sensors

As with any direct plant sensor (microtensiometer, sap flow, dendrometry) the measurement is a measure on a given plant. So, due to cost and/or logistics there is generally quite limited spatial sampling which can be important in orchards and vineyards that are located on highly variable soils and topographies. The answer to the common question of “how many plants needed to be monitored?” is “it depends”. Spatial sampling requirements depend on spatial variation. The greater the spatial variation, the greater the need to integrate direct sampling at high frequency but low spatial resolution, with high spatial resolution methods correlated to water status. These may include aerial remote spectral sensing [56], soil mapping by electromagnetic sensing, or proximal sensing of plant characteristics such as spectral methods [57] or d13C sampling of grape must [58]. The integration of the different data can be via modeling, or identifying major soil or growth variations in the fields to guide placement of limited numbers of monitored plants.
Whatever methods are utilized, it is important to understand the principle of the method, what the underlying assumptions are in any situation (i.e., calm, full sun conditions or soils at field capacity may be required), and what are the conditions under which a method will not work. Many publications have presented results comparing an indirect method (soil or remote) to direct water status measurements, but too rarely do they discuss the limitations of the methods or conditions under which it would work better or worse. In many cases, the studies that do not give strong positive results are not published, the so-called “file drawer effect” [59] which may be understandable, but knowledge of when technologies will not work is very important when considering grower adoption.
For example, aerial remote sensing of the canopy temperature of grapevines will be more effective if the weather is often clear and sunny and the canopies are broad, in which the images include many large basal leaves. Large leaves in the sun heat up significantly with stomatal closure, which is the basis of the correlation to water stress. In contrast, in thin vertical canopies, the aerial image from directly above sees only the top of the narrow canopy. The leaves imaged are the best-ventilated small leaves that heat up much less than larger basal leaves on the lower side of the canopy that heat up the most [60]. In apple trees, the stomates in the field are very well coupled to the photosynthesis of the leaves [61]. This means that any factor not related to water that affects photosynthesis, such as mineral nutrition or crop load, will affect leaf temperature with no direct relation to water stress, and thus give artifacts in thermal estimation of water stress.
It is critical to have collaboration between engineers developing or testing technologies to estimate crop water status, and crop physiologists who understand the plant and management side of the relationship. If growers are to use new technologies, they need to understand both when they will work, and when they will not work. Again, the more direct and fundamental the measurement, the more general the usefulness will be.

5. Conclusions and New Opportunities

The microtensiometer for continuous monitoring of stem water potentials of fruit crops has demonstrated the potential to provide a much greater understanding of variations in the stem water potential that integrates aerial and soil environment, as well as the physiology and management of fruit crops. Such data also improve the ability to determine if water management practices, whether by irrigation or crop management (pruning, training, weed management), actually reach the desired level of stress for optimal performance, however that is defined.
The ability to obtain season-long diurnal data, especially in conjunction with fruit expansion data, also opens new opportunities to use such detailed knowledge of water relations and plant responses to understand, model, and bench-mark other methods and guide irrigation. Perhaps there will be more precise times of the day to irrigate for different purposes, such as supporting or controlling vegetative growth versus fruit growth [62,63,64]. Integrals of predawn or mid-day water potentials over long periods in the season have been found to be well correlated to plant physiology [65], but these are currently labor-intensive with the pressure chamber, and necessarily limited to several days of measurement, especially in variable weather. However, are there other times during the day in which integrals are better related to fruit or vegetative development? The richness of such continuous data streams offers many opportunities to better understand water relations, support integrative modeling, improve water management, help document appropriate water usage, and contribute to the sustainability of a limited natural resource.

Author Contributions

Conceptualization, A.N.L.; methodology, M.S., A.N.L. and A.D.S.; investigation, M.S., A.N.L. and A.D.S.; resources, M.S.; data curation, M.S. and A.N.L.; writing—original draft preparation, A.N.L.; writing—review and editing, M.S., A.N.L. and A.D.S.; supervision, M.S.; visualization, A.N.L.; project administration, M.S., A.N.L. and A.D.S.; funding acquisition, M.S. and A.D.S. All authors have read and agreed to the published version of the manuscript.

Funding

We gratefully acknowledge that this research was funded by USDA—Small Business Innovation Research (SBIR) grants number 2017-33610-26741 and 2018-33610-28825, and by the US National Science Foundation—SBIR grant number 2026205.

Data Availability Statement

Original data available upon request to corresponding author.

Acknowledgments

We would like to acknowledge Ken Shackel for testing collaboration and sharing technical expertise, Richard Piccioni for technical assistance, and Nick Dokoozlian and Luis Sanchez of Gallo Winery for sharing data from their sensor testing. The authors thank the journal reviewers for their constructive reviews that improved the paper.

Conflicts of Interest

The authors conducted initial research on the microtensiometer at Cornell University. A Lakso is Professor Emeritus, and A. Stroock is Professor at Cornell. All authors are co-inventors of a Cornell patent, co-founders and Directors of FloraPulse Company that has licensed the relevant patent from Cornell University and developed the commercial sensor system. The funders had no role in the design of the study; in the collection, analyses, or interpretation of data; in the writing of the manuscript; or in the decision to publish the results.

References

  1. Fereres, E.; Goldhamer, D.A. Deciduous fruit and nut trees. In Irrigation of Agricultural Crops; Stewart, B.A., Nielsen, D.R., Eds.; ASA-CSSA-SSSA: Madison, WI, USA, 1990; pp. 987–1017. [Google Scholar]
  2. Williams, L.E.; Matthews, M.A. Grapevine. In Irrigation of Agricultural Crops; Stewart, B.A., Nielsen, D.R., Eds.; ASA-CSSA-SSSA: Madison, WI, USA, 1990; pp. 1019–1055. [Google Scholar]
  3. Lakso, A.N. Water relations of apples. In Apples, Botany, Production and Uses; Ferree, D.C., Warrington, I.A., Eds.; CAB International: Wallingford, UK, 2003; pp. 167–194. [Google Scholar] [CrossRef]
  4. Powell, D.B.B. Some effects of water stress on the growth and development of apple trees. J. Hortic. Sci. 1976, 51, 75–90. [Google Scholar] [CrossRef]
  5. Guilpart, N.; Roux, S.; Gary, C.; Metay, A. The trade-off between grape yield and grapevine susceptibility to powdery mildew and grey mould depends on inter-annual variations in water stress. Agric. Forest Meteorol. 2017, 234, 203–211. [Google Scholar] [CrossRef]
  6. Atkinson, D. The distribution and effectiveness of the roots of tree crops. Hortic. Rev. 1980, 2, 424–490. [Google Scholar]
  7. Smart, D.R.; Schwass, E.; Shaulis, N.J.; Lakso, A.N.; Morano, L. Grapevine rooting patterns: A comprehensive analysis and a review. Amer. J. Enol. Vitic. 2006, 57, 89–104. [Google Scholar] [CrossRef]
  8. Reynolds, A.G.; Vanden Heuvel, J.E. Influence of grapevine training systems on vine growth and fruit composition: A review. Amer. J. Enol. Vitic. 2009, 60, 251–268. [Google Scholar] [CrossRef]
  9. Musacchi, S.; Greene, D. Innovations in apple tree cultivation to manage crop load and ripening. In Achieving Sustainable Cultivation of Apples; Evans, K., Ed.; Burleigh Dodds Science Publ.: Cambridge, UK, 2017; pp. 195–237. [Google Scholar] [CrossRef]
  10. Fazio, G. Genetics, Breeding, and Genomics of Apple Rootstocks. In The Apple Genome; Korban, S.S., Ed.; Compendium of Plant Genomes; Springer: Cham, Switzerland, 2021; pp. 105–130. [Google Scholar] [CrossRef]
  11. Naor, A. Irrigation scheduling and evaluation of tree water status in deciduous orchards. Hortic. Rev. 2006, 32, 111–165. [Google Scholar] [CrossRef]
  12. Jones, H.G.; Lakso, A.N.; Syvertsen, J.P. Physiological control of water status in Temperate and subtropical fruit trees. Hortic. Rev. 1985, 7, 301–344. [Google Scholar]
  13. Jones, H.G. Plants and Microclimate—A Quantitative Approach to Environmental Plant Physiology, 3rd ed.; Cambridge Univ. Press: Cambridge, UK, 2014. [Google Scholar]
  14. Lakso, A.N.; Intrigliolo, D.S. Plant-based sensing for irrigation management in the field. Acta Hortic. 2022, 1335, 247–262. [Google Scholar] [CrossRef]
  15. Scholasch, T. Improving winegrowing with sap flow driven irrigation—A 10-year review. Acta Hortic. 2018, 1222, 155–168. [Google Scholar] [CrossRef]
  16. Vandegehuchte, M.W.; Steppe, K. Sap-flux density measurement methods: Working principles and applicability. Funct. Plant Biol. 2013, 40, 213–223. [Google Scholar] [CrossRef]
  17. McElrone, A.J.; Shapland, T.M.; Calderon, A.; Fitzmaurice, L.; Paw, U.K.T.; Snyder, R.L. Surface Renewal: An advanced micrometeorological method for measuring and processing field-scale energy flux density data. J. Visualized Exp. 2013, 82, e50666. [Google Scholar] [CrossRef] [PubMed] [Green Version]
  18. Tule Technologies Website. Available online: https://tule.ag/ (accessed on 17 October 2022).
  19. Basile, B.; Girona, J.; Behboudian, M.H.; Mata, M.; Rosello, J.; Ferre, M.; Marsal, J. Responses of “Chardonnay” to deficit irrigation applied at different phenological stages: Vine growth, must composition, and wine quality. Irrig. Sci. 2012, 30, 397–406. [Google Scholar] [CrossRef]
  20. López-López, M.; Espadafor, M.; Testi, L.; Lorite, I.J.; Orgaz, F.; Fereres, E. Water use of irrigated almond trees when subjected to water deficits. Agric. Water Manage 2018, 195, 84–93. [Google Scholar] [CrossRef]
  21. Galindo, A.; Collado-González, J.; Griñán, I.; Corell, M.; Centeno, A.; Martín-Palomo, M.J.; Girón, I.F.; Rodríguez, P.; Cruz, Z.N.; Memmi, H.; et al. Deficit irrigation and emerging fruit crops as a strategy to save water in Mediterranean semiarid agrosystems. Agric. Water Manag. 2018, 202, 311–324. [Google Scholar] [CrossRef]
  22. Scholasch, T.; Rienth, M. Review of water deficit mediated changes in vine and berry physiology; Consequences for the optimization of irrigation strategies. Oeno One 2019, 3, 423–444. [Google Scholar] [CrossRef]
  23. Gambetta, G.A.; Herrera, J.C.; Dayer, S.; Feng, Q.; Hochberg, U.; Castellarin, S.D. The physiology of drought stress in grapevine: Towards an integrative definition of drought tolerance. J. Exper. Bot. 2020, 71, 4658–4676. [Google Scholar] [CrossRef]
  24. Lakso, A.N.; Corelli Grappadelli, L.; Barnard, J.; Goffinet, M.C. An expolinear model of the growth pattern of the apple fruit. J. Hortic. Sci. 1995, 70, 389–394. [Google Scholar] [CrossRef]
  25. Famiani, F.; Bonghi, C.; Chen, Z.-H.; Drincovich, M.F.; Farinelli, D.; Lara, M.V.; Proietti, S.; Rosati, A.; Vizzotto, G.; Walker, R.P. Stone fruits: Growth and nitrogen and organic acid metabolism in the fruits and seeds—A review. Front. Plant Sci. 2020, 11, 572601. [Google Scholar] [CrossRef]
  26. van Leeuwen, C.; Barbe, J.-C.; Darriet, P.; Geffroy, O.; Gomès, E.; Guillaumie, S.; Helwi, P.; Laboyrie, J.; Lytra, G.; Le Menn, N.; et al. Recent advancements in understanding the terroir effect on aromas in grapes and wines. Oeno One 2020, 4, 985–1006. [Google Scholar] [CrossRef]
  27. Rienth, M.; Vigneron, N.; Darriet, P.; Sweetman, C.; Burbidge, C.; Bonghi, C.; Walker, R.P.; Famiani, F.; Castellarin, S.D. Grape berry secondary metabolites and their modulation by abiotic factors in a climate change scenario—A review. Front. Plant Sci. 2021, 12, 643258. [Google Scholar] [CrossRef]
  28. Baram, S.; Couvreur, V.; Harter, T.; Read, M.; Brown, P.H.; Hopmans, J.W.; Smart, D.R. Assessment of orchard N losses to groundwater with a vadose zone monitoring network. Agric. Water Man. 2016, 172, 83–95. [Google Scholar] [CrossRef]
  29. Gautam, D.; Pagay, V. A Review of current and potential applications of remote sensing to study the water status of horticultural crops. Agronomy 2020, 10, 140. [Google Scholar] [CrossRef] [Green Version]
  30. Tosin, R.; Martins, R.; Pocas, I.; Cunha, M. Canopy VIS-NIR spectroscopy and self-learning artificial intelligence for a generalised model of predawn leaf water potential in Vitis vinifera. Biosyst. Engineering 2022, 219, 235–258. [Google Scholar] [CrossRef]
  31. Girón, I.F.; Corell, M.; Martín-Palomo, M.J.; Galindo, A.; Torrecillas, A.; Moreno, F.; Moriana, A. Limitations and usefulness of maximum daily shrinkage (MDS) and trunk growth rate (TGR) indicators in the irrigation scheduling of table olive trees. Agric. Water Manage. 2016, 164, 38–45. [Google Scholar] [CrossRef] [Green Version]
  32. Scalisi, A.; Bresilla, K.; Simões Grilo, F. Continuous determination of fruit tree water-status by plant-based sensors. Italus Hortus 2017, 24, 39–50. [Google Scholar] [CrossRef]
  33. Scholander, P.F.; Hammel, H.T.; Hemingsen, E.A.; Bradstreet, E.D. Hydrostatic pressure and osmotic potential of leaves of mangrove and some other plants. Proc. Natl. Acad. Sci. USA 1964, 52, 119. [Google Scholar] [CrossRef] [Green Version]
  34. Scholander, P.F.; Hammel, H.T.; Bradstreet, E.D.; Hemmingsen, E.A. Sap pressure in vascular plants. Science 1965, 148, 339. [Google Scholar] [CrossRef]
  35. Turner, N.C. Measurement of plant water status by the pressure chamber technique. Irrig. Sci. 1988, 9, 289–308. [Google Scholar] [CrossRef]
  36. Shackel, K. A plant-based approach to deficit irrigation in trees and vines. HortScience 2011, 46, 173–177. [Google Scholar] [CrossRef]
  37. Patakas, A.; Noitsakis, B.; Chouzouri, A. Optimisation of irrigation water use in grapevines using the relationship between transpiration and plant water status. Agric. Ecosyst. Environ. 2005, 106, 253–259. [Google Scholar] [CrossRef]
  38. Naor, A. Midday stem water potential as a plant water stress indicator for irrigation scheduling in fruit trees. Acta Hortic. 2000, 537, 447–454. [Google Scholar] [CrossRef]
  39. Chone, X.; Van Leeuwen, C.; Dubordieu, D.; Gaudillere, J.P. Stem water potential is a sensitive integrator of grapevine water status. Ann. Botany 2001, 87, 477–483. [Google Scholar] [CrossRef] [Green Version]
  40. van Leeuwen, C.; Pieri, P.; Vivin, P. Comparison of three operational tools for the assessment of vine water status, stem water potential, carbon isotope discrimination measured on grape sugar and water balance. In Methodologies and Results in Grapevine Research; Delrot, S., Medrano, H., Or, E., Bavaresco, L., Grando, S., Eds.; Springer: Dordrecht, The Netherlands, 2010; pp. 87–106. [Google Scholar] [CrossRef]
  41. Santesteban, L.G.; Miranda, C.; Marín, D.; Sesma, B.; Intrigliolo, D.S.; Mirás-Avalos, J.M.; Escalona, J.M.; Montoro, A.; de Herralde, F.; Baeza, P.; et al. Discrimination ability of leaf and stem water potential at different times of the day through a meta-analysis in grapevine (Vitis vinifera L.). Agric. Water Manag. 2019, 221, 202–210. [Google Scholar] [CrossRef]
  42. Tian, T.; Schreiner, R.P. Appropriate time to measure leaf and stem water potential in north-south oriented, vertically shoot-positioned vineyards. Amer. J. Enol. Vitic. 2021, 72, 64–72. [Google Scholar] [CrossRef]
  43. Fernández, J.E. Plant-based sensing to monitor water stress, applicability to commercial orchards. Agric. Water Manage. 2014, 142, 99–109. [Google Scholar] [CrossRef] [Green Version]
  44. Pagay, V.; Santiago, M.; Sessoms, D.A.; Huber, E.J.; Vincent, O.; Pharkya, A.; Corso, T.N.; Lakso, A.N.; Stroock, A.D. A microtensiometer capable of measuring water potentials below -10 MPa. Lab on a Chip 2014, 14, 2806–2817. [Google Scholar] [CrossRef]
  45. Black, W.L.; Santiago, M.; Zhu, S.; Stroock, A.D. Ex situ and in situ measurement of water activity with a mems tensiometer. Analytical Chem. 2019, 92, 716–723. [Google Scholar] [CrossRef]
  46. Blanco, V.; Kalcsits, L. Microtensiometers accurately measure stem water potential in woody perennials. Plants 2021, 10, 2780. [Google Scholar] [CrossRef]
  47. Lakso, A.N.; Zhu, S.; Santiago, S.; Shackel, K.; Volkov, V.; Stroock, A.D. A microtensiometer sensor to continuously monitor stem water potentials in woody plants - design and field testing. Acta Hortic. 2022, 1335, 317–324. [Google Scholar] [CrossRef]
  48. Pagay, V. Evaluating a novel microtensiometer for continuous trunk water potential measurements in field-grown irrigated grapevines. Irrig. Sci. 2022, 40, 45–54. [Google Scholar] [CrossRef]
  49. Olien, W.C.; Lakso, A.N. Effect of rootstock on apple (Malus domestica) tree water relations. Physiol. Plant. 1986, 67, 421–430. [Google Scholar] [CrossRef]
  50. Forster, M.A. How significant is nocturnal sap flow? Tree Physiol. 2014, 34, 757–765. [Google Scholar] [CrossRef] [PubMed] [Green Version]
  51. Ameglio, T.; Archer, P.; Cohen, M.; Valancogne, C.; Daudet, F.-A.; Dayau, S.; Cruiziat, P. Significance and limits in the use of predawn leaf water potential for tree irrigation. Plant Soil 1999, 207, 155–167. [Google Scholar] [CrossRef]
  52. Shackel, K.; Moriana, A.; Marino, G.; Corell, M.; Pérez-López, D.; Martin-Palomo, M.J.; Caruso, T.; Marra, F.P.; Agüero Alcaras, L.M.; Milliron, L.; et al. Establishing a reference baseline for midday stem water potential in olive and its use for plant-based irrigation management. Front. Plant Sci. 2021, 12, 791711. [Google Scholar] [CrossRef] [PubMed]
  53. Brodersen, C.R.; McElrone, A.J.; Choat, B.; Lee, E.F.; Shackel, K.A.; Matthews, M.A. In vivo visualizations of drought-induced embolism spread in Vitis vinifera. Plant Physiol. 2013, 161, 1820–1829. [Google Scholar] [CrossRef] [PubMed] [Green Version]
  54. Landsberg, J.J.; Beadle, C.L.; Biscoe, P.V.; Butler, D.R.; Davidson, B.; Incoll, L.D.; James, D.B.; Jarvis, P.G.; Martin, P.J.; Neilson, R.E.; et al. Diurnal energy, water and CO2 exchanges in an apple (Malus pumila) orchard. J. Appl. Ecol. 1975, 12, 659–684. [Google Scholar] [CrossRef]
  55. Levin, A.D. Re-evaluating pressure chamber methods of water status determination in field-grown grapevine (Vitis spp.). Agric. Water Manag. 2019, 221, 422–429. [Google Scholar] [CrossRef]
  56. Damm, A.; Paul-Limoges, E.; Haghighi, E.; Simmer, C.; Morsdorf, F.; Schneider, F.D.; van der Tol, C.; Migliavacca, M.; Rascher, U. Remote sensing of plant-water relations: An overview and future perspectives. J. Plant Physiol. 2018, 227, 3–19. [Google Scholar] [CrossRef]
  57. Yu, R.; Zaccaria, D.; Kisekka, I.; Kurtural, S.K. Soil apparent electrical conductivity and must carbon isotope ratio provide indication of plant water status in wine grape vineyards. Prec. Agric. 2021, 22, 1333–1352. [Google Scholar] [CrossRef]
  58. Brillante, L.; Martínez-Lüscher, J.; Yu, R.; Kurtural, S.K. Carbon isotope discrimination (δ13C) of grape musts is a reliable tool for zoning and the physiological ground-truthing of sensor maps in precision viticulture. Front. Environ. Sci. 2020, 8, 561477. [Google Scholar] [CrossRef]
  59. Rosenthal, R. The “File Drawer Problem” and Tolerance for Null Results. Psychol. Bull. 1979, 86, 638–641. [Google Scholar] [CrossRef]
  60. Campbell, G.S.; Norman, J.M. An Introduction to Environmental Biophysics, 2nd ed.; Springer: New York, NY, USA, 1998; 286p. [Google Scholar]
  61. Lakso, A.N. Comparing water use efficiency of apples and grapes-physiological and morphological aspects. Acta Hortic. 2014, 1038, 67–72. [Google Scholar] [CrossRef]
  62. Torres-Ruiz, J.M.; Perulli, G.D.; Manfrini, L.; Zibordi, M.; Lopez Velasco, G.; Anconelli, S.; Pierpaoli, E.; Corelli Grappadelli, L.; Morandi, B. Time of irrigation affects vine water relations and the daily patterns of leaf gas exchanges and vascular flows to kiwifruit (Actinidia deliciosa Chev.). Agric. Water Manag. 2016, 166, 101–110. [Google Scholar] [CrossRef]
  63. Scalisi, A.; O’Connell, M.G.; Turpin, S.R.; Lo Bianco, R. Diurnal irrigation timing affects fruit growth in late-ripening nectarines. Acta Hortic. 2021, 1314, 61–68. [Google Scholar] [CrossRef]
  64. Lakso, A.N. Challenges to interpreting internal and external factors limiting apple fruit growth, set and abscission. Acta Hortic. 2022, 1342, 317–328. [Google Scholar] [CrossRef]
  65. Yu, R.; Brillante, L.; Torres, N.; Kurtural, S.K. Proximal sensing of vineyard soil and canopy vegetation for determining vineyard spatial variability in plant physiology and berry chemistry. Oeno One 2021, 55, 315–333. [Google Scholar] [CrossRef]
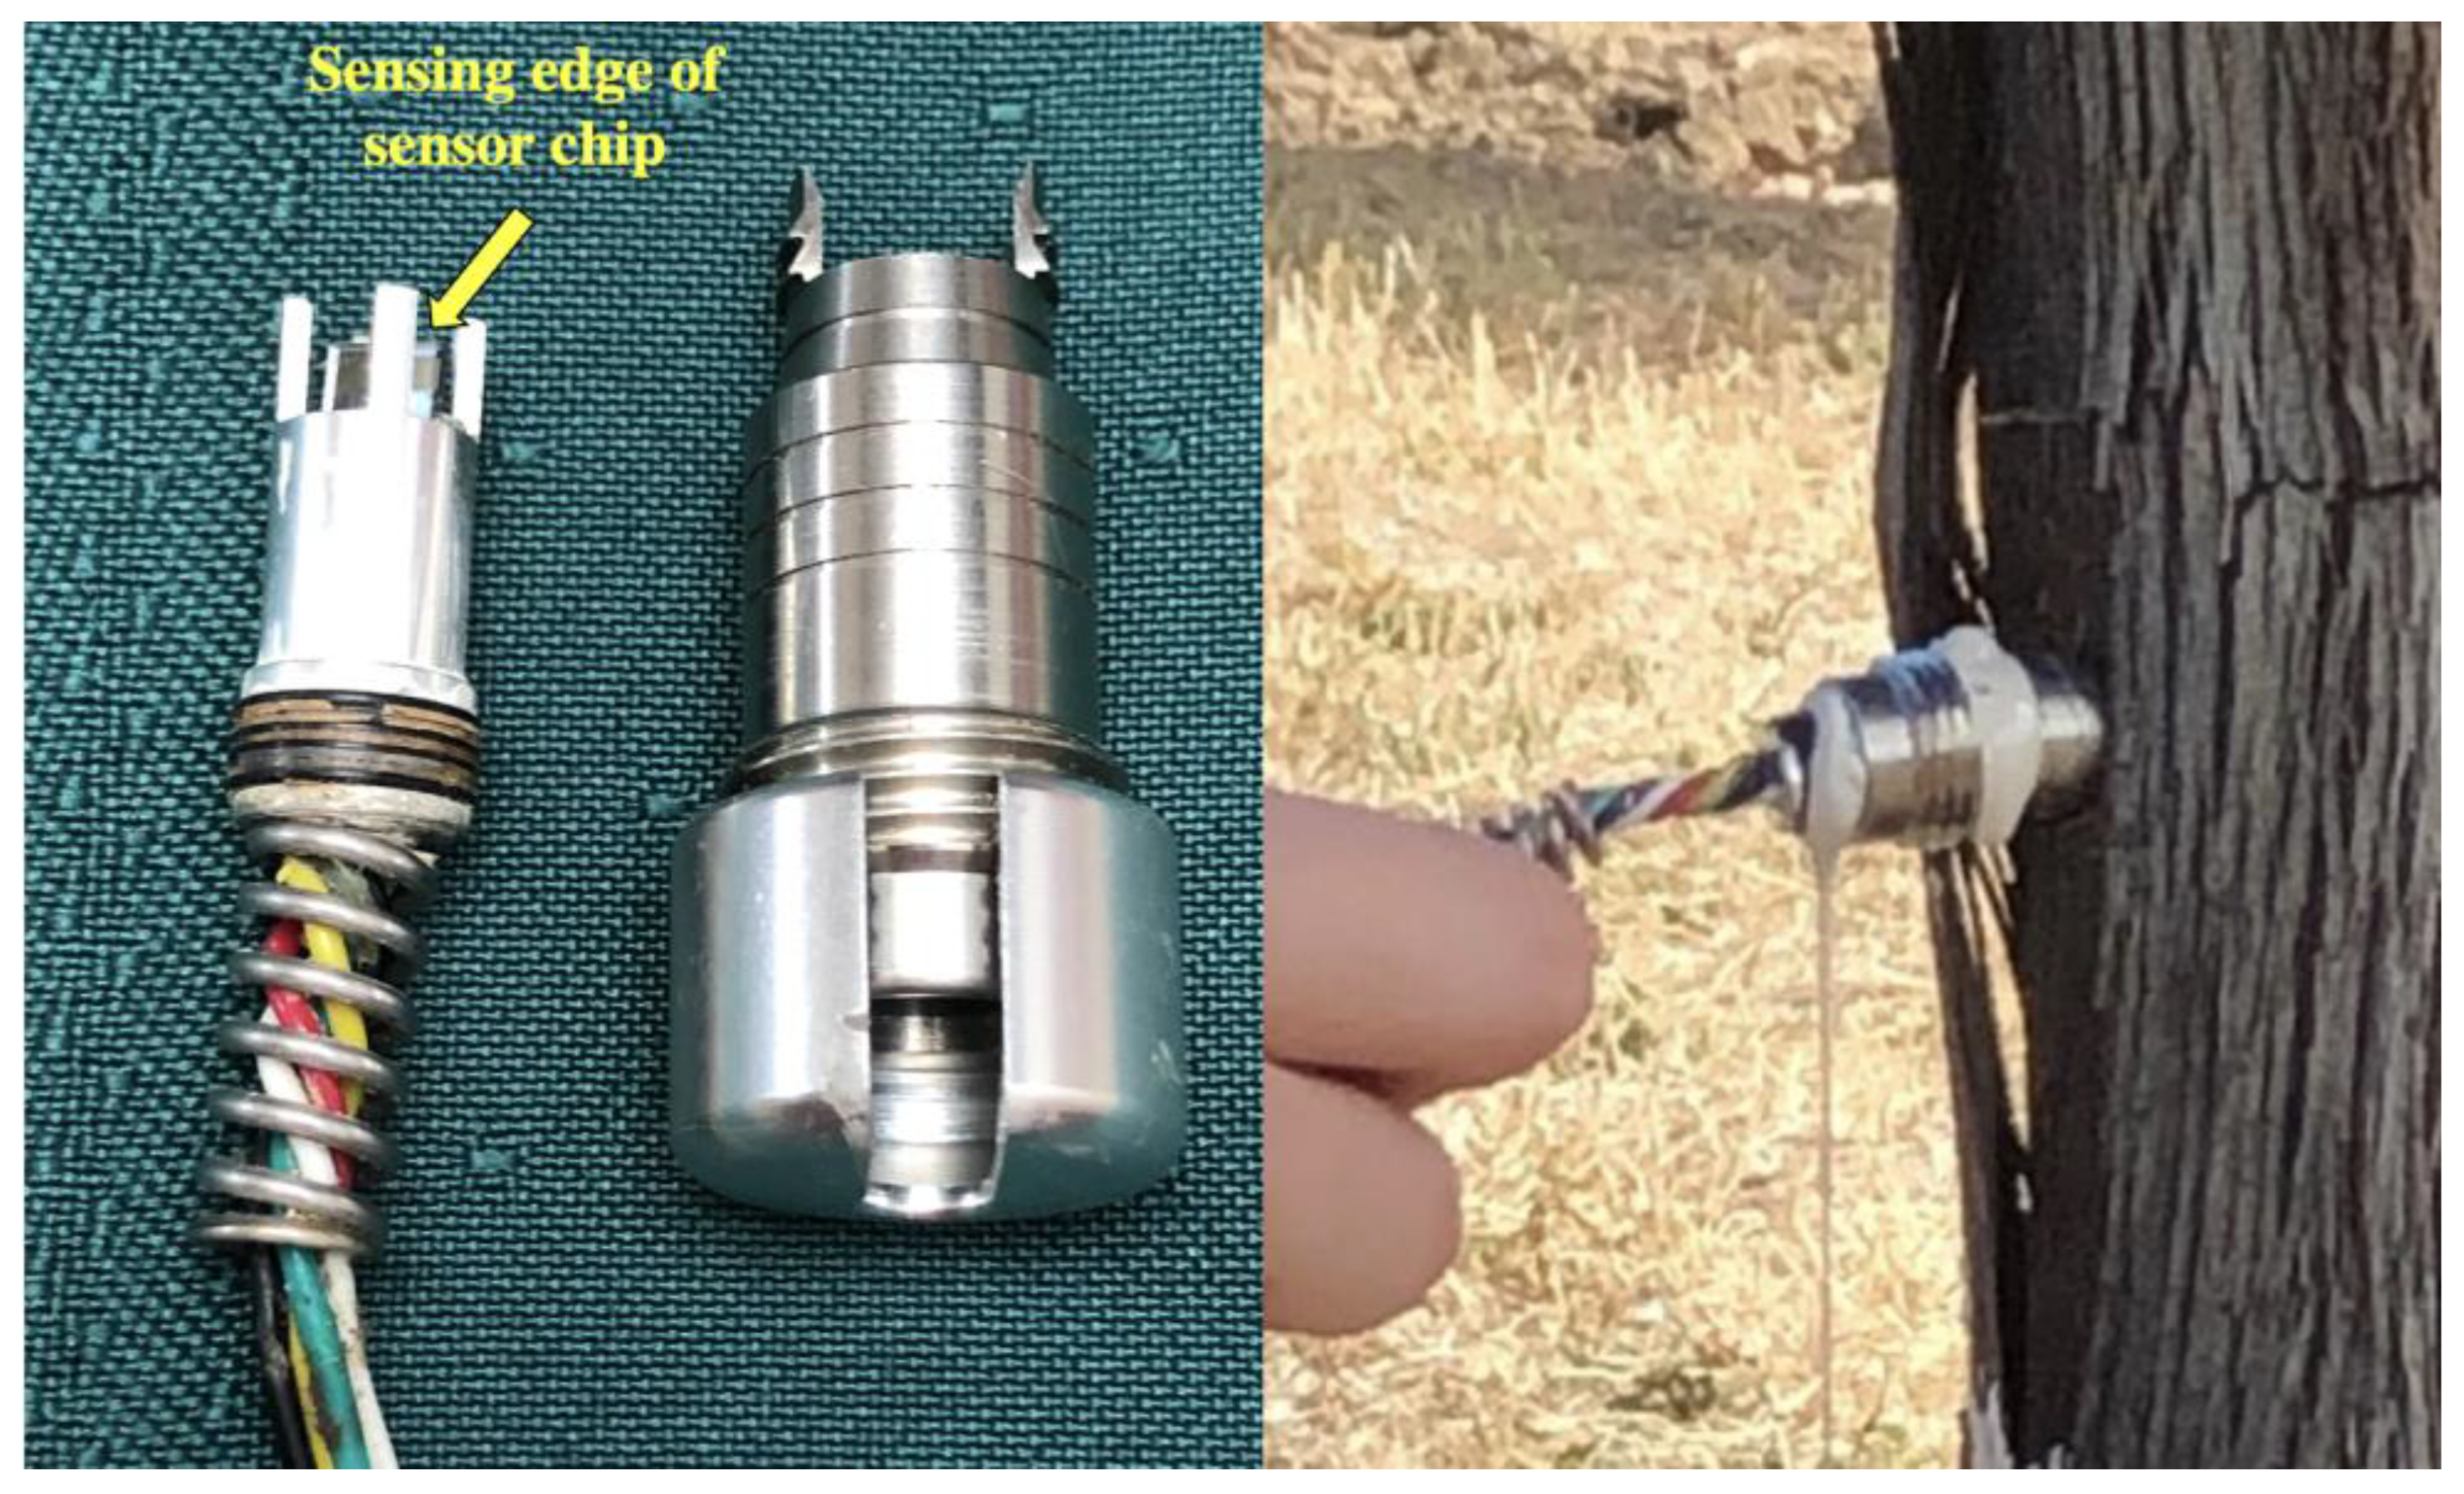
Figure 2. Photographs of the FloraPulse microtensiometer and installation. The sensing edge of the chip is held in a probe and held in contact with the xylem by the outer steel sleeve. After driving the sleeve into the stem, the sleeve is a drill guide, and a liquid clay paste is injected before the sensor probe is inserted. The nut of the sleeve then holds the spring-loaded probe in position.
Horticulturae 08 01207 g002
Figure 3. Example of the FloraPulse user interface. At the (left) is a plot of only mid-day minimum stem potentials with color-coded indications of relative stress levels. On the (right) is a plot of all data which can be downloaded. In the (middle) section is where irrigation amounts, and times and manual stem potentials can be added to the database.
Horticulturae 08 01207 g003
Figure 4. A typical diurnal pattern of stem water potential in an ‘Empire’/M9 apple tree in New York with mild-moderate soil moisture deficit in July. The first two days were sunny and warm, the third day overcast and the fourth day partly cloudy.
Horticulturae 08 01207 g004
Figure 5. Example of the microtensiometer response in an apple tree to rapid changes in radiation on a variably cloudy day. Data were collected every minute to examine response time. Stem potentials are inverted to make the comparison to radiation more direct.
Horticulturae 08 01207 g005
Figure 6. Daily stem water potentials in grapevines over three months with two irrigation regimes in a Mediterranean climate. One (red lines) withheld water relatively early in the season, but then maintained the vines with a mild-moderate stress level. The other regime (black lines) maintained higher water status for a longer period, then irrigation was reduced to allow the vines to become more stressed. The green, orange and red dashed lines at −0.9, −1.1 and −1.4 MPa indicate mid-day stress levels considered mild, moderate and severe, respectively [40]. Data courtesy of E&J Gallo Winery, Modesto, CA, USA.
Horticulturae 08 01207 g006
Figure 7. Daily cycles of almond stem water potential determined by the microtensiometer and SPC (dots) with irrigations noted by blue arrows. Reproduced from Lakso et al., 2022 [47]. Note that the stem potential units are bars. One bar = 0.1 MPa.
Horticulturae 08 01207 g007
Figure 8. Relationships of early morning and mid-day stem water potentials conducted in the field between the microtensiometer sensor and the Scholander Pressure Chamber on separate studies on almond and grape in California and apple in New York. The figure is reproduced from Lakso et al., 2022 with the addition of the previously unpublished apple data.
Horticulturae 08 01207 g008
Figure 9. Changes in stem water potential by pressure chamber with vascular distance from the soil in a Gala tall spindle apple tree on two sunny days 4 days apart. The upper relation was found on a mild day (24 °C, 65% RH, 1 m s−1 wind), while the lower relation was found on a day with higher evaporative demand (27 °C, 43% RH, 3 m s−1 wind). The square symbol on each relation indicates the expected stem potential at 0.4 m; the microtensiometer location using the regressions for each day.
Horticulturae 08 01207 g009
Publisher’s Note: MDPI stays neutral with regard to jurisdictional claims in published maps and institutional affiliations.