Article

Prediction Method of the Moisture Content of Black Tea during Processing Based on the Miniaturized Near-Infrared Spectrometer

1
College of Food and Health, Zhejiang Agriculture and Forestry University, No. 666 Wusu Road, Linan District, Hangzhou 311300, China
2
Tea Research Institute, The Chinese Academy of Agricultural Sciences, Hangzhou 310008, China
*
Authors to whom correspondence should be addressed.
These authors contributed equally to this work.
Horticulturae 2022, 8(12), 1170; https://doi.org/10.3390/horticulturae8121170
Submission received: 7 November 2022 / Revised: 30 November 2022 / Accepted: 6 December 2022 / Published: 9 December 2022
(This article belongs to the Special Issue Advances in Tea Plant Biology and Tea Quality Regulation)

Abstract

:
The moisture content of black tea is an important factor affecting its suitability for processing and forming the unique flavor. At present, the research on the moisture content of black tea mainly focuses on a single withering step, but the research on the rapid detection method of moisture content of black tea applicable to the entire processing stage is ignored. This study is based on a miniaturized near-infrared spectrometer(micro−NIRS) and establishes the prediction models for black tea moisture content through machine learning algorithms. We use micro−NIRS for spectroscopic data acquisition of samples. Linear partial least squares (PLS) and nonlinear support vector regression (SVR) were combined with four spectral pre−processing methods, and principal component analysis (PCA) was applied to establish the predictive models. In addition, we combine the gray wolf optimization algorithm (GWO) with SVR for the prediction of moisture content, aiming to establish the best prediction model of black tea moisture content by optimizing the selection of key parameters (c and g) of the kernel function in SVR. The results show that SNV, as a method to correct the error of the spectrum due to scattering, can effectively extract spectral features after combining with PCA and is better than other pre−processing methods. In contrast, the nonlinear SVR model outperforms the PLS model, and the established mixed model SNV−PCA−GWO−SVR achieves the best prediction effect. The correlation coefficient of the prediction set and the root mean square error of the prediction set are 0.9892 and 0.0362, respectively, and the relative deviation is 6.5001. Experimental data show that the moisture content of black tea can be accurately and effectively determined by micro-near-infrared spectroscopy.

1. Introduction

In recent years, the production and total sales of tea have exhibited a gradual upward trend worldwide [1]. In particular, black tea has become one of the mainstream products in the international tea market. The processing process of black tea can be simply divided into four stages: withering, rolling, fermenting, and drying [2]. In these stages, the moisture content of the samples affects the changes in its quality and composition and is one of the important influencing factors in forming the final flavor of black tea. During the actual production, different processing stages have different requirements for the moisture content of black tea. Withering is the first link in making black tea, and the degree of withering is a key factor affecting the formation of key flavors in subsequent stages [3]. Typically, the moisture content of withering leaves was used as a quantitative index to judge the degree of withering [4]. Rolling is the second step of the process, during which the appropriate moisture content in the leaves must be retained to prevent it from breaking during the rolling process, which helps conducive to shaping [5]. Fermentation is one of the important links in black tea processing and relative humidity is a key factor affecting the fermentation of black tea [6], and it is also the key factor in controlling moisture content changes. Hence, the moisture content must be precisely controlled to manage the chemical changes that take place during the fermentation, which directly promotes the formation of black tea’s pleasant aroma and flavour. After fermentation, the drying stage takes place, reducing the moisture content of the tea leaves not only makes it easier to store but also convenient to transport the tea [7], while shaping their appearance and forming other fine qualities. During these process stages, the moisture content of leaves has plenty of opportunities to drastically change owing to environmental factors. Unfortunately, traditional sensory evaluation is inefficient for precisely managing moisture content. Therefore, reliable technologies are needed. At the same time, contemporary measurement methods are costly and result in the sacrifice of samples [8]. Moreover, they do not support real-time operations [9].
Near-infrared spectroscopy (NIRS) is an important non-destructive measurement method and is widely used in the online detection of moisture content in withering leaves [10]. It has the advantage of requiring no sample pre−treatment while exhibiting the characteristics of fast detection and zero pollution [11]. Near-infrared spectrum is located between infrared and visible light, mainly reflecting the absorption of hydrogen-containing functional groups at double and harmonic frequencies. Therefore, the NIRS can be used to quantitatively predict and analyze the moisture content of tea leaves [12]. Rapid analytical detection techniques as such have many advantages over classical chromatography, such as greatly reducing analysis time and associated costs. Notably, they also avoid the use of hazardous chemicals. However, traditional NIRS are bulky, require a professional operation, and are expensive [13]. In addition, it is difficult to use the instruments for online non-destructive measurement of moisture content in tea during production because the environment used is limited to the laboratory. Therefore, instruments that are easy to promote and simple to operate should be used.
As analytical processing technologies have advanced and the demand for portable instruments has increased, miniaturized NIRS (micro−NIRS) systems have been fielded [14,15,16]. Such systems can be connected to mobile smart devices using wireless technology [17]. Compared with desktop equipment, micro−NIRS is portable, inexpensive, and simple to use. Additionally, it is suitable for the online non-destructive measurement of black tea during production. Nevertheless, with micro−NIRS, spectral curves are susceptible to many noisy factors such as baseline drift and uneven sample distributions, and the curves often contain redundant information that is irrelevant to the properties evaluated [18]. In order to avoid the influence of interfering factors, proper pre−processing of the spectra is required. Commonly used spectral pre−processing methods include SNV, MSC, SG, and Z-score. As one of the common methods to eliminate spectral error, SNV can make spectral data of the same nature more consistent. MSC can be used to improve the problem of spectral baseline shift. SG can reduce spectral data noise by suppressing the vibration of the signal. Z-score can eliminate the impact of magnitude on data analysis. Different pre−processing of spectral data can make the predictive model produce better results. Presently, there are a lot of spectral modeling approaches, including competitive adaptive reweighted sampling-partial least squares (PLS) [19], support vector machines (SVM), support vector regression (SVR) [20], and artificial neural networks [21]. SVR and PLS have been widely used in the studies of composition prediction. Therefore, PLS and SVR were used in this study to establish the moisture content prediction models for black tea based on micro−NIRS.
The main content of this study is that the above four different spectral pre−processing methods are compared and PCA is applied to establish the prediction models, and the best spectral pre−processing method is obtained by comparison. Moreover, PLS and SVR are applied simultaneously to explore the potential of linear models (PLS) and nonlinear models (SVR), combined with micro−NIRS for predicting the moisture content of black tea. In addition, the GWO algorithm, as a commonly used Meta-Heuristic algorithm, is often used in combination with SVR to improve the predictive power of the model. Therefore, the GWO algorithm was combined with SVR to improve the prediction ability of the model for the moisture content of black tea by optimizing the selection process of key parameters (c and g) of the kernel function in the SVR model [22]. By constructing various models, this study aims to establish the moisture content prediction method suitable for different processing stages of black tea. By analyzing and comparing the results of the models, we established a method for rapid analysis of the moisture content of black tea, replacing the traditional method.

2. Materials and Methods

2.1. Experimental Sample

Jiukeng tea leaves with a tenderness of one bud and one leaf or one bud and two leaves were utilized. Sample leaves with a moisture content of 78.62~76.85% were evenly dispersed in a withering trough for natural withering indoors. The room temperature was about 22 °C, the spread thickness of the raw material was 3–5 cm and the relative humidity was approximately 60%. To ensure that the moisture of the raw material dissipated evenly, the tea leaves were turned every hour [23]. After withering for 10 h, the moisture content was measured at 62.66~59.24%. During processing, a type-45 rolling machine was used per the technical specifications of Kung Fu black tea processing. The rolling duration was 75 min, after which the moisture content was 58.29~56.43%. Fermentation then took place in a fermentation chamber wherein the samples were stacked in bamboo baskets, and the surfaces of the tea leaves were covered with a layer of wet cotton cloth. The ambient temperature was 24 to 28 °C, the surface temperature of the sample did not exceed 32 °C and the indoor relative humidity was approximately 90%. The sample was sprayed with water as needed while maintaining fresh air circulation. The thickness of the tea leaves was 8–10 cm. After 2–3 h, the color of the sample was checked to ensure a light red or yellow tone and that the grassy color had disappeared. After fermentation, the moisture content of the sample was 58.95~57.33%. The drying process was then conducted in a dryer. During the first drying stage, the temperature of the instrument was 110 °C, and the moisture was reduced to 34.85~33.90% by the end of the process. The leaves were then placed on a bamboo sheet for about 30 min and allowed to cool to about 22 °C. The second drying stage lasted for 30 min at a temperature of 80 °C, after which the final measured moisture content was 6.68~6.36%. The process of the experiment is shown in Figure 1.

2.2. Data Acquisition

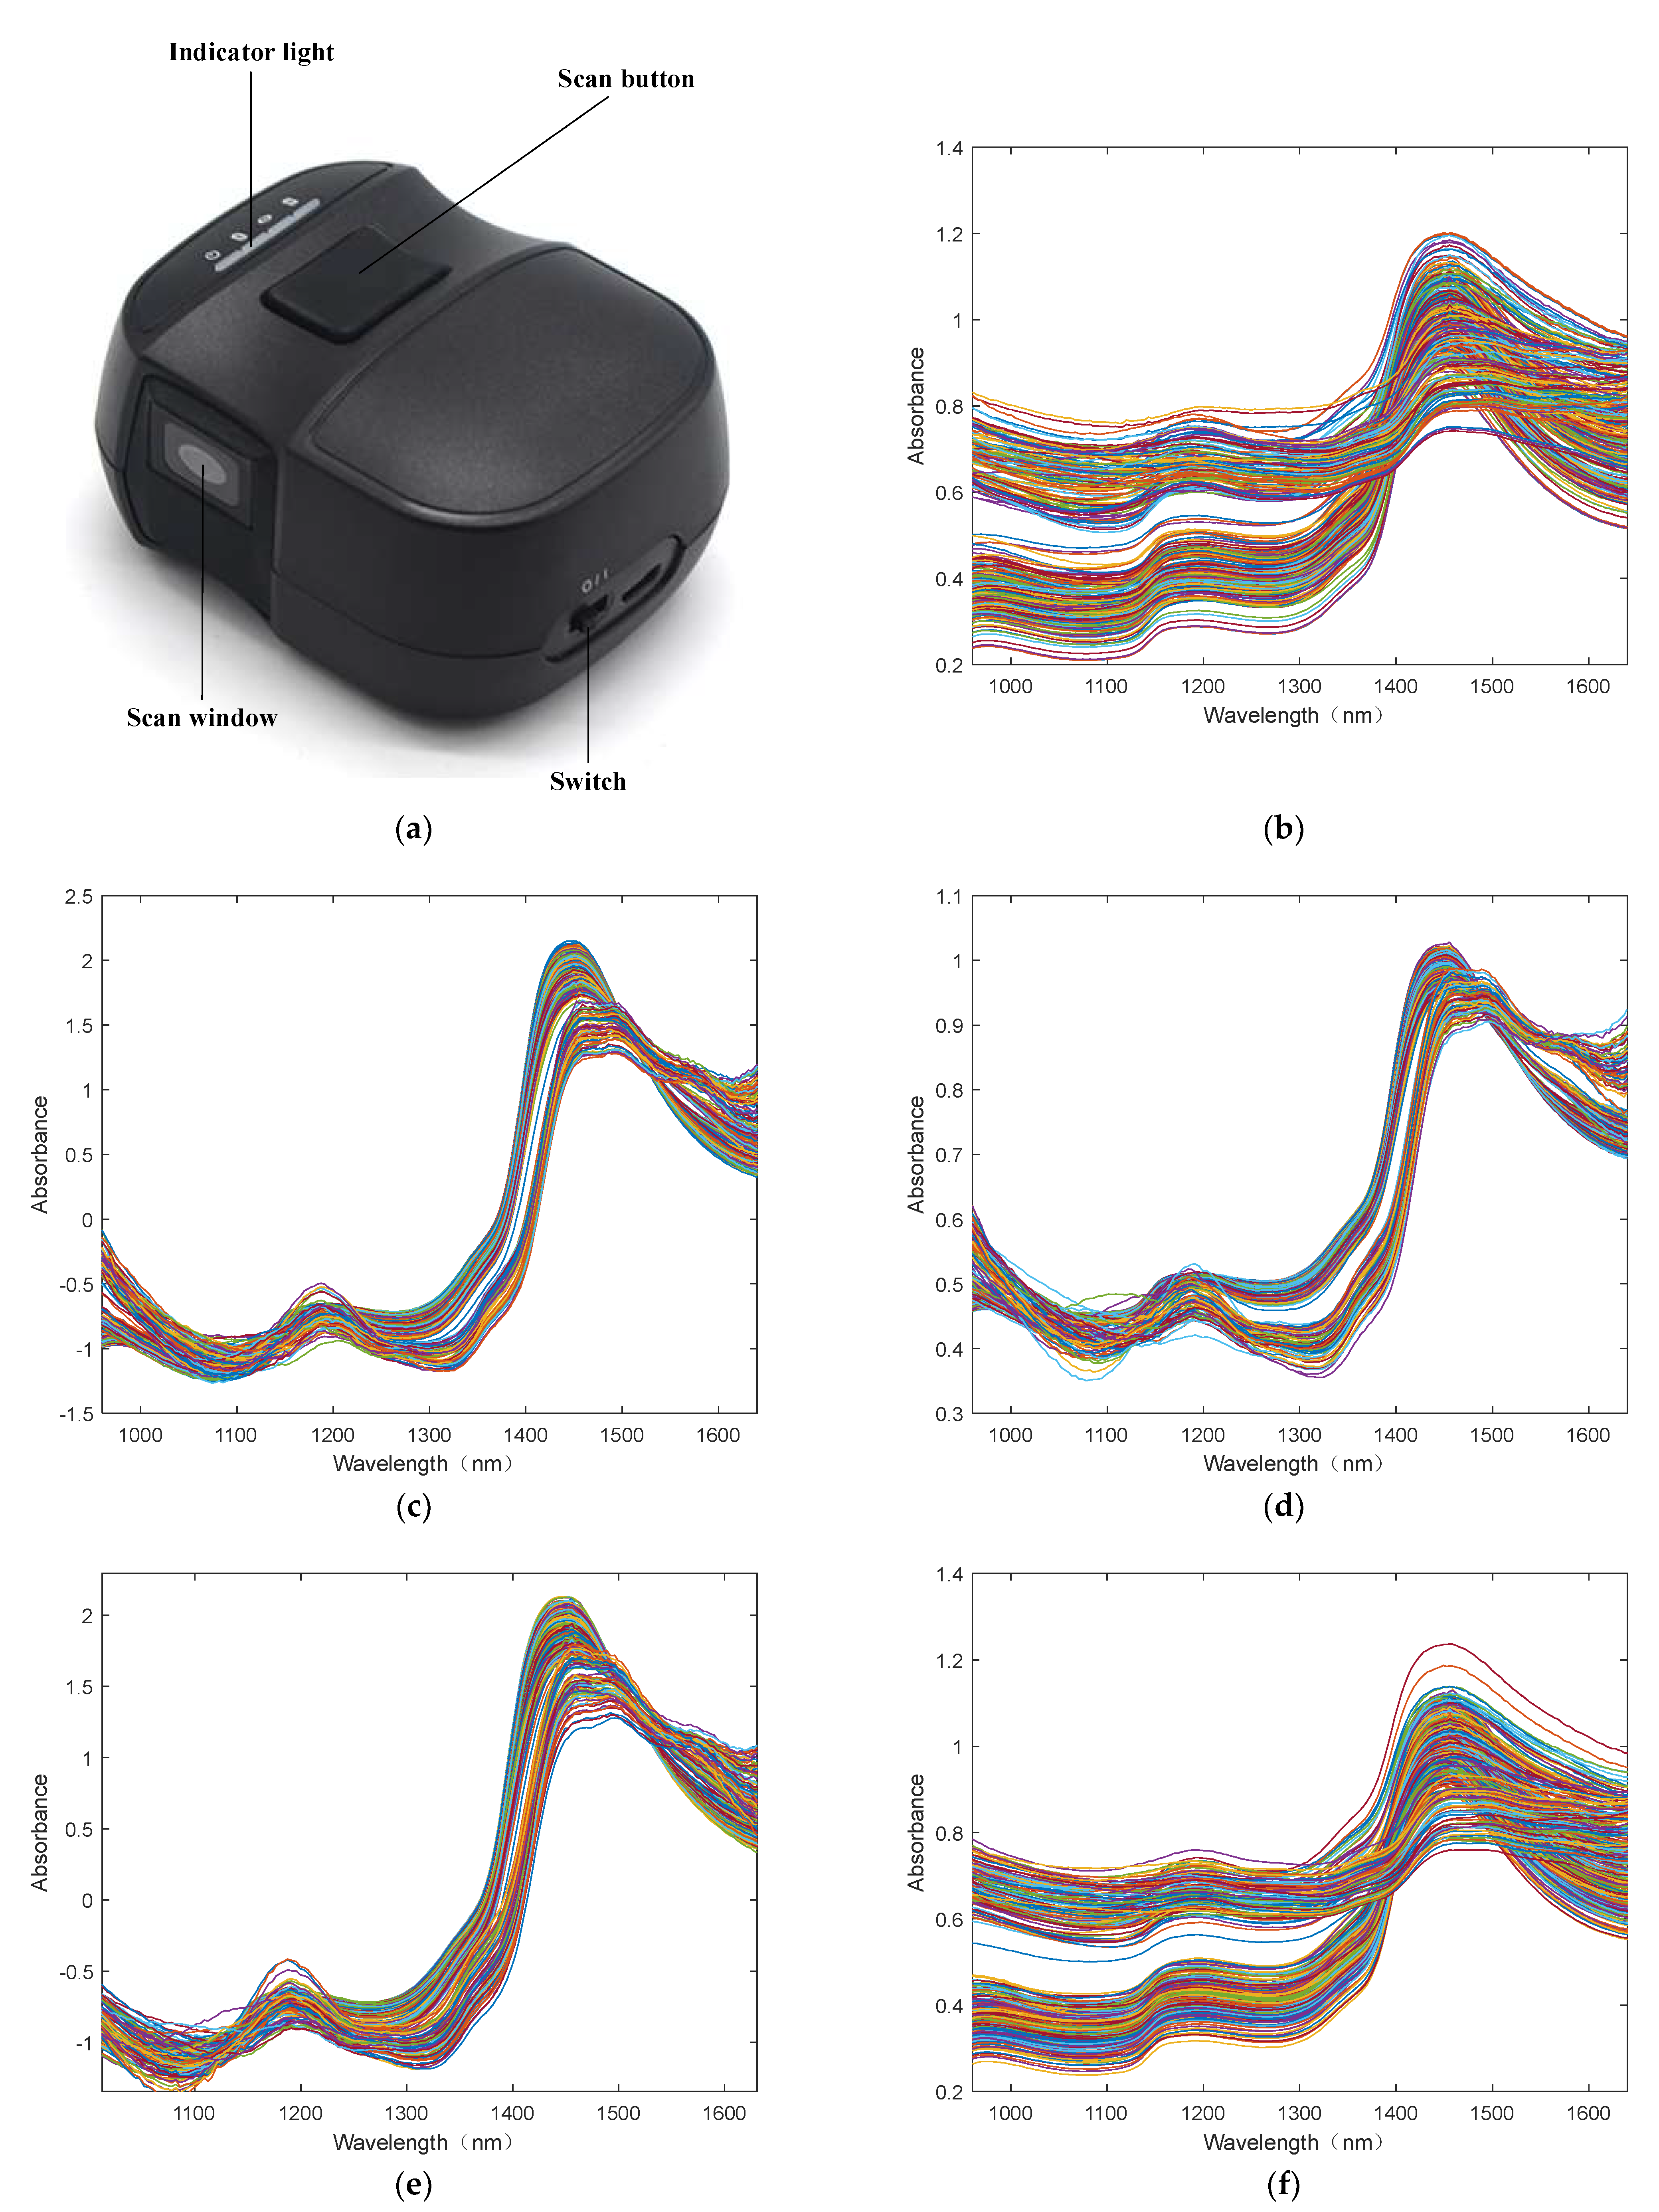
In this study, we utilized a micro−NIRS system (NIR-S-R2; InnoSpectra Corporation, Taiwan, China) to collect raw spectral data from the tea leaves during each processing step. The spectrometer has a wavelength range of 900–1700 nm, weighs approximately 77 g, measures 75 × 58 × 26.5 mm, and has a resolution of 10–12 nm, as shown in Figure 2a [12]. Using wireless technology, data were transferred from the system to portable smartphones [13]. To ensure that the collected spectral curves were accurate and stable, the instrument was preheated for approximately 30 min before collecting data to ensure the stability of its internal systems. After preheating, a self-check test was performed on the test bench to ensure that the instrument operated normally. Then, the sample spectra data were collected.
The samples were placed on the test bench for data collection, and the analysis was repeated three times for each sample. The average value of the three measurements was used as the representative sample’s measurement. The samples were mixed well before each test, and absorbance data were obtained. Spectral data collection was performed separately for each process. In total, 51 spectra samples were collected from the fresh leaf state, 55 after withering, 50 after rolling, 40 after fermentation, 50 after the first drying, and 59 after the second drying. Thus, 305 spectral datasets were assessed.

2.3. Determination of Moisture Content

While collecting the spectral data, the moisture content of a given sample was determined using the direct drying method of GB5009.3-2016, ‘National Food Safety Standard Determination of Moisture Content in Foods’. This method uses an electrically heated, constant-temperature oven to measure the weight of evaporated water via heating at 101–105 °C. The moisture content of each tea leaf sample was measured three times, and the average value was used. These values are listed in Table 1.

2.4. Establishment of Models

2.4.1. Spectral Pre−Processing Methods

Due to the influence of other conditions, such as uneven particle distribution on the surface of the sample, the micro−NIRS system was affected by the presence of noise. Thus, a suitable spectral pre−processing method was used to remove the noise before establishing the prediction model [24]. The original spectrum is shown in Figure 2b. In this study, we utilized four pre−processing methods: SNV (Figure 2c), MSC (Figure 2d), Z-score (Figure 2e), and SG (Figure 2f). The results in Table 2 show that the SNV method outperformed the others. Hence, we utilized SNV as our spectral pre−processing method for our experiment. The use of SNV resulted in the removal of the slope variation in the collected spectra and corrected for light scattering in the samples. The dimensionality of the spectral data was then reduced using PCA, which significantly improved predictability. Owing to the high noise effects at the beginning (900–960 nm) and end (1640–1700 nm) of the spectra, data from those ranges with a small buffer were removed. Each sample then exhibited a total of 196 sampling points in the 960–1640 nm band.

2.4.2. Partial Least Squares (PLS)

As one of the most classic linear analysis methods in regression predictive analysis, PLS’s predictive performance is generally better than other linear models. It has the advantages of correlation analysis, multiple regression analysis, and principal component analysis. The principle is to construct latent variables (LVs) from the original variable x in orthogonal space to predict the variable y in the maximized x space [25]. PLS has shown good performance in practical applications for analyzing spectral data. Moreover, the modeling problems generated by data redundancy have good processing ability. Therefore, PLS is also widely used in the predictive analysis of near-infrared spectral data.

2.4.3. Support Vector Regression

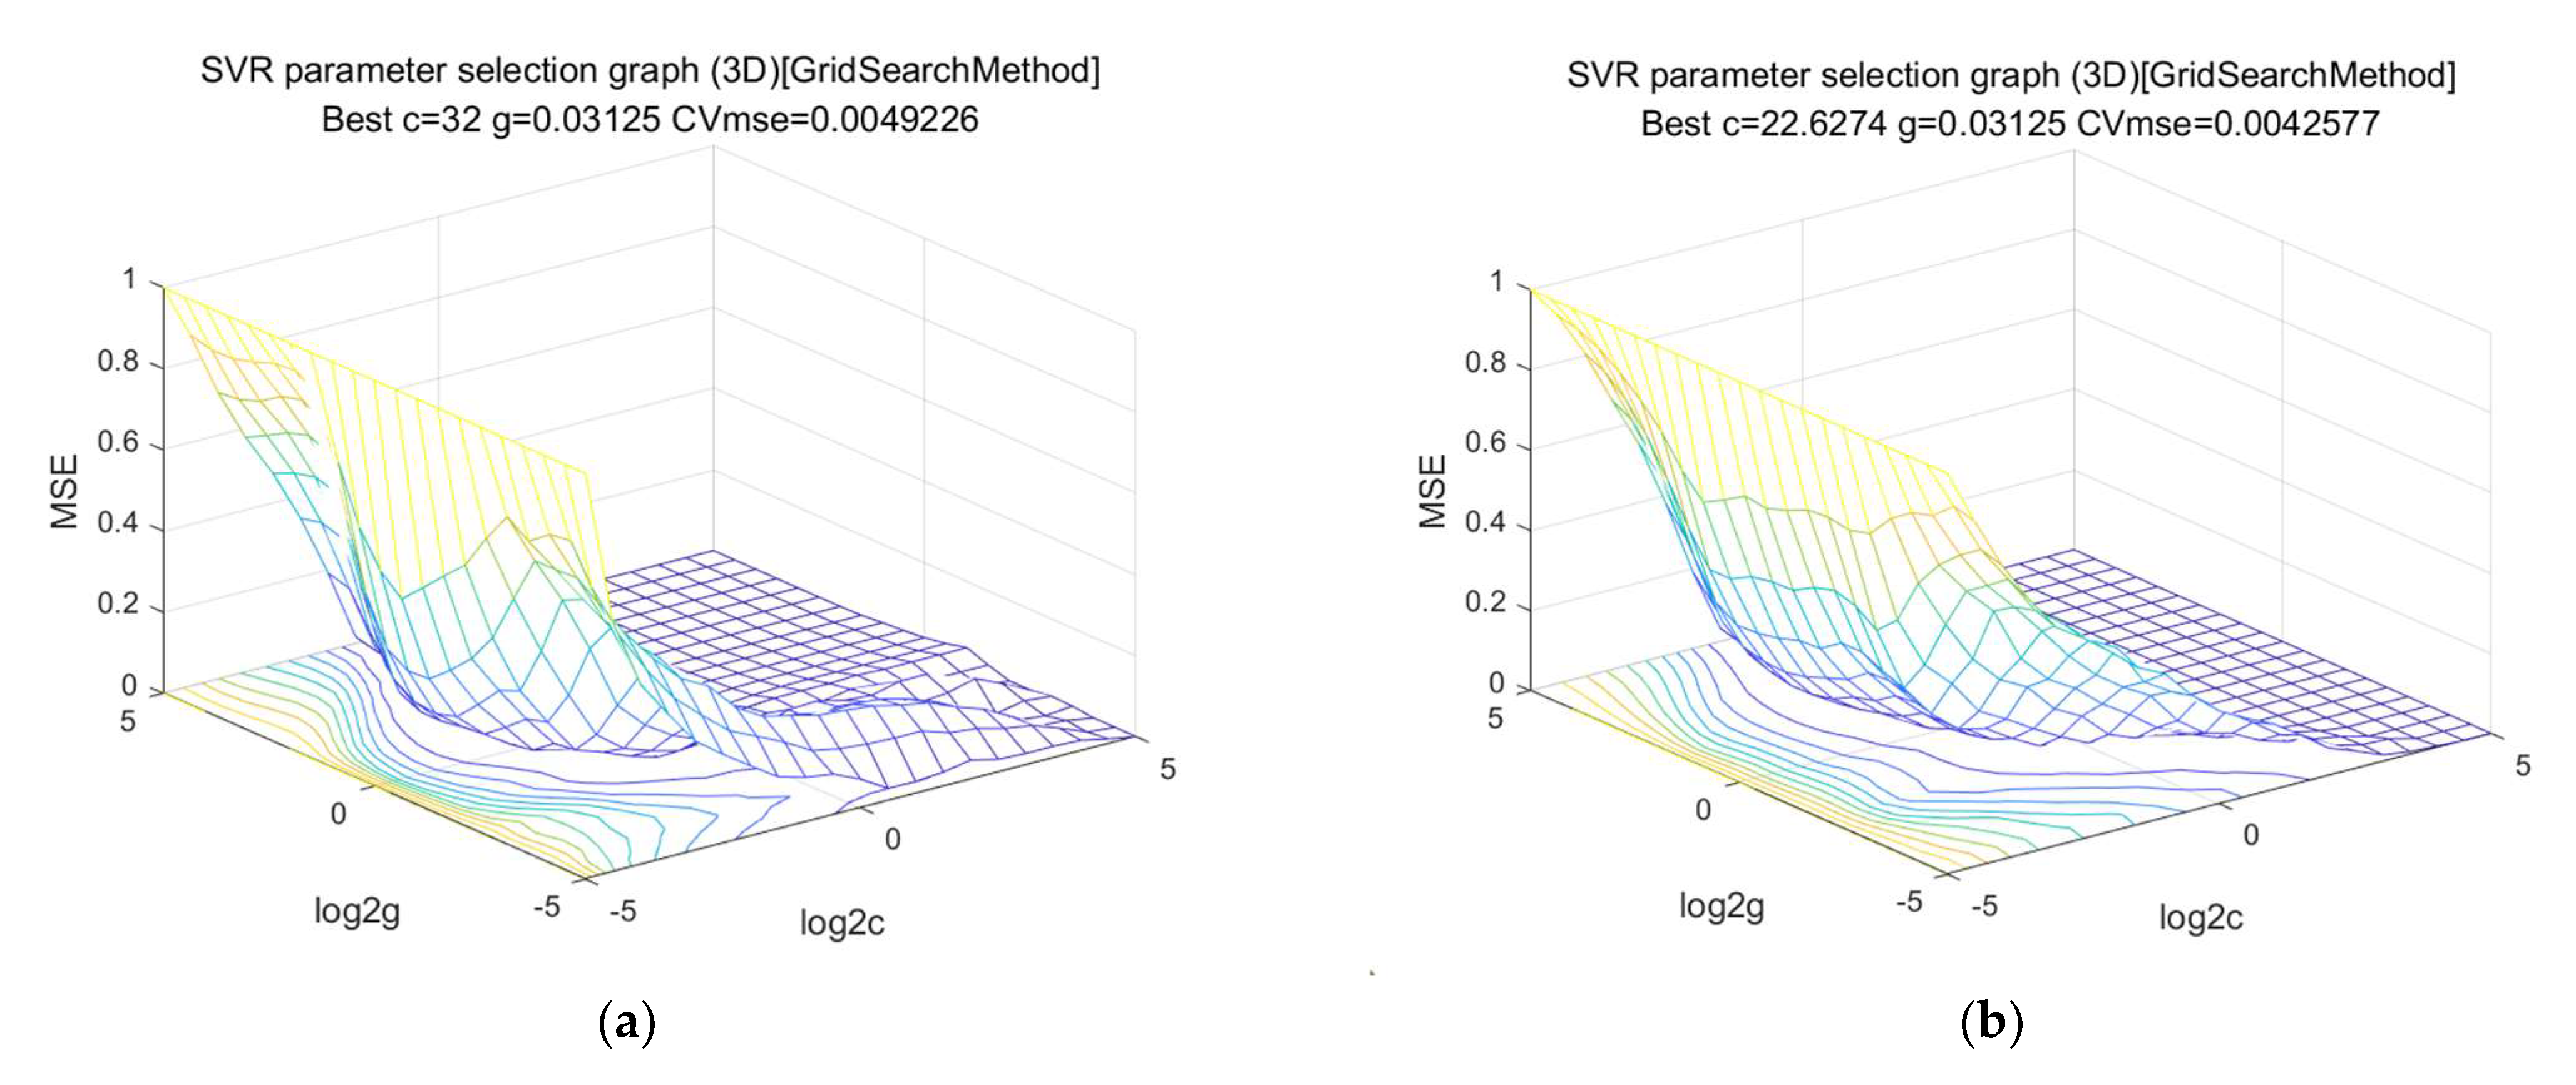
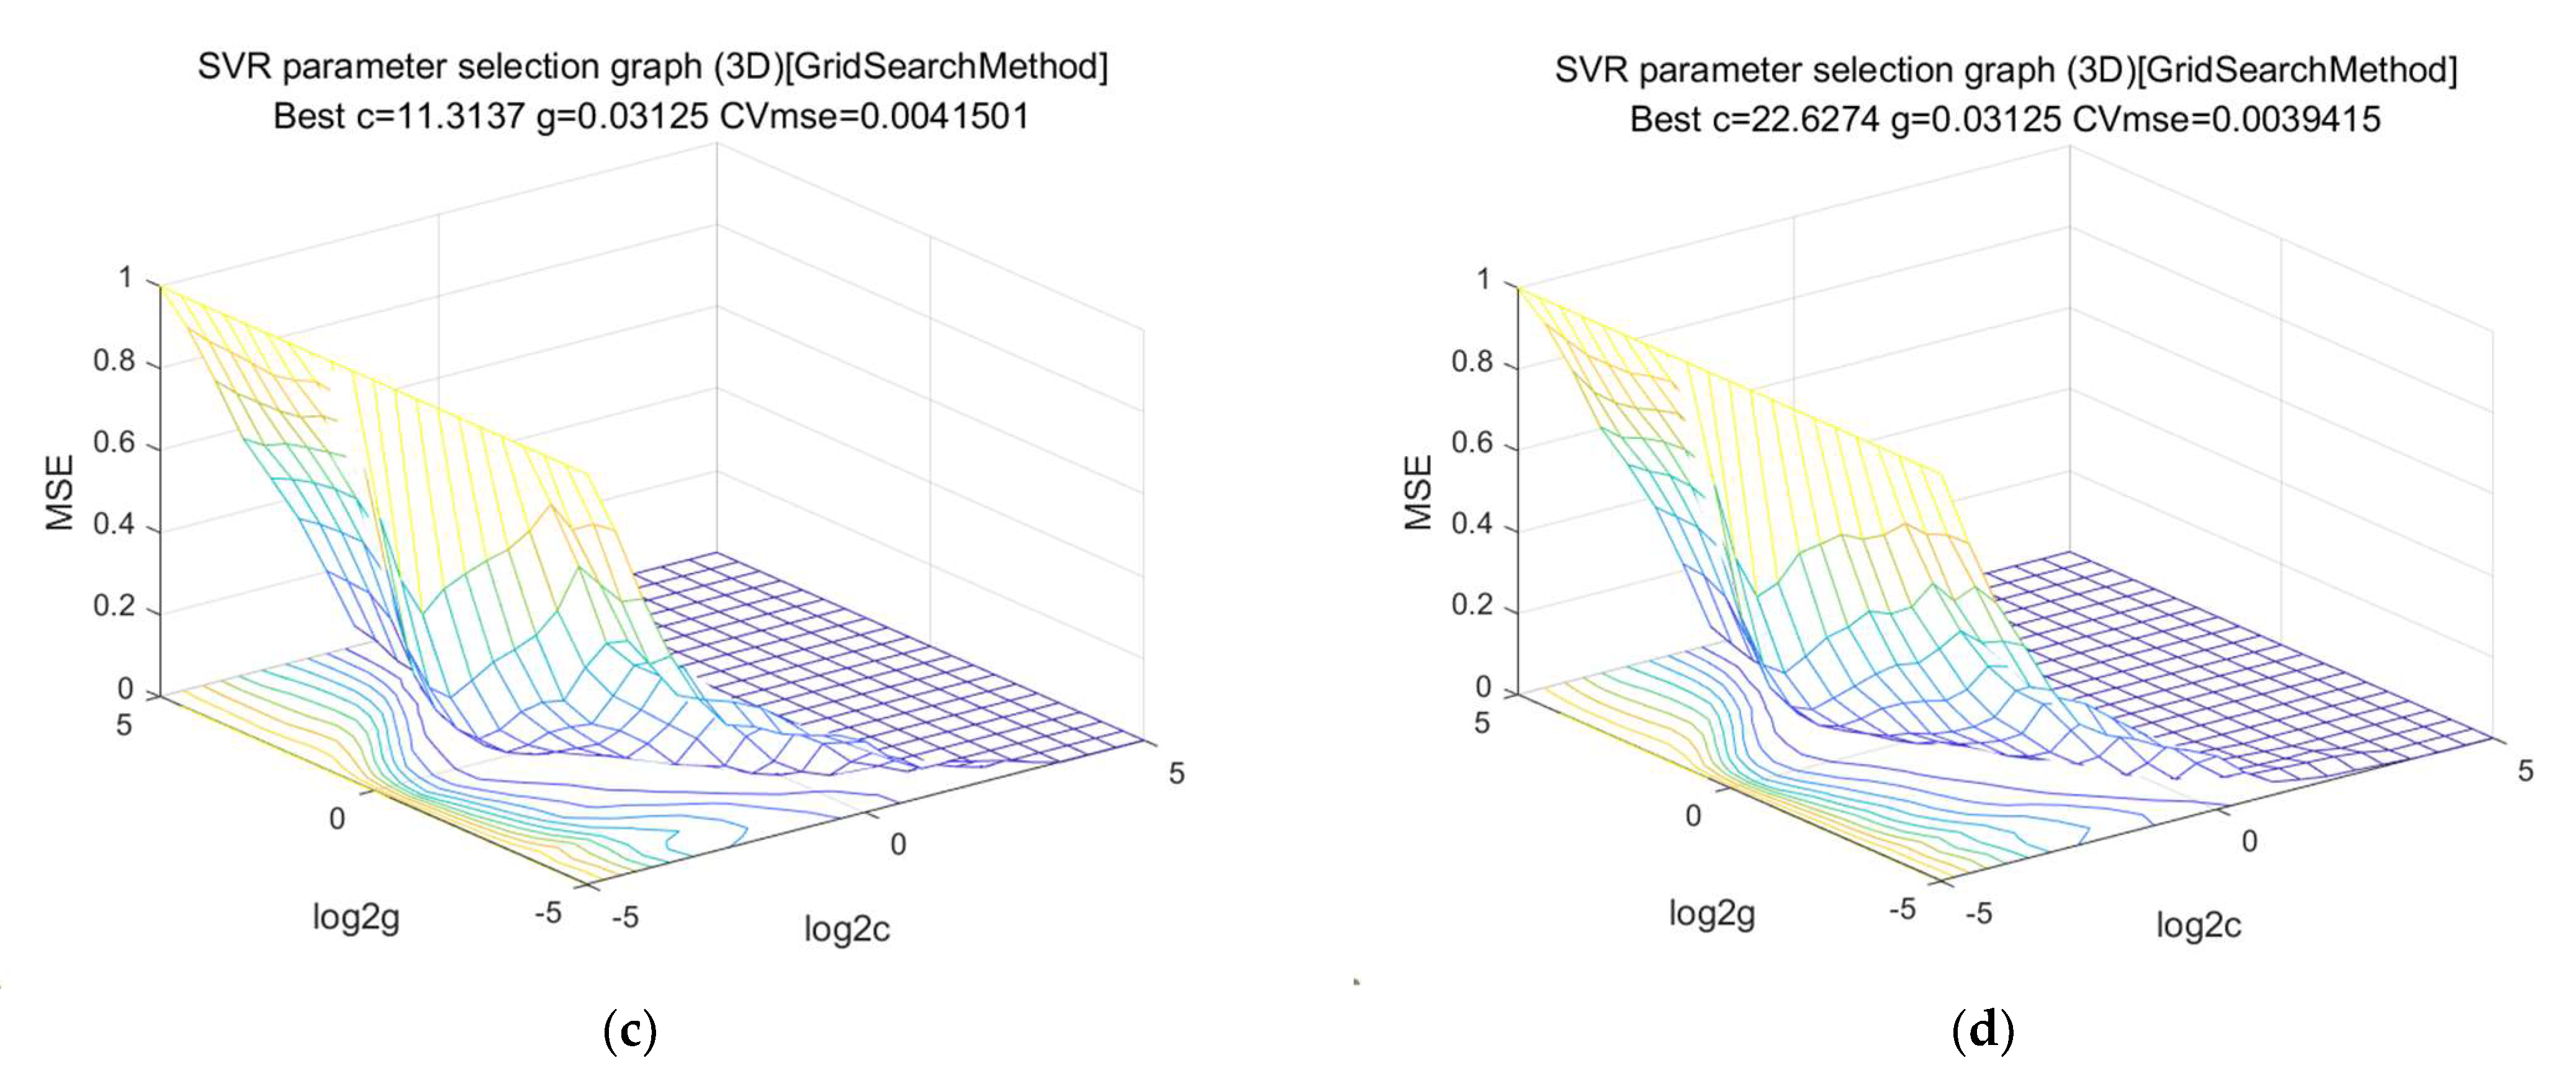
SVR is a machine learning method based on statistical theory [26], and it has a weak dependence on the number of samples and a strong generalizability [27]. SVR applies the principle of structural risk minimization and is mostly used with nonlinear problems. It maps sample data onto a high-dimensional space using a nonlinear function and accurately determines the functional relationship between the input and output. The radial basis function (RBF) is usually chosen as the kernel function. In this study, the SVR model adopted the LIBSVM open-source machine learning library’s RBF instantiation [28]. Compared with other commonly used kernel functions, RBF achieves improved prediction performance with nonlinear problems. Compared with polynomial and sigmoid kernel functions, RBF requires fewer initial parameters. The performance of the SVR model is mainly affected by the penalty parameter (c) and kernel function parameters (g). g affects the generalization ability of SVR by adjusting the kernel function, while c can be used to balance minimized training error and maximized edges. Considering the parameter optimization problems of c and g, we use the grid optimization classical method for parameter optimization in the SVR models. The optimization results of parameter selection as shown in Figure 3.

2.4.4. GWO Algorithm

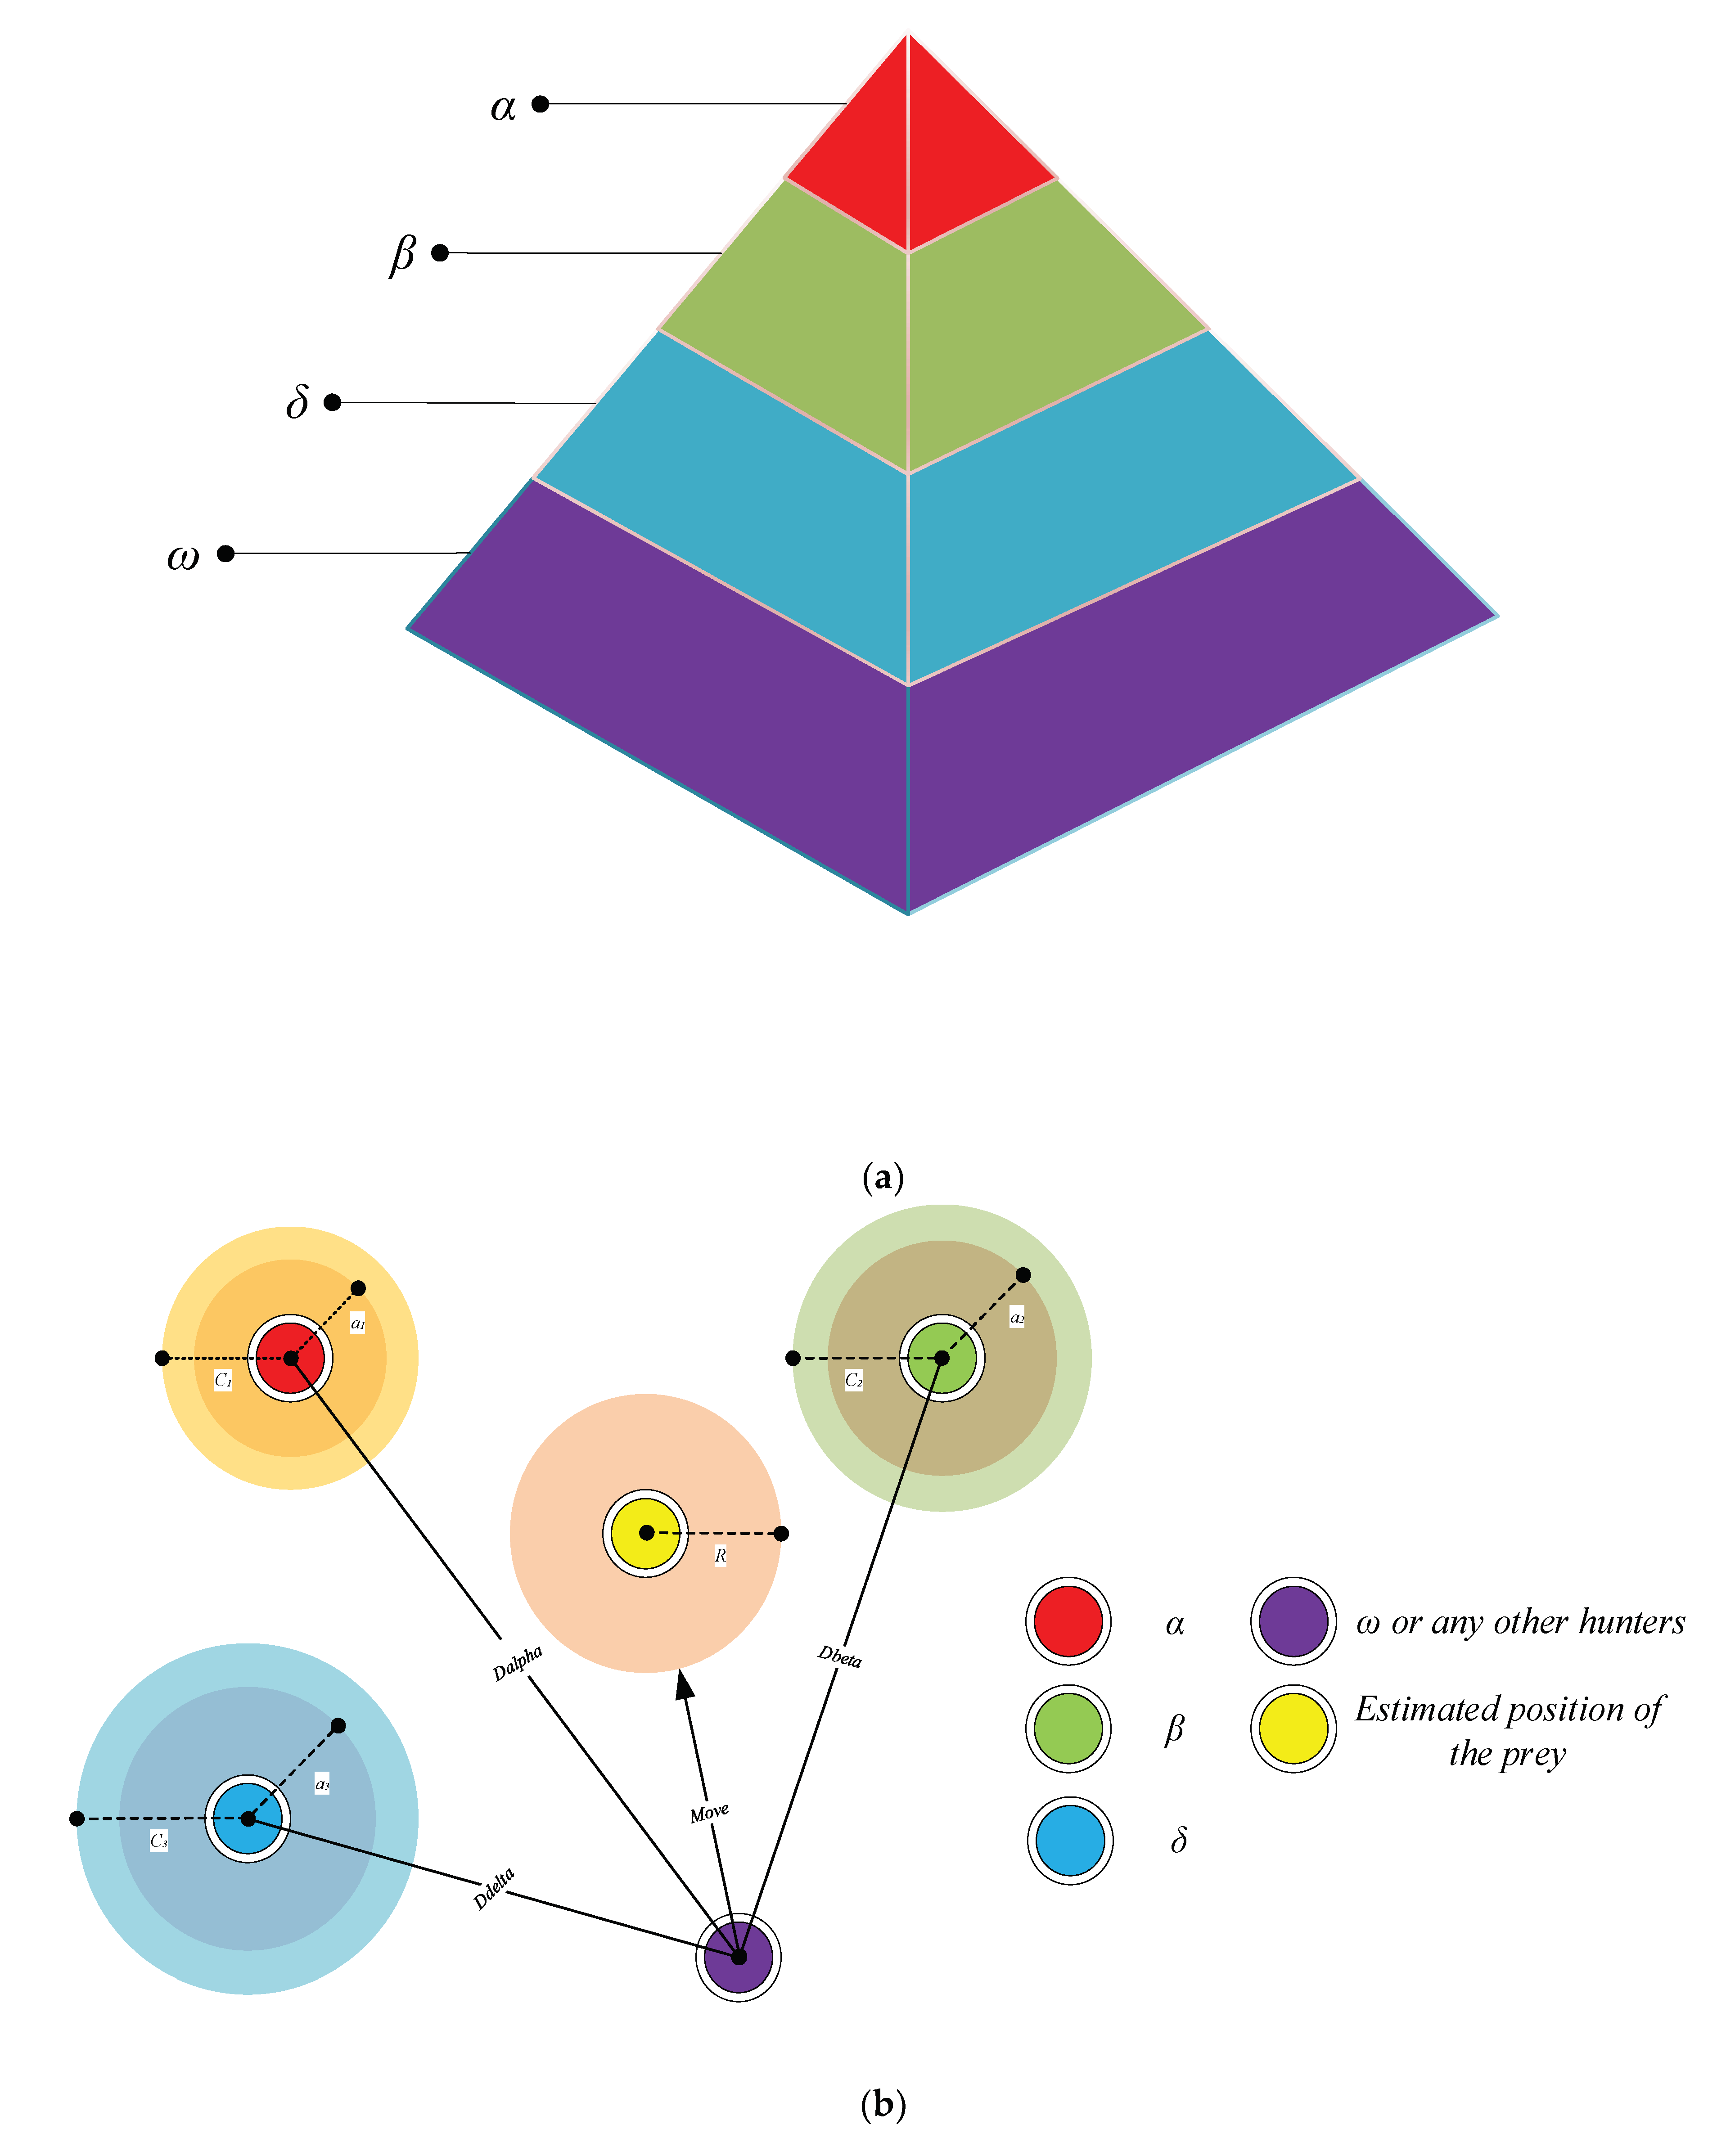
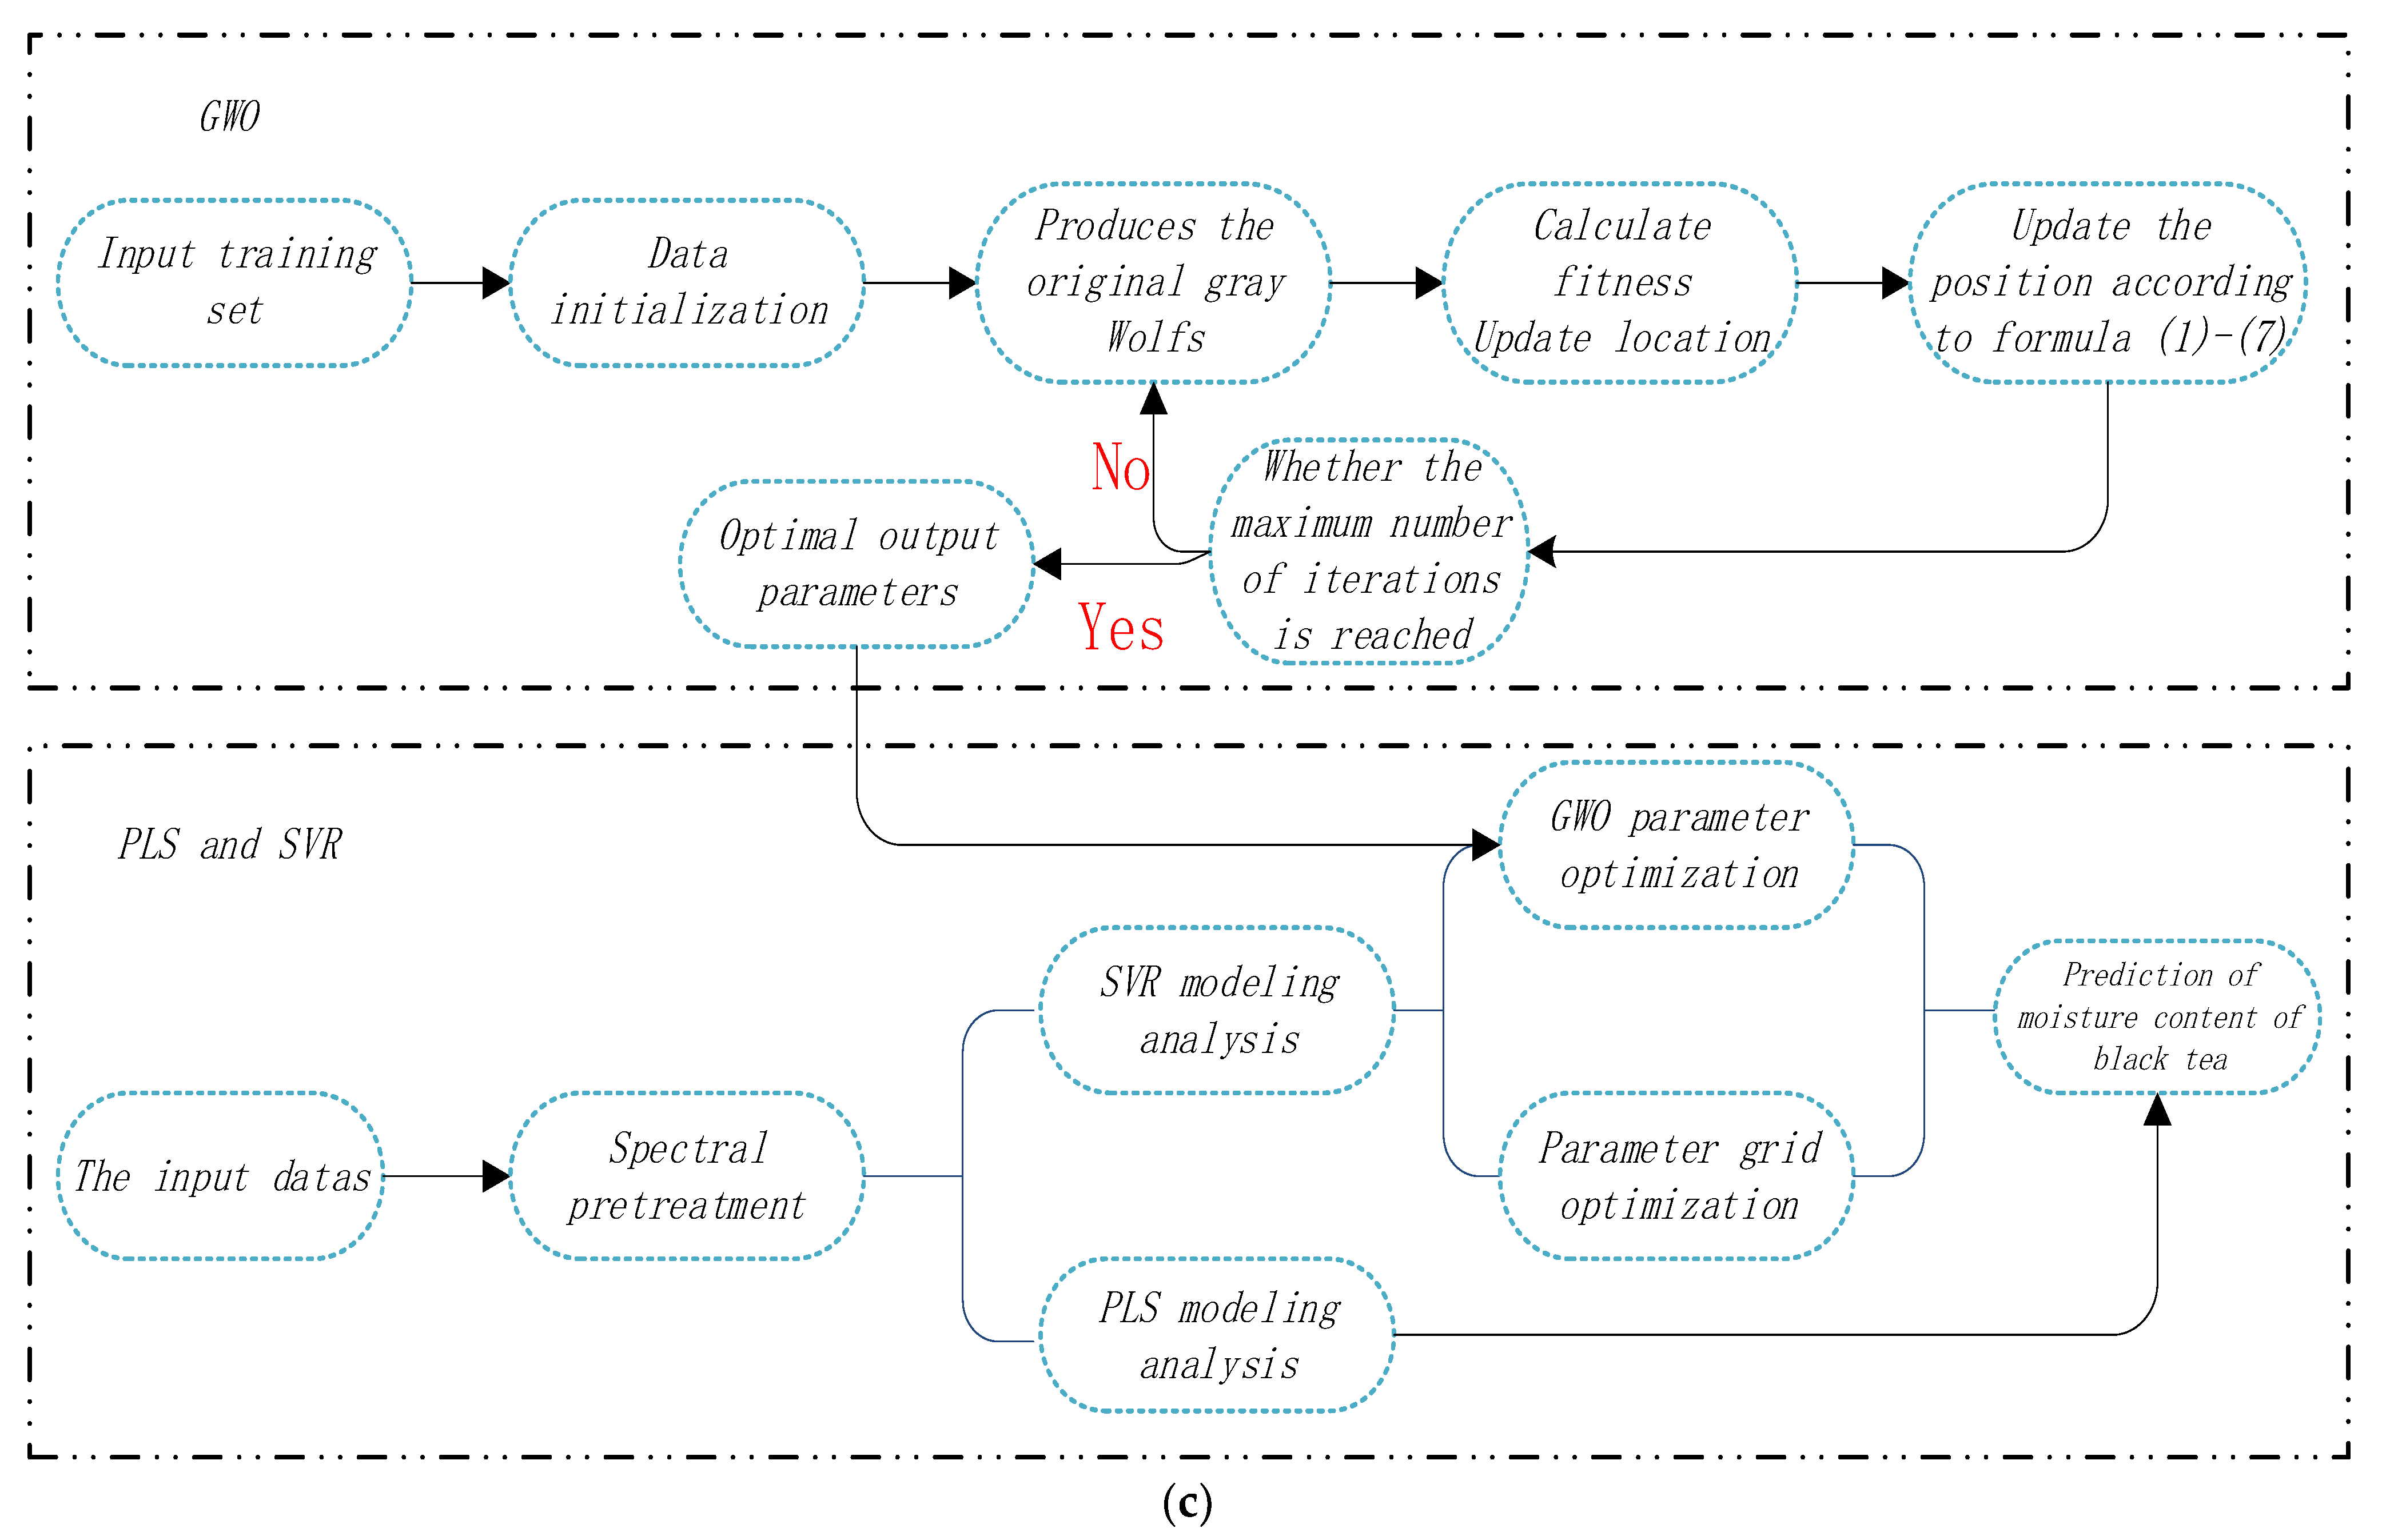
The GWO algorithm is a swarm intelligence optimization algorithm that was proposed by Griffith University scholar Mirjalili in 2014 [29]. Its convergence accuracy and speed are superior to similar algorithms [30]. The GWO simulates the aggressive behavior of wolves whose social hierarchy is distributed from top to bottom in a pyramid-like pattern, as shown in Figure 4a. The GWO algorithm has a simple structure with strong convergence and is easy to implement as it requires few parameters. It is widely used for parameter optimization of machine learning models. In our algorithm, there were four types of wolves: α, β, δ, and ω; the hierarchy descended from top to bottom. Hierarchically, the α wolf is at the highest level (leader). The β wolf is second and mainly assists the α in decision-making or replaces α when necessary. The δ wolf is at the third level and accepts instructions from α and β, which mainly entail reconnaissance activities. The ω group is at the bottom tier, and they follow the instructions of all higher wolves and generally remain responsible for balancing the overall structure. Generally, wolves with good fitness can become α and β types, but if their fitness is poor, they are demoted. In our implementation, α, β and δ were used as initial values, which triggered the wolves to search for and locate the “prey” (i.e., the optimal c and g values). GWO generally considers social-level stratification throughout garrison and hunting activities, and during hunting, they employ searching, encircling, tracking, and attacking tactics to capture prey. Each wolf automatically updates its position during operations. The algorithm flow chart is shown in Figure 4c.

Social Level Stratification

In the GWO algorithm, the social-level stratification model of grey wolves are first constructed in which α, β, and δ are the first, second, and third optimal solutions, respectively, and the remainder is ω. In this algorithm, as the number of iterations increases, α, β and δ always represents the top three best-performing solutions.

Encircling the Prey

When the wolves find prey, the distance, D, from the prey is first determined using Equation (1). The wolves gradually approach and surround the prey, and the wolf location is updated by Equation (2). Figure 4b shows the location update of the grey wolf. It can be seen that the final position will be at a random position within the circle with a radius R.
D = C X p ( t ) X ( t )
X ( t + 1 ) = X p ( t ) A D
A = 2 a r 1 a
C = 2 r 2
Here, t is the number of iterations, Xp is the position vector of the prey, X is the position vector of a grey wolf, A and C are vector coefficients, r1 and r2 are random vectors in [0, 1] and a is the convergence factor in [0, 2].

Tracking the Prey

After the wolves have located their prey, the β and δ wolves surround it under the command of the α wolf. In each iteration, the three fittest grey wolves (i.e., α, β, and δ) are selected, and the positions of the others are updated. The distances between the α, β and δ wolves and their prey are determined using Equations (5) and (6).
D α = | C 1 X α X | D β = | C 2 X β X | D δ = | C 3 X δ X |
X 1 = | X α A 1 D α | X 2 = | X β A 2 D β | X 3 = | X δ A 3 D δ |

Aggressive Behaviour

The ω wolves are instructed to approach the prey, and their positions are updated using Equation (7). When the value generated by A is in [−1, 1], the wolf gradually approaches the prey, and when the value is in [1, 2], the wolf increases its search range to find the next prey.
X ( t + 1 ) = X 1 + X 2 + X 3 3

2.4.5. Model Establishment and Performance Evaluation

The quantitative prediction models based on SVR and PLS were established by using spectral characteristic information. Their performances were evaluated using the Rp, RMSEP, and RPD values. RMSEP is used to evaluate the prediction ability of the established model for external verification samples. Rp is used to represent the correlation between the predicted value and the measured value of the sample. When the RMSEP value is near zero, the Rp value is closer to 1 in the range of [0, 1], indicating that the established model has superior predictability and generalization. The RPD value (i.e., the ratio of the standard deviation of the prediction to the RMSEP is the final indicator used to evaluate the model. The threshold segmentation method is then adopted as the standard for evaluating the prediction model [31]. When the RPD is less than 1.4, the model performs poorly and cannot be used. When it is between 1.4 and 1.8, the sample data can be roughly analysed and correlated [32]. However, when it falls between 1.8 and 2, the model can make good predictions. If it is greater than two, the established model has strong predictability. As the RPD value increases, the robustness of the model improves. All spectral data processing and model optimization were performed using MATLAB R2021b.

3. Results and Analysis

3.1. Spectral Characteristics

The raw and pre−processed spectra of the samples are shown in Figure 2. It can be seen from Figure 2b that the spectra exhibited two distinct absorption peaks at 1170 and 1450 nm. The former peak may have been caused by the C–H stretching vibration of CH3 and the first overtone of the O–H stretching [33]. The second absorption peak may have been caused by the first overtone of the O–H stretching [34].

3.2. Comparison of Models

3.2.1. Data Set Partitioning

In this study, we modelled the absorbance values of the samples as input data. Before constructing the quantitative prediction model, we first divided the sample data into training and predicting datasets at a ratio of 4:1. First, all samples were ranked in order of moisture content from lowest to highest. From top to bottom, every five samples were grouped. Then, from the samples in each group, one was randomly selected as the prediction dataset, and the remaining four were used for training. The resulting training dataset contained 244 samples and the prediction dataset contained 61 samples.

3.2.2. PLS

In order to explore the relationship between the near-infrared spectral data of black tea and its moisture content, we first use the PLS algorithm to establish a quantitative prediction model. The results are shown in Table 2. Using the raw data as the input of the model, the results show that the Rp value is 0.8387, the RMSEP value is 0.1376, and the RPD value is 1.5490. From the experimental data, it can be seen that the PLS model based on the original data has a poor effect and cannot effectively predict the moisture content. This may be because the raw data contains a lot of redundant information, which affects the overall prediction effect of the model. To get better predictions, we used four different spectral pre−treatment methods (SNV, MSC, Z-score, and SG). The results of the PLS model based on different pre−processing methods are shown in Table 2. Experimental data show that the pre−processed data has a better effect on the predictive performance of the model than the original data. This is because the use of spectral pre−processing can minimize the data error caused by external noise and can effectively improve the accuracy of the model. Among them, the PLS model based on SNV data has the best prediction effect, with an Rp value of 0.9425, an RMSEP value of 0.0786, and an RPD value of 2.9276. This suggests that SNV can correct spectral data better than other pre−treatments. Therefore, it is feasible to use PLS models to predict the moisture content of black tea.

3.2.3. SVR

To achieve a better prediction effect, we also used a nonlinear SVR model to analyze and model the spectral data. Similar to the analysis process of PLS, the four spectral pre−treatment methods mentioned above are also used. The SVR models based on raw data and different from processed data are established. The results show that the SVR model based on the original data has an Rp value of 0.9239, an RMSEP value of 0.1146, and an RPD value of 1.7531. Compared with PLS models, SVR models are more predictive when they also use raw data as model inputs. After spectral pre−processing, the effect of the SVR model is further improved, and most of the results obtained are better than the PLS model, as shown in Table 3. This may be because the change in moisture content during the processing of black tea is complex and non-linear. Among them, the SVR model based on SNV data achieved the best results, with an Rp value of 0.9481, an RMSEP value of 0.0829, and an RPD value of 3.0186. Experimental data show that the nonlinear analysis method is superior in predicting the moisture content of black tea and SNV has a better correction for scattering effects and removes slope variations. Therefore, we chose SNV as the pre−treatment method in the subsequent study analysis and SVR as the modeling method in the subsequent study. Figure 5a shows the distribution of the measured and predicted moisture contents obtained overall black tea samples based on the SNV−SVR prediction model. Figure 5b illustrates the validation errors. The blue asterisks are the actual humidity values measured by the oven according to the national standard method, and the red circles are the predicted humidity values of the model.

3.2.4. SNV−PCA−SVR

Here, we used the SNV−PCA data as input data for the SVR to predict the moisture content. PCA methods are often used to reduce large amounts of data and eliminate irrelevant variables [35]. Using the SNV−PCA data obtained after the combination of SNV and PCA can better reflect the spectral characteristics. Combining SNV−PCA data with SVR, we obtained the SNV−PCA−SVR model. The Rp, RMSEP, and RPD values of the prediction set were 0.9554, 0.0704, and 3.3896, respectively. The results show that the SNV−PCA−SVR model better predicted the moisture content. Figure 5c shows the distribution of the measured and predicted moisture content across all processes using the SNV−PCA−SVR model. Figure 5d depicts the validation errors.

3.2.5. SNV−PCA−GWO−SVR

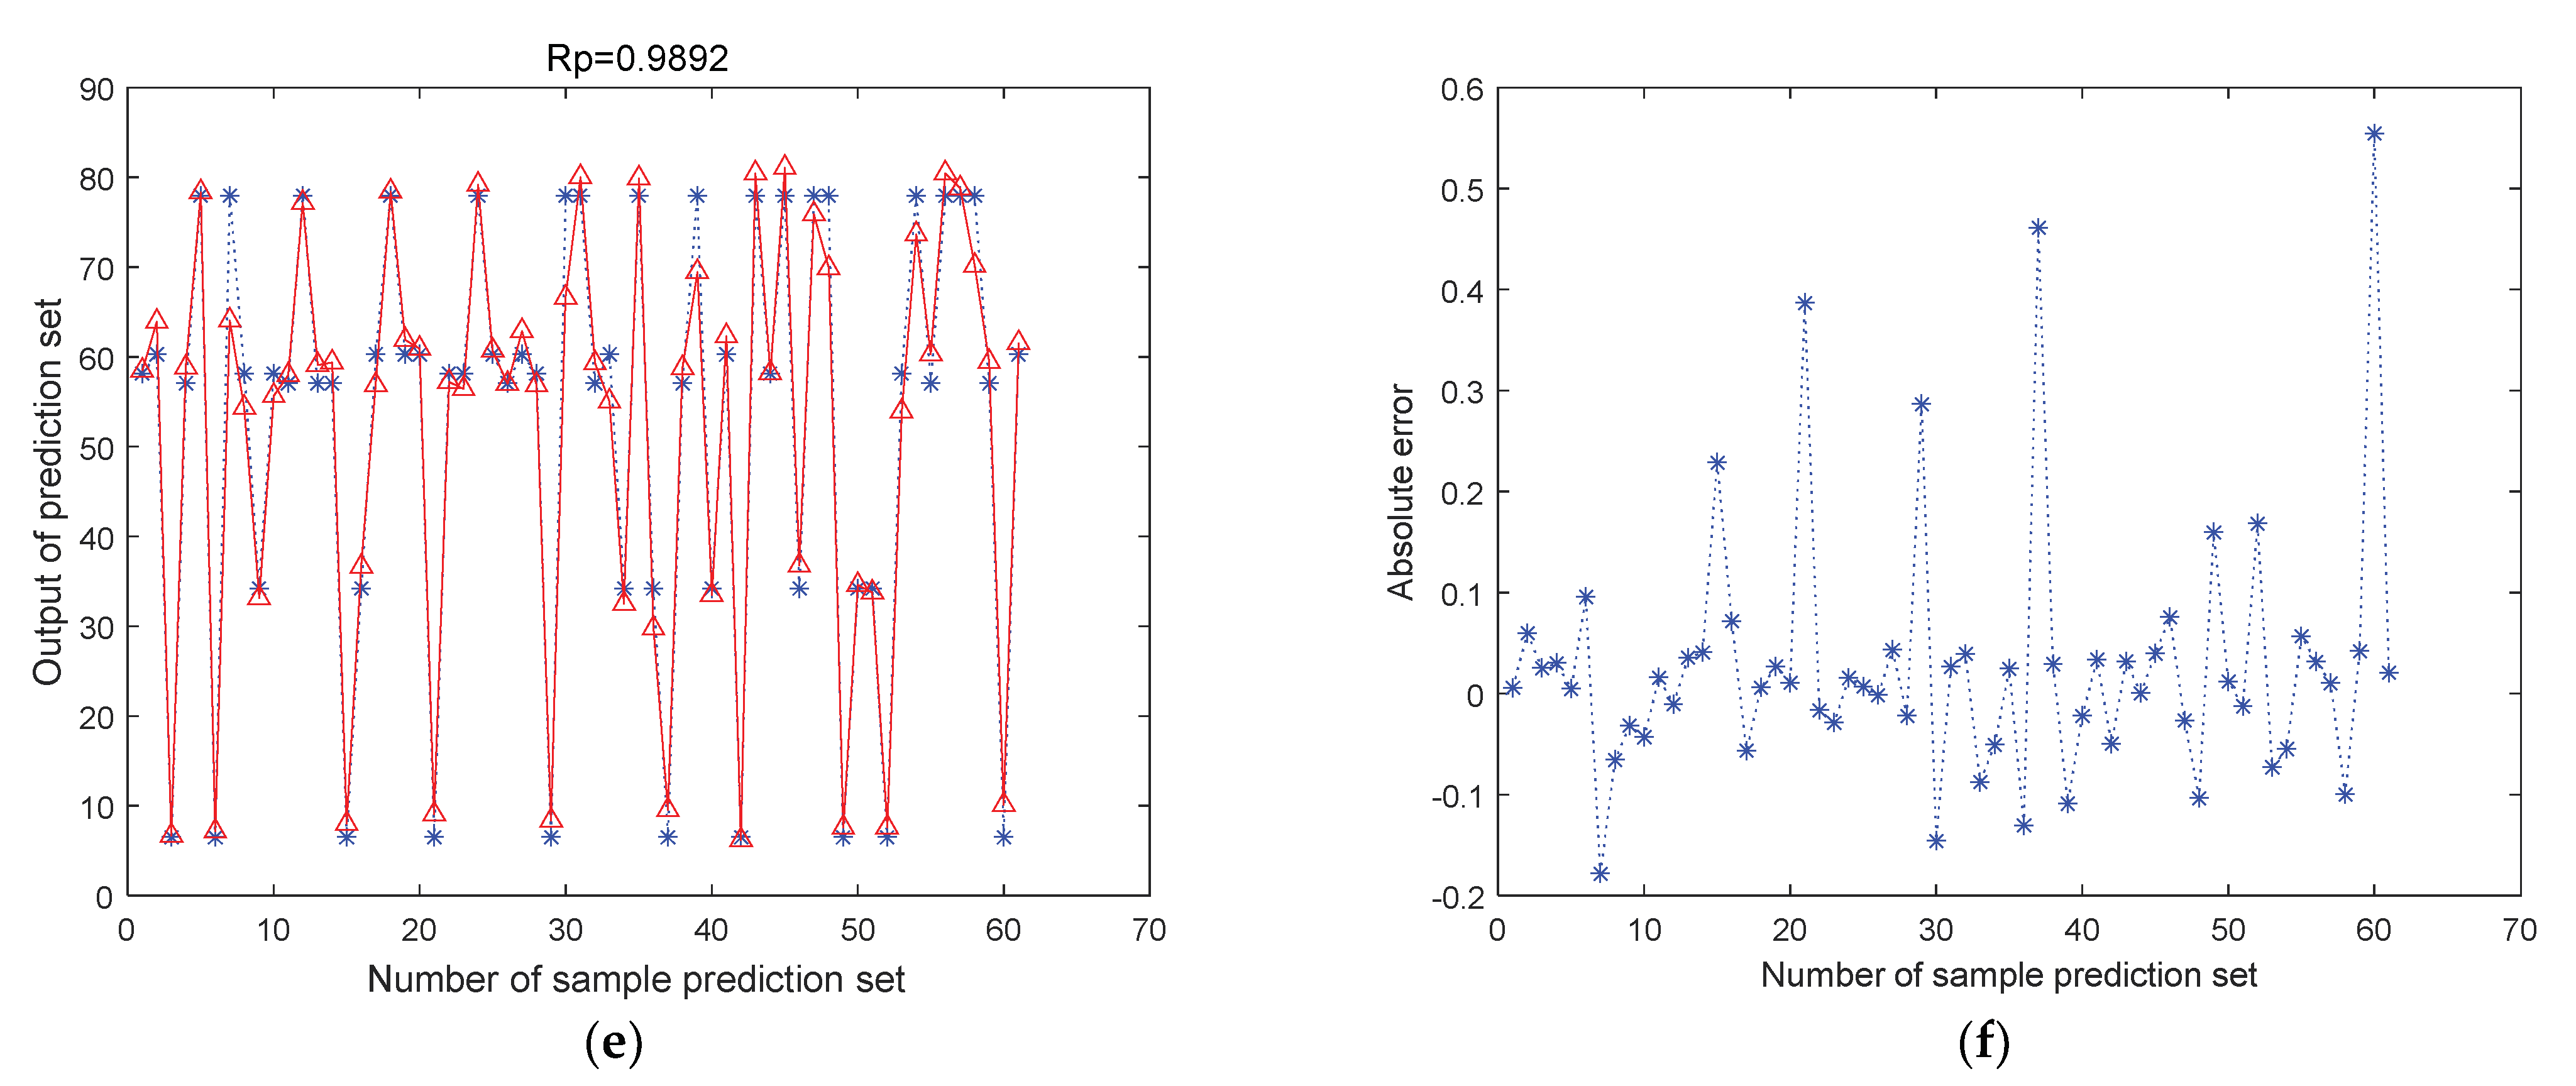
Here, we utilized the GWO algorithm to optimize the SVR method. Compared with SVR, GWO−SVR has better prediction accuracy and shorter running time. This may be because, in the GWO algorithm, the assignment of the task of searching for the optimal solution is reasonable and global optimization can be achieved. The parameter selection results of the model are shown in Table 3. The SNV−PCA data were then used as input to the SNV−PCA−GWO−SVR model, which produced improved results over the previous models. The Rp, RMSEP, and RPD values of the prediction set were 0.9892, 0.0362, and 6.5001, respectively. Figure 5e shows the distribution of the measured and predicted moisture content obtained over all processes using the SNV−PCA−GWO−SVR model. Figure 5f depicts the validation errors.

4. Discussion

In this study, we explored the feasibility of using micro−NIRS to rapidly determine the moisture content of black tea. At present, in the non-destructive testing of tea moisture content, a near-infrared spectrometer based on laboratory conditions has been widely used. However, the scenarios and conditions under which it can be applied are still limited. The use of micro−NIRS can be a good solution to such problems. Additionally, compared with the results of the studies in predicting the moisture content of black tea withering process, for example, multifrequency microwave signals are used to predict the moisture content of withering leaves [36], and the moisture content predicted of withering leaves is based on hyperspectral image [5], we also obtained equally superior prediction results. Furthermore, the operation of micro−NIRS is simpler and easier to promote.
In addition, due to the concentration of research on the moisture content of the black tea withering process, this leads to the lack of attention to the change of moisture content of black tea and non-destructive testing studies in the subsequent stages of the wilting process. Therefore, we collect the spectral information and moisture content of black tea at different stages of processing to make the collected data more comprehensive and representative. The results of linear partial least squares (PLS) and nonlinear support vector regression (SVR) are compared, and the SVR model is found to be better. It can be seen that the change in the moisture content of black tea during processing is not a simple linear change. For different processing stages, the moisture content of black tea also has different requirements, and its change process is also more complicated. Therefore, the method and strategy proposed in this paper are helpful to obtain moisture content information in real-time and control the change of moisture content, which is of practical significance. Finally, we used micro−NIRS combined with machine learning algorithms to build the hybrid model (SNV−PCA−GWO−SVR). The model is suitable for predicting the moisture content at each stage of black tea processing and has strong applicability and practicality.
Although the study focused on only one tea variety, the data collected included sample information at each stage of black tea processing and was somewhat representative. Based on the above research results, we will further collect different types of black tea sample data in future studies. By augmenting the sample information of different categories, it aims to enhance the predictability and application range of moisture content. Moreover, the proposed method and strategy can also be used in the prediction of moisture content of other plants, which has strong application. In summary, the application of micro−NIRS is of great significance for the application and development of near-infrared spectroscopy in the field of tea processing. This research has also promoted research into the non-destructive testing of other chemical components of tea using micro−NIRS.

5. Conclusions

This study proves that the prediction of the moisture content of black tea can be achieved by combining SVR and PLS with micro−NIR. The proposed method strategy can be applied to the non-destructive measurement of black tea moisture content during processing, and the operation is more simple and more convenient, which can not only replace traditional detection methods but also outperform other rapid detection methods based on laboratory conditions. Experimental data show that SNV is superior to other spectral pre−treatment methods and can better correct spectral information. At the same time, the ability of the linear analysis method (PLS) and nonlinear analysis method (SVR) to analyze spectral data and moisture content of black tea is compared, and the superiority and stability of the SVR model are discussed. After using SNV in combination with PCA, the SNV−PCA method can not only reduce spectral noise but also effectively extract spectral features. On this basis, we also use the GWO algorithm to explore its impact on SVR prediction models. The model comparison results show that the GWO algorithm can more effectively improve the ability of SVR to analyze spectral data, better realize the selection of key parameters of the kernel function in the SVR model, and further improve the prediction accuracy of black tea moisture content. The final mixed model SNV−PCA−GWO−SVR model can be used as an effective method for nondestructive testing of the moisture content of black tea, which is suitable for predicting the moisture content of black tea at different stages of processing.

Author Contributions

H.Z.: Formal analysis, Writing—original draft, Writing—review & editing, Methodology. S.S.: Writing—original draft, Data curation, Methodology. T.L.: Data curation. X.S.: Data curation. J.Z.: Investigation. Y.J.: Funding acquisition. Q.D.: Formal analysis, Methodology. H.Y.: Funding acquisition, Resources. All authors have read and agreed to the published version of the manuscript.

Funding

This work was supported by the Science and Technology Innovation Project of the Chinese Academy of Agricultural Sciences [grant number CAAS-ASTIP-TRICAAS]; and China Agriculture Research System of MOF and MARA [grant number CARS-19].

Institutional Review Board Statement

Not applicable.

Informed Consent Statement

Not applicable.

Data Availability Statement

Not applicable.

Conflicts of Interest

The authors declare that they have no known competing financial interest or personal relationship that could have appeared to influence the work reported in this paper.

References

  1. Wang, J.H.; Wang, Y.F.; Cheng, J.J.; Wang, J.; Sun, X.D.; Sun, S.; Zhang, Z.Y. Enhanced cross-category models for predicting the total polyphenols, caffeine and free amino acids contents in Chinese tea using NIR spectroscopy. Lwt 2018, 96, 90–97. [Google Scholar] [CrossRef]
  2. Wang, Y.J.; Ren, Z.Y.; Li, M.Y.; Yuan, W.X.; Zhang, Z.Z.; Ning, J.M. pH indicator-based sensor array in combination with hyperspectral imaging for intelligent evaluation of withering degree during processing of black tea. Spectrochim. Acta Part A Mol. Biomol. Spectrosc. 2022, 271, 120959. [Google Scholar] [CrossRef] [PubMed]
  3. Liang, G.Z.; Dong, C.W.; Hu, B.; Zhu, H.K.; Yuan, H.B.; Jiang, Y.W.; Hao, G.S. Prediction of Moisture Content for Congou Black Tea Withering Leaves Using Image Features and Nonlinear Method. Sci. Rep. 2018, 8, 7854. [Google Scholar] [CrossRef] [Green Version]
  4. Vargas, R.; Vecchietti, A. Influence of raw material moisture on the synthesis of black tea production process. J. Food Eng. 2016, 173, 76–84. [Google Scholar] [CrossRef]
  5. Dong, C.W.; An, T.; Yang, M.; Yang, C.S.; Liu, Z.Y.; Li, Y.; Duan, D.D.; Fan, S.X. Quantitative prediction and visual detection of the moisture content of withering leaves in black tea (Camellia sinensis) with hyperspectral image. Infrared Phys. Technol. 2022, 123, 104118. [Google Scholar] [CrossRef]
  6. Hossain, M.A.; Ahmed, T.; Hossain, M.S.; Dey, P.; Ahmed, S.; Hossain, M.M. Optimization of the factors affecting BT-2 black tea fermentation by observing their combined effects on the quality parameters of made tea using Response Surface Methodology (RSM). Heliyon 2022, 8, e08948. [Google Scholar] [CrossRef]
  7. Qu, F.F.; Zhu, X.J.; Ai, Z.Y.; Ai, Y.J.; Qiu, F.F.; Ni, D.J. Effect of different drying methods on the sensory quality and chemical components of black tea. Lwt 2019, 99, 112–118. [Google Scholar] [CrossRef]
  8. Chen, A.; Chen, H.Y.; Chen, C.C. Use of Temperature and Humidity Sensors to Determine Moisture Content of Oolong Tea. Sensors 2014, 14, 15593–15609. [Google Scholar] [CrossRef] [Green Version]
  9. Wei, Y.Z.; Wu, F.Y.; Xu, J.; Sha, J.J.; Zhao, Z.F.; He, Y.; Li, X.L. Visual detection of the moisture content of tea leaves with hyperspectral imaging technology. J. Food Eng. 2019, 248, 89–96. [Google Scholar] [CrossRef]
  10. Jia, J.M.; Zhou, X.F.; Li, Y.; Wang, M.; Liu, Z.Y.; Dong, C.W. Establishment of a rapid detection model for the sensory quality and components of Yuezhou Longjing tea using near-infrared spectroscopy. Lwt 2022, 164, 113625. [Google Scholar] [CrossRef]
  11. Wang, Y.J.; Cui, Q.Q.; Jin, S.S.; Zhuo, C.; Luo, Y.H.; Yu, Y.L.; Ning, J.M.; Zhang, Z.Z. Tea Analyzer: A low-cost and portable tool for quality quantification of postharvest fresh tea leaves. Lwt 2022, 159, 113248. [Google Scholar] [CrossRef]
  12. Shen, S.; Hua, J.J.; Zhu, H.K.; Yang, Y.Q.; Deng, Y.L.; Li, J.; Yuan, H.B.; Wang, J.J.; Zhu, J.Y.; Jiang, Y.W. Rapid and real-time detection of moisture in black tea during withering using micro-near-infrared spectroscopy. Lwt 2022, 155, 112970. [Google Scholar] [CrossRef]
  13. Wang, Y.J.; Liu, Y.; Cui, Q.Q.; Li, L.Q.; Ning, J.M.; Zhang, Z.Z. Monitoring the withering condition of leaves during black tea processing via the fusion of electronic eye (E-eye), colorimetric sensing array (CSA), and micro-near-infrared spectroscopy (NIRS). J. Food Eng. 2021, 300, 110534. [Google Scholar] [CrossRef]
  14. Kang, R.X.; Wang, X.; Zhao, M.; Henihan, L.E.; O’Donnell, C.P. A comparison of benchtop and micro NIR spectrometers for infant milk formula powder storage time discrimination and particle size prediction using chemometrics and denoising methods. J. Food Eng. 2022, 329, 111087. [Google Scholar] [CrossRef]
  15. Lan, Z.W.; Zhang, Y.F.; Zhang, Y.; Liu, F.; Ji, D.; Cao, H.; Wang, S.M.; Lu, T.L.; Meng, J. Rapid evaluation on pharmacodynamics of Curcumae Rhizoma based on Micro-NIR and benchtop-NIR. J. Pharm. Biomed. Anal. 2021, 200, 114074. [Google Scholar] [CrossRef]
  16. Sandak, J.; Niemz, P.; Hansel, A.; Mai, J.N.; Sandak, A. Feasibility of portable NIR spectrometer for quality assurance in glue-laminated timber production. Constr. Build. Mater. 2021, 308, 125026. [Google Scholar] [CrossRef]
  17. Li, L.Q.; Wang, Y.J.; Jin, S.S.; Li, M.H.; Chen, Q.S.; Ning, J.M.; Zhang, Z.Z. Evaluation of black tea by using smartphone imaging coupled with micro-near-infrared spectrometer. Acta Part A Mol. Biomol. Spectrosc. 2020, 246, 118991. [Google Scholar] [CrossRef]
  18. Nagy, M.M.; Wang, S.P.; Farag, M.A. Quality analysis and authentication of nutraceuticals using near IR (NIR) spectroscopy: A comprehensive review of novel trends and applications. Trends Food Sci. Technol. 2022, 123, 290–309. [Google Scholar] [CrossRef]
  19. Miloš, B.; Bensa, A.; Japundžić-Palenkić, B. Evaluation of Vis-NIR preprocessing combined with PLS regression for estimation soil organic carbon, cation exchange capacity and clay from eastern Croatia. Geoderma Reg. 2022, 30, e00558. [Google Scholar] [CrossRef]
  20. Santos, C.E.D.; Sampaio, R.C.; Coelho, L.D.; Bestard, G.A.; Llanos, C.H. Multi-objective adaptive differential evolution for SVM/SVR hyperparameters selection. Pattern Recognit. 2020, 110, 107649. [Google Scholar] [CrossRef]
  21. Lee, H.; Torres-Verdin, C. Compositions of liquid mixtures from near-infrared spectrum data via radial basis functions and artificial neural networks. Vib. Spectrosc. 2020, 110, 103108. [Google Scholar] [CrossRef]
  22. Balogun, A.L.; Rezaie, F.; Pham, Q.B.; Gigovic, L.; Drobnjak, S.; Aina, Y.A.; Panahi, M.; Yekeen, S.T.; Lee, S. Spatial prediction of landslide susceptibility in western Serbia using hybrid support vector regression (SVR) with GWO, BAT and COA algorithms. Geosci. Front. 2020, 12, 101104. [Google Scholar] [CrossRef]
  23. An, T.; Yu, H.; Yang, C.S.; Liang, G.Z.; Chen, J.Y.; Hu, Z.H.; Hu, B.; Dong, C.W. Black tea withering moisture detection method based on convolution neural network confidence. J. Food Process. Eng. 2020, 43, e13428. [Google Scholar] [CrossRef]
  24. Rady, A.; Fischer, J.; Reeves, S.; Logan, B.; Watson, N.J. The Effect of Light Intensity, Sensor Height, and Spectral Pre-Processing Methods When Using NIR Spectroscopy to Identify Different Allergen-Containing Powdered Foods. Sensors 2019, 20, 230. [Google Scholar] [CrossRef] [Green Version]
  25. Leng, T.; Li, F.; Chen, Y.; Tang, L.J.; Xie, J.H.; Yu, Q. Fast quantification of total volatile basic nitrogen (TVB-N) content in beef and pork by near-infrared spectroscopy: Comparison of SVR and PLS model. Meat Sci. 2021, 180, 108559. [Google Scholar] [CrossRef]
  26. Xie, G.; Qian, Y.T.; Wang, S.Y. Forecasting Chinese cruise tourism demand with big data: An optimized machine learning approach. Tour. Manag. 2020, 82, 104208. [Google Scholar] [CrossRef]
  27. Wei, X.; Li, S.; Zhu, S.P.; Zheng, W.Q.; Xie, Y.; Zhou, S.L.; Hu, M.D.; Miao, Y.J.; Ma, L.K.; Wu, W.J.; et al. Terahertz spectroscopy combined with data dimensionality reduction algorithms for quantitative analysis of protein content in soybeans. Spectrochim. Acta Part A Mol. Biomol. Spectrosc. 2021, 253, 119571. [Google Scholar] [CrossRef]
  28. Chang, C.C.; Lin, C.J. LIBSVM: A Library for Support Vector Machines. ACM Trans. Intell. Syst. Technol. 2011, 2, 1–27. [Google Scholar] [CrossRef]
  29. Mirjalili, S.; Mirjalili, S.M.; Lewis, A. Grey Wolf Optimizer. Adv. Eng. Softw. 2014, 69, 46–61. [Google Scholar] [CrossRef] [Green Version]
  30. Ghalambaz, M.; Yengejeh, R.J.; Davami, A.H. Building energy optimization using Grey Wolf Optimizer (GWO). Case Stud. Therm. Eng. 2021, 27, 101250. [Google Scholar] [CrossRef]
  31. Liu, S.Y.; Wang, S.T.; Hu, C.H.; Zhan, S.J.; Kong, D.M.; Wang, J.Z. Rapid and accurate determination of diesel multiple properties through NIR data analysis assisted by machine learning. Spectrochim. Acta Part A Mol. Biomol. Spectrosc. 2022, 277, 121261. [Google Scholar] [CrossRef] [PubMed]
  32. Viegas, T.R.; Mata, A.L.M.L.; Duarte, M.M.L.; Lima, K.M.G. Determination of quality attributes in wax jambu fruit using NIRS and PLS. Food Chem. 2016, 190, 1–4. [Google Scholar] [CrossRef] [PubMed] [Green Version]
  33. Liu, Z.Y.; Zhang, R.T.; Yang, C.S.; Hu, B.; Luo, X.; Li, Y.; Dong, C.W. Research on moisture content detection method during green tea processing based on machine vision and near-infrared spectroscopy technology. Spectrochim. Acta Part A Mol. Biomol. Spectrosc. 2022, 271, 120921. [Google Scholar] [CrossRef] [PubMed]
  34. Dong, C.W.; Ye, Y.L.; Yang, C.S.; An, T.; Jiang, Y.W.; Ye, Y.; Li, Y.Q.; Yang, Y.Q. Rapid detection of catechins during black tea fermentation based on electrical properties and chemometrics. Food Biosci. 2021, 40, 100855. [Google Scholar] [CrossRef]
  35. Jin, G.; Wang, Y.J.; Li, L.Q.; Shen, S.S.; Deng, W.W.; Zhang, Z.Z.; Ning, J.M. Intelligent evaluation of black tea fermentation degree by FT-NIR and computer vision based on data fusion strategy. Lwt 2020, 125, 109216. [Google Scholar] [CrossRef]
  36. Wu, C.Y.; Qian, J.; Zhang, J.Y.; Wang, J.; Li, B.; Wei, Z.B. Moisture measurement of tea leaves during withering using multifrequency microwave signals optimized by ant colony optimization. J. Food Eng. 2022, 335, 111174. [Google Scholar] [CrossRef]
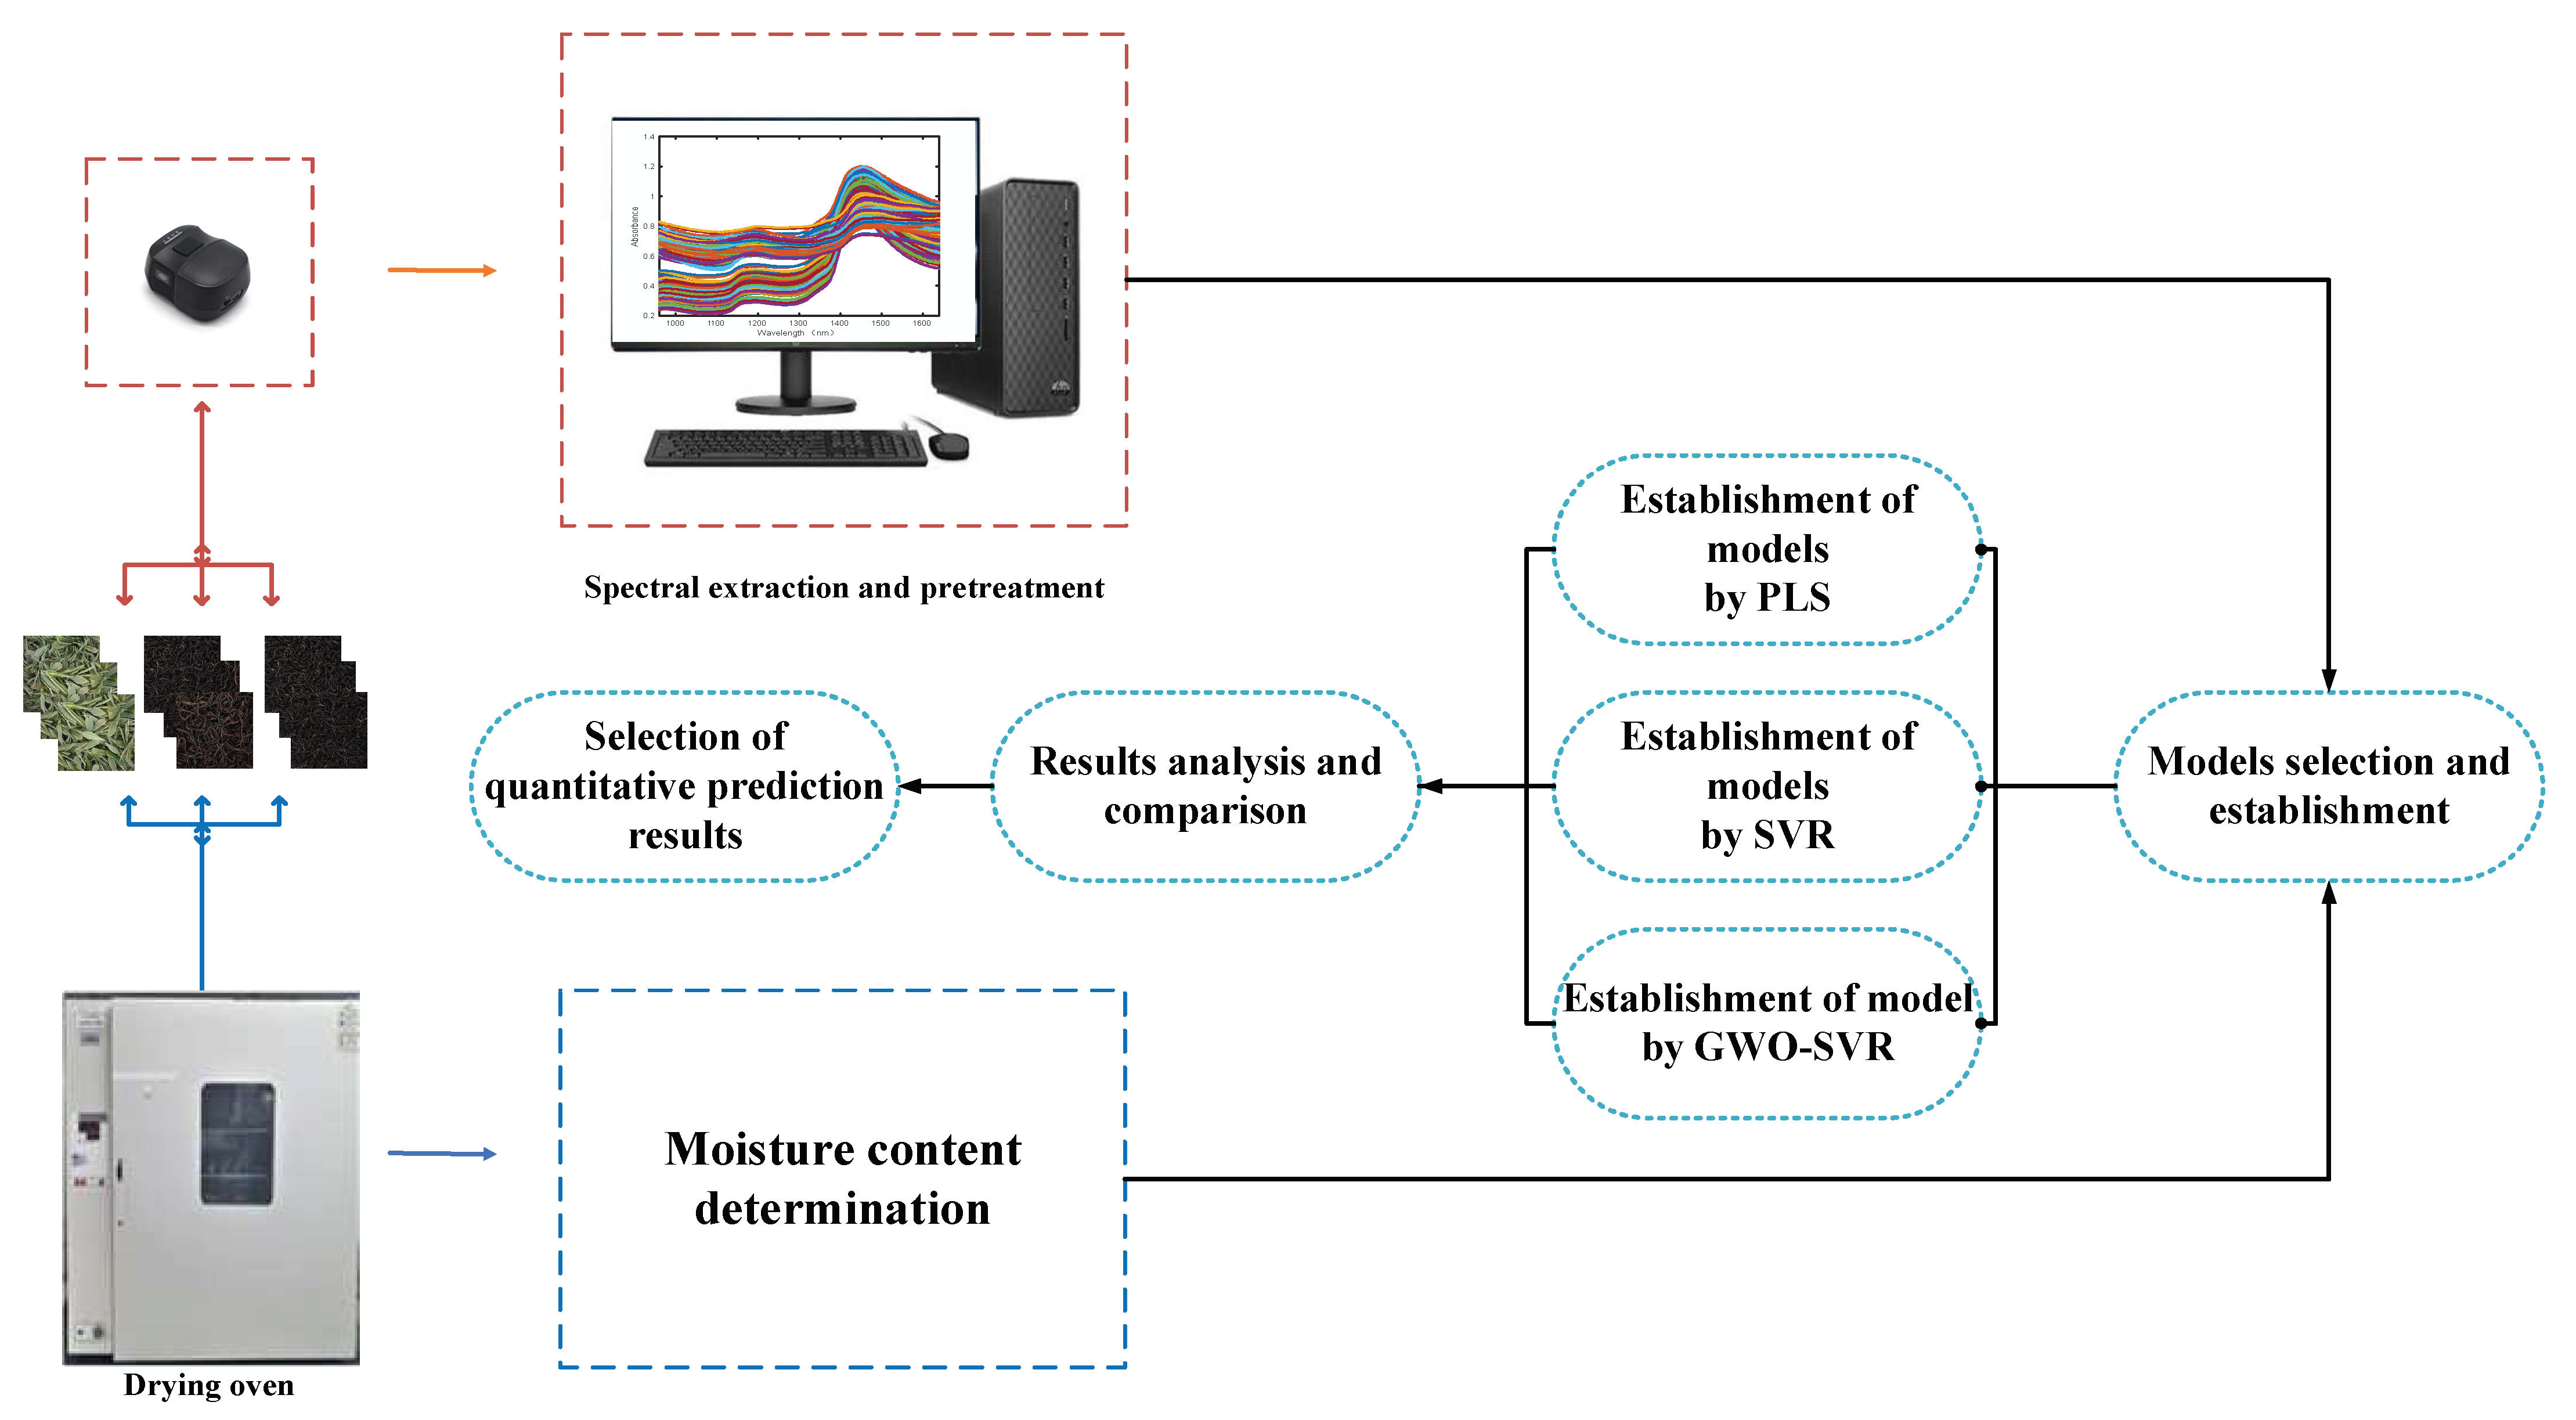
Figure 1. The process of the experiment.
Horticulturae 08 01170 g001
Figure 2. NIR raw spectrum and various pre−processed spectrum: (a) Micro−NIRS spectrometer; (b) Raw spectrum; (c) Spectrum after SNV pre−treatment; (d) Spectrum after MSC pre−treatment; (e) Spectrum after Z-score pre−treatment; (f) Spectrum after SG pre−treatment.
Horticulturae 08 01170 g002
Figure 3. The optimization results of parameter selection; (a) Parameter selection based on MSC data; (b) Parameter selection based on SG data; (c) Parameter selection based on Z−score data; (d) Parameter selection based on SNV data.
Horticulturae 08 01170 g003aHorticulturae 08 01170 g003b
Figure 4. (a) Distribution of social class; (b) Position updating of the grey wolf; (c) The algorithm flow chart.
Horticulturae 08 01170 g004aHorticulturae 08 01170 g004b
Figure 5. Model validation for moisture content: SNV−SVR (a), error with SNV−SVR (b), SNV−PCA−SVR (c), error with SNV−PCA−SVR (d), SNV−PCA−GWO−SVR (e), error with SNV−PCA−GWO−SVR (f).
Horticulturae 08 01170 g005aHorticulturae 08 01170 g005b
Table 1. Moisture content distribution of various samples during black tea processing.
Processing StepMoisture Content Range/%Average Moisture Content/%Variance of Moisture ContentStandard Deviation of Moisture ContentNumber of Samples
Fresh leaves78.62–76.8577.970.10440.396051
Withering62.66–59.2460.310.39860.773055
Rolling58.29–56.4357.080.54150.901350
Fermentation58.95–57.3358.150.17710.515440
First drying34.85–33.9034.220.12160.427150
Second drying6.68–6.366.520.03000.212259
Table 2. Result of moisture content prediction models using different pre-processing methods.
Prediction MethodModelsPre-ProcessingPrediction Data SetRPD
RpRMSEP
Micro-NIRSSVRRaw0.92390.11461.7531
SNV0.94810.08293.0186
SG0.92450.09732.0101
Z-score0.94360.06942.9069
MSC0.93440.09611.9103
PLSRaw0.83870.13761.5490
SNV0.94250.07862.9276
SG0.93970.12112.0872
Z-score0.94670.08952.8344
MSC0.89610.11152.0054
Table 3. Performance comparison of all models.
Prediction MethodModelscgPre-ProcessingPrediction Data SetRPD
RpRMSEP
Micro-NIRSSVR22.62740.03125SNV0.94810.08293.0186
32.0000.03125MSC0.93440.09611.9103
11.31370.03125Z-score0.94360.06942.9069
22.62740.03125SG0.92450.09732.0101
22.62740.03125SNV−PCA0.95540.07043.3896
GWO-SVR1.0004.000SNV−PCA0.98920.03626.5001
Publisher’s Note: MDPI stays neutral with regard to jurisdictional claims in published maps and institutional affiliations.