Article

Response of Nutritional Status and Tea Quality to the Rate and Substitution of Chemical Fertilizers with Organic Manure

1
Tea Research Institute, Chinese Academy of Agricultural Sciences, Hangzhou 310008, China
2
Key Laboratory of Tea Biology and Resource Utilization of the Ministry of Agriculture, Hangzhou 310008, China
*
Author to whom correspondence should be addressed.
Horticulturae 2022, 8(12), 1198; https://doi.org/10.3390/horticulturae8121198
Submission received: 12 October 2022 / Revised: 8 December 2022 / Accepted: 13 December 2022 / Published: 15 December 2022
(This article belongs to the Special Issue Advances in Tea Plant Biology and Tea Quality Regulation)

Abstract

:
Proper fertilization is important to sustainable tea production. A field experiment was conducted to investigate the response of quality components in a chlorotic tea variety (Zhonghuang-2) to rates of fertilizers and the substitution ratio of chemical fertilizers by organic manure based on rapeseed cake. Chlorotic tea varieties have unique metabolic characteristics and produce superior tea containing high contents of free amino acids. Results showed that fertilization significantly increased yield and contents of free amino acid (TFAA) but reduced contents of total polyphenol (TP) and the ratio of TP/TFAA. Contents of TFAA and TP and the TP/TFAA ratio were closely related to nitrogen (N) concentrations in plant tissues in response to the rate of N fertilizers. The results suggest that the quality-related components in the chlorotic tea variety respond to fertilizers in a similar way as normal tea varieties. The optimal rates of N, phosphorus (P), and potassium fertilizers were discussed and recommended based on the response of quality components of tea and the contents of nutrients in plants and soil. The full substitution of chemical fertilizers by organic manure showed no special benefit on tea quality and had lower N and P agronomic use efficiency due to a low bioavailability of nutrients. The partial substitution of chemical fertilizers by organic manure significantly improved tea yield, quality, profit, and economic and environmental sustainability.

1. Introduction

Tea (Camellia sinensis) is a valuable cash crop widely planted all over the word and plays important roles in increasing farmers’ income and alleviating poverty of rural areas in China and other tea-producing countries. The tea quality is determined by internal chemical compositions, which is greatly affected by the supply of nutrients to tea plants [1]. Deficiency of nutrients reduces tea yield and quality [1]. Nitrogen (N), phosphorus (P), and potassium (K) are nutrients most widely applied in tea fields. The beneficial effects of fertilizers on yield and quality are realized only when they are properly applied [2,3,4,5]. On the other hand, the use of excessive amounts of inorganic fertilizers is well known [6,7]. The excessive application of N, P, and K fertilizers negatively affects the biosynthesis and accumulation of free amino acids, catechins and lipid composition, and reduces tea quality [2,8,9,10,11]. In addition, the excessive application of fertilizers deteriorates soil quality and causes serious environmental problems [12,13,14]. Recent studies highlighted that tea-planted soils are global hotspots for N2O emission as a result of the overuse of N fertilizers [15].
Organic fertilizers are important sources of nutrients. The application of organic manure improves soil fertility and microbiological activity, mitigates soil acidification, and decreases the runoff of nutrients [16,17,18,19]. However, compared to chemical fertilizers, organic fertilizers have low nutrient concentrations, slow nutrient-release rates, and high application costs. This problem can be overcome by the application of organic fertilizers in combination with chemical fertilizers. Partial substitution of chemical fertilizers with organic manure increases nutrient use efficiency, reduces the application of chemical fertilizers and carbon dioxide emissions, and better sustains soil fertility without compromising yield and quality [20,21]. However, the optimal ratios between organic and chemical fertilizers are variable depending upon crop species, the application rate of fertilizers, and the type of organic fertilizers [20]. Compared to the extensive investigations in cereal crops [20,21], the effect of organic substitution on the yield and quality of perennial tea plants has been tested only limitedly [17,18,22]. Synchronizing the release of nutrients from organic fertilizers with the nutritional demand of crops is a challenge because the former is greatly influenced by soil temperature [23]. Spring tea, especially the early spring tea, has the best quality compared to teas of other seasons [24,25]. The growth and biosynthesis of metabolites of spring tea might be inhibited by weak and slow release of nutrients from organic fertilizers due to low temperatures. Previous work showed that organically grown tea had low contents of free amino acids [26].
The flavor and quality of tea are attributed to polyphenols, alkaloids, and free amino acids. Amino acids are the principal contributors to the mellow taste of brewed green tea. Premium green tea has high contents of free amino acids. In recent years, several natural mutants with chlorotic young leaves sensitive to light intensity have been cultivated in China and Japan [27,28,29]. These chlorotic tea varieties have enhanced levels of free amino acids and superior quality of made teas. They have higher economic value than the non-chlorotic varieties. The high content of free amino acids in these tea varieties is the result of abnormal protein degradation and weakening biosynthesis of nitrogen-containing compounds such as chlorophyll, purines, and nucleotides rather than enhanced biosynthesis of amino acids [27,28,29]. However, due to the limited photosynthetic capacity of chlorotic leaves, these varieties generally have lower yields and contents of catechins than normal varieties [27]. Improving the nutritional status of chlorotic tea plants through proper fertilization is a promising approach to overcome these shortcomings. Due to unique metabolic characteristics, these varieties might respond to fertilization differently than the normal varieties. Compared to extensive works on the metabolism of quality components in chlorotic mutants [27,28,29], the effect of fertilization has not been evaluated. In the present work, a field experiment was conducted for three years to investigate the response of nutrient uptake and quality parameters in a chlorotic tea variety to the application rate of fertilizers and the substitution ratio of chemical fertilizers by organic fertilizers. The aims are to develop proper nutrient management schemes for these cherished tea varieties to achieve sustainable yields, good quality, and high profits with reduced environmental risks.

2. Materials and Methods

2.1. Field Experiment

A field experiment was set up in 2017 in Tiantai County, Zhejiang Province, China. The tea cultivar was Zhonghuang-2, a native mutant with chlorotic young leaves under natural light intensity [27]. The soil pH was 5.70. The contents of total organic carbon, total N, available P, and available K were 9.63 g kg−1, 1.1 g kg−1, 10.1 mg kg−1, and 134 mg kg−1, respectively. There were five treatments: A control without any fertilizers (CK), chemical fertilizers at optimized application rates (referred to as NPK), substitution of the chemical fertilizers fully or partially by organic manure (referred to as OM and NPKOM, respectively), and high application rates of chemical fertilizers (referred to as NPK-H). The amounts and compositions of nutrients of treatments are presented in Table 1. The NPK, OM, and NPKOM received the same total amount (527 kg ha−1) of N, P2O5, and K2O but different rates of each nutrient. In the NPK treatment, a compound fertilizer specially formulated for tea (N-P2O5-K2O -MgO, 18-8-12-2) [30] was applied in the middle of October as a basal fertilizer and two topdressings in early February and at the end of April after the harvest of spring tea. The amounts of fertilizers of the three applications were 40%, 30%, and 30% of the total, respectively. In the OM treatment, rapeseed cake manure (N-P2O5-K2O, 5.8-2.7-1.5) was applied in early October as the basal fertilizer. In NPKOM treatment, half of the total amount of nutrients was supplied from rapeseed cake manure and another half from compound fertilizer and urea. In this treatment, all organic manure and compound fertilizer were applied as the basal fertilizer. A certain amount of urea was applied to supplement N to the defined rate (Table 1). Urea was applied as two topdressings equally in early February and at the end of April. The NPK-H treatment received a doubled amount of compound fertilizer of the NPK treatment. The application timing of NPK-H was the same as the NPK treatment. In all treatments, the basal fertilizers were applied to furrows with depths of 15–20 cm and the topdressing fertilizers to furrows with depths of 5–10 cm located between rows. The furrows were covered with soil after the application of fertilizers. The cost of fertilization including fertilizers and labor for application ranged from 7200 to 20,250 CNY ha−1 (Table 1). The area for a plot was 20 m2 and plots were randomly arranged in the field. There were four replications for each treatment. All other field management was the same as in the local tea plantations.

2.2. Samples and Measurements

Only spring tea was harvested for chlorotic mutant tea varieties for the highest price and profit in spring compared to other seasons. Young shoots consisting of one bud with one or two expanding leaves were harvested by hand and weighed as the fresh yield. Yield data of 2019–2020 were presented in the present work. Samples of harvested young shoots were dried in an electric oven at 60 °C following inactivation of the oxidase enzyme in a microwave oven (800 W) for 2 min, and finally ground into fine powders (using a ball mill (Mixer Mill MM300, Retsch GmbH, Haan, Germany)) for the measurement of nutrients.
In 2020, young shoots of buds with one expanding leaf were sampled on 4 April and 21 April (hereafter referred to as early and late spring, respectively). Samples were quickly frozen in liquid nitrogen and then transported to a laboratory to measure contents of chlorophyll. Chlorophyll content of young shoots was determined by spectrophotometer following extraction by acetone [1]. A portion of young shoots were freeze-dried and then ground into fine powders for the measurement of total free amino acid (TFAA) and total polyphenol (TP). Samples of young shoots (100 mg) were extracted with 5 mL of H2O in a boiling water bath for 5 min. The extract was used for determination of TFAA by spectrophotometry following reacting with ninhydrin reagent and for TP following reacting with Fe-tartrate reagent [4]. Mature leaves on the surface canopy were taken on 21 April 2020, dried at 60 °C in an electric oven, and then ground into fine powders for the measurement of nutrients. N concentration in young shoots and mature leaves was determined by an elemental analyzer (Vario Macro Cube, Elementar Analysensysteme GmbH, Langenselbold, Germany). Concentrations of P and K in plant samples were determined by Inductive Coupled Plasma-Atomic Emission Spectrometer (iCAP™ 7400 ICP-OES, Thermo Fisher Scientific, Waltham, MA, USA) after digestion at 550 °C and re-dissolved in dilute nitric acid.
Soil samples were taken using an auger in October 2020 at 5 randomly selected sites of each plot from depths of 0–20 cm and 80–100 cm. Soil from the same plot and layer was combined to obtain a composite sample. Stones and debris of roots were removed. Soil samples were separated into two portions after thorough mixing. One portion was temporarily stored in a refrigerator at 4 °C for the determination of water content and inorganic nitrogen. Ammonium (NH4+-N) and nitrate (NO3-N) in fresh soil were extracted with 2 mol L−1 potassium chloride (1/10 w/v) and determined by Discrete Chemistry Analyzer (Smartchem 140, AMS Alliance, Frepillon, France). Another portion was air-dried and passed thorough 20 mesh sieves for determining soil pH and available P and K. Soil pH was measured in 1:2.5 water paste by a glass electrode (Orion 3 Star, Thermo Ltd., Waltham, MA, USA). Soil available P and K were extracted by Mehlich-3 reagent [31] and determined by Inductive Coupled Plasma-Atomic Emission Spectrometer (iCAP™ 7400 ICP-OES, Thermo Fisher Scientific, Waltham, MA, USA). All chemicals were purchased from Merck & Co., Inc. (Rahway, NJ, USA) or China National Pharmaceutical Group Co., Ltd. (Beijing, China) with analytical or higher purity.

2.3. Calculation of Agronomic Use Efficiency and Profit

Agronomic use efficiency (AE, kg kg−1) of nutrients was calculated from the yield (YF, kg ha−1) and the total amount (F, kg ha−1) of N, P2O5, and K2O and their sum (Table 1) in the treatments relative to the yield of CK (YCK, kg ha−1) according to the following Equation (1):
AE = Y F Y C K / F
To compare the interaction effect on nutrient agronomic use efficiency between organic and inorganic resources in NPKOM, the theoretical nutrient use efficiency was calculated from the following Equation (2) according to [32]:
AE mix = ( F o r g × AE OM + F i n o r g × AE NPK ) / F × 100
where AEmix is the theoretical nutrient use efficiency (in kg kg−1) of the NPKOM treatment and Forg, Finorg, and F are the nutrient amounts from organic and inorganic fertilizers and total amount (kg ha−1), respectively; AEOM is the nutrient use efficiency (in kg kg−1) of the 100% organic treatment (OM), and AENPK is the nutrient use efficiency (in kg kg−1) of the 100% inorganic treatment (NPK).
The average price of fresh spring tea was approximately 60 CNY kg−1 according to the local market. The value (V) of fresh shoots was calculated as the product of the average price and the yield. The net profit of fertilization was calculated as the difference between the values of treatments (VF) and CK (VCK) and the fertilization cost (CF), according to the following Equation (3). The cost of harvesting young shoots was not included in the calculation of the net profit, as this provided important employment for local farmers.
Profit = V F V CK C F

2.4. Estimation of Greenhouse Gas Emissions Derived from Fertilization

The greenhouse gas emissions (GHGs) derived from fertilization were estimated according to the default method provided by the Intergovernmental Panel on Climate Change (IPCC) of the United Nations [33]. GHGs were divided into four parts generated from the production and transportation of fertilizers and the direct and indirect N2O emissions caused by the application of N fertilizers. Details and equations for the estimation can be found in Supplemental Table S1. The GHGs (CO2 equivalent) generated from the production and transportation of chemical fertilizers were estimated from their application rates per hectare and respective emission factors (EFs). The EFs of manufacture and transportation were 8.21 and 0.09 for N fertilizers, 0.73 and 0.06 for P fertilizers, and 0.5 and 0.05 for K fertilizers [34,35], respectively. We assumed that rapeseed cake manure was locally recycled without long-distance transportation. The direct emission of N2O from the application of chemical and organic N fertilizers was estimated from their application rates per hectare and their respective emission factors specified for tea plantations (0.0175 and 0.0261) [15]. The indirect N2O emissions caused by the application of N fertilizers were calculated from N application rates per hectare, fractions of N loss through leaching (14.53%) and runoff (8.20%), which were taken from recent respective field experiments under similar conditions, and an emission factor of 0.011 [16,35,36]. Indirect N2O emissions caused by the loss of N through NH3 volatilization was not considered for strongly acid tea soil and covering with soil after the application of fertilizers. The direct and indirect emissions of N2O were converted to CO2 equivalent greenhouse gas emissions. Total GHGs were further converted to emissions scaled per yield (GHGA) and per profit (GHGP), respectively.

2.5. Statistical Analysis

One-way analysis of variance (ANOVA), combined with the least significant difference (LSD) test, was used to compare the effect of treatments. Regression analysis was performed to describe the relations between quality parameters with the rate of fertilizers and nutrient concentrations in plant tissues. The best-fitting curves were selected according to their corrected R2-values together with visual inspection of each curve type. All analyses were performed using SigmaStat embedded in SigmaPlot (Version 12.0, Systat Software Inc., Palo Alto, CA, USA).

3. Results

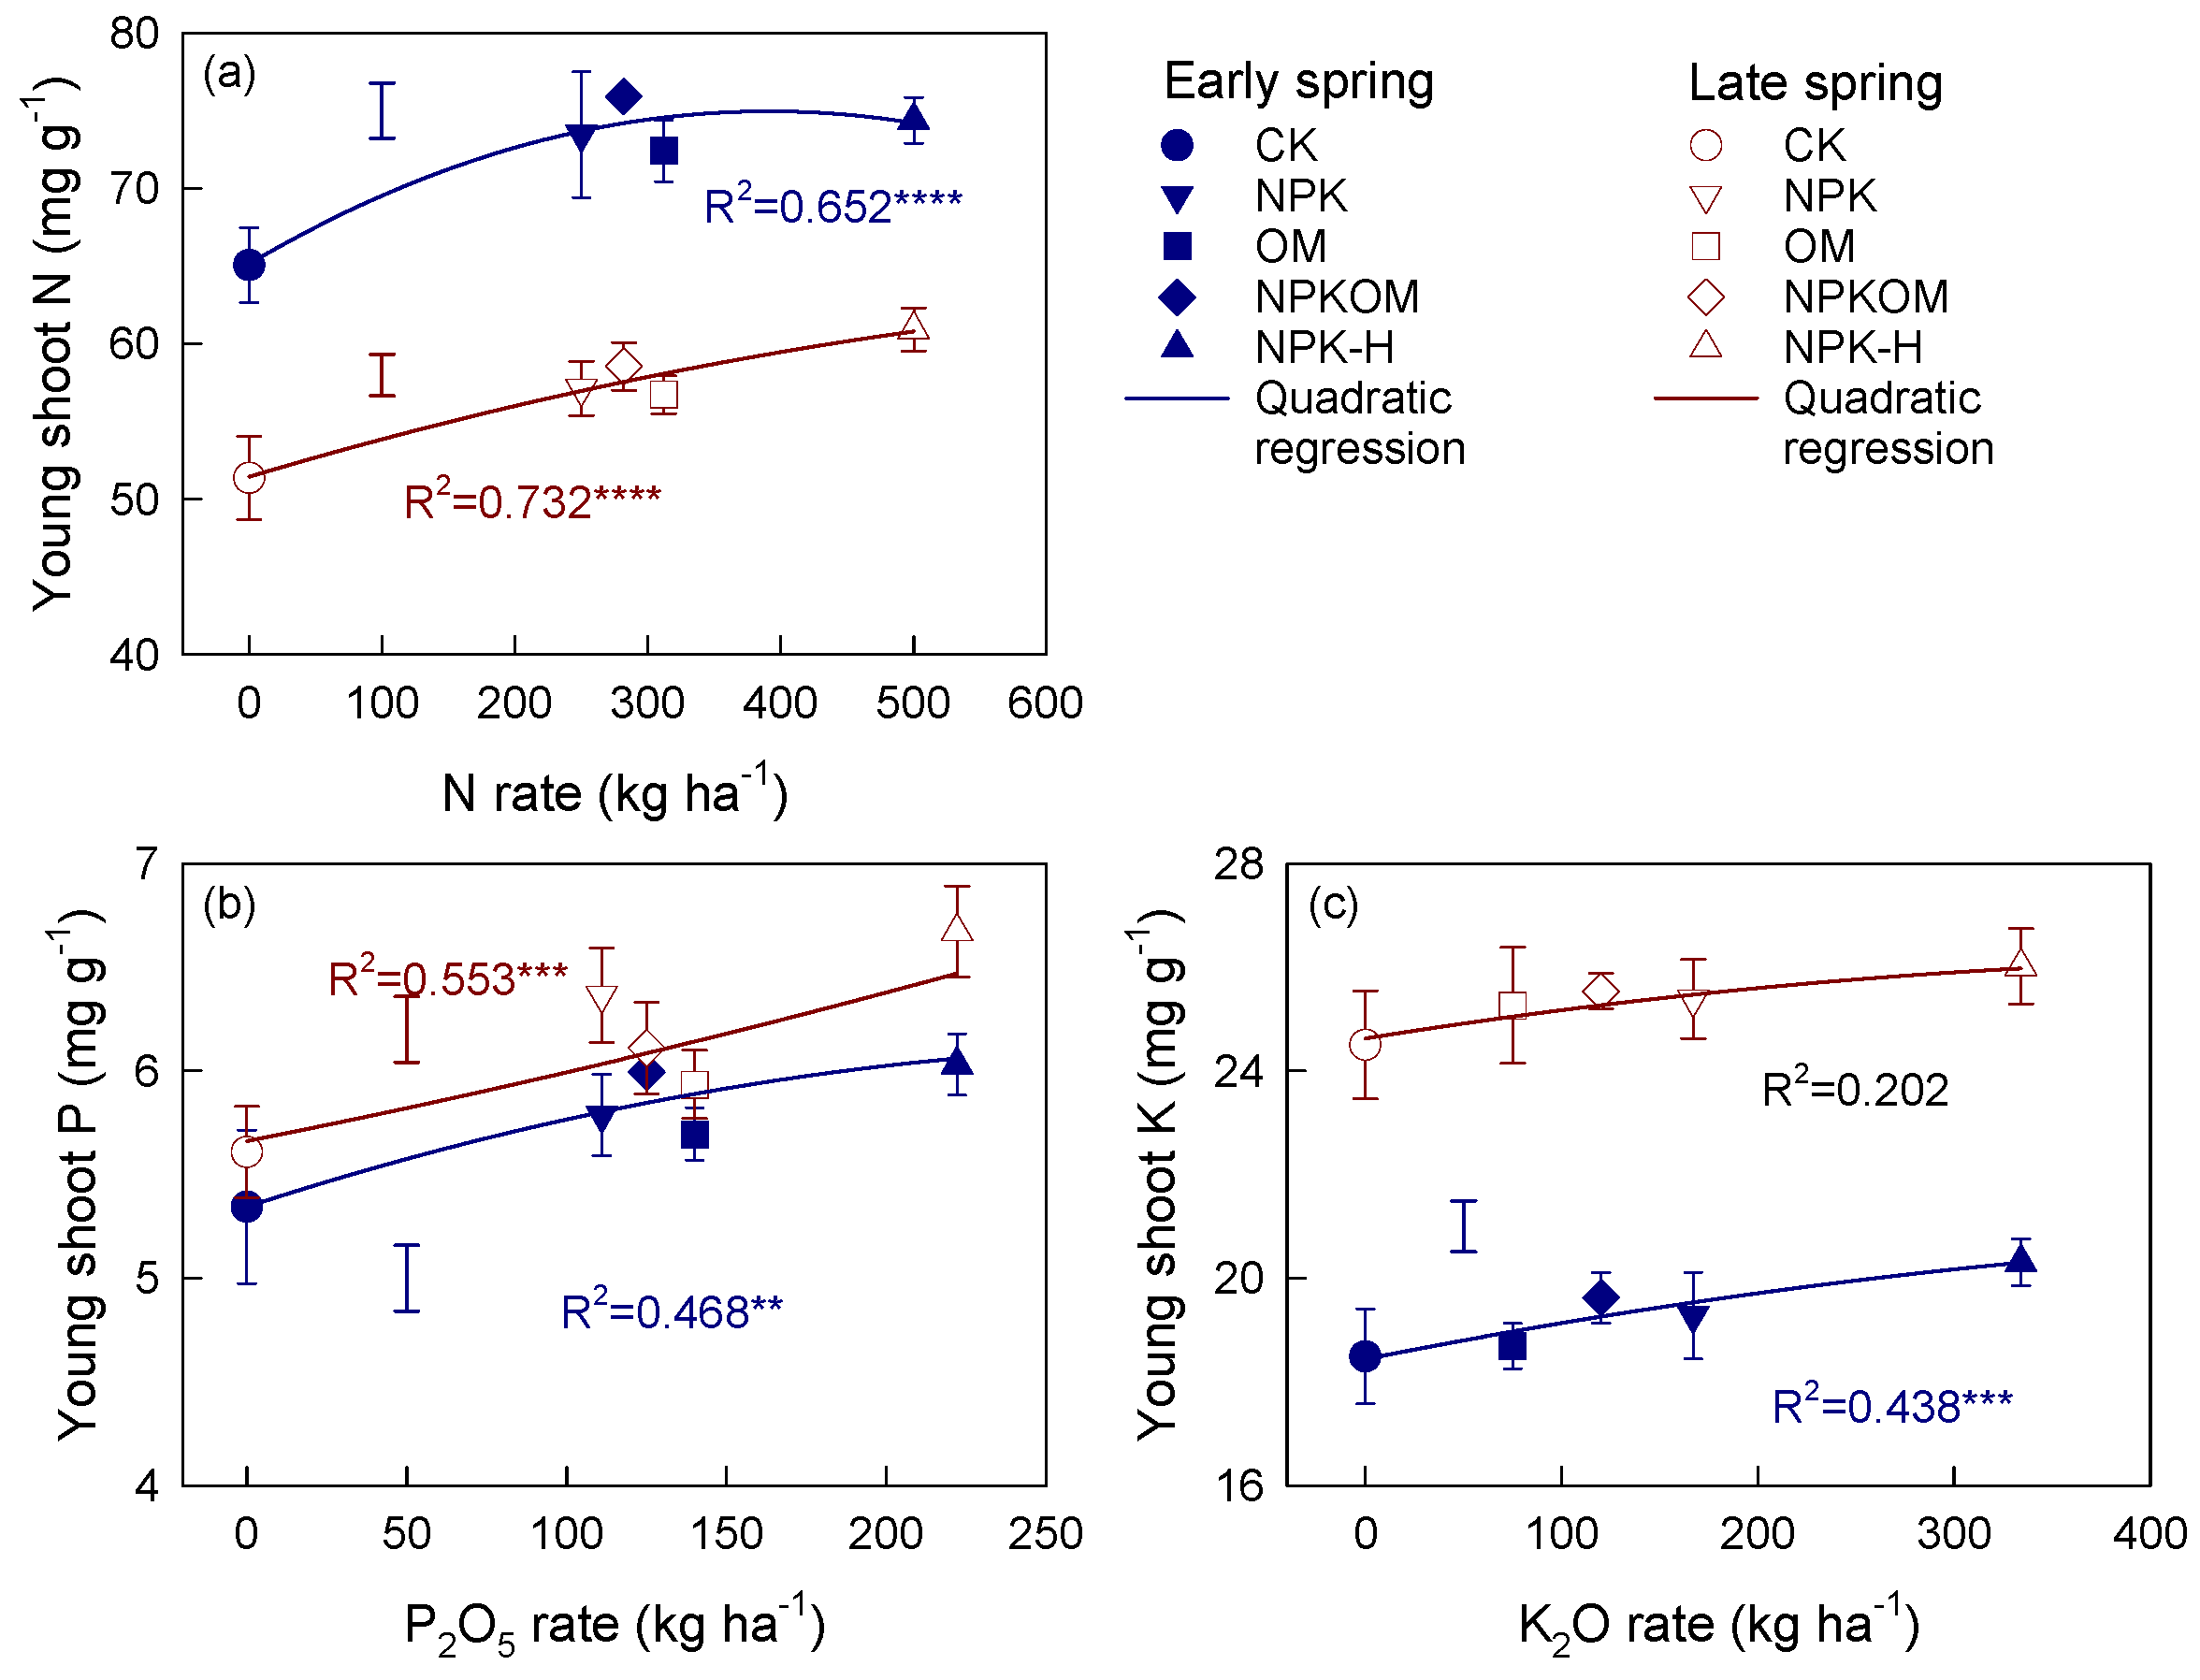
3.1. Yield, Nutrient Absorption, and Nutrient Use Efficiency

Compared to CK, the average yield of two years was increased by 75–111% in the fertilization treatments (Table 2). The high rate of nutrients (NPK-H) increased yield more significantly than full organic manure (OM) in 2020. However, there was no significant difference within the means of two years among the four fertilization treatments, although NPK-H and NPKOM had slightly (p > 0.05) higher yields. The profit of fertilization varied from 43,235 to 70,261 CNY ha−1 (Table 2). Without considering the impact of tea quality on the price of fresh shoots, OM had the lowest profit and profit/cost ratio. Profit was the highest in NPK-H, followed by NPKOM and NPK. However, the profit/cost ratio was the highest in NPK.
N concentrations of young shoots were considerably higher in the early (4 April) than in the late spring (21 April) (Figure 1a). By contrast, K and P concentrations were higher in the late than in the early spring (Figure 1b,c). Their concentrations were also significantly affected by the fertilization. For both the early and late spring, the trends of N, P, and K concentrations in the different treatments are well described by quadratic regressions. Young shoots of NPK-H had the highest N, P, and K concentrations. The concentrations of N, P, and K were not significantly different among OM, NPK, and NPKOM.
Mature leaves of NPK-H had the highest N and P concentrations, followed by NPK and NPKOM (Figure 2a,b). Mature leaves of OM had significantly lower N and P concentrations than NPK and NPKOM. K concentrations of mature leaves in NPK-H, NPK, and NPKOM were not significantly different but were higher than those in OM (Figure 2c). Similarly, the relation between the concentrations of N, P, and K in mature leaves with the rates of nutrients were well described by quadratic regressions (Figure 2). The yield was closely related to N concentration in mature leaves and their relation was well described by quadratic regression (Figure 3a).
The amounts of N, P, and K in young shoots were all significantly increased by fertilization and mostly by NPK-H (Table 3). The agronomic use efficiencies of N (AEN), P (AEP), and the sum (AEsum) were significantly higher in NPKOM and NPK than in NPK-H and OM. The agronomic use efficiency of K fertilizers (AEK) was higher in OM and NPKOM than in NPK and NPK-H (Table 3). The theoretical agronomic use efficiencies (AEmix) of N, P, and K and their sum for NPKOM according to Equation (2) were 1.32, 2.97, 3.08, and 0.71, respectively. All AEmix values were lower than their counterparts of NPKOM presented in Table 3.

3.2. Tea Quality

Fertilization had little effect on the content of chlorophyll in young shoots (Figure 4a). Compared to CK, the content of total free amino acid (TFAA) in young shoots was increased mostly by NPK-H followed by NPK and NPKOM (Figure 4b). The increase in TFAA was smaller in OM than in other fertilization treatments. TFAA content was higher in the early (mean 56.6 mg g−1) than in the late spring (mean 48.4 mg g−1). The differences between the early and late spring were greater in CK and OM than in other treatments. For instance, TFAA contents of the late stage were 24–30% lower than the early stage in CK and OM, whereas such differences were only 10–12% in NPK, NPK-H, and NPKOM. TFAA contents in the early and late spring were significantly and positively related to their N concentrations of young shoots (R2 = 0.253, p < 0.05 and R2 = 0.673, p < 0.0001, respectively; Figure 5). TFAA content was also significantly related in the quadric pattern with the N concentration of mature leaves (Figure 3b).
Compared to CK, fertilization significantly reduced the content of total polyphenol (TP) in young shoots (Figure 4c). The greatest decrease was found in the NPK-H and followed by, in decreasing order, NPK, NPKOM, and OM. TP contents in the early and late spring were significantly and negatively correlated with their N concentrations of young shoots (R2 = 0.206, p < 0.05 and R2 = 0.657, p < 0.0001, respectively) (Figure 5b). TP content of the late stage was also negatively (R2 = 0.584, p < 0.001) related to N concentration in the mature leaves (Figure 3c). The ratio of TP/TFAA in young shoots responded to fertilization in a similar way as TP (Figure 5c). TP/TFAA was negatively related with N concentration in mature leaves and their relation was best described by quadratic regressions (Figure 3d).

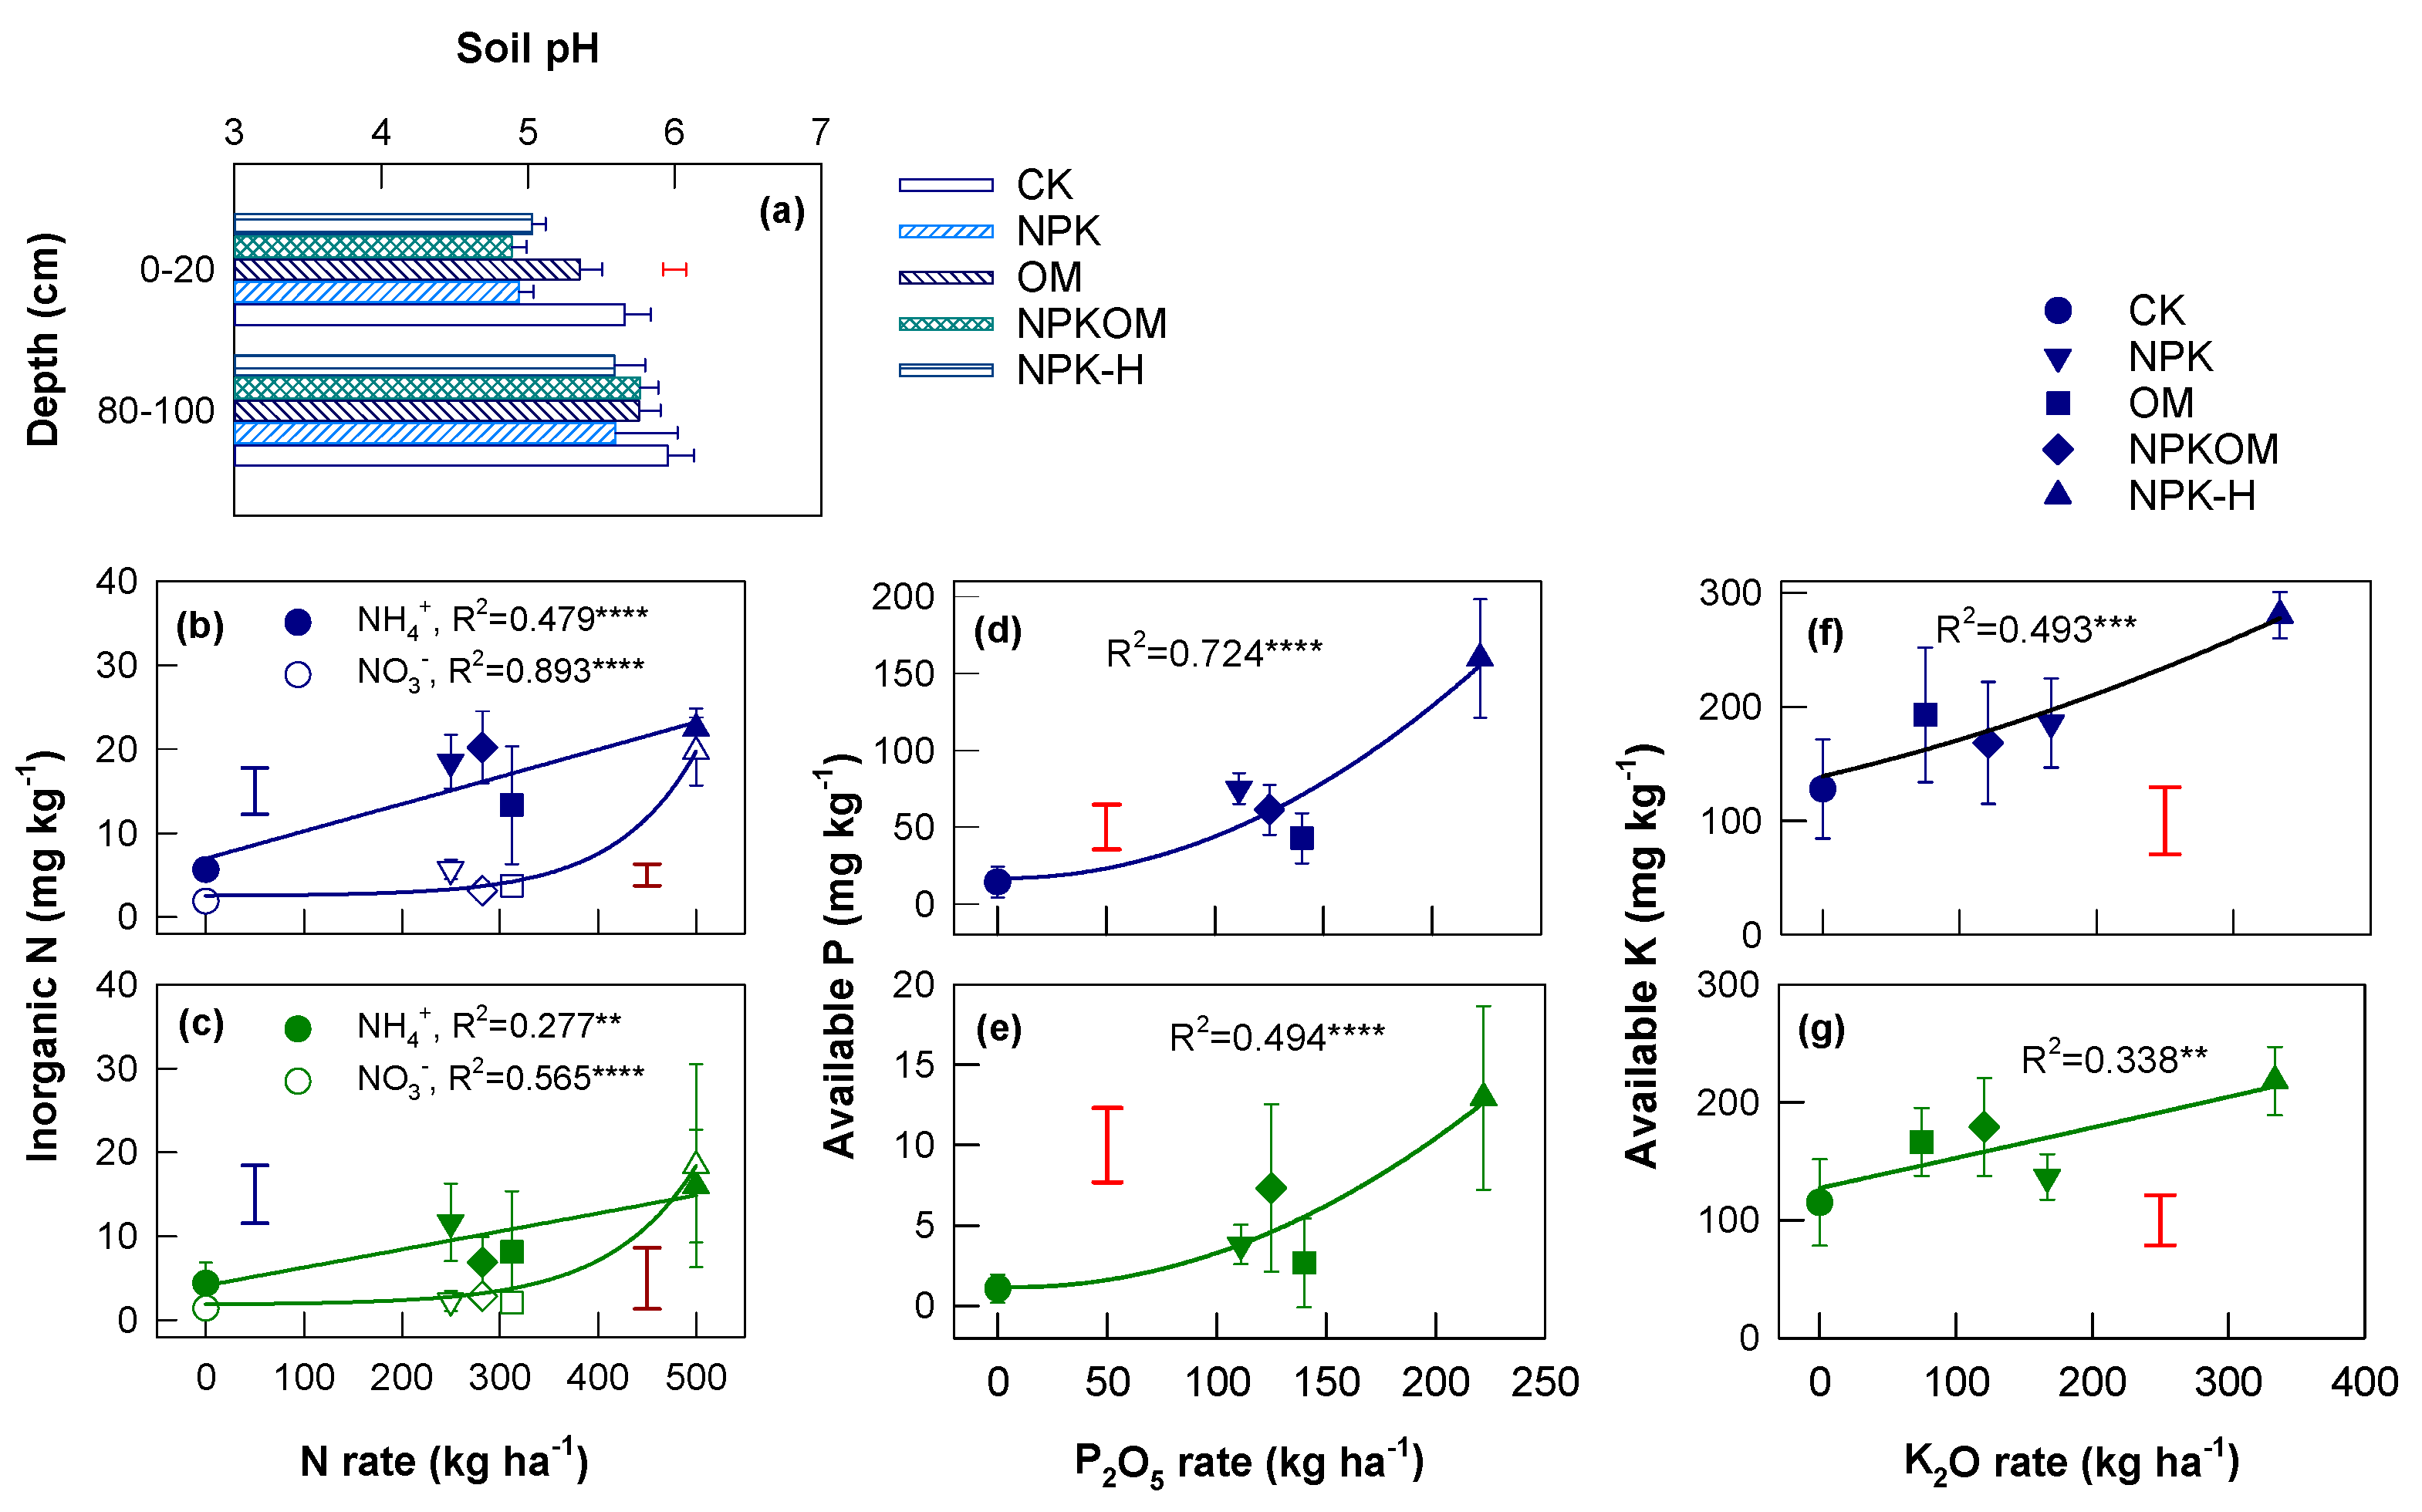
3.3. Soil Properties

The soil pH varied from 4.81 to 5.95 and was the lowest in the surface soil and increased in the deep soil (Figure 6a). Surface soil pH was significantly decreased by fertilization, with the greatest decrease in NPK-H. OM also decreased soil pH to a lesser extent than other fertilization treatments. NPKOM decreased soil pH but to a smaller extent than NPK. The content of NH4+-N increased with the rate of N fertilizers (Figure 6b,c). Their relationship could be described by linear regression. NH4+−N was the highest in NPK-H and was slightly lower in OM than in NPK. NO3–N contents increased sharply in NPK-H, which were 3.5–12.5 times those in other treatments (Figure 6b,c). The response of NO3–N content to the rate of N fertilizers could be best described by the equation of exponential growth (y = a × ex). The ratio of NO3–N/NH4+–N was significantly different among fertilization treatments and was the highest in NPK-H.
Available P accumulated mostly in the surface soil and increased significantly with the rate of P fertilizers (Figure 6d,e). The relations between available P in the soil and the rate of P fertilizers could be well described by quadratic equations. The soil of the OM treatment had slightly lower available P contents than NPK and NPKOM regardless of its higher rate of P fertilizers. Available K content was significantly affected by the rate of K fertilizers (Figure 6f,g). Their relations in different soil depths could be well described by quadratic equations. Available K was higher in the surface soil than in the deep soil. The difference in available P among soil depths was much larger than that of inorganic N and available K.

3.4. Estimation of Greenhouse Gas Emissions

Greenhouse gas emissions (GHGs) from the production and transport of chemical fertilizers accounted for half of the total emissions in NPK and NPK-H and accounted for about 25% of the total in NPKOM (Table S1). The GHGs ranged from 4179 to 9192 kg ha−1, from 4.85 to 9.89 kg kg−1, and from 0.065 to 0.13 kg CNY−1 for area, yield, and profit scaled emissions, respectively (Table 3). GHGs were the highest in NPK-H compared to other treatments. The OM treatment had lower area scaled emissions, but higher yield and profit scaled emissions than NPK and NPKOM. NPKOM had lower area, yield, and profit scaled total emissions than NPK.

4. Discussion

4.1. Response of Tea Yield, Quality Parameters, and Soil Property to Nutrient Application Rates

The present work showed that increasing the rate of N fertilizers enhanced the N status of tea plants and the content of TFAA in young shoots. Furthermore, the contents of TFAA, TP, and the ratio of TP/TFAA were closely associated with the N concentrations of mature leaves. Generally, these relations were well described by quadratic regressions. According to these regressions, the optimal rate of N fertilizers was estimated 250–280 kg ha−1 (in NPK and NPKOM) (Figure 2a and Figure 3). The estimated optimal N rates were lower than the values of 296–422 kg ha−1 recommended by a Nutrient Expert for normal tea varieties based on yield performance [5]. The high N rate of NPK-H resulted in the highest TFAA content but the lowest TP content and TP/TFAA ratio (Figure 4). The overall tea quality of NPK-H was considered deteriorated because of a low TP and unbalance between TP and TFAA, weakening the body of the infusion. These results suggest that the quality-related components respond to N in the chlorotic tea variety in a similar way as normal tea varieties and thus do not support the hypothesis that they might be different [8,37]. The contents of residual NO3−N in soil responded to the application rate of N fertilizers in exponential ways (Figure 6b,c), in line with previous findings with field crops [38,39]. By contrast, the source of fertilizer had little effect on the content of residual inorganic N in the soil. The high N application rate resulted in sharply increased residual NO3−N in the soil and the deep soil (80–100 cm) below the root zone. Nitrate is prone to leaching because of abundant rainfall in tea planting areas. According to the exponential regressions, the transition rate of N fertilizers beyond which the residual NO3–N content in soil tremendously increased was estimated around 350–400 kg ha−1. Hence, the optimal N rates appeared safe from risks of strong NO3 leaching.
A soil analysis indicated that the experimental site had a low status of available P and medium-level K in the soil at the time the present work was started. P and K fertilization greatly improved their concentrations in plants (Figure 1 and Figure 2). According to the quadratic regressions, P and K concentrations in mature leaves and young shoots no longer significantly increased when the application rates of P and K fertilizers reached 110–126 kg ha−1 and 120 kg ha−1 in NPK and NPKOM, respectively. Higher rates of P and K fertilizers beyond these values (in NPK-H) no longer increased P and K concentrations in tea plants and decreased remarkably the agronomic P and K use efficiency (Table 3). Available P in the soil increased with the rate of P fertilizers in the quadratic tendency. Available P accumulated and was affected by P fertilizers mostly in the surface soil (0–20 cm) (Figure 6d). The impact of P fertilizers on available P of the soil was observed down to the depth of 80–100 cm (Figure 6e), indicating somewhat downward P leaching in acidic tea soils. Previous work proposed a change-point index of soil extractable P to predict the leaching potential [40,41]. The critical index of Bray-1 extractable soil P (referred to as PBray-1) was found to be 75.1 mg kg−1 for tea plantations [14]. The Bray-1 extractable soil P can be converted to Mehlich-3 extractable P (referred to as PM3) according to a previously established regression equation (PM3 = 1.4974 × PBray-1 − 4.4468, R2 = 0.98, p < 0.0001) [42] for tea soils. The critical value of PM3 was estimated to be about 108 mg kg−1, which was surpassed in the soil receiving the high rate of P fertilizers in NPK-H and suggests a high risk of potential P leaching. Available K in the soil responded to the rate of K fertilizers in the quadratic mode (Figure 6f,g). Such a response was observed down to the depth of 80–100 cm, indicating significant downward K leaching in the soil profile. These results suggest that under the condition of continuous applications, the rates of P and K fertilizers need further optimization by soil analysis to mitigate a high accumulation in the soil and to reduce the risk of potential leaching [41].

4.2. The Efficacy of Full and Partial Organic Substitution

Substitution of chemical fertilizers with organic manure is a promising approach to reduce the use of chemical fertilizers and promote the recycling of nutrients in agricultural systems [20]. The present experiment demonstrated that full organic substitution did not significantly affect tea yield of chlorotic variety Zhonghuang-2 relative to the application of chemical fertilizers alone. However, compared to NPK and NPKOM, full organic substitution decreased the content of TFAA but increased that of total polyphenol and the TP/TFAA ratio in young shoots (Figure 4), suggesting a decrease in tea quality. This finding is in line with previous results showing higher phenolic contents in organically than in conventionally grown tea and other crops [23,26,43]. Our previous works showed that the biosynthesis of polyphenols is upregulated while that of amino acids is downregulated in the case of low N supply [8,37]. These findings together with the lower N concentrations in mature leaves in OM suggest that these tea plants had insufficient N supply, even though they received a slightly higher N rate compared to NPK and NPKOM (Figure 2a and Table 1). Furthermore, OM had a significantly lower agronomic N use efficiency (Table 3). Therefore, the low N status of tea plants in OM was most likely caused by a slow release and then weak intensity of N from the organic manure. In addition, the absorption of N by tea plants might be also competed by the microbial immobilization of mineral N in the soil stimulated by the additional carbon from organic fertilizers. Meanwhile, the low P agronomical use efficiency and low P concentration in mature leaves were also observed in the full substitution treatment (Figure 2b and Table 3), likely suggesting a low bioavailability of P from rapeseed cake manure. The present work showed that the bioavailability of nutrients (especially N) in soils fertilized only with rapeseed cake manure is inadequate to cover the demand necessary to obtain a high-quality spring tea [44].
Partial substitution of chemical fertilizers with organic manure had similar contents of TFAA and TP and a similar ratio of TP/TFAA with slightly increased yield (by 6%, p > 0.05) compared to its chemical counterpart (NPK). The greenhouse gas emissions scaled per area, yield, and profit were all decreased by the partial substitution. Agronomic use efficiency of N and P was improved by the positive interaction of chemical fertilizers in combination with organic manure, as indicated by AEmix < AE(NPKOM). The advantage of partial substitution might be the better balance between the readily and mineralizable N and P supply to match the nutrient demand of perennial tea plants and additionally the improvement of soil quality (e.g., soil microbial biomass, abundance, and activity) [17,18]. The application of specially formulated compound fertilizer alone also significantly improved tea quality and achieved a high profit with low greenhouse gas emissions (GHGY, GHGP). In practical use, the specially formulated compound fertilizer might be selected for mountainous tea plantations without convenient transport systems.

5. Conclusions

The present work demonstrated that the productivity and quality of chlorotic tea variety Zhonghuang-2 were closely related with the nutritional status of tea plants and the rate of fertilizers and sources. The results suggest that the quality-related components in chlorotic tea variety Zhonghuang-2 respond to fertilizer in a similar way as normal tea varieties, despite its unique metabolic characteristics. The full substitution of chemical fertilizers with organic fertilizers had no advantage on tea productivity and quality due to the low bioavailability of nutrients, especially N in organic fertilizers based on rapeseed cake manure. The partial organic substitution better matched the nutrient demand by perennial tea plants to ensure good tea quality, high economic profits, and reduced environmental risks.

Supplementary Materials

The following are available online at https://www.mdpi.com/article/10.3390/horticulturae8121198/s1, Table S1: Estimation of greenhouse gas emissions.

Author Contributions

Conceptualization and experimental design, J.R. and L.M.; field investigation, sample collection, and analysis, L.M., Y.Z. and S.G.; data curation, J.R., L.M. and Y.Z.; writing of manuscript, J.R. and Y.Z. All authors have read and agreed to the published version of the manuscript.

Funding

This work was financially supported by the National Key Research and Development Project (2021YFD1601100), the Earmarked Fund for China Agriculture Research System (CARS 19), the Agricultural Science and Technology Innovation Program of the Chinese Academy of Agricultural Sciences (CAAS-ASTIP-TRICAAS), and the Agricultural Department of Zhejiang Province through contract no. 2021SNLF032.

Data Availability Statement

The data presented in this study are available on request from the corresponding author.

Conflicts of Interest

The authors declare no conflict interest.

References

  1. Zhou, B.; Chen, Y.; Zeng, L.; Cui, Y.; Li, J.; Tang, H.; Liu, J.; Tang, J. Soil nutrient deficiency decreases the postharvest quality-related metabolite contents of tea (Camellia sinensis (L.) Kuntze) leaves. Food Chem. 2022, 377, 132003. [Google Scholar] [CrossRef] [PubMed]
  2. Venkatesan, S.; Ganapathy, M.N.K. Impact of nitrogen and potassium fertiliser application on quality of CTC teas. Food Chem. 2004, 84, 325–328. [Google Scholar] [CrossRef]
  3. Lin, Z.-H.; Qi, Y.-P.; Chen, R.-B.; Zhang, F.-Z.; Chen, L.-S. Effects of phosphorus supply on the quality of green tea. Food Chem. 2012, 130, 908–914. [Google Scholar] [CrossRef]
  4. Ruan, J.Y.; Ma, L.F.; Shi, Y.Z. Potassium management in tea plantations: Its uptake by field plants, status in soils, and efficacy on yields and quality of teas in China. J. Plant Nutr. Soil Sci. 2013, 176, 450–459. [Google Scholar] [CrossRef]
  5. Tang, S.; Zheng, N.; Ma, Q.; Zhou, J.; Sun, T.; Zhang, X.; Wu, L. Applying Nutrient Expert system for rational fertilisation to tea (Camellia sinensis) reduces environmental risks and increases economic benefits. J. Clean. Prod. 2021, 305, 127197. [Google Scholar] [CrossRef]
  6. Ni, K.; Liao, W.Y.; Yi, X.Y.; Niu, S.Y.; Ma, L.F.; Shi, Y.Z.; Zhang, Q.F.; Liu, M.Y.; Ruan, J.Y. Fertilization status and reduction potential in tea gardens of China. J. Plant Nutr. Fert. 2019, 25, 421–432. [Google Scholar]
  7. Mishima, S.; Endo, A.; Kohyama, K. Nitrogen and phosphate balance on crop production in Japan on national and prefectural scales. Nutr. Cycl. Agroecosyst. 2010, 87, 159–173. [Google Scholar] [CrossRef]
  8. Ruan, J.Y.; Haerdter, R.; Gerendas, J. Impact of nitrogen supply on carbon/nitrogen allocation: A case study on amino acids and catechins in green tea [Camellia sinensis (L.) O. Kuntze] plants. Plant Biol. 2010, 12, 724–734. [Google Scholar] [CrossRef]
  9. Ding, Z.; Jia, S.; Wang, Y.; Xiao, J.; Zhang, Y. Phosphate stresses affect ionome and metabolome in tea plants. Plant Physiol. Biochem. 2017, 120, 30–39. [Google Scholar] [CrossRef]
  10. Liu, M.-Y.; Burgos, A.; Ma, L.; Zhang, Q.; Tang, D.; Ruan, J. Lipidomics analysis unravels the effect of nitrogen fertilization on lipid metabolism in tea plant (Camellia sinensis L.). BMC Plant Biol. 2017, 17, 165. [Google Scholar] [CrossRef] [Green Version]
  11. Chen, Y.; Wang, F.; Wu, Z.; Jiang, F.; Yu, W.; Yang, J.; Chen, J.; Jian, G.; You, Z.; Zeng, L. Effects of long-term nitrogen fertilization on the formation of metabolites related to tea quality in subtropical China. Metabolites 2021, 11, 146. [Google Scholar] [CrossRef]
  12. Yang, X.; Ni, K.; Shi, Y.Z.; Yi, X.Y.; Zhang, Q.F.; Fang, L.; Ma, L.F.; Ruan, J.Y. Effects of long-term nitrogen application on soil acidification and solution chemistry of a tea plantation in China. Agric. Ecosyst. Environ. 2018, 252, 74–82. [Google Scholar] [CrossRef]
  13. Hirono, Y.; Watanabe, I.; Nonaka, K. Trends in water quality around an intensive tea-growing area in Shizuoka, Japan. Soil Sci. Plant Nutr. 2009, 55, 783–792. [Google Scholar] [CrossRef] [Green Version]
  14. Yan, P.; Shen, C.; Fan, L.; Li, X.; Zhang, L.; Zhang, L.; Han, W. Tea planting affects soil acidification and nitrogen and phosphorus distribution in soil. Agric. Ecosyst. Environ. 2018, 254, 20–25. [Google Scholar] [CrossRef]
  15. Wang, Y.; Yao, Z.; Pan, Z.; Wang, R.; Yan, G.; Liu, C.; Su, Y.; Zheng, X.; Butterbach-Bahl, K. Tea-planted soils as global hotspots for N2O emissions from croplands. Environ. Res. Lett. 2020, 15, 104018. [Google Scholar] [CrossRef]
  16. Xie, S.; Feng, H.; Yang, F.; Zhao, Z.; Hu, X.; Wei, C.; Liang, T.; Li, H.; Geng, Y. Does dual reduction in chemical fertilizer and pesticides improve nutrient loss and tea yield and quality? A pilot study in a green tea garden in Shaoxing, Zhejiang Province, China. Environ. Sci. Pollut. Res. 2019, 26, 2464–2476. [Google Scholar] [CrossRef] [PubMed]
  17. Ji, L.; Wu, Z.; You, Z.; Yi, X.; Ni, K.; Guo, S.; Ruan, J. Effects of organic substitution for synthetic N fertilizer on soil bacterial diversity and community composition: A 10-year field trial in a tea plantation. Agric. Ecosyst. Environ. 2018, 268, 124–132. [Google Scholar] [CrossRef]
  18. Ji, L.; Ni, K.; Wu, Z.; Zhang, J.; Yi, X.; Yang, X.; Ling, N.; You, Z.; Guo, S.; Ruan, J. Effect of organic substitution rates on soil quality and fungal community composition in a tea plantation with long-term fertilization. Biol. Fertil. Soils 2020, 56, 633–646. [Google Scholar] [CrossRef]
  19. Gu, S.; Hu, Q.; Cheng, Y.; Bai, L.; Liu, Z.; Xiao, W.; Gong, Z.; Wu, Y.; Feng, K.; Deng, Y.; et al. Application of organic fertilizer improves microbial community diversity and alters microbial network structure in tea (Camellia sinensis) plantation soils. Soil Tillage Res. 2019, 195, 104356. [Google Scholar] [CrossRef]
  20. Wei, Z.; Ying, H.; Guo, X.; Zhuang, M.; Cui, Z.; Zhang, F. Substitution of mineral fertilizer with organic fertilizer in maize systems: A meta-analysis of reduced nitrogen and carbon emissions. Agronomy 2020, 10, 1149. [Google Scholar] [CrossRef]
  21. Wei, Z.; Hoffland, E.; Zhuang, M.; Hellegers, P.; Cui, Z. Organic inputs to reduce nitrogen export via leaching and runoff: A global meta-analysis. Environ. Pollut. 2021, 291, 118176. [Google Scholar] [CrossRef] [PubMed]
  22. Qiu, S.L.; Wang, L.M.; Huang, D.F.; Lin, X.J. Effects of fertilization regimes on tea yields, soil fertility, and soil microbial diversity. Chilean J. Agric. Res. 2014, 74, 333–339. [Google Scholar] [CrossRef]
  23. Das, S.; Borua, P.K.; Bhagat, R.M. Soil nitrogen and tea leaf properties in organic and conventional farming systems under humid sub-tropical conditions. Org. Agric. 2016, 6, 119–132. [Google Scholar] [CrossRef]
  24. Liu, J.W.; Zhang, Q.F.; Liu, M.Y.; Ma, L.F.; Shi, Y.Z.; Ruan, J.Y. Metabolomic analyses reveal distinct change of metabolites and quality of green tea during the short duration of a single spring season. J. Agric. Food Chem. 2016, 64, 3302–3309. [Google Scholar] [CrossRef]
  25. Ma, L.F.; Shi, Y.Z.; Ruan, J.Y. Nitrogen absorption by field-grown tea plants (Camellia sinensis) in winter dormancy and utilization in spring shoots. Plant Soil 2019, 442, 127–140. [Google Scholar] [CrossRef]
  26. Han, W.Y.; Wang, D.H.; Fu, S.W.; Ahmed, S. Tea from organic production has higher functional quality characteristics compared with tea from conventional management systems in China. Biol. Agric. Hortic. 2018, 34, 120–131. [Google Scholar] [CrossRef]
  27. Wang, L.; Yue, C.; Cao, H.L.; Zhou, Y.H.; Zeng, J.M.; Yang, Y.J.; Wang, X.C. Biochemical and transcriptome analyses of a novel chlorophyll-deficient chlorina tea plant cultivar. BMC Plant Biol. 2014, 14, 352. [Google Scholar] [CrossRef] [PubMed] [Green Version]
  28. Zhang, Q.F.; Liu, M.Y.; Ruan, J.Y. Integrated transcriptome and metabolic analyses reveals novel insights into free amino acid metabolism in Huangjinya tea cultivar. Front. Plant Sci. 2017, 8, 291. [Google Scholar] [CrossRef] [Green Version]
  29. Yamashita, H.; Kambe, Y.; Ohshio, M.; Kunihiro, A.; Tanaka, Y.; Suzuki, T.; Nakamura, Y.; Morita, A.; Ikka, T. Integrated metabolome and transcriptome analyses reveal etiolation-induced metabolic changes leading to high amino acid contents in a light-sensitive Japanese albino tea cultivar. Front. Plant Sci. 2021, 11, 611140. [Google Scholar] [CrossRef]
  30. Ruan, J.Y.; Ma, L.; Yi, X.; Shi, Y.; Ni, K.; Liu, M.; Zhang, Q. Integrated nutrient management in tea plantation to reduce chemical fertilizer and increase nutrient use efficiency. J. Tea Sci. 2020, 40, 85–95, (Chinese with English abstract). [Google Scholar]
  31. Ziadi, Z.; Sen Tran, T. Mehlich 3-Extractable Elements. In Soil Sampling and Methods of Analysis, 2nd ed.; Carter, M.R., Gregorich, E.G., Eds.; CRC Press: Boca Raton, FL, USA, 2007; pp. 117–124. [Google Scholar] [CrossRef]
  32. Tong, B.X.; Hou, Y.; Wang, S.Q.; Ma, W.Q. Partial substitution of urea fertilizers by manure increases crop yield and nitrogen use efficiency of a wheat-maize double cropping system. Nutr. Cycl. Agroecosyst. 2022. [Google Scholar] [CrossRef]
  33. Hergoualc’h, K.; Akiyama, H.; Bernoux, M.; Chirinda, N.; del Prado, A.; Kasimir, Å.; MacDonald, J.D.; Ogle, S.M.; Regina, K.; van der Weerden, T.J. N2O emissions from managed soils, and CO2 emissions from lime and urea application. In 2019 Refinement to the 2006 IPCC Guidelines for National Greenhouse Gas Inventories Volume 4 Agriculture, Forestry and Other Land Use; Calvo Buendia, E., Tanabe, K., Kranjc, A., Baasansuren, J., Fukuda, M., Ngarize, S., Osako, A., Pyrozhenko, Y., Shermanau, P., Federici, S., Eds.; The Intergovernmental Panel on Climate Change: Geneva, Switzerland, 2019; Volume 4. [Google Scholar]
  34. Forster, P.; Ramaswamy, V.; Artaxo, P.; Berntsen, T.; Betts, R.; Fahey, D.W.; Haywood, J.; Lean, J.; Lowe, D.C.; Myhre, G.; et al. Changes in Atmospheric Constituents and in Radiative Forcing. In Climate Change 2007: The Physical Science Basis. Contribution of Working Group I to the Fourth Assessment Report of the Intergovernmental Panel on Climate Change; Solomon, S., Qin, D., Manning, M., Chen, Z., Marquis, M., Averyt, K.B., Tignor, M., Miller, H.L., Eds.; Cambridge University Press: Cambridge, UK, 2007; pp. 129–234. [Google Scholar]
  35. Zhang, W.F.; Dou, Z.X.; He, P.; Ju, X.-T.; David, P. New technologies reduce greenhouse gas emissions from nitrogenous fertilizer in China. Proc. Natl. Acad. Sci. 2013, 110, 8375–8380. [Google Scholar] [CrossRef] [PubMed] [Green Version]
  36. Zheng, S. Study on the Monitoring Methods of Nitrate Leaching and Features of Nitrogen Leaching in Tea Plantation; Chinese Academy of Agricultural Sciences: Beijing, China, 2022. [Google Scholar]
  37. Liu, J.; Liu, M.; Fang, H.; Zhang, Q.; Ruan, J. Accumulation of amino acids and flavonoids in young tea shoots is highly correlated with carbon and nitrogen metabolism in roots and mature leaves. Front. Plant Sci. 2021, 12, 756433. [Google Scholar] [CrossRef]
  38. Cui, Z.; Wang, G.; Yue, S.; Wu, L.; Zhang, W.; Zhang, F.; Chen, X. Closing the N-use efficiency gap to achieve food and environmental security. Environ. Sci. Technol. 2014, 48, 5780–5787. [Google Scholar] [CrossRef] [PubMed]
  39. Yao, Z.; Zhang, D.; Yao, P.; Zhao, N.; Li, Y.; Zhang, S.; Zhai, B.; Huang, D.; Ma, A.; Zuo, Y.; et al. Optimizing the synthetic nitrogen rate to balance residual nitrate and crop yield in a leguminous green-manured wheat cropping system. Sci. Total Environ. 2018, 631–632, 1234–1242. [Google Scholar] [CrossRef]
  40. Heckrath, G.; Brookes, P.C.; Poulton, P.R.; Goulding, K.W.T. Phosphorus leaching from soils containing different phosphorus concentrations in the broadbalk experiment. J. Environ. Qual. 1995, 24, 904–910. [Google Scholar] [CrossRef]
  41. Li, H.; Huang, G.; Meng, Q.; Ma, L.; Yuan, L.; Wang, F.; Zhang, W.; Cui, Z.; Shen, J.; Chen, X.; et al. Integrated soil and plant phosphorus management for crop and environment in China. A review. Plant Soil 2011, 349, 157–167. [Google Scholar] [CrossRef]
  42. Ma, L.; Yang, Y.; Shi, Y.; Ruan, J.; Han, W. Application of an universal soil extractant of Mehlich-3 to nutrient analysis of tea garden soil. Chin. J. Soil Sci. 2007, 38, 745–748. [Google Scholar] [CrossRef]
  43. Lester, G.E.; Saftner, R.A. Organically versus conventionally grown produce: Common production inputs, nutritional quality, and nitrogen delivery between the two systems. J. Agric. Food Chem. 2011, 59, 10401–10406. [Google Scholar] [CrossRef]
  44. Long, L.; Shi, Y.; Ma, L.; Ruan, J. Characterization of young shoot population, yield, and nitrogen demands of tea (Camellia sinensis L.) harvested under different standards. Horticulturae 2022, 8, 275. [Google Scholar] [CrossRef]
Figure 1. Response of concentrations of N (a), P (b), and K (c) in young shoots to the rate of fertilizers in the early (4 April) and late (21 April 2020) spring. Single bars in color without data point are LSD values indicative of significant difference among treatments. Quadratic regression lines are indicated with R2 values and significance levels (**, p < 0.01; ***, p < 0.001; ****, p < 0.0001; n = 20).
Horticulturae 08 01198 g001
Figure 2. Response of concentrations of N (a), P (b), and K (c) in mature leaves to the rate of fertilizers. Single bars in red without data point are LSD values indicative of significant difference among treatments. Quadratic regression lines are indicated with equations, R2 values, and significance levels (*, p < 0.05; ****, p < 0.0001). The circled data (OM treatment) were not included in the regression analysis for the significantly low bioavailability of N and P.
Horticulturae 08 01198 g002
Figure 3. Relation of tea yield (a), total free amino acid (TFAA, b), total polyphenol (TP, c), and the ratio of TP/TFAA (d) in young shoots with the N concentration in mature leaves on 21 April 2020. Quadratic regression lines are indicated with equations, R2 values, and significance levels (***, p < 0.001; ****, p < 0.0001).
Horticulturae 08 01198 g003
Figure 4. Concentrations of chlorophyll (chl-a, chl-b, and total) (a), total free amino acid (TFAA, b), total polyphenol (TP, c) and their ratio (PP/TFAA) (d) in young shoots in the early and late spring. Single bars in red without data above columns are LSD values indicative of significant difference among fertilization treatments.
Horticulturae 08 01198 g004
Figure 5. Response of total free amino acid (TFAA, a), total polyphenol (TP, b), and the ratio of TP/TFAA (c) to N concentration in young shoots in the early (open symbols) and the late spring (closed symbols). Linear regression lines are indicated with R2 values and significance levels (*, p < 0.05; **, p < 0.01; ****, p < 0.0001).
Horticulturae 08 01198 g005
Figure 6. Soil pH (a), contents of NO3−N (b,c, open symbols), NH4+−N (b,c, closed symbols), available P (d,e), and K (f,g) in the soil of 0–20 cm (b,d,f; in blue) and 80–100 cm (c,e,g; in green) depths. Single bars without data are LSD values indicative of significant difference among treatments. Regression lines are indicated with R2 values and significance levels (**, p < 0.01; ***, p < 0.001; ****, p < 0.0001).
Horticulturae 08 01198 g006
Table 1. The amount and composition of fertilizers, and the cost of fertilization including fertilizers and application of treatments.
Nutrient Treatment
CKNPKOMNPKOMNPK-H
Total (kg ha−1)N 0250312282500
P2O50110140125220
K2O016775120334
Sum05275275271054
Organic (kg ha−1)N 003121580
P2O500140700
K2O0075370
Sum005272640
Cost (CNY ha−1) 0720020,25012,60011,370
Table 2. Yield, profit, and profit/cost ratio of fertilization treatments.
TreatmentYield (kg ha−1)ProfitProfit/Cost
20192020Mean(CNY ha−1)Ratio
CK569a312a440a0/
NPK812b898bc855b64,9579.0
OM824b720b772b43,2352.1
NPKOM836b981bc908b67,6035.4
NPK-H791b1068c929b70,2616.2
Different letters following data of the same line indicate significant difference among treatments.
Table 3. Amount of nutrients in harvested young shoots, agronomic nutrient use efficiency (AE), and greenhouse gas emissions scaled per area (GHGA), yield (GHGY), and profit (GHGP).
TreatmentAmount (kg ha−1)AE (kg kg−1)GHGAGHGYGHGP
NPKNP2O5K2OSum #(kg ha−1)(kg kg−1)(kg Yuan−1)
CK6.0a0.58a2.34a////000
NPK12.8bcd1.18bc4.33b1.66b3.74b2.48a0.79b45965.380.071
OM11.9bc1.07b4.04b1.06a2.37a4.42b0.63ab41795.410.097
NPKOM13.4cd1.22bc4.54b1.66b3.74b3.87b0.89b44014.850.065
NPK-H14.0d1.27c4.62b0.98a2.20a1.46a0.46a91929.890.131
Different letters following data of the same line indicate significant difference among treatments. # Sum represents N+P2O5+K2O.
Publisher’s Note: MDPI stays neutral with regard to jurisdictional claims in published maps and institutional affiliations.

