Article

Agrivoltaic System and Modelling Simulation: A Case Study of Soybean (Glycine max L.) in Italy

Department of Sustainable Crop Production, Università Cattolica del Sacro Cuore, 29122 Piacenza, Italy
*
Authors to whom correspondence should be addressed.
Horticulturae 2022, 8(12), 1160; https://doi.org/10.3390/horticulturae8121160
Submission received: 5 November 2022 / Revised: 30 November 2022 / Accepted: 3 December 2022 / Published: 7 December 2022
(This article belongs to the Special Issue The Effects of Shade on Crops: From Greenhouse to Agrivoltaic)

Abstract

:
Agrivoltaic systems (AV) combine agricultural activities with the production of electricity from photovoltaic (PV) panels on the same land area. The concept of AV systems was introduced in 1982 by Goetzberger and Zastrow, but only more recently have the increased environmental concerns and the favorable economic and political frameworks stimulated a growing interest in this technology. A critical issue in the development of AV is the selection of crops that can grow profitably under the micrometeorological conditions generated by AV systems. This experiment studied the effect of four different shade depth treatments (AV1 = 27%, AV2 = 16%, AV3 = 9%, and AV4 = 18%) on the morphology, physiology, and yield of a soybean crop grown under a large-scale AV system. The field results were used to validate the output of a simulation platform that couples the crop model GECROS with a set of algorithms for the estimation and spatialisation of the shading, radiation, and crop-related outputs. Crop height, leaf area index (LAI), and specific leaf area (SLA) all increased under the most shaded AV areas compared to the full light (FL, control) conditions. On average, under an AV system, the grain yield and the number of pods per plant were reduced by 8% and 13%, and in only one area (AV2) was a slight increase in grain yield (+4.4%) observed in comparison to the FL. The normalised root mean square error (nRMSE) value of the predicted grain yield differed from the observed grain values of 12.9% for the FL conditions, 15.7% in AV1, 16.5% in AV2, 6.71% in AV3, and 2.82% in AV4. Although the model simulated the yield satisfactorily, the results of the RMSE revealed that the model tends to underestimate the yield with an increase in shade, particularly for the AV1 and AV2 conditions.

1. Introduction

In 2015, the United Nations General Assembly [1] defined the 17 Sustainable Development Goals (SDGs). Among these, SDG 7, which targets the production of sustainable energy, aims at (i) ensuring universal access to affordable, reliable, and modern energy services; (ii) increasing substantially the share of renewable energy in the global energy mix; and (iii) doubling the global rate of improvement in energy efficiency [2]. In addition to these targets, SDG 7 also intends to stimulate investment in energy infrastructure and clean renewable energy technologies.
The use of renewable energy sources provides multiple benefits to society as these sources reduce CO2 emissions, improve air quality, and promote economic growth and can help us to move forward to more efficient and cleaner power production. In 2021, solar energy, among the renewable energy sources, reached a capacity of 849 GW, increasing by 18% compared to that of 2020 (716 GW) [3]. At the same time, an effective energy transition strategy would require an increase in the use of renewables which was larger than the projected growth in energy demand in order to curtail the share of non-renewable energy employed. Many countries still strive for this goal, despite dramatic increases in their share of renewables for generating electricity [3].
The implementation of renewables can also have negative sides, and a major concern relates to the high land requirement of most renewables, which can compete with agricultural activities on land use, potentially resulting in a reduction in food production [4]. Agrivoltaic (AV) systems, combining food and energy production on the same land, can represent a win–win strategy that can increase land use efficiency [5,6,7,8,9] while reducing water use by crops, especially in drought-prone environments [10]. In these environments, the sustainability of agrivoltaic systems could be further increased by using wastewaters [11] or biostimulants [12].
The concept of the AV system was first formulated in 1982 [13], but only more recently have the increased environmental concerns and the favorable economic and political frameworks stimulated a growing interest in this technology. The main driver of the current interest in AV systems is the development of sustainable renewable energies that have a low impact on soil consumption [14].
In the last decade, a growing number of studies have investigated different topics related to the AV system. Most of the studies have addressed the impact of AV conditions on crop yield [5,6,15,16,17,18,19,20], but many others have recognised that AV systems tend to reduce crop evapotranspiration [18,20,21,22,23], protect the crop against extreme weather events (for example, drought stress [10]), and increase the land equivalent ratio (LER), which is an index used to evaluate a dual-use purpose as compared to a mono-use purpose (only photovoltaic panels or only crop) [5,6,7,8,9]. Despite this, the studies are still insufficient to assess the impact of the AV system on the productivity and development of a large number of crops, and only a very few studies have analysed the crops’ physiological and morphological responses [15,17,18,19,20,24,25,26] to the dynamic shading conditions generated by the AV system.
Height, vigor, stem potential, chlorophyll content (SPAD), leaf area index (LAI), and specific leaf area (SLA) are the crops’ physiological and morphological traits that are the most influenced in low light conditions and shaded conditions.
The height and vigour of crops growing under shaded conditions tends to be greater in order to increase light interception, and this trait reflects an adaptation of crops to shade [27,28,29,30,31].
In addition, in low light conditions, the adaptation of crops consists of an increase in SLA, a decrease in the chlorophyll a/b ratio, and an increase in the total chlorophyll content, which can increase the carbon gain in a shaded environment [31,32]. A high value of SLA in the shade tends to increase light interception [32], and the leaves appear thinner than those growing in sunlight conditions. The difference between sun leaves and shade leaves depends on the leaf internal structure, which performs an important role in light capture [31]. Therefore, it can be assumed that even in the AV environment the plants reacted similarly to the crops growing under low light or in a shaded environment by modifying their leaf structures and by exhibiting physiological adaptation mechanisms, such as changing stomata size and density [33,34,35,36,37,38,39].
Furthermore, a crop’s physiological and morphological traits can influence the crop development by affecting the processes of light interception, photosynthesis, and transpiration, as already demonstrated for the LAI [25,40,41,42,43,44]. For example, the LAI of celeriac [18], wheat, grass–clover, and potatoes [26] was higher under an AV system than in full light conditions.
Information on the performance of industrial crops cultivated under AV systems is scarce, and limited data are available on soybean (Glycine max L.) cultivation under AV systems. Namely, two modelling approaches have been investigated for soybean [45,46]. The adoption of the crop modelling approach allows an insight into the microclimatic conditions that are generated under AV systems by considering multiple micrometeorological conditions (i.e., solar radiation, temperature, CO2 concentration, soil nutrients, and water); the management of the crops (i.e., plant number per m2 or fertilisation); and the crop yield response to the shaded environment [46,47].
In a recent work, the response of soybean to an AV environment was modelled by coupling a crop model with a solar power generation model to obtain data on the effect of an AV system on both the crop yield and the net revenue for the landowners [46]. In another study carried out in Korea [45], field trials were carried out on rice, barley, and soybean to collect the data needed to calibrate and validate three crop models (CERES-rice, CERES-barley, and CROPGRO-soybean) and to predict the impact of shade on crop yield.
In 2018, a pioneering AV simulation work on maize [6] had already demonstrated the importance of using models to study how crops respond to the microclimatic conditions generated in an AV system and how this response interacts with weather conditions that change from year to year. In the abovementioned study, for example, the model simulations indicated that the maize yield was more stable under AV conditions than under full light and that in dry and hot years the rainfed maize yield under AV conditions was higher than under full light.
In order to study the response of soybean cultivated under an AV system, a field experiment was set up and an improved version of the model previously run for maize [6] was used to simulate soybean growth under an AV system. In particular, the objectives of this research were: (1) to measure the morphological, physiological, and yield response of soybean cultivated under the dynamic shading environment of a large-scale Agrovoltaico® system [48] and (2) to use the experimental data to validate the capacity of the modelling platform to accurately simulate the response of soybean under such conditions.

2. Materials and Methods

2.1. Study Area and Experimental Design

The study was carried out in a large commercial AV plant (Remtec, Agrovoltaico® [48]) in Monticelli d’Ongina (Italy, 45°04′10″ N–9°55′40″ E) where the PV panels are stilt-mounted on a biaxial full sun-tracking system. The experimental setup included a control area of “full light” (FL, 180 m2) located just outside the AV system and 8 experimental areas (Figure 1) characterised by 4 different shade depth (SD) treatments (see Section 2.4): 27%, 16%, 9%, and 18% (by considering the average value of the SD over the crop growing cycle), which are indicated, respectively, as AV1, AV2, AV3, and AV4. Each area included 4 soybean rows, for a total of 16 rows and an area of 144 m2 for a single replicate (2 replicates for each AV area).
Leaf area index (LAI) and the yield data (pod number and pod fresh weight) were collected by using the quadrat sampling methods [49], with a modification for the AV environment. The quadrats of the SD treatments were obtained by using a PVC quadrat frame (100 × 100 cm, 1 m2) placed directly on top of the vegetation.

2.2. Agronomic Management

The experimental field was ploughed (30 cm depth) to a fine tilth in March 2021. The soybean (Glycine max, L.) cultivar Namaste (Venturoli, maturity group 1/1+ [50]) was sowed on 29 April 2021. The sowing density was 50 plant m−2. The seeds were planted by a pneumatic seed drill (Gaspardo, Pinta [51]) at a depth of 3–4 cm. The inter-row spacing was 70 cm, and the distance between the seeds in the row was 3 cm. To control weeds, hoeing was performed on the inter-rows on 7 June 2021. The soybean plants were fully irrigated at 100% of crop evapotranspiration (ETc) with a sub-irrigation system with 15-day intervals (5 July and 20 July 2021, and 4 August 2021). The ETc was calculated by using the Irriframe cloud services developed by the Water Boards Italian Association (ANBI) [52]. Harvesting was carried out on 27 September 2021.

2.3. Field Data Collection

2.3.1. Crop Height

Crop height is a morphological and shade-adaptive trait which is most affected under a shaded environment [26,27,28,29,30,31] and under an AV system [18,26] since crops tend to elongate their stems when light decreases. To study the effect of the AV system on soybean height, measurements were carried out throughout the growing cycle on four occasions: 28 June, 15 and 30 July, and 9 August 2021. The heights of 12 plants per treatment were measured, with a 1 mm resolution.

2.3.2. SPAD Chlorophyll Content

The chlorophyll content in leaves, which determines their photosynthetic capacity [53], is linked to the N nutrition status of the plant and is affected by shading. According to studies carried out in moderately shaded environments with peony [54] and red rice [55], under low light conditions for a large number of species [31] and in an intercropping system (maize–soybean) [56], the chlorophyll content tends to increase as the light availability decreases.
The measurements of the chlorophyll content in the leaves were carried out in this study with the SPAD chlorophyll meter SPAD-502 plus (Konica Minolta) to measure the dynamics of the leaves’ chlorophyll content throughout the phenological cycle. The SPAD values were measured on 4 leaves of 3 different plants per treatment to obtain a representative mean value. The measurements were carried out on the following dates: 23 June, 7,15, and 30 July, 9 August, and 3 September 2021.

2.3.3. Leaf Area Index (LAI) and Specific Leaf Area (SLA)

The leaf area index (LAI) was monitored throughout the growing season to evaluate crop adaptation under AV conditions. The LAI was measured by using an AccuPAR LP-80 PAR/LAI ceptometer from METER Group. A total of 4 LAI measurements were carried out per shade depth treatment in the selected quadrat (12 measurements in total) in 4 development phases (early crop establishment: 16 June; flowering stage: 30 June; the full pods stage: August 9; and the maturity stage: 3 September 2021).
In addition to LAI, specific leaf area (SLA) was also monitored.
SLA is the ratio of the leaf area to the leaf dry mass (cm2 g−1). SLA increases under low light conditions [57,58,59,60] and in shaded conditions, which is an indication of the shade-adaptive mechanism of most plants [31,60]. The SLA was measured under the AV system by randomly selecting 12 plants for each treatment (4 plants × 3 replicates for each treatment). The samples were collected on 30 June, 15 July, and 9 August 2021 during the flowering, the beginning, and the full pod development, respectively. Samples of 15 leaves per plant with a fresh weight ranging from 4.5 g to 11 g were collected. The leaf samples were subsequently analysed with a desktop scanner for total surface estimation (cm2). The leaf samples were then dried in a forced-air oven at 65 °C until a constant dry weight (g).

2.3.4. Crop Yield Parameter: Fresh and Dry Weight of Pods

All the plants in the quadrat were sampled, and the soybean pods were collected from the plants and immediately weighed in the field in order to record the fresh weight with a precision scale (Figure 2).
The samples were subsequently oven-dried at 65 °C until a constant weight for the determination of the dry matter and the water content of each sample (following the method indicated by Kenig et al. [61]). The dry weight of the pods per quadrat was estimated from the fresh weight of the pods harvested in the quadrat and from the water content of the samples (Equations (1) and (2)).
D W = F W W c t o t · F W
W c = ( F W D W ) F W
where:
DW is the quadrat dry weight (g); FW is the quadrat fresh weight (g); and Wc is the water content of the pods.
Biomass productivity was then calculated from the quadrat dry biomass and expressed in t ha−1. Once the DW of the pods was obtained, the soybean seeds were separated from the pods and weighed to obtain the grain yield (g m−2).

2.4. Simulations

The simulations were performed with an updated version of the modelling platform described in [6]. The system couples a crop growth model (GECROS [62]) to a set of algorithms for estimating and spatialising the shading, radiation, and crop-related outputs.
The system can simulate the entire growing cycle of the crop, including phenology, carbohydrate partitioning, and grain yield. The simulations were conducted on a 12 m × 12 m test area covering all the used shading conditions of the AV system. Calculations were iterated in the test area on cells of size 0.5 m × 0.5 m, allowing for the mapping of the results.
The radiation mapping was calculated on the cells with a resolution of 0.12 m × 0.12 m and a 30 min time step. The mapped values of the radiation were then used to compute the shade depth (SD) map (Figure 3).
SD indicates the reduction percentage of the global radiation compared to the full light and is calculated as:
S D ( i , j ) = 100 I F L I ( i , j ) A V I F L
where IFL is the cumulated radiation in full light:
I F L   = t s t a r t   t e n d g F L ( t ) d t
and I(i j) is the cumulated radiation in a cell i, j of the AV area:
I ( i , j ) = t s t a r t   t e n d g ( i , j ) ( t ) d t
The SD values were estimated as mean values in the 1.5 m × 1.5 m plots (Figure 3). The simulated and observed grain yield values in the experimental plots were then plotted against the SD values estimated at the plot locations.

2.5. Statistical Analysis

Statistical analysis was performed using Rstudio, R version 4.2.1 (R Core Team, 2022).
The statistical analysis of the physiological and morphological traits of the crop was carried out using two-way ANOVA to identify the statistically significant differences among the experimental factors of the shading levels (FL, AV1, AV2, AV3, and AV4) and the time (dates) for the variables considered (LAI, SLA, SPAD, etc.) (see Supplementary Materials). The two-way ANOVA for the SLA was carried out only on 2 dates: 15 July and 9 August 2021. One-way ANOVA was carried out for crop yield data.
The ANOVA test was followed by the post hoc Tukey’s honestly significant difference test. The simulation data were analysed through root mean square error (RMSE) and normalised RMSE (nRMSE, %) to measure the differences between the simulated and the observed values of the soybean grain yield. The nRMSE was calculated by comparing the 4 simulated grain yields and the 4 observed grain yields in the FL conditions and, in the AV system, the 2 simulated grain yields and the 2 observed grain yields.

3. Results

3.1. Crop Height

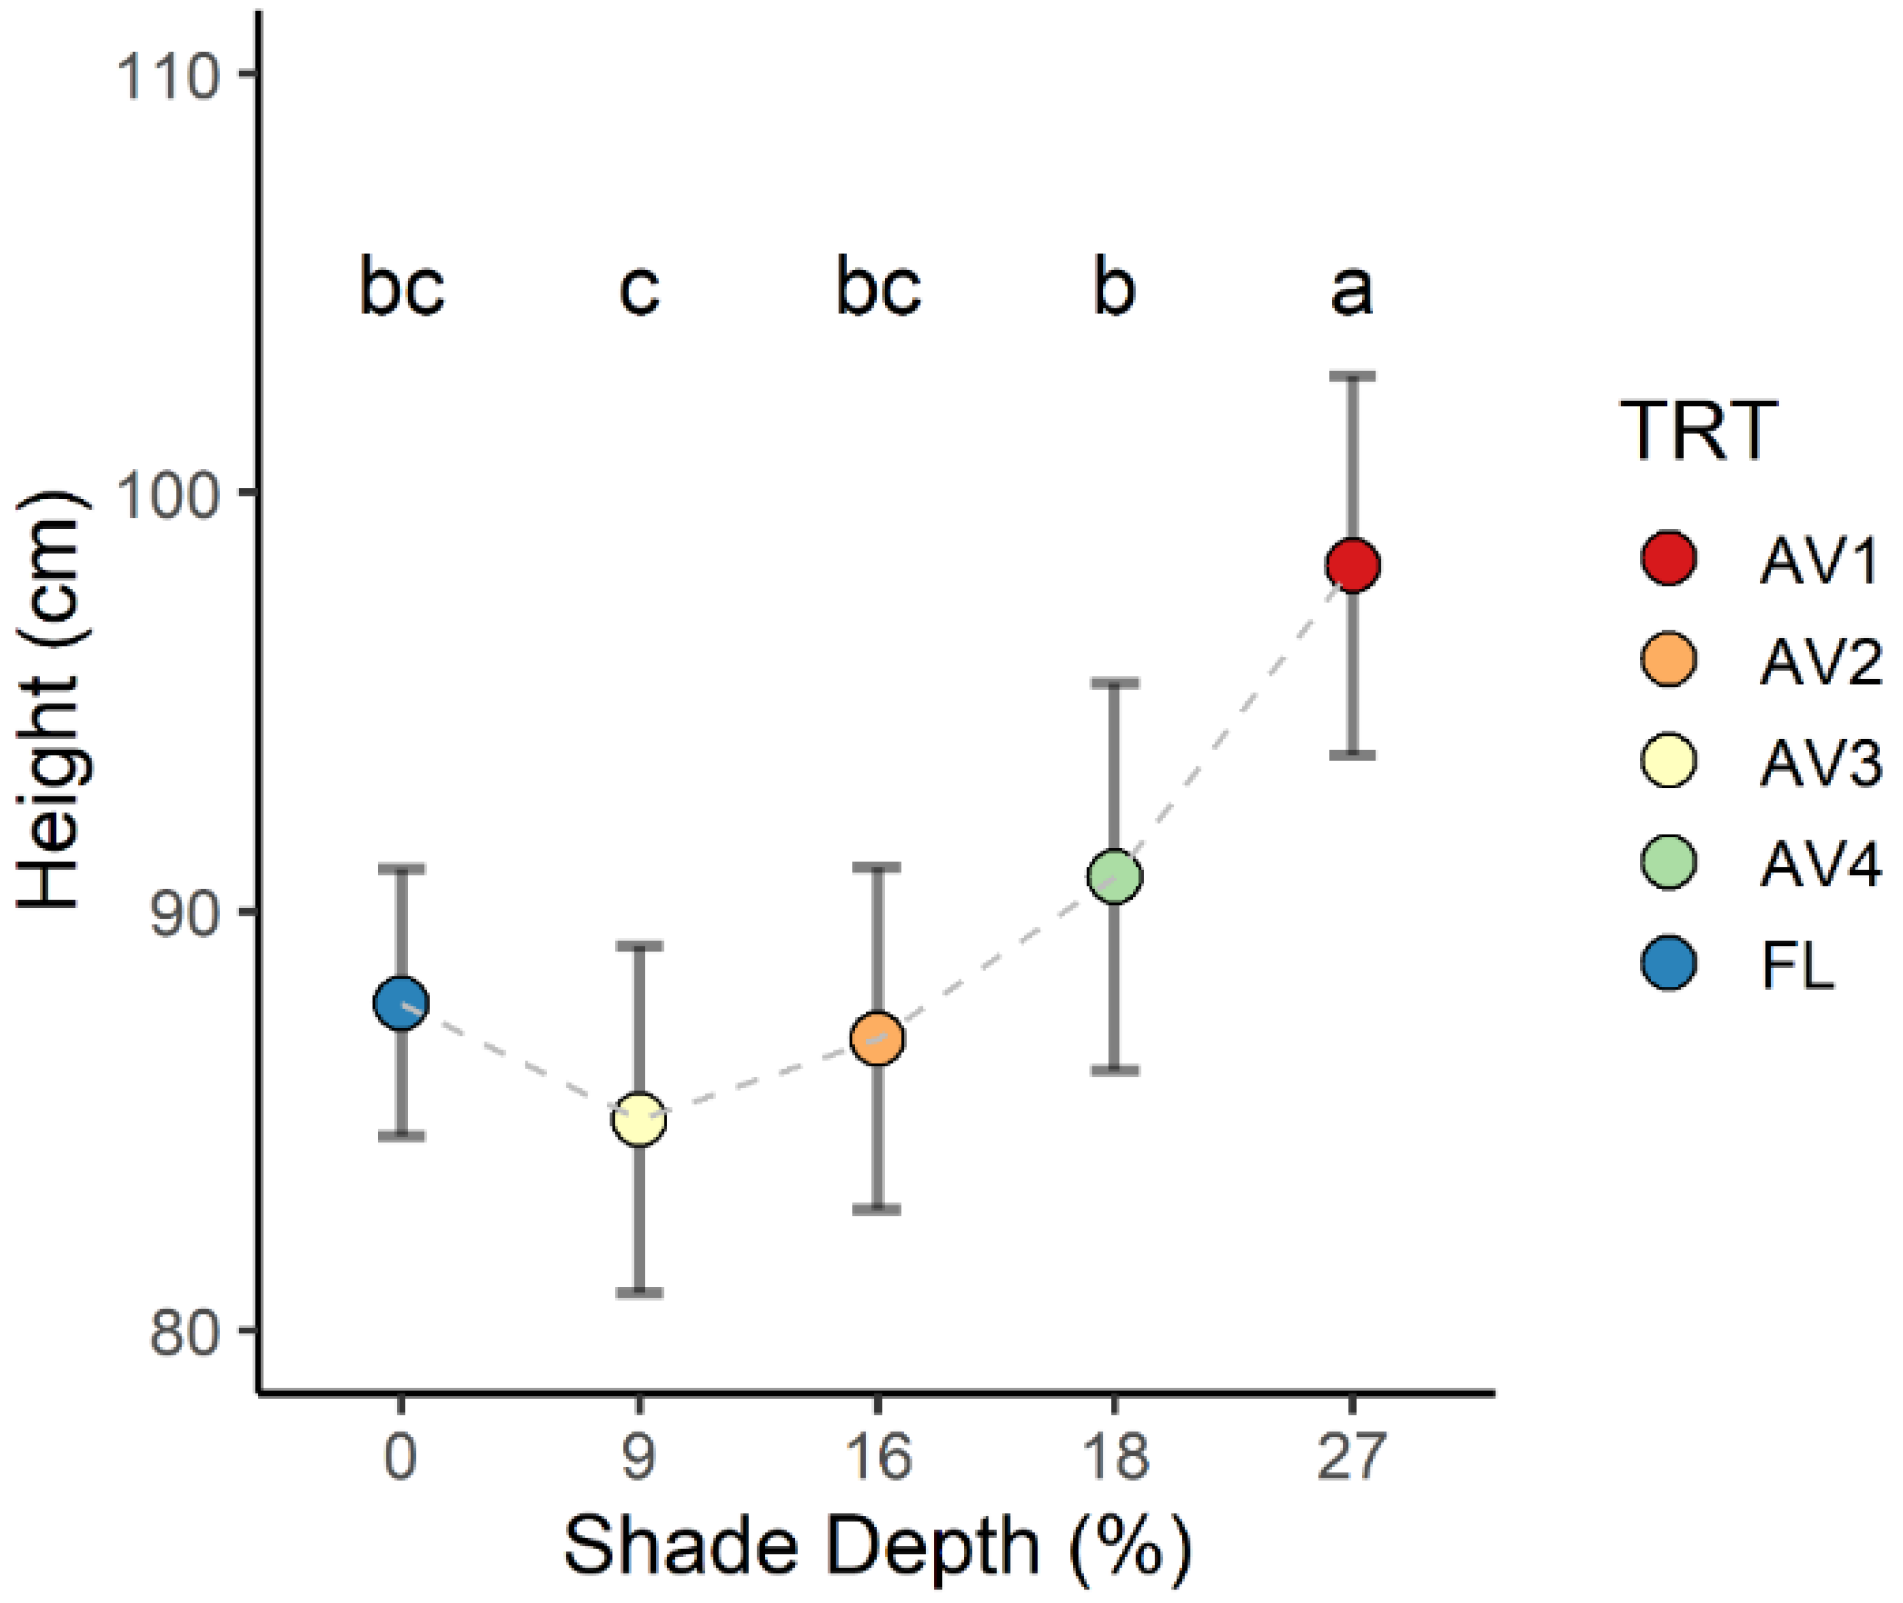
The average plant height (cm) (see Table S1 of Supplementary Materials), measured during the whole growing cycle, of the AV1 plants (98.25 cm) was significantly higher (p-value < 0.05, see Table S2 of Supplementary Materials) than that of the FL plants (87.8 cm) and all the other AV treatments (AV2 = 86.95 cm, AV3 = 85.04 cm, and AV4 = 90.81 cm), which indicates that only the most severe conditions of shade depth significantly affected stem elongation. The height of the plants grown in AV2, AV3, and AV4 did not statistically differ from that of the FL plants, but the plants in AV1 were significantly higher than those in AV2, AV2, AV3, and AV4 (Figure 4).

3.2. SPAD Chlorophyll Content

The differences in the chlorophyll content among the treatments were very limited and apparently not directly related to shading depth. The SPAD value of the FL treatments (43.58) was statistically higher (p-value < 0.05, Figure 5; see Tables S1 and S3 of Supplementary Materials) than that measured in the AV2 treatment (41.87). The level of shading of the other three treatments did not affect SPAD when compared to the FL conditions (AV1 = 43.41, AV3 = 42.87, and AV4 = 42.33).

3.3. Leaf Area Index and Specific Leaf Area

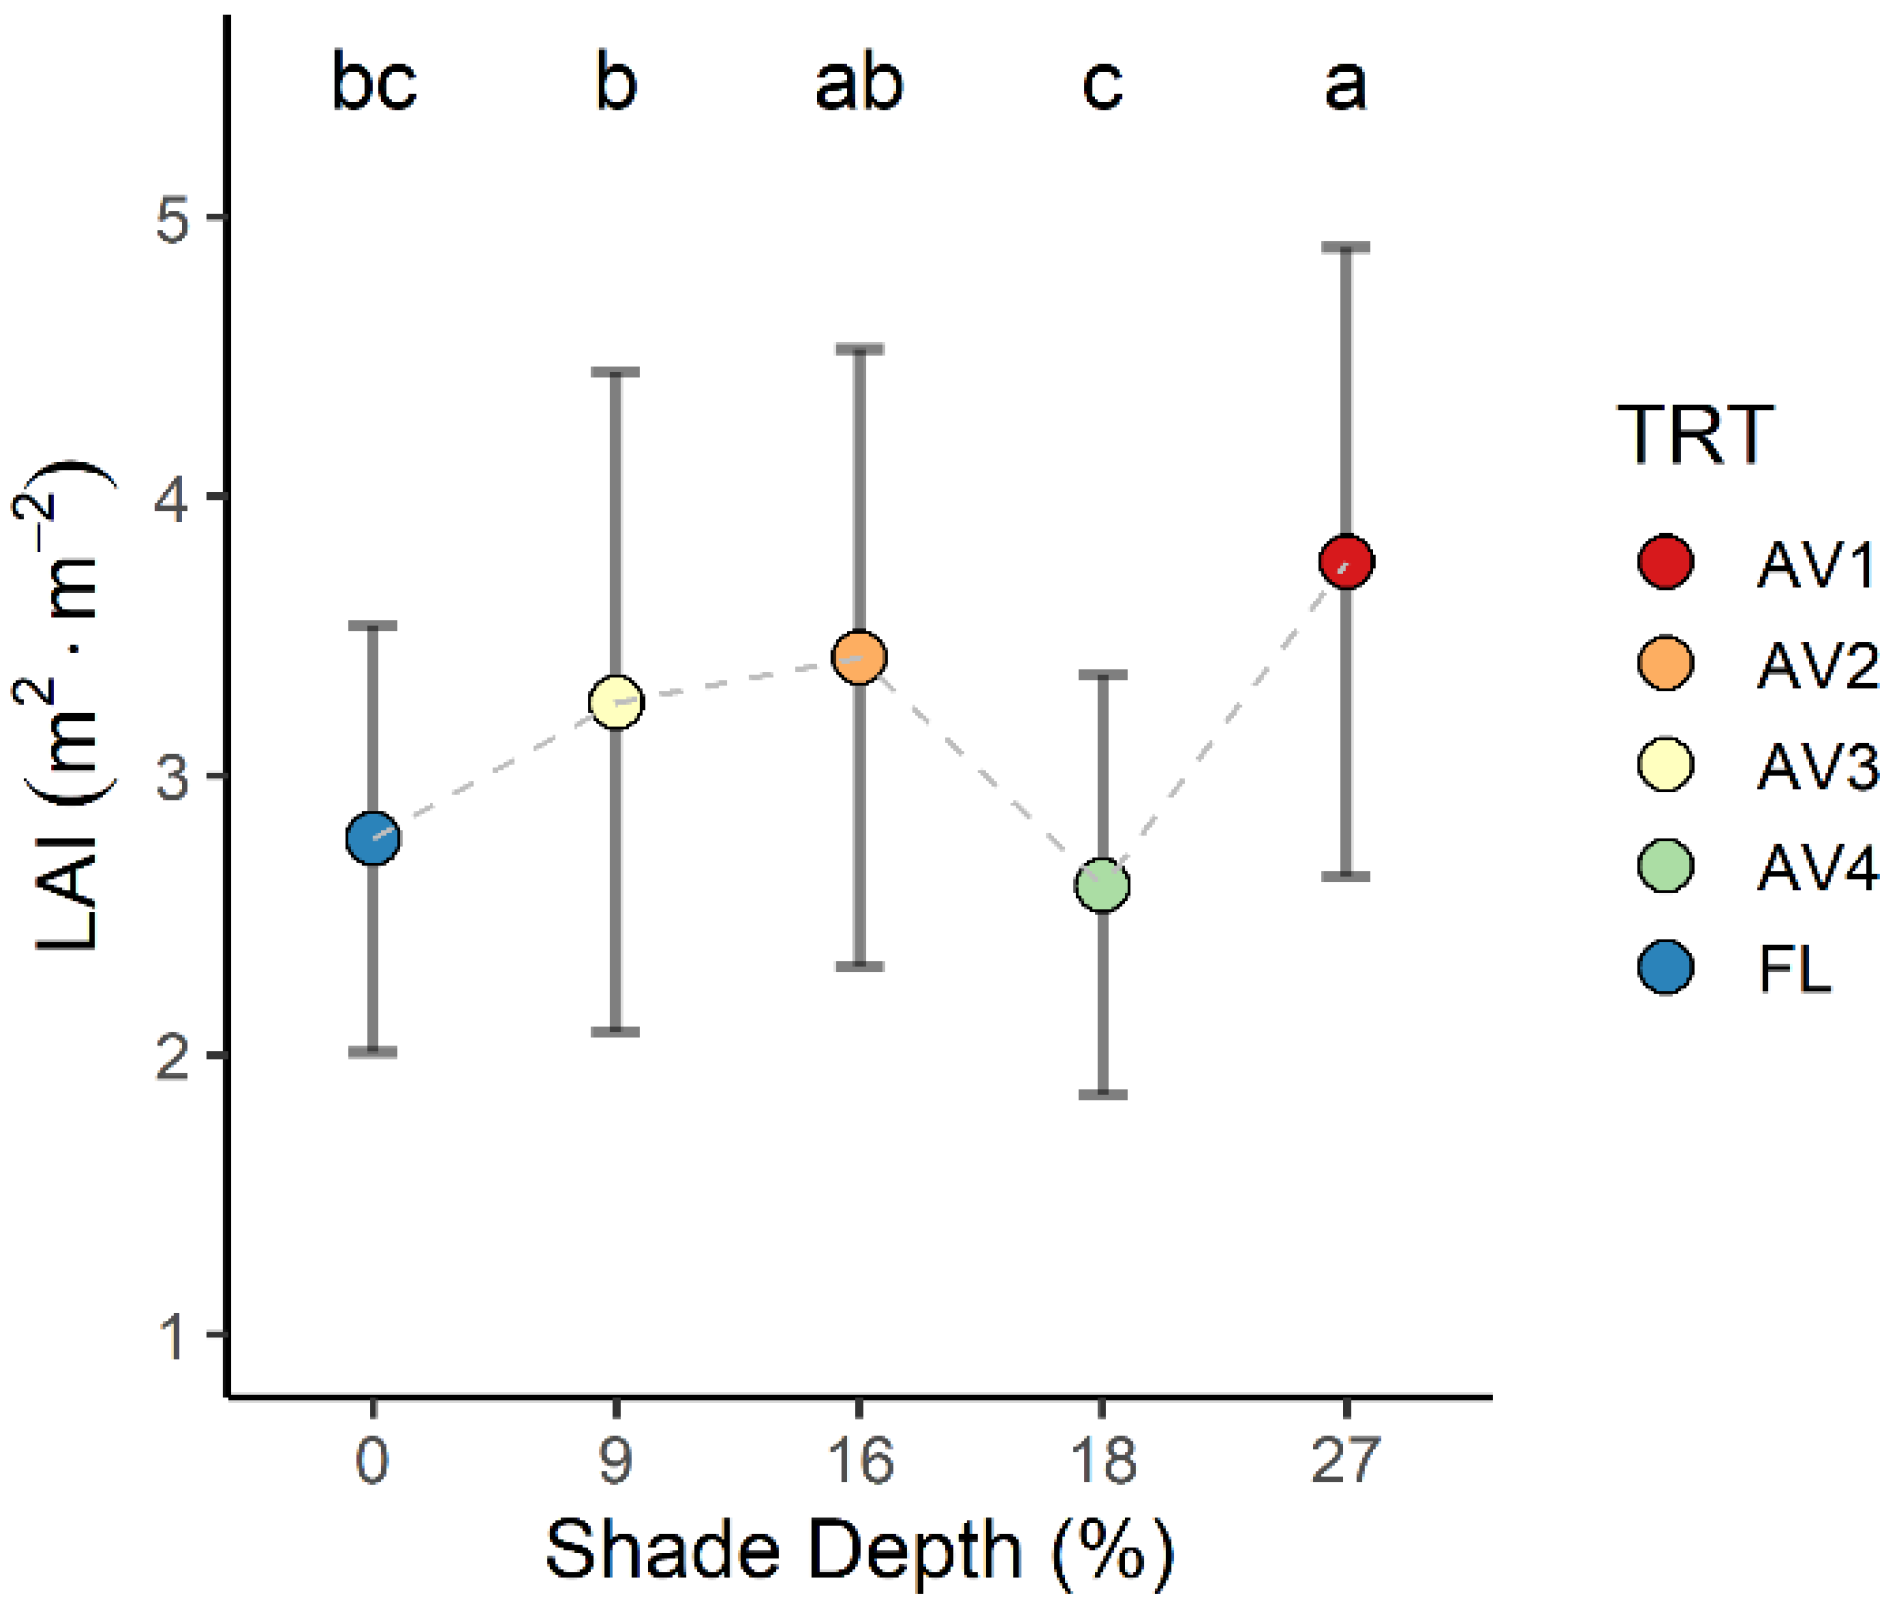
The highest LAI was found under the most shaded conditions (AV1) (Figure 6). The mean LAI in FL (2.78) was significantly lower (p-value < 0.05; see Table S4 of Supplementary Materials, Figure 6) than in AV1 (3.63).
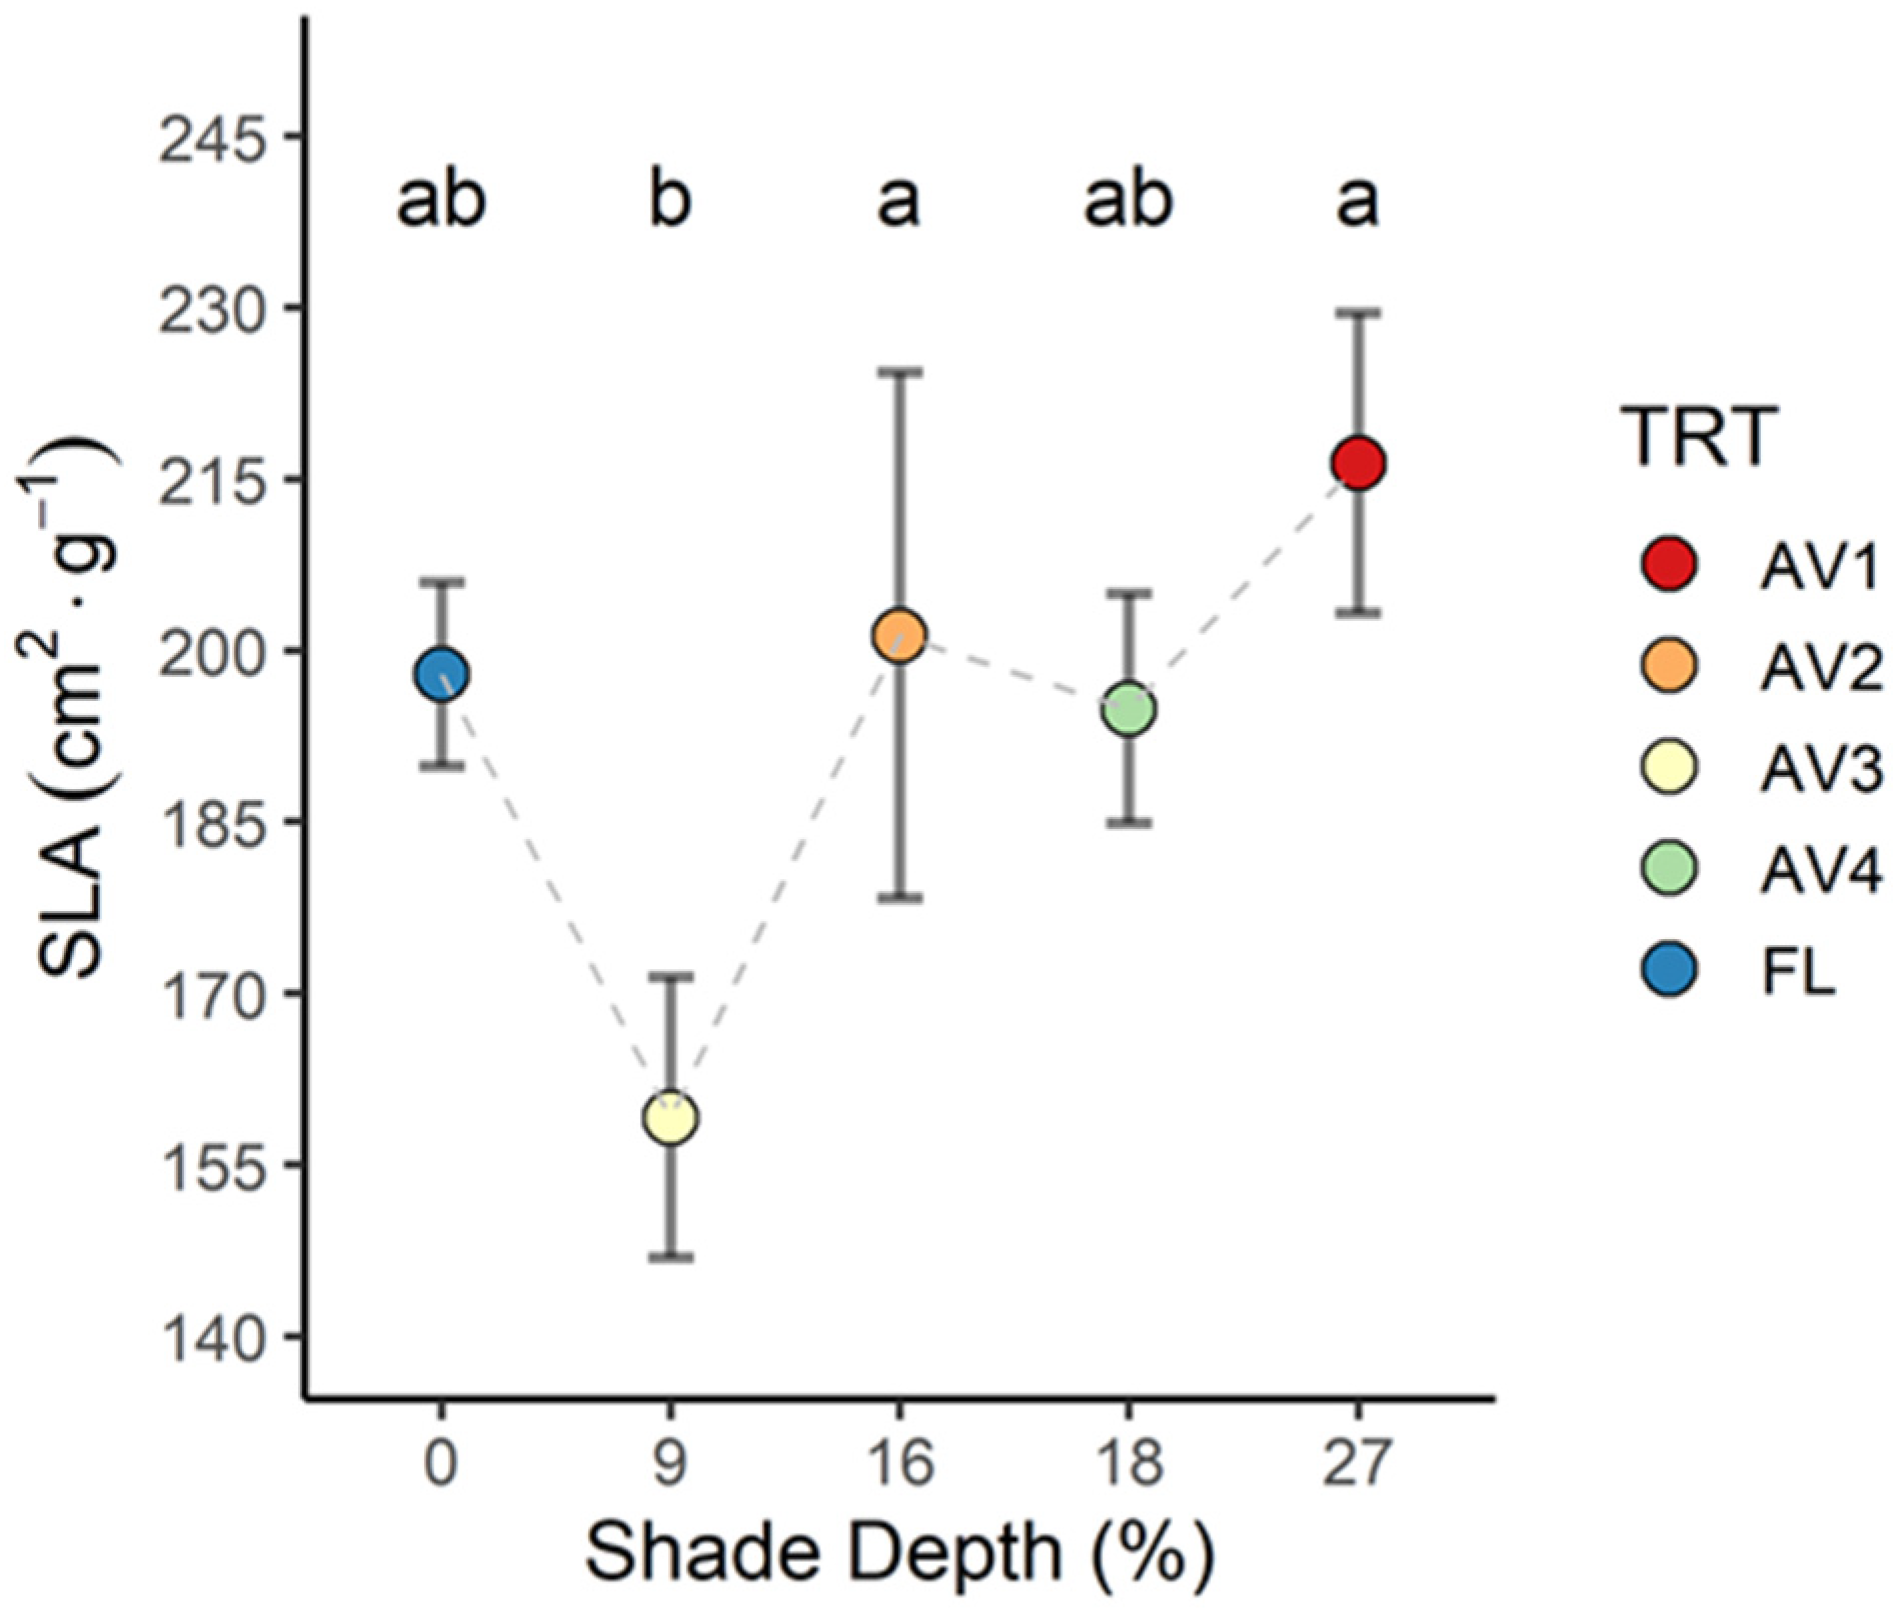
The LAIs of the AV2 (3.42), AV3 (3.26), and AV4 (2.64) SD treatments were not different from that of the FL (see Table S1 of Supplementary Materials). However, the LAIs of the AV2 and AV3 treatments showed a tendency to increase compared to the FL, which indicates that the soybean adapted its canopy to shade progressively by increasing leaf area. This morphological adaptation is also supported by the measurement of the SLA (Figure 7), which increased by 9% (216 c m2 g−1) under AV1 compared to the FL conditions (198 cm2 g−1), even though this difference, was not statistically significant (p-value ≥ 0.05, see Tables S1 and S5 of Supplementary Materials). The other treatments showed the following SLA values: 201 cm2 g−1 (AV2), 159.12 cm2 g−1 (AV3), and 194.90 cm2 g−1 (AV4).

3.4. Crop Yield Parameters

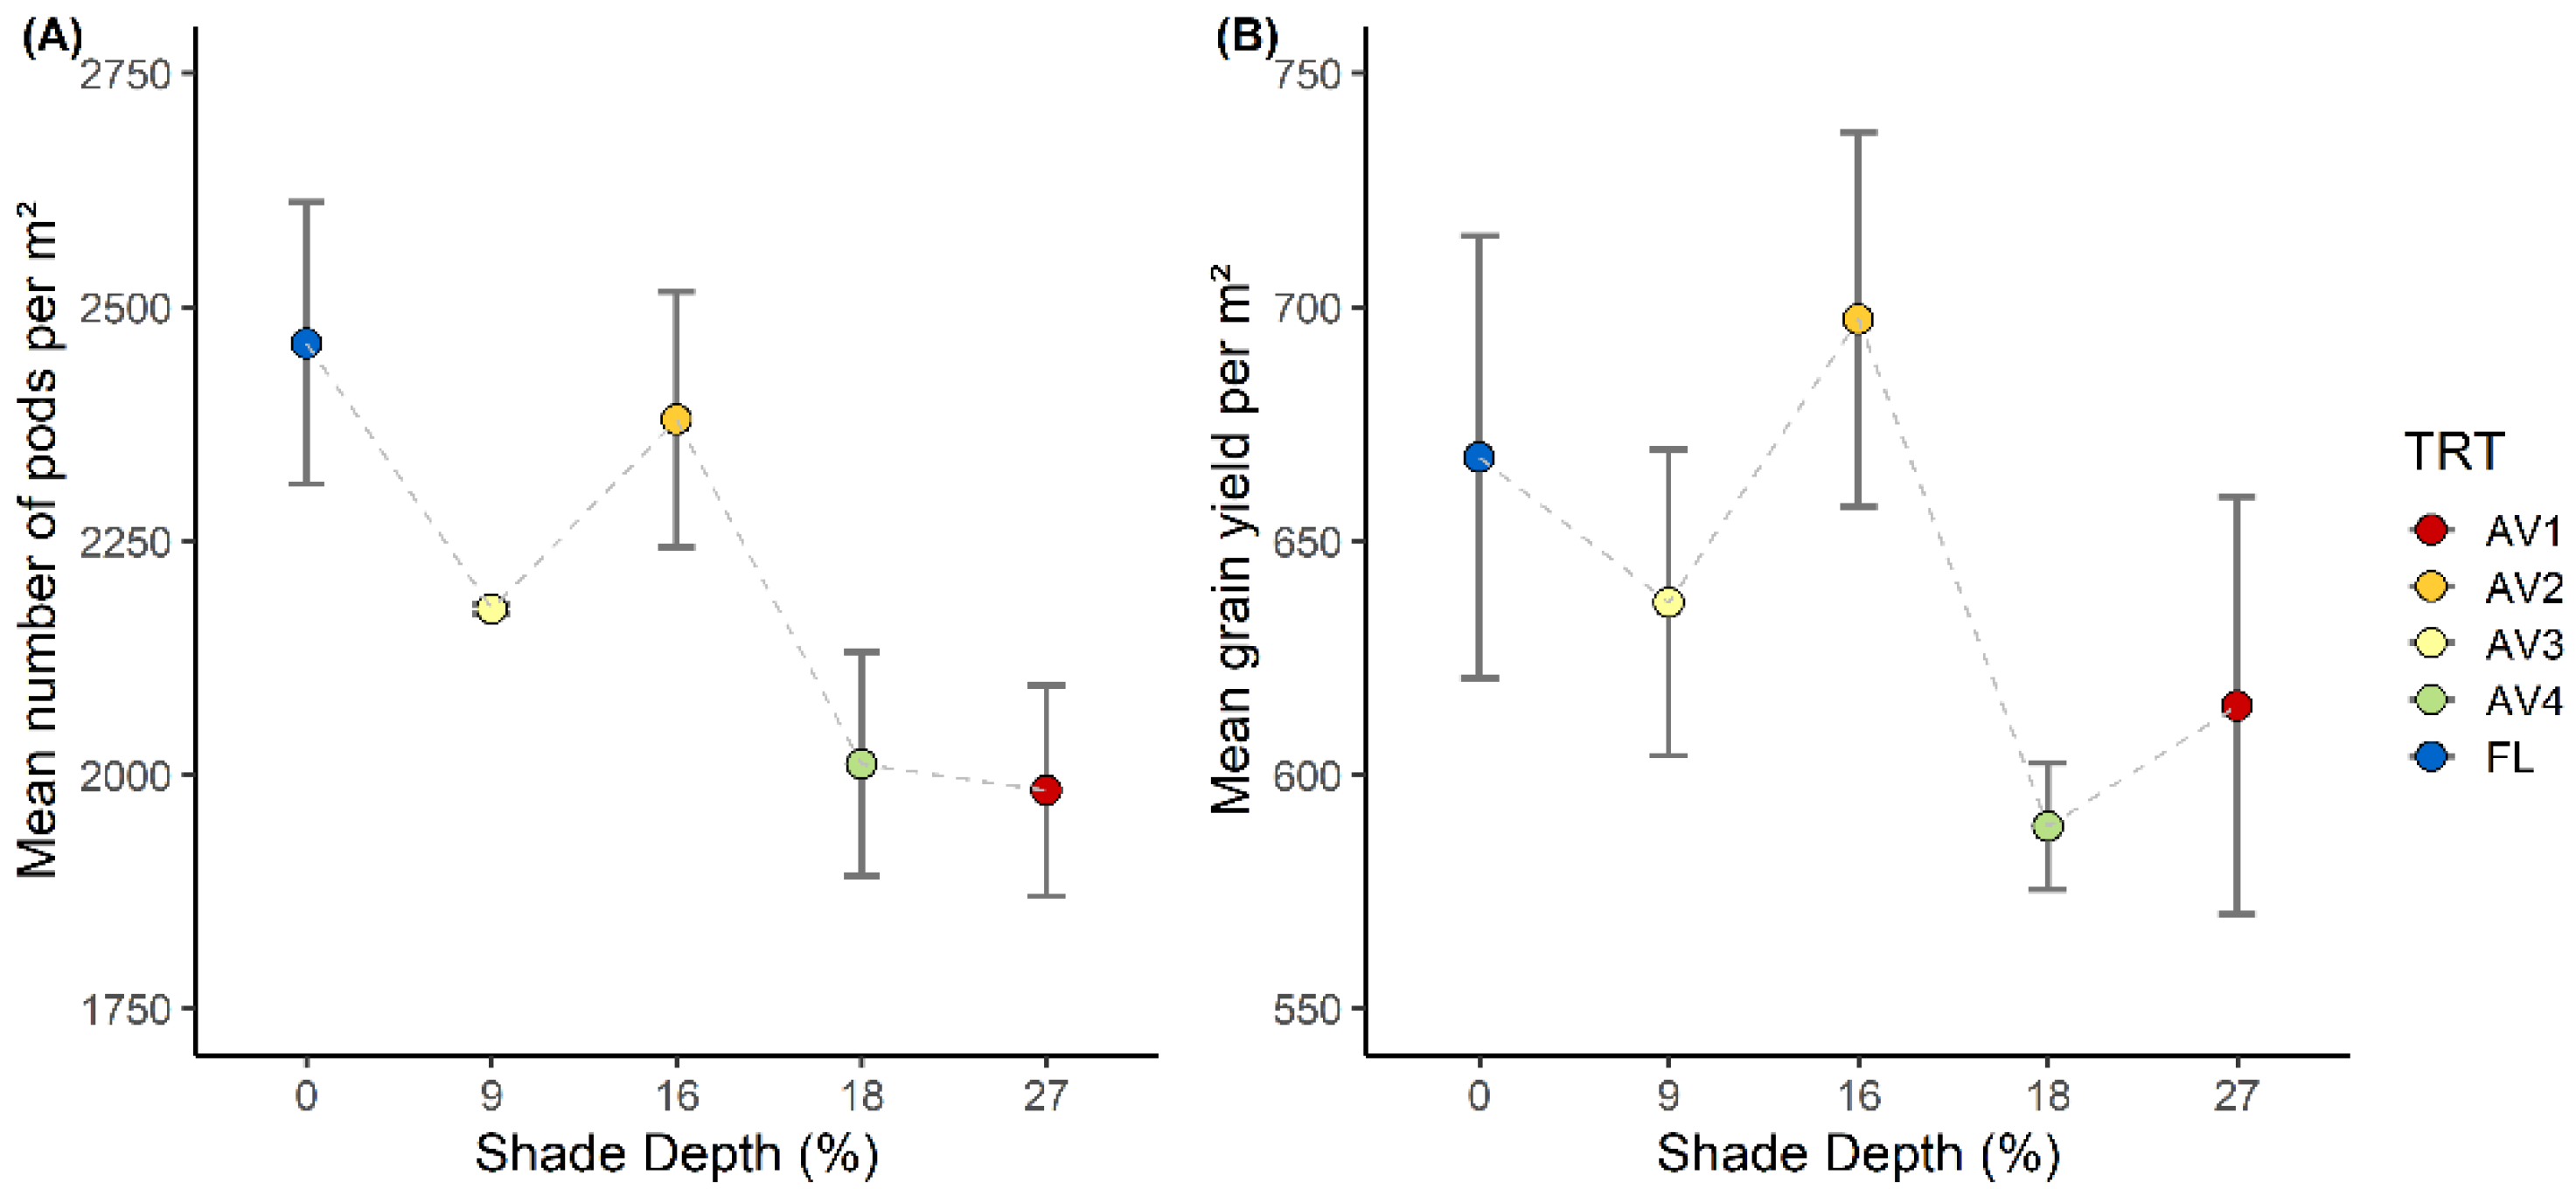
The pod number and grain yield showed a decreasing trend with increasing SD levels (Figure 8A,B; see Table S1 of Supplementary Materials). In particular, number while not statistically significant ((p-value ≥ 0.05, Table S6 of Supplementary Materials), in the most shaded treatments (AV1 and AV4) the pod number was reduced by 19.4% (1983, AV1) and 18.2% (2011, AV4) compared to that in the FL conditions (2461) (Figure 8A), and, in the AV2 and AV3 treatments, the number of pods was reduced by 3.3% (2379) and 11.5% (2177), respectively. The total pod number reduction compared to the open field conditions was on average 13% when considering all of the AV conditions.
The grain yield was not statistically significant ((p-value ≥ 0.05, see Table S9 of Supplementary Materials) for the SD treatments. The grain yield reduction compared to that of the FL (667 g m−2) was 8% (614 g m−2), 4.6% (636 g m−2), and 11.8% (588 g m−2), respectively, for treatments AV1, AV3, and AV4, while for AV2 a slight increase (+4.4%, 697 g m−2) was observed (Figure 8B).

3.5. Modelling Results

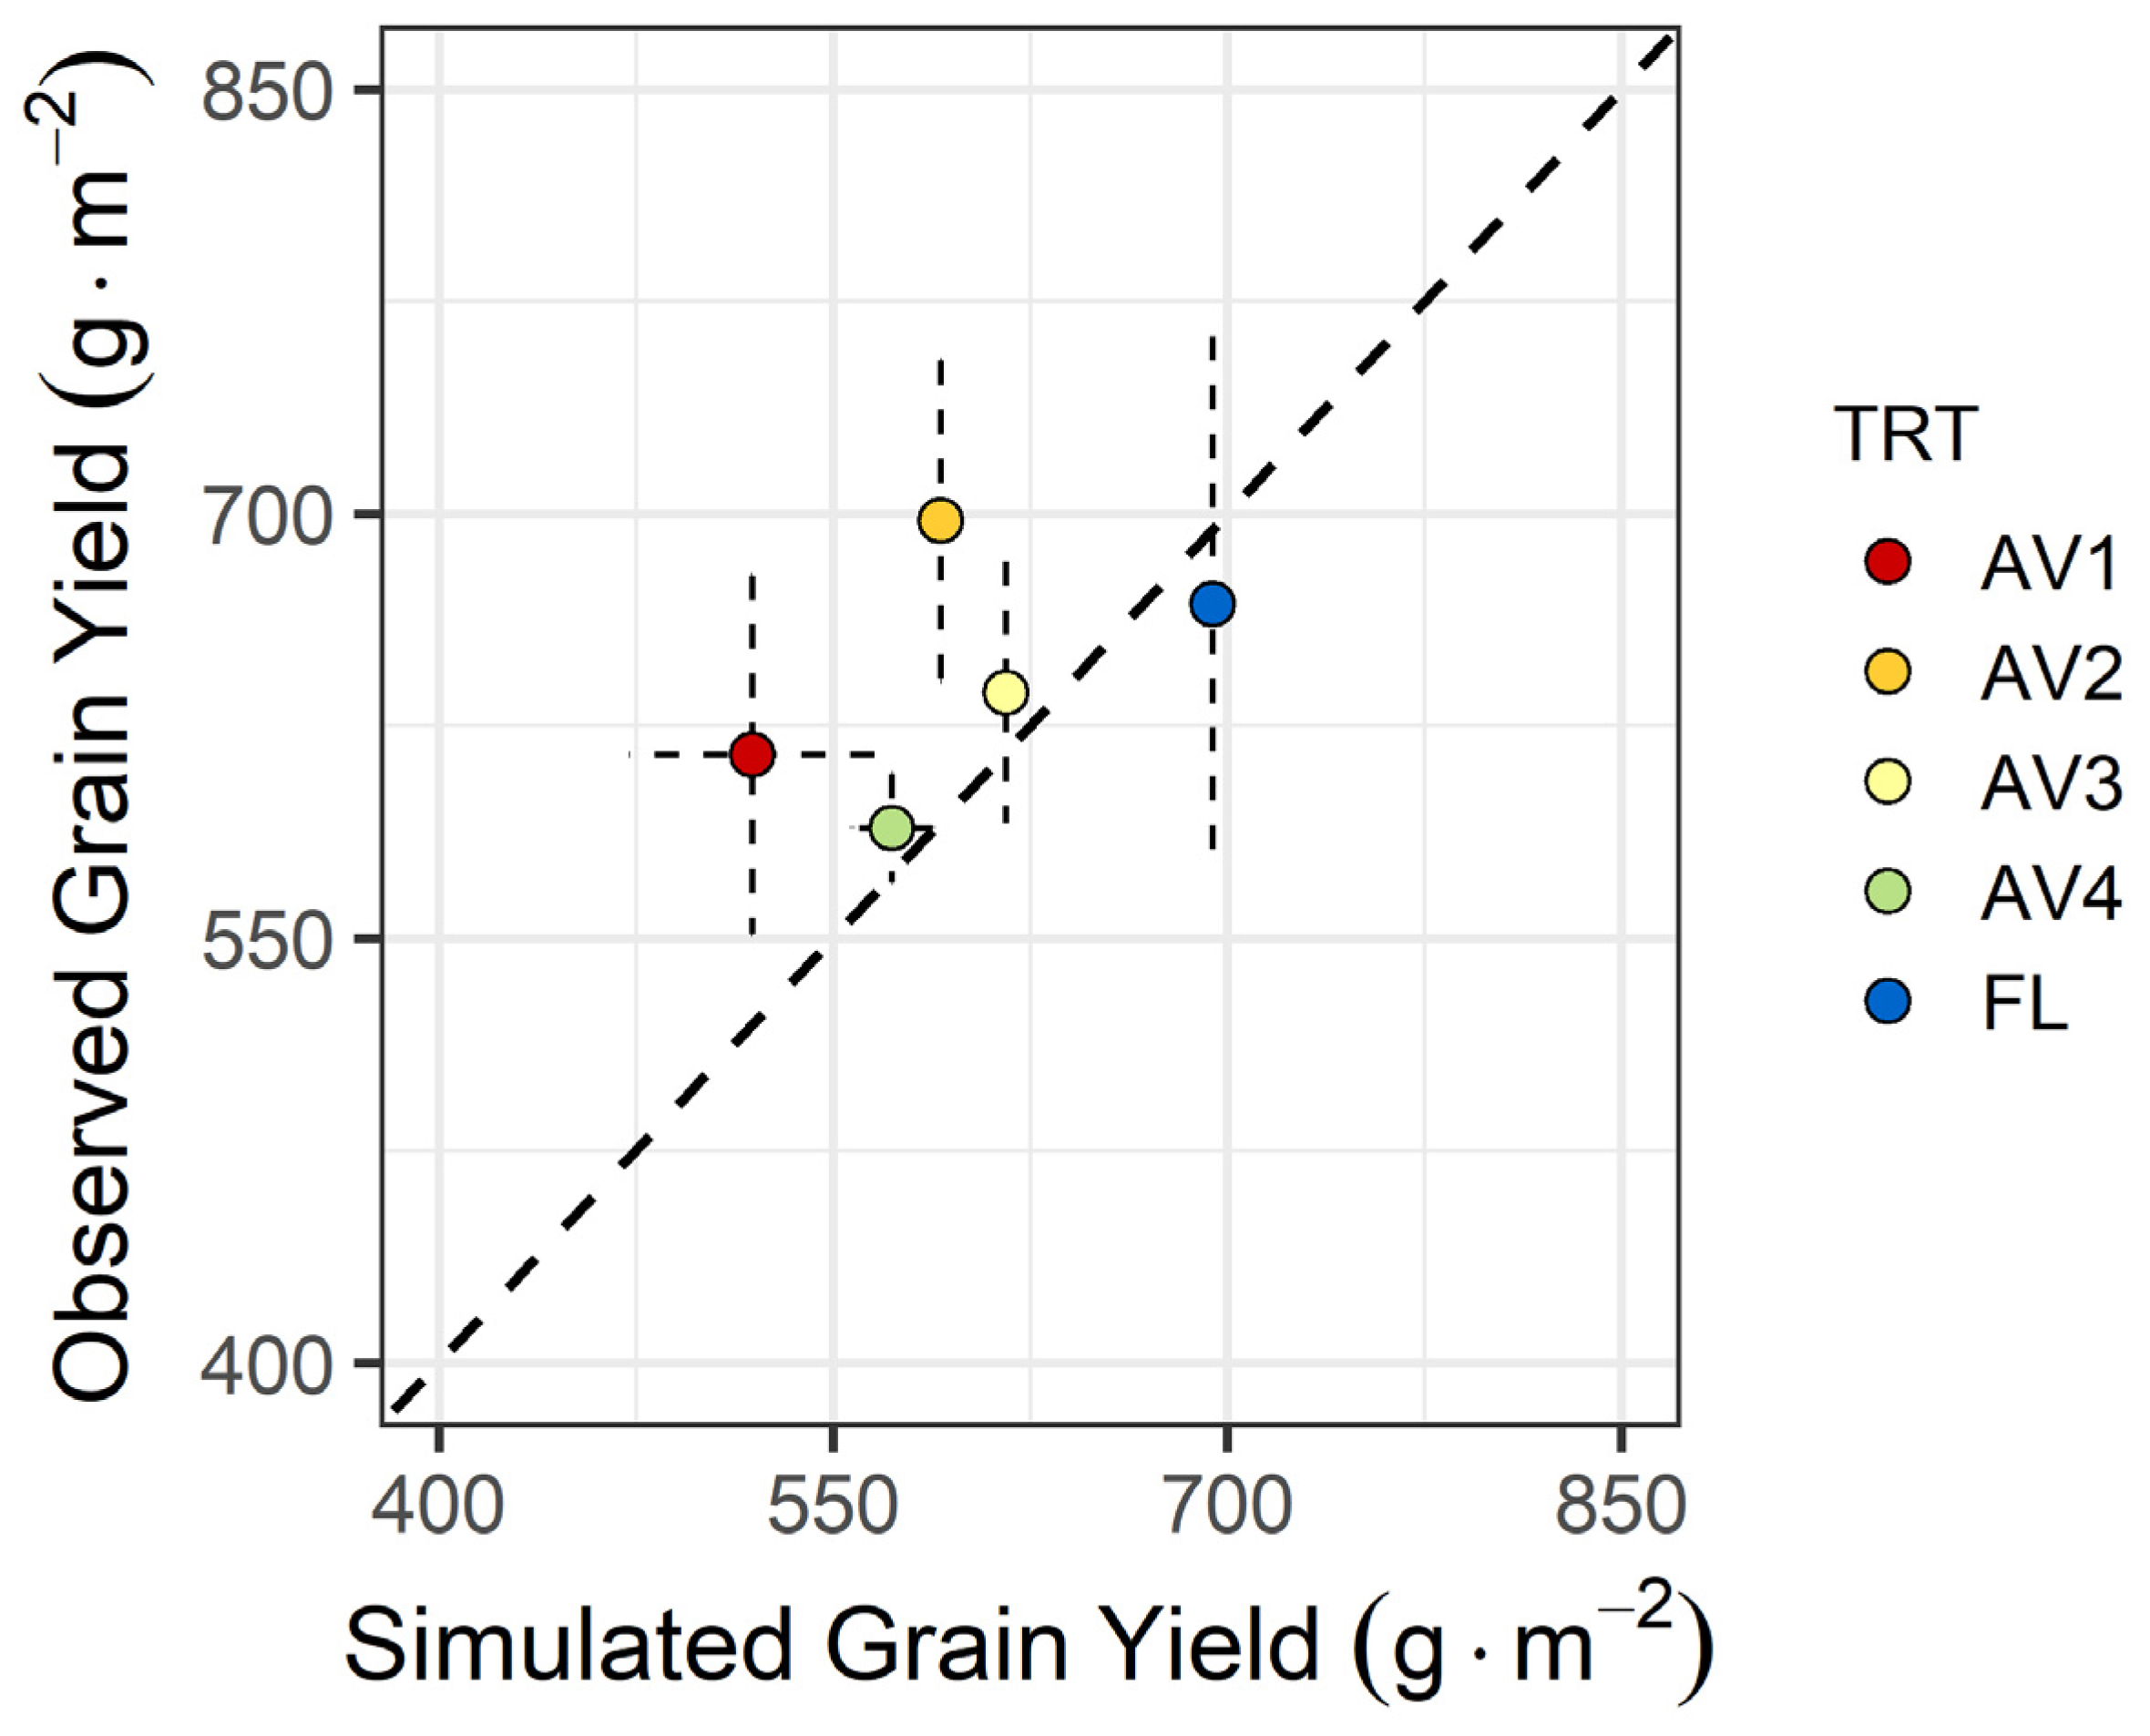
The normalised root mean square error (nRMSE) value of the predicted grain yield differs from the observed grain values of 12.9% for the FL conditions, 15.7% in AV1, 16.5% in AV2, 6.71% in AV3, and 2.82% in AV4. The results of the RMSE revealed that the model underestimated the grain yield, particularly in the AV2 and AV1 conditions (>15% nRMSE) (Table 1).
The simulation platform showed a good correspondence between the observed and the simulated values (Figure 9).

4. Discussion

One of the main limiting factors in the development of sustainable AV solutions is the lack of information on the response of the main field crops to the shading conditions generated by the AV system. In this work, for the first time, a soybean crop was cultivated under a largescale AV system, and the field results (morphological and physiological traits and yield) were used to validate a simulation model to forecast the soybean yield.
The soybean physiological and morphological traits were affected by the shade depth levels. Plant height and vigour increased linearly with the shade depth levels (Figure 4), which is a normal response of plants growing under shaded conditions [25,26,27,28,29,30], as was previously reported for soybean in an intercropping system [63,64] and for other field crops, such as durum wheat, potatoes, and grass–clover, under an AV system [26].
The leaf physiological and morphological traits investigated in this study were the leaf area index (LAI), the specific leaf area (SLA), and the chlorophyll content (SPAD).
The LAI and SLA data were not exclusively collected to evaluate the physiological and morphological mechanisms of shade adaptation; they were also collected for modelling purposes. In fact, the LAI is an important trait, along with SLA [65,66,67], for predicting crop photosynthesis and its growth response during the growing cycle.
The LAI and SLA were higher in the most shaded AV areas than in the FL conditions across all the sampling dates. An increase in the LAI under the AV system was found in celeriac [17,26], wheat, potatoes, and grass–clover [26]. The SLA of the soybean increased with the SD treatment, which confirms the response of this trait to shading already found in lettuce [15] and apples [20] grown under AV systems and in soybean grown in an intercropping system [63,64].
The chlorophyll content, which in this study was estimated with the SPAD index, was not affected by the SD levels under the AV system as the range of data collected varied by ±2 between the treatments. These SPAD results were unexpected as the chlorophyll content usually increases in crops grown under low light and under shade and in soybean in intercropping conditions [31,53,54,55,56,63,68,69]. In the AV system studied in this work, the soybean SPAD values were similar to those of plants growing in full light conditions, which is probably a consequence of the low shading depth and of the fact that the level of shading was not constant but changed dynamically throughout the day. For this reason, it seems incorrect to say that the response of soybean grown under AV conditions corresponds to that of soybean cultivated in intercropping systems or in experiments where the level of shading is constant throughout the day. In fact, the results obtained for SPAD under the AV system with a maximum shade < 30% were different to those obtained in the shading condition for other crops growing under a moderate shade environment, where the shade can reach values > 50% [54,55].
Regarding yield potential, it is considered that soybean is among the crops that suffer from shading conditions the most [70], but without field observations in an AV system, this assertion can only be based on a basic knowledge of the crop or on the trials where shading conditions are features of the experimental setup, e.g., intercropping systems [71].
Taking into account cropping in AV systems, it is interesting to analyse how the conditions of reduced radiation affect grain yield. In a previous study, it was reported that shading conditions negatively affected the reproductive stages of soybean (flowering and pod set) as they are directly related to the photosynthetic process [72,73,74,75]. It was also reported that continuous shade affects the soybean pod number by increasing the pod abortion [76]. Our results are in agreement with the bibliographic evidence and confirmed that in soybean the yield reduction experienced under the shade of the AV system is associated with a negative impact of shade during the pod set stage (Figure 8A). The inversely proportional relationship between shade depth and grain yield (Figure 8B) is, to a good extent, explained by the depressive effect of shade on the pod number, as revealed in Figure 8A. This is particularly evident for the AV1 and AV4 treatments.
In view of that which was mentioned above, the particular results observed for the treatment in AV2 are, to some extent, counter-intuitive in that the AV2 yields do not fit well in the relationship with the shade depth. Our interpretation must refer to a non-uniform distribution of irrigation water. In fact, the treatment in AV2 was located near the drip irrigation, and this may have affected the yield performances compared to the other treatments.
The average grain yield reduction for the whole AV system was 8%, which is largely under the limits of the yield reductions indicated by the DIN standards in Germany ([77], for which at least 66% of the reference yield needs to be achieved under the AV system). In a Korean study [45], which investigated soybean cultivation under an AV system, grain yield was reduced by 20% with a shade depth of 25%, while, in the present work, a similar shade depth (27% in AV1) determined a yield reduction of only 8%. These results confirm that, considering the conceptual model proposed by Laub et al. [70], soybean is shade tolerant. The yield reduction measured in this work is lower that what previously reported in the literature [45,64,70,78,79,80], which could be a consequence of pedoclimatic conditions or variety choice, considering that the effect of shading in soybean varies largely with the genotype [64]. Considering the large effect that genotype, environmental factors, and AV system design have on crop yield, it would be necessary to run multiple long-term studies to provide the information needed to support the design and management of sustainable AV systems. In this regard, the use of models such as GECROS [62], implemented in the modelling platform of this study, offers a great contribution to the development of AV systems. The experimental data obtained in this study were used to validate the modelling platform, and the values of the nRMSE (<7% and 16.5%, the best and worst performances, respectively) indicated that the simulation platform can satisfactorily predict soybean grain yields under AV.

5. Conclusions

In this work, the morphological and physiological traits and yield responses of soybean growing under a commercial large scale AV system were investigated both in the field and using a crop model.
The main morphological and physiological traits that increased significantly under the most shaded areas were plant height, the LAI, and the SLA. These results highlight the capacity of a soybean crop to adapt its morphology under an AV system to improve light capture, particularly by increasing leaf area (both the LAI and the SLA increased with shading level) and by increasing the stem elongation.
Under the large scale AV system tested in this study, soybean yield was on average reduced by 8%, due to a reduction in pod number, which was proportional to the shade depth level increase. The simulation platform developed by Amaducci et al. (2018) was validated in this study and is thus confirmed as a valuable tool for testing the potential of different AV scenarios. This could be of great practical use when studying the impact that a given AV design, in a particular environment and with a specific crop, has on a set of pre-defined key performance indicators or on the achievement of a target level of crop yield. In this regard, the regulations in France, Japan, and Germany have set the maximum level of yield reduction that can be achieved underAV systems (compared to full light) as 10%, 20%, and 34%, respectively. In addition, the simulation platform can be used to study the effect of specific agronomic choices (e.g., fertilisations and irrigation) on crop yield and on AV performance in general.

Supplementary Materials

The following supporting information can be downloaded at: https://www.mdpi.com/article/10.3390/horticulturae8121160/s1, Table S1: values of crop height, LAI, SPAD, SLA, number of pods and grain yield and Tukey’s HSD letters, Table S2: Tthe two-way ANOVA table for height, Table S3: the two-way ANOVA table for SPAD, Table S4: Tthe two-way ANOVA table for LAI, Table S5: the two-way ANOVA table for SLA, Table S6: one-way ANOVA for number of pods, Table S7: summary of the standard deviation and standard error of pods number measured per each treatment; N = number of samplings per area, Table S8: summary of the standard deviation and standard error of grain yield measured per each treatment; N = number of samplings per area., Table S9: one-way anova for grain yield.

Author Contributions

E.P.: conceptualisation, investigation, data curation, methodology, formal analysis, original draft preparation; M.C. (Michele Croci): data curation, review and editing, formal analysis; M.C. (Michele Colauzzi): conceptualisation, software, review and editing; S.A.: conceptualization, review and editing. All authors have read and agreed to the published version of the manuscript.

Funding

Emilia-Romagna Region European Social Fund (ESF) POR-FESR 2014–2020 bando “Alte competenze”.

Data Availability Statement

The data presented in this study are available on request from the corresponding author.

Conflicts of Interest

The authors declare no conflict of interest.

References

  1. General Assembly of the United Nations. Available online: https://www.un.org/en/ga/ (accessed on 22 September 2022).
  2. United Nations. Peace, Dignity and Equality on a Healthy Planet. Available online: https://www.un.org/en (accessed on 22 September 2022).
  3. International Renewable Energy Agency. Renewable Energy Statistics. Available online: https://www.irena.org/publications/2022/Jul/Renewable-Energy-Statistics-2022 (accessed on 15 September 2022).
  4. Van de Ven, D.J.; Capellan-Peréz, I.; Arto, I.; Cazcarro, I.; de Castro, C.; Patel, P.; Gonzalez-Eguino, M. The potential land requirements and related land use change emissions of solar energy. Sci. Rep. 2021, 11, 2907. [Google Scholar] [CrossRef] [PubMed]
  5. Dupraz, C.; Marrou, H.; Talbot, G.; Dufour, L.; Nogier, A.; Ferard, Y. Combining solar photovoltaic panels and food crops for optimising land use: Towards new agrivoltaic schemes. Renew. Energy 2011, 36, 2725–2732. [Google Scholar] [CrossRef]
  6. Amaducci, S.; Yin, X.; Colauzzi, M. Agrivoltaic systems to optimise land use for electric energy production. Appl. Energy 2018, 220, 545–561. [Google Scholar] [CrossRef]
  7. Campana, P.E.; Stridh, B.; Amaducci, S.; Colauzzi, M. Optimisation of vertically mounted agrivoltaic systems. J. Clean. Prod. 2021, 325, 129091. [Google Scholar] [CrossRef]
  8. Trommsdorff, M.; Kang, J.; Reise, C.; Schindele, S.; Bopp, G.; Ehmann, A.; Weselek, A.; Högy, P.; Obergfell, T. Combining food and energy production: Design of an agrivoltaic system applied in arable and vegetable farming in Germany. Renew. Sustain. Energy Rev. 2021, 140, 110694. [Google Scholar] [CrossRef]
  9. Giri, N.C.; Mohanty, R.C. Agrivoltaic system: Experimental analysis for enhancing land productivity and revenue of farmers. Energy Sustain. Dev. 2022, 70, 54–61. [Google Scholar] [CrossRef]
  10. Barron-Gafford, G.A.; Pavao-Zuckerman, M.A.; Minor, R.L.; Sutter, L.F.; Barnett-Moreno, I.; Blackett, D.T.; Thompson, M.; Dimond, K.; Gerlak, A.K.; Nabhan, G.P.; et al. Agrivoltaics provide mutual benefits across the food–energy–water nexus in drylands. Nat. Sustain. 2019, 2, 848–855. [Google Scholar] [CrossRef]
  11. Bedbabis, S.; Ben Rouina, B.; Boukhris, M.; Ferrara, G. Effects of irrigation with treated wastewater on root and fruit mineral elements of Chemlali olive cultivar. Sci. World J. 2014, 2014, 973638. [Google Scholar] [CrossRef]
  12. Boselli, M.; Bahouaoui, M.A.; Lachhab, N.; Sanzani, S.M.; Ferrara, G.; Ippolito, A. Protein hydrolysates effects on grapevine (Vitis vinifera L.; cv. Corvina) performance and water stress tolerance. Sci. Hortic. 2019, 258, 108784. [Google Scholar] [CrossRef]
  13. Goetzberger, A.; Zastrow, A. On the Coexistence of Solar-Energy Conversion and Plant Cultivation. Int. J. Sol. Energy 1982, 1, 55–69. [Google Scholar] [CrossRef]
  14. Agostini, A.; Colauzzi, M.; Amaducci, S. Innovative agrivoltaic systems to produce sustainable energy: An economic and environmental assessment. Appl. Energy 2021, 281, 116102. [Google Scholar] [CrossRef]
  15. Marrou, H.; Wery, J.; Dufour, L.; Dupraz, C. Productivity and radiation use efficiency of lettuces grown in the partial shade of photovoltaic panels. Eur. J. Agron. 2013, 44, 54–66. [Google Scholar] [CrossRef]
  16. Sekiyama, T.; Nagashima, A. Solar Sharing for Both Food and Clean Energy Production: Performance of Agrivoltaic Systems for Corn, A Typical Shade-Intolerant Crop. Environments 2019, 6, 65. [Google Scholar] [CrossRef] [Green Version]
  17. Schindele, S.; Trommsdorff, M.; Schlaak, A.; Obergfell, T.; Bopp, G.; Reise, C.; Braun, C.; Weselek, A.; Bauerle, A.; Högy, P.; et al. Implementation of agrophotovoltaics: Techno-economic analysis of the price-performance ratio and its policy implications. Appl. Energy 2020, 265, 114737. [Google Scholar] [CrossRef]
  18. Weselek, A.; Bauerle, A.; Zikeli, S.; Lewandowski, I.; Högy, P. Effects on Crop Development, Yields and Chemical Composition of Celeriac (Apium graveolens L. var. rapaceum) Cultivated Underneath an Agrivoltaic System. Agronomy 2021, 11, 733. [Google Scholar] [CrossRef]
  19. Jiang, S.; Tang, D.; Zhao, L.; Liang, C.; Cui, N.; Gong, D.; Wang, Y.; Feng, Y.; Hu, X.; Peng, Y. Effects of different photovoltaic shading levels on kiwifruit growth, yield and water productivity under “agrivoltaic” system in Southwest China. Agric. Water Manag. 2022, 269, 107675. [Google Scholar] [CrossRef]
  20. Juillion, P.; Lopez, G.; Fumey, D.; Lesniak, V.; Génard, M.; Vercambre, G. Shading apple trees with an agrivoltaic system: Impact on water relations, leaf morphophysiological characteristics and yield determinants. Sci. Hortic. 2022, 306, 111434. [Google Scholar] [CrossRef]
  21. Marrou, H.; Dufour, L.; Wery, J. How does a shelter of solar panels influence water flows in a soil–crop system? Eur. J. Agron. 2013, 50, 38–51. [Google Scholar] [CrossRef]
  22. Elamri, Y.; Cheviron, B.; Lopez, J.M.; Dejean, C.; Belaud, G. Water budget and crop modelling for agrivoltaic systems: Application to irrigated lettuces. Agric. Water Manag. 2018, 208, 440–453. [Google Scholar] [CrossRef]
  23. Hassanpour Adeh, E.; Selker, J.S.; Higgins, C.W. Remarkable agrivoltaic influence on soil moisture, micrometeorology and water-use efficiency. PLoS ONE 2018, 13, e0203256. [Google Scholar] [CrossRef]
  24. Gonocruz, R.A.; Nakamura, R.; Yoshino, K.; Homma, M.; Doi, T.; Yoshida, Y.; Tani, A. Analysis of the Rice Yield under an Agrivoltaic System: A Case Study in Japan. Environments 2021, 8, 65. [Google Scholar] [CrossRef]
  25. Ferrara, G.; Boselli, M.; Palasciano, M.; Mazzeo, A. Effect of shading determined by photovoltaic panels installed above the vines on the performance of cv. Corvina (Vitis vinifera L.). Sci. Hortic. 2023, 308, 111595. [Google Scholar] [CrossRef]
  26. Weselek, A.; Bauerle, A.; Hartung, J.; Zikeli, S.; Lewandowski, I.; Högy, P. Agrivoltaic system impacts on microclimate and yield of different crops within an organic crop rotation in a temperate climate. Agron. Sustain. Dev. 2021, 41, 59. [Google Scholar] [CrossRef]
  27. Gommers, C.M.; Visser, E.J.; Onge, K.R.S.; Voesenek, L.A.; Pierik, R. Shade tolerance: When growing tall is not an option. Trends Plant. Sci. 2013, 18, 65–71. [Google Scholar] [CrossRef]
  28. Ruberti, I.; Sessa, G.; Ciolfi, A.; Possenti, M.; Carabelli, M.; Morelli, G. Plant adaptation to dynamically changing environment: The shade avoidance response. Biotechn. Adv. 2012, 30, 1047–1058. [Google Scholar] [CrossRef] [PubMed]
  29. Smith, H.; Whitelam, G.C. The shade avoidance syndrome: Multiple responses mediated by multiple phytochromes. Plant. Cell Environ. 1997, 20, 840–844. [Google Scholar] [CrossRef] [Green Version]
  30. Niinemets, Ü. Role of foliar nitrogen in light harvesting and shade tolerance of four temperate deciduous woody species. Funct. Ecol. 1997, 11, 518–531. [Google Scholar] [CrossRef]
  31. Niinemets; Valladares, F. Photosynthetic Acclimation to Simultaneous and Interacting Environmental Stresses Along Natural Light Gradients: Optimality and Constraints. Plant. Biol. 2004, 6, 254–268. [Google Scholar] [CrossRef]
  32. Valladares, F.; Niinemets, L. Shade Tolerance, a Key Plant Feature of Complex Nature and Consequences. Annu. Rev. Ecol. Evol. Syst. 2008, 39, 237–257. [Google Scholar] [CrossRef] [Green Version]
  33. Kardiman, R.; Ræbild, A. Relationship between stomatal density, size and speed of opening in Sumatran rainforest species. Tree Physiol. 2018, 18, 696–705. [Google Scholar] [CrossRef]
  34. Gay, A.; Hurd, R. The influence of light on stomatal density in the tomato. New Phytol. 1975, 75, 37–46. [Google Scholar] [CrossRef]
  35. Gregoriou, K.; Pontikis, K.; Vemmos, S. Effects of reduced irradiance on leaf morphology, photosynthetic capacity, and fruit yield in olive (Olea europaea L.). Photosynthetica 2007, 45, 172–181. [Google Scholar] [CrossRef]
  36. Ajmi, A.; Vázquez, S.; Morales, F.; Chaari, A.; El-Jendoubi, H.; Abadía, A.; Larbi, A. Prolonged artificial shade affects morphological, anatomical, biochemical and ecophysiological behavior of young olive trees (cv. Arbosana). Sci. Hortic. 2018, 241, 275–284. [Google Scholar] [CrossRef]
  37. Yang, F.; Huang, S.; Gao, R.; Liu, W.; Yong, T.; Wang, X.; Wu, X.; Yang, W. Growth of soybean seedlings in relay strip intercropping systems in relation to light quantity and red:Far-red ratio. Field Crop. Res. 2014, 155, 245–253. [Google Scholar] [CrossRef]
  38. Shafiq, I.; Hussain, S.; Raza, M.A.; Iqbal, N.; Asghar, M.A.; Raza, A.; Fan, Y.F.; Mumtaz, M.; Shoaib, M.; Ansar, M.; et al. Crop photosynthetic response to light quality and light intensity. J. Integr. Agric. 2021, 20, 4–23. [Google Scholar] [CrossRef]
  39. Ferrara, G.; Flore, J.A. Comparison between different methods for measuring transpiration in potted apple trees. Biol. Plant. 2003, 46, 41–47. [Google Scholar] [CrossRef]
  40. Gratani, L. Plant Phenotypic Plasticity in Response to Environmental Factors. Adv. Bot. 2014, 2014, 208747. [Google Scholar] [CrossRef] [Green Version]
  41. Evans, J.R.; Poorter, H. Photosynthetic acclimation of plants to growth irradiance: The relative importance of specific leaf area and nitrogen partitioning in maximizing carbon gain. Plant. Cell Environ. 2001, 24, 755–767. [Google Scholar] [CrossRef]
  42. Oguntunde, P.G.; van de Giesen, N. Crop growth and development effects on surface albedo for maize and cowpea fields in Ghana, West Africa. Int. J. Biometeorol. 2004, 49, 106–112. [Google Scholar] [CrossRef]
  43. Duursma, R.A.; Makela, A. Summary models for light interception and light-use efficiency of non-homogeneous canopies. Tree Physiol. 2007, 27, 859–870. [Google Scholar] [CrossRef]
  44. Bsaibes, A.; Courault, D.; Baret, F.; Weiss, M.; Olioso, A.; Jacob, F.; Hagolle, O.; Marloie, O.; Bertrand, N.; Desfond, V.; et al. Albedo and LAI estimates from FORMOSAT-2 data for crop monitoring. Remote Sens. Environ. 2009, 113, 716–729. [Google Scholar] [CrossRef]
  45. Ko, J.; Cho, J.; Choi, J.; Yoon, C.Y.; An, K.N.; Ban, J.O.; Kim, D.K. Simulation of Crop Yields Grown under Agro-Photovoltaic Panels: A Case Study in Chonnam Province, South Korea. Energies 2021, 14, 8463. [Google Scholar] [CrossRef]
  46. Cuppari, R.I.; Higgins, C.W.; Characklis, G.W. Agrivoltaics and weather risk: A diversification strategy for landowners. Appl. Energy 2021, 291, 116809. [Google Scholar] [CrossRef]
  47. Amaducci, S.; Potenza, E.; Colauzzi, M. Developments in agrivoltaics: Achieving synergies by combining plants with solar photovoltaic power systems. In Energy-Smart Farming: Efficiency, Renewable Energy and Sustainability; Ralph, E., Sims, H., Eds.; Burleigh Dodds Science Publishing: Cambridge, UK, 2022; pp. 231–262. [Google Scholar] [CrossRef]
  48. Remtec Energy Agrovoltaico. Available online: http://www.remtec.energy/en/agrovoltaico/ (accessed on 22 September 2022).
  49. Oliver, F.W.; Tansley, A.G. Methods of surveying vegetation on a large scale. New Phytologist. 1904, 3, 228–237. [Google Scholar] [CrossRef]
  50. Sementi RV Venturoli. Available online: https://www.rv-venturoli.com/p-IT.asp?c=4&id=78/Soia/Namaste (accessed on 22 September 2022).
  51. Gaspardo. Available online: https://www.maschio.com/en/web/international/pinta (accessed on 5 October 2022).
  52. Giannerini, G.; Genovesi, R. The water saving with Irriframe platform for thousands of Italian farms. J. Agric. Inform. 2015, 6, 49–55. [Google Scholar] [CrossRef] [Green Version]
  53. Li, Y.; He, N.; Hou, J.; Xu, L.; Liu, C.; Zhang, J.; Wang, Q.; Zhang, X.; Wu, X. Factors Influencing Leaf Chlorophyll Content in Natural Forests at the Biome Scale. Front. Ecol. Evol. 2018, 6, 64. [Google Scholar] [CrossRef] [Green Version]
  54. Wan, Y.; Zhang, Y.; Zhang, M.; Hong, A.; Yang, H.; Liu, Y. Shade effects on growth, photosynthesis and chlorophyll fluorescence parameters of three Paeonia species. PeerJ 2020, 8, e9316. [Google Scholar] [CrossRef]
  55. Muhidin; Syam’un, E.; Kaimuddin; Musa, Y.; Sadimantara, G.R.; Usman; Leomo, S.; Rakian, T.C. The effect of shade on chlorophyll and anthocyanin content of upland red rice. IOP Conf. Ser. Earth Environ. Sci. 2018, 122, 012030. [Google Scholar] [CrossRef]
  56. Fan, Y.; Chen, J.; Wang, Z.; Tan, T.; Li, S.; Li, J.; Wang, B.; Zhang, J.; Cheng, Y.; Wu, X.; et al. Soybean (Glycine max L. Merr.) seedlings response to shading: Leaf structure, photosynthesis and proteomic analysis. BMC Plant. Biol. 2019, 19, 34–46. [Google Scholar] [CrossRef]
  57. Reich, P.; Wright, I.; Cavender-Bares, J.; Craine, J.; Oleksyn, J.; Westoby, M.; Walters, M. The Evolution of Plant Functional Variation: Traits, Spectra, and Strategies. Int. J. Plant. Sci. 2003, 164, S143–S164. [Google Scholar] [CrossRef]
  58. Rozendaal, D.M.A.; Hurtado, V.H.; Poorter, L. Plasticity in leaf traits of 38 tropical tree species in response to light; relationships with light demand and adult stature. Funct. Ecol. 2006, 20, 207–216. [Google Scholar] [CrossRef]
  59. Feng, Y.; van Kleunen, M. Responses to shading of naturalized and non-naturalized exotic woody species. Ann. Bot. 2014, 114, 981–989. [Google Scholar] [CrossRef] [PubMed] [Green Version]
  60. Liu, Y.; Dawson, W.; Prati, D.; Haeuser, E.; Feng, Y.; van Kleunen, M. Does greater specific leaf area plasticity help plants to maintain a high performance when shaded? Ann. Bot. 2016, 118, 1329–1336. [Google Scholar] [CrossRef] [PubMed] [Green Version]
  61. Kenig, A.; Mishoe, J.W.; Boote, K.J.; Cook, P.W.; Reicosky, D.C.; Pettigrew, W.T.; Hodges, H.F. Development of Soybean Fresh and Dry Weight Relationships for Real Time Model Calibration. Agron. J. 1993, 85, 140–146. [Google Scholar] [CrossRef]
  62. Xinyou, Y.; Laar, H.H.; van Laar, H.H. Crop Systems Dynamics: An. Ecophysiological Simulation Model of Genotype-By-Environment Interactions; Wageningen Academic Publishers: Wageningen, The Netherlands, 2005. [Google Scholar]
  63. Wu, Y.; Chen, P.; Gong, W.; Gul, H.; Zhu, J.; Yang, F.; Wang, X.; Yong, T.; Liu, J.; Pu, T.; et al. Morphological and physiological variation of soybean seedlings in response to shade. Front. Plant. Sci. 2022, 13, 1015414. [Google Scholar] [CrossRef] [PubMed]
  64. Wu, Y.S.; Yang, F.; Gong, W.Z.; Ahmed, S.; Fan, Y.F.; Wu, X.L.; Yong, T.W.; Liu, W.G.; Shu, K.; Liu, J.; et al. Shade adaptive response and yield analysis of different soybean genotypes in relay intercropping systems. J. Integr. Agric. 2017, 16, 1331–1340. [Google Scholar] [CrossRef]
  65. Heuvelink, E. Evaluation of a Dynamic Simulation Model for Tomato Crop Growth and Development. Ann. Bot. 1999, 83, 413–422. [Google Scholar] [CrossRef] [Green Version]
  66. Breuer, L.; Eckhardt, K.; Frede, H.G. Plant parameter values for models in temperate climates. Ecol. Model. 2003, 169, 237–293. [Google Scholar] [CrossRef]
  67. Xu, R.; Dai, J.; Luo, W.; Yin, X.; Li, Y.; Tai, X.; Han, L.; Chen, Y.; Lin, L.; Li, G. A photothermal model of leaf area index for greenhouse crops. Agric. For. Meteorol. 2010, 150, 541–552. [Google Scholar] [CrossRef]
  68. Gong, W.Z.; Jiang, C.D.; Wu, Y.S.; Chen, H.H.; Liu, W.Y.; Yang, W.Y. Tolerance vs. avoidance: Two strategies of soybean (Glycine max) seedlings in response to shade in intercropping. Photosynthetica 2015, 53, 259–268. [Google Scholar] [CrossRef]
  69. Niinemets, L. A review of light interception in plant stands from leaf to canopy in different plant functional types and in species with varying shade tolerance. Ecol. Res. 2010, 25, 693–714. [Google Scholar] [CrossRef]
  70. Laub, M.; Pataczek, L.; Feuerbacher, A.; Zikeli, S.; Högy, P. Contrasting yield responses at varying levels of shade suggest different suitability of crops for dual land-use systems: A meta-analysis. Agron. Sustain. Dev. 2022, 42, 20210479141. [Google Scholar] [CrossRef]
  71. Yang, F.; Wang, X.C.; Liao, D.P.; Lu, F.Z.; Gao, R.C.; Liu, W.G.; Yong, T.W.; Wu, X.L.; Du, J.B.; Liu, J.; et al. Yield response to different planting geometries in maize-soybean relay strip intercropping systems. Agron. J. 2015, 107, 296–304. [Google Scholar] [CrossRef]
  72. Schou, J.B.; Jeffers, D.L.; Streeter, J.G. Effects of Reflectors, Black Boards, or Shades Applied at Different Stages of Plant Development on Yield of Soybeans. Crop. Sci. 1978, 18, 29–34. [Google Scholar] [CrossRef]
  73. Egli, D. Cultivar maturity and potential yield of soybean. Field Crop. Res. 1993, 32, 147–158. [Google Scholar] [CrossRef]
  74. Jiang, H.; Egli, D.B. Shade induced changes in flower and pod number and flower and fruit abscission in soybean. Agron. J. 1993, 85, 221–225. [Google Scholar] [CrossRef]
  75. Liu, B.; Liu, X.; Wang, C.; Li, Y.; Jin, J.; Herbert, S. Soybean yield and yield component distribution across the main axis in response to light enrichment and shading under different densities. Plant. Soil Environ. 2010, 56, 384–392. [Google Scholar] [CrossRef] [Green Version]
  76. Egli, D.B.; Bruening, W.P. Shade and Temporal Distribution of Pod Production and Pod Set in Soybean. Crop. Sci. 2005, 45, 1764–1769. [Google Scholar] [CrossRef]
  77. DIN SPEC 91434, Agri-Photovoltaic Systems—Requirements for Primary Agricultural Use. 2021. Available online: https://www.beuth.de/en/technical-rule/din-spec-91434/337886742 (accessed on 20 December 2021).
  78. Pang, K.; Van Sambeek, J.W.; Navarrete-Tindall, N.E.; Lin, C.H.; Jose, S.; Garrett, H.E. Responses of legumes and grasses to non-, moderate, and dense shade in Missouri, USA. I. Forage yield and its species-level plasticity. Agrofor. Syst. 2019, 93, 11–24. [Google Scholar] [CrossRef]
  79. Gholamhoseini, M.; Ebrahimian, E.; Habibzadeh, F.; Ataei, R.; Dezfulizadeh, M.S. Interactions of shading conditions and irrigation regimes on photosynthetic traits and seed yield of soybean (Glycine max L.). Legum Res. 2018, 41, 230–238. [Google Scholar] [CrossRef] [Green Version]
  80. Liu, X.; Rahman, T.; Song, C.; Su, B.; Yang, F.; Yong, T.; Wu, Y.; Zhang, C.; Yang, W. Changes in light environment, morphology, growth and yield of soybean in maize-soybean intercropping systems. Field Crop. Res. 2017, 200, 38–46. [Google Scholar] [CrossRef]
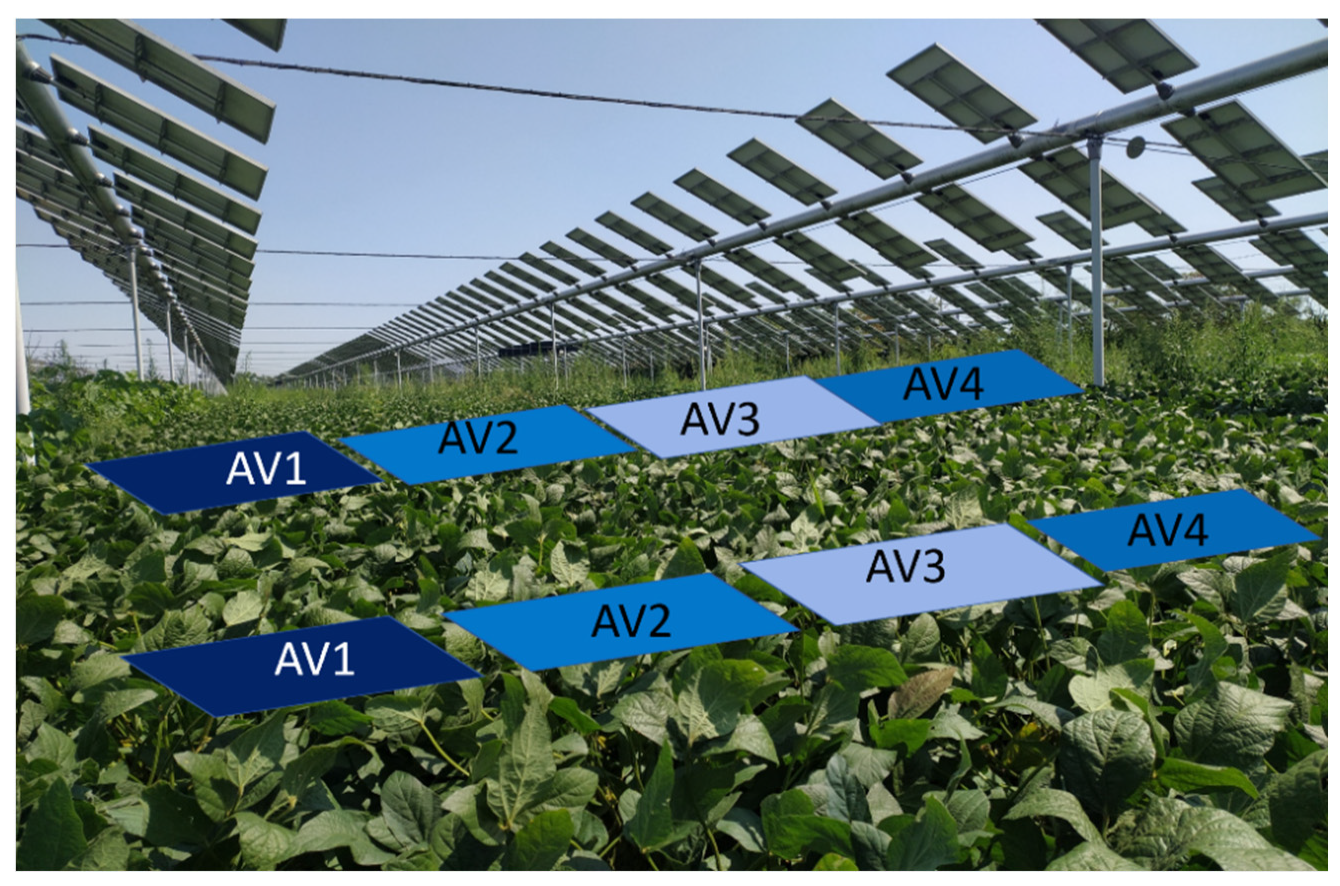
Figure 1. Experimental setup of the soybean trial in Monticelli D’Ongina (2021). Different colours represent the different shade depth (SD) levels, and the four SD levels are indicated as follows: AV1 = 27%, AV2 = 16%, AV3 = 9%, and AV4 = 18%.
Horticulturae 08 01160 g001
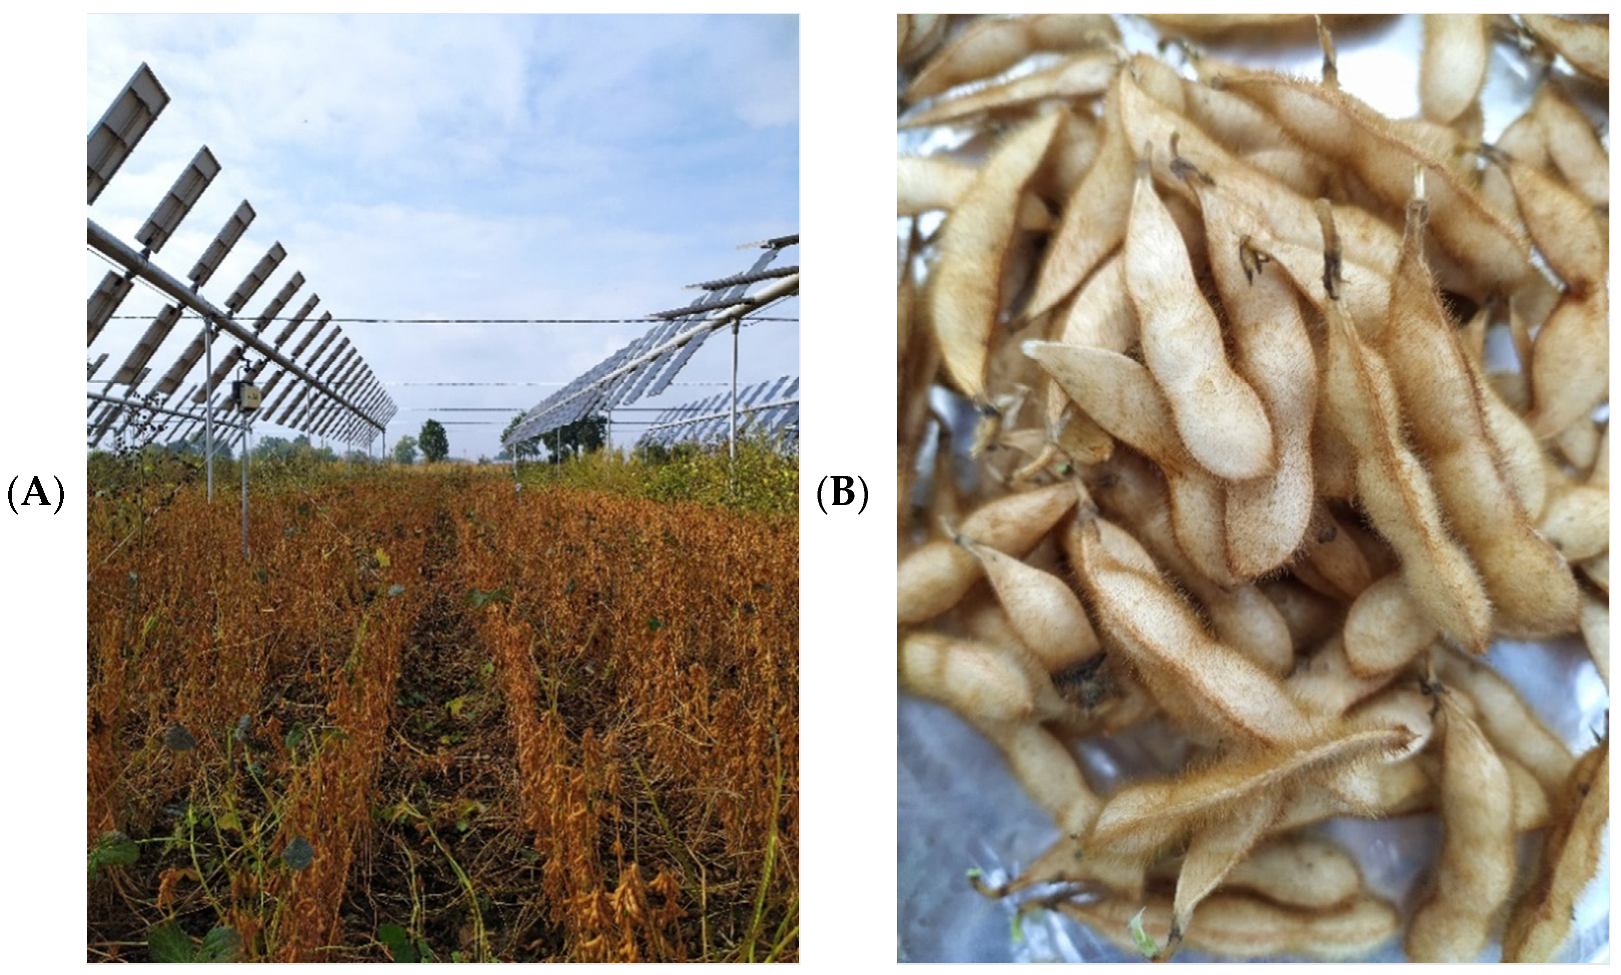
Figure 2. (A) Soybean plant on 27 September 2021 (harvest date) under AV system and (B) sample of soybean pods after the harvest, used to determine the pod number, the fresh and dry weight of the pods, and the grain yield.
Horticulturae 08 01160 g002
Figure 3. Mapped values of radiation reduction “Shade Depth (%)”. The vertical dotted lines represent crop rows, and the boxes represent the positioning and size of the plots.
Horticulturae 08 01160 g003
Figure 4. Physiological response of soybean in terms of crop height (cm). Different letters (a, b, c, bc) at the top of the graphs indicate statistically significant differences according to Tukey HSD test, treatments with the same letter are not significantly different.
Horticulturae 08 01160 g004
Figure 5. SPAD values for different shade depths. Different letters (a, b, ab) at the top of the plot indicate statistically significant differences according to Tukey HSD test, treatments with the same letter are not significantly different.
Horticulturae 08 01160 g005
Figure 6. Leaf area index (LAI, m2 m−2) value for different shade depths. Different letters (a, b, c, ab, bc) at the top of the plot indicate statistically significant differences according to Tukey HSD test, treatments with the same letter are not significantly different.
Horticulturae 08 01160 g006
Figure 7. Specific leaf area (SLA, cm2 g−1) for different shade depths. Different letters (a, b, ab)at the top of the graphs indicate statistically significant differences according to Tukey HSD test, treatments with the same letter are not significantly different.
Horticulturae 08 01160 g007
Figure 8. Effect of shading depth on soybean yield response in terms of number of pods m−2 (A) and grain yield per g m−2 (B). Data variability within treatment is indicated by the standard deviation bars ((A,B), see Tables S7 and S8 of Supplementary Materials).
Horticulturae 08 01160 g008
Figure 9. Scatterplots between observed and simulated grain yield (g m−2) per different shade depth treatments.
Horticulturae 08 01160 g009
Table 1. Root mean square error value (RMSE) and normalised RMSE (nRMSE) between simulated and observed grain yield (g m−2).
TRTSD (%)RMSEnRMSE
FL0%86.212.9%
AV127%96.315.7%
AV216%115.0016.5%
AV39%42.76.71%
AV418%16.62.82%
Publisher’s Note: MDPI stays neutral with regard to jurisdictional claims in published maps and institutional affiliations.