
A Quantitative Management of Potassium Supply for Hydroponic Production of Low-Potassium Cherry-Type Tomato Fruit for Chronic Kidney Disease Patients


Abstract
1. Introduction
2. Materials and Methods
2.1. Plant Materials and Culture
2.2. Treatment
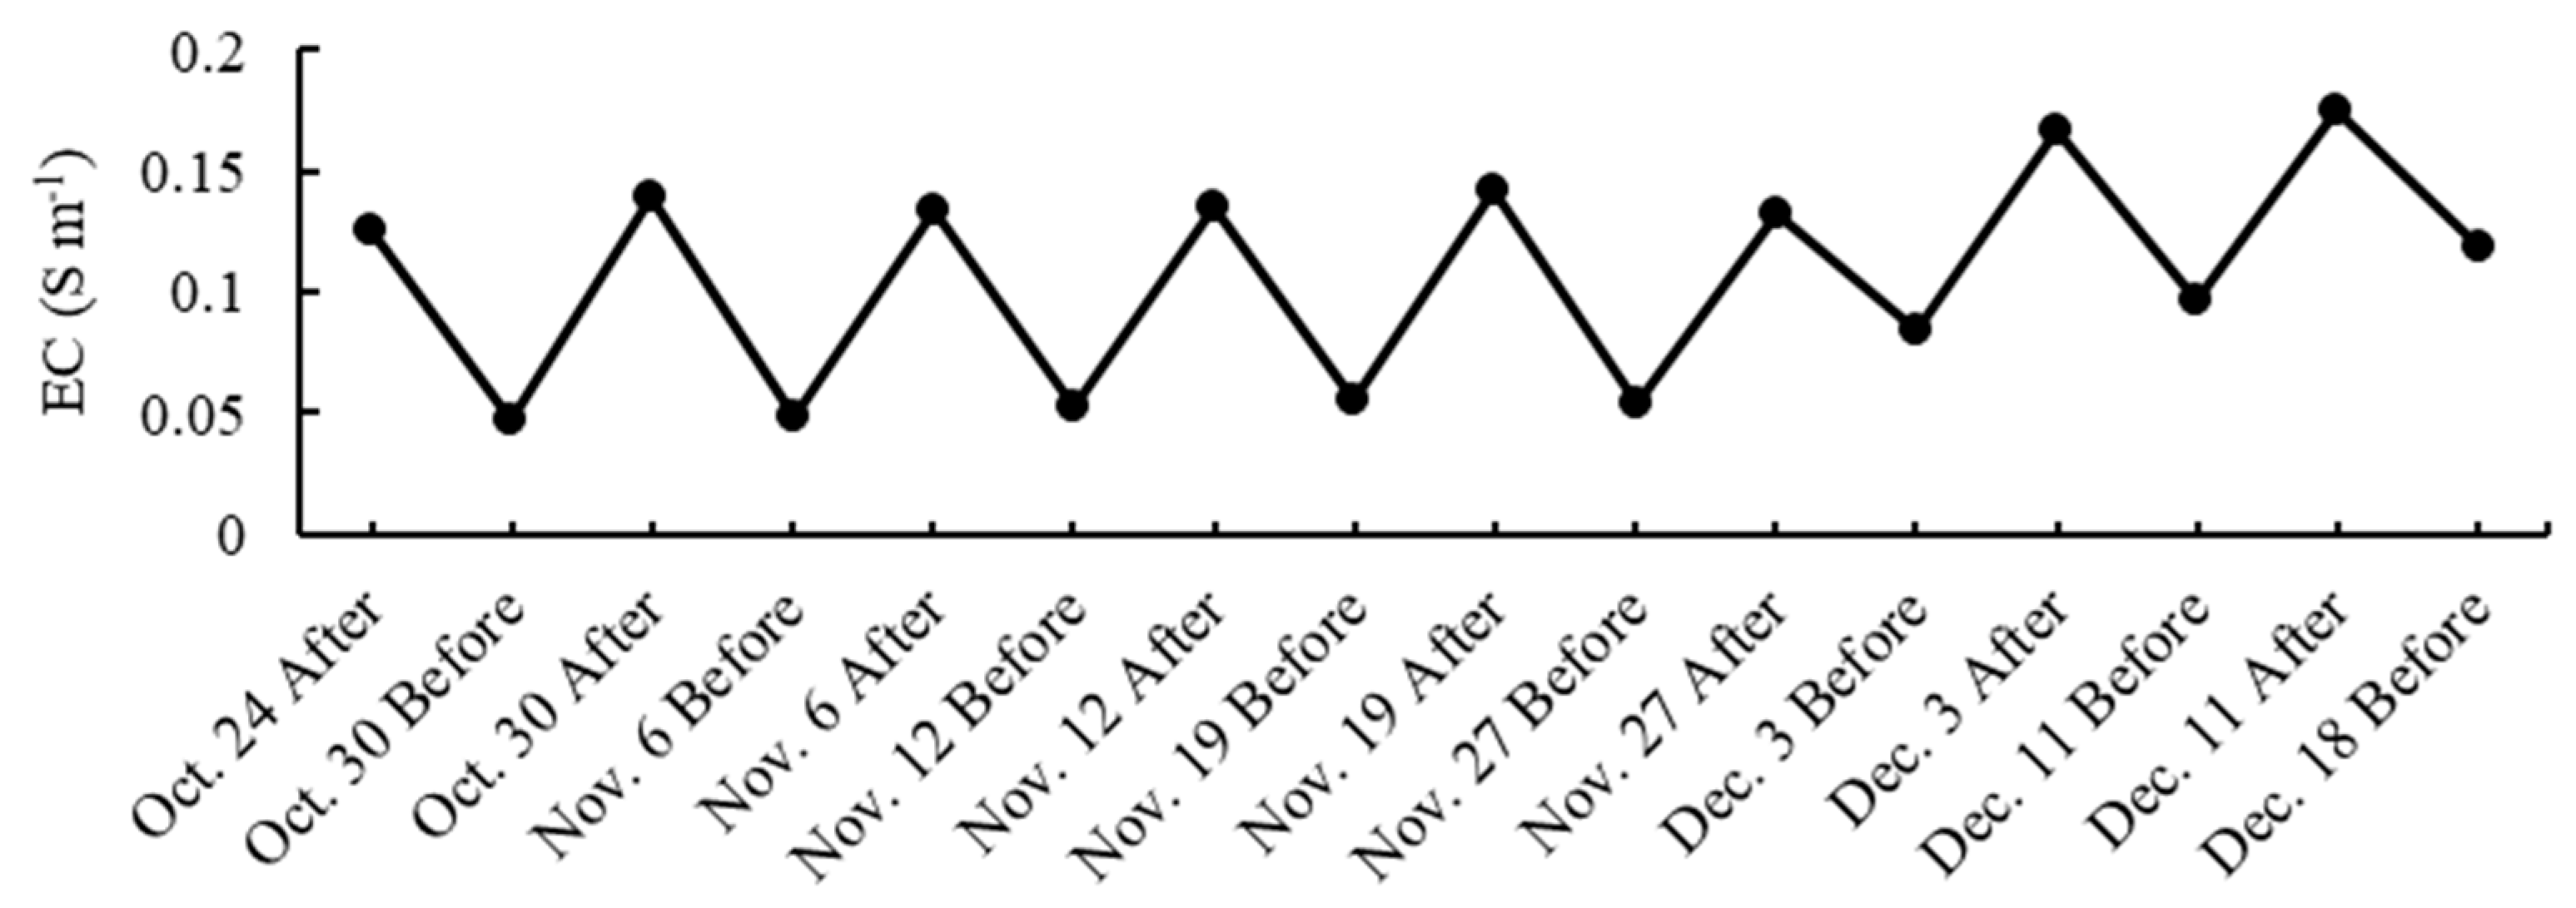
2.3. Measurements
2.4. Data Analysis
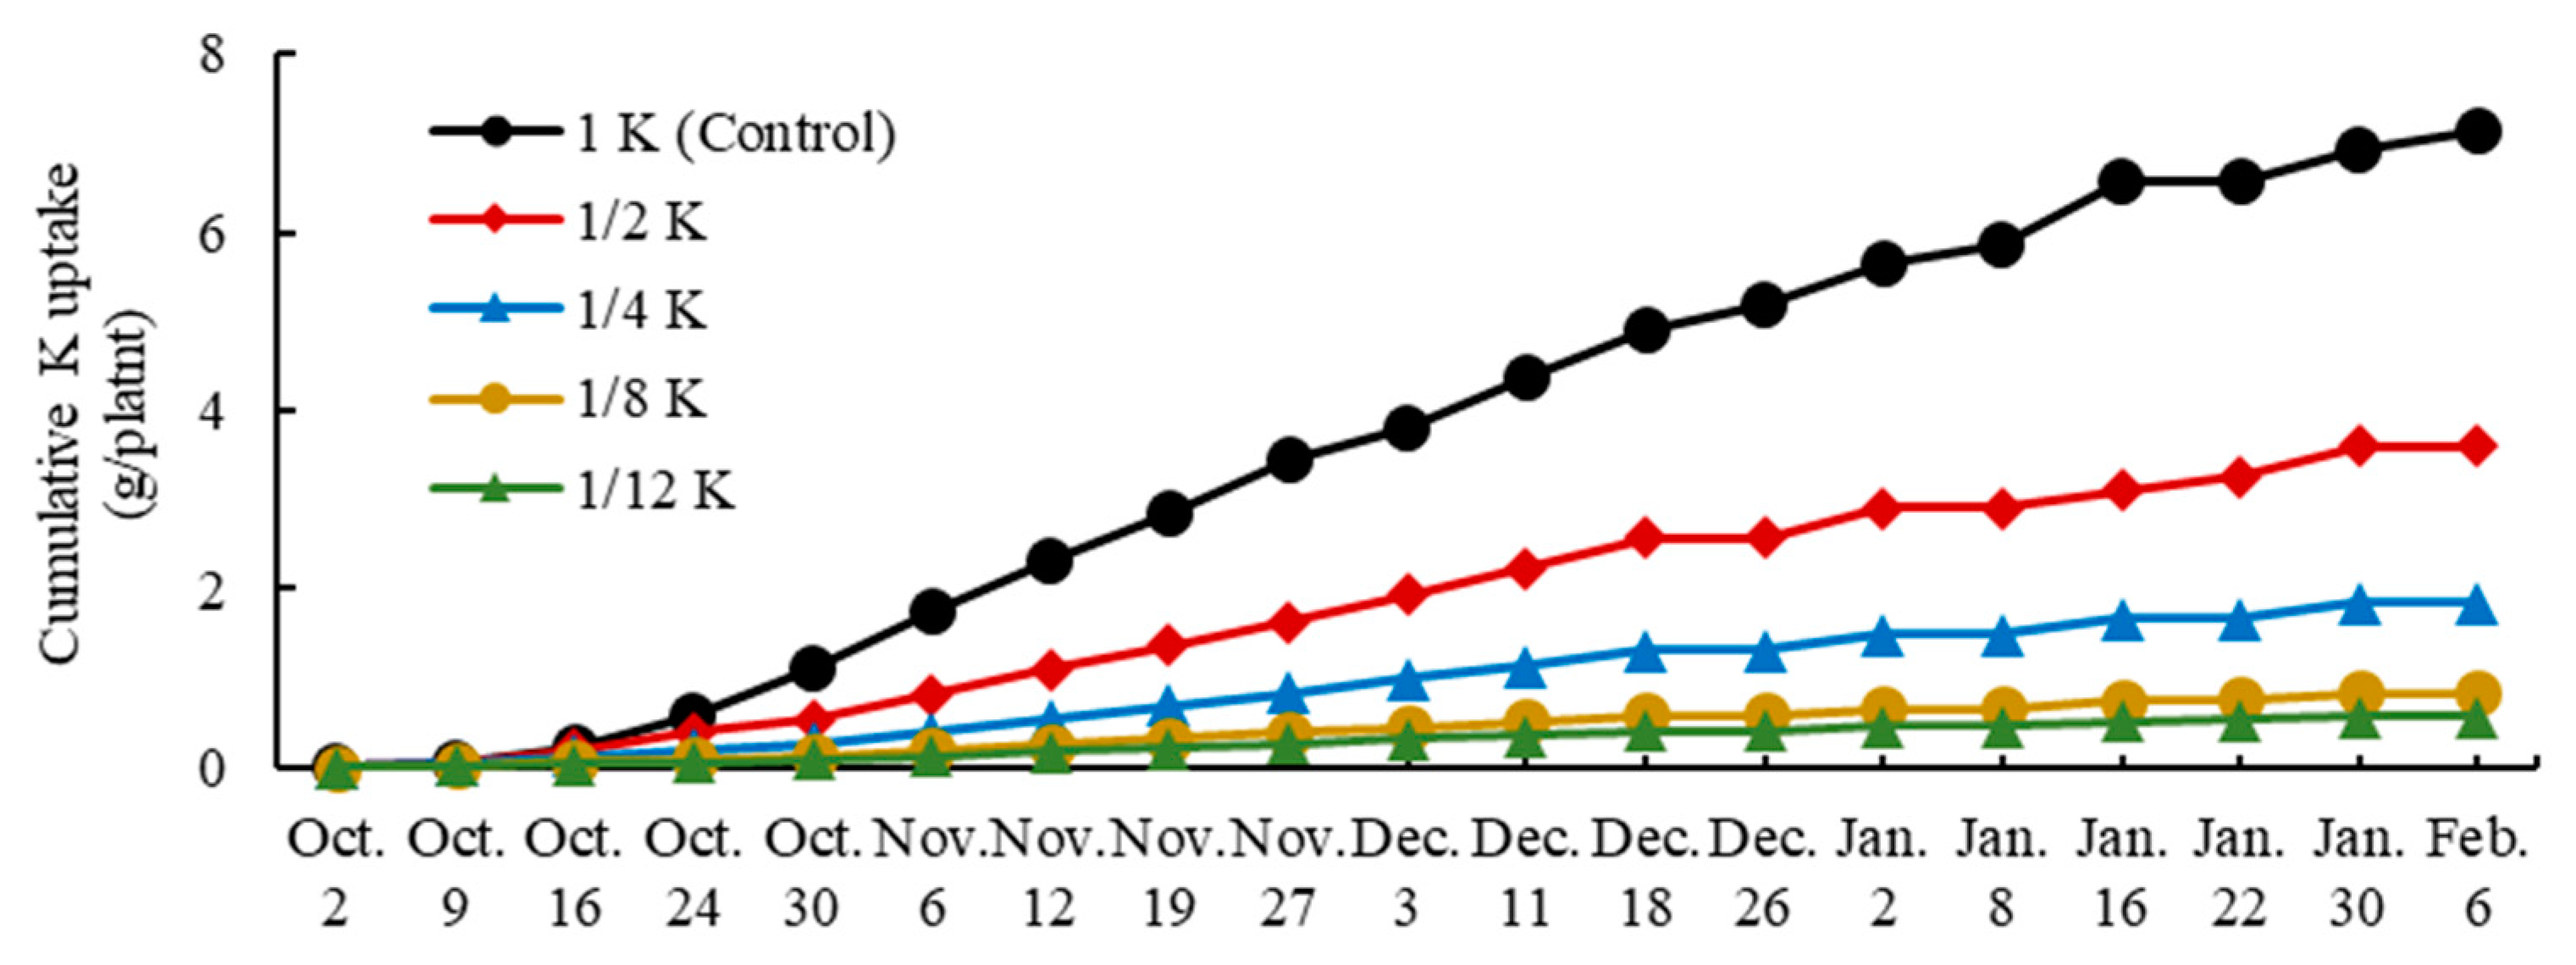
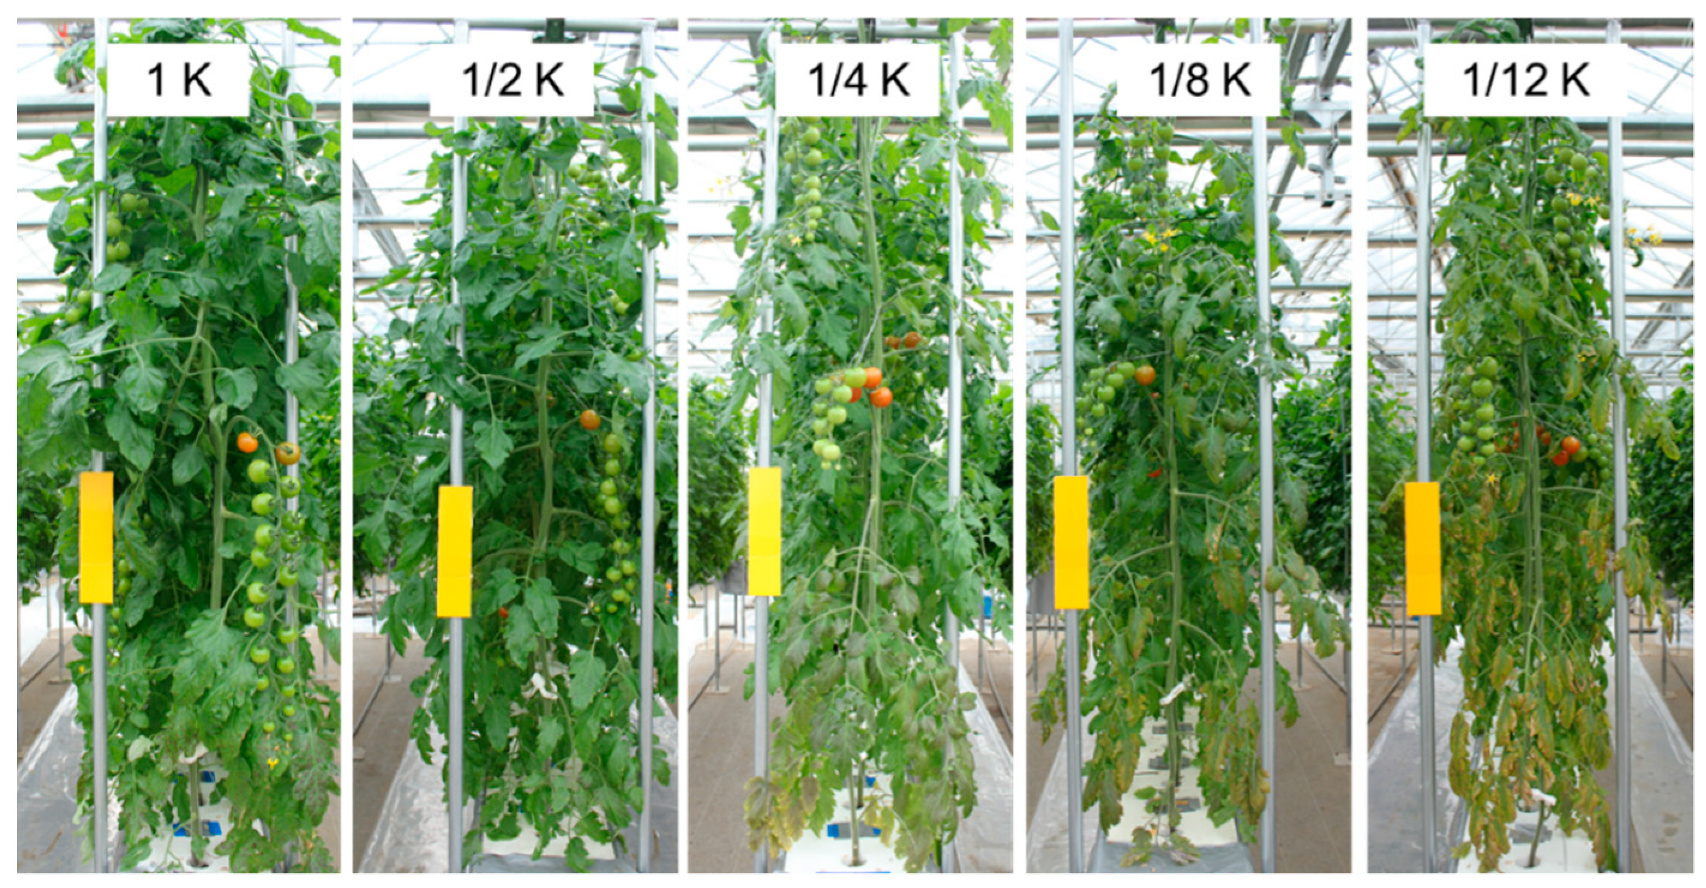
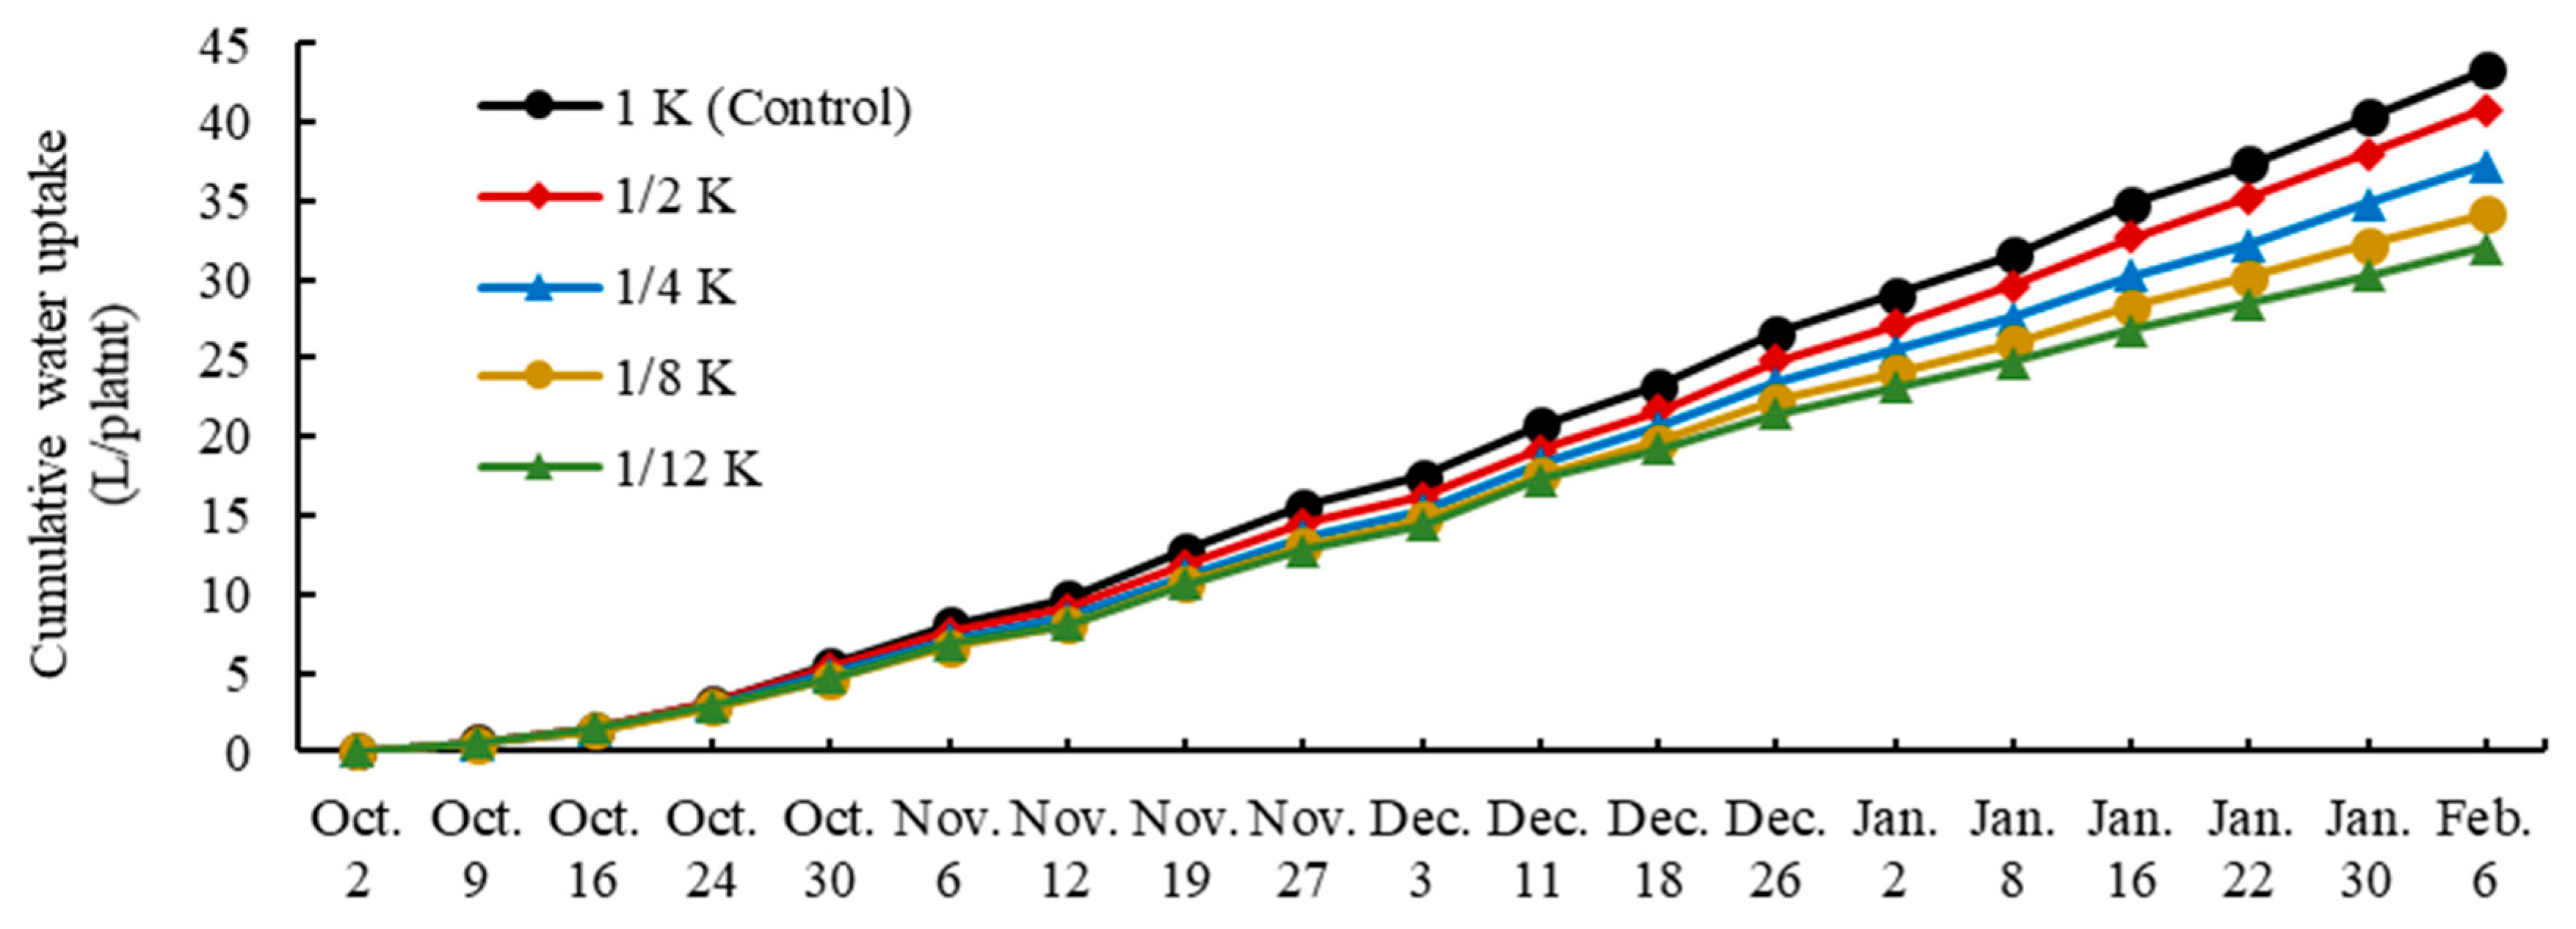
3. Results
4. Discussion
5. Conclusions
- Quantitative management can avoid the luxury absorption of K in hydroponic tomato production and precisely regulate the K supply to the plant.
- Fruit K content of approximately 100 mg 100 g−1 FW was achieved when the quantity of K supply was 1/4 K and 1/8 K.
- Total soluble solid content of fruit was not affected in 1/4 K, and decreased to 90% in 1/8 K, and acid content of fruit decreased to 70% in 1/4 K and 1/8 K.
- We could assume that the critical quantity of K supply was around 1/4 K (1.8 g K/plant with 2 truss) to achieve low-K tomato fruit production with normal quality.
- A combination of low node-order pinching and high-density planting system with quantitative K management is promising for the stable production of low K tomato.
- Further study to achieve all-year-round production of low-K tomato fruits should be necessary.
- This management method could apply to the other fruit vegetable production, such as low-K cucumber and low-K strawberry.
Author Contributions
Funding
Institutional Review Board Statement
Informed Consent Statement
Data Availability Statement
Conflicts of Interest
References
- Ikegami, F.; Wang, Y.; Kaneko, M.; Sumino, M.; Tsukagoshi, S. Human health sciences -from cultivation to utilization of medicinal plants. OJPM 2012, 2, 214–224. [Google Scholar] [CrossRef]
- GBD Chronic Kidney Disease Collaboration. Global, regional, and national burden of chronic kidney disease, 1990–2017: A systematic analysis for the global burden of disease study 2017. Lancet 2020, 395, 709–733. [Google Scholar] [CrossRef]
- GBD 2017 Disease and Injury Incidence and Prevalence Collaborators. Global, regional, and national incidence, prevalence, and years lived with disability for 354 diseases and injuries for 195 countries and territories, 1990–2017: A systematic analysis for the Global Burden of Disease Study 2017. Lancet 2018, 392, 1789–1858. [Google Scholar] [CrossRef]
- Choi, H.Y.; Ha, S.K. Potassium balances in maintenance hemodialysis. Electro. Blood Press. 2013, 11, 9–16. [Google Scholar] [CrossRef] [PubMed]
- Kes, P. Hyperkalemia: A potentially lethal clinical condition. Acta Clin. Croat. 2001, 40, 215–225. [Google Scholar]
- Putcha, N.; Allon, M. Management of hyperkalemia in dialysis patients. Semin. Dial. 2007, 20, 431–439. [Google Scholar] [CrossRef] [PubMed]
- Weiner, I.D.; Wingo, C.S. Hyperkalemia: A potential silent killer. J. Am. Soc. Nephrol. 1998, 9, 1535–1543. [Google Scholar]
- Committee for Revision of Diet Therapy Guideline. Dietary recommendations for chronic kidney disease 2007. Jpn. J. Nephro. 2007, 49, 871–878. (In Japanese) [Google Scholar]
- Tsukagoshi, S.; Shinohara, Y. Nutrition and Nutrient Uptake in Hydroponic System. In Plant Factory; An Indoor Vertical Farming System for Efficient Quality Food Production, 1st ed.; Kozai, T., Niu, G., Takagaki, M., Eds.; Academic Press: Cambridge, MA, USA, 2015; pp. 165–172. [Google Scholar]
- Tsukagoshi, S.; Yamori, W. Beneficial effects of various environmental stresses on vegetables and medicinal plants for the production of high value-added plants. In Handbook of Plant and Crop Stress, 4th ed.; Passarakli, M., Ed.; CRC Press: Boca Raton, FL, USA, 2019; pp. 909–917. [Google Scholar]
- Terabayashi, S.; Asaka, T.; Tomatsuri, A.; Date, S.; Fujime, Y. Effect of the limited supply of nitrate and phosphate on nutrient uptake and fruit production of tomato (Lycopersicon esculentum Mill.) in hydroponic culture. Hortic. Res. 2004, 3, 195–200, (In Japanese with English abstract). [Google Scholar] [CrossRef]
- Maruo, T.; Takagaki, M.; Shinohara, Y. Critical Nutrient Concentrations for Absorption of Some Vegetables. Acta Hortic. 2004, 44, 493–499. [Google Scholar] [CrossRef]
- Li, H.; Inokuchi, T.; Nagaoka, T.; Tamura, M.; Hamada, S.; Suzuki, S. NO3− requirement and the quantitative management method of nutrient solution based on NO3− supply in hydroponic culture of radish plants. J. Jpn. Soc. Hortic. Sci. 2014, 83, 44–51. [Google Scholar] [CrossRef]
- Nakano, Y.; Sasaki, H.; Nakano, A.; Suzuki, K.; Takaichi, M. Growth and yield of tomato plants as influenced by nutrient application rates with quantitative control in closed rockwool cultivation. J. Jpn. Soc. Hortic. Sci. 2010, 79, 47–55. [Google Scholar] [CrossRef]
- Kanai, S.; Ohkura, K.; Adu-Gyamfi, J.J.; Mohapatra, P.K.; Nguyen, N.T.; Saneoka, H.; Fujita, K. Depression of sink activity precedes the inhibition of biomass production in tomato plants subjected to potassium deficiency stress. J. Exp. Bot. 2007, 58, 2917–2928. [Google Scholar] [CrossRef]
- Gerardeaux, E.; Jordan-Meille, L.; Constantin, J.; Pllerin, S.; Dingkuhn, M. Changes in plant morphology and dry matter partitioning caused by potassium deficiency in Gossypium hirsutum (L.). Environ. Exp. Bot. 2010, 67, 451–459. [Google Scholar] [CrossRef]
- Matou, T. Physiological activity of potassium. In Textbook of Plant Nutrition and Fertilizer; Asakura Publishing Co., Ltd.: Tokyo, Japan, 2010; pp. 101–105. (In Japanese) [Google Scholar]
- Besford, R.T.; Maw, G.A. Effect of potassium nutrition on tomato plant growth and fruit development. Plant Soil 1975, 42, 395–412. [Google Scholar] [CrossRef]
- Asao, T.; Asaduzzaman, M.D.; Mondal, M.D.; Tokura, M.; Adachi, F.; Ueno, M.; Kawaguchi, M.; Yano, S.; Ban, T. Impact of reduced potassium nitrate concentrations in nutrient solution on the growth, yield and fruit quality of melon in hydroponics. Sci. Hortic. 2013, 164, 221–231. [Google Scholar] [CrossRef]
- Terry, N.; Ulrich, A. Effects of potassium deficiency on the photosynthesis and respiration of leaves of sugar beet. Plant Physiol. 1973, 51, 783–786. [Google Scholar] [CrossRef] [PubMed]
- Ogawa, A.; Taguchi, S.; Kawashima, C. A cultivation method of spinach with a low potassium content for patients on dialysis. Jpn. J. Crop Sci. 2007, 76, 232–237, (In Japanese with English abstract). [Google Scholar] [CrossRef]
- Ogawa, A.; Eguchi, T.; Toyofuku, K. Cultivation method for leafy vegetables and tomatoes with low potassium content for dialysis patients. Environ. Control Biol. 2012, 50, 407–414. [Google Scholar] [CrossRef]
- Xu, H.; Johkan, M.; Tsukagoshi, S.; Maruo, T. Effect of nutrient quantitative management on potassium and sodium concentration in low-potassium lettuce. Hortic. J. 2021, in press. [Google Scholar] [CrossRef]
- Tsukagoshi, S.; Hamano, E.; Hohjo, M.; Ikegami, F. Hydroponic production of low-potassium tomato fruit for dialysis patients. Int. J. Veg. Sci. 2016, 22, 451–460. [Google Scholar] [CrossRef]
- Miura, S. Cherry-type tomato cultivation using substrate. In Handbook of Practical Hydroponics; Seibundo Shinkosha Publishing Co., Ltd.: Tokyo, Japan, 2018; pp. 20–21. (In Japanese) [Google Scholar]
- Food Composition Database. Available online: https://fooddb.mext.go.jp/details/details.pl?ITEM_NO=6_06183_7 (accessed on 25 September 2020). (In Japanese)
- Bradley, D.B. Influence of K, Ca, and Mg application on acid content, composition, and yield of tomato fruit. J. Agric. Food Chem. 1962, 10, 450–452. [Google Scholar] [CrossRef]
- Sakiyama, R. Influence of potassium and calcium on acid content of tomato fruits in sand culture. J. Jpn. Soc. Hortic. Sci. 1966, 35, 260–368, (In Japanese with English abstract). [Google Scholar] [CrossRef]


| Treatment | Date and Growth Stage | ||
|---|---|---|---|
| Period 1: 2 October–30 October | Period 2: 30 October–11 December | Period 3: 11 December–6 February | |
| Before 1st Flower Anthesis | After 1st Flower Anthesis | After Green Mature of 1st Truss | |
| Quantity of K Supply (mg/Plant/Week) | |||
| 1 K (Control) | 300 | 600 | 300 |
| 1/2 K | 150 | 300 | 150 |
| 1/4 K | 75 | 150 | 75 |
| 1/8 K | 37.5 | 75 | 37.5 |
| 1/12 K | 25 | 50 | 25 |
| K Supply | Leaf (g/Plant) | Stem (g/Plant) |
|---|---|---|
| 1 K | 63.6 ± 1.6 1 a 2 | 41.1 ± 0.8 a |
| 1/2 K | 45.1 ± 3.6 b | 37.1 ± 0.4 b |
| 1/4 K | 35.9 ± 1.5 b | 28.5 ± 1.1 c |
| 1/8 K | 33.5 ± 3.3 b | 17.4 ± 0.5 d |
| 1/12 K | 33.9 ± 0.9 b | 14.6 ± 0.8 d |
| K Supply | Yield (g/Plant) | No. of Fruits (Fruits/Plant) | ||||
|---|---|---|---|---|---|---|
| 1st Truss | 2nd Truss | Total | 1st Truss | 2nd Truss | Total | |
| 1 K | 352.6 ± 22.0 2 a 3 | 313.1 ± 16.9 a | 665.7 ± 25.9 a | 20.8 ± 2.0 a | 17.5 ± 1.2 ns | 38.3 ± 1.6 a |
| 1/2 K | 285.4 ± 28.0 a | 229.5 ± 14.3 b | 502.6 ± 23.4 b | 16.0 ± 1.6 a | 12.7 ± 0.8 | 28.1 ± 0.9 b |
| 1/4 K | 267.8 ± 15.8 a | 241.6 ± 10.3 b | 509.5 ± 22.5 b | 16.0 ± 3.5 a | 15.2 ± 0.8 | 31.3 ± 1.6 b |
| 1/8 K | 168.0 ± 20.6 b | 264.0 ± 12.3 ab | 432.0 ± 21.3 bc | 10.9 ± 1.0 ab | 14.3 ± 0.8 | 25.1 ± 1.2 Bc |
| 1/12 K | 143.1 ± 19.7 b | 243.2 ± 12.1 b | 386.3 ± 16.4 c | 10.5 ± 0.8 b | 13.6 ± 0.4 | 24.1 ± 0.7 c |
| K Supply | 1st Truss | 2nd Truss | Total Average | ||
|---|---|---|---|---|---|
| 1st–3rd Fruit 1 | 7th–9th Fruit | 1st–3rd Fruit | 7th–9th Fruit | ||
| (mg 100 g−1 FW) | |||||
| 1 K | 164.3 ± 5.7 2 a 3 | 168.6 ± 6.7 a | 127.1 ± 6.8 a | 147.1 ± 3.6 a | 151.8 ± 4.2 a |
| 1/2 K | 167.1 ± 6.1 a | 140.0 ± 5.3 b | 128.6 ±5.1 a | 134.3 ± 3.7 a | 142.5 ± 3.7 a |
| 1/4 K | 114.3 ± 3.7 b | 105.1 ± 8.4 c | 96.1 ± 4.4 b | 115.0 ± 5.2 b | 107.6 ± 3.1 b |
| 1/8 K | 88.9 ± 4.7 c | 76.0 ± 3.3 d | 74.7 ± 4.2 c | 69.9 ± 2.4 c | 76.4 ± 2.0 c |
| 1/12 K | 77.4 ± 2.2 c | 46.6 ± 3.0 e | 63.4 ± 3.3 c | 54.7 ± 3.6 c | 60.5 ± 2.6 d |
| K Supply | 1st Truss | 2nd Truss | Total Average | ||
|---|---|---|---|---|---|
| 1st–3rd Fruit 1 | 7th–9th Fruit | 1st–3rd Fruit | 7th–9th Fruit | ||
| (Brix%) | |||||
| 1 K | 7.6 ± 0.2 2 a 3 | 6.9 ± 0.1 a | 7.5 ± 0.1 a | 7.8 ± 0.2 a | 7.4 ± 0.1 a |
| 1/2 K | 8.1 ± 0.2 a | 7.5 ± 0.4 a | 8.1 ± 0.3 a | 7.8 ± 0.4 a | 7.8 ± 0.2 a |
| 1/4 K | 7.7 ± 0.3 a | 7.9 ± 0.4 a | 7.4 ± 0.4 ab | 8.5 ± 0.6 a | 7.8 ± 0.2 a |
| 1/8 K | 6.9 ± 0.4 ab | 6.6 ± 0.3 ab | 6.8 ± 0.2 ab | 6.6 ± 0.4 ab | 6.7 ± 0.2 b |
| 1/12 K | 5.8 ± 0.4 b | 5.5 ± 0.3 b | 6.4 ± 0.3 b | 6.0 ± 0.3 b | 6.0 ± 0.2 c |
| K Supply | 1st Truss | 2nd Truss | Total Average | ||
|---|---|---|---|---|---|
| 1st–3rd Fruit 1 | 7th–9th Fruit | 1st–3rd Fruit | 7th–9th Fruit | ||
| (% 2) | |||||
| 1 K | 0.47 ± 0.01 3 a 4 | 0.49 ± 0.01 a | 0.47 ± 0.03 a | 0.45 ± 0.03 a | 0.47 ± 0.01 a |
| 1/2 K | 0.44 ± 0.01 ab | 0.46 ± 0.01 ab | 0.43 ± 0.03 ab | 0.33 ± 0.04 ab | 0.41 ± 0.02 ab |
| 1/4 K | 0.35 ± 0.03 abc | 0.34 ± 0.04 bc | 0.37 ± 0.04 ab | 0.30 ± 0.02 ab | 0.34 ± 0.02 bc |
| 1/8 K | 0.36 ± 0.02 bc | 0.37 ± 0.02 bc | 0.34 ± 0.02 ab | 0.26 ± 0.03 b | 0.33 ± 0.01 bc |
| 1/12 K | 0.27 ± 0.02 c | 0.28 ± 0.03 c | 0.29 ± 0.02 b | 0.22 ± 0.02 b | 0.27 ± 0.01 c |
Publisher’s Note: MDPI stays neutral with regard to jurisdictional claims in published maps and institutional affiliations. |
© 2021 by the authors. Licensee MDPI, Basel, Switzerland. This article is an open access article distributed under the terms and conditions of the Creative Commons Attribution (CC BY) license (https://creativecommons.org/licenses/by/4.0/).
Share and Cite
Tsukagoshi, S.; Aoki, M.; Johkan, M.; Hohjo, M.; Maruo, T. A Quantitative Management of Potassium Supply for Hydroponic Production of Low-Potassium Cherry-Type Tomato Fruit for Chronic Kidney Disease Patients. Horticulturae 2021, 7, 87. https://doi.org/10.3390/horticulturae7040087
Tsukagoshi S, Aoki M, Johkan M, Hohjo M, Maruo T. A Quantitative Management of Potassium Supply for Hydroponic Production of Low-Potassium Cherry-Type Tomato Fruit for Chronic Kidney Disease Patients. Horticulturae. 2021; 7(4):87. https://doi.org/10.3390/horticulturae7040087
Chicago/Turabian StyleTsukagoshi, Satoru, Miho Aoki, Masahumi Johkan, Masaaki Hohjo, and Toru Maruo. 2021. "A Quantitative Management of Potassium Supply for Hydroponic Production of Low-Potassium Cherry-Type Tomato Fruit for Chronic Kidney Disease Patients" Horticulturae 7, no. 4: 87. https://doi.org/10.3390/horticulturae7040087
APA StyleTsukagoshi, S., Aoki, M., Johkan, M., Hohjo, M., & Maruo, T. (2021). A Quantitative Management of Potassium Supply for Hydroponic Production of Low-Potassium Cherry-Type Tomato Fruit for Chronic Kidney Disease Patients. Horticulturae, 7(4), 87. https://doi.org/10.3390/horticulturae7040087