Article

Exogenous Application of Chitosan Alleviate Salinity Stress in Lettuce (Lactuca sativa L.)

1
Department of Agronomy and Horticulture, Jiangsu Vocational College of Agriculture and Forestry, Jurong 212400, China
2
Engineering and Technical Center for Modern Horticulture, Jiangsu Vocational College of Agriculture and Forestry, Jurong 212400, China
3
China Agriculture Press, Beijing 100125, China
*
Author to whom correspondence should be addressed.
These authors contributed equally to this work.
Horticulturae 2021, 7(10), 342; https://doi.org/10.3390/horticulturae7100342
Submission received: 24 August 2021 / Revised: 19 September 2021 / Accepted: 22 September 2021 / Published: 24 September 2021

Abstract

:
Soil salinity is one of the major factors that affect plant growth and decrease agricultural productivity worldwide. Chitosan (CTS) has been shown to promote plant growth and increase the abiotic stress tolerance of plants. However, it still remains unknown whether the application of exogenous CTS can mitigate the deleterious effects of salt stress on lettuce plants. Therefore, the current study investigated the effect of foliar application of exogenous CTS to lettuce plants grown under 100 mM NaCl saline conditions. The results showed that exogenous CTS increased the lettuce total leaf area, shoot fresh weight, and shoot and root dry weight, increased leaf chlorophyll a, proline, and soluble sugar contents, enhanced peroxidase and catalase activities, and alleviated membrane lipid peroxidation, in comparison with untreated plants, in response to salt stress. Furthermore, the application of exogenous CTS increased the accumulation of K+ in lettuce but showed no significant effect on the K+/Na+ ratio, as compared with that of plants treated with NaCl alone. These results suggested that exogenous CTS might mitigate the adverse effects of salt stress on plant growth and biomass by modulating the intracellular ion concentration, controlling osmotic adjustment, and increasing antioxidant enzymatic activity in lettuce leaves.

1. Introduction

Saline stress is a harmful form of abiotic stress that restricts the growth and function of plants and thus can cause a 10%–25% decrease in the yield of many agricultural crops [1]. More than 20% of global farmland is affected by various degrees of salinity, and the farmland area (approximately 20,000 km2 per year) affected by salinity is increasing each year, which severely limits agricultural productivity [2,3]. Salinity in soils can occur naturally or as a result of human activities. Weathering of rock minerals and flooding by seawater causes inherent soil salinity. Irrigation water with a high salt concentration, excessive chemical fertilization, and poor soil management are the main reasons for an increase in the area of saline–alkali land [4,5]. In some semi-arid and arid areas (e.g., Sahara in North Africa, Saudi Arabia, large parts of Iran and Iraq, parts of Asia, California in the USA, South Africa, and most of Australia), high temperatures and uneven distribution of rainfall result in higher evapotranspiration rates than the size of the leaching fraction, which causes an accumulation of soluble salts in the plough layer [6]. To increase the output of salinized agricultural land, the salt tolerance of plants must be increased and the conditions of saline–alkali land must be improved.
Salt stress negatively influences several processes in plant growth and production by causing ion toxicity, hyperosmotic stress, nutritional imbalance, oxidative damage, metabolic disorders, and photoinhibition [4,7]. Because of their sessile nature, plants must evolve several mechanisms to adapt to high-salinity environments. The various physiological and biochemical processes that plants use to adapt to salt stress can be grouped into three categories: Osmotic stress, ionic stress, and detoxification responses [8]. Plants’ primary response to salt stress is osmotic stress. Plants adjust their osmotic balance by accumulating organic and inorganic osmolytes, such as proline, glycine betaine, soluble sugar, soluble protein, and sodium (Na+) and potassium (K+) ions, to maintain cell turgor [2,9,10]. Na+ and chloride (Cl) enter the root system through nonselective cation channels, K+ transporters, and Cl transporters [11]. The excessive accumulation of Na+ and Cl in plant cells and tissues can adversely affect the growth and development of plants by disturbing the water structure, inhibiting enzymes, and creating nutritional imbalance [12,13]. Plants usually maintain a balanced cytosolic Na+/K+ ratio through Na+ and K+ transporters and channels [12]. Salt stress also causes the accumulation of reactive oxygen species (ROS), which results in oxidative-stress-induced toxic effects in plants. ROS sources, such as superoxide radical (O2), hydrogen peroxide (H2O2), and hydroxyl radical (·OH), are generated by plants’ photosynthetic and respiratory electron transport chains, xanthine oxidase, and nicotinamide adenine dinucleotide phosphate oxidase [14]. Normally, cellular ROS levels are regulated by enzymatic (e.g., ROS scavenging enzymes) and nonenzymatic scavengers (e.g., ascorbic acid [AsA], glutathione, and carotenoids) to mitigate the ROS-induced damage caused by salt stress [15,16]. However, although plants adopt these strategies to reduce the harmful effect of salt stress, survival in a salty environment is difficult, let alone producing a good yield.
Chitosan (poly[1,4]-2-amino-2-deoxy-D-glucose; CTS) is a biopolymer obtained through the deacetylation of nontoxic and biofunctional chitin from the exoskeleton of crustaceans [17]. Chitosan has three types of functional groups on its backbone: The amino/acetamido group, and primary and secondary hydroxyl groups, which enhance its affinity for ions and various pollutants [18]. CTS is a natural, low-toxicity, biodegradable, environmentally friendly, renewable, and inexpensive resource and has many applications in the agriculture sector [19]. Since the discovery of CTS by Rouget in 1859 [20], several studies have proven its role in enhancing plant growth and increasing plants’ abiotic stress tolerance [21], including rice [19], maize [22], safflower and sunflower [23], and creeping bentgrass [24]. The beneficial role of CTS in stress mitigation is broadly attributable to the alleviation of oxidative stress [25] and the increase in water use efficiency [26], mineral nutrient uptake [27], chlorophyll (Chl) content, and photosynthesis [28] caused by CTS. The application of exogenous CTS increases plants’ tolerance to several forms of stress, such as drought, salt, osmotic, and low-temperature stress [19,22,23,29]. Certain concentrations of exogenous CTS have been used to increase plants’ resistance to several biotic and abiotic stresses by increasing water use efficiency, enhancing antioxidant activity, and regulating the content of osmotic regulation substances and defense gene expression [17,26,30,31,32].
Lettuce (Lactuca sativa L.) is a leafy vegetable mainly consumed raw and in salad mixes [33]. The production and cultivation area of lettuce has increased because of its marketability, sensory characteristics, and health-promoting properties [5,34]. According to the last available FAO data (http://www.fao.org/faostat/en/#data/QC, accessed on 19 September 2021), the global cultivation area and yield of lettuce were 243.97 thousand hectares and 16.31 million tonnes in 2019, an increase of 0.54% and 2.3% over 2018, respectively. The majority of lettuce comes from China, the United States, and India—the world’s top three lettuce producers. Lettuce is a moderately to highly salt-sensitive vegetable [35]. Salinity reduces the seed germination rate, leaf number, photosynthesis, and cell growth and increases the accumulation of ROS, which negatively affects lettuce growth and yield [36,37]. Although the negative effects of salinity on lettuce have been studied [36,38], information regarding the effects of CTS on lettuce growth and production under saline conditions is lacking. Therefore, the present study evaluated the effectiveness of exogenous CTS in mitigating the adverse effects of salinity on the growth and physiological attributes of lettuce plants. In addition, this study identified the effects of exogenous CTS on the accumulation of osmolytes, the biosynthesis of antioxidants, and the activity of antioxidant enzymes in lettuce under saline conditions.

2. Materials and Methods

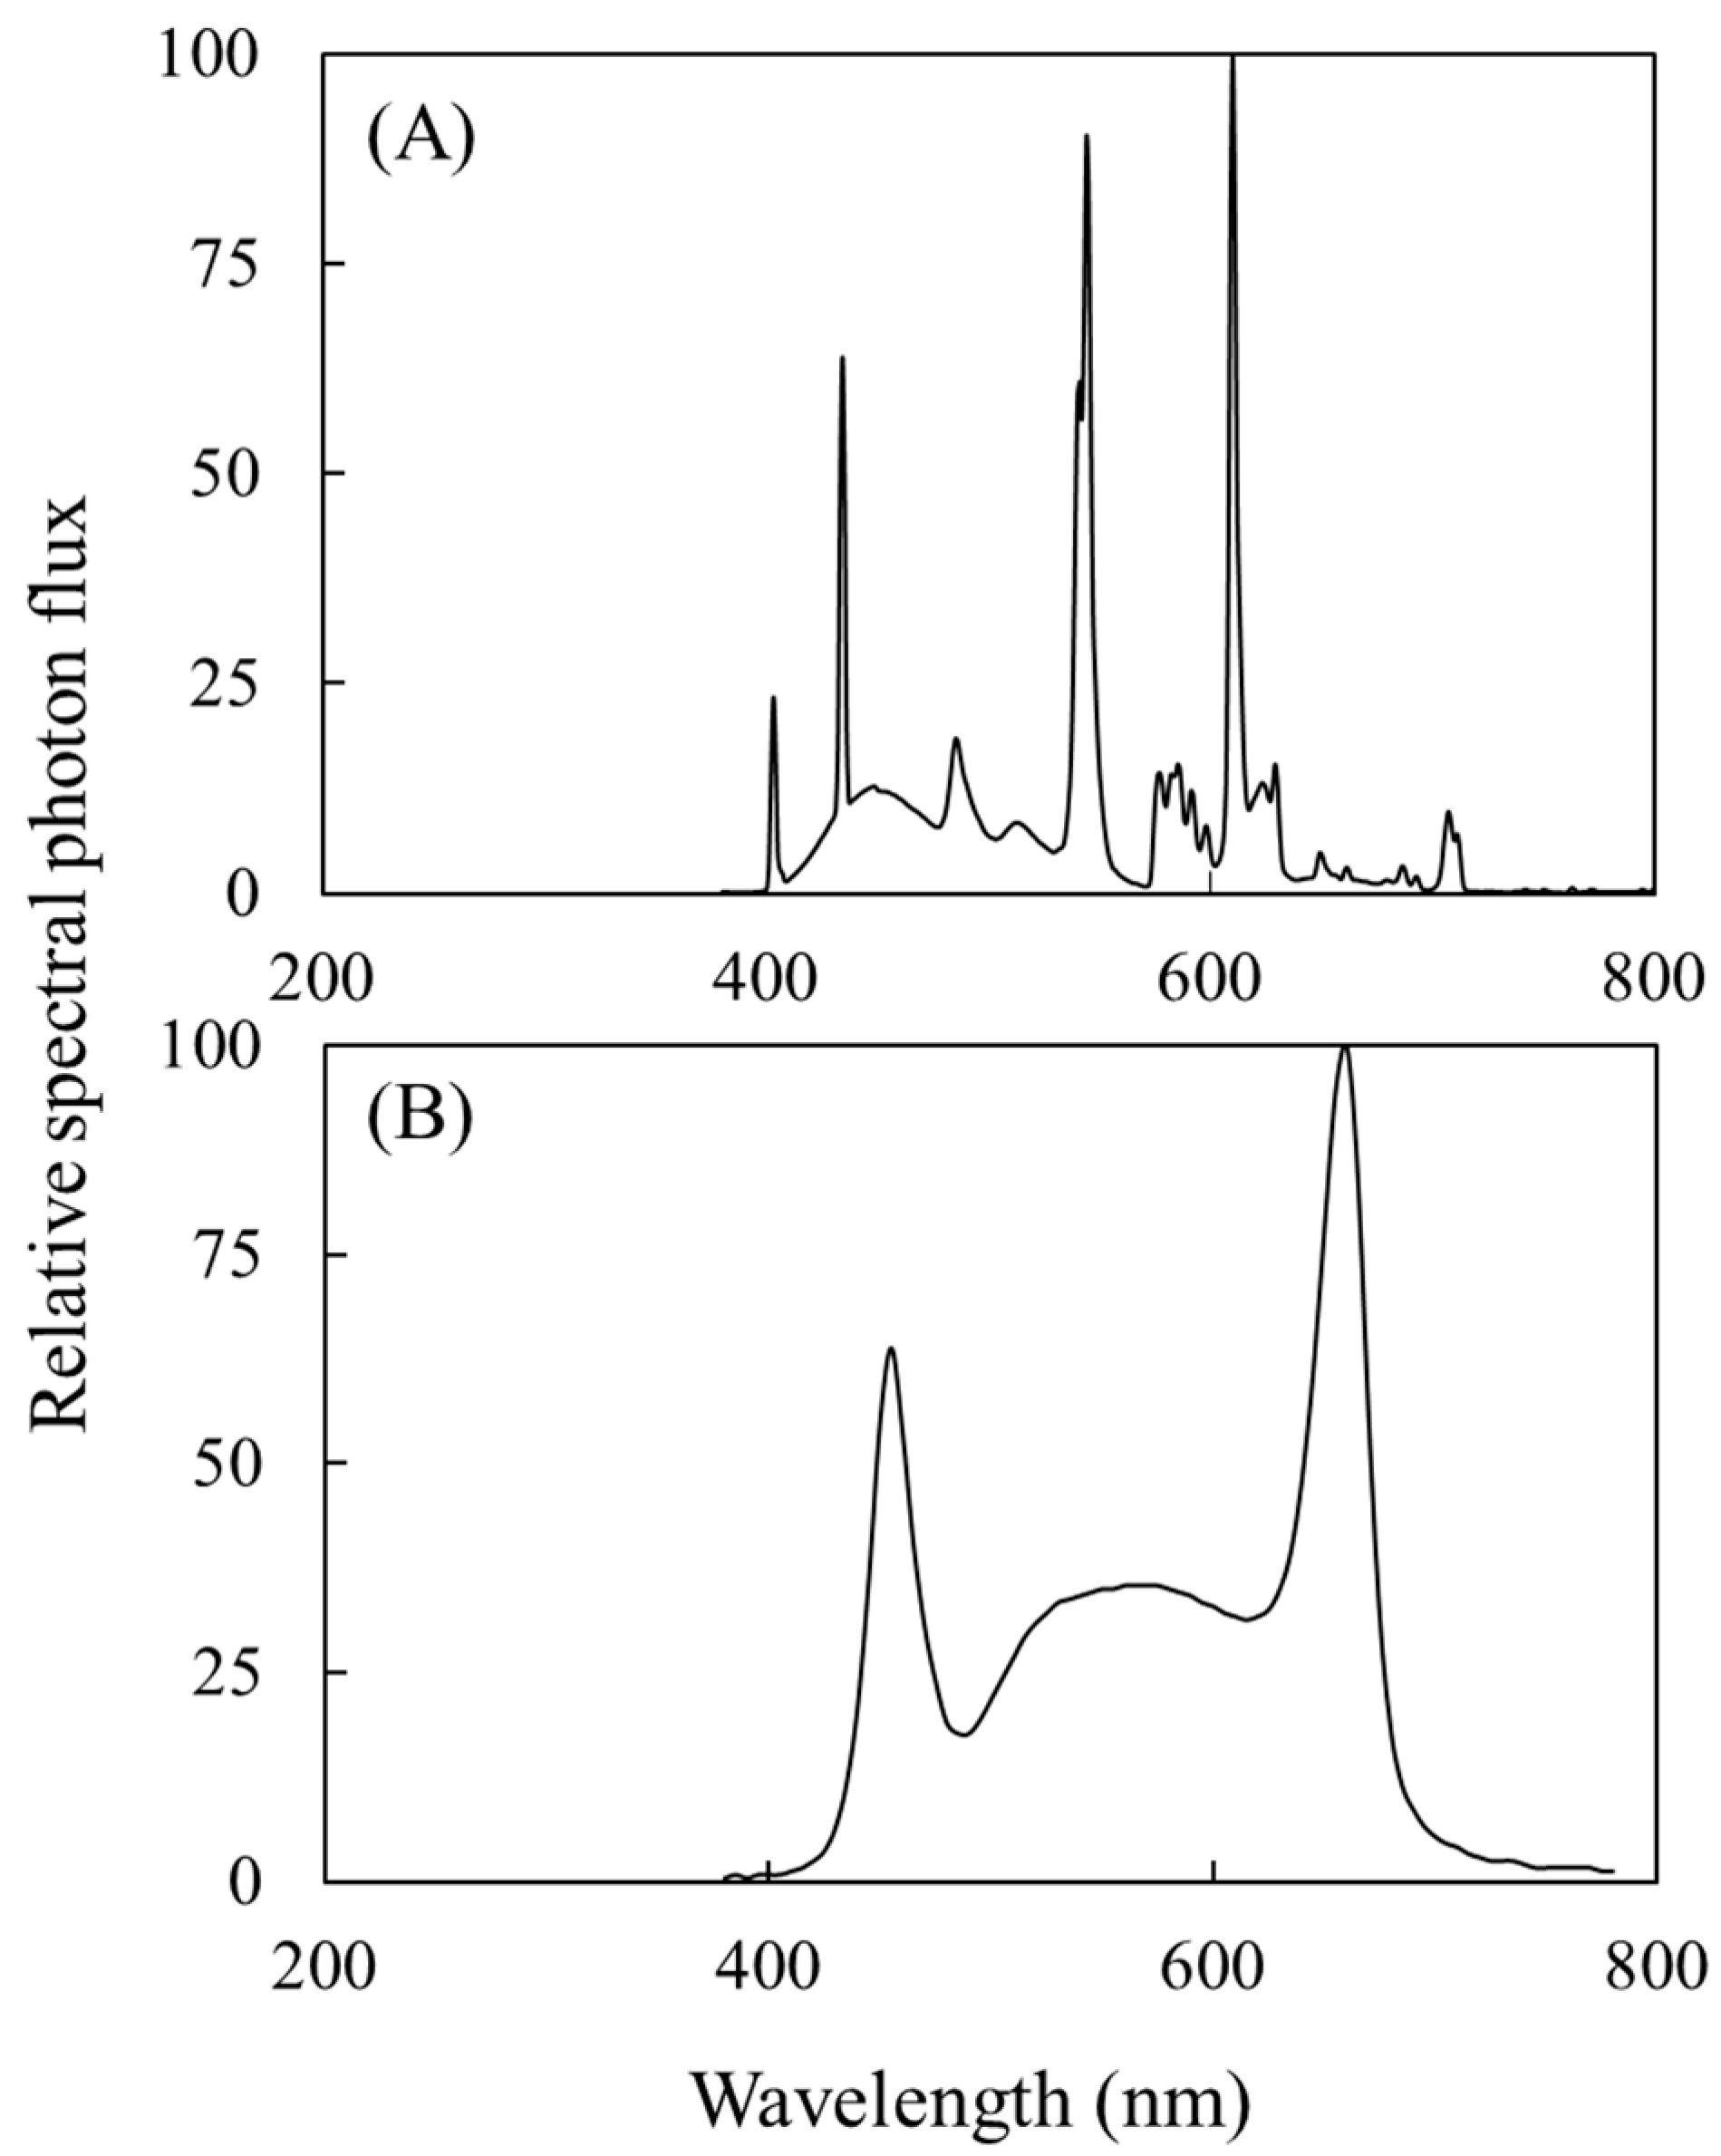
2.1. Plant Materials and Treatments

Romaine lettuce (Lactuca sativa var. longifolia L. cv. Romana, Takii seed, Japan) was used as the test material, and an experiment was conducted from November 2020 to January 2021. Lettuce seeds were sown in urethane cubes (2.3 × 2.3 × 2.7 cm3), and the seedlings were cultivated in a 22 °C growth chamber at 200 ± 10 µmol∙m−2∙s−1 photosynthetic photon flux for 12 h by using cool white fluorescent lamps (Figure 1A). At 21 days after sowing (DAS), uniform seedlings were selected and transplanted into a cultivation room of the Engineering and Technical Center for Modern Horticulture in Jurong. The plants were grown in a deep-flow hydroponic system in an Enshi formula nutrient solution (electrical conductivity [EC]: 1.5 ± 0.2, pH: 6.9 ± 0.2) [39]. Air pumps were used to oxygenate the nutrient solution and supply a constant stream of oxygen. The lighting for plant cultivation was provided by light-emitting diode lights (Figure 1B). The photosynthetic photon flux density of the light was 200 ± 10 µmol∙m−2∙s−1, and its photoperiod was 16 h. The air temperature was maintained as 25 °C during the day and 20 °C at night, with the relative humidity being maintained as 65% ± 5%.
All treatments were performed at 7 days after transplanting (28 DAS) into the cultivation room, so that the lettuce seedlings were well adapted to the environment of the cultivation room. The treatments were divided into four groups: (1) The control group, in which the plants were grown in a nutrient solution with water sprayed on the leaf surface; (2) the CTS group, in which the plants were grown under the same conditions as those of the control group and 100 mg/L of CTS (instead of water) was sprayed on the leaf surface; (3) the NaCl group, in which the plants were grown in a nutrient solution containing 100 mM NaCl and water was sprayed on the leaf surface; and (4) the NaCl + CTS group, in which the plants were grown under the same conditions as those of the NaCl group and 100 mg/L of CTS (instead of water) was sprayed on the leaf surface. CTS or water was sprayed on the leaves of the hydroponically grown lettuce continuously for 5 days from 28 DAS. Approximately 30 mL of CTS or water solution was sprayed on both adaxial and abaxial surfaces of leaves for each lettuce plant. For groups (3) and (4), NaCl was dissolved into the nutrient solution after the 5-day CTS induction treatment. Three replications were performed for each treatment, and each replication comprised six plants. Plants of each treatment were sampled at 28 and 49 DAS for further examinations.

2.2. Plant Growth Analysis

At 28 and 49 DAS, the plants were sampled to determine total leaf area, shoot and root fresh weight (FW), and shoot and root dry weight (DW). Total leaf area was determined using a Li-3100 leaf area meter (Li-Cor, Lincoln, NE, United States). Shoot and root DW was obtained after the plant tissues were dried at 80 °C to a constant weight. Chl was extracted in N,N-dimethylformamide from fresh lettuce leaves, and the Chl content was determined spectrophotometrically according to the method of Porra et al. [40].
Growth analysis parameters, namely the relative growth rate (RGR), the net assimilation rate (NAR), and the leaf area ratio (LAR), were estimated using the method of Ohtake et al. [41] by using the following equations:
RGR = (1/W)(ΔWt) = [ln(W2) − ln(W1)]/(t2t1),
where W1 and W2 are the total DWs of a plant at times t1 (28 DAS) and t2 (49 DAS).
NAR = (1/L)(ΔWt) = [(W2W1)/(t2t1)] × [ln(L2) − ln(L1)]/(L2L1),
where L1 and L2 are the total leaf areas of a plant at times t1 and t2.
LAR = L/W = (L1/W1 + L2/W2)/2

2.3. Estimation of Leaf Relative Water Content and Electrolyte Leakage

Relative water content (RWC) was measured using the method of Yamasaki and Dillenburg [42] by adopting the following equation:
RWC (%) = (FW − DW)/(turgid weight − DW) × 100
Electrolyte leakage (EL) was measured using the method described by Ahmad et al. [43]. Leaf disks with a diameter of 13 mm were produced from the leaves in each treatment group and submerged in deionized water to measure ECa. Then, tubes containing the leaf disks were incubated in a water bath at 50–60 °C for 25 min to determine the ECb value for each treatment. Finally, the tubes with the leaf disks were boiled at 100 °C for 10 min to measure ECc. The EL was calculated using the following equation:
EL (%) = (ECb − ECa)/ECc × 100

2.4. Determination of the Potassium and Sodium Contents in Lettuce Leaves

The potassium and sodium contents in lettuce leaves were determined through inductively coupled plasma optical emission spectrometry (Thermo Fisher Scientific, Cambridge, United Kingdom) by using the method of Zhang et al. [44].

2.5. Estimation of the Proline, Soluble Sugar, and Ascorbic Acid Contents

The proline content of the leaf samples was determined according to the method described by Bates et al. [45]. The soluble sugar content of the leaves was measured using the anthrone–sulfuric acid method [46]. The ascorbic acid (AsA) content of the leaves was determined according to the method of Kampfenkel et al. [47].

2.6. Examination of H2O2 Content, O2 Generation, and Malondialdehyde Content

The H2O2 concentration of the leaf samples was determined using the method of Patterson et al. [48]. The O2 generation was assayed spectrophotometrically by measuring the reduction of nitroblue tetrazolium by using the method of Averina et al. [49]. The malondialdehyde (MDA) concentration of the leaf samples was estimated using the method of Heath et al. [50]. The absorbance of the leaf samples was measured at 450, 532, and 600 nm by using a spectrophotometer.

2.7. Enzyme Assays

The fresh leaf samples were homogenized in phosphate buffer saline (50 mM, pH 7.8), and the homogenate was centrifuged at 10,000 × g and 4 °C for 15 min. The supernatants were collected to determine the superoxide dismutase (SOD; EC: 1.15.1.1), peroxidase (POD; EC: 1.11.1.7), and catalase (CAT; EC: 1.11.1.6) activity [51]. Protein content was determined using the method of Bradford [52]. The activity of the enzymes was expressed in units per milligram of protein.

2.8. Statistical Analysis

The data are presented as the means ± standard errors (SEs) of the three replications for each treatment. Statistical analysis was performed using one-way analysis of variance with Tukey’s HSD test (SPSS v. 18.0, IBM Inc., Chicago, IL, USA). p values of ≤0.05 were considered significant.

3. Results

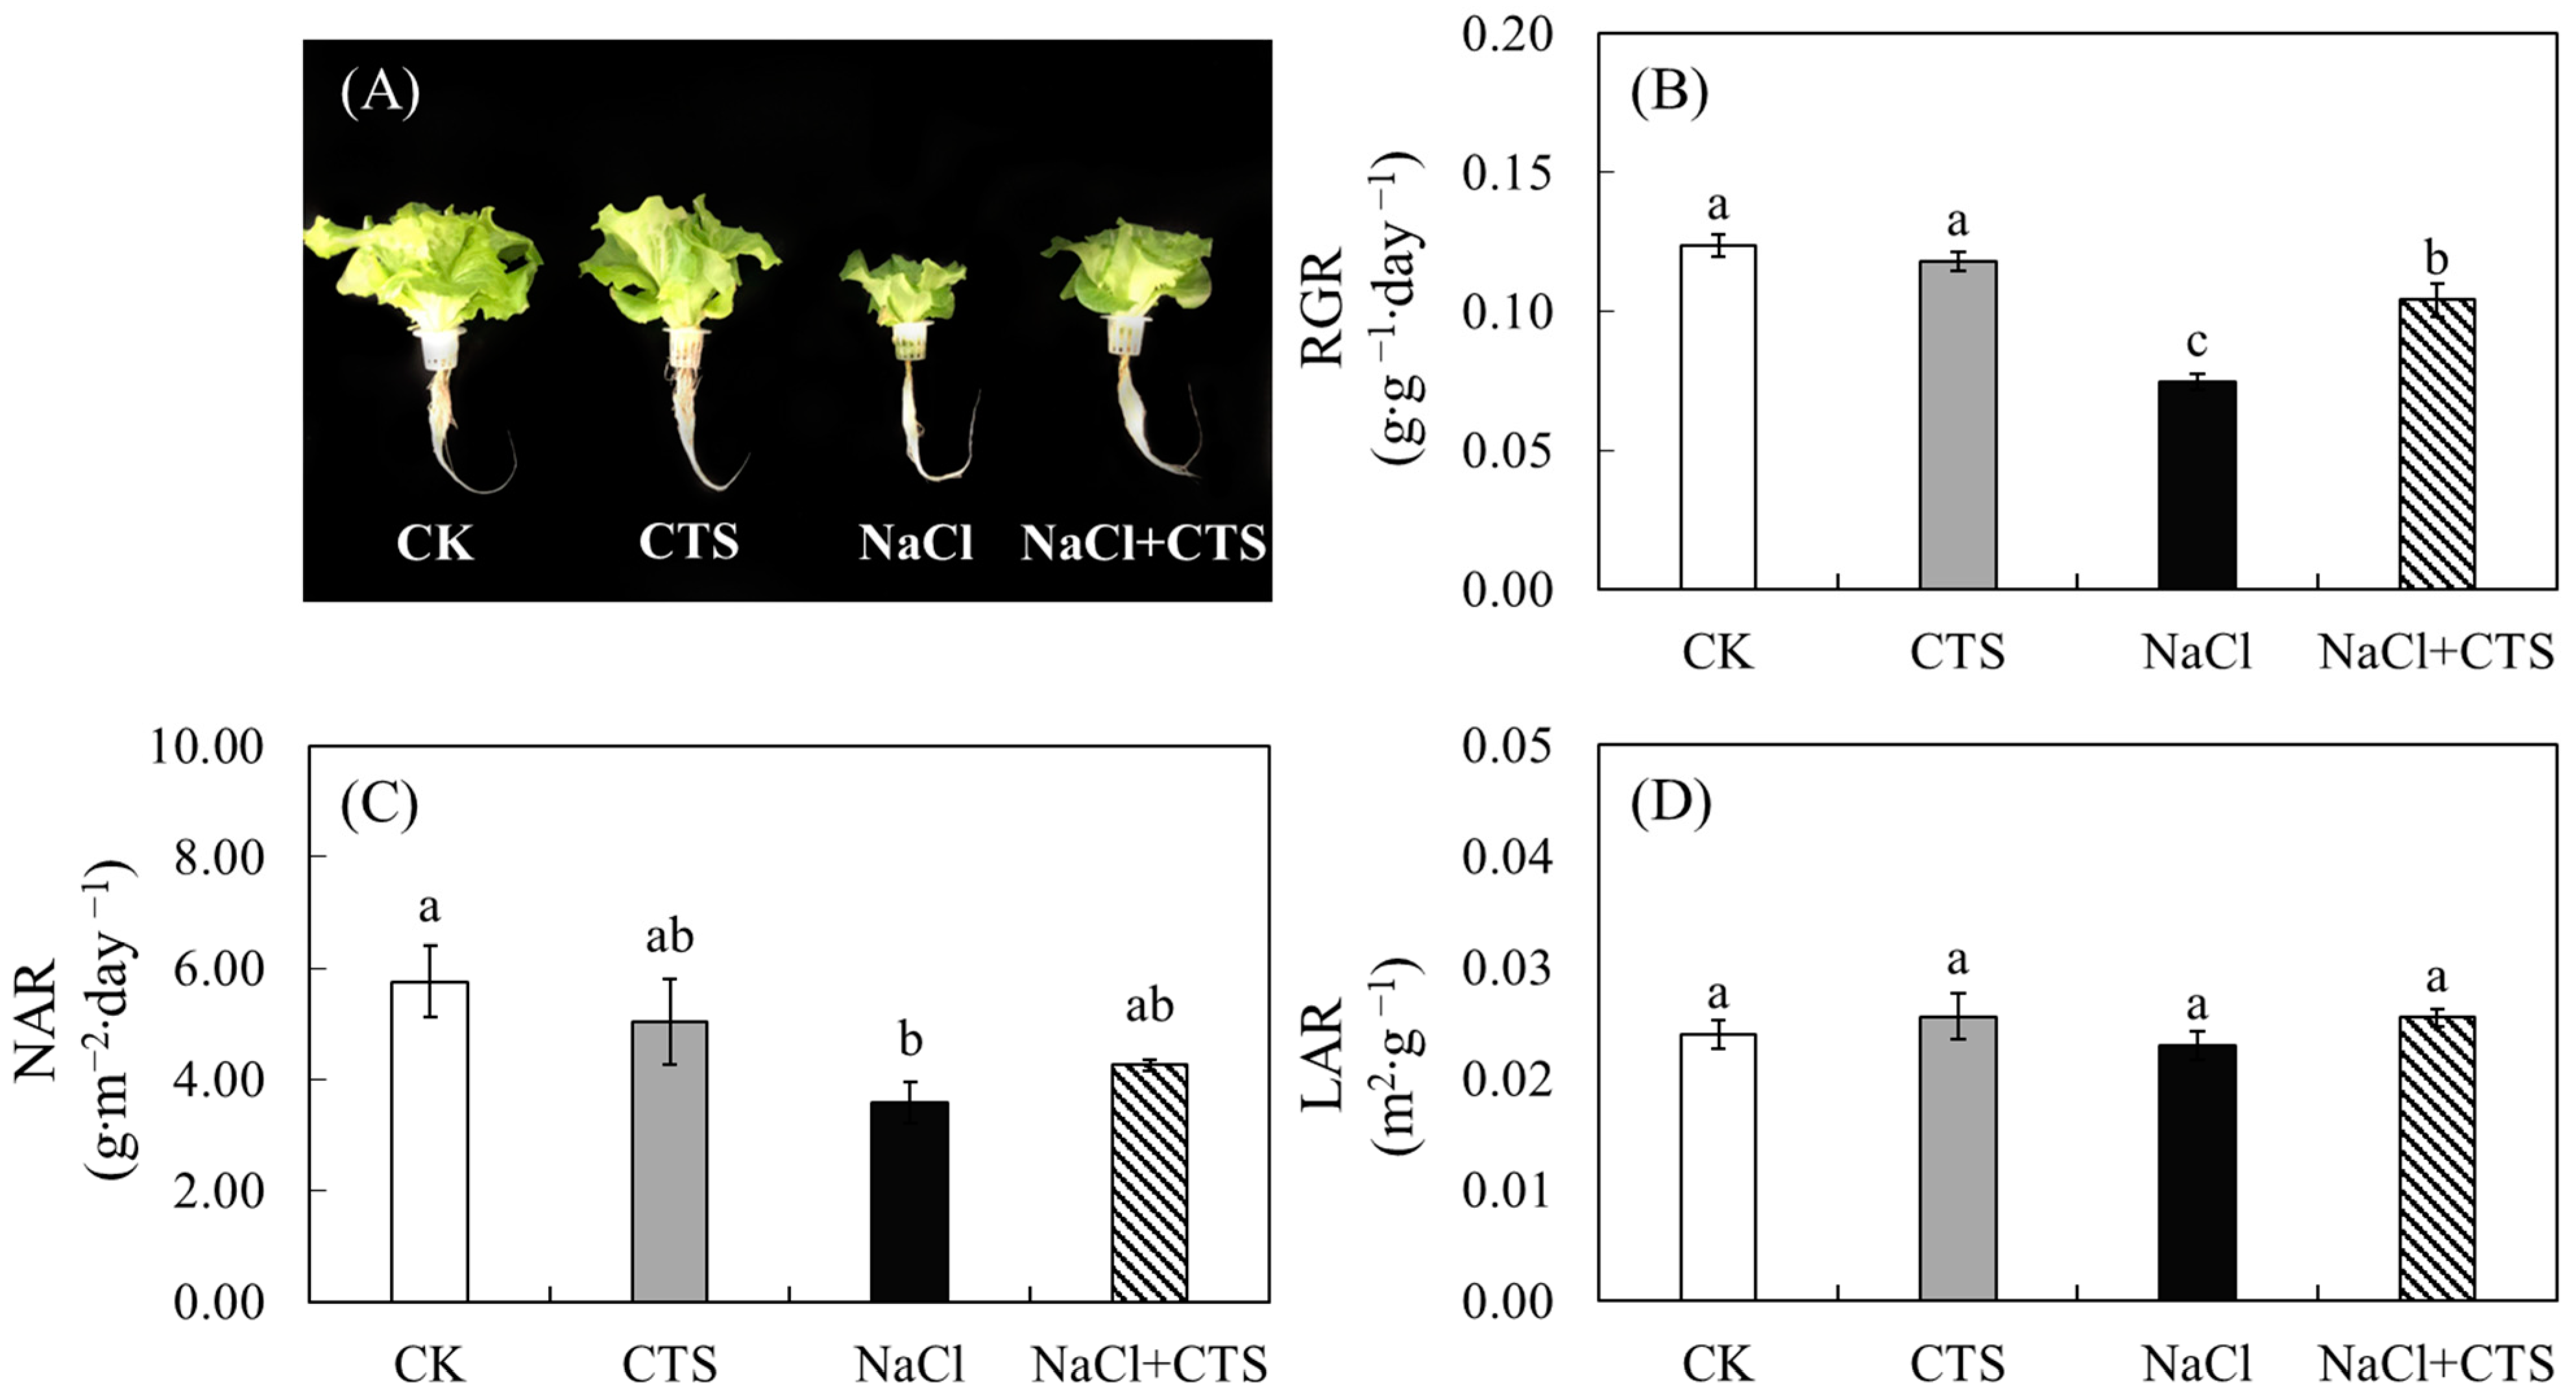
3.1. Exogenous CTS Improved the Growth and Biomass of Lettuce under NaCl Stress

Compared with the control plants, the lettuce plants exposed to NaCl stress exhibited considerably inhibited plant growth in terms of a lower total leaf area, shoot FW, and shoot DW (Table 1). The total leaf area, shoot FW, root FW, shoot DW, and root DW of the NaCl group were 67.3%, 60.3%, 73.8%, 66.5%, and 51.6% lower, respectively, than those of the control group (Table 1). The application of 100 mg/L of exogenous CTS mitigated the lettuce growth inhibition caused by the salinity stress (Figure 2A). The total leaf area, shoot FW, root FW, shoot DW, and root DW of the NaCl + CTS group were 141.2%, 127.3%, 72.3%, 95.0%, and 60.0% higher, respectively, than those of the NaCl group (Table 1). The total leaf area, shoot FW, root FW, shoot DW, and root DW of the NaCl + CTS group were 21.2%, 40.4%, 31.5%, 34.7%, and 22.6% lower, respectively, than those of the control group (Table 1). However, no significant change in the aforementioned growth parameters was observed between the CTS and control groups (Table 1). The Chl a, Chl b, and total Chl contents of the NaCl group were 14.4%, 20.6%, and 16.1% lower, respectively, than those of the control group (Table 1). The Chl a and total Chl contents of the NaCl + CTS group were 10.1% and 8.6% higher, respectively, than those of the NaCl group (Table 1). The Chl b and total Chl contents of the NaCl + CTS group were 17.3% and 8.9% lower, respectively, than those of the control group (Table 1). In addition, the Chl a content of the plants subjected to exogenous CTS treatment alone were significantly higher than that of the control group (Table 1).
Plant biomass is strongly and positively correlated to RGR, and plant growth analysis decomposes RGR into NAR and LAR. In order to determine how physiological and morphological traits contribute to the plant biomass of each group, the growth analysis parameters of each group were estimated using total plant DW and total leaf area as described in the aforementioned text. The RGR of the NaCl group was significantly lower than that of the control group and corresponded to the lowest DW (Figure 2B, Table 1). The decrease in the RGR of the NaCl group was mitigated by the application of 100 mg/L of exogenous CTS (Figure 2B). A similar trend was observed in NAR, and the lowest NAR was observed for the NaCl group. Moreover, an insignificant difference in NAR was observed between the NaCl + CTS and NaCl groups (Figure 2C). No significant difference in LAR was observed among all the groups (Figure 2D). Similar to the growth parameters, no significant changes in the aforementioned growth analysis parameters were observed between the CTS and control groups.

3.2. Effects of NaCl and CTS on the RWC, EL, and the Contents of Potassium and Sodium of the Lettuce Leaves

The leaf RWC of the NaCl group was 15.9% lower than that of the control group (Table 2). This decrease in leaf RWC due to salinity was mitigated by the application of exogenous CTS. The leaf RWC of the NaCl + CTS group was 15.7% higher than that of the NaCl group (Table 2). The leaf EL of the NaCl group was 160.9% higher than that of the control group (Table 2). Moreover, the leaf EL of the NaCl + CTS group was 21.2% lower than that of the NaCl group (Table 2). The leaf RWC and EL of the lettuce plants subjected to the exogenous CTS treatment alone were not significantly different from those of the control group (Table 2).
The potassium content of the NaCl group was 28.4% lower than that of the control group (Table 2). The addition of exogenous CTS to the plants treated with NaCl significantly mitigated the inhibition of potassium accumulation in the lettuce leaves (Table 2). The sodium contents of the NaCl and NaCl + CTS groups were 19.7 and 11.1 times higher, respectively, than that of the control group, whereas the accumulation of sodium was 46.0% lower in the NaCl + CTS group than in the NaCl group (Table 2). The K+/Na+ ratio of the NaCl group was significantly lower than that of the control group, and no significant change in the K+/Na+ ratio was observed between the NaCl and NaCl + CTS groups. Non-significant differences were noted in the potassium sodium contents and the K+/Na+ ratio between the CTS and control groups (Table 2).

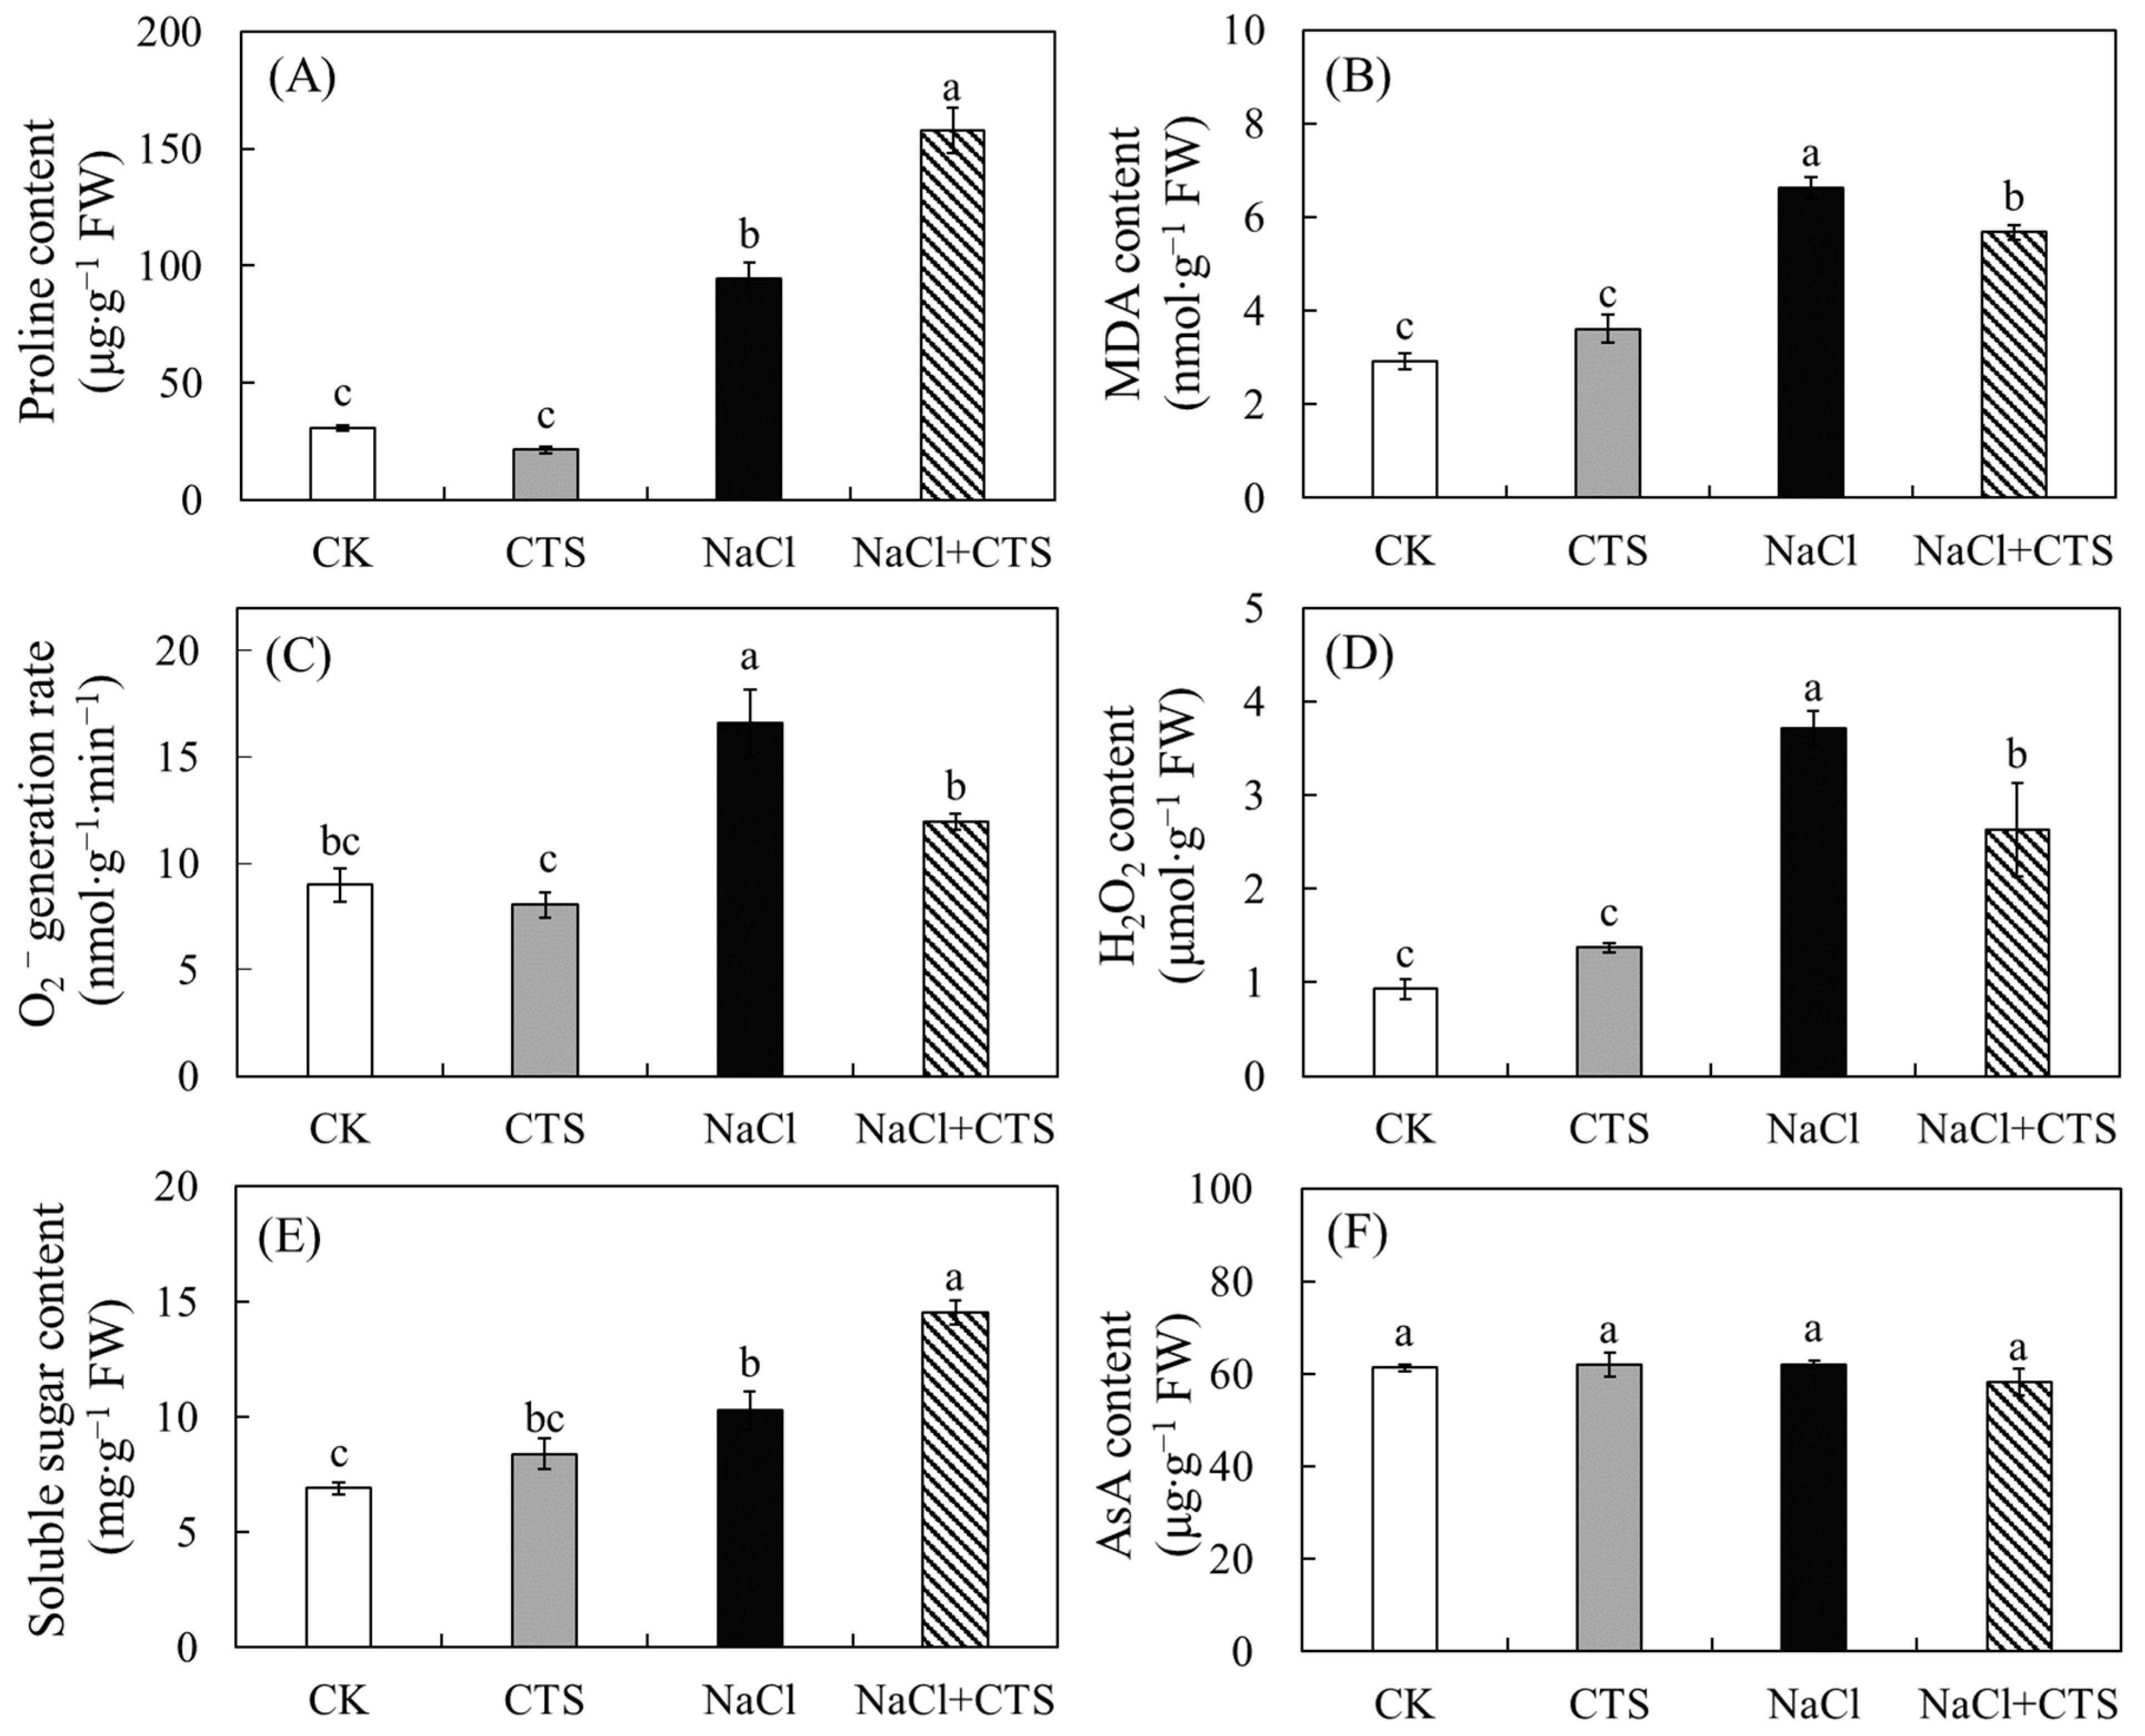
3.3. Effects of NaCl and CTS on the Proline Content, MDA Content, O2 Generation, H2O2 Content, Soluble Sugar Content, and AsA Content of the Lettuce Leaves

Proline biosynthesis was triggered by salinity stress, which resulted in the NaCl group having a proline content 2.1 times higher than the control group (Figure 3A). Moreover, the proline content of the NaCl + CTS group was 66.5% higher than that of the NaCl group (Figure 3A). MDA, the product of membrane lipid peroxidation caused by ROS, can be used to evaluate the degree of membrane injury under stress [44]. The MDA content of the NaCl group was 127.6% higher than that of the control group (Figure 3B). Moreover, the MDA content of the NaCl + CTS group was 14.3% lower than that of the NaCl group (Figure 3B). The exposure of the lettuce plants to salinity stress induced the production of ROS in cells. The lettuce plants treated with NaCl generated ROS such as H2O2 and O2. The H2O2 content and O2 of the NaCl group were 3 and 1.8 times higher than those of the control group, respectively (Figure 3C,D). The application of exogenous CTS to the plants treated with NaCl slowed the generation of H2O2 and O2 (Figure 3C,D). The soluble sugar content of the NaCl group was considerably higher than that of the control group (Figure 3E). The soluble sugar content of the NaCl + CTS group was 40.8% higher than that of the NaCl group (Figure 3E). No significant difference in AsA content was observed among the groups (Figure 3F). No significant change in the proline content, MDA content, H2O2 content, superoxide radical production rate, soluble sugar content, and AsA content was observed between the CTS and control groups (Figure 3).

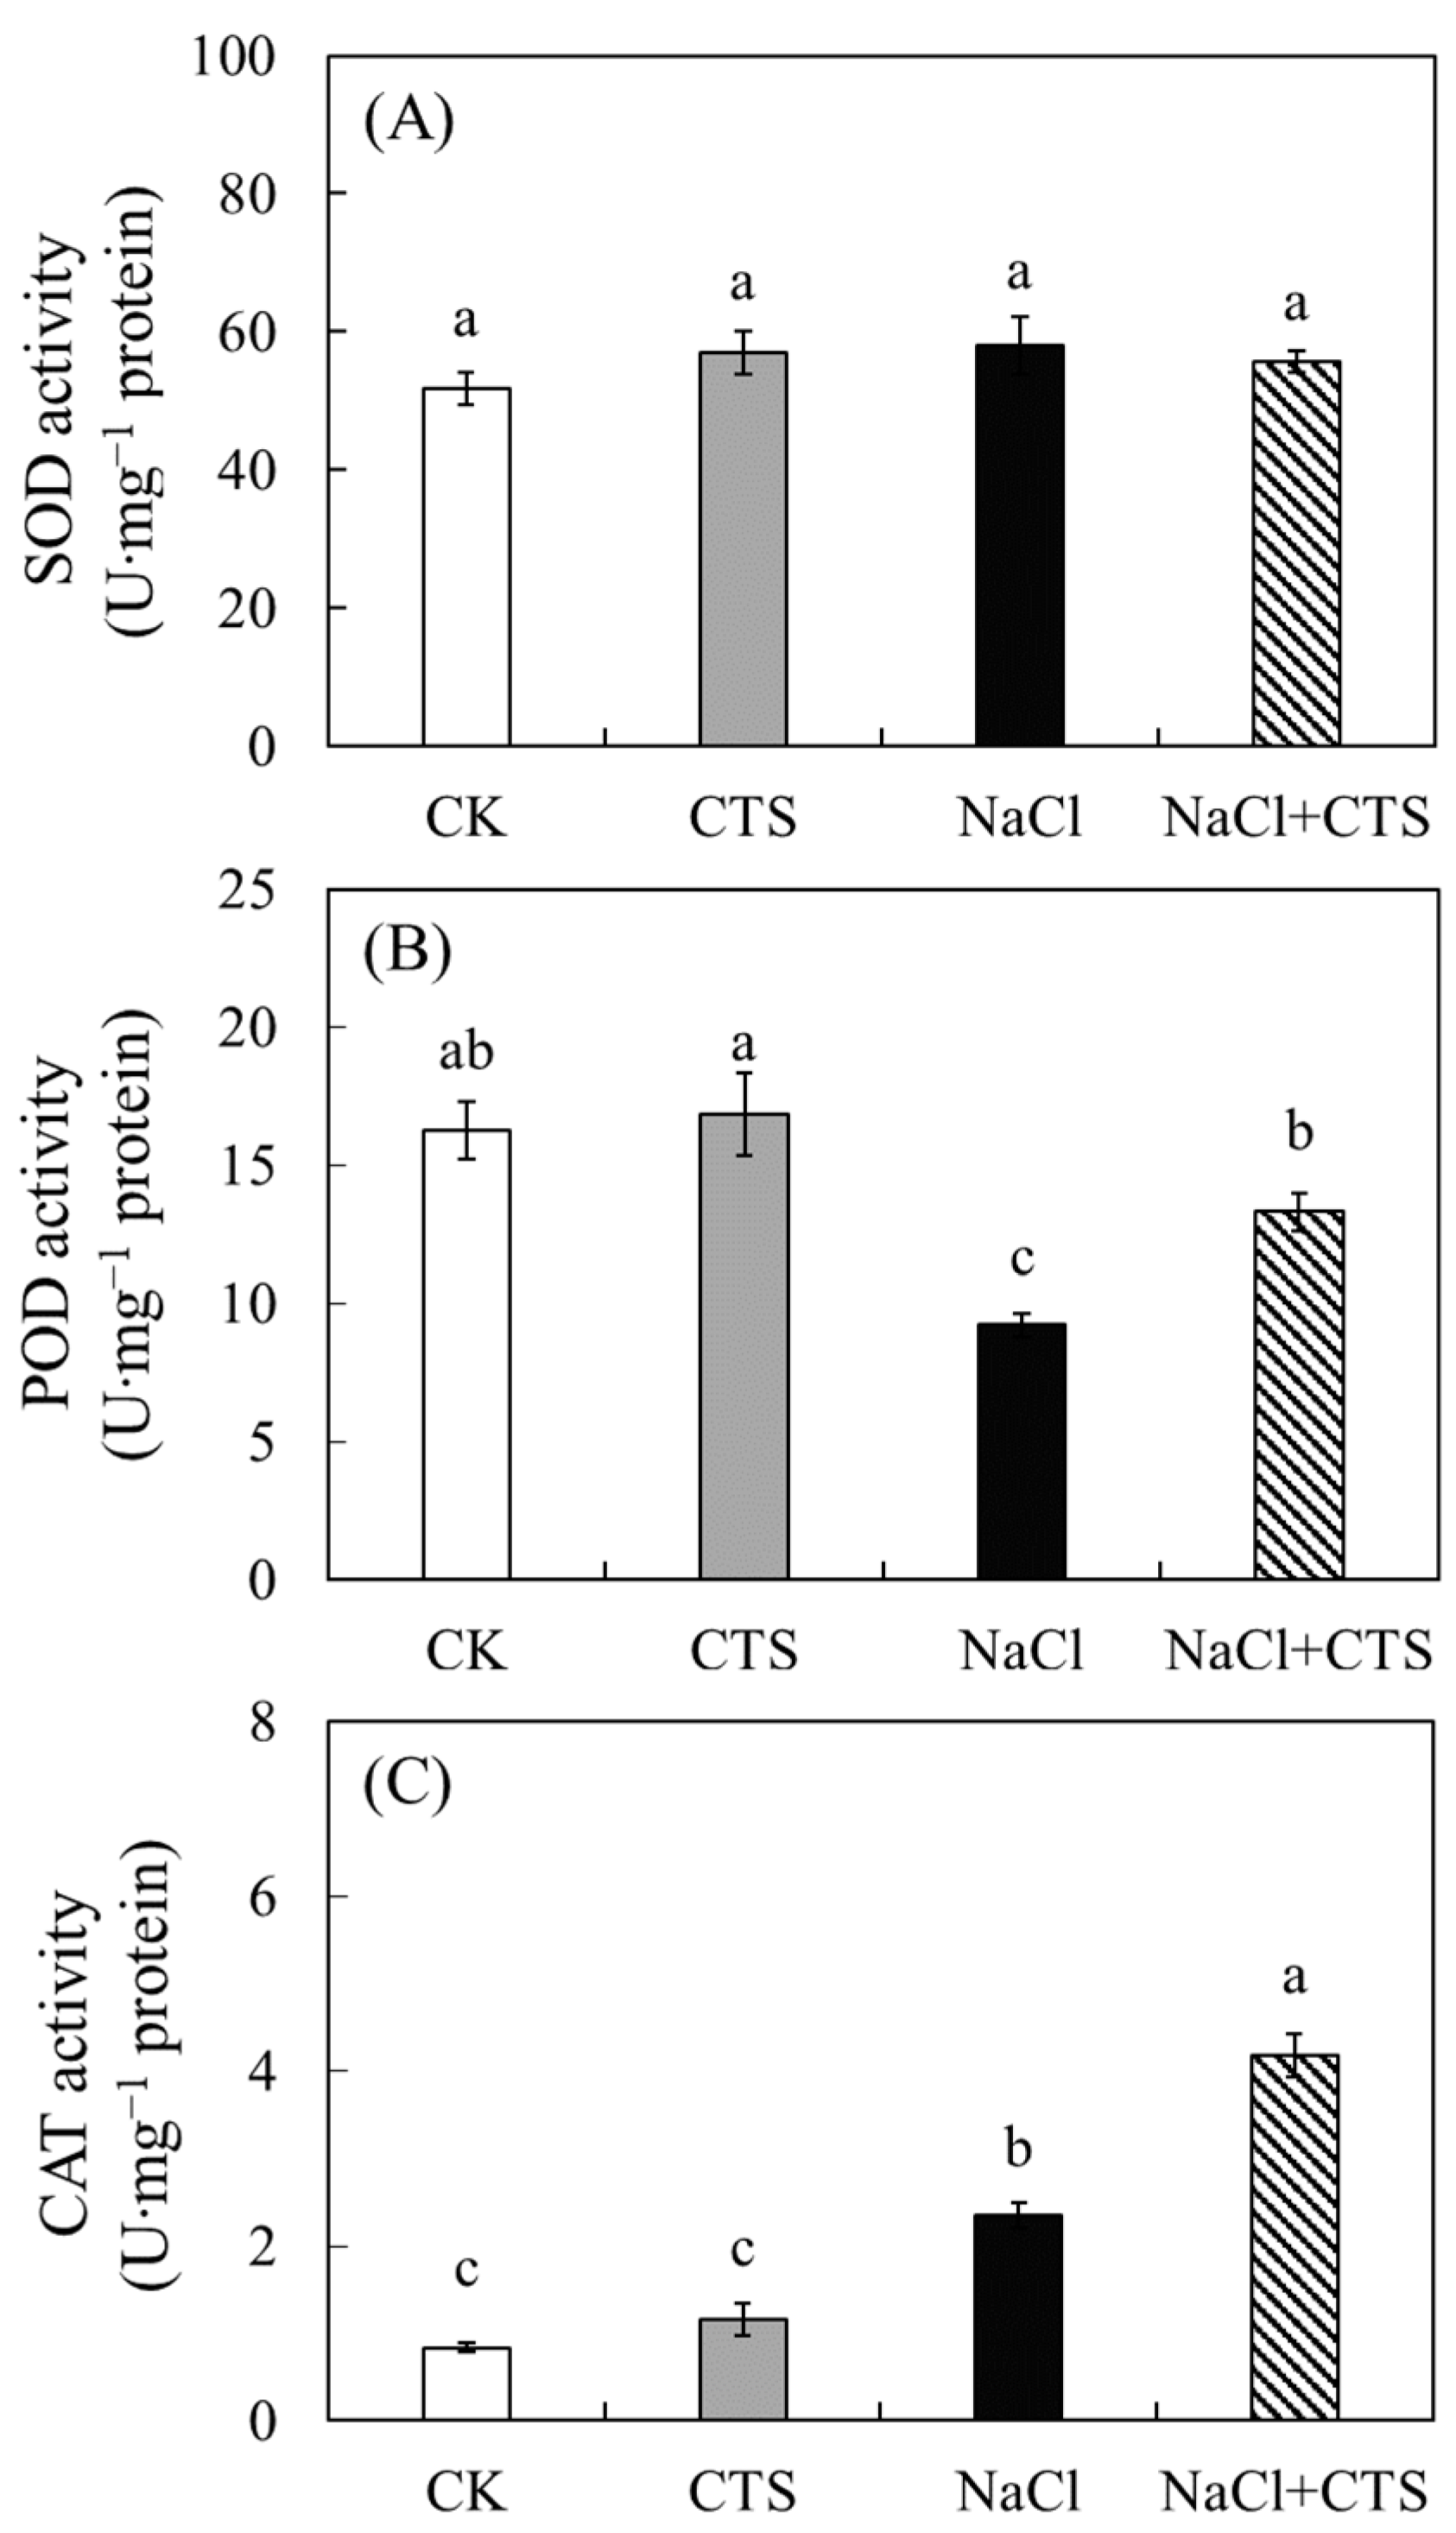
3.4. Effects of NaCl and CTS on the Antioxidant Enzyme Activity in the Lettuce Leaves

Figure 4 displays the results regarding the effects of NaCl and CTS on the antioxidant enzyme activity in the lettuce leaves. SOD, POD, and CAT exhibited various responses to the different treatments. SOD activity was consistent among all the groups (Figure 4A). However, the POD and CAT activities of the NaCl group were 43.3% lower and 181.9% higher than those of the control group, respectively (Figure 4B,C). The CTS + NaCl group had considerably higher POD and CAT activities than the NaCl group (Figure 4B,C). No significant change in the SOD, POD, and CAT activities was observed between the CTS and control groups (Figure 4).

4. Discussion

Limited plant growth and productivity are common responses to salinity stress [5]. The data obtained in this study indicate that salinity adversely affected the growth and biomass of lettuce plants and resulted in a significant decrease in their total leaf area, FW, and DW (Table 1). These results are consistent with those of studies on other crops, including tomatoes [53], peppers [54], and chickpeas [43]. CTS, which is a derivative of chitin, has many applications in the agricultural sector because it regulates plant growth and development and increases plants’ resistance to a wide range of abiotic and biotic stresses [19,21,55]. The application of exogenous CTS can mitigate the effects of salt stress on plant growth in many crops, such as ajowan [56], maize [57], and wheat [58]. A similar finding was obtained in this study, which indicates that the application of exogenous CTS alleviated the inhibition of the growth of lettuce caused by saline conditions (Table 1, Figure 2A). Growth analysis is a widely used analytical method for characterizing plant growth [59]. Plant biomass is strongly and positively correlated with RGR. We observed that the RGR of the NaCl group was significantly lower than that of the control group (Figure 2B), which indicates that the lettuce exposed to saline conditions accumulated less biomass than the lettuce grown under normal conditions during the growth stage. The NAR (average growth per unit leaf) of the NaCl group was significantly lower than that of the control group (Figure 2C). However, the LAR of the lettuce was relatively consistent between the saline and normal conditions (Figure 2D). These results indicate that the decrease in the RGR of the lettuce under salt stress was mainly associated with NAR and less associated with LAR. The exogenous application of CTS markedly increased the RGR of the lettuce under salt stress (Figure 2B), which proves that exogenous CTS can mitigate the inhibition of plant growth caused by salinity. However, we observed only a minor variation in NAR between the NaCl + CTS and NaCl groups (Figure 2C). Thus, the increase in the RGR of the NaCl + CTS group may have been related to both NAR and LAR. The Chl content of leaves is commonly considered a reliable predictor of the health and photosynthesis capacity of plants during growth [60,61]. Chlorophyll degradation under salt stress is usually related to the accumulation of ROS, which causes lipid peroxidation of chloroplast membranes [62]. In this study, the Chl content of the NaCl group was considerably lower than that of the control group (Table 1), which is in agreement with previous findings [63]. This result might be ascribable to the impaired biosynthesis or accelerated degradation of Chl pigment under saline conditions [43,64]. The application of exogenous CTS to the lettuce under saline conditions increased the Chl a and total Chl contents (Table 1). Similarly, Zou et al. [62] found that exogenous polysaccharides increased the Chl a content in wheat seedling leaves under salt stress. Chl a is responsible for the absorption of light and the initiation of photosynthesis. Excessive amounts of salt accumulated in chloroplasts can exert a direct toxic effect on photosynthesis through the destruction of pigment–protein complexes [65]. Thus, the increases in Chl a content in NaCl + CTS group are possibly because exogenous CTS protected Chl a from degradation in salt-stressed lettuce leaves, leading to high efficiency in photosynthesis. Moreover, the NaCl + CTS group did not exhibit a significantly higher Chl b content than the NaCl group possibly because Chl b tends to transform into Chl a when plants are subjected to saline conditions [66].
Leaf RWC is an accurate measure of the status of water in plants and indicates the water content of a leaf relative to the maximum amount of water that the leaf can contain under full turgidity [67]. Our study indicates that salinity decreased leaf RWC substantially; however, the exogenous application of CTS positively affected the leaf RWC of the lettuce exposed to saline conditions (Table 2). Geng et al. [24] also found that exogenous CTS application significantly increased the leaf RWC and water use efficiency in creeping bentgrass under salt stress, which contributes to maintaining a better water status in plants exposed to salinity stress. Thus, the results obtained from the current study were possibly due to the regulation of the balance between the water supply and leaf transpiration in the lettuce of the NaCl + CTS group. Under normal conditions, the Na+ content was very low in lettuce leaves, and no significant change was observed between the CK and CTS groups (Table 2). Salt stress significantly increased Na+ content but decreased the K+ content in lettuce leaves (Table 2). The application of exogenous CTS increased the K+ content and decreased the Na+ content in the leaves of lettuce exposed to saline conditions, but the K+ content in leaves was still lower than that of the control group (Table 2). A similar trend was also found in salt-stressed wheat seedlings applied with polysaccharides [62]. The accumulation of high levels of Na+ in plant tissues subjected to saline conditions has a devastating effect on the metabolism of cytoplasm and organelles. As cytosolic Na+ is noxious to cells, so too is chloroplastic Na+ accumulation [12]. Excess Na+ will cause an imbalance in cellular Na+ and K + homeostasis, which often leads to a low K+/Na+ ratio [68]. Hereafter, plants will suffer from K+ deficiencies stemming from the competitive inhibition of its uptake by Na+ in plants exposed to salt stress. Potassium is an essential nutrient for plant growth and production, it is involved in the balance of osmotic pressure and the regulation of stomatal closure, and it affects photosynthesis and enzymatic activity [44]. Maintaining a high shoot K+/Na+ ratio is an important trait of plant salt tolerance [69]. In the current study, the shoot K+/Na+ ratio decreased dramatically under saline conditions due to excessive Na+ accumulation in leaves. However, K+ accumulation in NaCl + CTS-group plants was accompanied by a higher K+/Na+ ratio but not a significant difference compared to that of the NaCl group. These results, combined with the mitigation of growth inhibition, suggest that exogenous CTS might facilitate plant growth by regulating the nutritional balance and reducing ion toxicity. A previous study has shown that polysaccharides enhanced salt tolerance in wheat by maintaining a high K+/Na+ ratio through regulation of several Na+/K+ transporter genes, coordinating the efflux and compartmentation of Na+ [58]. The study of Geng et al. [24] found that CTS enhanced salt overly sensitive pathways and upregulated the expression of AsHKT1 and genes encoding Na+/H+ exchangers under saline conditions, thus inhibiting Na+ transport to the photosynthetic tissues. In the present study, although the lower Na+ content in leaves was observed in the NaCl + CTS group at harvest time, the Na+ levels in shoot and root were not evaluated in a time-response manner, and the gene expressions related to Na+ transport still have to be analyzed. To further understand the CTS-induced salt tolerance in lettuce, future studies need to focus on examining the accumulation pattern of Na+ in shoot and root and investigating the gene expressions involved in Na+ transport.
Osmotic regulation is a major adaptation mechanism for plants to resist salt stress. High levels of osmolytes, such as proline, soluble sugars, and soluble proteins, are accumulated in the cytosol and other organelles to adjust osmotic pressure [17,44]. The high accumulation of proline in the NaCl group indicated the crucial nature of this osmolyte in the osmotic adjustment under saline conditions (Figure 3A). Under salt stress, proline can regulate osmotic potential, stabilize the cellular structure, reduce damage to the photosynthetic apparatus, and induce the expression of salt stress-responsive genes, consequently enhancing the adaption of the plant to saline conditions [58]. The application of exogenous CTS increased the proline level and Chl a content of the lettuce leaves subjected to saline conditions (Figure 3A), which suggests that exogenous CTS not only balances osmosis in cells but also protects their photosynthetic machinery. It had been proved that proline accumulation might be a result of a salt-induced increase in N metabolism [70]. A previous study found in wheat that exogenous CTS could effectively enhance N metabolism [71]. Thus, it is interesting to further study whether CTS increases proline levels by modulating N metabolism in lettuce plants during salt stress. The quantity of another vital osmolyte, namely soluble sugar, increased in the lettuce under saline conditions regardless of whether the leaves were treated with exogenous CTS; however, the soluble sugar levels of lettuce leaves treated with exogenous CTS were considerably higher than those of lettuce leaves treated with NaCl alone (Figure 3E). Because soluble sugar plays a key role in many physiological and biochemical processes, including photosynthesis, ROS scavenging, and the induction of adaptive pathway destructive conditions, a substantial increase in the total soluble sugar content may effectively protect lettuce plants exposed to NaCl stress [72,73].
Salt stress triggers the generation of a large number of ROS, such as O2, H2O2, and ·OH, which poses challenges to plant cells [74,75]. The excessive generation of ROS causes the oxidation of lipids and proteins and the breakage of nucleic acids and limits the effectiveness of enzymes, which results in abnormalities at the cellular level and thus the inhibition of plant growth [43,76]. MDA, which is the final product of membrane lipid peroxidation caused by ROS, is generally an indicator of the degree of cell membrane damage in plants subjected to stress [77,78]. The results of our experiment reveal that the O2, H2O2, MDA contents, and EL of the NaCl group were considerably higher than those of the control group, which indicates that the integrity and stability of the cell membrane decreased due ROS-induced oxidative damage (Figure 3B–D; Table 2). The O2, H2O2, and MDA contents and EL of the CTS + NaCl group were lower than those of the NaCl group (Figure 3B–D; Table 2). These results suggest that CTS can mitigate oxidative damage and regulate the stability of the cell membrane system under saline conditions. Moreover, the observed significant increases in Chl a content and reductions in the MDA level in lettuce leaves of NaCl + CTS group also proved that exogenous CTS reduced lipid peroxidation and mitigated the salt-induced reduction in chlorophyll content (Figure 3B; Table 1). Similarly, Turk [57] reported that the application of exogenous CTS decreases ROS levels and lipid peroxidation in peppers under salt stress.
Plants possess a wide range of radical scavenging systems to manage oxidative damage, including antioxidative enzymes, such as SOD, POD, and CAT, and nonenzymatic compounds, such as proline and AsA [44,79,80,81]. SOD is a major O2 scavenger that catalyzes O2 to H2O2 and O2 [82]. Thereafter, the toxic H2O2 can be removed by POD, CAT, or ascorbate peroxidase [83,84]. In the current study, the O2, H2O2, and MDA contents of the NaCl group were considerably higher than those of the control group (Figure 3B–D). Moreover, the CAT and POD activities of the NaCl group were lower and higher, respectively, than those of the control group (Figure 4). The exogenous application of CTS significantly decreased the O2, H2O2, and MDA levels and considerably increased the POD and CAT activities (Figure 3B–D and Figure 4). These results are consistent with those of studies on maize [57] and suggest that the exogenous application of CTS can mitigate the damage to the cell membrane system by salt stress by increasing the POD and CAT activities in lettuce leaves. The enzymatic activities of POD and CAT may have played a more crucial role than that of SOD in scavenging the overproduction of ROS in the plants treated with NaCl alone because no significant difference was observed in SOD activity among all the groups (Figure 4). However, the current study did not investigate the expression patterns of SOD, CAT, and POD genes, and additional studies should be conducted on this topic. In addition, studies have indicated that proline and AsA are potent antioxidants that can scavenge various types of ROS and shield the cell from oxidative damage [85,86]. In the current study, the application of exogenous CTS significantly increased the proline content of the lettuce leaves (Figure 3A), indicating that lettuce may accumulate high levels of proline to scavenge ROS, decrease oxidative damage, and safeguard cell membranes from the adverse effects of salt stress. No significant difference was observed in the AsA contents of the CTS + NaCl and NaCl groups (Figure 3F), which suggests that AsA may not play an important role in maintaining the strong antioxidant capacity of lettuce under saline conditions. A current study also found that exogenous oligo-alginate in NaCl-treated plants did not change the AsA content [87].

5. Conclusions

CTS, a natural polysaccharide, has many applications in the agriculture sector as an exogenous additive substance, being both safe and cheap. In the present study, the effects of exogenous CTS on lettuce plants under salt stress were investigated. The results showed that exogenous CTS could improve plant growth and biomass under salt stress. Exogenous CTS application increased proline and soluble sugar accumulations and enhanced peroxidase and catalase activities, thereby reducing oxidative damage to leaves. The CTS also curbed the accumulation of sodium but enhanced the accumulation of potassium in the leaves of NaCl-treated plants. These outcomes may help optimize the production technology of lettuce under saline conditions. However, the mechanism of CTS on alleviating salinity damage is still not fully understood. Future studies should focus on analyzing Na+/K+ transporter gene expressions and possible signal transduction pathways involved in CTS-regulated increased tolerance of lettuce plants to salt stress. As a biopolymer, the presence of amine and hydroxyl groups in CTS may also prevent Na+ from reaching the photosynthetic tissue by chelating part of it at the root/lower tissue level, which needs further exploration depending on the CTS application method.

Author Contributions

Conceptualization, G.Z. and Y.W.; methodology, G.Z., Z.Y. and Y.W.; validation, Q.Z. and Y.F.; data analysis, G.Z., Y.W. and Q.Z.; writing—original draft preparation, G.Z. and Y.M.; writing—review and editing, K.W. All authors have read and agreed to the published version of the manuscript.

Funding

This research was funded by the Natural Science Foundation of the Jiangsu Higher Education Institutions of China, 19KJB210011; Innovation Training Program for College Students of Jiangsu Vocational College of Agriculture and Forestry, 202113103005y.

Institutional Review Board Statement

Not applicable.

Informed Consent Statement

Not applicable.

Data Availability Statement

The data presented in this study are available on request from the corresponding author.

Acknowledgments

The authors would like to thank Cullen Pitney and Randy Johnson for many helpful comments and suggestions.

Conflicts of Interest

The authors declare no conflict of interest.

References

  1. Shahid, S.A.; Zaman, M.; Heng, L. Introduction to Soil Salinity, Sodicity and Diagnostics Techniques. In Guideline for Salinity Assessment, Mitigation and Adaptation Using Nuclear and Related Techniques; Springer Nature: Vienna, Switzerland, 2018. [Google Scholar]
  2. Deinlein, U.; Stephan, A.B.; Horie, T.; Luo, W.; Schroeder, J.I. Plant salt-tolerance mechanisms. Trends Plant Sci. 2014, 19, 371–379. [Google Scholar] [CrossRef] [Green Version]
  3. Ke, Q.; Wang, Z.; Ji, C.Y.; Jeong, J.C.; Lee, H.S.; Li, H.; Xu, B.; Deng, X.; Kwak, S.S. Transgenic poplar expressing codA exhibits enhanced growth and abiotic stress tolerance. Plant Physiol. Biochem. 2016, 100, 75–84. [Google Scholar] [CrossRef]
  4. Chen, M.; Yang, Z.; Liu, J.; Zhu, T.; Wei, X.; Fan, H.; Wang, B. Adaptation mechanism of salt excluders under saline conditions and its applications. Int. J. Mol. Sci. 2018, 19, 3668. [Google Scholar] [CrossRef] [Green Version]
  5. Azarmi-Atajan, F.; Sayyari-Zohan, M.H. Alleviation of salt stress in lettuce (Lactuca sativa L.) by plant growth-promoting rhizobacteria. J. Hortic. Postharvest Res. 2020, 3, 67–78. [Google Scholar]
  6. Sohaid, M.; Zahir, Z.; Khan, M.; Ans, M.; Asghar, H.; Yasin, S.; Al-Barakah, F. Comparative evaluation of different carrier-based multi-strain bacterial formulations to mitigate the salt stress in wheat. Saudi J. Biol. Sci. 2020, 27, 777–787. [Google Scholar]
  7. Zhu, J.K. Regulation of ion homeostasis under salt stress. Curr. Opin. Plant Biol. 2003, 6, 441–445. [Google Scholar] [CrossRef]
  8. Yang, Y.; Guo, Y. Unraveling salt stress signaling in plants. J. Integr. Plant Biol. 2018, 60, 58–66. [Google Scholar] [CrossRef] [PubMed] [Green Version]
  9. Hasegawa, P.M. Plant cellular and molecular responses to high salinity. Annu. Rev. Plant Physiol. Plant Mol. Biol. 2000, 51, 463–499. [Google Scholar] [CrossRef] [Green Version]
  10. Wu, G.Q.; Shui, Q.Z.; Wang, C.M.; Zhang, J.L.; Yuan, H.J.; Li, S.J.; Liu, Z.J. Characteristics of Na+ uptake in sugar beet (Beta vulgaris L.) seedlings under mild salt conditions. Acta Physiol. Plant. 2015, 37, 70. [Google Scholar] [CrossRef]
  11. Zhang, J.L.; Wetson, A.M.; Wang, S.M.; Gurmani, A.R.; Bao, A.K.; Wang, C.M. Factors associated with determination of root 22Na+ influx in the salt accumulation halophyte Suaeda maritima. Biol. Trace Elem. Res. 2011, 139, 108–117. [Google Scholar] [CrossRef] [PubMed]
  12. Assaha, D.V.M.; Ueda, A.; Saneoka, H.; Al-Yahyai, R.; Yaish, M.W. The role of Na+ and K+ transporters in salt stress adaptation in glycophytes. Front. Physiol. 2017, 8, 509. [Google Scholar] [CrossRef] [PubMed]
  13. Isayenkov, S.V.; Maathuis, F.J.M. Plant salinity stress: Many unanswered questions remain. Front. Plant Sci. 2019, 10, 80. [Google Scholar] [CrossRef] [Green Version]
  14. Lv, X.; Chen, S.; Wang, Y. Advances in understanding the physiological and molecular responses of sugar beet to salt stress. Front. Plant Sci. 2019, 10, 1431. [Google Scholar] [CrossRef] [PubMed] [Green Version]
  15. Li, J.; Liu, J.; Wang, G.; Cha, J.Y.; Li, G.; Chen, S.; Li, Z.; Guo, J.; Zhang, C.; Yang, Y.; et al. A chaperone function of NO CATALASE ACTIVITY1 is required to maintain catalase activity and for multiple stress responses in Arabidopsis. Plant Cell 2015, 27, 908–925. [Google Scholar] [CrossRef] [Green Version]
  16. Del, L.A.D.; López-Huertas, E. ROS generation in peroxisomes and its role in cell signaling. Plant Cell Physiol. 2016, 57, 1364–1376. [Google Scholar] [CrossRef]
  17. Zhao, J.; Pan, L.; Zhou, M.; Yang, Z.; Meng, Y.; Zhang, X. Comparative physiological and transcriptomic analyses reveal mechanisms of improved osmotic stress tolerance in annual ryegrass by exogenous chitosan. Genes 2019, 10, 853. [Google Scholar] [CrossRef] [PubMed] [Green Version]
  18. Betchem, G.; Johnson, N.; Wang, Y. The application of chitosan in the control of post-harvest diseases: A review. J. Plant Dis. Protect. 2019, 126, 495–507. [Google Scholar] [CrossRef]
  19. Pongprayoon, W.; Roytrakul, S.; Pichayangkura, R.; Chadchawan, S. The role of hydrogen peroxide in chitosan-induced resistance to osmotic stress in rice (Oryza sativa L.). Plant Growth Regul. 2013, 70, 159–173. [Google Scholar] [CrossRef]
  20. Morin-Crini, N.; Lichtfouse, E.; Torri, G.; Crini, G. Applications of chitosan in food, pharmaceuticals, medicine, cosmetics, agriculture, textiles, pulp and paper, biotechnology, and environmental chemistry. Environ. Chem. Lett. 2019, 17, 1667–1692. [Google Scholar] [CrossRef] [Green Version]
  21. Malerba, M.; Cerana, R. Chitosan effects on plant systems. Int. J. Mol. Sci. 2016, 17, 996. [Google Scholar] [CrossRef]
  22. Guan, Y.J.; Hu, J.; Wang, X.J.; Shao, C.X. Seed priming with chitosan improves maize germination and seedling growth in relation to physiological changes under low temperature stress. J. Zhejiang Univ. Sci. B 2009, 10, 427–433. [Google Scholar] [CrossRef] [Green Version]
  23. Jabeen, N.; Ahmad, R. The activity of antioxidant enzymes in response to salt stress in safflower (Carthamus tinctorius L.) and sunflower (Helianthus annuus L.) seedlings raised from seed treated with chitosan. J. Sci. Food Agric. 2012, 93, 1699–1705. [Google Scholar] [CrossRef]
  24. Geng, W.; Li, Z.; Hassan, M.; Peng, Y. Chitosan regulates metabolic balance, polyamine accumulation, and Na+ transport contributing to salt tolerance in creeping bentgrass. BMC Plant Biol. 2020, 20, 506. [Google Scholar] [CrossRef] [PubMed]
  25. Cho, M.H.; No, H.K.; Prinyawiwatkul, W. Chitosan treatments affect growth and selected quality of sunflower sprouts. J. Food Sci. 2010, 73, S70–S77. [Google Scholar] [CrossRef] [PubMed]
  26. Bittelli, M.; Flury, M.; Campbell, G.S.; Nichols, E.J. Reduction of transpiration through foliar application of chitosan. Agric. For. Meteorol. 2001, 107, 167–175. [Google Scholar] [CrossRef]
  27. Dzung, N.A. Chitosan and their derivatives as prospective biosubstances for developing sustainable eco-agriculture. Adv. Chitin Sci. 2007, 10, 453–459. [Google Scholar]
  28. Dzung, N.A.; Thang, N.T. Effect of oligoglucosamine on the growth and development of peanut (Arachis hypogea L.). In Proceedings of the 6th Asia-Pacific on Chitin, Chitosan Symposium, Singapore, 23–26 May 2004; Khor, E., Hutmacher, D., Yong, L.L., Eds.; ISBN 981-05r-r0904-9. [Google Scholar]
  29. Li, Z.; Zhang, Y.; Zhang, X.; Merewitz, E.; Peng, Y.; Ma, X.; Huang, L.; Yan, Y. Metabolic pathways regulated by chitosan contributing to drought resistance in white clover. J. Proteome Res. 2017, 16, 3039–3052. [Google Scholar] [CrossRef]
  30. Yang, F.; Hu, J.; Li, J.; Wu, X.; Qian, Y. Chitosan enhances leaf membrane stability and antioxidant enzyme activities in apple seedlings under drought stress. Plant Growth Regul. 2009, 58, 131–136. [Google Scholar] [CrossRef]
  31. Hadwiger, L.A. Anatomy of a nonhost disease resistance response of pea to Fusarium solani: PR gene elicitation via DNase, chitosan and chromatin alterations. Front. Plant Sci. 2015, 6, 373. [Google Scholar] [CrossRef]
  32. Aleksandrowicz-Trzcińska, M.; Bogusiewicz, A.; Szkop, M.; Drozdowski, S. Effect of chitosan on disease control and growth of scots pine (Pinus sylvestris L.) in a forest nursery. Forests 2015, 6, 3165–3176. [Google Scholar] [CrossRef] [Green Version]
  33. Viacava, G.E.; Gonzalez-Aguilar, G.G.; Roura, S.I. Determination of phytochemicals and antioxidant activity in butterhead lettuce related to leaf age and position. J. Food Biochem. 2014, 38, 352–362. [Google Scholar] [CrossRef]
  34. Aksakal, O.; Tabay, D.; Esringu, A.; Icoglu, A.F.; Esim, N. Effect of proline on biochemical and molecular mechanisms in lettuce (Lactuca sativa L.) exposed to UV-B radiation. Photochem. Photobiol. Sci. 2017, 16, 246–254. [Google Scholar] [CrossRef] [PubMed]
  35. Yildirim, E.; Ekinci, M.; Turan, M.; Dursun, A.; Kul, R.; Parlakova, F. Roles of glycine betaine in mitigating deleterious effect of salt stress on lettuce (Lactuca sativa L.). Arch. Agron. Soil Sci. 2015, 61, 1673–1689. [Google Scholar] [CrossRef]
  36. Fernández, J.A.; Niirola, D.; Ochoa, J.; Orsini, F.; Pennisi, G.; Gianquinto, G.; Egea-Gilabert, C. Root adaptation and ion selectivity affects the nutritional value of salt-stressed hydroponically grown baby-leaf Nasturtium officinale and Lactuca sativa. Agr. Food Sci. 2016, 25, 230–239. [Google Scholar] [CrossRef]
  37. Ahmed, S.; Ahmed, S.; Roy, S.K.; Woo, S.H.; Sonawane, K.D.; Shohael, A.M. Effect of salinity on the morphological, physiological and biochemical properties of lettuce (Lactuca sativa L.) in Bangladesh. Open Agric. 2019, 4, 361–373. [Google Scholar] [CrossRef]
  38. Garrido, Y.; Tudela, J.A.; Marín, A.; Mestre, T.; Martínez, V.; Gil, M.I. Physiological, phytochemical and structural changes of multi-leaf lettuce caused by salt stress. J. Sci. Food Agric. 2014, 94, 1592–1599. [Google Scholar] [CrossRef] [PubMed]
  39. Joshi, J.; Zhang, G.; Shen, S.; Supaibulwatana, K.; Watanabe, C.K.A.; Yamori, W. A combination of downward lighting and supplemental upward lighting improves plant growth in a closed plant factory with artificial lighting. HortScience 2017, 52, 831–835. [Google Scholar] [CrossRef] [Green Version]
  40. Porra, R.J.; Thompson, W.A.; Kriedemann, P.E. Determination of accurate extinction coefficients and simultaneous equations for assaying chlorophylls a and b extracted with four different solvents: Verification of the concentration of chlorophyll standards by atomic absorption spectroscopy. BBA Bioenerg. 1989, 975, 384–394. [Google Scholar] [CrossRef]
  41. Ohtake, N.; Ishikura, M.; Suzuki, H.; Yamori, W.; Goto, E. Continuous irradiation with alternating red and blue light enhances plant growth while keeping nutritional quality in lettuce. HortScience 2018, 53, 1804–1809. [Google Scholar] [CrossRef] [Green Version]
  42. Yamasaki, S.; Dillenburg, L.R. Measurements of leaf relative water content in Araucaria angustifolia. Rev. Bras. Fisiol. Veg. 1999, 11, 69–75. [Google Scholar]
  43. Ahmad, P.; Latef, A.A.A.; Hashem, A.; Abd_Allah, E.F.; Gucel, S.; Tran, L.P. Nitric oxide mitigates salt stress by regulating levels of osmolytes and antioxidant enzymes in chickpea. Front. Plant Sci. 2016, 7, 347. [Google Scholar] [CrossRef] [Green Version]
  44. Zhang, G.; Yan, Z.; Wang, Y.; Feng, Y.; Yuan, Q. Exogenous proline improve the growth and yield of lettuce with low potassium content. Sci. Hortic. 2020, 271, 109469. [Google Scholar] [CrossRef]
  45. Bates, L.S.; Waldren, R.P.; Teare, I.D. Rapid determination of free proline for water-stress studies. Plant Soil 1973, 39, 205–207. [Google Scholar] [CrossRef]
  46. Yemm, E.W.; Willis, A.J. The estimation of carbohydrates in plant extracts by anthrone. Biochem. J. 1954, 57, 508–514. [Google Scholar] [CrossRef] [PubMed] [Green Version]
  47. Kampfenkel, K.; Van Montagu, M.; Inzé, D. Extraction and determination of ascorbate and dehydroascorbate from plant tissue. Anal. Biochem. 1995, 225, 165–167. [Google Scholar] [CrossRef]
  48. Patterson, B.D.; MacRae, E.A.; Ferguson, I.B. Estimation of hydrogen peroxide in plant extracts using titanium (IV). Anal. Biochem. 1984, 139, 487–492. [Google Scholar] [CrossRef]
  49. Averina, N.G.; Nedved, E.L.; Shcherbakov, R.A.; Vershilovskaya, I.V.; Yaronskaya, E.B. Role of 5-aminolevulinic acid in the formation of winter rape resistance to sulfonylurea herbicides. Russ. J. Plant Physiol. 2014, 61, 679–687. [Google Scholar] [CrossRef]
  50. Heath, R.L.; Packer, L. Photoperoxidation in isolated chloroplasts: I. Kinetics and stoichiometry of fatty acid peroxidation. Arch. Biophys. Biophys. 1968, 125, 189–198. [Google Scholar] [CrossRef]
  51. Jin, P.; Wang, H.; Zhang, Y.; Huang, Y.; Wang, L.; Zheng, Y. UV-C enhances resistance against gray mold decay caused by Botrytis cinerea in strawberry fruit. Sci. Hortic. 2017, 225, 106–111. [Google Scholar] [CrossRef]
  52. Bradford, M.M. A rapid and sensitive method for the quantitation of microgram quantities of protein utilizing the principaldye binding. Anal. Biochem. 1976, 72, 248–254. [Google Scholar] [CrossRef]
  53. Latef, A.A.H.A.; Chaoxing, H. Effect of arbuscular mycorrhizal fungi on growth, mineral nutrition, antioxidant enzymes activity and fruit yield of tomato grown under salinity stress. Sci. Hortic. 2011, 127, 228–233. [Google Scholar] [CrossRef]
  54. Latef, A.A.H.A.; Chaoxing, H. Does the inoculation with Glomus mosseae improve salt tolerance in pepper plants? J. Plant Growth Regul. 2014, 33, 644–653. [Google Scholar] [CrossRef]
  55. Hemantaranjan, A.; Deepmala, K.; Bharti, S.; Nishant, B.A. A future perspective in crop protection: Chitosan and its oligosaccharides. Adv. Plants Agric. Res. 2014, 1, 00006. [Google Scholar] [CrossRef] [Green Version]
  56. Mahdavi, B.; Rahimi, A. Seed priming with chitosan improves the germination and growth performance of ajowan (Carum copticum) under salt stress. Eurasia. J. Biosci. 2013, 7, 69–76. [Google Scholar] [CrossRef]
  57. Turk, H. Chitosan-induced enhanced expression and activation of alternative oxidase confer tolerance to salt stress in maize seedlings. Plant Physiol. Bioch. 2019, 141, 415–422. [Google Scholar] [CrossRef]
  58. Zou, P.; Li, K.C.; Liu, S.; Xing, R.G.; Qin, Y.K.; Yu, H.H.; Zhou, M.M.; Li, P.C. Effect of chitooligosaccharides with different degrees of acetylation on wheat seedlings under salt stress. Carbohydr. Polym. 2015, 126, 62–69. [Google Scholar] [CrossRef]
  59. Hoffmann, W.A.; Poorter, H. Avoiding bias in calculations of relative growth rate. Ann. Bot. 2002, 80, 37–42. [Google Scholar] [CrossRef] [Green Version]
  60. Rady, M.M.; El-Shewy, A.A.; El-Yazal, M.A.; Abdelaal, K.E.S. Response of salt-stressed common bean plant performances to foliar application of phosphorus (MAP). Int. Lett. Nat. Sci. 2018, 72, 7–20. [Google Scholar] [CrossRef] [Green Version]
  61. Qi, H.; Wu, Z.; Zhang, L.; Li, J.; Zhou, J.; Jun, Z.; Zhu, B. Monitoring of peanut leaves chlorophyll content based on drone-based multispectral image feature extraction. Comput. Electron. Agr. 2021, 187, 106292. [Google Scholar] [CrossRef]
  62. Zou, P.; Lu, X.; Jing, C.; Yuan, Y.; Lu, Y.; Zhang, C.; Meng, L.; Zhao, H.; Li, Y. Low-molecular-weightt polysaccharides from Pyropia yezoensis enhance tolerance of wheat seedlings (Triticum aestivum L.) to Salt Stress. Front. Plant Sci. 2018, 9, 427. [Google Scholar] [CrossRef] [Green Version]
  63. Sen, S.; Chouhan, D.; Das, D.; Ghosh, R.; Mandal, P. Improvisation of salinity stress response in mung bean through solid matrix priming with normal and nano-sized chitosan. Int. J. Biol. Macromol. 2020, 145, 108–123. [Google Scholar] [CrossRef] [PubMed]
  64. Rasool, S.; Ahmad, A.; Siddiqi, T.O.; Ahmad, P. Changes in growth, lipid peroxidation and some key antioxidant enzymes in chickpea genotypes under salt stress. Acta Physiol. Plant. 2013, 35, 1039–1050. [Google Scholar] [CrossRef]
  65. Negrão, S.; Schmöckel, S.M.; Tester, M. Evaluating physiological responses of plants to salinity stress. Ann. Bot. 2017, 119, 1–11. [Google Scholar] [CrossRef] [PubMed] [Green Version]
  66. Eckardt, N.A. A new chlorophyll degradation pathway. Plant Cell 2009, 21, 700. [Google Scholar] [CrossRef] [PubMed] [Green Version]
  67. Suriya-arunroj, D.; Supapoj, N.; Toojinda, T.; Vanavichit, A. Relative leaf water content as an efficient method for evaluating rice cultivars for tolerance to salt stress. ScienceAsia 2004, 30, 411–415. [Google Scholar] [CrossRef]
  68. Mekawy, A.M.; Assaha, D.V.; Yahagi, H.; Tada, Y.; Ueda, A.; Saneoka, H. Growth, physiological adaptation, and gene expression analysis of two Egyptian rice cultivars under salt stress. Plant Physiol. Biochem. 2015, 87, 17–25. [Google Scholar] [CrossRef]
  69. Cuin, T.A.; Betts, S.A.; Chalmandrier, R.; Shabala, S. A root’s ability to retain K+ correlates with salt tolerance in wheat. J. Exp. Bot. 2008, 59, 2697–2706. [Google Scholar] [CrossRef] [Green Version]
  70. Rocha, I.M.A.; Vitorello, V.A.; Silva, J.S.; Ferreira-Silva, S.L.; Viegas, R.A.; Silva, E.N.; Silveira, J.A.G. Exogenous ornithine is an effective precursor and the delta-ornithine amino transferase pathway contributes to proline accumulation under high N recycling in salt-stressed cashew leaves. J. Plant Physiol. 2012, 169, 41–49. [Google Scholar] [CrossRef]
  71. Zhang, X.Q.; Li, K.C.; Xing, R.G.; Liu, S.; Li, P.C. Metabolite profiling of wheat seedlings induced by chitosan: Revelation of the enhanced carbon and nitrogen metabolism. Front. Plant Sci. 2017, 8, 13. [Google Scholar] [CrossRef] [Green Version]
  72. Gupta, A.K.; Kaur, N. Sugar signalling and gene expression in relation to carbohydrate metabolism under abiotic stresses in plants. J. Biosci. 2005, 30, 761–776. [Google Scholar] [CrossRef]
  73. Bolouri-Moghaddam, M.R.; Le, R.K.; Xiang, L.; Rolland, F.; Van den Ende, W. Sugar signalling and antioxidant network connections in plant cells. FEBS J. 2010, 277, 2022–2037. [Google Scholar] [CrossRef]
  74. Hayat, S.; Yadav, S.; Wani, A.S.; Irfan, M.; Alyemini, M.N.; Ahmad, A. Impact of sodium nitroprusside on nitrate reductase, proline and antioxidant systemin Solanum lycopersicum under salinity stress. Hort. Environ. Biotechnol. 2012, 53, 362–367. [Google Scholar] [CrossRef]
  75. Butt, M.; Ayyub, C.M.; Amjad, M.; Ah-mad, R. Proline application enhances growth of chilli by improving physiological and biochemical attributes under salt stress. Pak. J. Agr. Sci. 2016, 53, 43–49. [Google Scholar]
  76. Miller, G.; Suzuki, N.; Ciftci-Yilmaz, S.; Mittler, R. Reactive oxygen species homeostasis and signalling during drought and salinity stresses. Plant Cell Environ. 2010, 33, 453–467. [Google Scholar] [CrossRef] [PubMed]
  77. Li, J.T.; Qiu, Z.B.; Zhang, X.W.; Wang, L.S. Exogenous hydrogen peroxide can enhance tolerance of wheat seedlings to salt stress. Acta Physiol. Plant. 2011, 33, 835–842. [Google Scholar] [CrossRef]
  78. Wu, G.Q. Exogenous application of proline alleviates salt-induced toxicity in sainfoin seedlings. J. Anim. Plant Sci. 2017, 27, 246–251. [Google Scholar]
  79. Asada, K. Ascorbate peroxidase—A hydrogen peroxide-scavenging enzyme in plants. Physiol. Plant. 1992, 85, 235–241. [Google Scholar] [CrossRef]
  80. Alscher, R.G.; Donahue, J.L.; Cramer, C.L. Reactive oxygen species and antioxidants: Relationships in green cells. Physiol. Plant. 1997, 100, 224–233. [Google Scholar] [CrossRef]
  81. Orsini, F.; Pennisi, G.; Mancarella, S.; Nayef, M.A.; Sanoubar, R.; Nicola, S.; Gianquinto, G. Hydroponic lettuce yields are improved under salt stress by utilizing white plastic film and exogenous applications of proline. Sci. Hortic. 2018, 233, 283–293. [Google Scholar] [CrossRef]
  82. Apel, K.; Hirt, H. Reactive oxygen species: Metabolism, oxidative stress, and signal transduction. Annu. Rev. Plant Biol. 2004, 55, 373–399. [Google Scholar] [CrossRef] [Green Version]
  83. Foyer, C.H.; Noctor, G. Oxidant and antioxidant signalling in plants: A re-evaluation of the concept of oxidative stress in a physiological context. Plant Cell Environ. 2005, 28, 1056–1071. [Google Scholar] [CrossRef]
  84. Kusvuran, S.; Bayat, R.; Ustun, A.S.; Ellialtioglu, S.S. Exogenous proline improves osmoregulation, physiological and biochemical responses of eggplant under salt stress. Fresenius Environ. Bull. 2020, 29, 152–161. [Google Scholar]
  85. Thomas, C.E.; Mclean, L.R.; Parkar, R.A.; Ohleweiler, D.F. Ascorbate and phenolic antioxidant interactions in prevention of liposomal oxidation. Lipids 1992, 27, 543–550. [Google Scholar] [CrossRef]
  86. Iqbal, N.; Umar, S.; Khan, N.A.; Khan, M.I.R. A new perspective of phytohormones in salinity tolerance: Regulation of proline metabolism. Environ. Exp. Bot. 2014, 100, 34–42. [Google Scholar] [CrossRef]
  87. Piotr, S.; Monika, G.; Edward, M.; Marcin, S. Oligo-alginate with low molecular mass improves growth and physiological activity of eucomis autumnalis under salinity stress. Molecules 2018, 23, 812. [Google Scholar]
Figure 1. The relative spectral photon flux of (A) cool white fluorescent lamps and (B) LED lights. The wavelengths of light sources were recorded at 380–800 nm with a spectrometer.
Horticulturae 07 00342 g001
Figure 2. Effects of exogenous chitosan (CTS) on (A) plant morphology and (BD) plant growth analysis parameters of lettuce plants under salt stress. Data presented are the means ± SEs (n = 3). Different letters on top of bars indicate a significant difference (p < 0.05) according to Tukey’s HSD test. CK (control) = 0 mM NaCl + 0 mg/L CTS; CTS = 0 mM NaCl + 100 mg/L CTS; NaCl = 100 mM NaCl + 0 mg/L CTS; NaCl + CTS = 100 mM NaCl +100 mg/L. RGR, relative growth rate; NAR, net assimilation rate; LAR, leaf area ratio.
Horticulturae 07 00342 g002
Figure 3. Effects of exogenous chitosan (CTS) on (A) proline content, (B) MDA content, (C) O2 generation rate, (D) H2O2 content, (E) soluble sugar content, and (F) AsA content in leaves of lettuce plants under salt stress. Data presented are the means ± SEs (n = 3). Different letters on top of bars indicate a significant difference (p < 0.05) according to Tukey’s HSD test. CK (control) = 0 mM NaCl + 0 mg/L CTS; CTS = 0 mM NaCl + 100 mg/L CTS; NaCl = 100 mM NaCl + 0 mg/L CTS; NaCl + CTS = 100 mM NaCl +100 mg/L. MDA, malondialdehyde; O2, superoxide radical; H2O2, hydrogen peroxide; AsA, ascorbic acid.
Horticulturae 07 00342 g003
Figure 4. Effects of exogenous chitosan (CTS) on activities of (A) SOD, (B) POD, and (C) CAT in leaves of lettuce plants under salt stress. Data presented are the means ± SEs (n = 3). Different letters on top of bars indicate a significant difference (p < 0.05) according to Tukey’s HSD test. CK (control) = 0 mM NaCl + 0 mg/L CTS; CTS = 0 mM NaCl + 100 mg/L CTS; NaCl = 100 mM NaCl + 0 mg/L CTS; NaCl + CTS = 100 mM NaCl +100 mg/L. SOD, superoxide dismutase; POD, peroxidase; CAT, catalase.
Horticulturae 07 00342 g004
Table 1. Effects of chitosan (CTS) on total leaf area, shoot and root fresh weight, shoot and root dry weight, and leaf chlorophyll content of lettuce plants under salt stress.
TreatmentsTotal Leaf Area
(m2)
Shoot FW
(g∙plant−1)
Shoot DW
(g∙plant−1)
Root FW
(g∙plant−1)
Root DW
(g∙plant−1)
Chl a
(μg∙ml−1)
Chl b
(μg∙ml−1)
Total Chl
(μg∙ml−1)
CK0.052 ± 0.004 a48.8 ± 0.9 a2.39 ± 0.21 a8.73 ± 0.63 a0.31 ± 0.02 a8.68 ± 0.15 b 3.30 ± 0.23 a 11.98 ± 0.13 a
CTS0.054 ± 0.010 a45.2 ± 1.9 a2.11 ± 0.19 ab9.80 ± 1.23 a0.28 ± 0.02 ab9.24 ± 0.14 a 3.29 ± 0.11 a 12.53 ± 0.24 a
NaCl0.017 ± 0.003 b12.8 ± 1.7 c0.80 ± 0.05 c3.47 ± 0.51 b0.15 ± 0.01 c7.43 ± 0.14 c2.62 ± 0.04 b10.05 ± 0.16 c
NaCl + CTS0.041 ± 0.007 a29.1 ± 4.5 b1.56 ± 0.19 b5.98 ± 0.47 b0.24 ± 0.03 b8.18 ± 0.20 b2.73 ± 0.15 b10.91 ± 0.35 b
Data presented are the means ± SEs (n = 3). Different letters in each column indicate significant differences (p < 0.05). CK (control) = 0 mM NaCl + 0 mg/L CTS; CTS = 0 mM NaCl + 100 mg/L CTS; NaCl = 100 mM NaCl + 0 mg/L CTS; NaCl + CTS = 100 mM NaCl +100 mg/L CTS. FW, fresh weight; DW, dry weight; Chl, chlorophyll.
Table 2. Effects of chitosan (CTS) on leaf RWC, EL, and the contents of potassium and sodium in leaves of lettuce plants under salt stress.
TreatmentsRWC
(%)
EL
(%)
Potassium
(mg∙g−1 DW)
Sodium
(mg∙g−1 DW)
K+/Na+ Ratio
CK74.8 ± 1.3 ab16.1 ± 3.0 c73.96 ± 1.30 a1.09 ± 0.04 c68.23 ± 3.73 a
CTS79.0 ± 2.9 a15.5 ± 2.5 c72.02 ± 2.25 a1.05 ± 0.07 c69.38 ± 6.97 a
NaCl62.9 ± 1.6 c42.0 ± 3.1 a52.92 ± 1.55 c22.61 ± 1.31 a2.35 ± 0.07 b
NaCl + CTS72.8 ± 0.4 b33.1 ± 0.5 b61.27 ± 1.23 b12.21 ± 1.36 b5.11 ± 0.42 b
Data presented are the means ± SEs (n = 3). Different letters in each column indicate significant differences (p < 0.05). CK (control) = 0 mM NaCl + 0 mg/L CTS; CTS = 0 mM NaCl + 100 mg/L CTS; NaCl = 100 mM NaCl + 0 mg/L CTS; NaCl + CTS = 100 mM NaCl +100 mg/L CTS. RWC, relative water content; EL, electrolyte leakage; FW, fresh weight; K+, potassium; Na+, sodium.
Publisher’s Note: MDPI stays neutral with regard to jurisdictional claims in published maps and institutional affiliations.

