Article

Chemotypic Diversity and Integrated Metabolic Profiling of Myrtle (Myrtus communis L.) from Mediterranean Turkey

1
Department of Horticulture, Faculty of Agriculture, Akdeniz University, Antalya 07059, Turkey
2
Department of Horticulture, Faculty of Agriculture, Recep Tayyip Erdoğan University, Rize 53300, Turkey
3
Medical and Aromatic Plants Program, Department of Plant and Animal Production, Şavşat Vocational School, Artvin Çoruh University, Artvin 08700, Turkey
4
Department of Horticulture, Faculty of Agriculture, Çukurova University, Adana 01330, Turkey
5
Department of Agricultural, Food, and Environmental Sciences, Università Politecnica delle Marche, 60121 Ancona, Italy
6
Batı Akdeniz Agricultural Research Institute, Antalya 07100, Turkey
*
Authors to whom correspondence should be addressed.
Horticulturae 2026, 12(5), 633; https://doi.org/10.3390/horticulturae12050633
Submission received: 10 April 2026 / Revised: 9 May 2026 / Accepted: 15 May 2026 / Published: 20 May 2026

Abstract

Myrtus communis L. (common myrtle) is an economically valuable Mediterranean shrub with diverse applications in food, pharmaceutical, and ornamental sectors. However, the biochemical diversity of myrtle genotypes from Mediterranean environments remains insufficiently characterized, particularly regarding the relationship between primary and secondary metabolism and stress adaptation. This study investigated the biochemical and aroma profiles of six myrtle genotypes selected from natural populations in Antalya, Turkey, to identify chemotypic diversity and elucidate metabolic diversity observed in Mediterranean genotypes. Volatile compounds were analyzed using HS-SPME/GC-MS, while sugars and organic acids were quantified by HPLC. Multivariate statistical analyses (PCA, hierarchical clustering) were employed to evaluate metabolic relationships and genotype classification. Descriptive analysis suggested three potential chemotypic patterns: (i) 1,8-cineole-type (G34, G36) with G29 showing a transitional profile, (ii) α-Pinene-type (G15, G37), and (iii) Ester-aldehyde type (G9). These groupings are based on single volatile measurements and should be considered preliminary patterns pending validation through replicate analyses. Significant genotypic variation was observed for primary metabolites (sugars and organic acids) (p < 0.001, η2 > 0.90), as evaluated by ANOVA with triplicate biological replicates. Volatile compound differences were evaluated as descriptive exploratory patterns only. Hierarchical clustering revealed three metabolic strategies: balanced metabolism integrating diverse volatile and primary metabolite profiles (Cluster 1: G9, G15, G37), terpene-rich volatile defense with enhanced organic acid metabolism (Cluster 2: G29, G36), and specialized 1,8-cineole-dominant biosynthesis (Cluster 3: G34). These findings highlight substantial metabolic diversity and provide a basis for germplasm evaluation and selection and potential applications.

1. Introduction

Myrtus communis L. (common myrtle), belonging to the Myrtaceae family, is a characteristic and economically valuable native species of the Mediterranean basin [1]. This perennial shrub, considered sacred since ancient Egyptian, Greek, and Roman civilizations as the “plant of love and peace,” has been utilized in traditional medicine for its antiseptic, anti-inflammatory, and healing properties [2]. Contemporary pharmacological research has validated the antimicrobial, antioxidant, and anticancer activities of myrtle essential oils [3].
The plant exhibits remarkable versatility across multiple sectors. In the food industry, the fruits are used in liqueur production, jams, and fruit juices, while the aromatic leaves are valued as tea and spices [4]. In the cosmetics sector, it is incorporated into perfumes and skincare products, and in aromatherapy, it is employed for its relaxing effects [5]. As an ornamental plant, it provides year-round aesthetic value: its glossy, leathery foliage; white, fragrant flowers in summer; and colorful fruits in autumn and winter make it a landscape asset. Its tolerance to salinity and dry conditions makes it preferred for coastal and low-input landscapes, while its compact, prunable form allows for formal designs. With low maintenance requirements under climate change conditions, it emerges as a sustainable ornamental plant [6].
The economic and functional value of the plant is closely related to its biochemical content. Volatile compounds are fundamental determinants of aroma quality and simultaneously play critical roles in defense against biotic and abiotic stresses. The volatile profile of myrtle fruits comprises terpenes (monoterpenes and sesquiterpenes), phenylpropanoids, and aliphatic compounds [7]. Monoterpenes are synthesized via the mevalonate (MVA) and methylerythritol phosphate (MEP) pathways. 1,8-cineole, an oxygenated monoterpene ether synthesized through the MEP pathway, contributes to drought tolerance by providing antioxidant capacity and membrane stabilization [8]. α-Pinene, a hydrocarbon monoterpene, functions in allelopathy and defense against herbivores [9]. Linalool, a non-cyclic monoterpenol, plays roles in pollinator attraction and stress responses [10]. Esters (linalyl acetate, ethyl acetate) are critical in fruit ripening and aroma development [11]. These volatile compounds exhibit pharmacological activities (antimicrobial, anti-inflammatory, bronchodilator) that enhance the value of myrtle products [12].
Primary metabolites, particularly sugars (glucose, fructose) and organic acids (malic acid, citric acid, succinic acid) are fundamental indicators of fruit quality. Sugars are transported to fruit tissues via source-sink relationships, providing energy and carbon skeletons for cellular processes [13]. Under drought conditions, sugar accumulation lowers cellular osmotic potential, increasing water retention and preserving membrane integrity. Glucose and fructose also function as metabolic signaling molecules regulating redox balance and ROS detoxification [14]. Organic acids are central to cellular energy metabolism as TCA cycle intermediates. Malic acid regulates intracellular pH and osmotic pressure; citric acid exhibits antioxidant activity through metal chelation; and succinic acid supports alternative energy pathways under stress. These acids directly affect pH homeostasis, antioxidant capacity, and pathogen resistance [15].
M. communis has evolved complex tolerance mechanisms against abiotic stresses in the Mediterranean basin. Drought tolerance involves morphological, physiological, and biochemical adaptations. At the cellular level, abscisic acid (ABA) triggers stomatal closure and activates stress-responsive gene expression through SnRK2 kinases and AREB/ABF transcription factors [16]. Osmotic adjustment is achieved through accumulation of inorganic ions and compatible osmoprotectants such as proline, synthesized via the glutamate pathway by Δ1-pyrroline-5-carboxylate synthetase (P5CS). Proline functions not only in osmoregulation but also in ROS detoxification, protein stabilization, and prevention of cell death [17]. Salt tolerance requires management of both osmotic stress and ionic toxicity. Plants maintain cytosolic Na+ homeostasis through Na+/H+ antiporters (SOS1, NHX family) and compartmentalization into vacuoles [18]. Oxidative stress management is critical under both drought and salinity. Plants detoxify ROS (superoxide, hydrogen peroxide, hydroxyl radicals) through enzymatic (SOD, catalase, APX, GR) and non-enzymatic (phenolics, terpenes, ascorbic acid) antioxidant systems. The lipophilic antioxidant properties of volatile terpenes (1,8-cineole, α-pinene) are particularly important in preventing membrane lipid peroxidation [19].
The Mediterranean basin represents a major center of genetic diversity for M. communis, hosting extensive populations across Western (Spain, Portugal, Morocco, Algeria), Central (Italy, France, Corsica, Sardinia, Malta, Tunisia), and Eastern (Greece, Turkey, Cyprus, Lebanon, Israel, Syria) regions [20]. This geographic diversity has generated significant genetic and metabolic differentiation through adaptation to varied ecological conditions. The southwestern coasts of Turkey (Antalya, Mersin, Muğla), characterized by dry summers and saline coastal ecosystems, harbor myrtle populations adapted to these challenging environments. However, despite its value, the biochemical diversity of this genetic resource, particularly metabolic profiles associated with environmental adaptation remain poorly understood [21].
We hypothesized that myrtle genotypes from Mediterranean environments would exhibit distinct metabolic profiles characterized by (i) differential biosynthesis of volatile terpenes as chemotypic markers; (ii) variable accumulation of primary metabolites (sugars and organic acids) associated with fruit quality traits; and (iii) coordinated metabolic networks linking primary and secondary metabolism, consistent with a resource allocation trade-off framework.
While myrtle populations from Sardinia, Corsica, and the Iberian Peninsula have been extensively characterized for their volatile and primary metabolic profiles [22,23,24], Turkish Mediterranean myrtle germplasm remains underexplored at the metabolic level. Yaşa et al. [25] recently reported the fixed oil composition of myrtle fruits from Bursa province, but this study did not investigate volatile compounds, sugars, or organic acids. To date, no systematic study has simultaneously characterized the volatile profiles, sugar contents, and organic acid compositions of white-fruited myrtle genotypes from Antalya and Muğla provinces. This knowledge gap limits the utilization of Turkish genetic resources in germplasm evaluation and potential industrial applications.
This study investigated the fruit biochemical profiles of six myrtle genotypes (G9, G15, G29, G34, G36, and G37), previously selected from natural populations in Antalya and Muğla provinces, Turkey, based on superior fruit characteristics and white fruit color. The specific objectives were to: (1) characterize volatile compound profiles using HS-SPME/GC-MS to identify chemotypic diversity; (2) quantify sugar and organic acid contents using HPLC to assess primary metabolic status; (3) evaluate relationships between volatile and primary metabolic profiles through multivariate analysis; and (4) identify superior genotypes for specific end-use applications (essential oil extraction, food processing, or ornamental use) based on integrated biochemical characteristics.

2. Results

2.1. Volatile Component Profile

GC-MS analyses of the fruit samples of six myrtle genotypes (G9, G15, G29, G34, G36, and G37) identified over 50 volatile compounds, classified into Total Terpenes (including hydrocarbon and oxygenated monoterpenes), Total Aliphatic Alcohols, Total Aliphatic Aldehydes, Total Aliphatic Esters, Total Aliphatic Ketones, Total Phenylpropanoids, and Other Compounds (Table 1). Total Terpenes constituted the dominant compound group across all genotypes, representing 71.55% (G34) to 86.46% (G36) of total volatiles. Within the terpene fraction, 1,8-cineole (1,3,3-trimethyl-2-oxabicyclo [2.2.2] octane, an oxygenated monoterpene ether) was the most abundant component, ranging from 0% (G9) to 40.3% (G34). Total Aliphatic Alcohols (non-terpenoid alcohols: 1-hexanol, 2-hexen-1-ol, cis-2-pentenol) represented a minor fraction (3.50–12.34%), contrary to previous myrtle studies that classified 1,8-cineole within the alcohol group following traditional conventions [22,23].
Within the terpene fraction, oxygenated monoterpenes were the most abundant subclass. 1,8-cineole (an oxygenated monoterpene ether) was the most notable terpene component, ranging from 0% (G9) to 40.30% (G34). High 1,8-cineole levels (35–40%) were also found in G15 (35.97%), G29 (38.46%), and G36 (39.61%). Other prominent oxygenated terpenes included linalool (a terpenol), which was abundant in G36 (8.70%), G29 (7.78%), and G37 (7.90%), while trans-β-terpineol (also a terpenol) accumulated specifically in G9 (34.45%) and G37 (30.13%). Among aliphatic alcohols (non-terpenoid), 1-hexanol was more pronounced in G9 (2.47%) and G29 (2.07%).
Marked descriptive differences in the hydrocarbon monoterpene fraction were observed among genotypes. The highest hydrocarbon monoterpene content was recorded in G37 (20.50%), followed by G15 (19.10%) and G36 (15.24%). The lowest total terpene content was found in G34 (7.74%). The main terpene component, α-Pinene, was prominent in all genotypes, with the highest values measured in G37 (15.74%) and G15 (15.58%). G34 exhibited the lowest α-Pinene level (5.50%).
In the esters group, total content ranged from 23.13% (G15) to 30.40% (G9). G9 was uniquely characterized by high Linalyl acetate (8.62%) and 1,6-Octadien-3-ol, 3,7-dimethyl-, formate (8.95%). Conversely, G29 and G37 showed elevated Ethyl Acetate levels (9.44% and 9.39%, respectively), while G36 accumulated high Linalyl acetate (8.95%). G15 and G34 displayed moderate ester profiles dominated by p-Mentha-1,8-dien-7-yl acetate.
Aldehydes were generally found in low concentrations, with the highest total aldehyde content detected in G9 (7.04%). Hexanal was the dominant aldehyde component, reaching its highest value in G9 (5.25%) and lowest in G36 (0.41%). Ketones remained below 2% in all genotypes, with G34 showing the highest level (1.69%). Other miscellaneous compounds collectively ranged from 0.24% (G37) to 5.32% (G34).
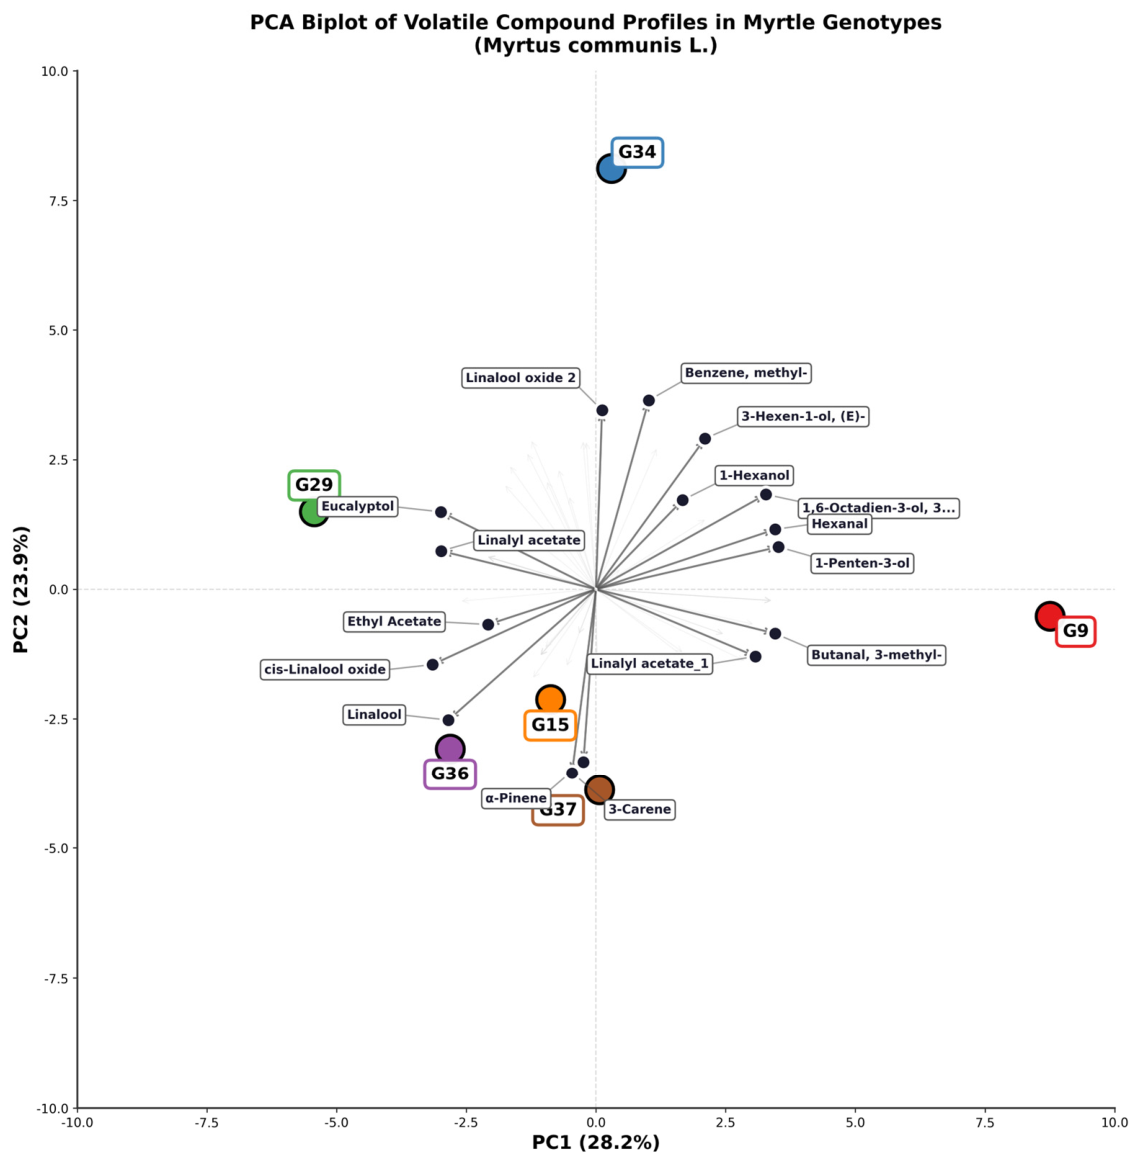
Principal Component Analysis (PCA) revealed distinct chemotypic differentiation among the six myrtle genotypes based on their volatile compound profiles (Figure 1). The first two principal components accounted for 52.1% of the total variance (PC1: 28.2%, PC2: 23.9%), with PC1 primarily separating genotypes according to their ester-aldehyde versus terpene content, and PC2 differentiating 1,8-cineole-rich from α-Pinene-rich chemotypes. G34 exhibited extreme positive loading on PC2, positioning it distinctly in the upper quadrants due to its exceptionally high 1,8-cineole content (40.3%), the highest among all genotypes. Conversely, G37 and G15 clustered in the negative PC2 region, characterized by elevated α-Pinene (15.7% and 15.6%, respectively) and total terpene concentrations. G9 displayed extreme positive loading on PC1, driven by its unique ester-dominant profile (30.4% total esters) and elevated Hexanal content (5.25%), clearly distinguishing it from the other genotypes. Notably, G29 and G36 occupied intermediate positions, with G29 showing moderate 1,8-cineole levels (38.5%) coupled with high Ethyl Acetate (9.4%), and G36 demonstrating balanced composition with notable Linalool accumulation (8.7%). The biplot loading vectors indicated that 1,8-cineole, α-Pinene, Linalool, and Ethyl Acetate were the primary discriminatory compounds responsible for genotype separation. These findings provide descriptive exploratory evidence for three potential chemotypic patterns within the studied population: (i) a 1,8-cineole-type pattern (G34, G36), (ii) an α-Pinene-type pattern (G37, G15), and (iii) an Ester-aldehyde type pattern (G9), with G29 representing a transitional phenotype. Given that these analyses were based on single measurements without replicate variance estimation, these groupings should be interpreted as preliminary descriptive patterns rather than statistically validated chemotype classifications. The apparent separation observed in the PCA biplot, supported by 52.1% cumulative variance explanation across the first two components, suggests substantial genetic diversity in volatile metabolism among these myrtle genotypes.
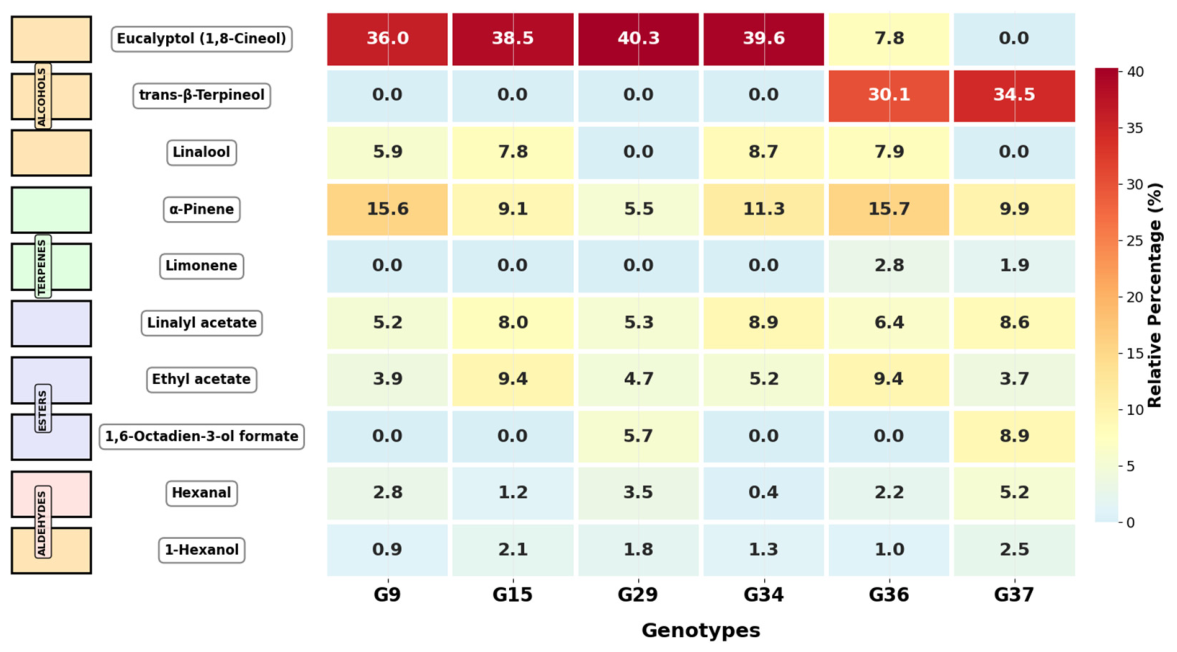
Hierarchical clustering and heatmap visualization of the volatile compound data provided detailed insights into the quantitative chemical diversity across the six myrtle genotypes (Figure 2). The analysis suggested pronounced variation in the relative abundance of key aroma-active compounds, with 1,8-cineole (eucalyptol) exhibiting the most dramatic inter-genotypic differences, ranging from complete absence in G9 to 40.3% in G34. Similarly, α-Pinene displayed a 2.9-fold variation (5.5% in G34 to 15.7% in G37), clearly demarcating terpene-rich chemotypes. The terpene group, dominated by 1,8-cineole (an oxygenated monoterpene ether), Linalool (a terpenol), and α-Pinene, constituted the primary chemical class across all genotypes, though with distinct compositional patterns—G36 uniquely accumulated Linalool (8.7%), while G9 and G37 showed elevated trans-β-Terpineol levels (34.5% and 30.1%, respectively).
Within the ester fraction, marked genotype-specific accumulation patterns emerged: G9 exclusively contained high Linalyl acetate (8.6%) and 1,6-Octadien-3-ol formate (8.9%), whereas G29 and G37 shared elevated Ethyl Acetate content (9.4% and 9.4%). The terpene profile was similarly distinctive, with G15 and G37 clustering together based on high α-Pinene, while G34 showed minimal terpene representation (7.7% total). Notably, the aldehyde Hexanal, an important contributor to fresh-green aroma notes, varied 12.8-fold among genotypes, with G9 presenting the highest concentration (5.2%). The color gradient patterns in the heatmap visually reinforce the PCA findings, confirming three preliminary chemical signatures: (i) the “cineole-type” characterized by dominant 1,8-cineole and minimal terpenes (G34), (ii) the “pinene-type” with balanced 1,8-cineole and high α-Pinene (G15, G37), and (iii) the “ester-aldehyde type” with negligible 1,8-cineole but distinctive ester profiles (G9). These quantitative differences in volatile composition not only underscore the substantial metabolic diversity within Myrtus communis but also suggest chemotypic differentiation potentially linked to habitat-specific metabolic optimization, as the 1,8-cineole-rich chemotypes (G34, G36) display enhanced antioxidant and membrane-stabilizing compound levels.

2.2. Sugar Contents

The sugar composition of fruit samples from six myrtle genotypes was determined by HPLC analysis. Sucrose was not detected in any of the examined genotypes. Glucose and fructose were identified as the predominant sugars, while xylose was found in trace amounts.
ANOVA indicated significant genotypic differences across all sugar parameters (p < 0.001, η2 > 0.99). Tukey HSD post hoc comparisons revealed that extremely significant differences among the six myrtle genotypes for all sugar parameters evaluated (Table 2). The F-values ranged from 304.76 for xylose to 1994.65 for total sugar content, all highly significant at p < 0.001. The effect sizes, expressed as partial eta squared (η2), exceeded 0.99 for all parameters, indicating that genotype accounted for more than 99% of the total variance in sugar composition. This demonstrates exceptionally strong genetic control over sugar metabolism in these selected genotypes. The consistency of high F-values across individual sugars and their sum suggests that selection for superior fruit characteristics has concurrently influenced carbohydrate accumulation patterns, with potential implications for fruit quality and primary metabolic diversification.
Glucose levels showed highly significant differences among genotypes (F = 991.528, df = 5.12, p < 0.001, η2 = 0.998), explaining 99.8% of the variance. The mean glucose content ranged from 3453.8 mg/100 mL (G29) to 5819.1 mg/100 mL (G15). G15 exhibited the highest glucose concentration (5819.1 mg/100 mL), statistically similar to G37 (5571.3 mg/100 mL). G29 showed the lowest glucose content, significantly differing from all other genotypes. G34 and G36 formed an intermediate group with comparable glucose levels, while G9 occupied a distinct middle position between these intermediate and high-glucose groups (Table 3).
Fructose demonstrated highly significant inter-genotypic variation (F = 1638.358, df = 5.12, p < 0.001, η2 = 0.999), accounting for 99.9% of total variance. Mean fructose concentrations ranged from 3602.1 mg/100 mL (G29) to 6588.7 mg/100 mL (G15). Fructose was the predominant sugar across all genotypes, consistently exceeding glucose concentrations. G15 exhibited the highest fructose content (6588.7 mg/100 mL), followed by G37 (6341.0 mg/100 mL), with these two genotypes forming a statistically distinct high-fructose cluster. G34 and G36 showed statistically similar intermediate levels (~4800 mg/100 mL), while G9 occupied a middle position (6087.6 mg/100 mL), significantly higher than the intermediate group but lower than the high-fructose cluster. G29 again displayed the lowest fructose content, significantly different from all other genotypes (p < 0.05).
Xylose, present in trace amounts, showed significant differences among genotypes (F = 304.758, df = 5.12, p < 0.001, η2 = 0.992). Mean xylose levels ranged from 3.2 mg/100 mL (G29) to 12.1 mg/100 mL (G37). G37 exhibited the highest xylose concentration (12.1 mg/100 mL), statistically comparable to G9 (10.9 mg/100 mL) and G15 (10.5 mg/100 mL), which formed a homogeneous high-xylose group. G34 (7.4 mg/100 mL) and G36 (5.6 mg/100 mL) constituted an intermediate cluster, while G29 maintained the lowest xylose level (3.2 mg/100 mL), significantly different from all other genotypes. Notably, G9 and G15 showed statistically comparable xylose contents despite their divergence in glucose and fructose profiles.
Total sugar content (glucose + fructose + xylose) exhibited extremely significant genotypic variation (F = 1994.648, df = 5.12, p < 0.001, η2 = 0.999), with genotype explaining 99.9% of variance. The mean total sugar concentration ranged from 7059.1 mg/100 mL (G29) to 12,418.3 mg/100 mL (G15). G15 demonstrated the highest total sugar content (12,418.3 mg/100 mL), statistically comparable to G37 (11,924.4 mg/100 mL). These two genotypes formed a distinct high-sugar cluster. G9 occupied a middle position (10,817.0 mg/100 mL), significantly lower than the high-sugar cluster but higher than the intermediate group comprising G34 (9050.9 mg/100 mL) and G36 (8733.3 mg/100 mL). G29 consistently showed the lowest sugar accumulation across all parameters, significantly differing from all other genotypes. The fructose/glucose ratio remained relatively stable across genotypes (ranging from 1.04 in G29 to 1.14 in G15), indicating consistent metabolic partitioning between these hexoses.

2.3. Organic Acids Content

The organic acid profile of the six myrtle genotypes was characterized by three major acids: citric acid, malic acid, and succinic acid. HPLC analysis revealed significant genotypic variation in organic acid composition and total acidity.
ANOVA indicated significant genotypic differences across all organic acid parameters (p < 0.001, η2 > 0.98). Tukey HSD post hoc comparisons revealed highly significant differences among the six myrtle genotypes for all organic acid parameters evaluated (Table 4). The F-values ranged from 21.50 for succinic acid to 51.61 for citric acid, all highly significant at p < 0.001. The effect sizes, expressed as partial eta squared (η2), ranged from 0.900 to 0.956, indicating that genotype accounted for 90–96% of the total variance in organic acid composition. This demonstrates exceptionally strong genetic control over organic acid metabolism in these selected genotypes. The particularly high η2 value for citric acid (0.956) suggests that genetic factors predominantly regulate this tricarboxylic acid cycle intermediate, potentially reflecting genotype-specific variation in respiratory metabolism and energy production pathways.
Citric acid content showed highly significant differences among genotypes (F = 51.607, df = 5.12, p < 0.001, η2 = 0.956), with genotype explaining 95.6% of total variance. Mean citric acid concentrations ranged from 188.0 mg/100 mL (G34) to 376.9 mg/100 mL (G37). G37 and G36 formed a high-citric acid cluster, statistically comparable to each other but significantly higher than all other genotypes (Table 5). G15, G9, and G29 constituted an intermediate group with similar citric acid levels (~250–270 mg/100 mL). G34 exhibited the lowest citric acid content, significantly differing from all other genotypes (p < 0.05).
Malic acid demonstrated highly significant inter-genotypic variation (F = 35.288, df = 5.12, p < 0.001, η2 = 0.936), accounting for 93.6% of variance. As seen in Table 5, mean malic acid levels ranged from 500.2 mg/100 mL (G34) to 867.0 mg/100 mL (G37). G37 exhibited the highest malic acid concentration, significantly exceeding G34 but statistically comparable to G9, G15, and G36. G9, G15, and G36 formed a homogeneous intermediate-high group (~785–804 mg/100 mL). G29 occupied a middle position (681.5 mg/100 mL), significantly higher than G34 but lower than the G37 peak. G34 consistently showed the lowest organic acid levels, with malic acid content 42% lower than the highest value.
Succinic acid showed significant differences among genotypes (F = 21.498, df = 5.12, p < 0.001, η2 = 0.900), explaining 90.0% of variance. Mean succinic acid concentrations ranged from 720.7 mg/100 mL (G9) to 902.6 mg/100 mL (G36) (Table 5). G36 exhibited the highest succinic acid content, statistically comparable to G37. G34, G15, and G29 clustered together in an intermediate group (~795–821 mg/100 mL). G9 showed the lowest succinic acid level, significantly differing from G36 but comparable to the intermediate cluster due to subset overlap.
Total organic acid content (sum of citric, malic, and succinic acids) given in Table 5 and exhibited highly significant genotypic variation (F = 39.108, df = 5.12, p < 0.001, η2 = 0.942), with genotype explaining 94.2% of variance. Mean total acidity ranged from 1509.1 mg/100 mL (G34) to 2111.4 mg/100 mL (G37). G37 and G36 formed a distinct high-acidity cluster (>2050 mg/100 mL), statistically comparable to each other. G15, G9, and G29 constituted an intermediate group (~1720–1870 mg/100 mL). G34 consistently exhibited the lowest total organic acid content, significantly differing from the high-acidity cluster but showing marginal statistical overlap with the intermediate group (p = 0.097).
Notably, malic acid was the predominant organic acid in most genotypes, contributing 45–50% of total acidity, though succinic acid exceeded malic acid in G15 (808.1 vs. 791.9 mg/100 mL), followed by succinic acid (35–42%) and citric acid (10–18%). The relative acid composition remained relatively stable, suggesting consistent metabolic pathways despite quantitative differences in total accumulation.

2.4. Hierarchical Clustering of Biochemical Profiles

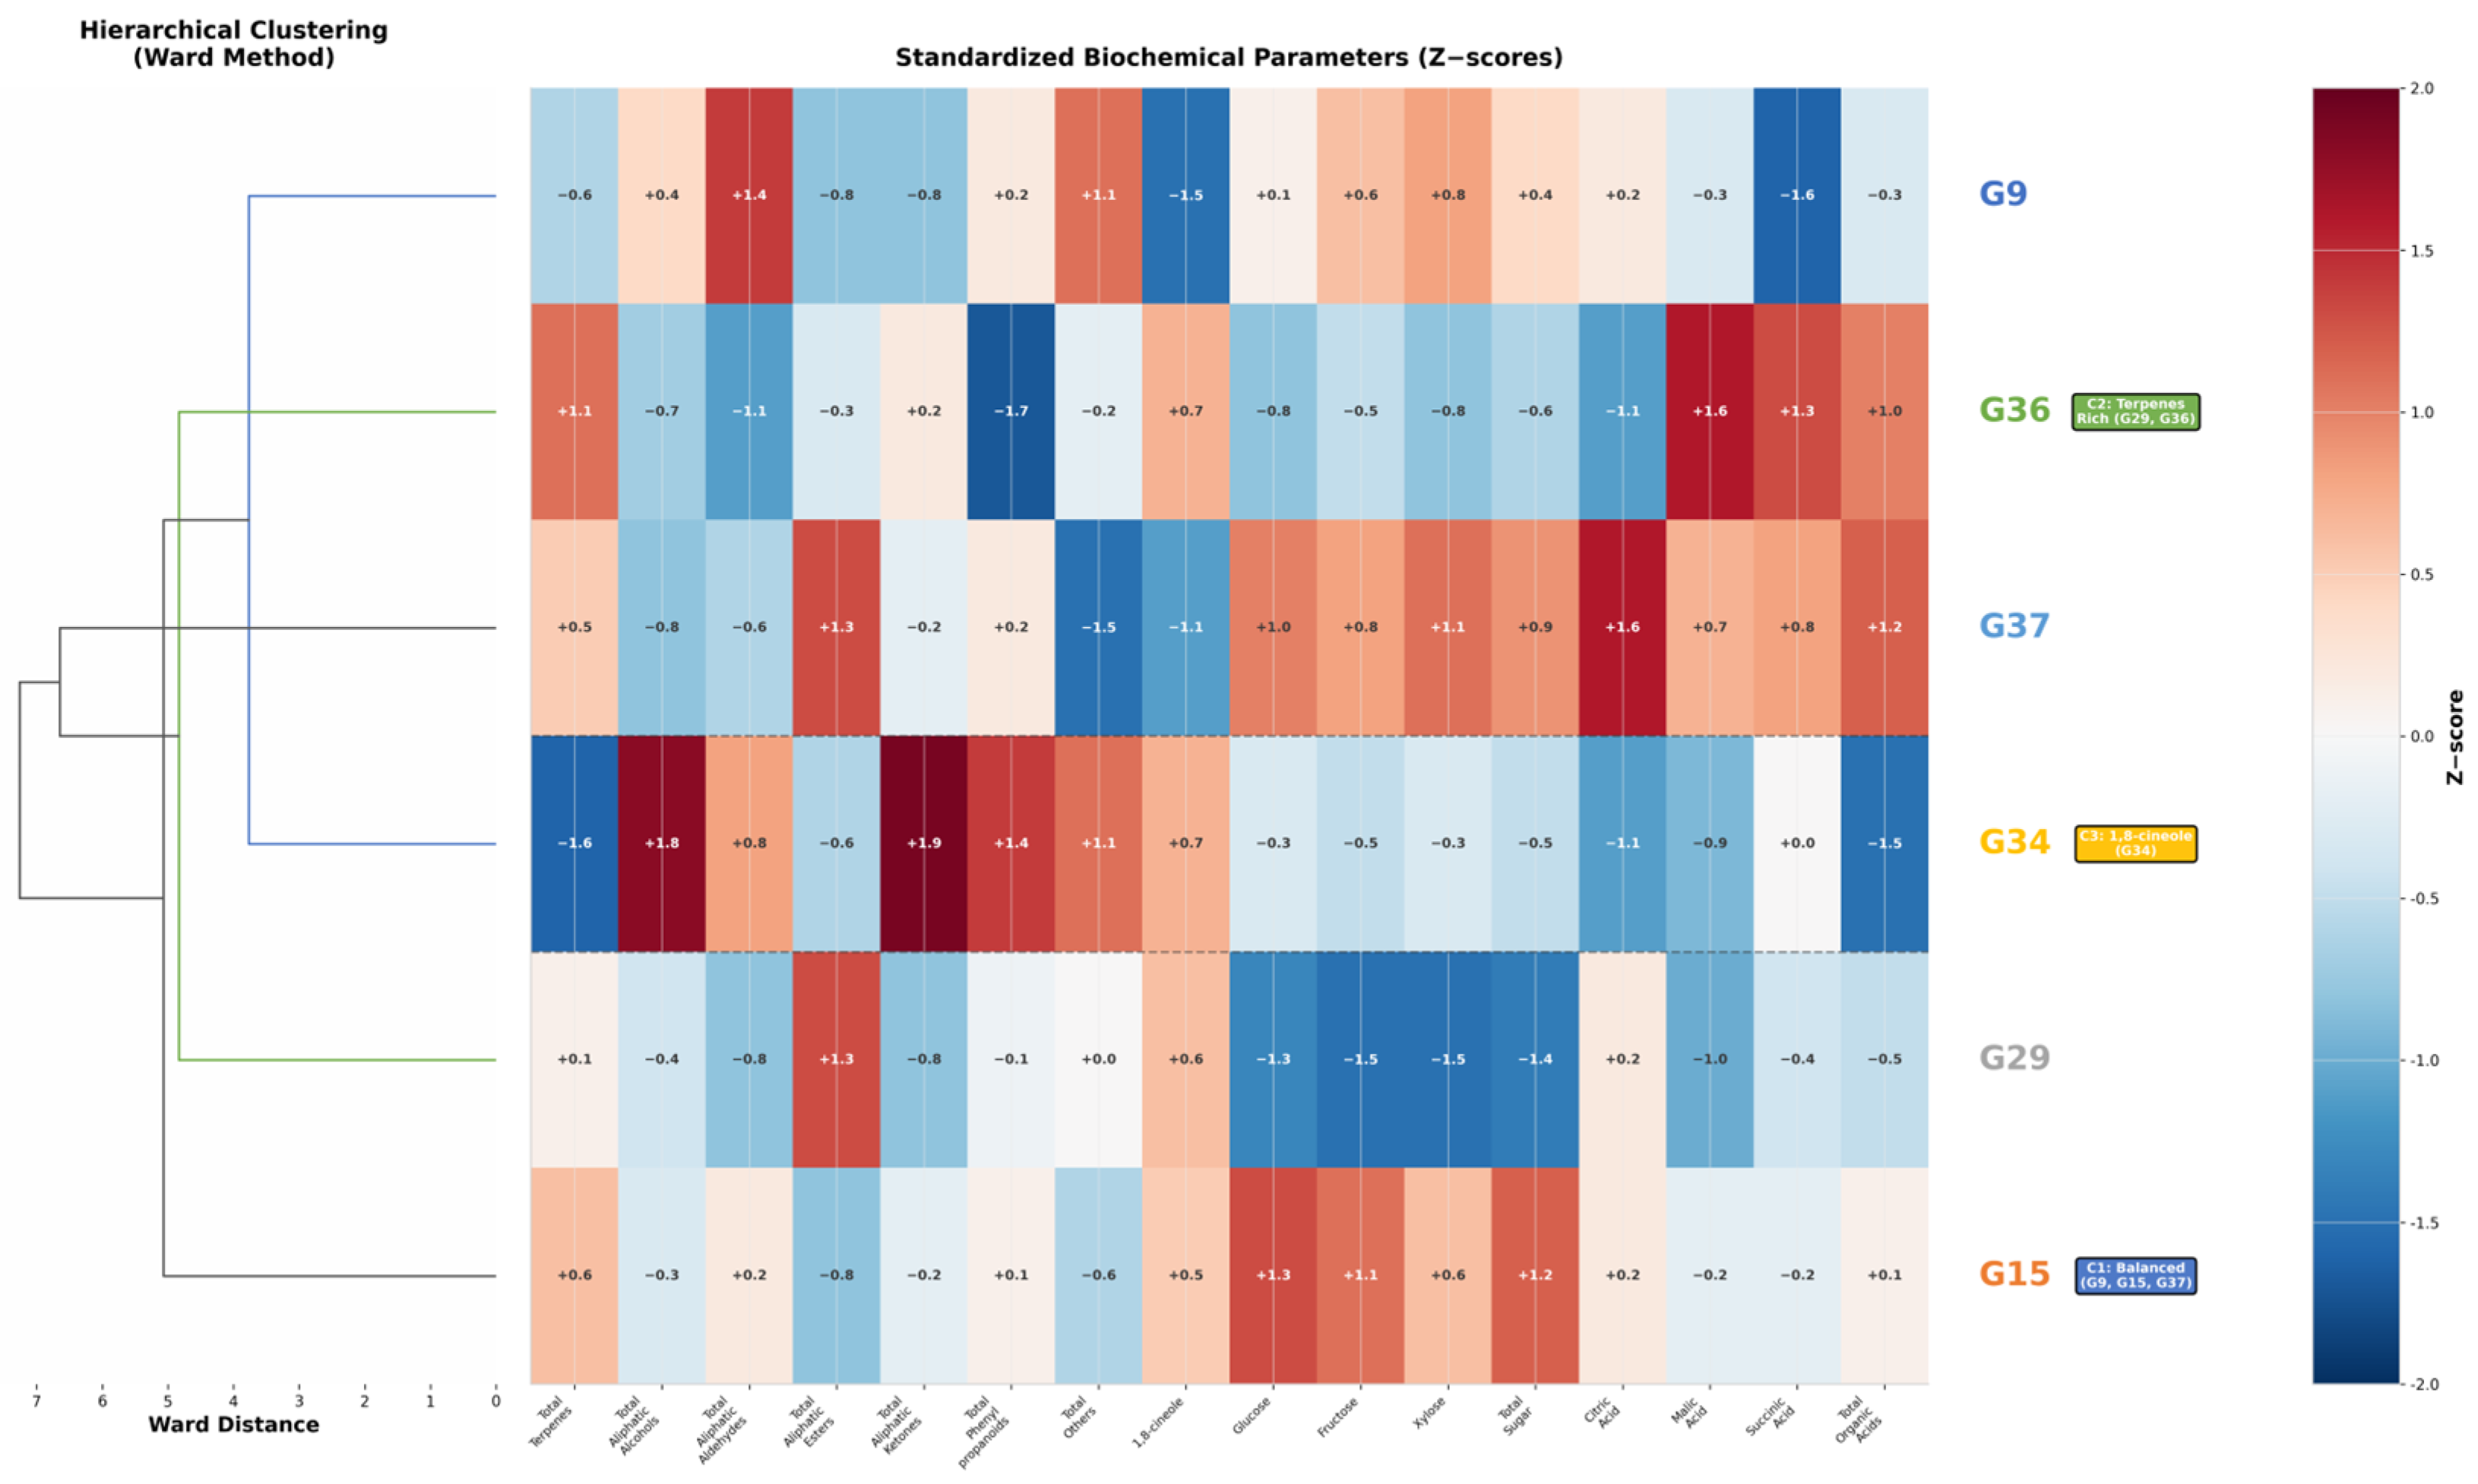
To elucidate the overall metabolic relationships among the six myrtle genotypes, hierarchical cluster analysis was performed using Ward’s minimum variance method on standardized biochemical parameters (16 parameters: 7 volatile compound groups, 1,8-cineole, 4 sugars, and 4 organic acids). The analysis revealed three distinct metabolic clusters (Figure 3), supporting the chemotypic differentiation previously identified in volatile profiles.
Cluster 1 (G9, G15, G37—“Balanced-Metabolism Type”): This cluster grouped genotypes with diverse but balanced metabolic portfolios. G9 exhibited negligible 1,8-cineole (0%) but dominant aldehyde (Z-score: +1.44, primarily Hexanal) and elevated aliphatic alcohol profiles, suggesting a stress-signaling phenotype. G15 showed the highest total sugar accumulation (+1.17) with moderate 1,8-cineole (+0.49), representing a genotype balancing primary metabolite storage with oxygenated monoterpene ether defense. G37 combined high ester content (+1.28) with elevated citric acid (+1.57) and total organic acids (+1.22), indicating a metabolic strategy prioritizing acid-mediated stress tolerance and osmotic adjustment alongside ester-rich volatile profiles.
Cluster 2 (G29, G36—“Terpenes-Rich Type”): This cluster comprised genotypes characterized by elevated total terpene content (G36: +1.14) and moderate 1,8-cineole levels (G29: +0.63, G36: +0.69). G29 uniquely exhibited high ester accumulation (+1.26) under low primary metabolite status (glucose: −1.27, fructose: −1.51, total sugars: −1.42), suggesting carbon partitioning toward volatile ester biosynthesis at the expense of sugar accumulation. G36, conversely, showed the highest malic acid (+1.62) and succinic acid (+1.33) levels among all genotypes, representing a transitional phenotype that combines terpene-focused chemical defense with enhanced organic acid metabolism.
Cluster 3 (G34 “1,8-cineole-Dominant Type”): This unique genotype formed a separate singleton cluster, characterized by the highest 1,8-cineole content (40.3%) but paradoxically low total terpenes (−1.64) due to minimal hydrocarbon monoterpene contribution. This genotype exhibited extreme elevation in aliphatic ketones (+1.88), phenylpropanoids (+1.38), aliphatic alcohols (+1.83), and “Other Compounds” (+1.13), coupled with severely reduced organic acid metabolism (citric: −1.13, total acids: −1.48). This unique profile suggests a highly specialized metabolic phenotype where carbon flux is predominantly channeled into oxygenated monoterpene ether (1,8-cineole) and diverse aliphatic secondary metabolites, potentially at the expense of primary metabolic pathways.
The hierarchical clustering results confirm substantial metabolic diversification among myrtle genotypes, with each cluster representing distinct biochemical strategies reflecting alternative metabolic adaptations.

3. Discussion

3.1. Chemotypic Diversity and Volatile Compound Profiles in Myrtle Genotypes from Mediterranean Habitats

The present study revealed substantial chemotypic diversity among six Myrtus communis L. genotypes selected from natural populations in Antalya, Turkey.
Descriptive analysis of volatile profiles suggested three potential chemotypic patterns—1,8-cineole-type (G34, G36), α-Pinene-type (G37, G15), and Ester-aldehyde type (G9) —which are consistent with previous reports documenting significant chemical variability in myrtle populations across the Mediterranean basin and within Turkey. Notably, G29 exhibited intermediate characteristics between the 1,8-cineole and α-Pinene types, with high 1,8-cineole (38.5%) co-occurring with elevated α-pinene (12.1%), suggesting a transitional chemotypic profile. It should be noted, however, that these patterns are based on single measurements and should be regarded as preliminary groupings requiring validation through replicate analyses. The hierarchical clustering analysis, based on the new 7-group volatile classification, further substantiated these chemotypic patterns by identifying three distinct metabolic clusters: the Balanced-Metabolism type (G9, G15, G37), the Terpenes-Rich type (G29, G36), and the 1,8-cineole-Dominant type (G34) (Figure 3, Table 6).
Şan et al. reported that Turkish myrtle (Mersin) genotypes show significant variation in volatile compounds depending on genotype, ecology, and harvest time, with α-pinene, 1,8-cineole, myrtenyl acetate, linalool, and α-terpineol being the major components in both leaves and berries [26]. They noted that myrtenyl acetate is higher in white-berried types, while α-pinene, linalool, and α-terpineol are more abundant in black-berried types. Our study focused on berries from white-fruited genotypes selected for white fruit color and enhanced fruit characteristics, and consistent with these findings, we observed high α-pinene in G37 (15.7%) and G15 (15.6%), with complete absence of myrtenyl acetate across all genotypes.
Yaşa et al. characterized fixed oils from myrtle fruits collected from three different Turkish provinces (Bursa, İzmir, Isparta), reporting significant variation in oil yields (3.26–5.43%) and fatty acid profiles [25]. They identified linoleic acid (68.96–73.97%), oleic acid (12.04–16.60%), and palmitic acid (8.51–8.86%) as major components, with terpene content varying from 0.43% to 2.88% across regions. Notably, they detected α-pinene (0.06–0.83%), 1,8-cineole (0.26–0.99%), and limonene (0.03–0.41%) in the fixed oil fraction, demonstrating that volatile terpenes are present not only in essential oils but also in lipid fractions. Our study complements these findings by showing that volatile profiles in Antalya genotypes are dominated by oxygenated monoterpenes (1,8-cineole up to 40.3%) rather than hydrocarbon terpenes, suggesting that selection from Mediterranean environments may favor oxygenated terpene accumulation.
Tuberoso et al. reported strong chemical variability in Sardinian myrtle essential oils, with α-pinene (30.0% in leaves, 28.5% in berries) and 1,8-cineole (28.8% in leaves, 15.3% in berries) as major constituents [22]. Similarly, our study identified α-pinene and 1,8-cineole as primary discriminatory compounds, though with notable quantitative differences. Barboni et al. conducted comprehensive analyses of Corsican myrtle berries from ten localities and reported a characteristic chemotype dominated by α-pinene (45.3–48.2%) and 1,8-cineole (25.0–27.3%), with remarkable chemical uniformity across different geographical locations within Corsica [23]. This contrasts sharply with our findings of extreme chemotypic variation among Antalya genotypes, where 1,8-cineole content ranged from 0% (G9) to 40.3% (G34), and α-pinene varied from 5.5% (G34) to 15.7% (G37).
The Corsican chemotype, characterized by the absence of myrtenyl acetate and lower limonene content compared to Sardinian populations, represents a distinct geographical variant. Our Turkish genotypes similarly lacked myrtenyl acetate, consistent with observations by Serreli et al., who noted the absence of this compound in white myrtle berry liqueurs despite its presence in aerial parts of M. communis var. leucocarpa DC [24]. The absence of myrtenyl acetate in our Antalya genotypes, despite their white berry color, suggests that this trait may be more complex than previously thought, involving genetic factors beyond simple color polymorphism.
Şan et al. reported that maximum essential oil content in myrtle berries is reached 60 days after full flowering, followed by a slight decrease with maturity, and that α-pinene, terpinen-4-ol, geranyl acetate, and β-caryophyllene reach highest levels 30 days after flowering [26]. They also noted that leaf myrtenyl acetate content is highest in February–March, while 1,8-cineole and linalool peak in August. Our samples were collected at full maturity, which may explain the high 1,8-cineole but relatively moderate α-pinene levels compared to peak values reported in the literature.
Serreli et al. reported that the headspace of white myrtle berry liqueur contained 1,8-cineole (26.5%) and linalool (23.3%) as major compounds, with significant differences between headspace solid-phase microextraction (HS-SPME) and liquid-liquid extraction (LLE) profiles [24]. This suggests that Turkish genotypes may represent a distinct “high-cineole” chemotype with potential industrial significance for liqueur production and essential oil extraction.
The 1,8-cineole-rich chemotype (G34, G36) observed in our study is particularly noteworthy given the documented biological activities of this monoterpene ether. Shoshtari et al. demonstrated that 1,8-cineole content in myrtle leaves varied from 7.42% under high salinity stress to 15.45% under low salinity conditions [27]. However, our genotypes maintained exceptionally high 1,8-cineole levels (35–40%) despite natural selection under Mediterranean climatic pressure, indicating genetic fixation of this trait. This finding is consistent with the hypothesis that 1,8-cineole-rich chemotypes may represent a metabolic specialization under Mediterranean environmental conditions, potentially contributing to membrane stabilization and antioxidant protection under seasonal water deficit.
The α-Pinene-type chemotype (G37, G15), characterized by elevated α-pinene (15.6–15.7%) and hydrocarbon monoterpene content (19.1–20.5%), corresponds to the Balanced-Metabolism Type (Cluster 1). This chemotype partially aligns with the Corsican chemotype described by Barboni et al., though our genotypes showed lower α-pinene levels (15.6% vs. 45–48%) but higher co-occurring sugars [23]. The co-occurrence of high terpene content with elevated primary metabolites in these genotypes suggests a coordinated metabolic strategy combining osmotic adjustment through sugar accumulation with constitutive chemical defense via terpene biosynthesis.
The unique Ester-aldehyde chemotype represented by G9, characterized by negligible 1,8-cineole (0%) but dominant ester (30.4%) and aldehyde (7.04%) profiles, represents a distinct metabolic phenotype. Barboni et al. observed quantitative variations in volatile compositions between myrtle liqueur and eau-de-vie, with α-pinene increasing from 31.9% in berries to 60.0% in eau-de-vie, while 1,8-cineole decreased from 29.0% to 13.5% [23]. Similarly, Tuberoso et al. identified fatty acid ethyl esters (ethyl palmitate, ethyl linoleate, ethyl linolenate) as characteristic components of myrtle hydroalcoholic extracts [22]. However, the high levels of Linalyl acetate (8.62%) and 1,6-Octadien-3-ol formate (8.95%) in G9, combined with elevated Hexanal (5.25%), suggest a specialized metabolic pathway potentially linked to specific microhabitat adaptations or altered lipid metabolism in their native Mediterranean habitats.
The striking divergence in 1,8-cineole (0–40.3%) and α-pinene (5.5–15.7%) accumulation among genotypes suggests differential flux through the plastidial methylerythritol phosphate (MEP) and cytosolic mevalonate (MVA) pathways. In the MEP pathway—which supplies precursors for monoterpene biosynthesis in plastids—the first committed step catalyzed by 1-deoxy-D-xylulose-5-phosphate synthase (DXS) and the subsequent reduction by DXS reductase (DXR) are known rate-limiting nodes. The co-dominance of 1,8-cineole and α-pinene in G15 and G37 may reflect elevated DXS/DXR expression or enhanced geranyl diphosphate synthase (GPPS) activity, channeling isoprenoid precursors toward monoterpene synthases (TPS).
Conversely, the near-complete absence of 1,8-cineole in G9 (0%) suggests either downregulation of the MEP pathway in favor of cytosolic MVA-derived sesquiterpene/ester flux, or a mutation/allelic variant in the 1,8-cineole synthase gene (McCinS1), as hypothesized for chemotypic variants in other Lamiaceae species.
These hypotheses require validation through transcriptomic profiling of DXS, DXR, GPPS, FPPS, and TPS gene families, which is beyond the scope of this descriptive metabolomic study but represents a priority for future functional genomics work.

3.2. Primary Metabolite Accumulation and Metabolic Diversification Patterns

The sugar and organic acid profiles revealed significant metabolic diversification among the six genotypes, highlighting substantial variation in fruit quality parameters and primary metabolic pathways relevant to end-use applications. It should be noted that sugar and organic acid concentrations are expressed per 100 mL of aqueous extract rather than per gram fresh weight, owing to the small fruit size and high seed content which rendered direct juice extraction impractical. While this precludes direct quantitative comparison with literature values commonly reported on a fresh-weight or dry-weight basis, the relative genotypic differences and statistical rankings remain internally valid and reproducible within this standardized extraction protocol. The absence of sucrose across all genotypes and the predominance of glucose and fructose as reducing sugars align with the findings of Fadda and Mulas, who reported that myrtle berries accumulate non-reducing sugars instead of starch during maturation, suggesting a non-climacteric fruit physiology [28]. In their study of ‘Barbara’ and ‘Daniela’ cultivars, total sugar content increased from 1.41–1.43% at fruit set to 7.56–8.28% at maturation.
However, the extreme variation in total sugar content among our genotypes—ranging from 7059.1 mg/100 mL (G29) to 12,418.3 mg/100 mL (G15)—exceeds the cultivar differences reported by Fadda and Mulas, suggesting that genetic selection has significantly altered carbohydrate metabolism [28]. Mulas et al. studied the effect of maturation and cold storage on organic acid composition in myrtle fruits, reporting that reducing sugars increased during maturation up to 77.8 g kg−1 in ‘Barbara’ and 40.9 g kg−1 in ‘Daniela’, with total sugars ranging from 14.8 to 144.7 g kg−1 depending on harvest time and storage conditions [29]. Our high-sugar genotypes (G15, G37) achieved total sugar levels (124.2 and 119.2 g kg−1, respectively) comparable to the maximum values reported by Mulas et al. for cold-stored fruits, suggesting enhanced carbohydrate accumulation capacity under selection pressure [29].
The three metabolic clusters identified in this study—Balanced-Metabolism (Cluster 1: G9, G15, G37), Terpenes-Rich (Cluster 2: G29, G36), and 1,8-cineole-Dominant (Cluster 3: G34)—reveal divergent carbon partitioning strategies between primary and secondary metabolism. Cluster 1 genotypes maintained relatively balanced sugar and organic acid profiles, with G15 achieving the highest total sugar content (12,418 mg/100 mL) and G37 showing the highest organic acid accumulation (2111 mg/100 mL). This cluster represents genotypes with optimized primary metabolic capacity suitable for direct consumption and processing applications. Cluster 2 genotypes (G29, G36) showed contrasting patterns: G29 exhibited exceptionally low sugar content (7059 mg/100 mL) alongside moderate 1,8-cineole levels (38.5%), while G36 combined high terpene content (86.5%) with elevated malic and succinic acids. These genotypes appear to prioritize volatile defense compound biosynthesis over carbohydrate storage. Cluster 3 (G34) displayed the most extreme metabolic specialization: despite producing the highest 1,8-cineole content (40.3%), this genotype showed the lowest total terpene percentage (71.6%) and severely reduced organic acid metabolism (1509 mg/100 mL total). This phenotype suggests that the exceptional carbon demand for 1,8-cineole biosynthesis may divert resources from both hydrocarbon monoterpene and primary acid metabolism.
Yılmaz investigated chemical and antioxidative properties of Myrtus communis L. fruits from Mersin province at three different maturity stages, using extractable, hydrolyzable, and bioaccessible fractions with in vitro enzymatic extraction simulating gastrointestinal conditions [30]. This approach is particularly relevant for understanding the nutritional value of our high-sugar genotypes (G15, G37), as the bioaccessibility of phenolic compounds and antioxidants determines their actual health benefits. Future research should apply similar bioaccessibility analyses to our genotypes to assess their functional food potential.
The organic acid profile in our study, dominated by malic acid (45–50% of total acidity) followed by succinic acid (35–42%) and citric acid (10–18%), partially diverges from previous reports. Mulas et al. identified quinic, malic, and gluconic acids as the major organic acids in Sardinian myrtle cultivars, with malic acid peaking at 3 g kg−1 and decreasing during maturation [29]. Our genotypes showed malic acid levels ranging from 500.2 mg/100 mL (5 g kg−1) to 867.0 mg/100 mL (8.7 g kg−1), substantially higher than those reported for Sardinian cultivars. Notably, G34 exhibited the lowest malic acid content and moderate total acidity across all parameters, combined with its 1,8-cineole-rich volatile profile, suggesting a metabolic trade-off where resources are diverted from primary acid metabolism to volatile terpene production.
Chidouh et al. characterized water-soluble polysaccharide fractions from Algerian myrtle fruit, reporting that the ethanol precipitate contained 12.3% neutral sugars and 28.8% uronic acids, with arabinose (5%) and galactose (3%) as major neutral sugars [31]. They noted high levels of free glucose (65–70%) in ethanol-soluble fractions, which aligns with our finding of glucose as a predominant reducing sugar across all genotypes. The presence of xylose in trace amounts in our HPLC analysis (3.2–12.1 mg/100 mL) corresponds to the xylose content (0.1%) reported by Chidouh et al. in the ethanol precipitate, suggesting conserved carbohydrate profiles across Mediterranean myrtle populations despite quantitative variation [31].
The absence of quinic and gluconic acids—reported by Mulas et al. as major organic acids in Sardinian myrtle—in our Turkish genotypes indicates significant geographical variation in organic acid metabolism [29]. Mulas et al. suggested that gluconic acid accumulation could serve as a marker of fruit senescence, while quinic acid decrease coincided with anthocyanin accumulation [29]. Our finding of citric and succinic acids as co-dominant with malic acid suggests different metabolic flux patterns in Turkish genotypes, potentially reflecting adaptation to different environmental stress regimes. The high genetic control over citric acid variation (η2 = 0.956) in our study suggests that this parameter may serve as a reliable marker for genotype differentiation in germplasm evaluation, particularly given its role as a tricarboxylic acid cycle intermediate and potential involvement in stress signaling.
Yaşa et al. emphasized that genetic characteristics, climate, temperature, geographical location, and soil properties affect fatty acid composition in myrtle fruits [25]. They reported that unsaturated fatty acids constituted 85.66–87.57% of total fatty acids across three Turkish regions, with linoleic acid showing anti-inflammatory, cardioprotective, and antioxidant properties. While our study focused on water-soluble metabolites rather than fixed oils, the metabolic diversity we observed in sugars and organic acids parallels the regional variation in fatty acid profiles, underscoring the importance of comprehensive phytochemical characterization for selecting superior genotypes.
The substantial variation in total sugar (7059–12,418 mg/100 mL) and organic acid (1509–2111 mg/100 mL) accumulation suggests differential carbon partitioning between glycolysis, the tricarboxylic acid (TCA) cycle, and osmolyte storage. In high-sugar genotypes (G15, G37), elevated glucose (+1.40, +1.02) and fructose (+1.16, +1.02) with concurrent high malic acid (+1.07, +0.84) may indicate enhanced phosphoenolpyruvate carboxylase (PEPC) activity and malate valve operation, shunting carbon skeletons toward malic acid accumulation while maintaining high soluble sugar pools for osmotic adjustment. Conversely, in low-sugar/high-volatile genotypes (G29, G34), reduced carbon flux through glycolysis may reflect substrate competition, wherein phosphoenolpyruvate (PEP) is diverted toward the shikimate pathway (aromatic amino acid precursors for volatile phenylpropanoids) or the MEP pathway (monoterpene precursors) at the expense of hexose accumulation. The elevated succinic acid in G36 (+1.46) and G37 (+0.84) may indicate partial TCA cycle bypassing (γ-aminobutyric acid shunt) under cellular redox balancing, though this requires enzymatic confirmation [15].

3.3. Metabolic Trade-Offs and Integrated Biochemical Strategies

The hierarchical clustering analysis, based on the new 7-group volatile classification, identified three distinct metabolic clusters that reflect alternative resource allocation strategies among the six genotypes (Figure 3, Table 6). Cluster 3 (G34), the 1,8-cineole-dominant singleton, and Cluster 2 (G29, G36), the Terpenes-Rich cluster, both prioritize volatile compound biosynthesis but through different compositional strategies. The high 1,8-cineole levels in Cluster 3 (40.3%) and Cluster 2 (38.5% in G29, 39.6% in G36) may contribute to antioxidant capacity, consistent with the reported antioxidant properties of 1,8-cineole-rich essential oils. Tuberoso and Orrù reviewed the phytochemical profile of myrtle berries, noting that myricetin and gallic acid derivatives are the most efficient molecules in inhibiting free radical and lipid peroxidation [32]. While our study focused on volatile compounds rather than phenolics, the elevated 1,8-cineole in these clusters may similarly contribute to oxidative stress mitigation.
Şan et al. reported that myrtle essential oils possess significant anti-diabetic properties, highlighting the importance of this fruit in both nutrition and alternative medicine [26]. Serreli et al. reported that white myrtle berry liqueur exhibited better antioxidant capacities than purple myrtle berry liqueur despite lower total phenolic content, potentially due to high concentrations of gallic acid and its derivatives [24]. They identified 1,8-cineole as the most abundant terpene (26.5% in HS-SPME). Our Cluster 3 (G34, 40.3%) and Cluster 2 (G36, 39.6%) genotypes showed even higher cineole content, suggesting superior potential for antioxidant applications compared to previously reported myrtle products.
Cluster 1 (G9, G15, G37), the Balanced-Metabolism Type, demonstrates a fundamentally different strategy. Within this cluster, G15 and G37 showed coordinated accumulation of osmoticum (sugars) and defense compounds, suggesting a dual strategy of physiological maintenance and chemical protection. Barboni et al. noted that volatile constituents were more abundant in myrtle commercial liqueur than in corresponding eau-de-vie, attributing this to manufacturing techniques and extraction efficiency [23]. Our high-sugar Cluster 1 genotypes (G15, G37) may provide optimal biomass for liqueur production, combining sufficient sugar substrate for fermentation with elevated terpene content for aromatic quality. Yaşa et al. noted that Bursa samples showed the highest fixed oil yield (5.43%) and linoleic acid content (73.97%), suggesting that high primary metabolite accumulation may co-occur with high lipid content, making these genotypes particularly valuable for industrial applications [25].
Within Cluster 1, G9 represents a specialized aldehyde-ester phenotype distinct from its cluster mates. Tuberoso et al. noted that ethyl esters in myrtle extracts slowly increase during maceration, potentially through enzymatic esterification [22]. The high natural ester content in G9 may indicate enhanced lipolytic activity or altered esterase function, potentially linked to membrane remodeling processes in this genotype. Hexanal, a product of 13-lipoxygenase pathway activity and a marker of lipid peroxidation, reached 5.25% in G9—12.8-fold higher than in G36—suggesting either enhanced oxidative metabolism or altered membrane turnover.
The metabolic trade-offs evident in our data—particularly the divergence between the 1,8-cineole-dominant Cluster 3 (G34), the Terpenes-Rich Cluster 2 (G29, G36), and the Balanced-Metabolism Cluster 1 (G9, G15, G37)—support the hypothesis that myrtle involves multiple alternative metabolic strategies. This finding has significant implications for germplasm evaluation: the 1,8-cineole-dominant genotype G34 (Cluster 3) may be preferred for essential oil extraction and pharmaceutical applications given the documented antimicrobial and anti-inflammatory properties of 1,8-cineole [24]; the Terpenes-Rich genotypes G29 and G36 (Cluster 2), combining elevated total terpenes with divergent acid profiles, may serve dual purposes for both volatile extraction and acid-based processing; the high-sugar genotypes G15 and G37 (Cluster 1) may be more suitable for liqueur production and direct consumption, potentially offering enhanced bioaccessibility of nutrients as suggested by Yılmaz’s work on in vitro digestion [30]; and the unique G9 (Cluster 1, aldehyde-ester component) may offer specialized aromatic properties for niche markets.

3.4. Implications for Myrtle Domestication and Functional Food Development

The substantial genetic diversity documented in our myrtle genotypes, despite their shared selection history, underscores the potential for germplasm evaluation and domestication. Tuberoso and Orrù highlighted that myrtle berry extracts prepared with different polarity solvents showed varying antioxidant activities, with ethanol and ethyl acetate extracts exhibiting the strongest antiradical and antioxidant activities [32]. They suggested that myrtle berries could be used in dietary supplement preparations or as food additives due to their protective effects against cholesterol degradation and LDL oxidation. The unique Ester-Aldehyde chemotype of G9, characterized by negligible 1,8-cineole (0%) but dominant ester (30.4%) and aldehyde (7.04%) profiles, suggests a fundamental metabolic switch from terpenoid to lipid-derived volatile biosynthesis. In plants, C6 aldehydes (e.g., hexanal) and alcohols are predominantly generated via the lipoxygenase (LOX)–hydroperoxide lyase (HPL) pathway from membrane lipid oxidation, while ethyl esters (e.g., ethyl acetate) arise from acyl-CoA-dependent esterification catalyzed by alcohol acyltransferases (AATs). The exceptionally high ester content in G9 (Z-score: +1.94) may reflect: (i) elevated phospholipase A1/A2 activity releasing free fatty acids (C16:0, C18:1, C18:2) from membrane phospholipids; (ii) enhanced LOX-mediated hydroperoxidation of linoleic/linolenic acid; and (iii) upregulation of HPL and AAT gene expression channeling lipid catabolites toward ester accumulation rather than terpenoid synthesis. This ‘lipid-terpenoid switch’ hypothesis is consistent with the observed negative correlation between total esters and 1,8-cineole across genotypes (r ≈ −0.82), suggesting substrate competition between the plastidial MEP pathway and cytosolic lipid catabolism for carbon skeletons. Transcriptomic and lipidomic profiling would be required to confirm this mechanism.
Yaşa et al. concluded that Myrtus communis L. fruit, with its rich phytochemical content and high nutritional value, can be used in food, medicine, and various other fields [25]. Our findings extend this potential by demonstrating that specific genotypes within Turkish germplasm offer distinct metabolic profiles suitable for different applications. The high sugar content in G15 and G37 (12.4% and 11.9% total sugar, respectively) approaches levels suitable for direct consumption or minimal processing, while their elevated organic acid content provides the acidic environment necessary for anthocyanin stability noted by Tuberoso et al. [22].
Şan et al. emphasized that myrtle has wide application areas as both an additive and in alternative medicine, particularly for respiratory infections, diarrhea, hemorrhoids, and as an anti-inflammatory agent [26]. Our chemotypic analysis provides a scientific basis for selecting specific genotypes for these traditional uses: 1,8-cineole-rich genotypes (G34, G36) may be preferred for respiratory applications given the established bronchodilatory effects of 1,8-cineole; high-sugar/high-acid genotypes (G15, G37) may be more suitable for gastrointestinal applications where organic acids play a therapeutic role; and the unique G9 chemotype with its high ester content may offer novel antimicrobial properties through its distinct volatile profile.
Chidouh et al. demonstrated that myrtle fruit polysaccharides contain significant uronic acids (28.8%) and neutral sugars (12.3%), with potential applications as food hydrocolloids [31]. The variation in sugar profiles among our genotypes, particularly the high glucose and fructose content in G15 and G37, may influence the yield and composition of polysaccharide extracts, warranting further investigation into genotype-specific processing technologies. The presence of xylose in all our genotypes, though in trace amounts, suggests potential for arabinoxylan-type polysaccharide extraction, which has not been previously explored in Turkish myrtle germplasm.
The absence of myrtenyl acetate in our genotypes, consistent with findings of Tuberoso et al. for Sardinian myrtle and Barboni et al. for Corsican populations, distinguishes these Turkish accessions from other Mediterranean populations [22,23]. Serreli et al. raised important questions regarding the botanical classification of white-berried myrtle varieties, suggesting that morphological and genetic investigation is needed [24]. Our chemotypic analysis contributes to this discourse by demonstrating that Turkish genotypes represent a distinct genetic resource, potentially warranting separate taxonomic or varietal status. The classification of myrtle genotypes based on berry color (white vs. black) may be insufficient, as our white-berried genotypes showed chemotypic diversity exceeding that reported between color variants in other studies.


4. Materials and Methods

4.1. Plant Material

In this study, six myrtle (Myrtus communis L.) genotypes (G9, G15, G29, G34, G36, and G37) were used. These genotypes represent elite selections from a broader screening of 68 myrtle accessions (35 white-fruited and 33 black-fruited) collected from natural populations in Antalya and Muğla provinces, Turkey, and evaluated using weighted scoring for pomological and biochemical traits (fruit weight, seed characteristics, SSC, sensory attributes, tannin content, and antioxidant activity) under Project No. TA-GEM/TBAD/B/19/A7/P6/970 [33,34]. The six white-fruited genotypes scoring highest (≥545 points) were selected for this metabolic characterization study. The collection sites, altitudes, and habitat characteristics of the parental accessions are summarized in Table 7. Pomological characteristics of the selected genotypes are presented in Table 8.
All six genotypes were subsequently propagated vegetatively (by cuttings) and established in a common collection garden at the Mediterranean Agricultural Research Institute (BATEM) research station in 2021. Under common-garden conditions, all plants were maintained with standardized cultural practices, including drip irrigation, annual pruning, and uniform fertilization, ensuring identical environmental conditions (soil type, water availability, microclimate) across all genotypes during the experimental period. Fruits for this metabolic characterization were harvested from these common-garden plants. While Table 7 records the original provenance of the parental accessions, the metabolic analysis was performed on fruits produced under standardized, common-garden conditions, thereby minimizing confounding environmental effects [33].
Harvest timing was determined by monitoring soluble solids content (SSC) using a handheld refractometer (Krüss, Hamburg, Germany). Fruits were collected at random from different orientations of each tree at daily intervals after natural fruit drop initiation. Based on Angioni et al. [35], who reported optimal harvest at ~21.4% SSC for Sardinian myrtle, fruits reaching approximately 22% SSC were considered at full maturity and harvested during December–January. Following collection, samples were immediately frozen at −20 °C and stored at this temperature until analysis.

4.2. Sample Preparation and Storage

The fruit samples were stored at −20 °C until the analyses were carried out. During the analysis stage, only the required quantities of samples were removed from the freezer for processing; to preserve the structural and chemical integrity of the samples, as well as to ensure extraction efficiency and the reproducibility of results, repeated freeze–thaw cycles were avoided. Prior to extraction, the fruits were homogenised using a homogeniser to produce a homogeneous purée. A portion of the resulting material was left in its pure state for direct analysis (volatile compound analysis), whilst the remainder was subjected to aqueous extraction. For the aqueous extraction, 1 g of the homogenate was mixed with 4 mL of ultrapure water (Millipore Corp., Bedford, MA, USA). The mixtures were placed in an ultrasonic bath and sonicated at 80 °C for 15 min. The mixtures were then centrifuged at +4 °C and 5500 rpm for 20 min to facilitate phase separation. The resulting supernatants were filtered through 0.45 µm nylon syringe filters (Whatman, Maidstone, UK; 13 mm diameter)) and transferred to HPLC vials to prepare them for biochemical analyses, such as the determination of sugars and organic acids.

4.3. Analysis of Volatile Compounds Using HS-SPME/GC-MS

Volatile compounds were extracted from fruit pulp using headspace solid-phase microextraction (HS-SPME). For extraction, 1 g of the sample homogenate was weighed, and 1 mL of CaCl2 was added, followed by incubation at 40 °C for 30 min. For the extraction of volatile compounds, an SPME Assy 75 µm Car/PDMS FS 23Ga Auto (Black), 3/PAK (Supelco, Bellefonte, PA, USA) was used. The aroma compounds adsorbed from the fruit pulp were analyzed using a Shimadzu GC-2010 Plus Gas Chromatography-Mass Spectrometry (GC/MS) system (Shimadzu, Kyoto, Japan). An Agilent HP-Innowax column (Agilent, Santa Clara, CA, USA; 30 m × 0.25 mm i.d., 0.25 µm thickness)) was used, and helium was used as the carrier gas. The GC oven temperature was maintained at 40 °C and programmed to 260 °C at a rate of 5 °C/min, then held constant at 260 °C for 40 min. The injector temperature was 250 °C. MS data were acquired at 70 eV. The mass range was m/z 30–400. A library search was performed using commercial Wiley, NIST, and Flavor GC–MS libraries [36] (Kafkas et al. 2022). The results are expressed as the relative peak area percentage (%) in the total volatile compound. Aroma analyses were performed on a single measurement per genotype, and principal component analysis (PCA) was performed using genotype averages. Therefore, the PCA results were evaluated as descriptive analysis.

4.4. Analysis of Sugar and Organic Acid Profile by HPLC

4.4.1. Sugar Analyses

The HPLC analysis developed by Crisosto (1997) [37] was performed on samples taken from homogenized specimens to determine specific sugars (glucose, fructose, and sucrose) and the total sugar content. Prior to analysis, the fruit extract samples were dissolved at 25 °C by adding 4 mL of distilled water (Millipore Corp., Bedford, MA, USA) to 1 g of sample. The reaction mixture was placed in an ultrasonic bath and subjected to ultrasonic treatment at 80 °C for 15 min, then centrifuged at 5500 rpm for 15 min and filtered (prior to HPLC analysis). Sugar contents were determined by HPLC (Shimadzu, Prominence LC-20A), using RID (Refractive Index Detection) and a Coregel-87C column (7.8 × 300 mm) with three replicate measurements. Separation was performed at 70 °C at a flow rate of 0.6 mL/min. Elution was carried out with isocratic ultrapure water. Calibration curves were constructed using analytical-grade sugar standards (Sigma-Aldrich, St. Louis, MO, USA); the coefficient of determination (r2) was 0.9963. Sugar contents are expressed as mg per 100 mL of aqueous extract.

4.4.2. Organic Acid Analyses

The organic acids in fruit pulp extract were determined by the HPLC analysis developed by Bozan et al. (1997) [38]. The changes in the malic, citric, succinic, fumaric, L-ascorbic and oxalic acid levels in pulp samples were identified. For the extraction of organic acids, 1 g of the sample was mixed with 4 mL of 3% metaphosphoric acid. The mixture was placed in an ultrasound bath at 80 °C for 15 min and it was sonified and centrifuged at 5500 rpm for 15 min. The mixture was filtered and the HPLC vials were removed. The extract organic acids were analyzed using HPLC (Shimadzu LC20Avp, Kyoto, Japan) equipped with a UV detector (Shimadzu SPD 20A vp) in which we used an 87 H column (5 μm, 300 × 7.8 mm, Transgenomic). Sulfuric acid (0.05 M) was used as solvent. The operating conditions were: column temperature, 40 °C; injection volume, 20 μL; detection wavelength, 210 nm; flow rate 0.6 mL/min. Peak identification was based on retention time matching and spectral comparison with analytical-grade standards (Sigma-Aldrich). Calibration curves yielded r2 = 0.9998. Organic acid contents are expressed as mg per 100 mL of aqueous extract.

4.5. Statistical Analysis

Sugar and organic acid data were evaluated in triplicate (three biological replicates) according to the randomized block design. Volatile compound analyses were performed on a single measurement per genotype; PCA and hierarchical clustering were performed using genotype averages and evaluated as descriptive exploratory analysis only. ANOVA was performed using IBM SPSS Statistics v26.0 (IBM Corp., Armonk, NY, USA), with Tukey’s multiple comparison test for post hoc analysis at p < 0.05. Results are presented as the mean ± SD. PCA and Hierarchical Cluster Analysis were conducted using Python 3.9 (Python Software Foundation, Wilmington, DE, USA) with scikit-learn, scipy, and seaborn libraries after autoscaling.

5. Conclusions

This study demonstrates that myrtle genotypes from Antalya, Turkey, exhibit remarkable metabolic diversity, with descriptive evidence suggesting three potential chemotypes (1,8-cineole-dominant (G34, G36), α-Pinene-rich (G15, G37), and ester-aldehyde type (G9), with G29 representing a transitional profile and distinct metabolic strategies. These groupings are based on single volatile measurements and should be considered preliminary patterns pending validation through replicate analyses.
These chemotypes provide a framework for germplasm evaluation and selection, while hierarchical clustering analysis reveals integrated metabolic strategies linking primary and secondary metabolism. Comparison with Turkish germplasm from other regions suggests that Antalya genotypes represent a unique genetic resource with exceptionally high 1,8-cineole content and distinct organic acid profiles.
Future research should investigate the genetic basis of these metabolic differences through transcriptomic and metabolomic approaches, validate the observed metabolic patterns through controlled experiments, and assess the functional properties of each chemotype in food and pharmaceutical applications. Particular attention should be paid to the bioaccessibility of bioactive compounds from these genotypes. The conservation of these distinct metabolic phenotypes within a geographically restricted, native population adapted to local environmental conditions confirms that Turkish myrtle germplasm is a valuable, underexploited resource for sustainable agriculture in Mediterranean climates. Furthermore, comparative studies with Corsican, Sardinian, and other Mediterranean populations should be conducted to establish clear chemotaxonomic relationships and potential geographical indication protections, contributing to the growing recognition of Turkish myrtle as a functional food and pharmaceutical resource.
This study has several limitations: (i) volatile compound analyses were performed on single measurements without replicates; (ii) environmental adaptation conclusions are inferential and require controlled stress experiments; (iii) the six genotypes represent a limited sample of the broader germplasm collection.

Author Contributions

Conceptualization, S.A., D.H., E.K., and E.A.; methodology, S.A., D.H., E.K., E.G., A.M., D.E., and L.M.; validation, S.A., D.H., E.K., E.G., A.M., D.E., and L.M.; formal analysis, E.K., D.E., and L.M.; investigation, S.A., D.H., D.E., and E.A.; resources, S.A., D.H., E.A., and D.E.; data curation, S.A., D.E., and L.M.; writing—original draft preparation, S.A., E.K. and L.M.; writing—review and editing, S.A., E.K. and L.M.; visualization, S.A.; supervision, S.A., D.H., and E.K.; project administration, S.A., D.H., and E.K.; funding acquisition, L.M. All authors have read and agreed to the published version of the manuscript.

Funding

This research received no direct financial support. Plant materials and pomological data were provided through Project No. TA-GEM/TBAD/B/19/A7/P6/970, which was funded by the General Directorate of Agricultural Research and Policies (TAGEM), Turkish Ministry of Agriculture and Forestry.

Data Availability Statement

The original contributions presented in this study are included in the article. Further inquiries can be directed to the corresponding authors.

Acknowledgments

The authors thank the General Directorate of Agricultural Research and Policies (TAGEM), Turkish Ministry of Agriculture and Forestry for providing plant materials and pomological data from the completed project TA-GEM/TBAD/B/19/A7/P6/970.

Conflicts of Interest

The authors declare no conflicts of interest.

Abbreviations

The following abbreviations are used in this manuscript:
HS-SPMEHeadspace solid-phase microextraction
GC-MSGas Chromatography-Mass Spectrometry
HPLCHigh Performance Liquid Chromatography
PCAPrincipal Component Analysis
MVAMevalonate
MEPMethylerythritol phosphate
ROSReactive Oxygen Species
TCATricarboxylic Acid
ABAAbscisic acid
SnRK2Sucrose nonfermenting 1–related protein kinase 2
AREB/ABF ABRE-Binding Proteins/ABRE Binding Factors
P5CSΔ1-pyrroline-5-carboxylate synthetase
SOS1Salt Overly Sensitive 1
NHXNa+/H+ antiporters
APXAscorbate peroxidase
GRGlutathione reductase
HSDHonestly Significant Difference
ANOVAAnalysis of Variance
LLELiquid-liquid extraction
LDLLow-Density Lipoprotein
CAR/PDMS Carboxen/Polydimethylsiloxane
RIDRefractive Index Detection
dwDry weight

References

  1. Zilkah, S.; Goldschmidt, E.E. Myrtle (Myrtus communis L.)—A native Mediterranean and cultivated crop species. In Medicinal and Aromatic Plants of the Middle-East; Springer: Dordrecht, The Netherlands, 2014; pp. 253–267. [Google Scholar]
  2. Dafni, A. Myrtle (Myrtus communis) as a ritual plant in the Holy Land—A comparative study in relation to ancient traditions. Econ. Bot. 2016, 70, 222–234. [Google Scholar] [CrossRef]
  3. Asgarpanah, J.; Ariamanesh, A. Phytochemistry and pharmacological properties of Myrtus communis L. Indian J. Tradit. Knowl. 2015, 1, 82–87. [Google Scholar]
  4. Aksay, S.; Çınar, F.; Arslan, R.; Karatay, H.E. Development of myrtle (Myrtus communis L.) fruit-based herbal tea: Physicochemical and sensory characterization. Turk. J. Agric.-Food Sci. Technol. 2025, 13, 3285–3294. [Google Scholar] [CrossRef]
  5. Abate, L.; Bachheti, A.; Bachheti, R.K.; Husen, A.; Getachew, M.; Pandey, D.P. Potential role of forest-based plants in essential oil production: An approach to cosmetic and personal health care applications. In Non-Timber Forest Products: Food, Healthcare and Industrial Applications; Springer: Cham, Switzerland, 2021; pp. 1–18. [Google Scholar]
  6. Medda, S.; Fadda, A.; Mulas, M. Selection for ornamental purposes of ‘Angela’ myrtle (Myrtus communis L.) cultivar with unpigmented fruit. Sustainability 2022, 14, 13210. [Google Scholar] [CrossRef]
  7. Usai, M.; Marchetti, M.; Culeddu, N.; Mulas, M. Chemical composition of myrtle (Myrtus communis L.) berries essential oils as observed in a collection of genotypes. Molecules 2018, 23, 2502. [Google Scholar] [CrossRef]
  8. Külheim, C.; Yeoh, S.H.; Wallis, I.R.; Laffan, S.; Moran, G.F.; Foley, W.J. The molecular basis of quantitative variation in foliar secondary metabolites in Eucalyptus globulus. New Phytol. 2011, 191, 1041–1053. [Google Scholar] [CrossRef]
  9. Chen, M.; Qiao, Y.; Quan, X.; Shi, H.; Duan, Z. Physiological, biochemical and phytohormone responses of Elymus nutans to α-pinene-induced allelopathy. PeerJ 2022, 10, e14100. [Google Scholar] [CrossRef] [PubMed]
  10. Ilc, T. Role of Cytochromes P450 in Wine Aroma. Ph.D. Thesis, Université de Strasbourg, Strasbourg, France, 2015. [Google Scholar]
  11. El Hadi, M.A.M.; Zhang, F.J.; Wu, F.F.; Zhou, C.H.; Tao, J. Advances in fruit aroma volatile research. Molecules 2013, 18, 8200–8229. [Google Scholar] [CrossRef] [PubMed]
  12. Gorjian, H.; Khaligh, N.G. Myrtle: A versatile medicinal plant. Nutrire 2023, 48, 10. [Google Scholar] [CrossRef] [PubMed]
  13. Falchi, R.; Bonghi, C.; Drincovich, M.F.; Famiani, F.; Lara, M.V.; Walker, R.P.; Vizzotto, G. Sugar metabolism in stone fruit: Source–sink relationships and environmental and agronomical effects. Front. Plant Sci. 2020, 11, 573982. [Google Scholar] [CrossRef]
  14. Afzal, S.; Chaudhary, N.; Singh, N.K. Role of soluble sugars in metabolism and sensing under abiotic stress. In Plant Growth Regulators: Signalling Under Stress Conditions; Springer: Cham, Switzerland, 2021; pp. 305–334. [Google Scholar]
  15. Panchal, P.; Miller, A.J.; Giri, J. Organic acids: Versatile stress-response roles in plants. J. Exp. Bot. 2021, 72, 4038–4052. [Google Scholar] [CrossRef] [PubMed]
  16. Ali, S.; Hayat, K.; Iqbal, A.; Xie, L. Implications of abscisic acid in the drought stress tolerance of plants. Agronomy 2020, 10, 1323. [Google Scholar] [CrossRef]
  17. Prakash, P.; Saini, D.R.; Jangde, S.; Kamlapuri, S.S.; Kumar, K. Role of osmoprotectants on alleviation of elevated CO2 and temperature stress. In Climate Change; CRC Press: Boca Raton, FL, USA, 2025; pp. 199–214. [Google Scholar]
  18. Almeida, D.M.; Oliveira, M.M.; Saibo, N.J. Regulation of Na+ and K+ homeostasis in plants: Towards improved salt stress tolerance in crop plants. Genet. Mol. Biol. 2017, 40, 326–345. [Google Scholar] [CrossRef] [PubMed]
  19. Wojtunik-Kulesza, K.A.; Kasprzak, K.; Oniszczuk, T.; Oniszczuk, A. Natural monoterpenes: Much more than only a scent. Chem. Biodivers. 2019, 16, e1900434. [Google Scholar] [CrossRef]
  20. Migliore, J.; Baumel, A.; Juin, M.; Médail, F. From Mediterranean shores to central Saharan mountains: Key phylogeographical insights from the genus Myrtus. J. Biogeogr. 2012, 39, 942–956. [Google Scholar] [CrossRef]
  21. Tüzün-Kis, B.; İkten, H. Assessment of genetic variation in wild myrtle (Myrtus communis L.) genotypes growing around the Mediterranean region of Turkey. Appl. Ecol. Environ. Res. 2022, 20, 855–873. [Google Scholar] [CrossRef]
  22. Tuberoso, C.I.; Barra, A.; Angioni, A.; Sarritzu, E.; Pirisi, F.M. Chemical composition of volatiles in Sardinian myrtle (Myrtus communis L.) alcoholic extracts and essential oils. J. Agric. Food Chem. 2006, 54, 1420–1426. [Google Scholar] [CrossRef] [PubMed]
  23. Barboni, T.; Venturini, N.; Paolini, J.; Desjobert, J.M.; Chiaramonti, N.; Costa, J. Characterisation of volatiles and polyphenols for quality assessment of alcoholic beverages prepared from Corsican Myrtus communis berries. Food Chem. 2010, 122, 1304–1312. [Google Scholar] [CrossRef]
  24. Serreli, G.; Jerković, I.; Gil, K.A.; Marijanović, Z.; Pacini, V.; Tuberoso, C.I.G. Phenolic compounds, volatiles and antioxidant capacity of white myrtle berry liqueurs. Plant Foods Hum. Nutr. 2017, 72, 205–210. [Google Scholar] [CrossRef]
  25. Yaşa, B.; Genç, M.; Angın, N.; Ertaş, M. Farklı bölgelerde yetişen mersin (Myrtus communis L.) meyvelerinin bazı fitokimyasal özelliklerinin karakterizasyonu. Tarim Doga Derg. 2023, 26, 1230. [Google Scholar] [CrossRef]
  26. Şan, B.; Yıldırım, F.; Yıldırım, A.N. Mersin (Myrtus communis L.) bitkisinin biyoaktif bileşenleri. Bahçe 2016, 45, 185–193. [Google Scholar]
  27. Vafadar Shoshtari, Z.; Rahimmalek, M.; Sabzalian, M.R.; Hosseini, H. Essential oil and bioactive compounds variation in myrtle (Myrtus communis L.) as affected by seasonal variation and salt stress. Chem. Biodivers. 2017, 14, e1600365. [Google Scholar] [CrossRef]
  28. Fadda, A.; Mulas, M. Chemical changes during myrtle (Myrtus communis L.) fruit development and ripening. Sci. Hortic. 2010, 125, 477–485. [Google Scholar] [CrossRef]
  29. Mulas, M.; Fadda, A.; Angioni, A. Effect of maturation and cold storage on the organic acid composition of myrtle fruits. J. Sci. Food Agric. 2013, 93, 37–44. [Google Scholar] [CrossRef]
  30. Yılmaz, S. Myrtus communis L. Meyvesinin bazı Kimyasal ve Antioksidatif Özelliklerinin Belirlenmesi. Master’s Thesis, Bursa Uludag University, Bursa, Turkey, 2020. [Google Scholar]
  31. Chidouh, A.; Aouadi, S.; Heyraud, A. Extraction, fractionation and characterization of water-soluble polysaccharide fractions from myrtle (Myrtus communis L.) fruit. Food Hydrocoll. 2014, 35, 733–739. [Google Scholar] [CrossRef]
  32. Tuberoso, C.I.G.; Orrù, C.D. Myrtle (Myrtus communis L.) berries: Composition and properties. In Berries: Properties, Consumption and Nutrition; Nova Science Publishers: New York, NY, USA, 2011; pp. 145–155. [Google Scholar]
  33. Alim, E.; Çınar, O.; Uysal Bayar, F.; Çetinay, Ş.; Bayır Yeğin, A.; Polat, S.; Yüksel, K.; Şimşek, M.; Erçik, K. Determination of Myrtle (Myrtus communis L.) Genotypes Suitable for Different Uses; Project Report No. TA-GEM/TBAD/B/19/A7/P6/970; General Directorate of Agricultural Research and Policies (TAGEM), Turkish Ministry of Agriculture and Forestry: Ankara, Turkey, 2013. [Google Scholar]
  34. Michelson, L.F.; Lachman, W.H.; Allen, D.D. The use of the “Weighted-Rankit” method in variety trials. Proc. Amer. Soc. Hort. Sci. 1958, 71, 334–338. [Google Scholar]
  35. Angioni, A.; Pirisi, F.; Caboni, P. Effects of cold storage on quality traits of Sardinian Myrtle (Mytrus communis L.) berries and their alcoholic extracts. J. Agric. Sci. Technol. 2011, 5, 790–798. [Google Scholar]
  36. Kafkas, N.E.; Gündeşli, M.A. Fig Flavor. Advances in Fig Research and Sustainable Production; CABI: Wallingford, UK, 2022; pp. 364–386. [Google Scholar]
  37. Crisosto, C.H. Developing Maturity Indices for Full Red Plum Cultivars. Calif. Tree Fruit Agreem. 1997, 34–48. [Google Scholar]
  38. Bozan, B.; Başer, K.H.C.; Kara, S. Quantitative determination of naphthaquinones of Arnebia densiflora by an improved HPLC method. J. Chromatogr. A 1997, 782, 133–136. [Google Scholar] [CrossRef]
Figure 1. PCA biplot of volatile profiles in six myrtle genotypes based on Total Terpenes (including 1,8-cineole), Total Aliphatic Alcohols, Total Esters, and individual marker compounds. PC1 (28.2%) and PC2 (23.9%) suggest three potential chemotype patterns are evident: 1,8-cineole-dominant (G34, G36) with G29 showing a transitional profile, α-Pinene-rich (G15, G37), and ester-dominant (G9). Compound vectors (gray arrows) indicate 1,8-cineole and α-Pinene as primary discriminatory markers.
Horticulturae 12 00633 g001
Figure 2. Heatmap of volatile compounds in six myrtle genotypes. Color intensity represents relative abundance (%). Three potential chemotype patterns are evident: 1,8-cineole-dominant (G34, G36) with G29 showing a transitional profile, α-Pinene-rich (G15, G37), and ester-dominant (G9). Maximum variation observed for 1,8-cineole (0–40.3%) and α-Pinene (5.5–15.7%).
Horticulturae 12 00633 g002
Figure 3. Hierarchical clustering dendrogram and heatmap of six myrtle genotypes based on comprehensive biochemical profiles (16 parameters: 7 volatile compound groups, 1,8-cineole, 4 sugars, and 4 organic acids). Cluster 1 (Balanced-Metabolism: G9, G15, G37), Cluster 2 (Terpenes-Rich: G29, G36), and Cluster 3 (1,8-cineole-Dominant: G34). Color intensity represents standardized Z-scores (red: high, blue: low). Dashed lines indicate cluster boundaries.
Horticulturae 12 00633 g003
Table 1. Relative percentages of major volatile compound groups in six myrtle (Myrtus communis L.) genotypes.
Compound GroupG9G15G29G34G36G37
Total Terpenes76.9383.6680.6771.5586.4682.82
Total Aliphatic Alcohols7.735.224.7912.344.023.50
Total Aliphatic Aldehydes7.044.382.085.671.382.45
Total Aliphatic Esters4.644.6610.085.065.9510.12
Total Aliphatic Ketones0.000.290.001.310.490.30
Total Phenylpropanoids0.580.550.500.940.000.58
Total Others3.081.241.883.131.700.23
Total100100100100100100
Chemical classification note: Unlike traditional myrtle volatile classifications [22,23], this study adopts a chemically accurate functional grouping. 1,8-Cineole is an oxygenated monoterpene ether (not an alcohol); linalool and trans-β-terpineol are terpenols (terpenoid alcohols); linalyl acetate is a terpenoid ester. These oxygenated terpenes are grouped under Total Terpenes. Total Aliphatic Alcohols include only non-terpenoid alcohols (1-hexanol, 2-hexen-1-ol, cis-2-pentenol, 1-pentanol, isoamyl alcohol). Total Aliphatic Esters include non-terpenoid esters and lactones.
Table 2. Summary of ANOVA results for sugar composition parameters across six myrtle genotypes.
ParameterSum of Squares (Type III)Mean SquareF-Valuep-ValuePartial η2
Glucose12,857,300.352,571,460.07991.53<0.0010.998
Fructose20,407,406.514,081,481.301638.36<0.0010.999
Xylose179.8535.97304.76<0.0010.992
Total Sugar64,120,238.6212,824,047.731994.65<0.0010.999
All dependent variables met the assumption of homogeneity of variances as confirmed by Levene’s test (Glucose: F = 1.640, p = 0.223; Fructose: F = 1.833, p = 0.181; Xylose: F = 1.300, p = 0.327; Total Sugar: F = 1.775, p = 0.193). Post hoc comparisons performed using Tukey’s Honestly Significant Difference (HSD) test at α = 0.05. Partial eta squared (η2) interpreted as: 0.01 = small, 0.06 = medium, 0.14 = large effect. All values represent extremely large effects.
Table 3. Sugar contents of myrtle genotypes (mg/100 mL, mean ± SD).
SugarG9G15G29G34G36G37
Glucose 4718.5 ± 28.5 c5819.1 ± 3.9 a3453.8 ± 37.3 f4314.9 ± 69.4 d3926.3 ± 86.2 e5571.3 ± 33.1 b
Xylose10.9 ± 0.2 b10.5 ± 0.3 b3.2 ± 0.3 e7.4 ± 0.4 c5.6 ± 0.2 d12.1 ± 0.6 a
Fructose6087.6 ± 72.3 c6588.7 ± 48.7 a3602.1 ± 4.0 e4728.6 ± 49.6 d4801.4 ± 40.5 d6341.0 ± 56.9 b
Total Sugar10,817.0 ± 101.0 c12,418.3 ± 52.7 a7059.1 ± 37.1 f9050.9 ± 60.5 d8733.3 ± 112.4 e11,924.4 ± 89.1 b
Means followed by different letters within rows are significantly different according to Tukey’s HSD test (p < 0.05). Sucrose was not detected in any genotype. Values represent the mean ± standard deviation of three biological replicates.
Table 4. Summary of ANOVA results for organic acid composition parameters across six myrtle genotypes.
ParameterSum of Squares (Type III)Mean SquareF-Valuep-ValuePartial η2
Citric Acid83,468.9516,693.7951.61<0.0010.956
Malic Acid257,968.2051,593.6435.29<0.0010.936
Succinic Acid59,123.6811,824.7421.50<0.0010.900
Total Organic Acids747,187.56149,437.5139.11<0.0010.942
All dependent variables met the assumption of homogeneity of variances as confirmed by Levene’s test (Citric Acid: F = 2.021, p = 0.148; Malic Acid: F = 1.935, p = 0.162; Succinic Acid: F = 2.745, p = 0.070; Total Organic Acids: F = 2.289, p = 0.111). Post hoc comparisons performed using Tukey’s Honestly Significant Difference (HSD) test at α = 0.05. Partial eta squared (η2) interpreted as: 0.01 = small, 0.06 = medium, 0.14 = large effect. All values represent extremely large effects. Degrees of freedom: numerator (df1) = 5, denominator (df2) = 12 for all parameters.
Table 5. Organic acid contents of myrtle genotypes (mg/100 mL, mean ± SD).
Organic AcidG9G15G29G34G36G37
Citric Acid247.4 ± 14.0 b268.0 ± 20.6 b242.5 ± 19.8 b188.0 ± 4.2 c365.8 ± 4.5 a376.9 ± 29.8 a
Malic Acid804.4 ± 24.2 a791.9 ± 53.4 a681.5 ± 18.3 b500.2 ± 4.1 c785.9 ± 46.9 ab867.0 ± 52.7 a
Succinic Acid720.7 ± 24.4 d808.1 ± 33.7 bc794.7 ± 8.8 c820.9 ± 17.0 bc902.6 ± 12.9 a867.4 ± 32.2 ab
Total Organic Acids1772.5 ± 29.5 b1867.9 ± 78.2 b1718.7 ± 16.7 b1509.1 ± 24.2 c2054.3 ± 52.2 a2111.4 ± 111.2 a
Means followed by different letters within rows are significantly different according to Tukey’s HSD test (p < 0.05). Values represent the mean ± standard deviation of three biological replicates.
Table 6. Metabolic clusters and characteristic features based on hierarchical clustering of standardized biochemical parameters.
ClusterGenotypesKey Characteristics (Z-Scores)Proposed Metabolic Strategy
Cluster 1 (Balanced-Metabolism)G9, G15, G37G9: High Aldehydes (+1.44), High Others (+1.08), Low 1,8-cineole (−1.49), Low Succinic (−1.57); G15: High Glucose (+1.28), High Fructose (+1.05), High Total Sugars (+1.17), Moderate 1,8-cineole (+0.49); G37: High Esters (+1.28), High Glucose (+1.01), High Xylose (+1.10), High Citric (+1.57), High Total Organic Acids (+1.22), Low 1,8-cineole (−1.06), Low Others (−1.48)Balanced primary-secondary metabolism with varied end-use potential; G9 emphasizes aldehyde stress signaling and aliphatic alcohols, G15 prioritizes sugar accumulation with moderate terpene defense, G37 combines elevated sugars, organic acids, and esters for osmotic adjustment and quality
Cluster 2 (Terpenes-Rich)G29, G36G29: High Esters (+1.26), Low Glucose (−1.27), Low Fructose (−1.51), Low Xylose (−1.47), Low Total Sugars (−1.42), Moderate 1,8-cineole (+0.63); G36: High Total Terpenes (+1.14), High Malic Acid (+1.62), High Succinic Acid (+1.33), High Total Organic Acids (+0.96), Low Aldehydes (−1.10), Low Phenylpropanoids (−1.74), Moderate 1,8-cineole (+0.69), Low Sugars (−0.61)Volatile-focused defense combined with organic acid metabolism; G29 emphasizes ester accumulation under low primary metabolite status, G36 represents high terpene biosynthesis with enhanced acid metabolism (transitional between terpene defense and primary metabolic optimization)
Cluster 3 (1,8-cineole-Dominant)G34High Total Aliphatic Alcohols (+1.83), High Total Aliphatic Ketones (+1.88), High Total Phenylpropanoids (+1.38), High Total Others (+1.13), Low Total Terpenes (−1.64), Low Citric Acid (−1.13), Low Malic Acid (−0.92), Low Total Organic Acids (−1.48), Moderate 1,8-cineole (+0.73)Specialized high-cineole phenotype with divergent aliphatic ketone and phenylpropanoid accumulation; reduced primary metabolism suggests carbon allocation toward oxygenated monoterpene ether biosynthesis at the expense of acid and sugar production
Clustering performed using Ward’s minimum variance method on standardized data (n = 16 parameters: 7 volatile compound groups, 1,8-cineole, 4 sugars, 4 organic acids). Z-scores indicate deviation from population mean.
Table 7. Location, altitude, fruit color, propagation method, irrigation status, vegetation, and plant habitus of myrtle genotypes.
Gen. NoLocation NameAltitude (m)Fruit ColorGrafted/NaturalIrrigationVegetationPlant Habitus
9Antalya-Kalkan-İslamlar 3278.0WhiteGraftedNoMaquis, Red Pine4
15Antalya-Finike-Yeşilyurt 11.0WhiteGraftedYesSmall Garden3
29Antalya-Serik-Yumaklar403.6WhiteGraftedYesOlive Grove4
34Antalya-Serik-Çetince 2121.0WhiteGraftedYesGarden5
36Muğla-Fethiye-Seydikemer-Kocaçınar120.0WhiteGraftedYesGarden3
37Muğla-Fethiye-Seydikemer-Döver118.0WhiteGraftedYesGarden2
Collection sites, altitude, and habitat characteristics in Table 7 refer to the original provenance of the parental accessions. Fruits for metabolic analysis were harvested from vegetatively propagated plants grown in a common collection garden under standardized conditions (drip irrigation, annual pruning, uniform fertilization) since 2021.
Table 8. Pomological characteristics of myrtle genotypes.
Gen. NoFruit Weight (g)Fruit Width (mm)Fruit Length (mm)Calyx Diameter (mm)Fruit Stalk Length (mm)Seed Number (Count)Seed ClassificationGerminated Seed CountTotal Seed Weight (g)Seed Ratio (%)
91.3212.4914.935.3423.4616.60Multi-seeded0.000.118.33
151.4613.1816.695.4720.7026.50Multi-seeded0.700.1610.96
291.2812.8515.844.4616.2021.20Multi-seeded0.100.1410.94
341.3612.8517.145.1220.1524.10Multi-seeded0.200.1410.29
361.1812.1915.194.9313.5618.60Multi-seeded0.200.119.32
371.4813.5616.555.3916.8318.60Multi-seeded0.000.149.46
Disclaimer/Publisher’s Note: The statements, opinions and data contained in all publications are solely those of the individual author(s) and contributor(s) and not of MDPI and/or the editor(s). MDPI and/or the editor(s) disclaim responsibility for any injury to people or property resulting from any ideas, methods, instructions or products referred to in the content.