Article

Effects of Stage-Specific Red-to-White Light Ratios on the Growth and Nutritional Properties of Pak Choi


College of Horticulture, South China Agricultural University, Guangzhou 510642, China
*
Author to whom correspondence should be addressed.
Horticulturae 2026, 12(5), 618; https://doi.org/10.3390/horticulturae12050618
Submission received: 20 March 2026 / Revised: 25 April 2026 / Accepted: 13 May 2026 / Published: 15 May 2026
(This article belongs to the Special Issue Optimized Light Management in Controlled-Environment Horticulture)

Abstract

In plant factories with artificial lighting (PFALs), spectral regulation serves as the predominant factor governing plant growth and development. The implementation of red-enriched spectral regimens during cultivation promotes biomass accumulation, whereas blue-dominant spectra enhance the biosynthesis of phytochemicals and nutritional compounds in plants. Nevertheless, systematic investigations into the effects of staged spectral regimens on both plant development and secondary metabolite biosynthesis remain limited. This study evaluated four distinct stage-specific dynamic lighting regimens (T1–T4) under a constant total photosynthetic photon flux density (PPFD) of 200 μmol·m−2·s−1. The treatments utilized three distinct red-to-white photon flux ratios (R:W = 3:1, 1:1, and 1:3) administered sequentially during critical developmental phases of Pak choi: the seedling stage, the early growth stage (15 days after transplanting, DAT), and the late growth stage (16–30 DAT). The effects of these treatments on biomass production, morphological development, photosynthetic pigments, nutritional metabolites, antioxidant levels and radical quenching capacity were evaluated. The results demonstrated that the T4 treatment significantly enhanced biomass production, increasing shoot fresh weight by 51.3% compared to the T1 treatment at the late growth stage. The application of a higher red-light proportion (HR, R:W = 3:1) during the seedling stage significantly increased leaf area by 70% compared to the low red-light treatment (LR, R:W = 1:3). Regarding nutritional quality, while carotenoid content showed no significant differences among treatments, higher blue-light proportions selectively stimulated the biosynthesis of chlorophyll, vitamin C, and soluble proteins. Specifically, the T3 treatment enhanced certain traits during the early growth stage, whereas the T2 treatment best maintained specific antioxidant capacities (FRAP and flavonoids) at the late growth stage prior to harvest. Notably, nitrate levels were not significantly affected by the spectral shifts. This study establishes that the temporal modulation of red-to-white spectral ratios enables the targeted optimization of either crop yield (T4) or specific harvest-stage nutritional attributes (T2) in Pak choi.

1. Introduction

Plant factories with artificial lighting (PFALs) can produce high-quality vegetables year-round to meet the increasing market demand. Leafy vegetables contain various phytochemicals that confer significant health benefits, such as carbohydrates, vitamins, and flavonoids [1,2,3]. These substances can reduce the risk of cardiovascular disease, hypertension, and obesity [4]. Pak choi (Brassica campestris ssp. chinensis var. communis) is characterized by a short growth cycle, compact morphology, and rich nutritional content, and it is well-suited for cultivation in PFALs. In PFALs, modifying the growing environment—particularly the light environment—can effectively enhance vegetable quality and yield. Artificial lighting in controlled environment agriculture (CEA), including plant factories, offers wide-ranging benefits for optimizing plant physiology, morphology, and the accumulation of high-value phytochemicals [5].
Light, as a crucial environmental factor for plant growth and development, exerts an extremely complex influence on plants. The visible light spectrum predominantly influences plant growth and development, red and blue light play the most critical roles in plant photosynthesis [6,7]. Therefore, red and blue light-emitting diodes (LEDs) are often used as the principal light sources in PFALs [8]. Red light-enriched spectral compositions have been shown to significantly enhance plant growth, particularly biomass, leaf elongation, and leaf area expansion [9,10]. Spinach cultivated under a red-to-blue (R:B) ratio of 9:1 produced significantly greater biomass and leaf area than plants grown under R:B ratios of 3:1 and 1:3 [11]. Cucumber leaves exposed to combined red and blue light demonstrated enhanced photosynthetic acclimation, as evidenced by significantly increased leaf area and elevated chlorophyll content [12]. Lettuce grown under a combined red and blue light spectrum demonstrated enhanced growth performance, characterized by increased biomass (both dry and fresh weight) and greater leaf area [13]. Furthermore, combined red and blue light spectra also promote the biosynthesis of secondary metabolites [14]. Blue light supplementation significantly enhanced the phytochemical concentrations and antioxidant capacity in Chinese kale and pak choi sprouts initially cultivated under ambient light conditions [15]. However, an elevated proportion of blue light in the spectrum can inhibit plant growth. Lettuce growth under a blue light-enriched spectrum was markedly inferior to that observed under a red light-enriched spectrum [16]. Consequently, the use of combined red and blue light represents an optimal strategy for achieving balanced plant growth in PFALs [17].
During lettuce growth, a higher R:B ratio facilitated biomass accumulation, whereas a lower R:B ratio during the quality-forming stage stimulated the biosynthesis of secondary metabolites [18]. An elevated red-to-blue ratio increased the biomass and leaf area in lettuce [19]. Blue light supplementation for 10 days prior to harvest significantly increased the content of ascorbic acid, soluble proteins, and free amino acids in Chinese kale [20]. While the cultivation of leafy vegetables like pak choi usually occurs under static lighting treatments, research on stage-specific dynamic lighting strategies remains relatively underdeveloped. The lower photon efficacy of blue LEDs has been identified as a constraint. Consequently, the use of white LEDs to achieve the desired red-to-blue ratio has been found to offer a more practical solution for meeting production benchmarks [21]. This study aimed to evaluate and compare the effects of four distinct stage-specific dynamic lighting regimes (differing in the red-to-white light ratio) on the growth, morphological traits, and nutritional composition of pak choi. In this study, we hypothesized that applying a red-enriched spectrum during the seedling stage would maximize leaf area and biomass accumulation, while transitioning to a blue-enriched white spectrum in later growth stages would optimize secondary metabolite accumulation without compromising the previously established biomass.

2. Materials and Methods

2.1. Plant Material, Growth Conditions, and Treatments

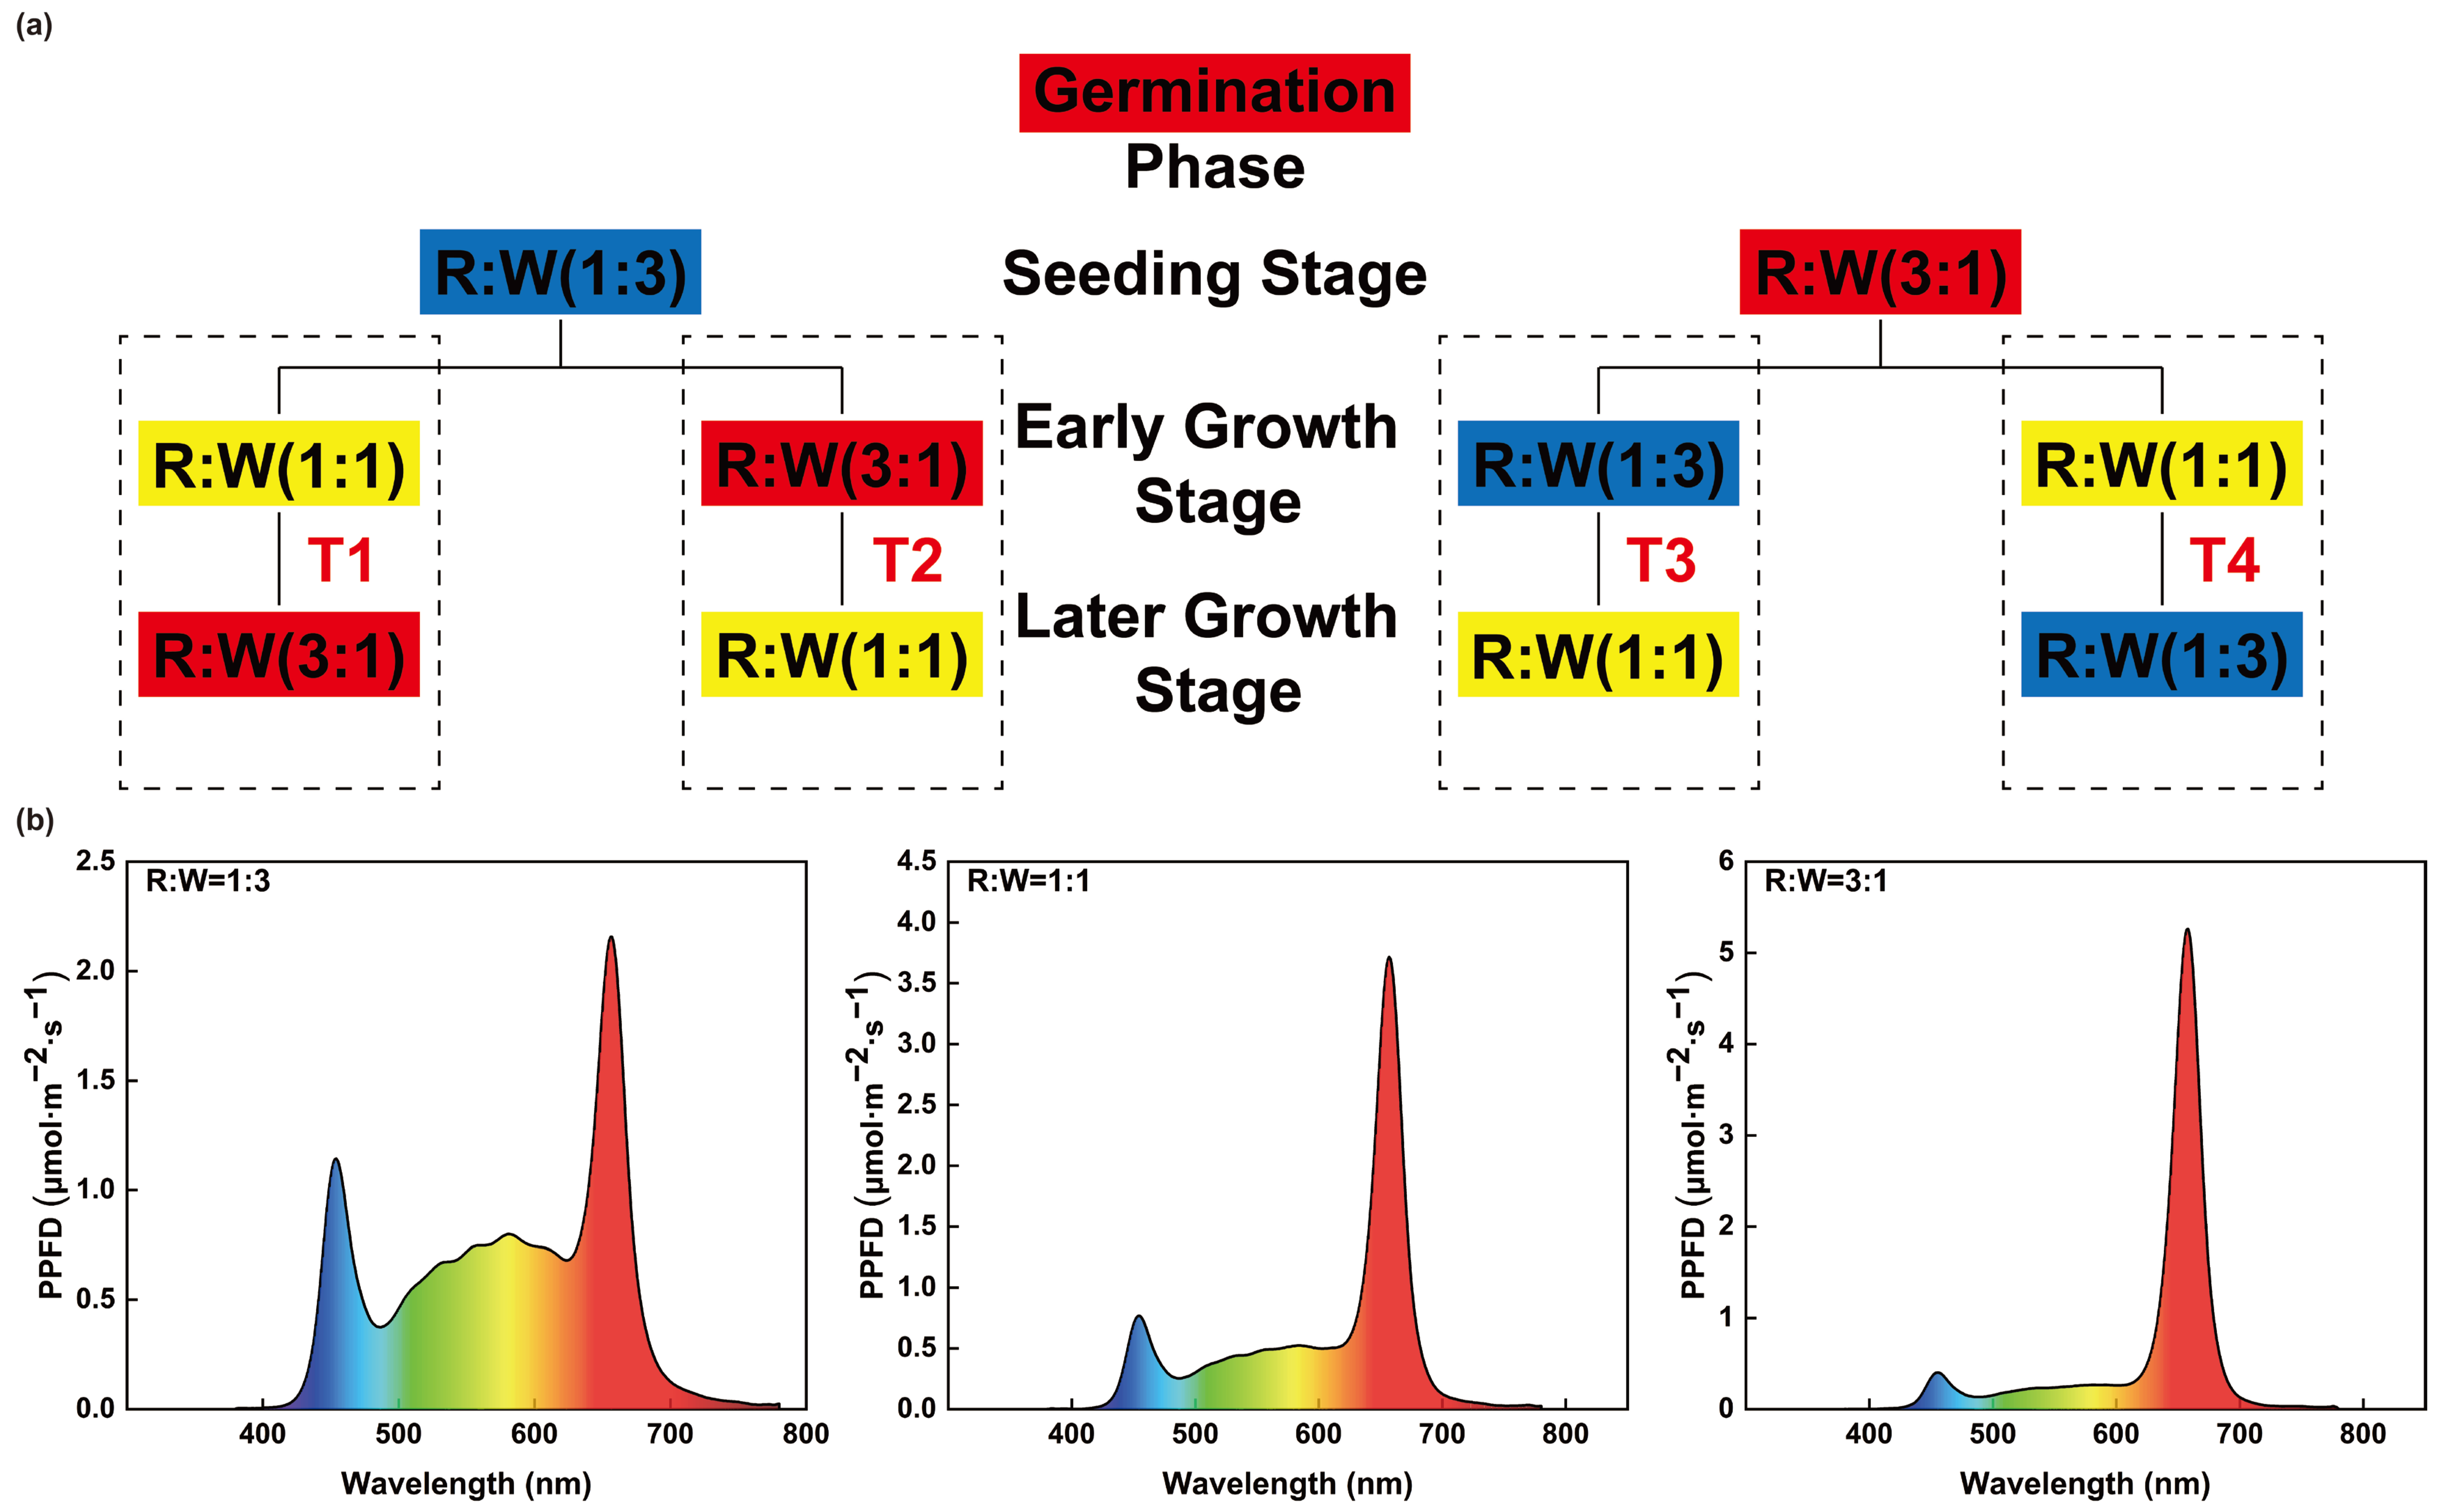
This study was conducted in an artificial lighting plant factory at the South China Agricultural University. Pak choi (cv. Xiashangwei No. 2, from GLseed seed company Ltd., Zhuhai, China) seeds were germinated in sponge cubes. Post-germination cultivation was conducted using a standardized hydroponic protocol with 1/2 Hoagland solution, 200 μmol·m−2·s−1 PPFD, and 10/14 h light/dark. Adjustable red (660 ± 10 nm) and white (400–700 nm) LED light panels (Chenghui Equipment Co., Ltd., Guangzhou, China; 150 × 30 cm2) were used as light sources. The PPFD and spectra were monitored using a spectroradiometer (ALP-01, Asensetek, Taiwan, China) (Figure 1b and Table 1). The ambient temperature was maintained at 20 ± 2 °C with a relative humidity of 65–75%.
Fifteen-day-old seedlings with three true leaves were transplanted onto cultivation panels (90 × 120 cm2) at a density of 24 plants per panel, in a deep-flow technique (DFT) hydroponic system with half-strength Hoagland’s nutrient solution (pH of 6.8 ± 0.2, electrical conductivity of 1.50 ± 0.05 mS·cm−1). The nutrient solution was circulated for 5 min at 20 min intervals.
Four spectral treatments were applied under 200 μmol·m−2·s−1 PPFD, 10/14 h light/dark photoperiod: T1 (R:W = 1:3 during the seedling stage, R:W = 1:1 through the early growth stage, and R:W = 3:1 during the late growth stage); T2 (R:W = 1:3 during the seedling stage, R:W = 3:1 through the early growth stage, and R:W = 1:1 during the late growth stage); T3 (R:W = 3:1 during the seedling stage, R:W = 1:3 through the early growth stage, and R:W = 1:1 during the late growth stage); and T4 (R:W = 3:1 during the seedling stage, R:W = 1:1 through the early growth stage, and R:W = 1:3 during the late growth stage). These specific ratios (R:W = 3:1, 1:1, and 1:3) were selected to represent distinct shifts from a red-dominant environment to a blue-enriched environment. There were three biological replicates. The detailed configuration of spectral regimens and sampling schedule is presented in Figure 1 and Table 1.

2.2. Measurement of Plant Morphology and Growth Characteristics

At the termination of each stage, six uniform pak choi plants were randomly selected from each treatment for the quantification of morphophysiological parameters. A total of eighteen pak choi plants were used for the subsequent experiments. The fresh biomass of the shoot and root systems was quantified using an analytical balance. Leaf area was determined through digital image analysis using ImageJ software (version 1.8.0; National Institutes of Health, Bethesda, MD, USA). Plant samples were subjected to oven-drying at 105 °C for enzyme inactivation (2 h), followed by desiccation at 75 °C until a constant mass was achieved. The dry weights of shoots and roots were subsequently quantified gravimetrically using an electronic balance.
The shoot tissues of pak choi were immediately cryopreserved in liquid nitrogen and maintained at −80 °C for subsequent biochemical analyses. For all biochemical parameters, tissue samples within each biological replicate were pooled, and the subsequent assays were performed with four technical replicates. For all biochemical analyses, standard calibration curves were established using analytical-grade reference standards. Method validation included routine blank corrections, and data were normalized to fresh weight. All reagents used for biochemical analyses were purchased from Shanghai Yuanye Bio-Technology Co., Ltd. (Shanghai, China).

2.3. Measurement of Pigment Content

Fresh pak choi leaves were dissected to remove petioles and midribs, finely homogenized, and thoroughly mixed. A 0.2 g sample was immersed in 8 mL of an acetone/anhydrous ethanol (1:1, v/v) mixture. The samples were incubated in the dark until the leaf tissue turned completely white. The supernatant was measured at 663 nm, 645 nm, and 440 nm using a UV spectrophotometer (Shimadzu UV-1780, Kyoto, Japan). Pigment concentrations were determined using the following equations [22]:
Chlorophyll a (mg/L) = 12.7 × A663 − 2.69 × A645
Chlorophyll b (mg/L) = 22.9 × A645 − 4.68 × A663
Total chlorophyll (mg/L) = 8.02 × A663 + 20.20 × A645
Carotenoids (mg/L) = 4.7 × A440 − 0.27 × Total chlorophyll
Pigment content based on fresh weight (mg/g FW) was calculated as follows: (Pigment concentration × Extract volume)/Sample mass.

2.4. Measurement of Nutrient Content

Soluble protein content was determined using the Coomassie Brilliant Blue G-250 binding assay [23]. A 0.5 g sample was homogenized in 8 mL of ultrapure water and centrifuged at 4000 rpm for 10 min at 4 °C. A 0.2 mL aliquot of the supernatant was diluted with 0.8 mL of ultrapure water. To this dilution, 5 mL of the Coomassie Brilliant Blue G-250 solution was added and mixed thoroughly. After a 5 min incubation at ambient temperature, the absorbance was measured at 595 nm using a UV spectrophotometer (Shimadzu UV-1780, Kyoto, Japan).
Soluble sugar content was determined using the anthrone–sulfuric acid method [24]. A 0.5 g fresh sample was subjected to extraction with 80% ethanol (an initial 4 mL, followed by two 2.5 mL washes of the residue), with each step involving a 40 min incubation in a water bath. The pooled supernatants were decolorized with 10 mg of activated charcoal at 80 °C for 30 min. The final solution was filtered and made up to 10 mL with 80% ethanol. Aliquots (0.2 mL) of the filtrate were mixed with 0.8 mL of ultrapure water, reacted with 5 mL of freshly prepared anthrone reagent (0.2% in concentrated sulfuric acid), and incubated in a boiling water bath for 10 min. After cooling to ambient temperature, the absorbance was measured at 625 nm using a UV spectrophotometer (Shimadzu UV-1780, Kyoto, Japan).
Vitamin C content was determined using the molybdenum blue spectrophotometric method [25]. A 0.5 g sample was mixed with 10 mL of an oxalic acid-ethylenediaminetetraacetic acid solution, allowed to stand for 30 min, and then filtered. Aliquots (5 mL) of the filtrate were reacted sequentially with 0.5 mL of a metaphosphoric-acetic acid solution, 1 mL of 5% sulfuric acid, and 2 mL of ammonium molybdate reagent. After a 15 min chromogenic development period, the absorbance was measured at 705 nm using a UV spectrophotometer (Shimadzu UV-1780, Kyoto, Japan).
Nitrate content was quantified using the salicylic acid nitration method [26]. A 0.5 g sample was extracted in 10 mL of ultrapure water, centrifuged at 5000 rpm for 10 min, and then incubated in a boiling water bath for 30 min. Following cooling, the extract was filtered, diluted to 10 mL with ultrapure water and mixed. Aliquots (0.1 mL) were reacted with 0.4 mL of a 5% (w/v) salicylic acid-sulfuric acid reagent for 20 min, followed by the addition of a 9.5 mL 8% NaOH solution. After cooling, the absorbance was measured at 410 nm using a UV spectrophotometer (Shimadzu UV-1780, Kyoto, Japan).

2.5. Measurement of Antioxidant Content and Antioxidant Capacity

A 0.5 g sample was extracted with 8 mL of anhydrous ethanol for 30 min. The mixture was centrifuged at 3000 rpm for 15 min at 4 °C. The resulting supernatant was collected for the analysis of antioxidant content and antioxidant capacity.

2.5.1. Measurement of Antioxidant Content

Total phenolic content was determined using the Folin–Ciocalteu method [27]. A 0.5 mL sample solution was mixed with 0.5 mL of Folin–Ciocalteu reagent and supplemented with 1.5 mL of a 26.7% Na2CO3 solution and 7 mL of ultrapure water. The reaction mixture was incubated for 2 h in the dark before measuring the absorbance at 760 nm using a UV spectrophotometer (Shimadzu UV-1780, Kyoto, Japan).
Total flavonoid content was quantified using the aluminum chloride colorimetric method [28]. To 1 mL of the sample solution, reagents were added sequentially: first, 0.7 mL of a 5% NaNO2 (incubated for 5 min at 25 °C), followed by 0.7 mL of a 10% AlCl3 solution (incubated for 6 min at 25 °C), and finally 5 mL of a 5% NaOH solution. The absorbance was measured at 510 nm using a UV spectrophotometer (Shimadzu UV-1780, Kyoto, Japan).

2.5.2. Measurement of Antioxidant Capacity

The free radical scavenging capacity was evaluated using the 1,1-diphenyl-2-picrylhydrazyl (DPPH) assay according to Musa et al. [29]. The measurement procedure was conducted as follows: Ai (2 mL aliquot of the sample solution was combined with 2 mL of a 0.1 mM DPPH methanolic solution); Aj (2 mL aliquot of the sample solution was mixed with 2 mL of absolute ethanol); Ac (2 mL aliquot of the 0.1 mM DPPH solution was mixed with 2 mL of absolute ethanol). The absorbance of the three solutions was measured at 517 nm using a UV spectrophotometer (Shimadzu UV-1780, Kyoto, Japan). The DPPH radical scavenging rate was calculated using the following equation:
DPPH radical scavenging rate (%) = [1 − (Ai − Aj)/Ac] × 100%
The ferric reducing antioxidant power (FRAP) was determined following Benzie et al. [30]. A 0.4 mL aliquot of the sample solution was mixed with 3.6 mL of TPTZ solution and incubated at 37 °C for 10 min. The absorbance was measured at 593 nm using a UV spectrophotometer (Shimadzu UV-1780, Kyoto, Japan).

2.6. Statistical Analysis

Data were expressed as the mean ± standard error (SE) (n = 3 biological replicates). Differences at the seedling stage (where the treatments were effectively grouped into two categories, LR and HR) were analyzed using an independent-samples t-test. For the early and late growth stages, differences among the four distinct dynamic sequences (T1–T4) were analyzed by one-way analysis of variance (ANOVA) using SPSS 22.0 software. Multiple comparisons were performed using Tukey’s Honestly Significant Difference (HSD) test at p < 0.05.

3. Results

3.1. Plant Growth Characteristics and Pigment Content

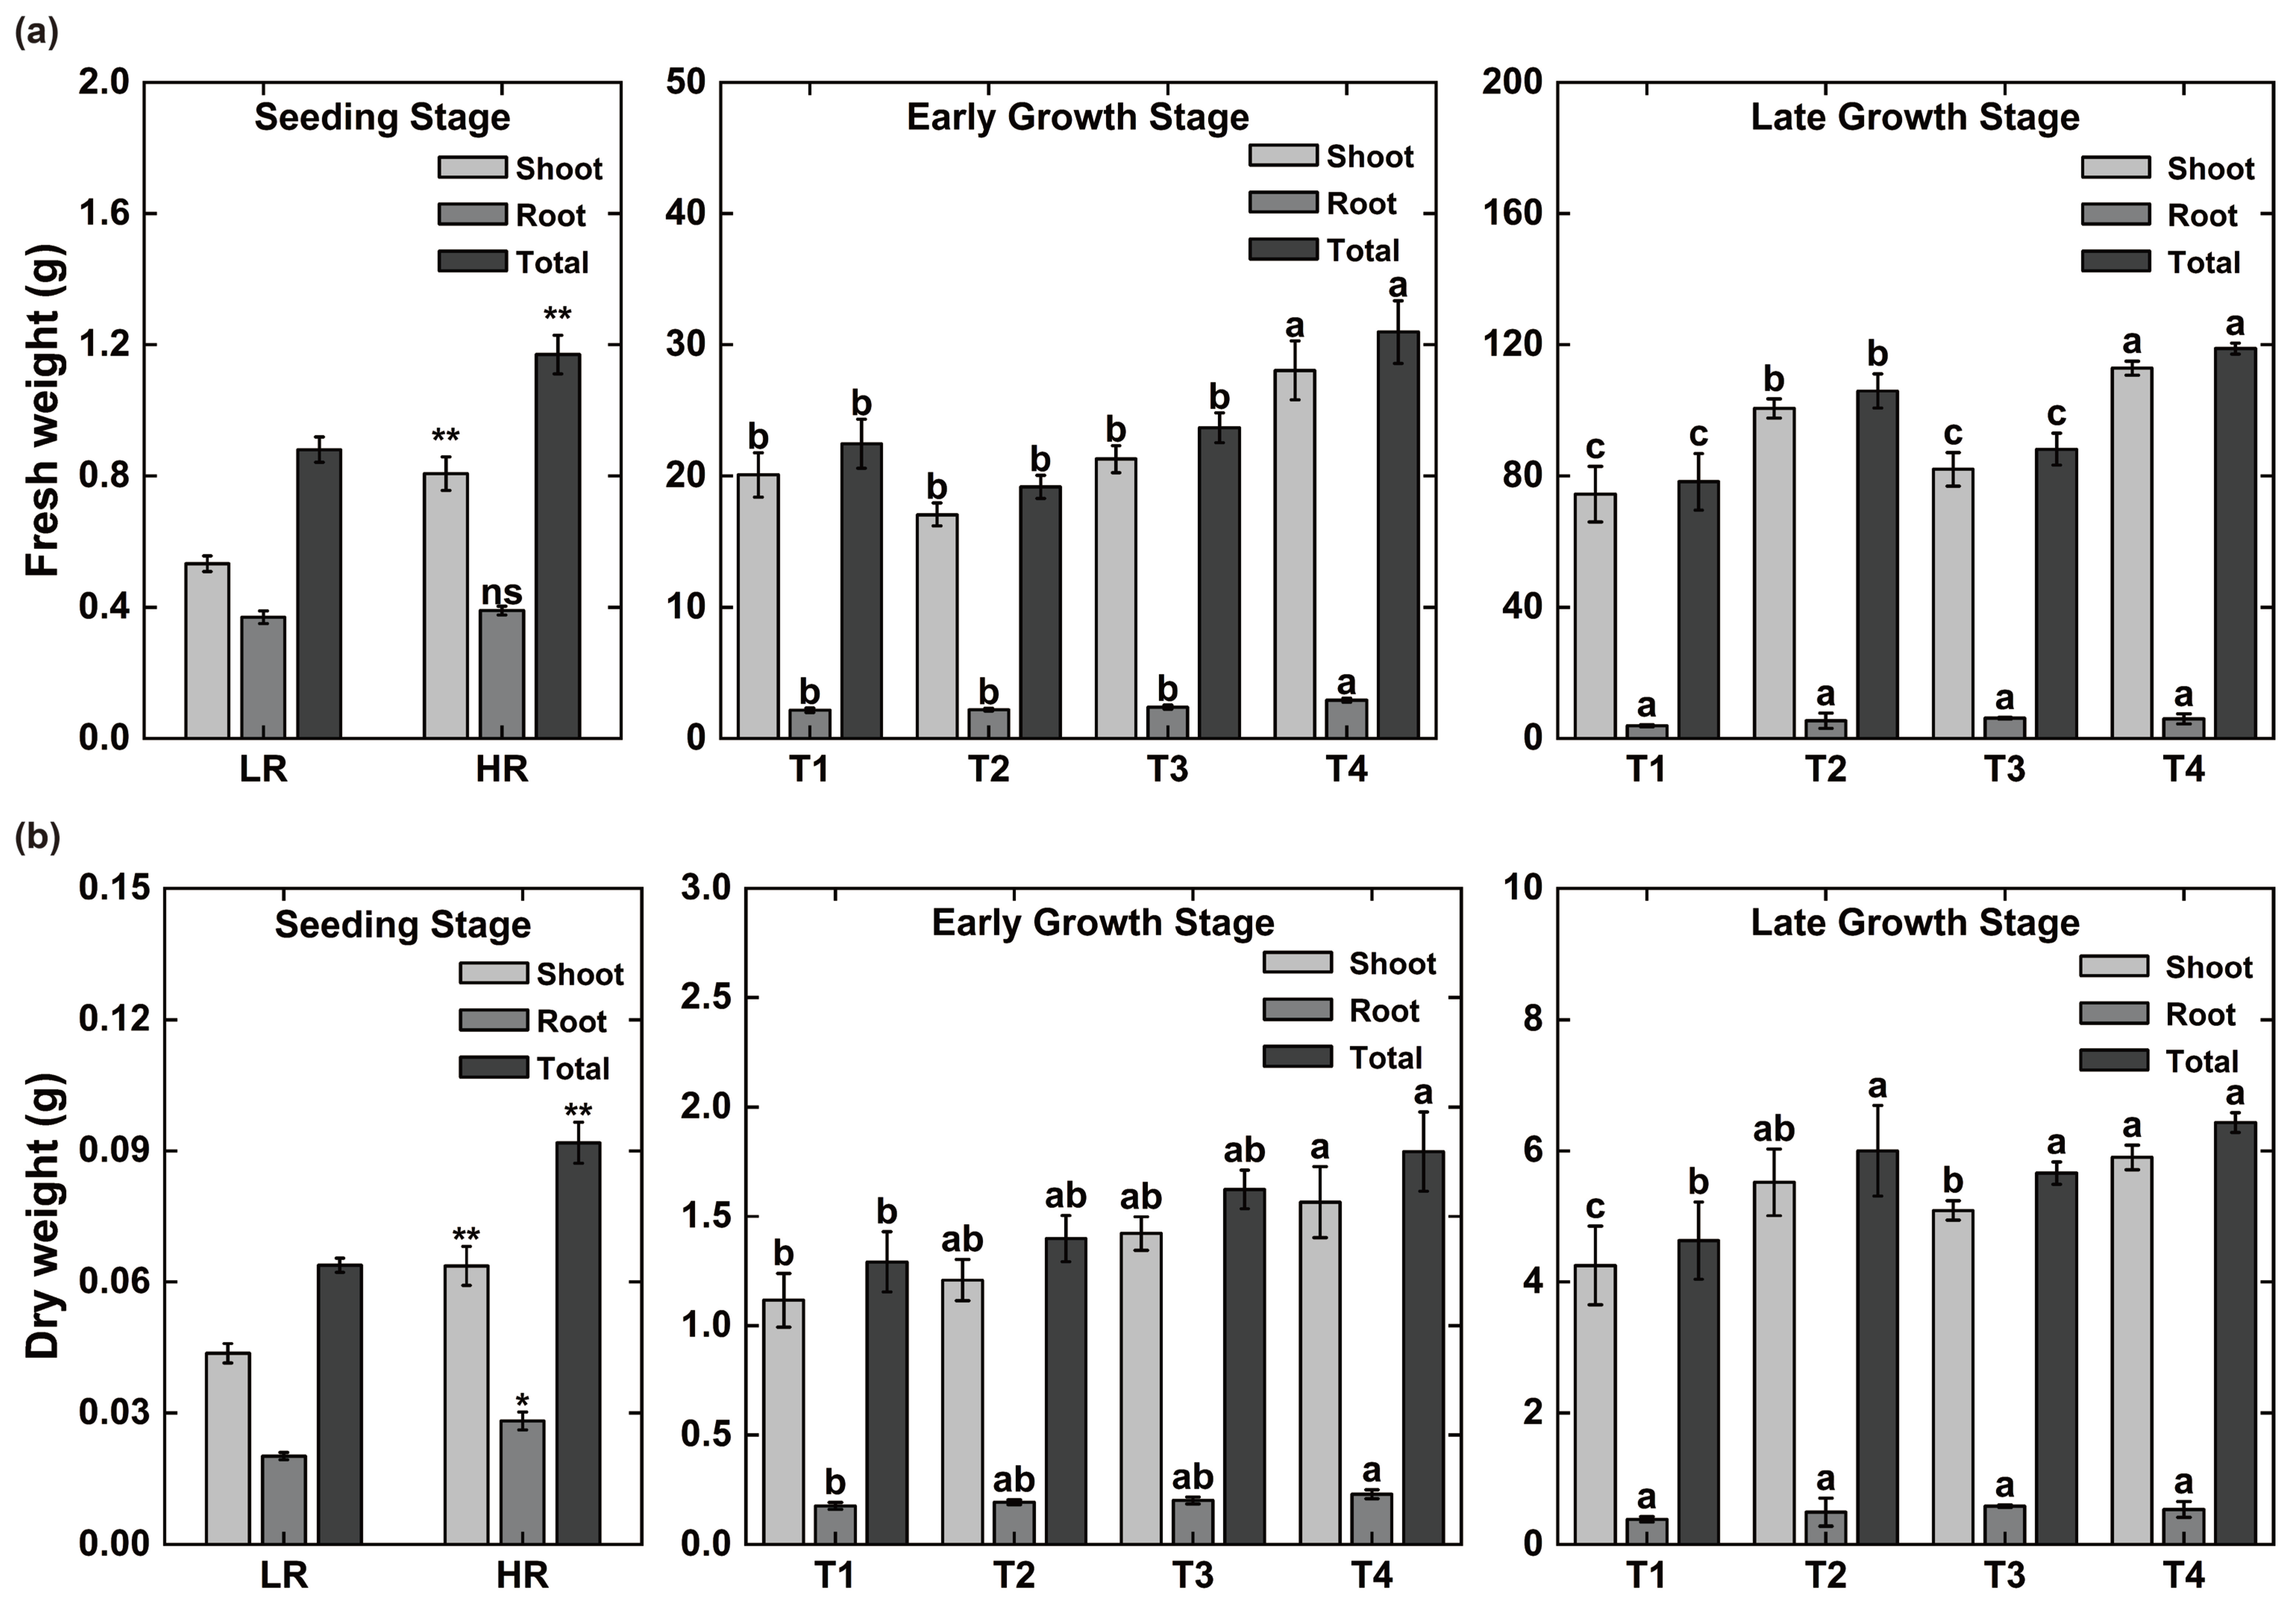
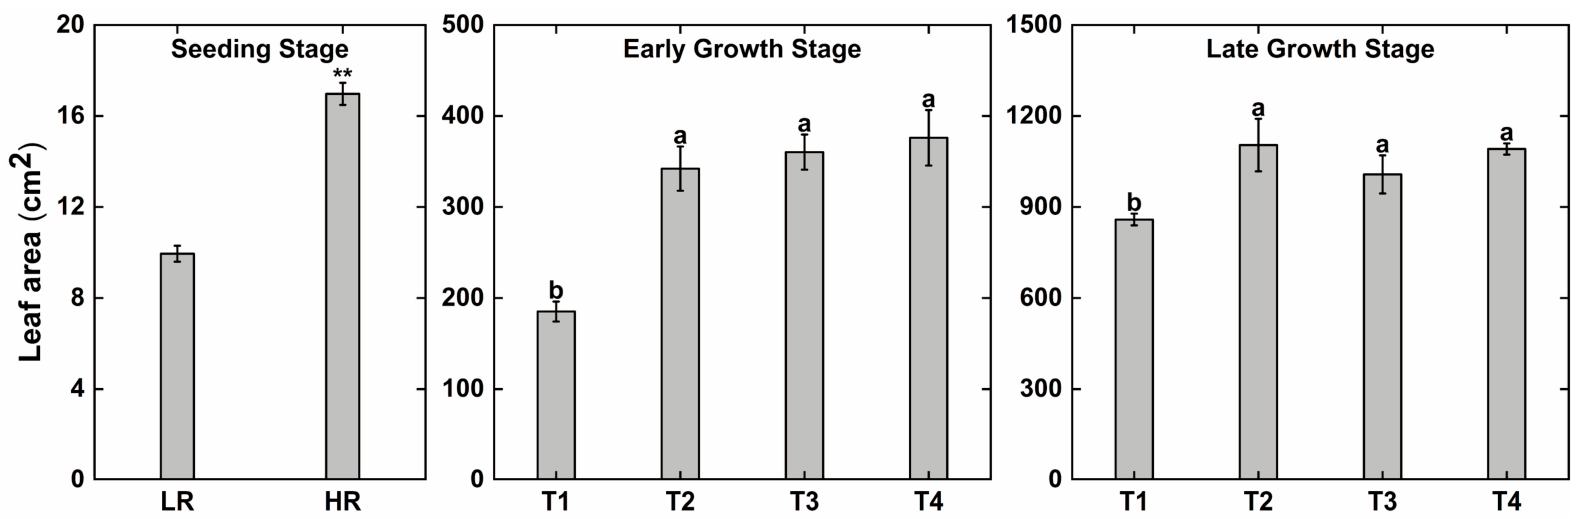
Pak choi demonstrated a high degree of developmental plasticity in response to staged light regimens, with pronounced morphological differentiation manifesting across its developmental stages. Compared to the LR treatment (R:W = 1:3) (T1, T2), the HR treatment (R:W = 3:1) (T3, T4) yielded significantly higher dry and fresh weights and leaf areas in pak choi. Specifically, the HR treatment resulted in significantly higher shoot dry and fresh weights and leaf area than the LR treatment (Figure 2, Figure 3 and Figure 4). The T4 treatment resulted in superior biomass accumulation across all growth stages compared to the other treatments, whereas the T1 treatment was the least effective (Figure 3). For instance, at the late growth stage, the shoot fresh weight in the T4 treatment was 51.3% higher than that in the T1 treatment. During the early growth stage, both the dry and fresh weights of the shoots and roots in the T4 treatment were significantly higher than those in the other treatments, and this trend persisted into the late growth stage. Notably, the T2 treatment exhibited a more pronounced growth rate in both shoot and root dry and fresh weights during the late growth stage, although these absolute values remained lower than those of the T4 treatment. During the seedling stage, the HR treatments exhibited significantly greater leaf areas than the LR treatments. Except for the T1 treatment, which exhibited a significantly lower leaf area than the other treatments, no significant differences in leaf area were observed among the remaining treatments (Figure 4).
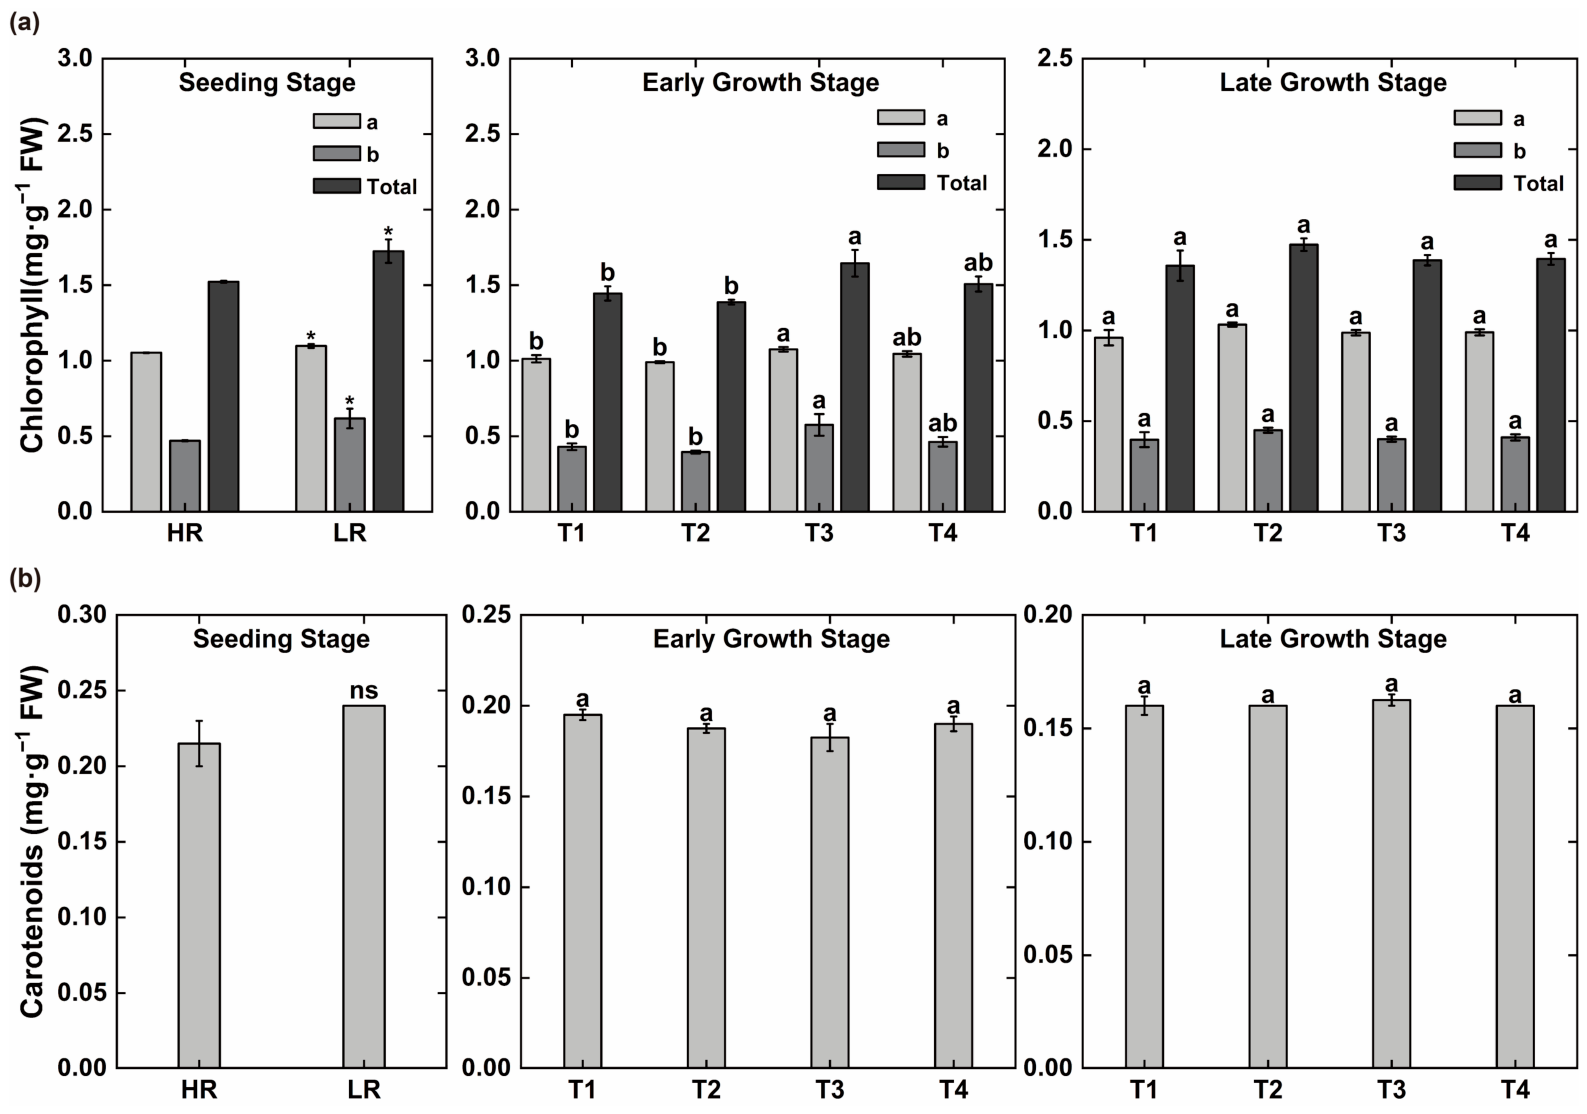
During the seedling stage, the LR treatments exhibited significantly higher contents of chlorophyll a, chlorophyll b, and total chlorophyll compared to the HR treatments. However, chlorophyll contents showed little variation during subsequent growth stages, particularly in the late growth stage, with no significant differences observed among the treatments (Figure 5a). There was no significant difference in the carotenoid content of pak choi across all growth stages (Figure 5b). The photosynthetic pigment contents within each treatment remained relatively stable across the different growth stages. Overall, dynamic supplemental lighting strategies had little effect on the photosynthetic pigment contents of pak choi.

3.2. Content of Soluble Sugars, Soluble Proteins, Nitrates, and Vitamin C

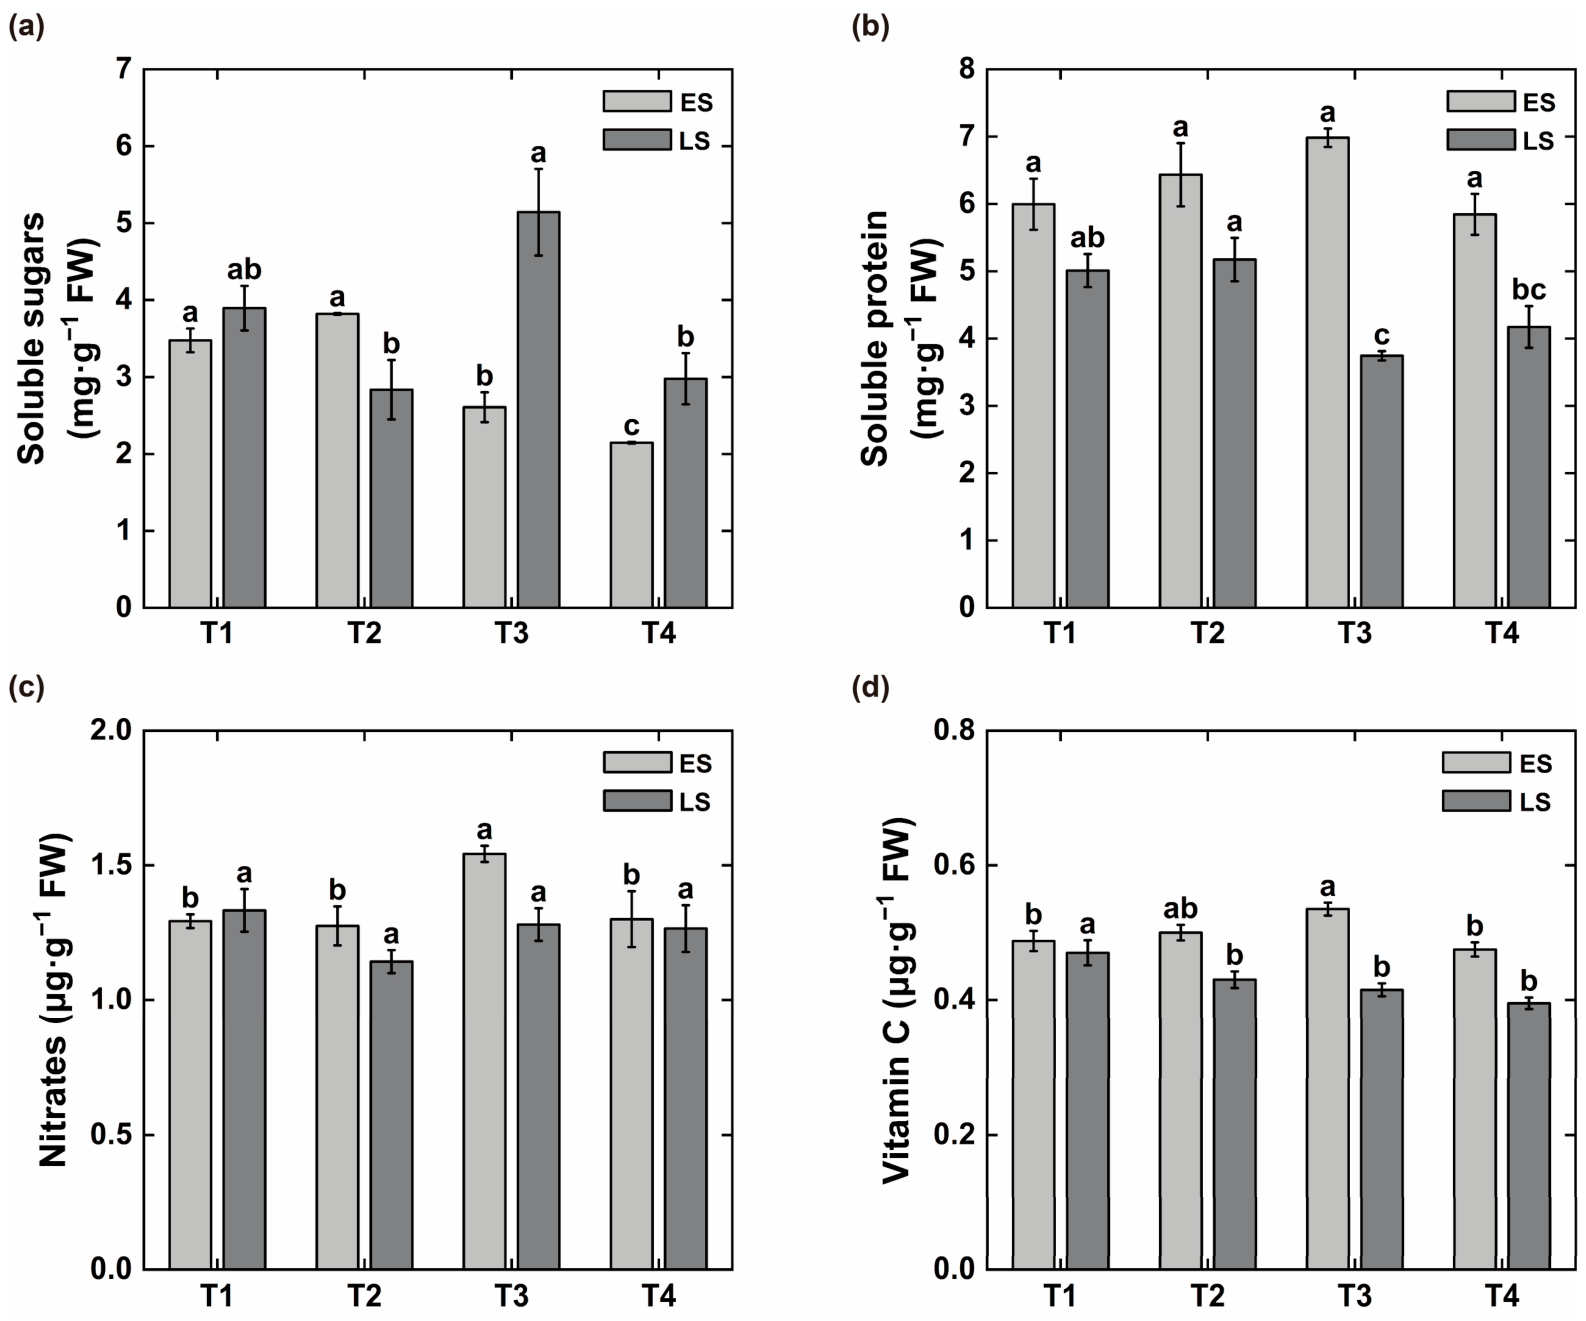
Pak choi in the T3 treatment (R:W = 1:3) exhibited the highest nutritional component contents (particularly the contents of soluble proteins and vitamin C) during the early growth stage, whereas the T1 treatment (R:W = 3:1) showed the highest contents during the late growth stage (Figure 6). During the early growth stage, the T3 treatment exhibited higher levels of nutritional parameters, with the exception of soluble sugar content, compared to the other treatments. Notably, the soluble sugar content in the T3 treatment was significantly higher than that in the T1 and T4 treatments. However, its nitrate content was also significantly higher than that of the other treatments. During the late growth stage, the vitamin C content in the T1 treatment was significantly higher than that in the other treatments (e.g., 20.1% higher than that in the T4 treatment), and there was no significant difference in the contents of soluble proteins and soluble sugars between the T1 treatment and the others. Compared to the early growth stage, the nutritional component contents of pak choi in the late growth stage generally showed a decreasing trend. Conversely, except for the T2 treatment, the soluble sugar content in the other treatments actually exhibited an increasing trend (Figure 6).

3.3. Antioxidant Content and Antioxidant Activity

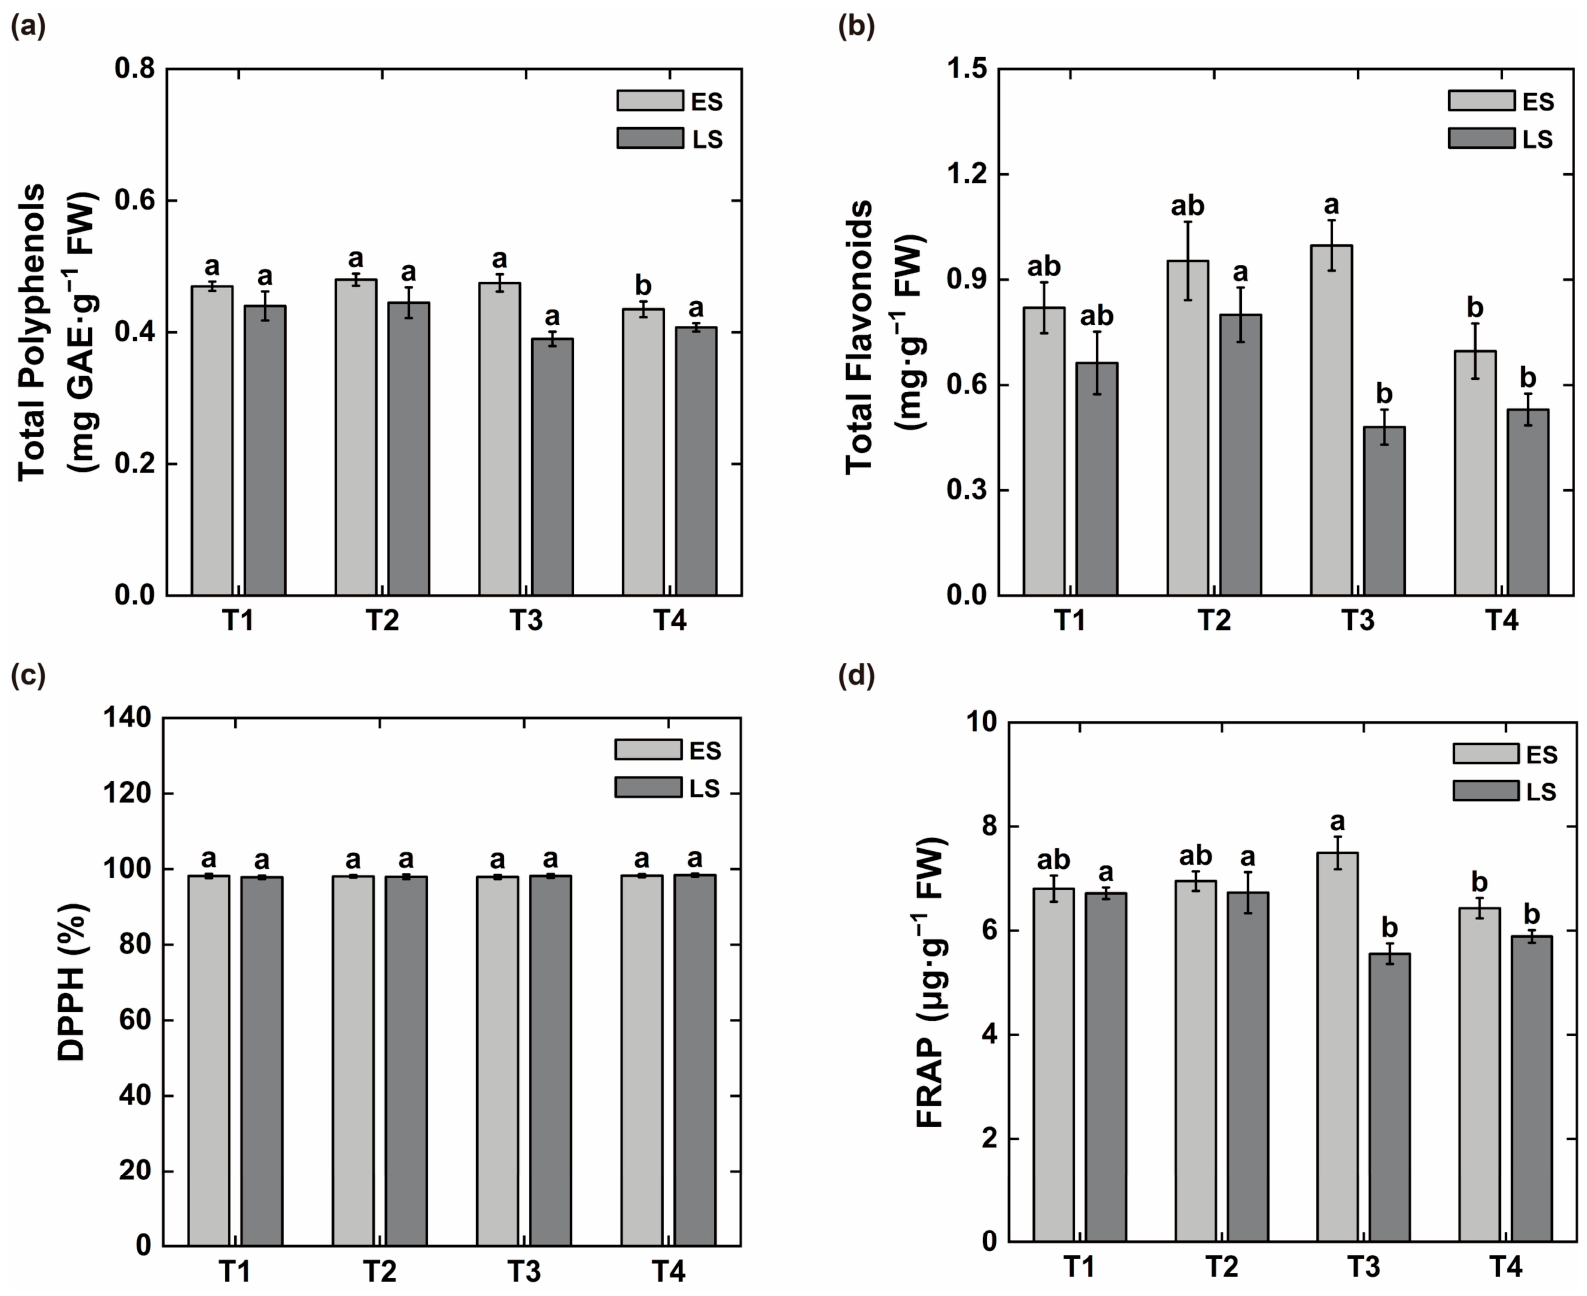
Similarly to the trends observed for nutritional components, pak choi in the T3 treatment exhibited the highest antioxidant contents and capacities during the early growth stage, whereas the T2 treatment showed the highest levels in the late growth stage (Figure 7). During the early growth stage, significantly higher contents of total polyphenols and total flavonoids, along with higher FRAP values, were found in the T3 treatment compared to the T4 treatment. There was no significant difference in the DPPH scavenging rates among the treatments. During the late growth stage, the total flavonoid content and FRAP of pak choi in the T2 treatment were significantly higher than those of the T3 and T4 treatments, showing an increase of 66.7% and 20% compared to the T3 treatment, respectively, although no significant difference was observed between the T2 and T1 treatments. There was no significant difference in the total polyphenol content and DPPH radical scavenging activity of pak choi among the treatments. By the late growth stage, the antioxidant contents and antioxidant capacities of pak choi across all treatments generally showed a declining trend, with only the DPPH scavenging rate remaining relatively stable without a significant reduction (Figure 7).

4. Discussion

4.1. Effects of Dynamic Light Regimen on Biomass Accumulation and Photosynthetic Pigment Content

When exposed to dynamic light regimens, plants exhibit specific physiological responses that alter their biomass accumulation and morphological characteristics. A high proportion of red light during the early plant growth stages has been shown to promote growth and biomass accumulation [10,31]. Red light-enriched illumination significantly increased the leaf length and leaf area of lettuce [9]. In this study, significantly higher biomass and leaf area were found in pak choi under the HR treatment (R:W = 3:1) than in the LR treatment (R:W = 1:3) during the seedling stage. Notably, the higher biomass accumulation observed in the HR treatment persisted until the harvest stage. Even when red-light-enriched spectra were applied during both the early and late growth stages (T1 and T2 treatments), the biomass and leaf areas of these pak choi plants remained lower than those in treatments that received high red light initially (Figure 3). Providing a high proportion of red light during the late growth stages has been reported to increase the leaf size of lettuce, enabling the leaves to intercept more light for photosynthetic assimilation, ultimately leading to increased biomass [32,33]. However, in this study, pak choi plants in the T1 treatment (LR during the seedling stage) showed a significantly smaller leaf area than the other three treatments, even after applying the HR spectrum (R:W = 3:1) during the late growth stage. Short-term exposure to high proportions of red light during the late growth stage did not significantly increase the leaf area and biomass of pak choi plants (Figure 4). Supplementing red light (600–699 nm) for three days before harvest did not increase the lettuce leaf area [34]. The increase in lettuce biomass accumulation was attributed to larger leaves intercepting and utilizing more light, which leads to higher biomass [35]. The largest leaf area and the highest biomass were recorded in the T4 treatment (Figure 3 and Figure 4). These findings indicated that leaf enlargement was an important driver of biomass accumulation in pak choi under different light regimes, which was consistent with the positive relationship between biomass and leaf area of pak choi observed in this study. A high proportion of red light in the spectrum during the seedling stage was associated with a significant increase in the biomass accumulation of pak choi, an effect that persisted through the growth period until harvest.
Chlorophyll is not only closely associated with plant photosynthesis but is also a determining factor for the coloration of pak choi at harvest, a trait strongly linked with consumer preferences. The biosynthesis of chlorophyll is influenced by the red-to-blue light ratio, as the spectra of red and blue light match the peak absorption areas of chlorophyll [36]. The content of total chlorophyll in lettuce and pak choi was significantly increased by spectra with a low red-to-blue ratio (R:B = 1:4), compared to spectra with a high R:B ratio (4:1) [37]. This study found that the contents of chlorophyll a, chlorophyll b, and total chlorophyll in pak choi significantly increased under a high proportion of blue light spectra (R:W = 1:3) and decreased under a low proportion of blue light spectra (R:W = 3:1) (Figure 5a). This dynamic shift suggests that blue-enriched light might alleviate the inhibition of chlorophyll accumulation typically induced by prolonged exposure to high red-light environments [38]. The chlorophyll contents in lettuce leaves significantly increased in response to a transition from a high (R:B = 89:11) to a low (R:B = 50:50) red-to-blue ratio spectrum, while chlorophyll contents decreased when transitioning from a low to a high red-to-blue ratio spectrum [19]. In this study, across the three growth stages of pak choi, the chlorophyll content increased when the red-to-white light ratio in the current stage’s spectrum was lower than that of the previous stage (e.g., from R:W = 3:1 to R:W = 1:3). Conversely, the chlorophyll content decreased when the red-to-white light ratio increased (Figure 5). The decrease in chlorophyll content observed in the T4 treatment during the late growth stage might be attributed to the larger leaf area of the plants, resulting in dilution of chlorophyll per unit fresh weight (Figure 5a). Carotenoid content has been reported to be regulated by blue light through the induction of BrHY5 expression and the subsequent alteration of carotenoid biosynthetic gene expression in orange-headed Chinese cabbage [39]. The carotenoid content in pak choi sprouts was significantly increased by supplemental blue light compared to white light [40]. In this study, however, dynamic spectral regimens had no significant effect on the carotenoid content across all growth stages. This indicates that carotenoid biosynthesis in pak choi might be less sensitive to these specific R:W shifts compared to chlorophylls. In conclusion, the photosynthetic pigment contents of pak choi were significantly increased by a blue light-enriched spectrum during the seedling stage, with these elevated levels maintained during subsequent growth stages.

4.2. Impacts of Dynamic Light Regimen on Phytonutrient Profiles

The synthesis and degradation of primary and secondary metabolites in plants are affected by the light spectrum. The responses to the red-to-blue light ratio vary among plant species and growth stages. Red light-enriched illumination has been shown to lead to increased levels of soluble sugars and vitamin C, coupled with a decreased content of nitrate in lettuce [41]. Conversely, supplementing blue light during the 10 days preceding harvest elevated the concentrations of vitamin C, soluble proteins, and free amino acids in Chinese kale [20].
Soluble sugars are essential substances for plant growth and development. The accumulation of sugars in plants is inextricably linked to photosynthetic carbon assimilation [42]. A significant increase in sucrose content was observed in tomato under a high red light proportion (R:B = 3:1) [43]. The soluble sugar content in broccoli microgreens was significantly elevated by an increase in the proportion of red light in the spectrum (from R:B = 1:1 to R:B = 5:1) [44]. The soluble sugar content of broccoli was increased by a pre-harvest spectrum with a higher red light proportion spectrum [45]. The application of a higher red light proportion spectrum (R:B = 4:1) two days before harvest was associated with elevated soluble sugar content in lettuce compared to the spectrum of (R:B = 2:1) [46]. This study found that red light-enriched illumination (R:W = 3:1) increased soluble sugar content while reducing chlorophyll content during the late growth stage (Figure 5 and Figure 6a). The accumulation of soluble carbohydrates might reflect reduced photosynthetic activity and increased light inhibition in leaves, a mechanism that supported these results [47]. Altogether, the spectral characteristics during the final growth stage exerted a stronger influence on the soluble sugar content of pak choi than those during the earlier stages.
Nitrate, the primary form of nitrogen uptake, is first reduced to ammonium via the catalytic actions of nitrate reductase and nitrite reductase. This resulting ammonium is subsequently utilized in the synthesis and conversion of amino acids [14]. The dynamic balance between nitrate and soluble protein pools is regulated by environmental conditions. Light exposure has been identified as a crucial environmental factor influencing this dynamic process [48]. Numerous studies have demonstrated that light exposure influences the activity of nitrate reductase and nitrite reductase in plants, thereby altering the contents of nitrate and soluble proteins [49]. Supplementing blue light under white light conditions significantly suppressed nitrate accumulation in lettuce [14]. The content of soluble proteins in Chinese kale was significantly increased by spectra with low red-to-blue ratios (R:B = 2:1) compared to those with high R:B ratios (8:1). The application of a light spectrum with an R:B ratio of 4:1 two days before harvest was associated with a significantly lower nitrate content in lettuce compared to the 8:1 R:B spectrum [46]. Adjusting the light spectrum from an R:B ratio of 5:1 to 2:1 seven days before harvest led to a significant reduction in nitrate levels in spinach, accompanied by increased protein content [50]. In this study, during the late growth stage, a high proportion of blue light spectrum (R:W = 1:3) was associated with a slower decline of soluble protein content in pak choi, although no significant effect on nitrate content was detected (Figure 6b). The light spectrum during the late growth stage was found to be an important regulatory factor for soluble protein content in pak choi, while nitrate contents showed no significant response to light spectrum adjustment under the conditions of this study.
Vitamin C is widely recognized not only as an essential nutrient for the human body but also as a vital antioxidant, playing a significant role in the maintenance of human health [51]. Light regimes have been identified as a key environmental factor governing the synthesis and accumulation of vitamin C in plants. Blue light increased vitamin C content in Chinese cabbage, mediated by the up-regulation of genes associated with its biosynthesis (e.g., BrPGI1, BrPMI1 and BrPMM1) and recycling (e.g., BrAO6, BrAPX6 and BrMDHAR1) [52]. Compared with white light, supplementing with blue light significantly increased the contents of vitamin A and vitamin C in lettuce [53]. A low R:B ratio (4:1) was associated with significantly higher content of vitamin C in green pak choi relative to a high R:B ratio (8:1) [54]. Exposure to a high-proportion blue light spectrum (R:B = 2:1) during the final week before harvest significantly elevated the vitamin C content in spinach at harvest [50]. Compared to the control, the vitamin C content of Chinese Kale during storage was significantly increased by supplementing with 50 μmol·m−2·s−1 of blue light (430 nm) 10 days before harvest. In this study, exposure to a high proportion of blue light (R:W = 1:3) was associated with elevated vitamin C content in pak choi in the early growth stage [20]. Interestingly, the vitamin C content in pak choi was significantly higher when the plants were grown under a low-blue-light spectrum (R:W = 3:1) during the late growth stage than in other treatments (Figure 6d). The low blue light treatment had a smaller leaf area and lower canopy shading, leading to higher light interception per unit leaf area, which might have potentially induced higher activity of vitamin C biosynthesis-related enzymes. However, the high red-light treatment significantly increased the soluble sugar content of leaves, and soluble sugars are the key precursors for vitamin C biosynthesis in plants, which might provide a sufficient substrate for vitamin C synthesis during the late growth stage. Thus, a high proportion of the blue light spectrum was identified as the most significant factor influencing the vitamin C content of pak choi during the early growth stage.
In summary, dynamic lighting strategies were found to significantly affect multiple nutritional parameters in pak choi. Among these, the application of a high-proportion blue light spectrum during the early growth stage was shown to elevate soluble proteins and vitamin C content, with the exception of soluble sugar content; whereas a high red-light treatment during the late growth stage was more beneficial for the accumulation of soluble sugars and vitamin C.

4.3. Impacts of Dynamic Light Regimen on Antioxidant Capacity and Antioxidants

Antioxidants are associated with the prevention of chronic human diseases, such as cardiovascular disease, diabetes, and cancer [55,56]. Vegetables are considered the primary dietary source of antioxidants, including total flavonoids and total polyphenols, for the human body. A significant positive correlation has been widely observed between the antioxidant capacity of plants and their content of phenolic compounds [56]. Light has been confirmed as a crucial environmental factor that regulates the antioxidant capacity and antioxidant content in plants. Under supplemental blue light, a significant increase in antioxidant content coupled with enhanced antioxidant capacity was observed in pak choi compared to plants grown under white light [15]. Exposure to a high-proportion blue light spectrum (R:B = 1:4) was associated with significantly elevated total phenolic content and FRAP values in kale relative to a low-proportion blue light (R:B = 1:1) or white light treatment [20]. As the blue light ratio increased (from R:W = 2:1 to R:W = 1:2), the contents of flavonoids and polyphenols in pak choi, along with the FRAP values, were gradually elevated, while no significant change was observed in the DPPH radical scavenging activity [57]. This selective enhancement is consistent with the established role of shorter-wavelength light in triggering the accumulation of protective phenolic compounds [58]. Pre-harvest supplementation with blue light (50 μmol·m−2·s−1, 10 days) was associated with significantly enhanced antioxidant properties in Chinese kale during storage, as evidenced by elevated total flavonoids, total polyphenols, FRAP values, and DPPH activity [20]. When blue light (100 μmol·m−2·s−1, 455 nm) was supplemented before harvest, the total polyphenol and total flavonoid contents in basil significantly increased at harvest, and the decline in DPPH activity and FRAP values during storage was slowed [34]. In this study, a balanced red-to-white spectrum (R:W = 1:1, T2) during the late growth stage was most effective in mitigating the decline of specific antioxidant capacities (such as FRAP) and compounds (flavonoids), prior to harvest (Figure 7). These outcomes were consistent with our previous study on pak choi [57]. The differential response of FRAP values and DPPH activity to the light spectrum might be attributed to the different detection mechanisms of the two assays: FRAP reflects the total reducing power of all antioxidant components, while DPPH mainly measures the scavenging capacity for specific free radicals, leading to inconsistent trends under partial treatments. Combined with the soluble proteins and vitamin C results, a high blue light treatment during the late growth stage could effectively maintain specific functional attributes (such as soluble proteins, vitamin C, FRAP, and flavonoids) of pak choi, providing a reference for the dynamic light quality regulation of leafy vegetables.

4.4. Methodological Considerations and Future Perspectives

While this study provides valuable insights into the effects of staged spectral regimens, certain methodological considerations should be noted. The experimental design utilized three biological replicates (n = 3), which is adequate for initial exploratory evaluations but may benefit from larger sample sizes in future studies to further solidify the observed developmental trends. Additionally, because the primary objective was to evaluate the relative efficacy among various dynamic sequences, a conventional static-spectrum control was not included. Consequently, the current findings primarily highlight the comparative advantages of different dynamic strategies rather than establishing a direct comparison with static lighting. Future research incorporating static controls and expanded sample sizes will be instrumental in comprehensively validating these dynamic lighting strategies and optimizing their commercial application in plant factories.

5. Conclusions

The growth and metabolite accumulation of pak choi were significantly influenced by the red-to-white (R:W) ratios. A high R:W ratio during the seedling stage increased yield, while a low R:W ratio (high blue light proportion) during the late growth stage enhanced nutritional quality and antioxidant capacity. In this study, the yield of pak choi in the T4 treatment (R:W = 3:1 during the seedling stage, R:W = 1:1 during the early growth stage, and R:W = 1:3 during the late growth stage) was the highest among all treatments. Its shoot fresh weight was significantly higher than that in the other treatments at all growth stages. Conversely, the T2 treatment (R:W = 1:3 during the seedling stage, R:W = 3:1 during the early growth stage, and R:W = 1:1 during the late growth stage) showed the most significant advantages for specific phytochemicals (vitamin C, soluble proteins, and flavonoids) and antioxidant capacities (FRAP) at the harvest stage. Notably, nitrate and carotenoid contents remained largely unaffected by the spectral shifts.
In summary, the staged lighting regimen of the T4 treatment can significantly improve the yield of pak choi in plant factories, whereas the lighting strategy of the T2 treatment can selectively improve the nutritional quality of pak choi, which is highly suitable for the production of high-end functional leafy vegetables. From a practical application perspective in PFALs, the use of dynamic staged regimens not only optimizes specific plant traits but also provides a favorable visual environment for facility management.

Author Contributions

Conceptualization, methodology, validation, formal analysis, data curation, writing—original draft, X.W.; methodology, writing—review and editing, J.J.; methodology, Validation, S.Z., M.Z. and Y.H.; formal analysis, X.Y.; visualization, J.S.; conceptualization, methodology, resources, supervision, project administration, funding acquisition, H.L. All authors have read and agreed to the published version of the manuscript.

Funding

This research was funded by National Key Research and Development of China (2021YFD2000701).

Data Availability Statement

The original contributions presented in this study are included in the article. Further inquiries can be directed to the corresponding author.

Acknowledgments

We thank the anonymous reviewers for their helpful comments, which significantly improved the manuscript.

Conflicts of Interest

The authors declare that they have no known competing financial interests or personal relationships that could have appeared to influence the work reported in this paper.

Abbreviations

The following abbreviations are used in this manuscript:
PFALsplant factories with artificial lighting
DATday after transplanting
R:Wred-to-white light ratio
LEDslight-emitting diodes
DFTdeep-flow technique
PPFDPhotosynthetic Photon Flux Density
PHpotential of hydrogen
R:Bred-to-blue light ratio
DPPH1,1-diphenyl-2-picrylhydrazyl
FRAPferric reducing antioxidant power

References

  1. Kim, M.J.; Moon, Y.; Tou, J.C.; Mou, B.; Waterland, N.L. Nutritional Value, Bioactive Compounds and Health Benefits of Lettuce (Lactuca sativa L.). J. Food Compos. Anal. 2016, 49, 19–34. [Google Scholar] [CrossRef]
  2. Medina-Lozano, I.; Bertolín, J.R.; Díaz, A. Nutritional Value of Commercial and Traditional Lettuce (Lactuca sativa L.) and Wild Relatives: Vitamin C and Anthocyanin Content. Food Chem. 2021, 359, 129864. [Google Scholar] [CrossRef]
  3. Fasciolo, B.; Van Brenk, J.; Verdonk, J.C.; Bakker, E.-J.; Van Mourik, S. Quantifying the Impact of Light on Ascorbic Acid Content in Lettuce: A Model Proposal. Sustainability 2024, 16, 7470. [Google Scholar] [CrossRef]
  4. Dias, J.S. Nutritional Quality and Health Benefits of Vegetables: A Review. Food Nutr. Sci. 2012, 03, 1354–1374. [Google Scholar] [CrossRef]
  5. Lee, J.H.; Kim, E.A.; Sunwoo, Y.; Cha, E.B.; Joo, S.; Lee, S.; Lee, J.G.; Nam, S.Y. Light Spectrum Strategies to Optimize Yield and Physiological Performance of Korean Thistle in a Closed-Type Plant Production System. J. People Plants Environ. 2025, 28, 799–823. [Google Scholar] [CrossRef]
  6. Hasan, M.M.; Bashir, T.; Ghosh, R.; Lee, S.K.; Bae, H. An Overview of LEDs’ Effects on the Production of Bioactive Compounds and Crop Quality. Molecules 2017, 22, 1420. [Google Scholar] [CrossRef]
  7. Shafiq, I.; Hussain, S.; Raza, M.A.; Iqbal, N.; Asghar, M.A.; Raza, A.; Fan, Y.; Mumtaz, M.; Shoaib, M.; Ansar, M.; et al. Crop Photosynthetic Response to Light Quality and Light Intensity. J. Integr. Agric. 2021, 20, 4–23. [Google Scholar] [CrossRef]
  8. Naznin, M.T.; Lefsrud, M.; Gravel, V.; Azad, M.O.K. Blue Light Added with Red LEDs Enhance Growth Characteristics, Pigments Content, and Antioxidant Capacity in Lettuce, Spinach, Kale, Basil, and Sweet Pepper in a Controlled Environment. Plants 2019, 8, 93. [Google Scholar] [CrossRef]
  9. Anum, H.; Cheng, R.; Tong, Y. Improving Plant Growth, Anthocyanin Production and Oxidative Status of Red Lettuce (Lactuca sativa cv. Lolla Rossa) by Optimizing Red to Blue Light Ratio with a Constant Green Light Fraction in a Plant Factory. Sci. Hortic. 2024, 338, 113832. [Google Scholar] [CrossRef]
  10. Luo, S.; Zou, J.; Shi, M.; Lin, S.; Wang, D.; Liu, W.; Shen, Y.; Ding, X.; Jiang, Y. Effects of Red-Blue Light Spectrum on Growth, Yield, and Photo-Synthetic Efficiency of Lettuce in a Uniformly Illumination Environment. Plant Soil Environ. 2024, 70, 305–316. [Google Scholar] [CrossRef]
  11. Vaštakaitė-Kairienė, V.; Brazaitytė, A.; Miliauskienė, J.; Runkle, E.S. Red to Blue Light Ratio and Iron Nutrition Influence Growth, Metabolic Response, and Mineral Nutrients of Spinach Grown Indoors. Sustainability 2022, 14, 12564. [Google Scholar] [CrossRef]
  12. Trouwborst, G.; Hogewoning, S.W.; Van Kooten, O.; Harbinson, J.; Van Ieperen, W. Plasticity of Photosynthesis after the ‘Red Light Syndrome’ in Cucumber. Environ. Exp. Bot. 2016, 121, 75–82. [Google Scholar] [CrossRef]
  13. Son, K.-H.; Oh, M.-M. Growth, Photosynthetic and Antioxidant Parameters of Two Lettuce Cultivars as Affected by Red, Green, and Blue Light-Emitting Diodes. Hortic. Environ. Biotechnol. 2015, 56, 639–653. [Google Scholar] [CrossRef]
  14. Zhang, T.; Shi, Y.; Piao, F.; Sun, Z. Effects of Different LED Sources on the Growth and Nitrogen Metabolism of Lettuce. Plant Cell Tissue Organ Cult. PCTOC 2018, 134, 231–240. [Google Scholar] [CrossRef]
  15. Li, Y.; Zheng, Y.; Zheng, D.; Zhang, Y.; Song, S.; Su, W.; Liu, H. Effects of Supplementary Blue and UV-A LED Lights on Morphology and Phytochemicals of Brassicaceae Baby-Leaves. Molecules 2020, 25, 5678. [Google Scholar] [CrossRef]
  16. Kong, Y.; Nemali, K. Blue and Far-Red Light Affect Area and Number of Individual Leaves to Influence Vegetative Growth and Pigment Synthesis in Lettuce. Front. Plant Sci. 2021, 12, 667407. [Google Scholar] [CrossRef]
  17. Bantis, F.; Smirnakou, S.; Ouzounis, T.; Koukounaras, A.; Ntagkas, N.; Radoglou, K. Current Status and Recent Achievements in the Field of Horticulture with the Use of Light-Emitting Diodes (LEDs). Sci. Hortic. 2018, 235, 437–451. [Google Scholar] [CrossRef]
  18. Spalholz, H.; Perkins-Veazie, P.; Hernández, R. Impact of Sun-Simulated White Light and Varied Blue:Red Spectrums on the Growth, Morphology, Development, and Phytochemical Content of Green- and Red-Leaf Lettuce at Different Growth Stages. Sci. Hortic. 2020, 264, 109195. [Google Scholar] [CrossRef]
  19. Van Brenk, J.B.; Hendriks, L.; Rei, A.; Marcelis, L.F.M.; Verdonk, J.C. Dynamic Application of High and Low Red:Blue Ratios During Lettuce Development Shifts Growth and Metabolite Allocation. Physiol. Plant. 2025, 177, e70456. [Google Scholar] [CrossRef]
  20. Jiang, H.; Li, X.; Tian, J.; Liu, H. Pre-Harvest Supplemental Blue Light Enhanced Antioxidant Activity of Flower Stalk in Chinese Kale during Storage. Plants 2021, 10, 1177. [Google Scholar] [CrossRef]
  21. Trisno, J.; Neo, D.C.J.; Ong, M.M.X.; Ng, R.J.H.; Tan, C.Y.L.; Lee, I.S.H.; Chu, H.S.; Teo, E.J. Enhancing LED Spectral Output with Perylene Dye-Based Remote Phosphor. Sci. Rep. 2023, 13, 10841. [Google Scholar] [CrossRef]
  22. Edelenbos, M.; Christensen, L.P.; Grevsen, K. HPLC Determination of Chlorophyll and Carotenoid Pigments in Processed Green Pea Cultivars ( Pisum sativum L.). J. Agric. Food Chem. 2001, 49, 4768–4774. [Google Scholar] [CrossRef]
  23. Candiano, G.; Bruschi, M.; Musante, L.; Santucci, L.; Ghiggeri, G.M.; Carnemolla, B.; Orecchia, P.; Zardi, L.; Righetti, P.G. Blue Silver: A Very Sensitive Colloidal Coomassie G-250 Staining for Proteome Analysis. Electrophoresis 2004, 25, 1327–1333. [Google Scholar] [CrossRef]
  24. Kohyama, K.; Nishinari, K. Effect of Soluble Sugars on Gelatinization and Retrogradation of Sweet Potato Starch. J. Agric. Food Chem. 1991, 39, 1406–1410. [Google Scholar] [CrossRef]
  25. Chen, G.; Mo, L.; Li, S.; Zhou, W.; Wang, H.; Liu, J.; Yang, C. Separation and Determination of Reduced Vitamin C in Polymerized Hemoglobin-Based Oxygen Carriers of the Human Placenta. Artif. Cells Nanomed. Biotechnol. 2015, 43, 152–156. [Google Scholar] [CrossRef]
  26. Cataldo, D.A.; Maroon, M.; Schrader, L.E.; Youngs, V.L. Rapid Colorimetric Determination of Nitrate in Plant Tissue by Nitration of Salicylic Acid. Commun. Soil Sci. Plant Anal. 1975, 6, 71–80. [Google Scholar] [CrossRef]
  27. Rahman, M.J.; Costa De Camargo, A.; Shahidi, F. Phenolic Profiles and Antioxidant Activity of Defatted Camelina and Sophia Seeds. Food Chem. 2018, 240, 917–925. [Google Scholar] [CrossRef] [PubMed]
  28. Xie, Y.; Zheng, Y.; Dai, X.; Wang, Q.; Cao, J.; Xiao, J. Seasonal Dynamics of Total Flavonoid Contents and Antioxidant Activity of Dryopteris Erythrosora. Food Chem. 2015, 186, 113–118. [Google Scholar] [CrossRef]
  29. Musa, K.H.; Abdullah, A.; Kuswandi, B.; Hidayat, M.A. A Novel High Throughput Method Based on the DPPH Dry Reagent Array for Determination of Antioxidant Activity. Food Chem. 2013, 141, 4102–4106. [Google Scholar] [CrossRef] [PubMed]
  30. Benzie, I.F.F.; Strain, J.J. The Ferric Reducing Ability of Plasma (FRAP) as a Measure of “Antioxidant Power”: The FRAP Assay. Anal. Biochem. 1996, 239, 70–76. [Google Scholar] [CrossRef]
  31. Le, T.M.; Sago, Y.; Ibaraki, Y.; Harada, K.; Arai, K.; Ishizaki, Y.; Aoki, H.; Abdelrahman, M.; Kik, C.; Van Treuren, R.; et al. Effect of LED Irradiation with Different Red-to-Blue Light Ratios on Growth and Functional Compound Accumulations in Spinach (Spinacia oleracea L.) Accessions and Wild Relatives. Plants 2025, 14, 700. [Google Scholar] [CrossRef]
  32. Van Brenk, J.B.; Vanderwolk, K.R.; Seo, S.; Choi, Y.H.; Marcelis, L.F.; Verdonk, J.C. Blue Light Sonata: Dynamic Variation of Red:Blue Ratio during the Photoperiod Differentially Affects Leaf Photosynthesis, Pigments, and Growth in Lettuce. Plant Biol. 2025, 223, 109861. [Google Scholar] [CrossRef]
  33. Wang, J.; Lu, W.; Tong, Y.; Yang, Q. Leaf Morphology, Photosynthetic Performance, Chlorophyll Fluorescence, Stomatal Development of Lettuce (Lactuca sativa L.) Exposed to Different Ratios of Red Light to Blue Light. Front. Plant Sci. 2016, 7, 250. [Google Scholar] [CrossRef]
  34. Hooks, T.; Sun, L.; Kong, Y.; Masabni, J.; Niu, G. Short-Term Pre-Harvest Supplemental Lighting with Different Light Emitting Diodes Improves Greenhouse Lettuce Quality. Horticulturae 2022, 8, 435. [Google Scholar] [CrossRef]
  35. Jin, W.; Ji, Y.; Larsen, D.H.; Huang, Y.; Heuvelink, E.; Marcelis, L.F.M. Gradually Increasing Light Intensity during the Growth Period Increases Dry Weight Production Compared to Constant or Gradually Decreasing Light Intensity in Lettuce. Sci. Hortic. 2023, 311, 111807. [Google Scholar] [CrossRef]
  36. Terashima, I.; Fujita, T.; Inoue, T.; Chow, W.S.; Oguchi, R. Green Light Drives Leaf Photosynthesis More Efficiently than Red Light in Strong White Light: Revisiting the Enigmatic Question of Why Leaves Are Green. Plant Cell Physiol. 2009, 50, 684–697. [Google Scholar] [CrossRef]
  37. Bantis, F.; Simos, N.; Koukounaras, A. Plant Factory in a Restaurant: Light Quality Effects on the Development, Physiology, and Quality of Three Baby-Leaf Vegetables. Plants 2025, 14, 153. [Google Scholar] [CrossRef]
  38. Fan, X.; Zang, J.; Xu, Z.; Guo, S.; Jiao, X.; Liu, X.; Gao, Y. Effects of Different Light Quality on Growth, Chlorophyll Concentration and Chlorophyll Biosynthesis Precursors of Non-Heading Chinese Cabbage (Brassica campestris L.). Acta Physiol. Plant. 2013, 35, 2721–2726. [Google Scholar] [CrossRef]
  39. Zhang, R.; Zhang, N.; Wang, Y.; Khan, A.; Ma, S.; Bai, X.; Zeng, Q.; Pan, Q.; Li, B.; Zhang, L. Blue Light Induces Leaf Color Change by Modulating Carotenoid Metabolites in Orange-Head Chinese Cabbage (Brassica rapa L. ssp. pekinensis). J. Integr. Agric. 2023, 22, 3296–3311. [Google Scholar] [CrossRef]
  40. Frede, K.; Baldermann, S. Accumulation of Carotenoids in Brassica rapa ssp. chinensis by a High Proportion of Blue in the Light Spectrum. Photochem. Photobiol. Sci. 2022, 21, 1947–1959. [Google Scholar] [CrossRef]
  41. Chen, X.; Li, Y.; Wang, L.; Guo, W. Red and Blue Wavelengths Affect the Morphology, Energy Use Efficiency and Nutritional Content of Lettuce (Lactuca sativa L.). Sci. Rep. 2021, 11, 8374. [Google Scholar] [CrossRef]
  42. Courbier, S.; Grevink, S.; Sluijs, E.; Bonhomme, P.; Kajala, K.; Van Wees, S.C.M.; Pierik, R. Far-red Light Promotes Botrytis cinerea Disease Development in Tomato Leaves via Jasmonate-dependent Modulation of Soluble Sugars. Plant Cell Environ. 2020, 43, 2769–2781. [Google Scholar] [CrossRef]
  43. Li, Y.; Xin, G.; Wei, M.; Shi, Q.; Yang, F.; Wang, X. Carbohydrate Accumulation and Sucrose Metabolism Responses in Tomato Seedling Leaves When Subjected to Different Light Qualities. Sci. Hortic. 2017, 225, 490–497. [Google Scholar] [CrossRef]
  44. Luo, L.; Zhang, G.; Liang, W.; Wu, D.; Sun, Q.; Hao, Y. Effects of LED Light Quality on Broccoli Microgreens Plant Growth and Nutrient Accumulation. J. Plant Growth Regul. 2024, 43, 3481–3489. [Google Scholar] [CrossRef]
  45. Steindal, A.L.H.; Johansen, T.J.; Bengtsson, G.B.; Hagen, S.F.; Mølmann, J.A. Impact of Pre-Harvest Light Spectral Properties on Health- and Sensory-Related Compounds in Broccoli Florets. J. Sci. Food Agric. 2016, 96, 1974–1981. [Google Scholar] [CrossRef] [PubMed]
  46. Wanlai, Z.; Wenke, L.; Qichang, Y. Reducing Nitrate Content in Lettuce by Pre-harvest Continuous Light Delivered by Red and Blue Light-emitting Diodes. J. Plant Nutr. 2013, 36, 481–490. [Google Scholar] [CrossRef]
  47. Urban, L.; Alphonsout, L. Girdling Decreases Photosynthetic Electron Fluxes and Induces Sustained Photoprotection in Mango Leaves. Tree Physiol. 2007, 27, 345–352. [Google Scholar] [CrossRef]
  48. Anjana, S.U.; Iqbal, M. Nitrate Accumulation in Plants, Factors Affecting the Process, and Human Health Implications. A Review. Agron. Sustain. Dev. 2007, 27, 45–57. [Google Scholar] [CrossRef]
  49. Bian, Z.-H.; Cheng, R.-F.; Yang, Q.-C.; Wang, J.; Lu, C. Continuous Light from Red, Blue, and Green Light-Emitting Diodes Reduces Nitrate Content and Enhances Phytochemical Concentrations and Antioxidant Capacity in Lettuce. J. Am. Soc. Hortic. Sci. 2016, 141, 186–195. [Google Scholar] [CrossRef]
  50. Gulyás, Z.; Szalai, G.; Utasi, L.; Darko, E. Pre-Harvest Light Modifications Improve Yield Quality by Modifying Ascorbate and Nitrate Metabolism in Spinach Leaves. J. Plant Growth Regul. 2025, 1–17. [Google Scholar] [CrossRef]
  51. Padayatty, S.; Levine, M. Vitamin C: The Known and the Unknown and Goldilocks. Oral Dis. 2016, 22, 463–493. [Google Scholar] [CrossRef]
  52. Kang, C.H.; Yoon, E.K.; Muthusamy, M.; Kim, J.A.; Jeong, M.-J.; Lee, S.I. Blue LED Light Irradiation Enhances L-Ascorbic Acid Content While Reducing Reactive Oxygen Species Accumulation in Chinese Cabbage Seedlings. Sci. Hortic. 2020, 261, 108924. [Google Scholar] [CrossRef]
  53. Li, Y.; Wu, L.; Jiang, H.; He, R.; Song, S.; Su, W.; Liu, H. Supplementary Far-Red and Blue Lights Influence the Biomass and Phytochemical Profiles of Two Lettuce Cultivars in Plant Factory. Molecules 2021, 26, 7405. [Google Scholar] [CrossRef]
  54. Anum, H.; Wang, Y.; Li, Y.; Sun, G.; Luo, J.; Gruda, N.S.; Liu, G.; Tong, Y. Physiological and Nutritional Responses of Two Pakchoi (Brassica chinensis) Cultivars to Different Red-Blue Light Ratios in Controlled Environment. Front. Sustain. Food Syst. 2025, 9, 1561118. [Google Scholar] [CrossRef]
  55. Šamec, D.; Karalija, E.; Šola, I.; Vujčić Bok, V.; Salopek-Sondi, B. The Role of Polyphenols in Abiotic Stress Response: The Influence of Molecular Structure. Plants 2021, 10, 118. [Google Scholar] [CrossRef] [PubMed]
  56. Podsędek, A.; Frąszczak, B.; Sosnowska, D.; Kajszczak, D.; Szymczak, K.; Bonikowski, R. LED Light Quality Affected Bioactive Compounds, Antioxidant Potential, and Nutritional Value of Red and White Cabbage Microgreens. Appl. Sci. 2023, 13, 5435. [Google Scholar] [CrossRef]
  57. He, X.; He, R.; Li, Y.; Liu, K.; Tan, J.; Chen, Y.; Liu, X.; Liu, H. Effect of Ratios of Red and White Light on the Growth and Quality of Pak Choi. Agronomy 2022, 12, 2322. [Google Scholar] [CrossRef]
  58. Fu, X.; He, Y.; Li, L.; Zhao, L.; Wang, Y.; Qian, H.; Sun, X.; Tang, K.; Zhao, J. Overexpression of Blue Light Receptor AaCRY1 Improves Artemisinin Content in Artemisia annua L. Biotechnol. Appl. Biochem. 2021, 68, 338–344. [Google Scholar] [CrossRef]
Figure 1. (a) Light spectral treatments and (b) photon flux density of three distinct light spectra. Plants were divided into three growth stages, each lasting 15 days, totaling 45 days from germination to harvest. Three distinct light spectra were applied: red light: white light = 3:1 (red box), red light: white light = 1:1 (yellow box), and red light: white light = 1:3 (blue box). Different light spectral treatments were applied during each growth stage, with destructive sampling performed at stage termination for subsequent phenotypic and biochemical analysis.
Horticulturae 12 00618 g001
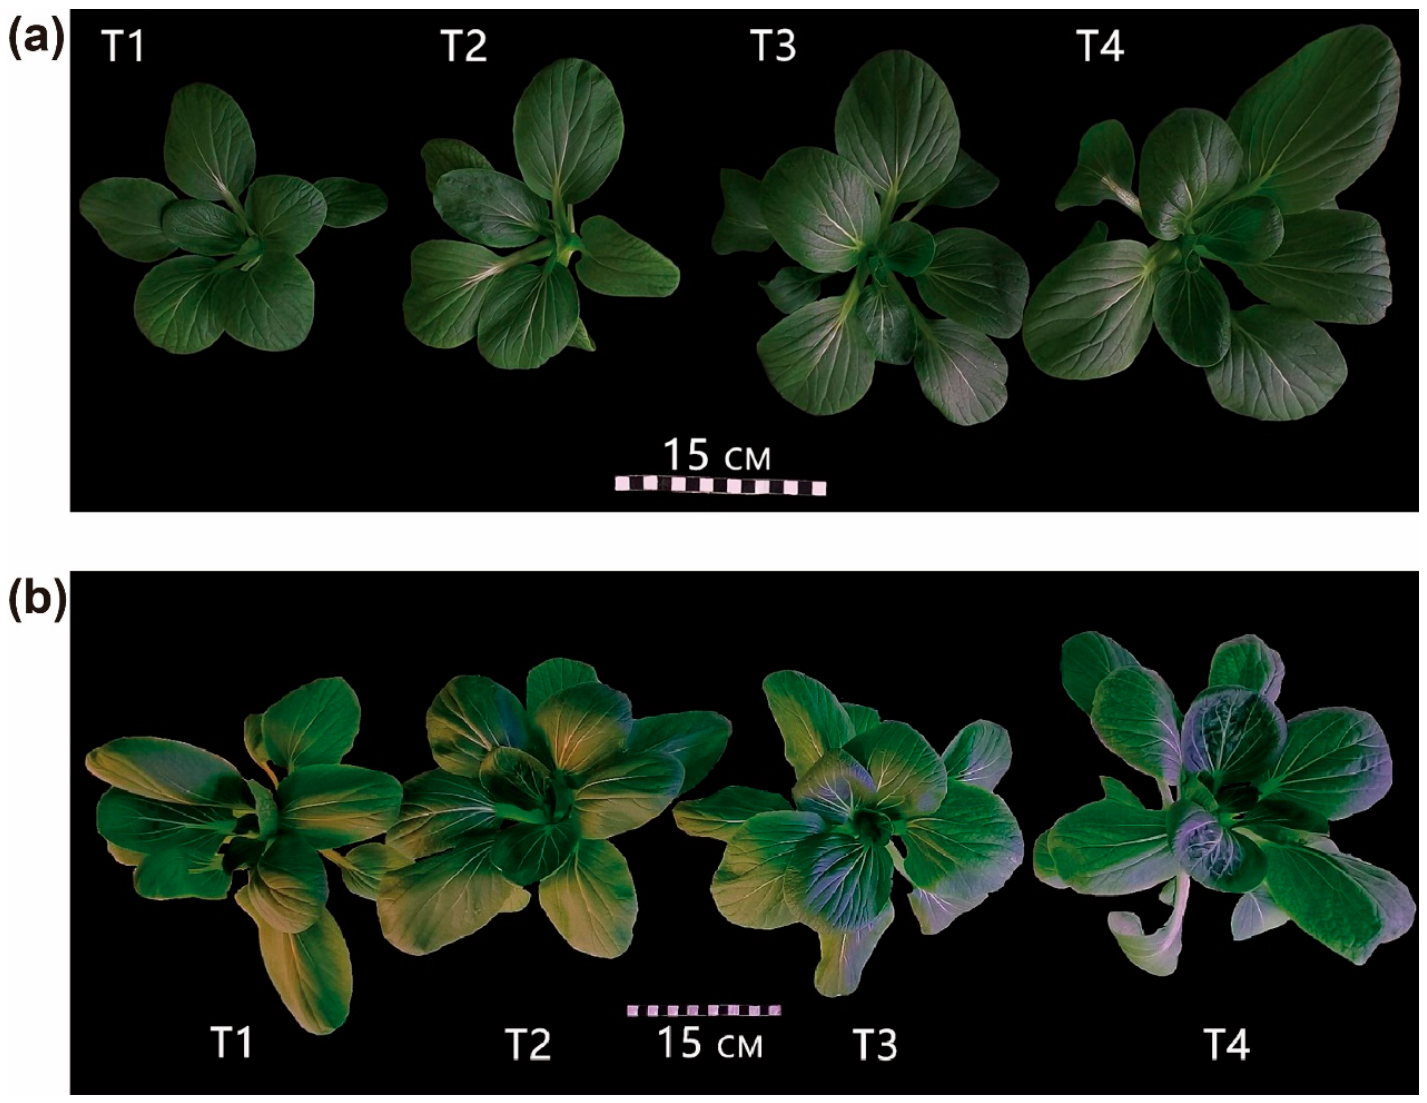
Figure 2. (a) Plant phenotypic performance at the early growth stage. (b) Plant phenotypic performance at the late growth stage.
Horticulturae 12 00618 g002
Figure 3. Impacts of staged Spectral Regimens on Biomass Partitioning in pak choi: Temporal Analysis of Shoot and Root Fresh (a)/Dry (b) Matter Accumulation. The asterisk denotes statistically significant differences in intergroup comparisons during the seedling stage (independent samples t-test). Different letters indicate significant differences between treatments at the same growth stage (p < 0.05, one-way ANOVA with Tukey’s HSD test).
Horticulturae 12 00618 g003
Figure 4. Effects of staged Spectral Regimens on Leaf Area Expansion in pak choi Across Developmental Stages. The asterisk denotes statistically significant differences in intergroup comparisons during the seedling stage (independent samples t-test). Different letters indicate significant differences between treatments at the same growth stage (p < 0.05, one-way ANOVA with Tukey’s HSD test).
Horticulturae 12 00618 g004
Figure 5. Effects of staged Spectral Regimens on Chlorophyll a, Chlorophyll b, and Total Chlorophyll (a) and Carotenoids (b) in pak choi Leaves at Different Growth Stages. The asterisk denotes statistically significant differences in intergroup comparisons during the seedling stage (independent samples t-test). Different letters indicate significant differences between treatments at the same growth stage (p < 0.05, one-way ANOVA with Tukey’s HSD test).
Horticulturae 12 00618 g005
Figure 6. Staged Spectral Strategies Modulate Nutritional Metabolite Profiles in pak choi: Soluble Sugars (a), Soluble Proteins (b), Nitrates (c) and Vitamin C (d) Dynamics Across Developmental Stages. ES means the early growth stage, whereas LS means the late growth stage. Different letters indicate significant differences between treatments at the same growth stage (p < 0.05, one-way ANOVA with Tukey’s HSD test).
Horticulturae 12 00618 g006
Figure 7. Dynamic Spectral Strategies Modulate Antioxidant Content and Antioxidant Activity Profiles in pak choi: (a) total phenolics, (b) total flavonoids, (c) 2,2-diphenyl-1-picrylhydrazyl (DPPH), and (d) ferric-reducing antioxidant power (FRAP) Dynamics Across Developmental Stages. ES means the early growth stage, whereas LS means the late growth stage. Different letters indicate significant differences between treatments at the same growth stage (p < 0.05, one-way ANOVA with Tukey’s HSD test).
Horticulturae 12 00618 g007
Table 1. Lighting parameters of treatments. photon flux density (μmol·m−2·s−1).
Spectral Composition and Light TreatmentSeedling StageThe Early Growth StageThe Late Growth Stage
Red LightWhite LightRed LightWhite LightRed LightWhite Light
TI5015010010015050
T25015015050100100
T31505050150100100
T41505010010050150
Disclaimer/Publisher’s Note: The statements, opinions and data contained in all publications are solely those of the individual author(s) and contributor(s) and not of MDPI and/or the editor(s). MDPI and/or the editor(s) disclaim responsibility for any injury to people or property resulting from any ideas, methods, instructions or products referred to in the content.