Article

Influence of Light Quality on the Growth of Machine-Compatible Tomato Seedlings Before and After Grafting

1
College of Agriculture, South China Agricultural University, Guangzhou 510642, China
2
College of Engineering, South China Agricultural University, Guangzhou 510642, China
3
College of Mechanical and Electrical Engineering, Zhongkai University of Agriculture and Engineering, Guangzhou 510225, China
4
Guangdong Provincial Improved Variety Introduce Service Corp., Guangzhou 510620, China
*
Authors to whom correspondence should be addressed.
Horticulturae 2026, 12(3), 340; https://doi.org/10.3390/horticulturae12030340
Submission received: 25 January 2026 / Revised: 26 February 2026 / Accepted: 27 February 2026 / Published: 11 March 2026
(This article belongs to the Special Issue Optimized Light Management in Controlled-Environment Horticulture)

Abstract

Tomato (Solanum lycopersicum L.) is an economically important horticultural crop. The application of mechanical grafting technology enables the efficient, large-scale production of grafted tomato seedlings, which is of great significance for overcoming continuous cropping obstacles and boosting tomato yield. In this study, tomato cultivar ‘Juxiang 1809’ as the scion and ‘T17-2’ as the rootstock were used to systematically investigate the effects of red-blue light quality pretreatments on tomato grafted seedlings. The rootstock and scion seedlings were cultivated under white (W), pure red (R), pure blue (B), and five mixed red-blue lights (R7B1, R3B1, R1B1, R1B3, R1B7). Our results demonstrated that R3B1 (Red: Blue = 3:1) yielded the highest scion comprehensive score (2.06), promoting balanced growth with robust stem diameter (2.75 mm) and high aboveground dry weight (0.36 g). For rootstocks, R3B1 also excelled, driving optimal root development with maximum root area (26.32 cm2) and dry weight (0.046 g). Post-grafting, R3B1-pre-treated seedlings maintained vigorous growth with enhanced photosynthetic capacity (37.10) and biomass accumulation. These findings demonstrate that R3B1 light quality is highly effective. It optimizes both scion vigor and rootstock root architecture. This offers a practical light-regulation strategy. It is applicable to the production of high-quality, machine-compatible tomato grafted seedlings in controlled environments.

1. Introduction

China ranks as the world’s largest producer of tomatoes. By 2025, the total cultivation area will have reached 2.12 million hectares. Grafting is a pivotal agronomic practice for mitigating continuous cropping obstacles and enhancing plant stress resistance [1,2,3], which in turn improve tomato yield and fruit quality [4,5]. Consequently, this technology is indispensable for the sustainable development of the tomato industry.
Despite the escalating market demand for grafted tomato seedlings [6], grafting operations in China are still predominantly reliant on manual labor [7]. This manual grafting process is constrained by low operational efficiency, high labor input costs, and challenges in recruiting and training skilled grafting technicians [8]. Mechanized grafting has emerged as a feasible strategy to enhance efficiency and reduce dependence on specialized labor [8]. However, with the industry advancing toward mechanization and standardization, a critical technical bottleneck has become increasingly prominent: the morphological characteristics of rootstock and scion seedlings fail to meet the stringent requirements of automated grafting equipment [7,9]. Thus, breeding tomato seedlings with favorable machine compatibility has become an urgent priority for resolving this industrial dilemma.
Plant factories enable the precise regulation of environmental factors, including temperature, light, water, CO2 concentration, and nutrient supply [10,11,12]. Thereby providing an efficient and stable system for producing tomato seedlings with consistent morphological traits and standardized specifications [13]. Among these environmental cues, light quality is a key regulatory factor governing plant morphogenesis. Specifically, red light enhances photosynthetic efficiency [14,15,16] and modulates the allocation and accumulation of photosynthetic products and nutrients [17,18]. In contrast, blue light effectively suppresses hypocotyl elongation [19] and regulates leaf morphogenesis and chlorophyll biosynthesis [20]. Red and blue light exert synergistic and antagonistic effects on plant growth and development [21,22]. Rational optimization of red-blue light ratios can precisely modulate key morphological traits of tomato seedlings. These traits include plant height, stem diameter and hypocotyl length [13,23,24]. This optimization provides critical technical support for machine-compatible seedling production.
Automated grafting equipment imposes specific morphological requirements on rootstock and scion seedlings. This study aims to elucidate the key physiological factors through which light quality influences the mechanical adaptive traits of tomato seedlings. It also seeks to cultivate rootstock and scion seedlings with excellent adaptability to mechanized grafting. Additionally, the study intends to evaluate their post-grafting growth performance under field conditions. To achieve these objectives, this study systematically investigated the effects of light quality on the pre-grafting development of machine-compatible tomato seedlings, as well as the subsequent in-field performance of grafted plants derived from rootstocks and scions cultured under consistent light conditions. The findings of this study are expected to provide a theoretical basis and technical guidance for promoting the mechanization of grafting in the tomato industry.

2. Materials and Methods

2.1. Seed Treatment

The scion cultivar used in this study was ‘Juxiang 1809’, and the rootstock cultivar was ‘T17-2’ (both obtained from Guangdong Provincial Improved Variety Introduce Service Corp, Guangzhou, China).
Prior to sowing, seeds were soaked in warm water at 50 °C with continuous stirring and then allowed to cool naturally to room temperature. After 5 h of imbibition, the seeds were placed on moist gauze and germinated in an incubator at 30 °C.

2.2. Seedling Experiment Under Different Light Qualities

A single-factor completely randomized design was used to evaluate the effects of light quality on seedling growth.

2.2.1. Environment Treatments

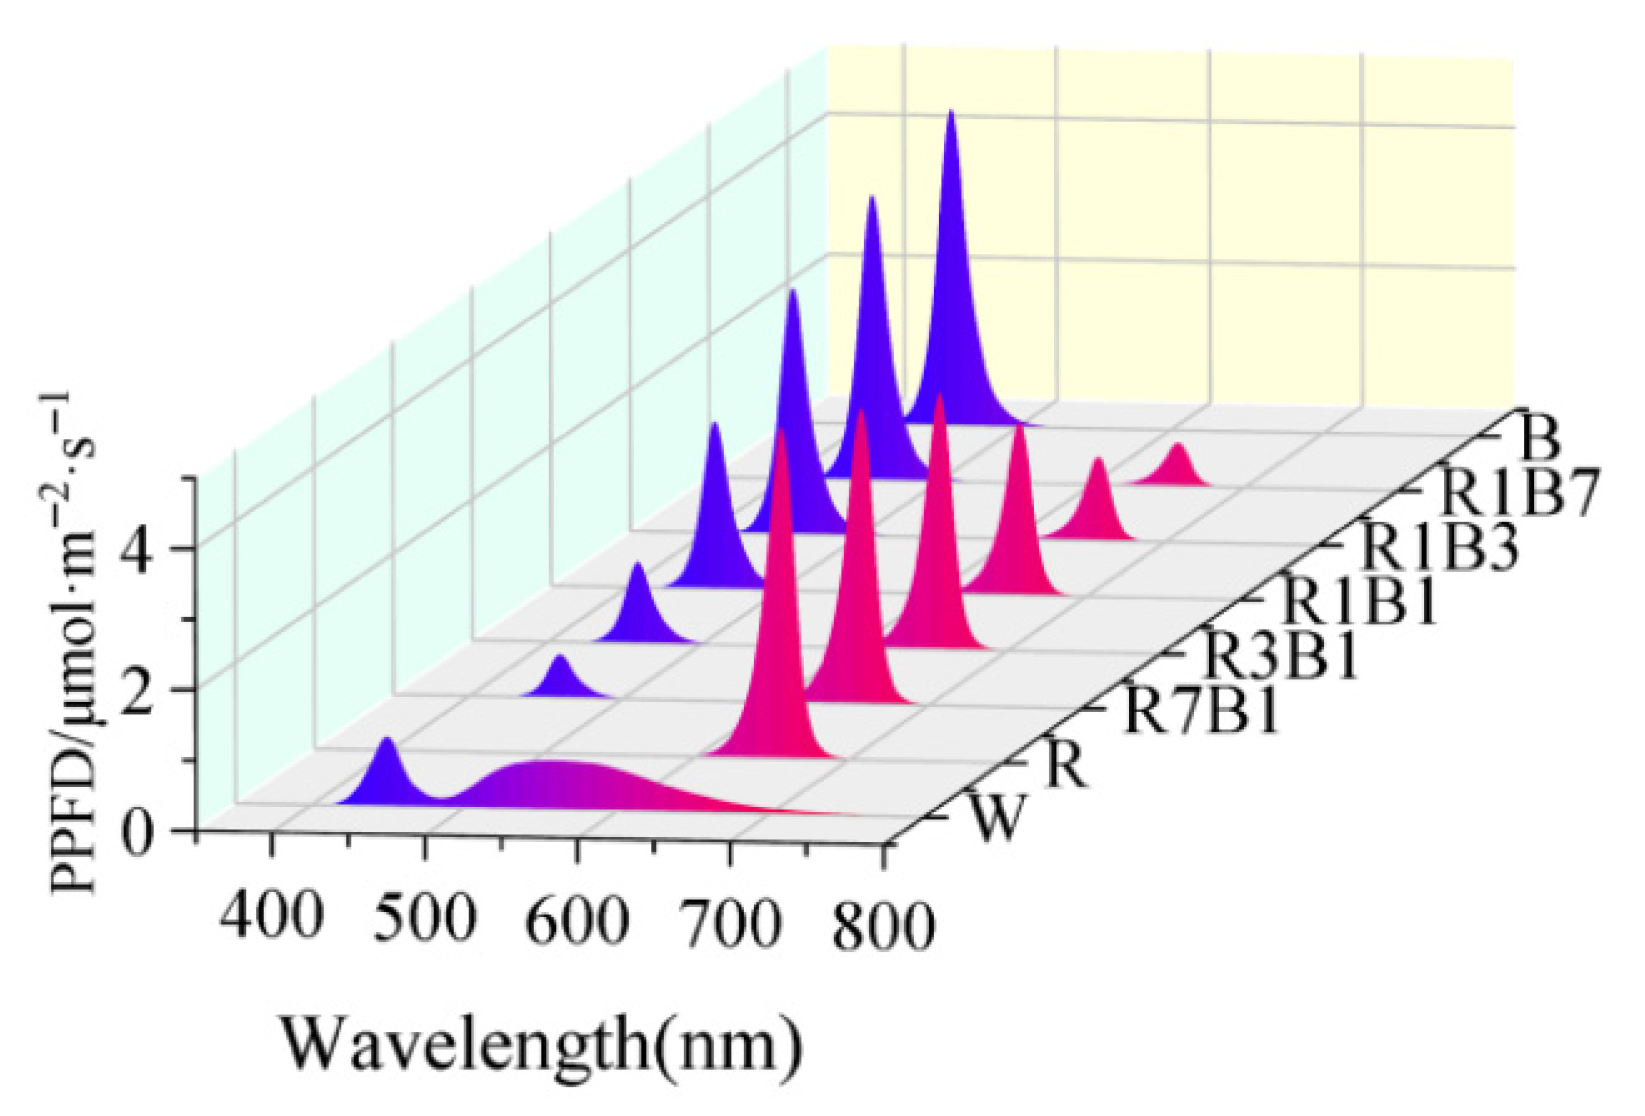
Eight light spectra were provided using LED panels: white light (W), red light (R), blue light (B), and five red–blue combinations with varying ratios (R7B1, R3B1, R1B1, R1B3, and R1B7), where the numerical values represent the relative photon flux proportions of red to blue light (Figure 1).
All treatments were delivered at a constant photosynthetic photon flux density (PPFD) of 180 μmol m−2 s−1 under a 15 h daily photoperiod. The peak wavelengths of red and blue light were 656 nm and 458 nm, respectively. The spectral distribution of each treatment was recorded using a spectrometer (LI-180, LI-COR Biosciences, Lincoln, NE, USA).

2.2.2. Seedling Cultivation and Nutrient Management

Germinated seeds were sown in 72-cell plug trays (540 × 280 × 50 mm, length × width × height) with 1.5 L of water applied to each tray at sowing. The growth substrate comprised a 3:1 (v/v) mixture of peat moss and perlite.
The plug trays were placed in a controlled-environment plant factory. Day and night air temperatures were maintained at 25 ± 1 °C and 20 ± 1 °C, respectively, whereas relative humidity was regulated at 75% ± 5%. All light treatments were subjected to consistent irrigation and nutrient management regimes. From 1 to 10 days after sowing (DAS), the trays were irrigated with water at 5-day intervals. Commencing from 10 DAS, a tomato-specific nutrient solution was supplied at 3-day intervals.
The nutrient solution was formulated using tomato nutrient salts (NSP1100, Coolaber, Beijing, China) in accordance with the manufacturer’s instructions. Unless otherwise specified, the identical nutrient formula was employed consistently throughout the experimental period. The nutrient solution consisted of (mg·L−1): KNO3 (151.7), MgSO4 (90.3), KH2PO4 (113), K2SO4 (144.6), H3BO3 (0.717), MnSO4·H2O (0.406), ZnSO4·7H2O (0.058), CuSO4·5H2O (0.025), FeNaEDTA (18.35), and Na2MoO4·2H2O (0.024). A 2000*calcium stock solution containing Ca(NO3)2·4H2O (378.8 mg·mL−1) was prepared separately. For nutrient solution preparation, 519 mg of the dry mixture and 0.5 mL of the calcium stock solution were dissolved in 1 L of water.

2.2.3. Data Collection Time

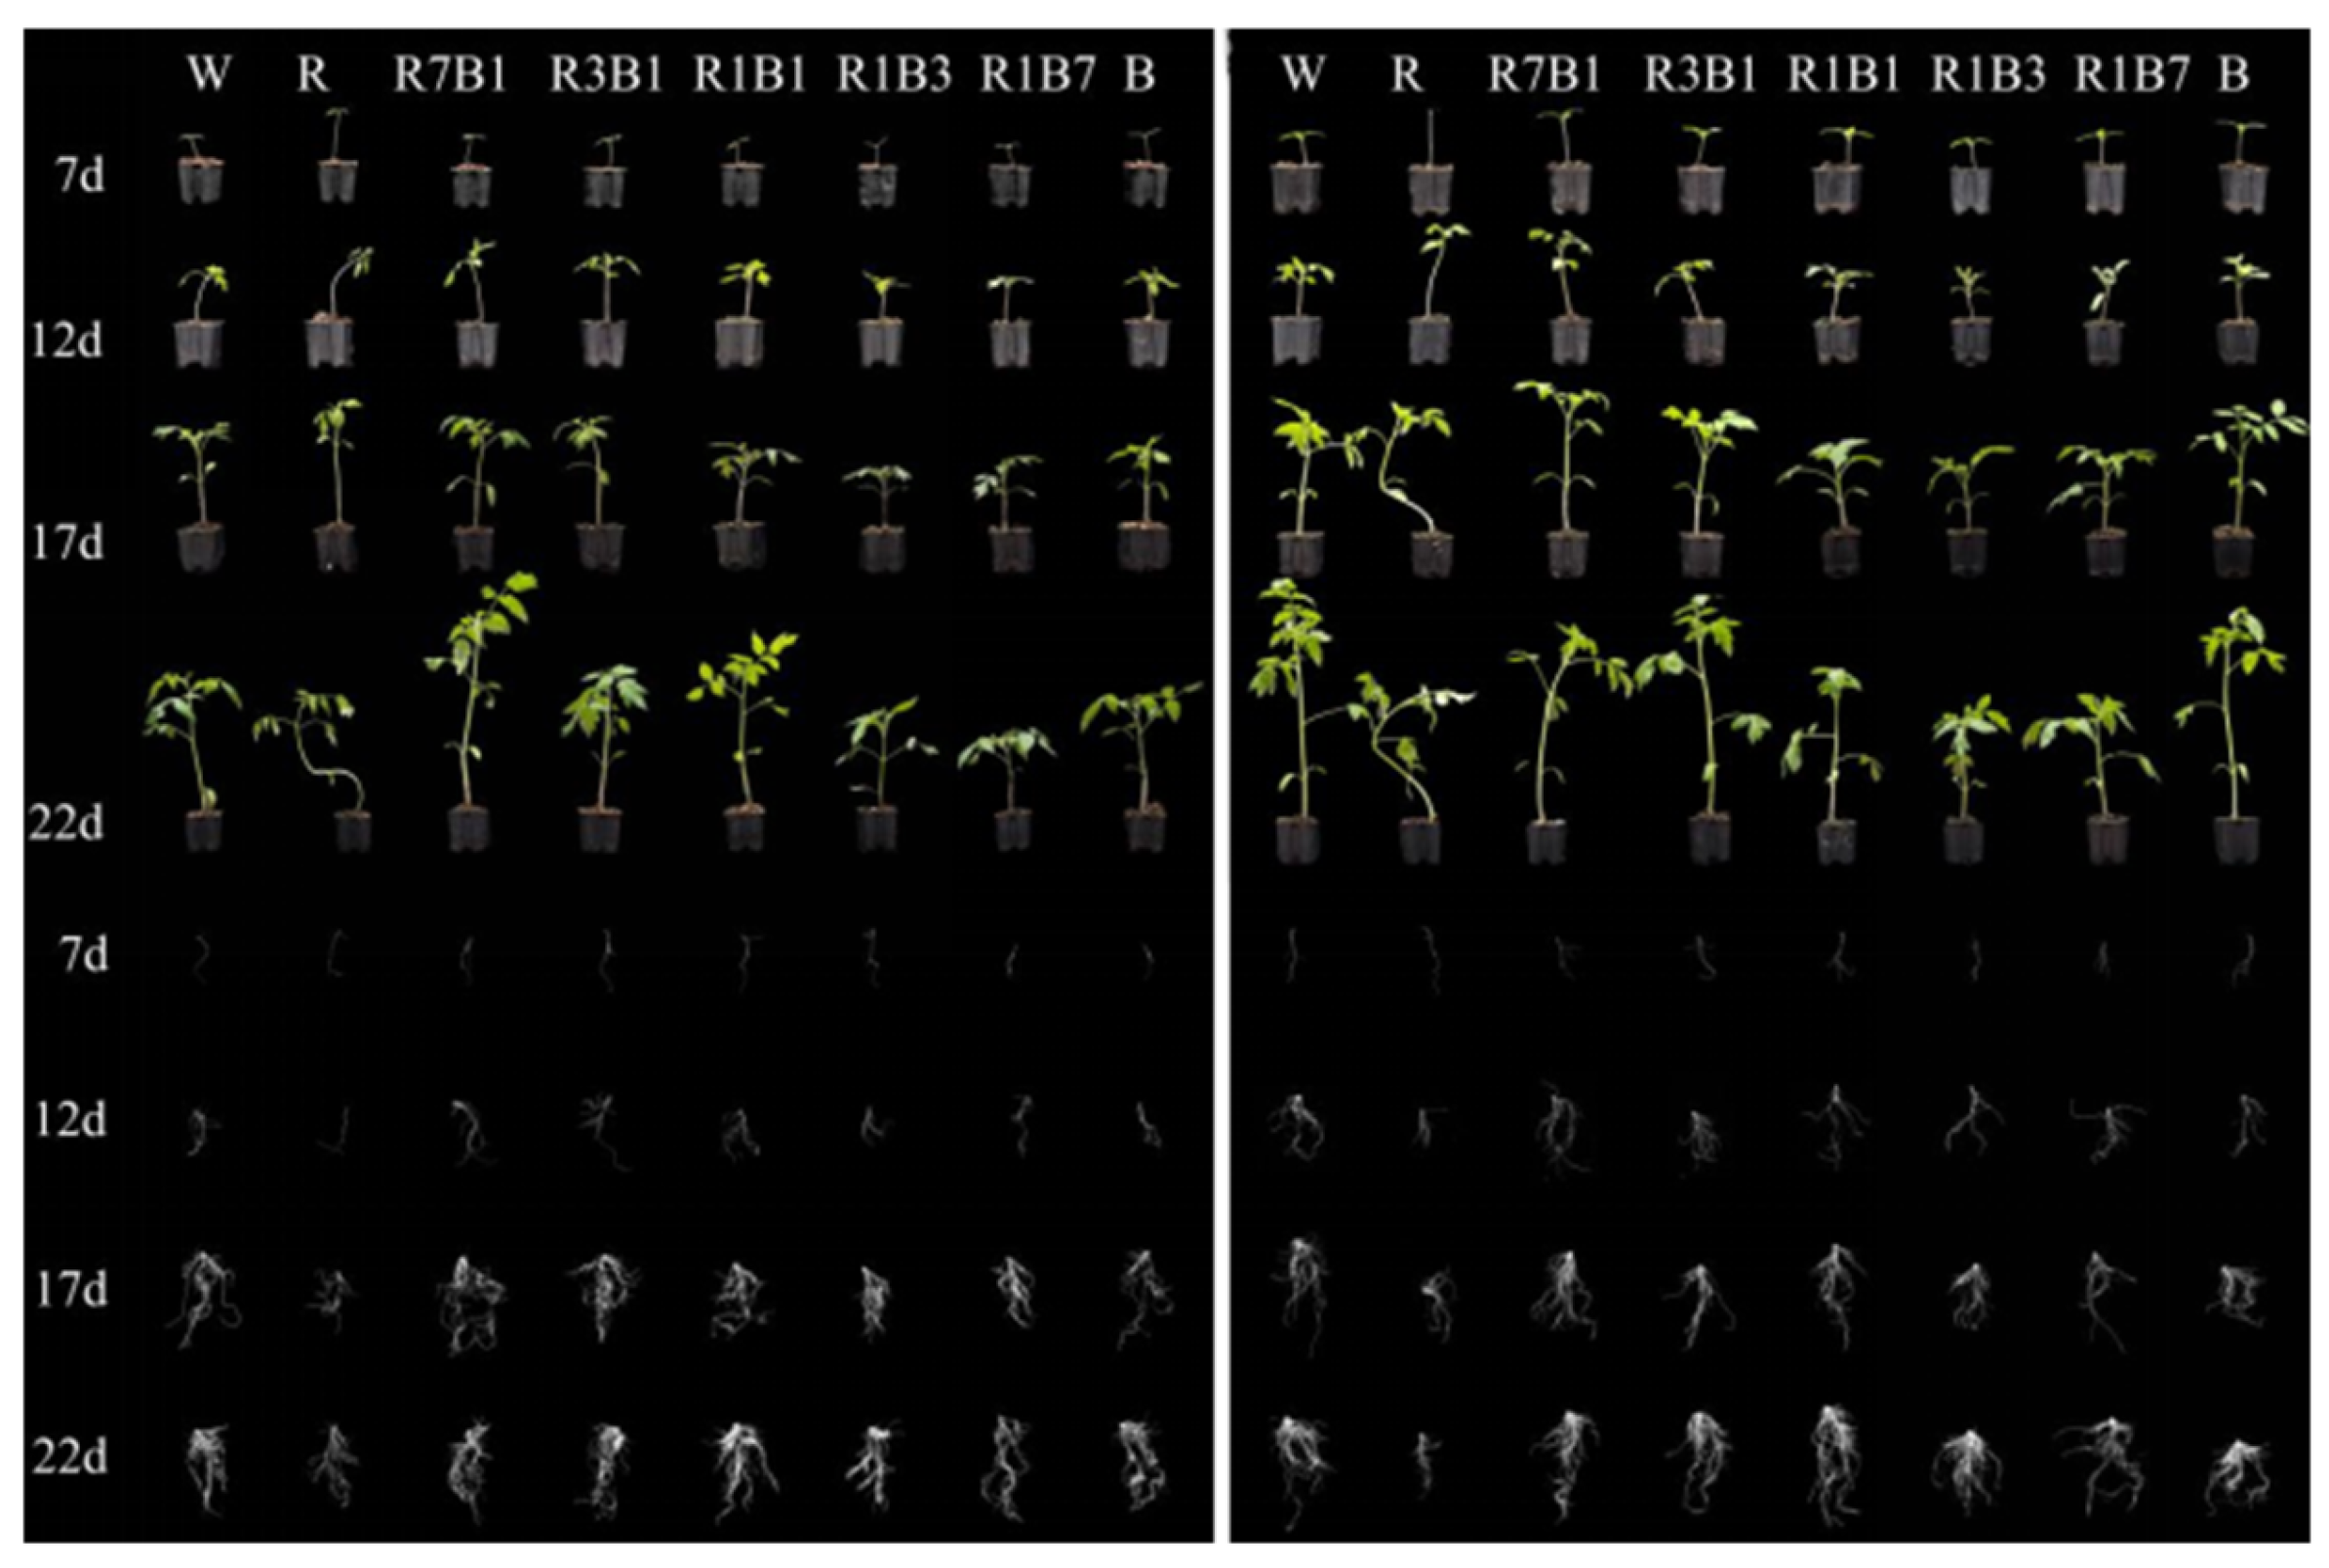
A tracking investigation was conducted on rootstock and scion seedlings. Starting from the seventh day after emergence, three scion seedlings were randomly selected every five days to measure plant height, stem diameter and aboveground dry matter accumulation. Starting from the fifth day after emergence, three rootstock seedlings were randomly selected every five days to measure plant height, stem diameter and root area, and the average value was calculated (Figure 2). Morphological characteristics of seedlings were recorded for rootstock at 18 days after emergence (DAS) and for scion at 21 DAS (Figure 3). Notably, since the rootstock growth had essentially reached the desired standard by day 18, the final tracking investigation for rootstocks was conducted with a 3-day interval from the previous investigation, rather than the standard 5-day interval.

2.3. Grafting and Cultivating Experiment

2.3.1. Grafting, Healing, and Transplanting

When the seedling stem diameter reached approximately 3.0 mm (both scion and rootstock), splice grafting was performed, with scions and rootstocks originating from the same light-quality treatment combined. The grafted seedlings were placed in a dark healing chamber for 7 days under the same temperature and humidity conditions as those adopted for seedling cultivation.
Subsequent to the healing period, the grafted seedlings were transplanted into pots filled with a substrate mixture consisting of earthworm-cast-rich soil, peat moss, and perlite at a volume ratio of 3:3:1 (v:v:v).

2.3.2. Cultivating Management of Grafted Plants

After acclimatization, the grafted plants were transplanted to the field at a spacing of 50 cm × 50 cm. The experiment adopted a completely randomized design with five replicates per treatment. Following outdoor transplantation, plants were irrigated weekly with tomato nutrient solution prepared from tomato nutrient salts (NSP1100, Beijing Coolaber Science and Technology Co. Ltd., Beijing, China), and additional watering was applied as needed according to field soil moisture conditions.

2.4. Measured Parameters and Methods

2.4.1. Morphological Traits

For each treatment, six rootstock seedlings and six scion seedlings were selected. Plant height, stem diameter, and hypocotyl length were measured using a ruler and a digital caliper. Leaf area, root projected area, and canopy width were determined with a root and canopy scanner. Stem compressive strength, an indicator of rigidity, was measured using a texture analyzer (TMS-PILOT, Food Technology Corporation, VA, USA).

2.4.2. Biomass

For each treatment, six rootstock seedlings and six scion seedlings were selected. Plants were separated into shoots and roots. The fresh weight of each part was recorded using an electronic balance (JJ124BC, G&G Measurement Plant, Changshu, China) with a precision of 0.0001 g. Samples were then placed in an oven, deactivated at 105 °C for 15 min, and dried at 65 °C to a constant weight before dry weight measurement.

2.4.3. Soluble Protein Content

Three plants were selected from each treatment group ground in liquid nitrogen, and soluble protein was extracted from 0.5 g of fresh tissue. The powder was homogenized in 9 mL of distilled water and centrifuged at 4 °C and 3000 r·min−1 for 10 min. A 0.2 mL aliquot of the supernatant was mixed with 0.8 mL of distilled water and 5 mL of Coomassie Brilliant Blue G-250 reagent. After 5 min, absorbance was measured at 595 nm using a spectrophotometer (LI-180, LI-COR Corporate, Lincoln, NU, USA). Concentration was calculated from a standard curve prepared with bovine serum albumin and expressed as a percentage [25].

2.4.4. Soluble Sugar Content

Three plants were selected from each treatment group. Soluble sugars were extracted from 0.2 g of fresh tissue in 6 mL of distilled water via a boiling water bath for 20 min. After cooling, the volume was adjusted to 10 mL. A 0.1 mL aliquot of the supernatant was mixed with 0.9 mL of distilled water and 5 mL of anthrone reagent, boiled for 10 min, and then cooled. Absorbance was measured at 620 nm. Concentration was calculated from a glucose standard curve and expressed as a percentage [26,27].

2.4.5. Photosynthetic Pigment Content

Three plants were selected from each treatment group. Pigments were extracted from 0.1 g of fresh leaf tissue in 7.5 mL of 95% ethanol in the dark for 24 h. The extract was centrifuged at 5000 r·min−1 for 5 min, and the absorbance of the supernatant was measured at 665, 649, and 470 nm. Chlorophyll a (Chl a), chlorophyll b (Chl b), and carotenoid (Car) contents were calculated using the following equations and expressed as mg per gram fresh weight [28]:
Chl   a   ( mg · L 1 )   = 13.95 × A 665 6.88 × A 649
Chl   b   ( mg · L 1 ) = 24.96 × A 649 7.32 × A 665
Car   ( mg · L 1 ) = 1000 × A 470 2.05 × C h l   a 114.8 × C h l   b 248
Pigment   content   ( mg · g 1 ) = C o n c e n t r a t i o n ( m g · L 1 ) × 0.0075 W
W is the sample fresh weight (g).

2.4.6. Photosynthetic Parameters

Net photosynthetic rate (Pn), stomatal conductance (Gs), intercellular CO2 concentration (Ci), and transpiration rate (Tr) were measured on the third youngest fully expanded leaf of five plants per treatment using a portable photosynthesis system (LI-6800, LI-COR Inc., Lincoln, NU, USA). Measurement conditions were set to match the growth light environment: 75% relative humidity, 500 ppm CO2, and a PPFD of 180 μmol·m−2·s−1. Chlorophyll fluorescence parameters, including initial fluorescence (Fo), maximum fluorescence (Fm), maximum quantum yield of Photosystem II (PSII) (Fv/Fm), and effective quantum yield of PSII (Fv′/Fm′), were also determined using the same instrument.

2.4.7. Endogenous Hormones

Three plants were selected from each treatment group. The contents of IAA, GA3, ABA, and CTK were determined using commercial plant hormone ELISA research kits (Jiangsu Meimian Industrial Co., Ltd., Yancheng, China). The specific procedures were performed exactly according to the kit protocols.

3. Results

3.1. Different Light Qualities on Seedling Morphogenesis and Growth Dynamics of Rootstock and Scion Under Different Light Qualities

3.1.1. Scion Morphology and Dynamic Accumulation of Aboveground Dry Matter

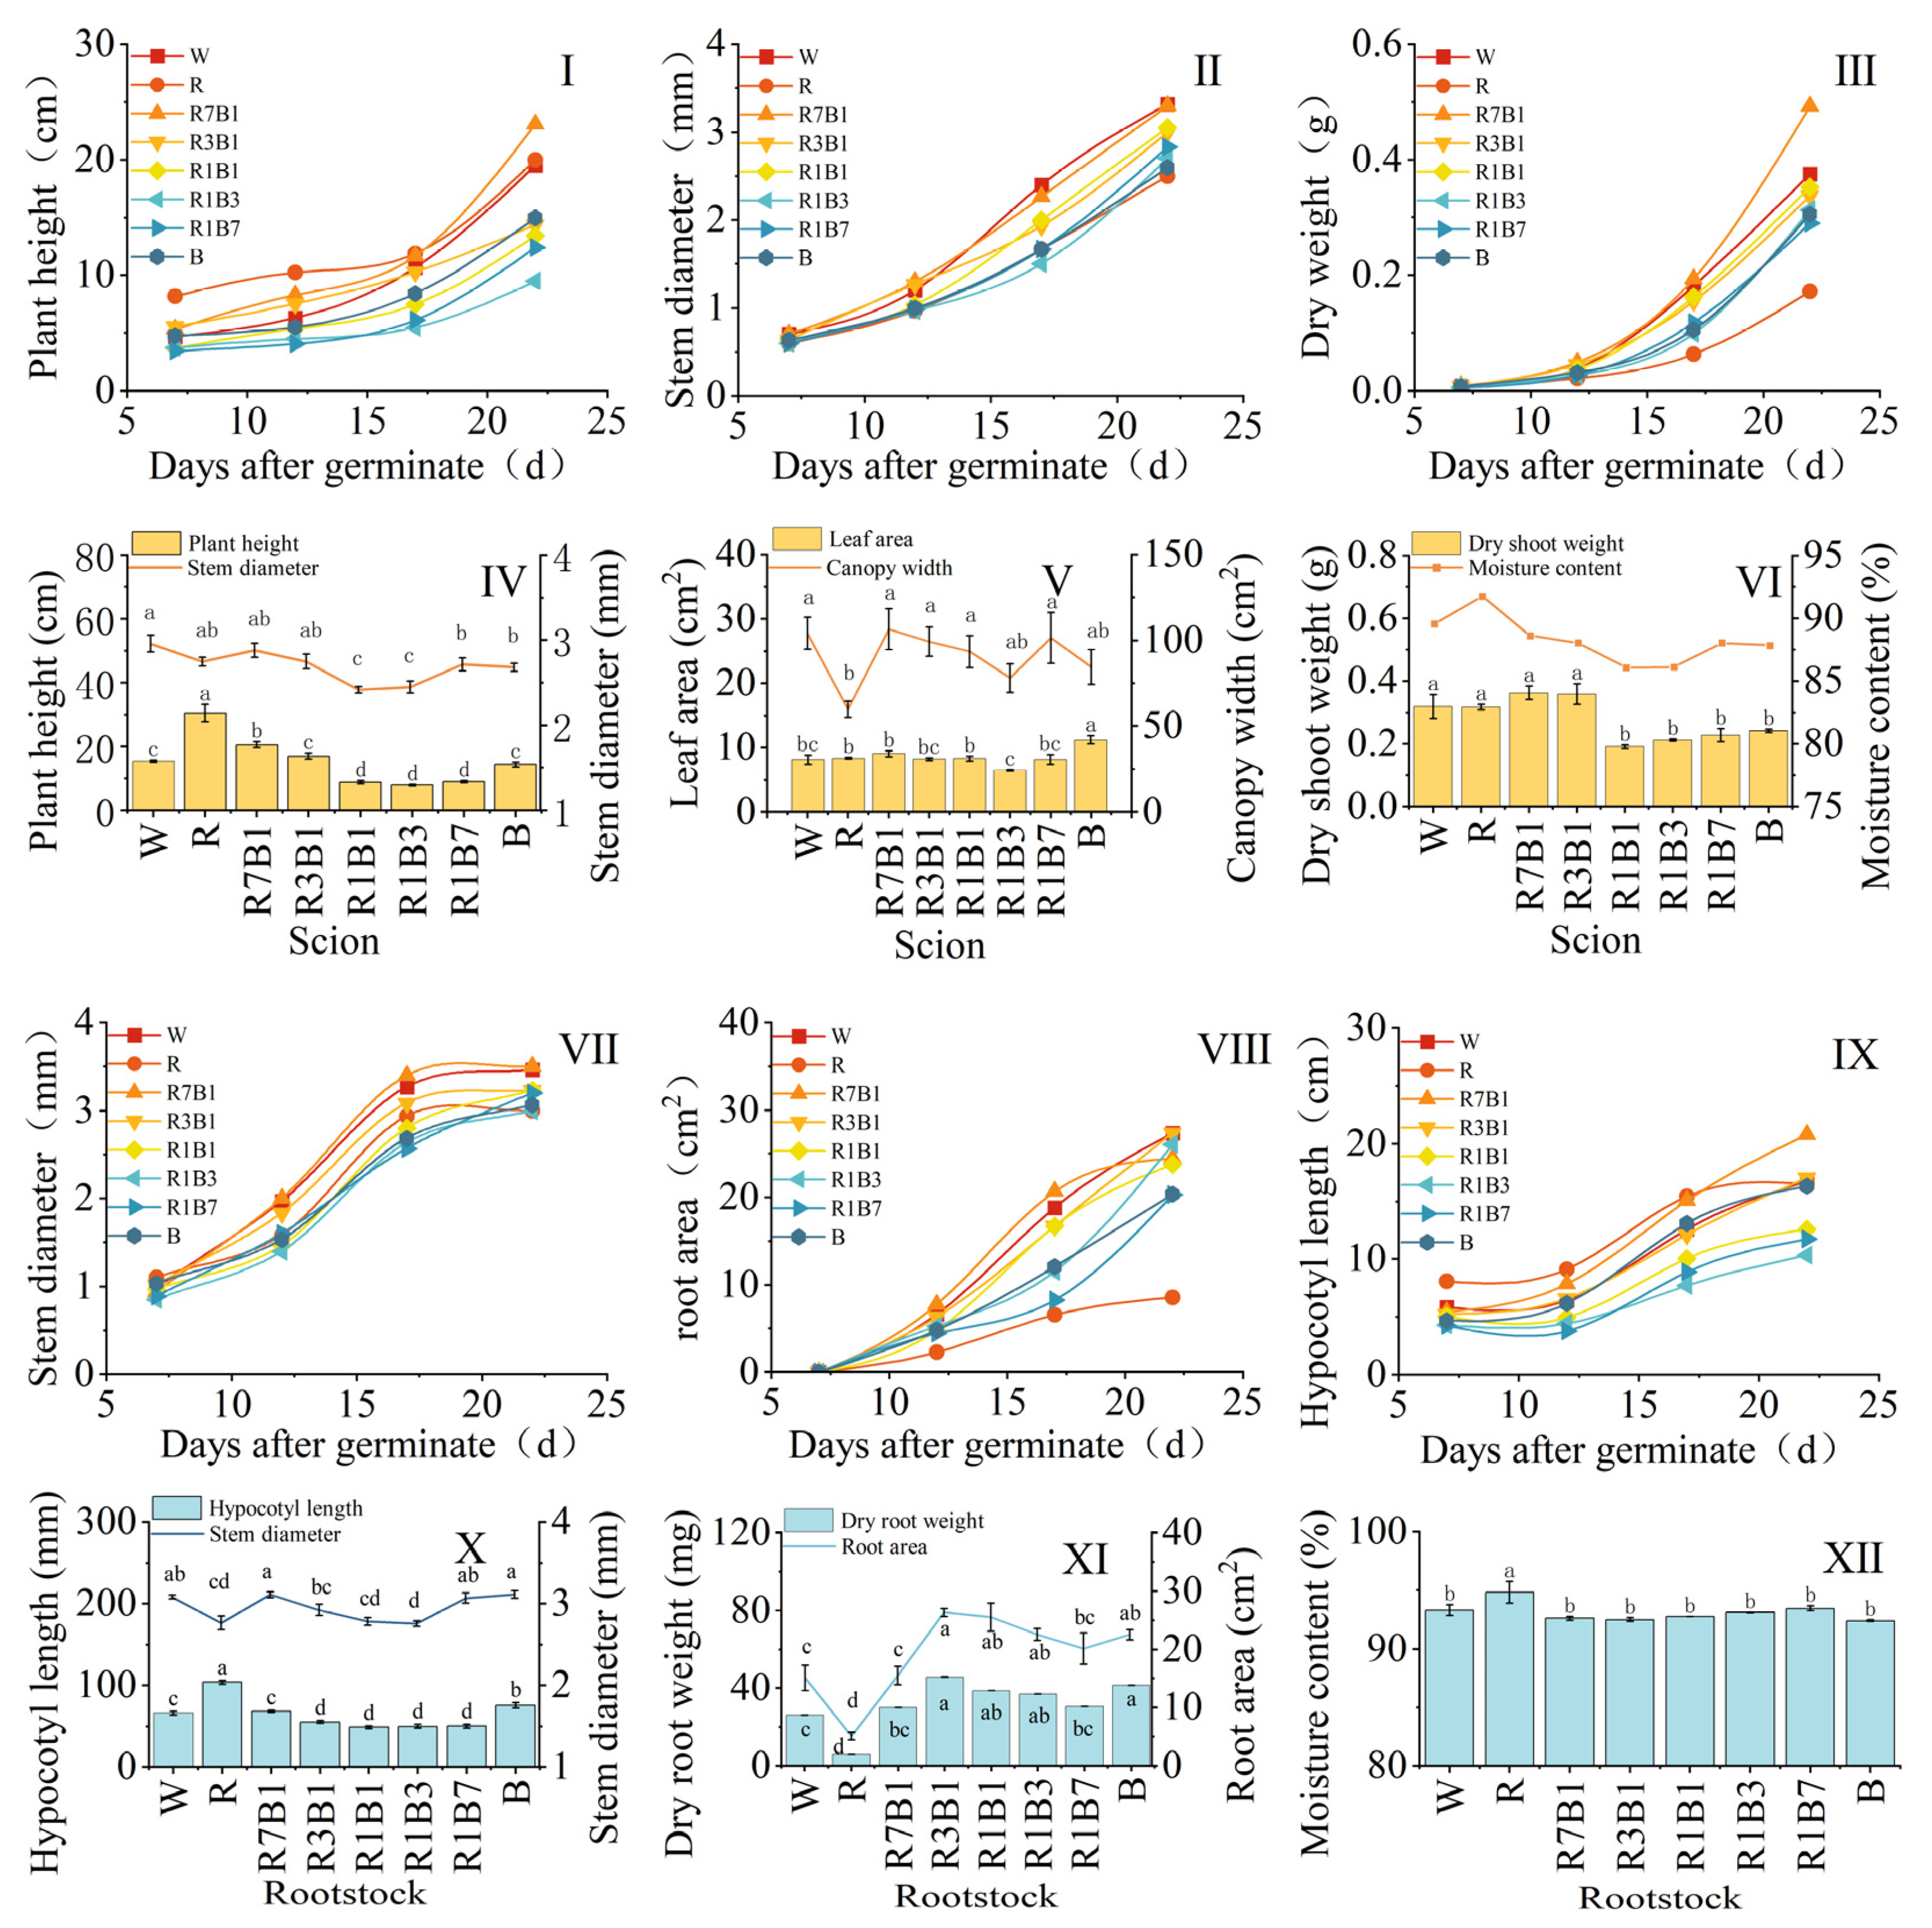
Light-quality treatments differentially regulated scion morphological traits and aboveground dry matter accumulation (Figure 2 and Figure 3).
For stem diameter, scions grown under white light had the thickest stems (2.96 mm), significantly greater than all other treatments. Red light (R), R7B1, and R3B1 also produced relatively thick stems (2.8 mm), whereas R1B1 and R1B3 resulted in the thinnest stems (2.43 mm).
Scion height was greatest under R (30.5 cm), significantly higher than under all other treatments, followed by R7B1 (20.57 cm). In contrast, R1B1, R1B3, and R1B7 markedly suppressed stem elongation, reducing plant height to 9 cm. Scions under R also had the highest shoot moisture content (90%), whereas high–blue-ratio treatments (R1B1 and R1B3) produced the lowest values (86%). Aboveground dry weight did not differ significantly among W, R, R7B1, and R3B1, which all maintained relatively high values (0.3 g). Similarly, R1B1, R1B3, R1B7, and blue light (B) did not differ from one another but formed a lower-yielding group (0.2 g), significantly below the former cluster.
For leaf area and canopy spread, R1B3 produced the smallest leaf area (6.46 cm2), whereas B yielded the largest (11.21 cm2); no significant differences in leaf area were detected among the other treatments. Canopy spread was smallest under R (59.9 cm2), while no significant variation was observed among the remaining treatments (Figure 3).
Dynamic analyses showed a slow-to-rapid increase in scion height during early development. Seedlings under R7B1 exhibited the fastest height growth between 17 and 22 days after grafting (2.3 cm·day−1). Aboveground dry matter accumulation followed a similar pattern: R7B1 showed the highest accumulation rates during days 12–18 (30 mg·day−1) and 17–22 (60 mg·day−1), whereas R showed the lowest rates over the same intervals (7 and 22 mg·day−1, respectively). Stem thickening followed a typical sigmoidal (S-shaped) curve; between days 12 and 17, W-treated scions exhibited the fastest thickening rate (0.24 mm·day−1) (Figure 3).

3.1.2. Rootstock Morphology and Dynamic Root Area Expansion

Significant differences were observed in how different light-quality treatments regulated rootstock morphology and root dry matter accumulation (Figure 3). In terms of stem diameter, R7B1 and B produced the thickest rootstock stems (both 3.11 mm) and did not differ significantly from W and R1B7, which together formed the highest-diameter group. R1B3 resulted in the thinnest stems (2.75 mm). Hypocotyl length was strongly promoted by red light (R), reaching 103.72 mm, far exceeding all other treatments. In contrast, red–blue combined light (R1B1, R1B3, R1B7) effectively suppressed excessive hypocotyl elongation, with lengths of 49–51 mm. Among mixed red–blue treatments, hypocotyl length decreased progressively with increasing blue light proportion.
For key root traits, R3B1 performed best, with the largest root area (26.32 cm2) and root dry weight (45.8 mg). R1B1 and B also supported vigorous root growth. By contrast, R severely inhibited root development, resulting in the smallest root area (5.09 cm2) and root dry weight (6.1 mg). Among red–blue treatments, root water content increased with increasing blue light proportion.
Regarding dynamic growth, under W, R, R3B1, and R7B1, root area followed an overall slow–fast–slow, S-shaped growth curve, whereas the other treatments showed a slow-then-fast pattern. Both stem diameter and plant height of rootstocks exhibited a similar slow–fast–slow S-shaped growth trend.

3.2. Material Accumulation and Allocation in Rootstock and Scion Seedlings Under Different Light Quality

3.2.1. Photosynthetic Characteristics

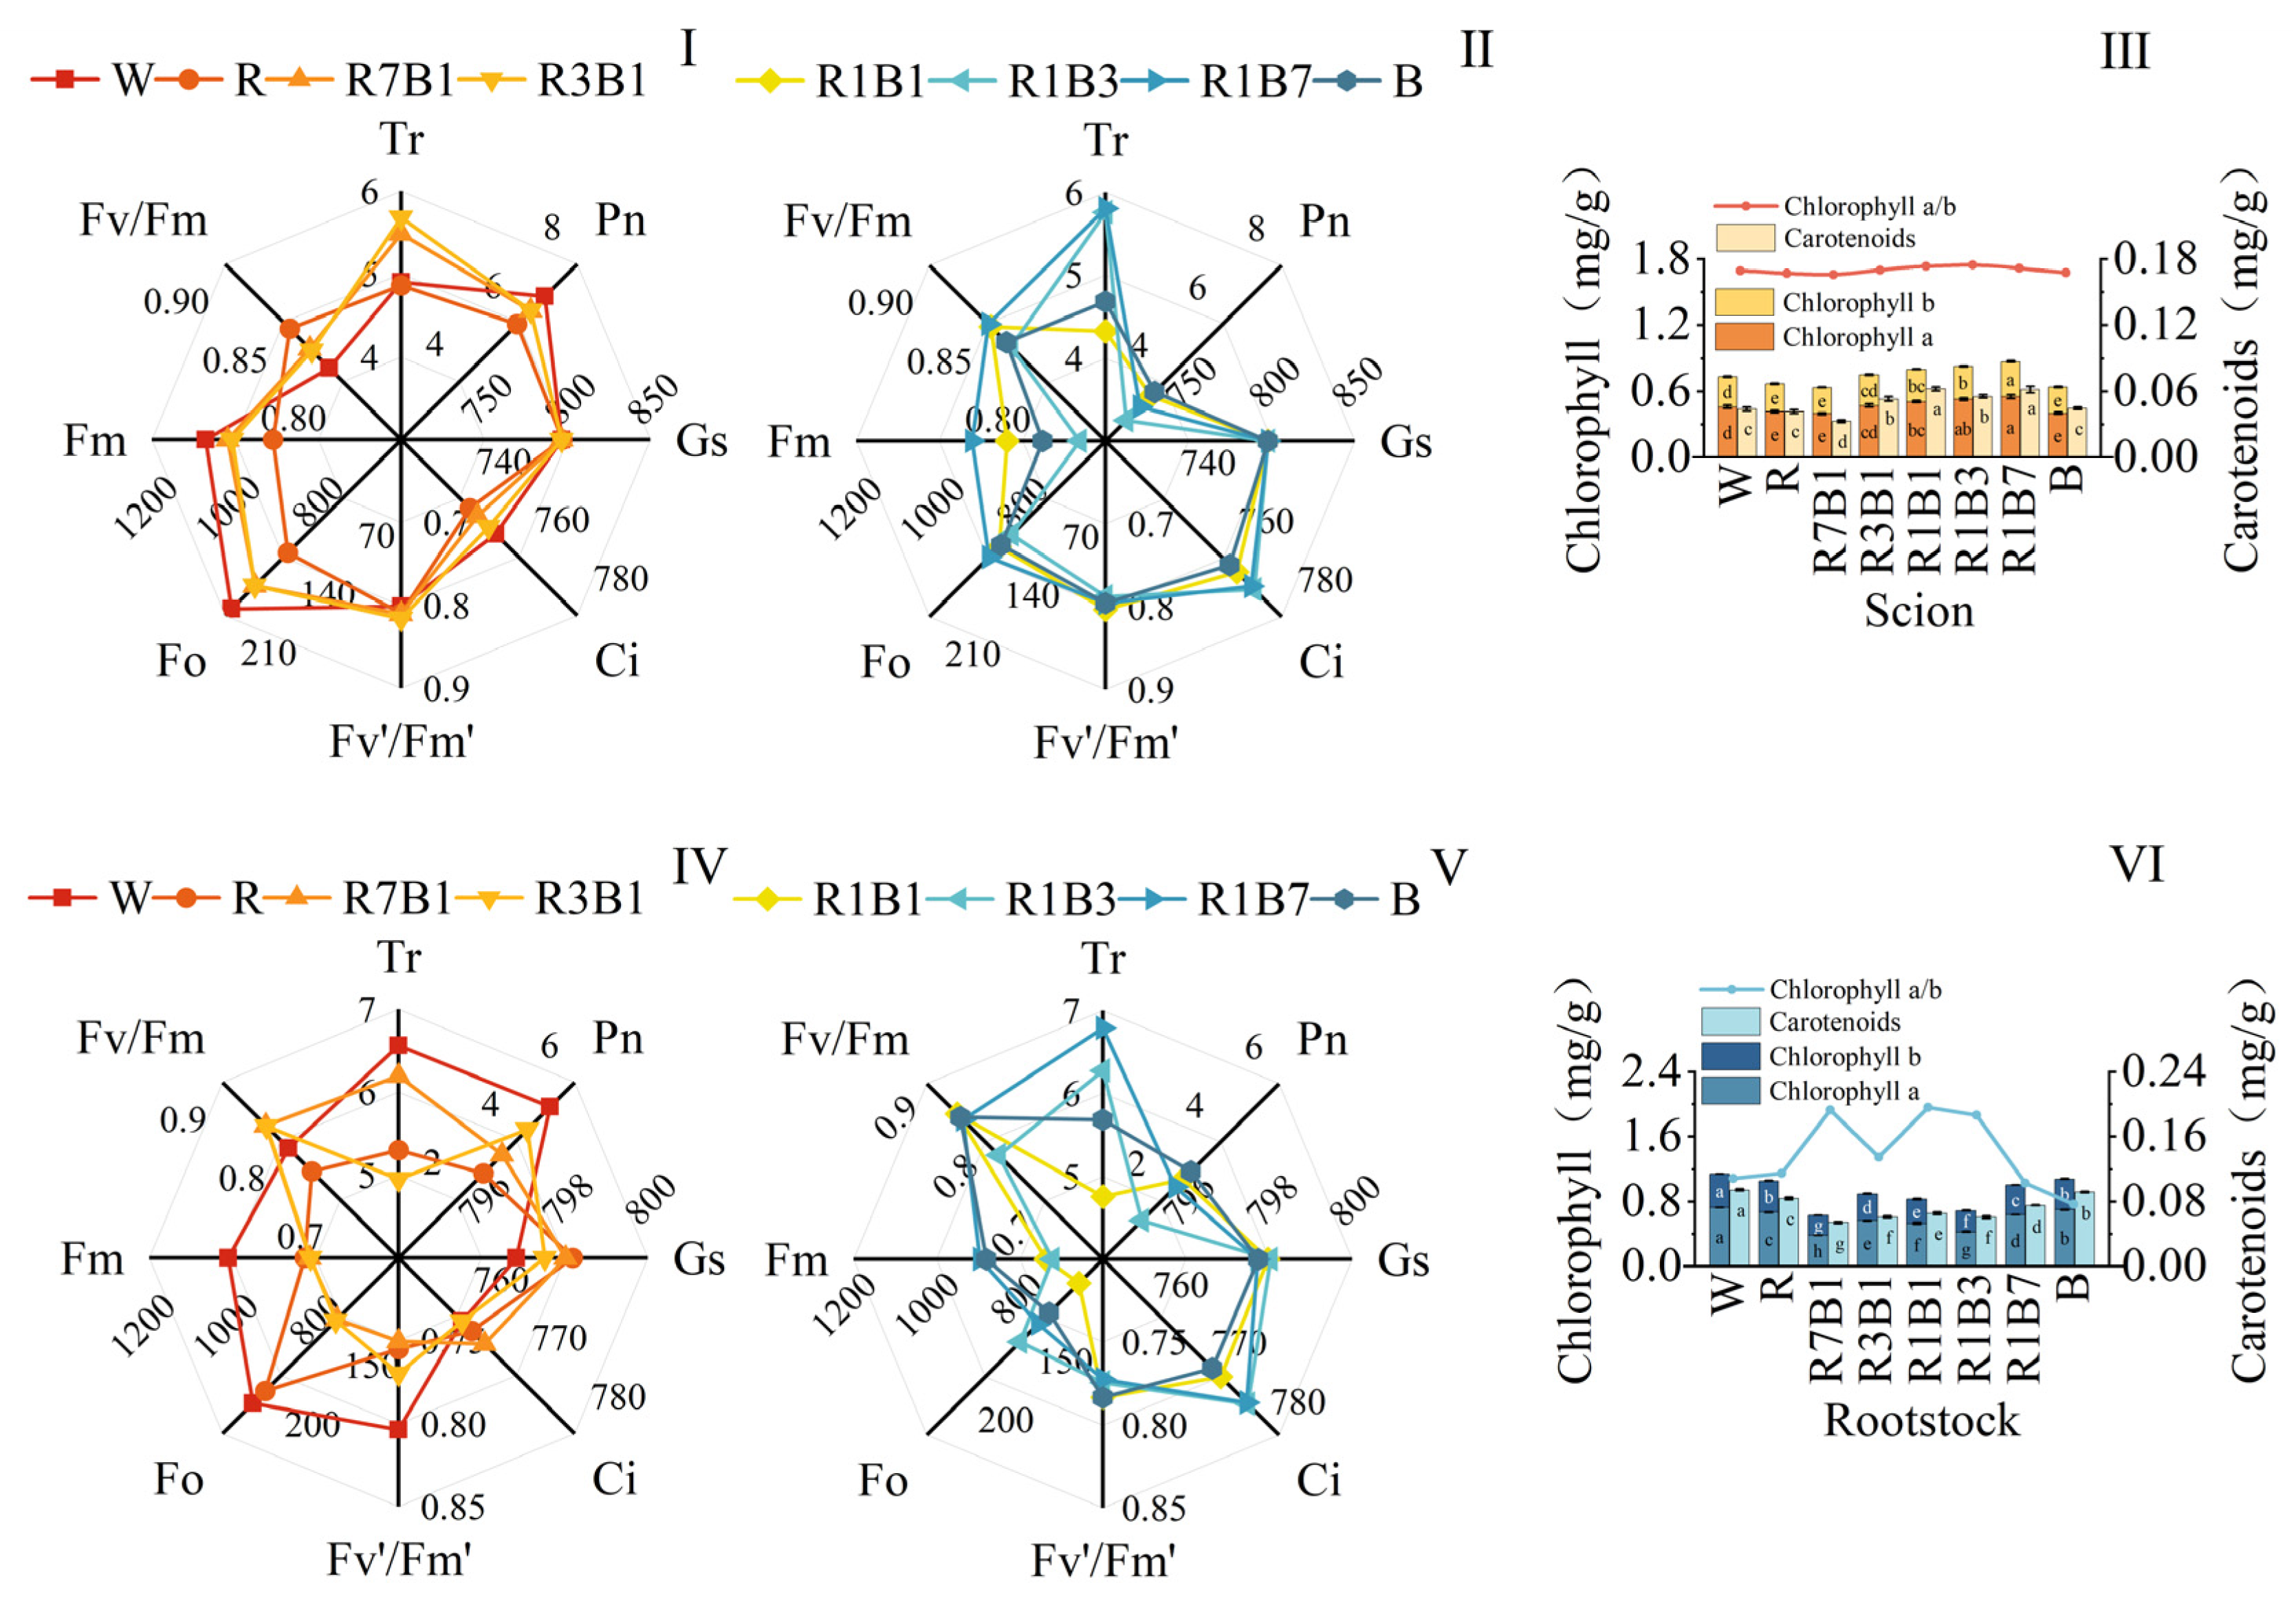
Light quality treatments significantly affected the photosynthetic characteristics of both scion and rootstock, including gas exchange, photosynthetic pigment content, and PSII efficiency (Figure 4).
For the scion, net photosynthetic rate (Pn) was highest under white light, reaching 6.90 μmol·m−2·s−1. The R3B1 and R7B treatments produced comparably high Pn values, whereas treatments with a high proportion of blue light (R1B1, R1B3, R1B7, B) generally showed lower Pn, with R1B3 being the lowest. Differences in transpiration rate (Tr) among treatments were relatively small, with only R1B7 and R1B3 showing slightly elevated values. Notably, treatments with low Pn (e.g., R1B3, R1B7) had higher intercellular CO2 concentration (Ci), both exceeding 769 μmol·mol−1.
Regarding PSII efficiency, maximal photochemical efficiency (Fv/Fm) for all treatments remained within the normal, non-stress range (0.78–0.85). R1B7 exhibited the highest Fv/Fm (0.850), whereas the effective quantum yield of PSII (Fv′/Fm′) was highest under R3B1 (0.816). Overall, W and R3B1 were most effective in sustaining a high Pn in the scion.
For photosynthetic pigments (Figure 4), scion chlorophyll a content was highest under R1B7 (0.5495 mg·g−1), significantly exceeding that under W (0.4597 mg·g−1) and B (0.4009 mg·g−1). Chlorophyll b showed a similar pattern, also peaking under R1B7 (0.3197 mg·g−1) and being lower under W and B. Carotenoid content was highest under R1B1 and R1B7 (0.0621 and 0.0613 mg·g−1, respectively), both significantly greater than under W (0.0440 mg·g−1). Differences in the chlorophyll a/b ratio were relatively small; only R1B3 showed a significantly higher value (1.750), with no significant differences among the other mixed-light treatments.
In the rootstock, the regulatory patterns of light quality on photosynthetic traits were partly similar to those in the scion but also showed clear differences (Figure 4). As in the scion, rootstock Pn was highest under W (5.15 μmol·m−2·s−1), followed by R3B1 (4.38 μmol·m−2·s−1), whereas Pn under R1B3 was extremely low (1.33 μmol·m−2·s−1). Transpiration rate was highest under R1B7 (6.79 μmol·m−2·s−1), likely reflecting greater stomatal aperture under this treatment. The trend in Ci mirrored that of the scion: treatments with low Pn (e.g., R1B3, R1B7) also exhibited elevated Ci.
For PSII efficiency in the rootstock, B, R1B1, and R1B7 produced relatively high Fv/Fm values (all >0.838), whereas red light (R) and W showed lower values. In contrast, Fv′/Fm′ was highest under W (0.804), while R7B1 and R had comparatively low values.
Regarding photosynthetic pigments (Figure 4), rootstock chlorophyll a content was highest under W (0.7232 mg·g−1), and, together with B (0.6977 mg·g−1), formed the top significance group. In sharp contrast, R7B1 resulted in the lowest chlorophyll a content (0.3819 mg·g−1), significantly lower than all other treatments. Chlorophyll b displayed a similar pattern, being highest under W (0.4184 mg·g−1) and lowest under R7B1 (0.2494 mg·g−1), indicating that W and B were more conducive to chlorophyll synthesis in the rootstock, whereas high-red treatments were inhibitory. Carotenoid content was likewise highest under W (0.0943 mg·g−1) and lowest under R7B1 (0.0539 mg·g−1). For the chlorophyll a/b ratio, B showed the lowest value (0.767), while R1B1 had the significantly highest ratio (1.961).

3.2.2. Carbon and Nitrogen Metabolites Before Grafting

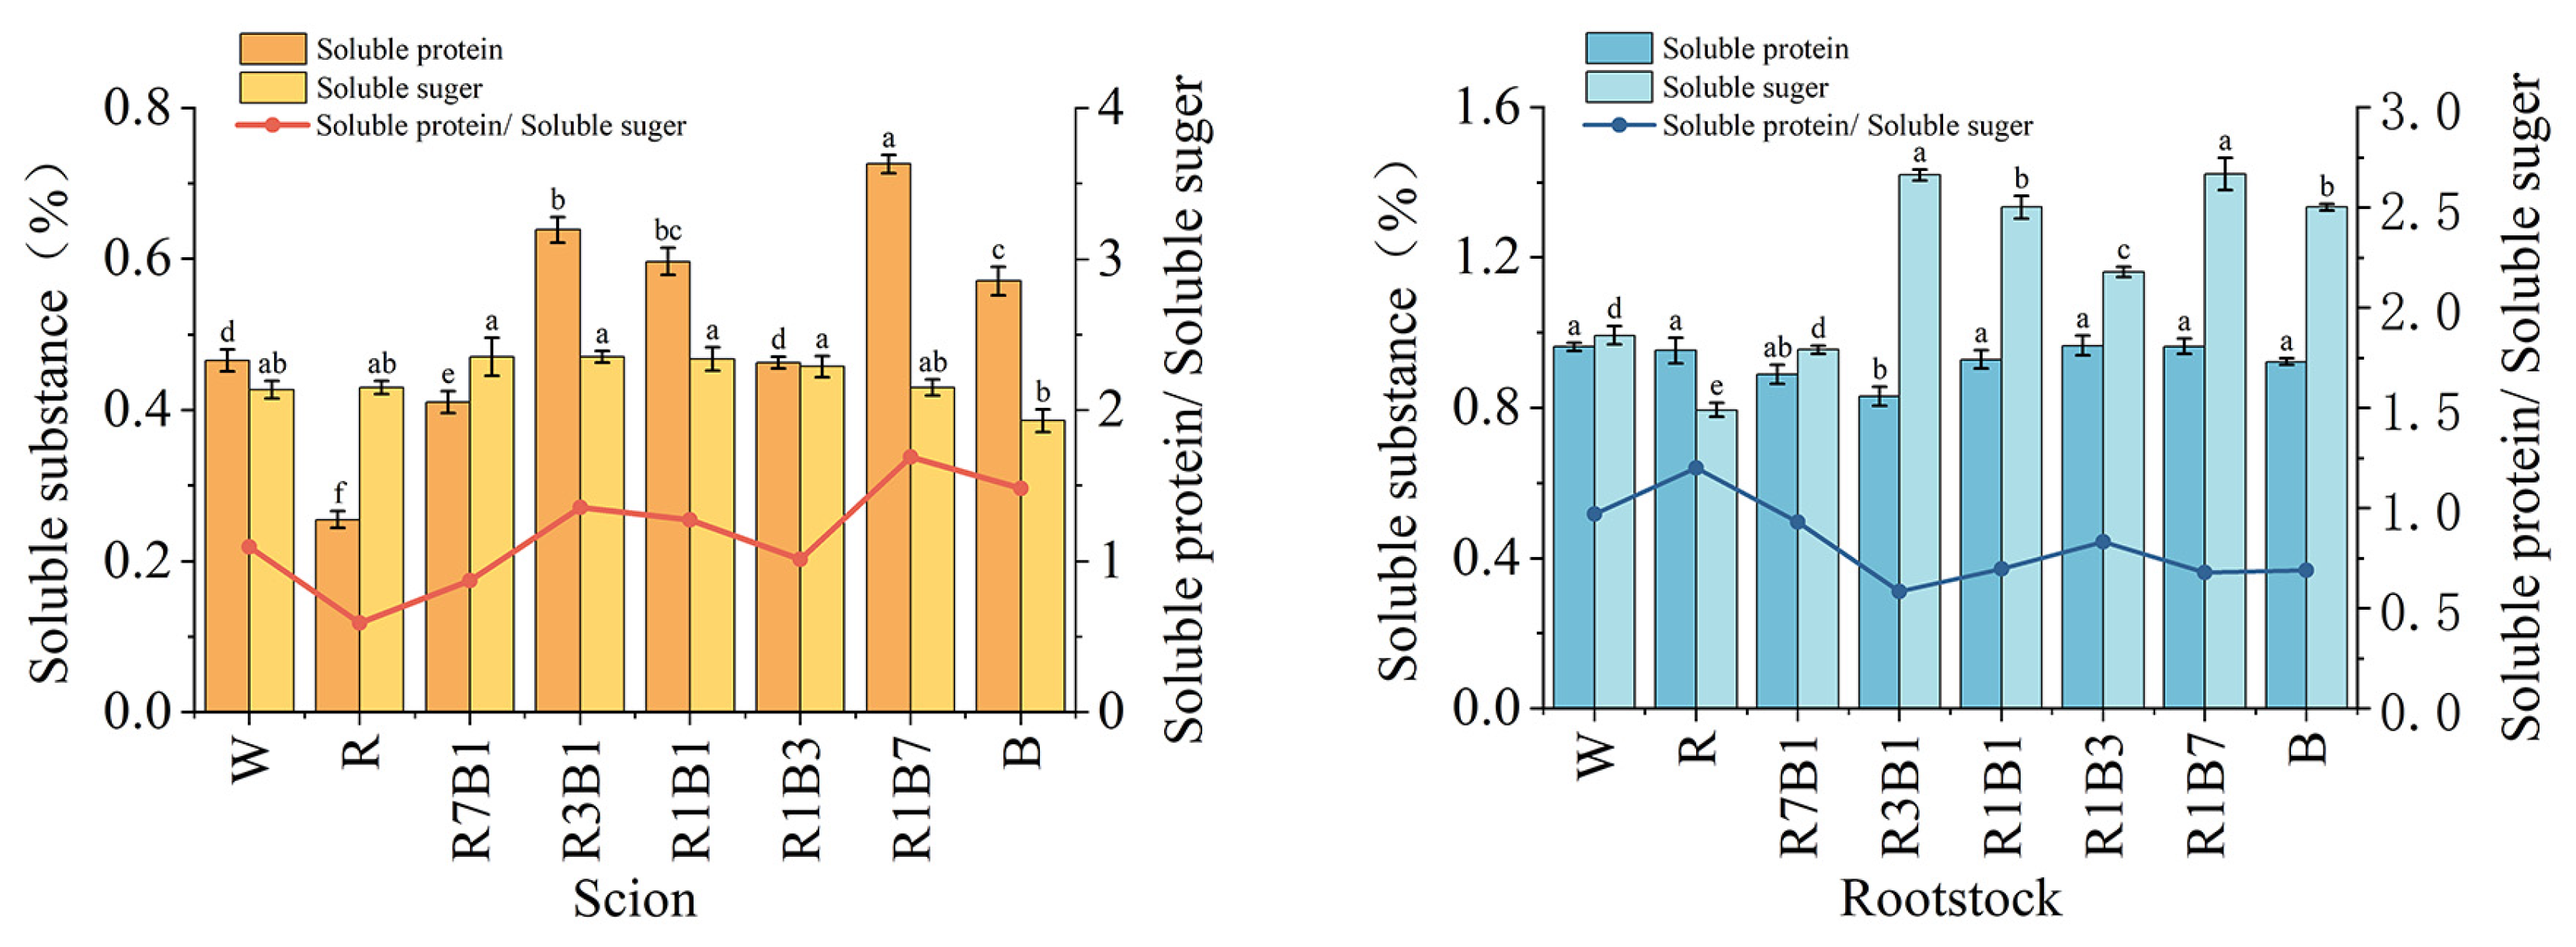
Different light quality treatments significantly regulated the soluble protein content, soluble sugar content, and carbon-nitrogen metabolic balance (protein-to-sugar ratio) in the scion (Figure 5). For soluble protein content, the R1B7 (red: blue = 1:7) treatment yielded a significantly higher content (0.726%) than other treatments. The R3B1 (red: blue = 3:1) and R1B1 (red: blue = 1:1) treatments followed, with contents of 0.639% and 0.597%, respectively. The red light (R) treatment resulted in the lowest soluble protein content (0.255%). Regarding soluble sugar content, the R7B1, R3B1, R1B1, and R1B3 treatments all exhibited the highest levels (approximately 1.17%), significantly higher than the blue light (B) treatment (0.965%).
The protein-to-sugar ratio reflects the relative intensity of carbon and nitrogen metabolism as well as the tendency of resource allocation. The R1B7 treatment resulted in an extremely significantly higher ratio (0.675). In contrast, the R treatment had the lowest ratio (0.237).
Different light quality treatments significantly regulated the soluble protein content, soluble sugar content, and carbon–nitrogen metabolic balance (protein-to-sugar ratio) in the rootstock (Figure 5). For soluble protein content, the R3B1 treatment was significantly lower than the other treatments (0.831%). No significant differences were observed among the remaining treatments, all maintaining levels around 0.95%. Regarding soluble sugar content, the R1B7 and R3B1 treatments were extremely significantly higher than other treatments, reaching 3.558% and 3.550%. The R1B1 and B treatments followed, while the R treatment resulted in the lowest sugar content (1.988%).
For the protein-to-sugar ratio, rootstocks generally exhibited lower ratios than scions. The white light and R7B1 treatments showed relatively high ratios (approximately 0.38). In contrast, treatments associated with higher sugar contents (R3B1, R1B1, R1B7, B) had lower protein-to-sugar ratios (approximately 0.27).

3.3. GA3, IAA, CTK, and ABA Content in Rootstock and Scion Seedlings Under Different Light Quality

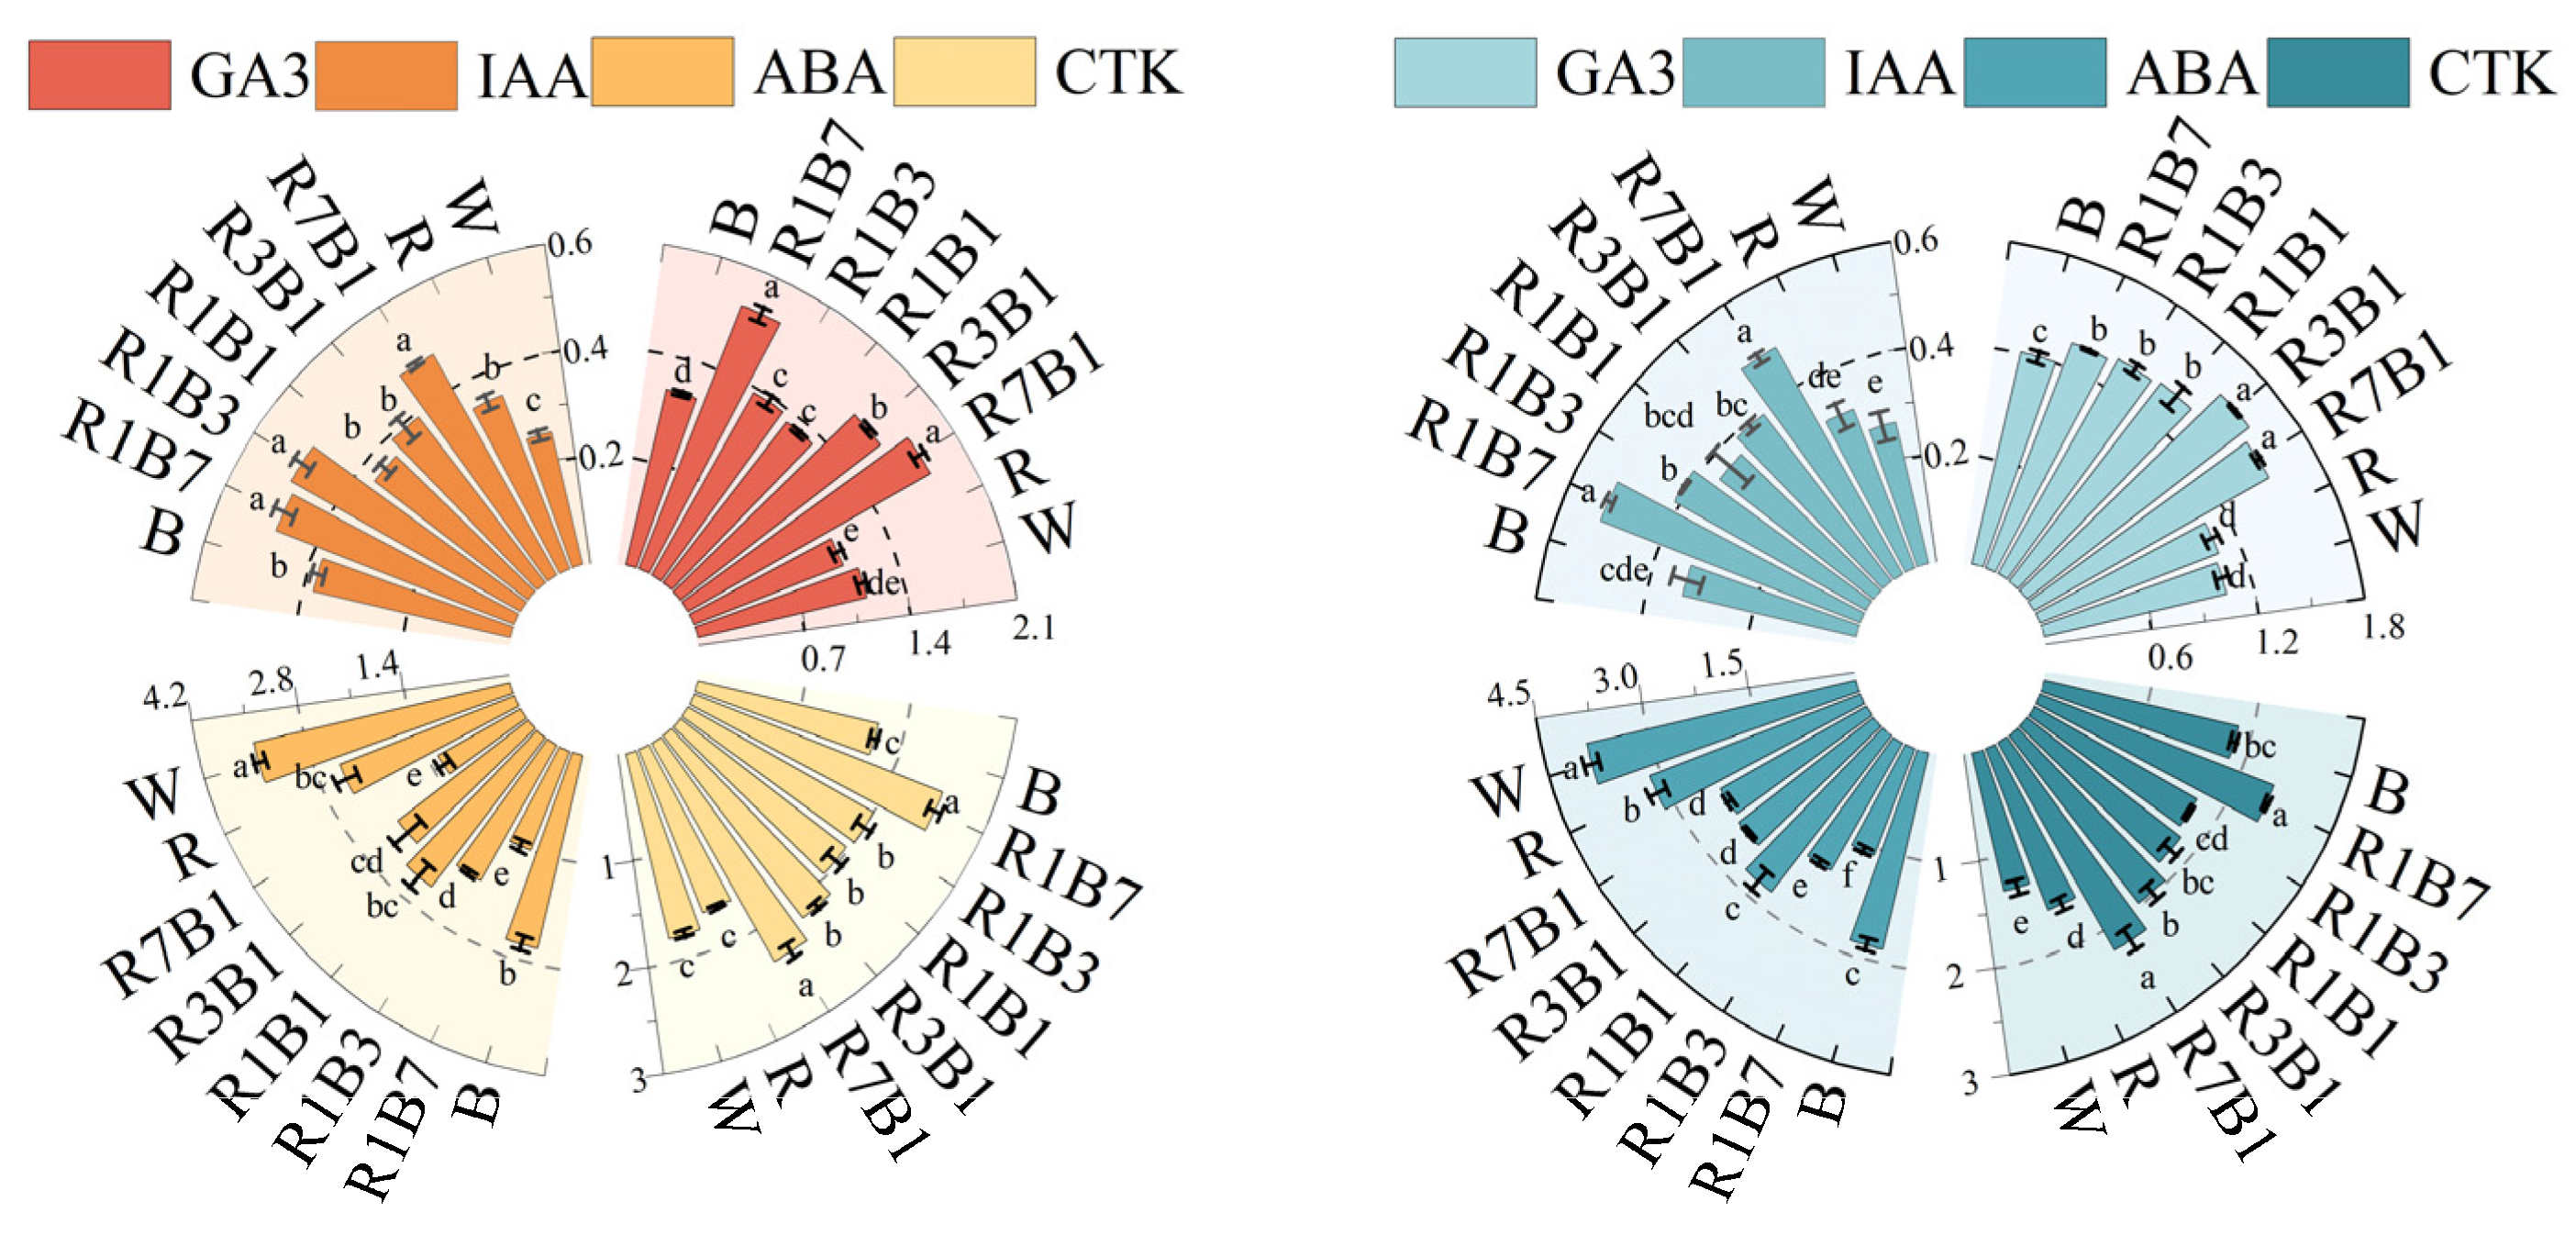
Different light quality treatments exerted significant regulatory effects on the contents of individual endogenous hormones in tomato scion seedlings (Figure 6). The gibberellin (GA3) content was highest under the R7B1 (1.82 nmol·g−1) and R1B7 (1.84 nmol·g−1) treatments, with no significant difference between them. This represented an increase of 73.3% to 75.2% compared to the red light (R) treatment (1.05 nmol·g−1). The auxin (IAA) content was maintained at a high concentration under the R1B3, R1B7 and R7B1 treatments. The content ranged from 0.47 to 0.49 nmol·g−1, with no significant differences observed among these three treatments. Compared with the white light treatment (0.255 nmol·g−1), the IAA content under these treatments increased by an average of 84.3% to 92.2%. The abscisic acid (ABA) content was highest under the W treatment (3.45 nmol·g−1), significantly exceeding other treatments. In contrast, the R7B1 (1.24 nmol·g−1) and R1B7 (1.39 nmol·g−1) treatments resulted in the lowest ABA contents (no significant difference between them), representing a reduction of 60.3% to 64.1% compared to the W treatment. The cytokinin (CTK) content was highest under the R1B7 (2.50 nmol·g−1) and R7B1 (2.33 nmol·g−1) treatments, with no significant difference between them, representing an increase of 42.9% to 53.4% compared to the R treatment (1.63 nmol·g−1).
For rootstock seedlings, the regulatory patterns of light quality on hormone contents shared similarities with those in scions (Figure 6). The GA3 content was the highest under the R3B1 and R7B1 treatments.
The R3B1 treatment (red: blue = 3:1) had a GA3 content of 1.52 nmol·g−1, and the R7B1 treatment had 1.50 nmol·g−1. There was no significant difference in GA3 content between these two treatments. Compared with the R treatment (1.07 nmol·g−1), the GA3 content increased by 41.1% to 42.1%. Compared with the white light treatment (1.04 nmol·g−1), it increased by 45.2% to 46.2%. The IAA content was highest under the R1B7 treatment (0.52 nmol·g−1), significantly higher than other treatments and representing a 92.6% increase compared to the lowest content under the W treatment (0.27 nmol·g−1). The ABA content remained highest under the W treatment (3.87 nmol·g−1), while the R1B7 treatment showed the most significant inhibitory effect on ABA (1.59 nmol·g−1)—representing a reduction of approximately 58.9% compared to the R treatment. The CTK content was highest under the R1B7 (2.34 nmol·g−1) and R7B1 (2.20 nmol·g−1) treatments, with no significant difference between them—approximately 1.8 times the content under the W treatment (1.31 nmol·g−1), representing an increase of 78.6% to 78.7%.

3.4. Comprehensive Evaluation of Tomato Rootstocks and Scions Under Different Light Quality

3.4.1. Evaluation of Adaptability to Mechanized Operation for Rootstock and Scion Seedlings

Mechanical grafting operations impose stringent specifications on the morphological and mechanical properties of both rootstocks and scions. For rootstocks, a well-developed root system is indispensable to ensure the facilitated and safe manipulation of root-substrate blocks during the grafting process. Concurrently, to provide sufficient spatial allowance for the clamping and cutting mechanisms of the grafting equipment, the hypocotyl length of rootstocks must be no less than 5 cm. For scions, plant height and canopy width should be optimized to a compact growth habit, aiming to mitigate inter-seedling interference during grafting operations. In the final clamping stage, to match the structural configuration of the clamping mechanism and avoid mechanical damage, the stem diameter of grafted seedlings must reach a minimum of 3 mm, with concomitant requirements for adequate compressive strength to withstand clamping forces. A comprehensive score for seedlings was calculated by standardizing using Z-score standardization and summing key morphological and mechanical indices (Table 1 and Table 2). For scion seedlings, the evaluated indices included stem diameter, plant height, aboveground dry weight, hypocotyl compressive resistance, and canopy spread. The scion seedlings under the R3B1 treatment achieved the highest comprehensive score. For rootstock seedlings, the indices included stem diameter, hypocotyl length, underground dry weight, root area, and hypocotyl compressive resistance. The rootstock seedlings under the B and R3B1 treatment achieved the highest comprehensive score.

3.4.2. Comprehensive Effects of Different Light Quality Treatments on the Physiological Status of Rootstocks and Scions

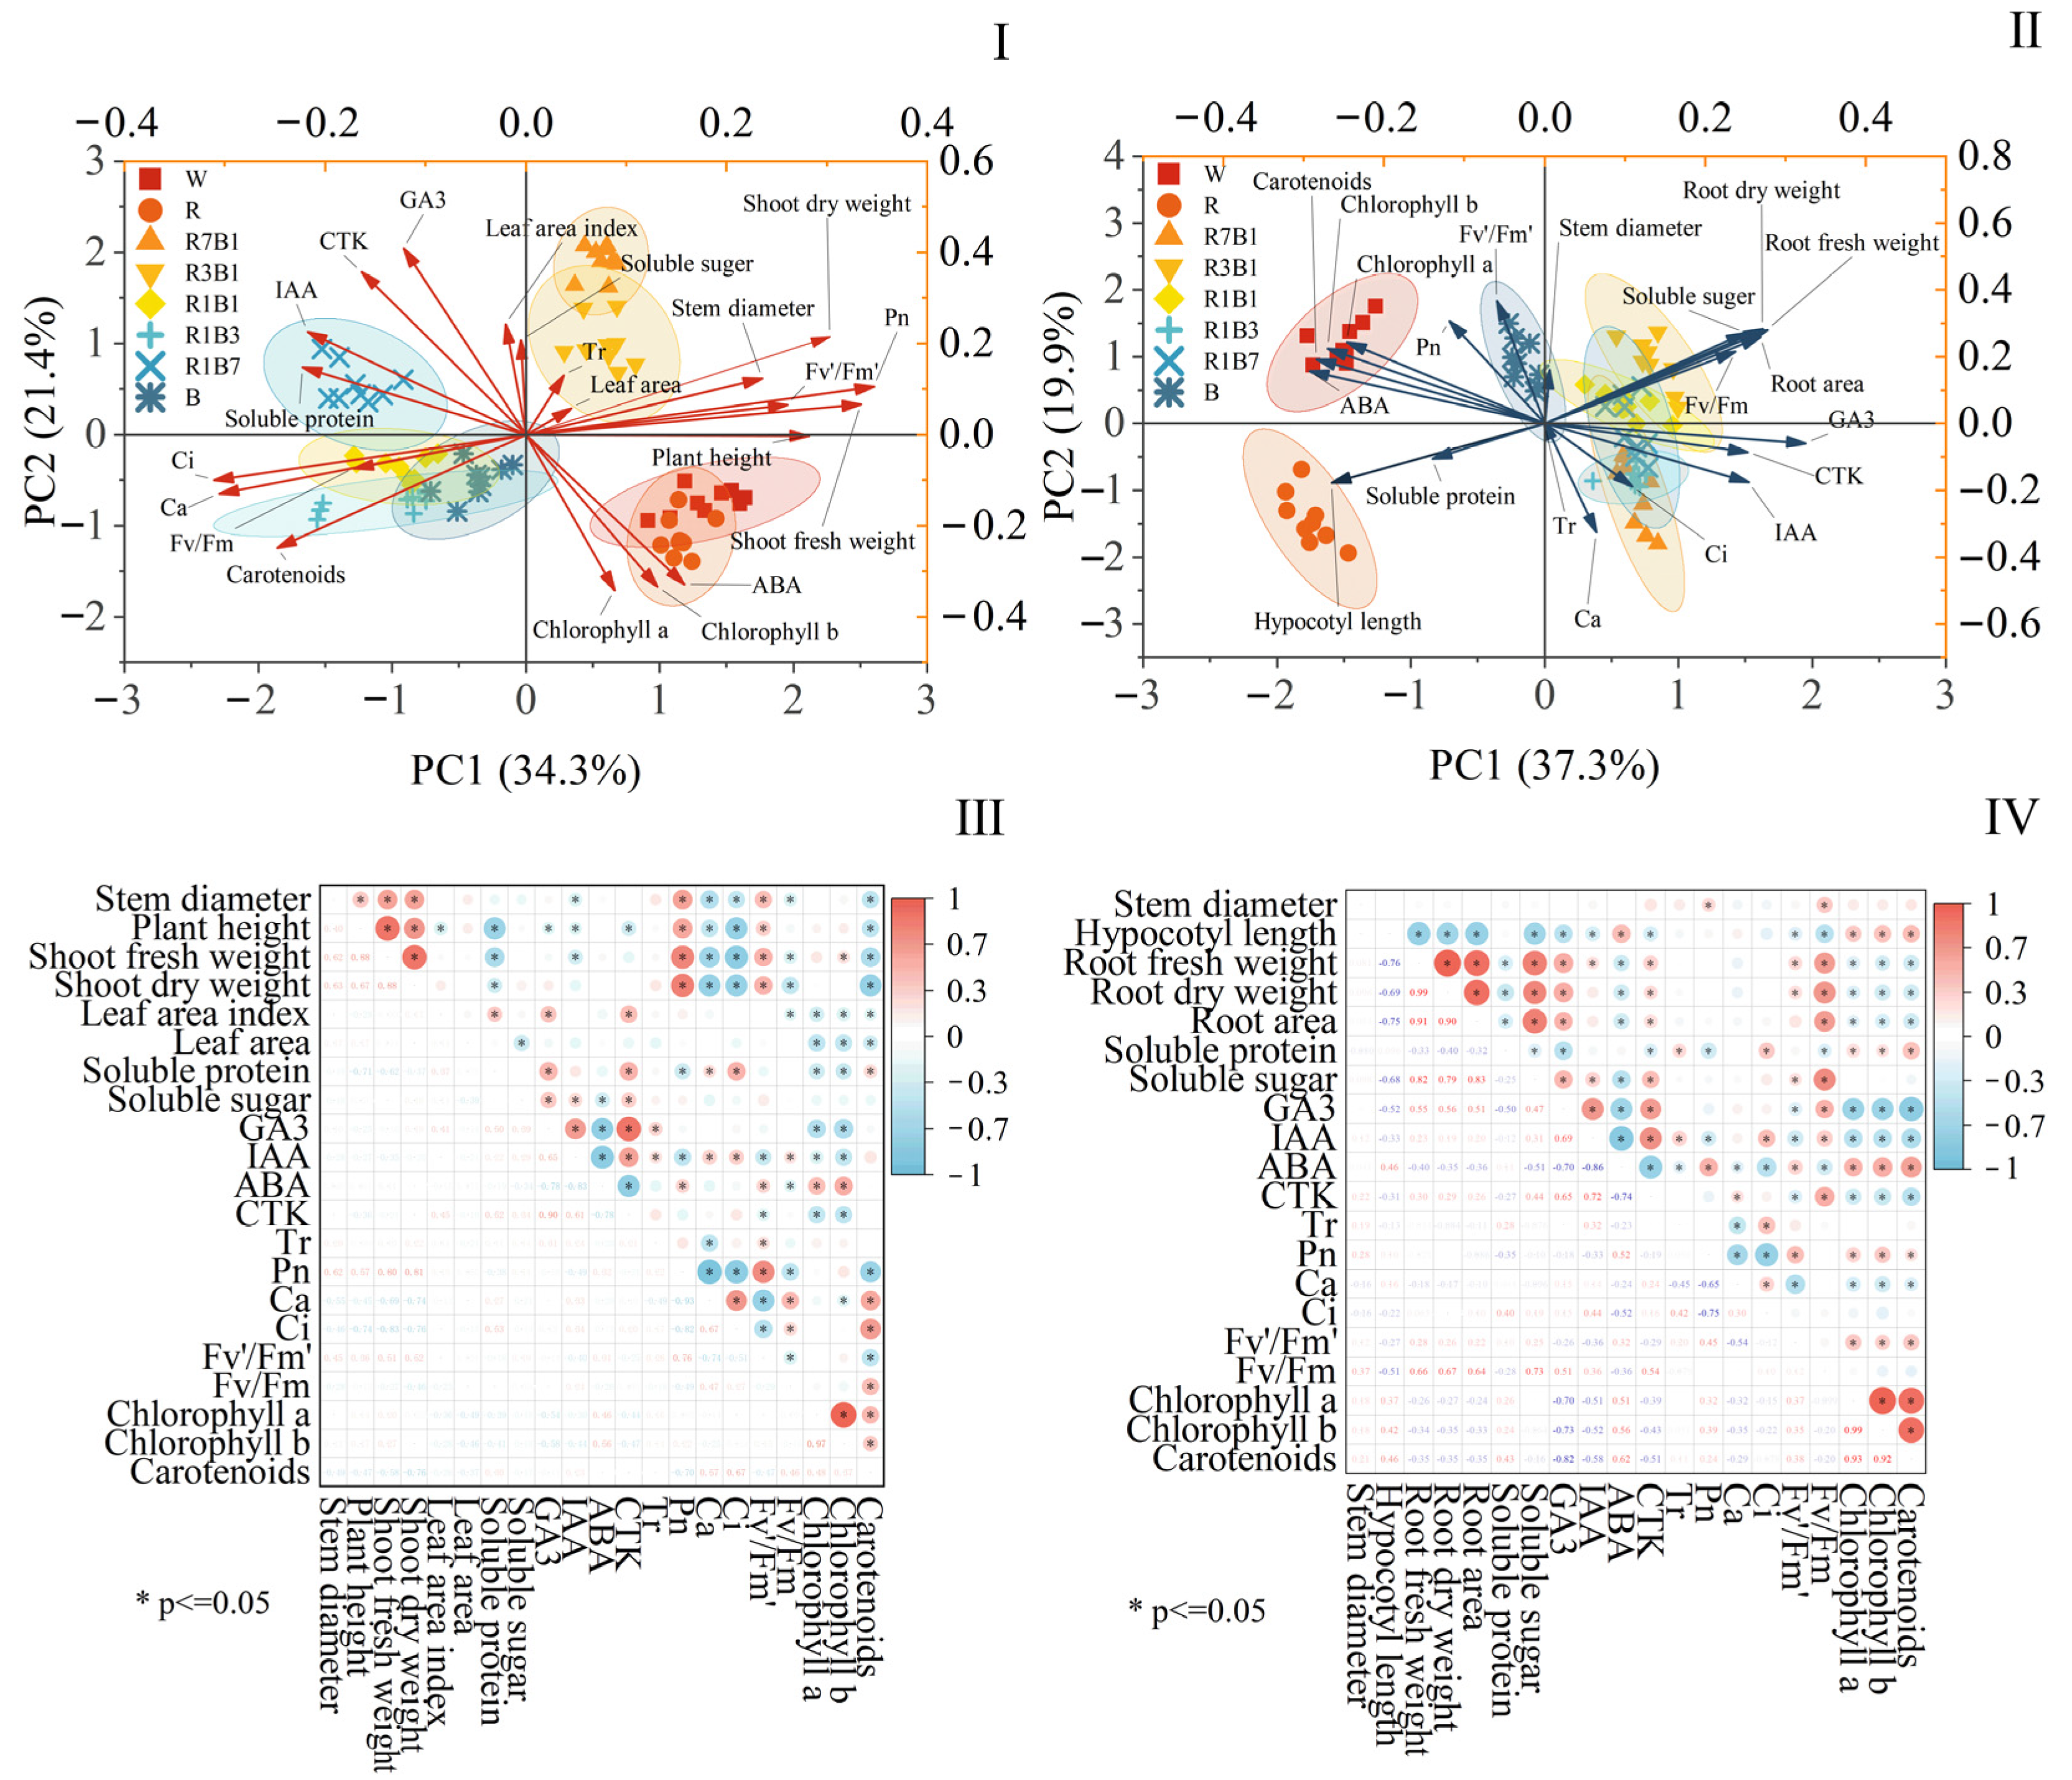
To comprehensively evaluate the effects of different light quality treatments on the physiological responses of tomato seedlings, principal component analysis (PCA) was performed independently on 21 physiological parameters for scions and 20 for rootstocks (Figure 7).
For scion seedlings, PC1 and PC2 collectively explained 55.7% of the total variance, indicating that the two-dimensional PCA model captured most information in the dataset. The score plot showed clear separation among different light quality treatments. Treatments with a high red light proportion (W, R, R7B1, R3B1) were distributed on the positive side of PC1. Among these treatments, R7B1 and R3B1 clustered on the positive side of PC2, while W and R were mainly distributed on the negative side of PC2. The remaining treatments were on the negative side of PC1, indicating that different light qualities induced distinct overall physiological states in scion seedlings.
Loading plot analysis revealed that PC1 was positively loaded with biomass accumulation, chlorophyll content, plant height, stem diameter, and net photosynthetic rate (Pn), and negatively loaded with soluble protein content, auxin (IAA), and carotenoid content. PC2 was strongly positively associated with gibberellin (GA3), IAA, cytokinin (CTK), leaf area, plant height, and stem diameter, suggesting that higher PC2 scores reflect greater growth vigor and more robust shoot structure.
Heatmap analysis further confirmed extensive correlations among scion traits (Figure 7). Stem diameter and plant height were significantly positively correlated with aboveground biomass accumulation, whereas IAA, GA3, and CTK were significantly negatively correlated with plant height, stem diameter, and aboveground fresh weight. Intercellular CO2 concentration (Ci) was positively correlated with stomatal conductance (Gs) but significantly negatively correlated with Pn and the effective quantum yield of PSII (ΦPSII).
For rootstocks, PC1 and PC2 together explained 56.5% of the total variance, indicating that the two-dimensional PCA model effectively represented the main dataset structure. In the score plot, W and R treatments were located on the negative side of PC1: W samples clustered on the positive side of PC2, while R samples concentrated on the negative side. All other treatments were distributed on the negative side of PC1. This indicated that W and R induced distinct physiological states in rootstock seedlings. In contrast, the remaining light quality treatments elicited relatively similar physiological responses in the seedlings.
Loading plot analysis showed that PC1 was positively associated with biomass accumulation, photosynthetic pigment content, stem diameter, and Pn and negatively associated with hypocotyl length, growth-promoting hormones (GA3, IAA, CTK), and Gs. PC2 was mainly positively correlated with growth-promoting hormones and root growth traits (e.g., root area, root dry weight) and negatively correlated with shoot growth (e.g., shoot dry weight, leaf area) and photosynthetic accumulation (e.g., chlorophyll content, Pn). Thus, PC2 reflects a shoot–root resource allocation axis, with higher scores indicating more vigorous root growth.
As shown in the heatmap (Figure 7), extensive correlations were also observed among rootstock traits. Root growth traits (e.g., root area, root dry weight) were highly significantly negatively correlated with shoot growth traits (e.g., shoot dry weight, leaf area). They also showed a highly significant negative correlation with photosynthetic pigment contents (chlorophyll a, chlorophyll b, total chlorophyll, carotenoids). Soluble protein content was significantly negatively correlated with soluble sugar content. Growth-promoting hormones (GA3, IAA, CTK) were significantly positively correlated with root growth but significantly negatively correlated with shoot biomass accumulation.

3.5. The Effects of Different Light Quality Pretreatments on the Vegetative Growth and Morphological Development of Grafted Seedlings

3.5.1. Effects of Different Light Quality Pretreatments on Morphological Development of Grafted Seedlings

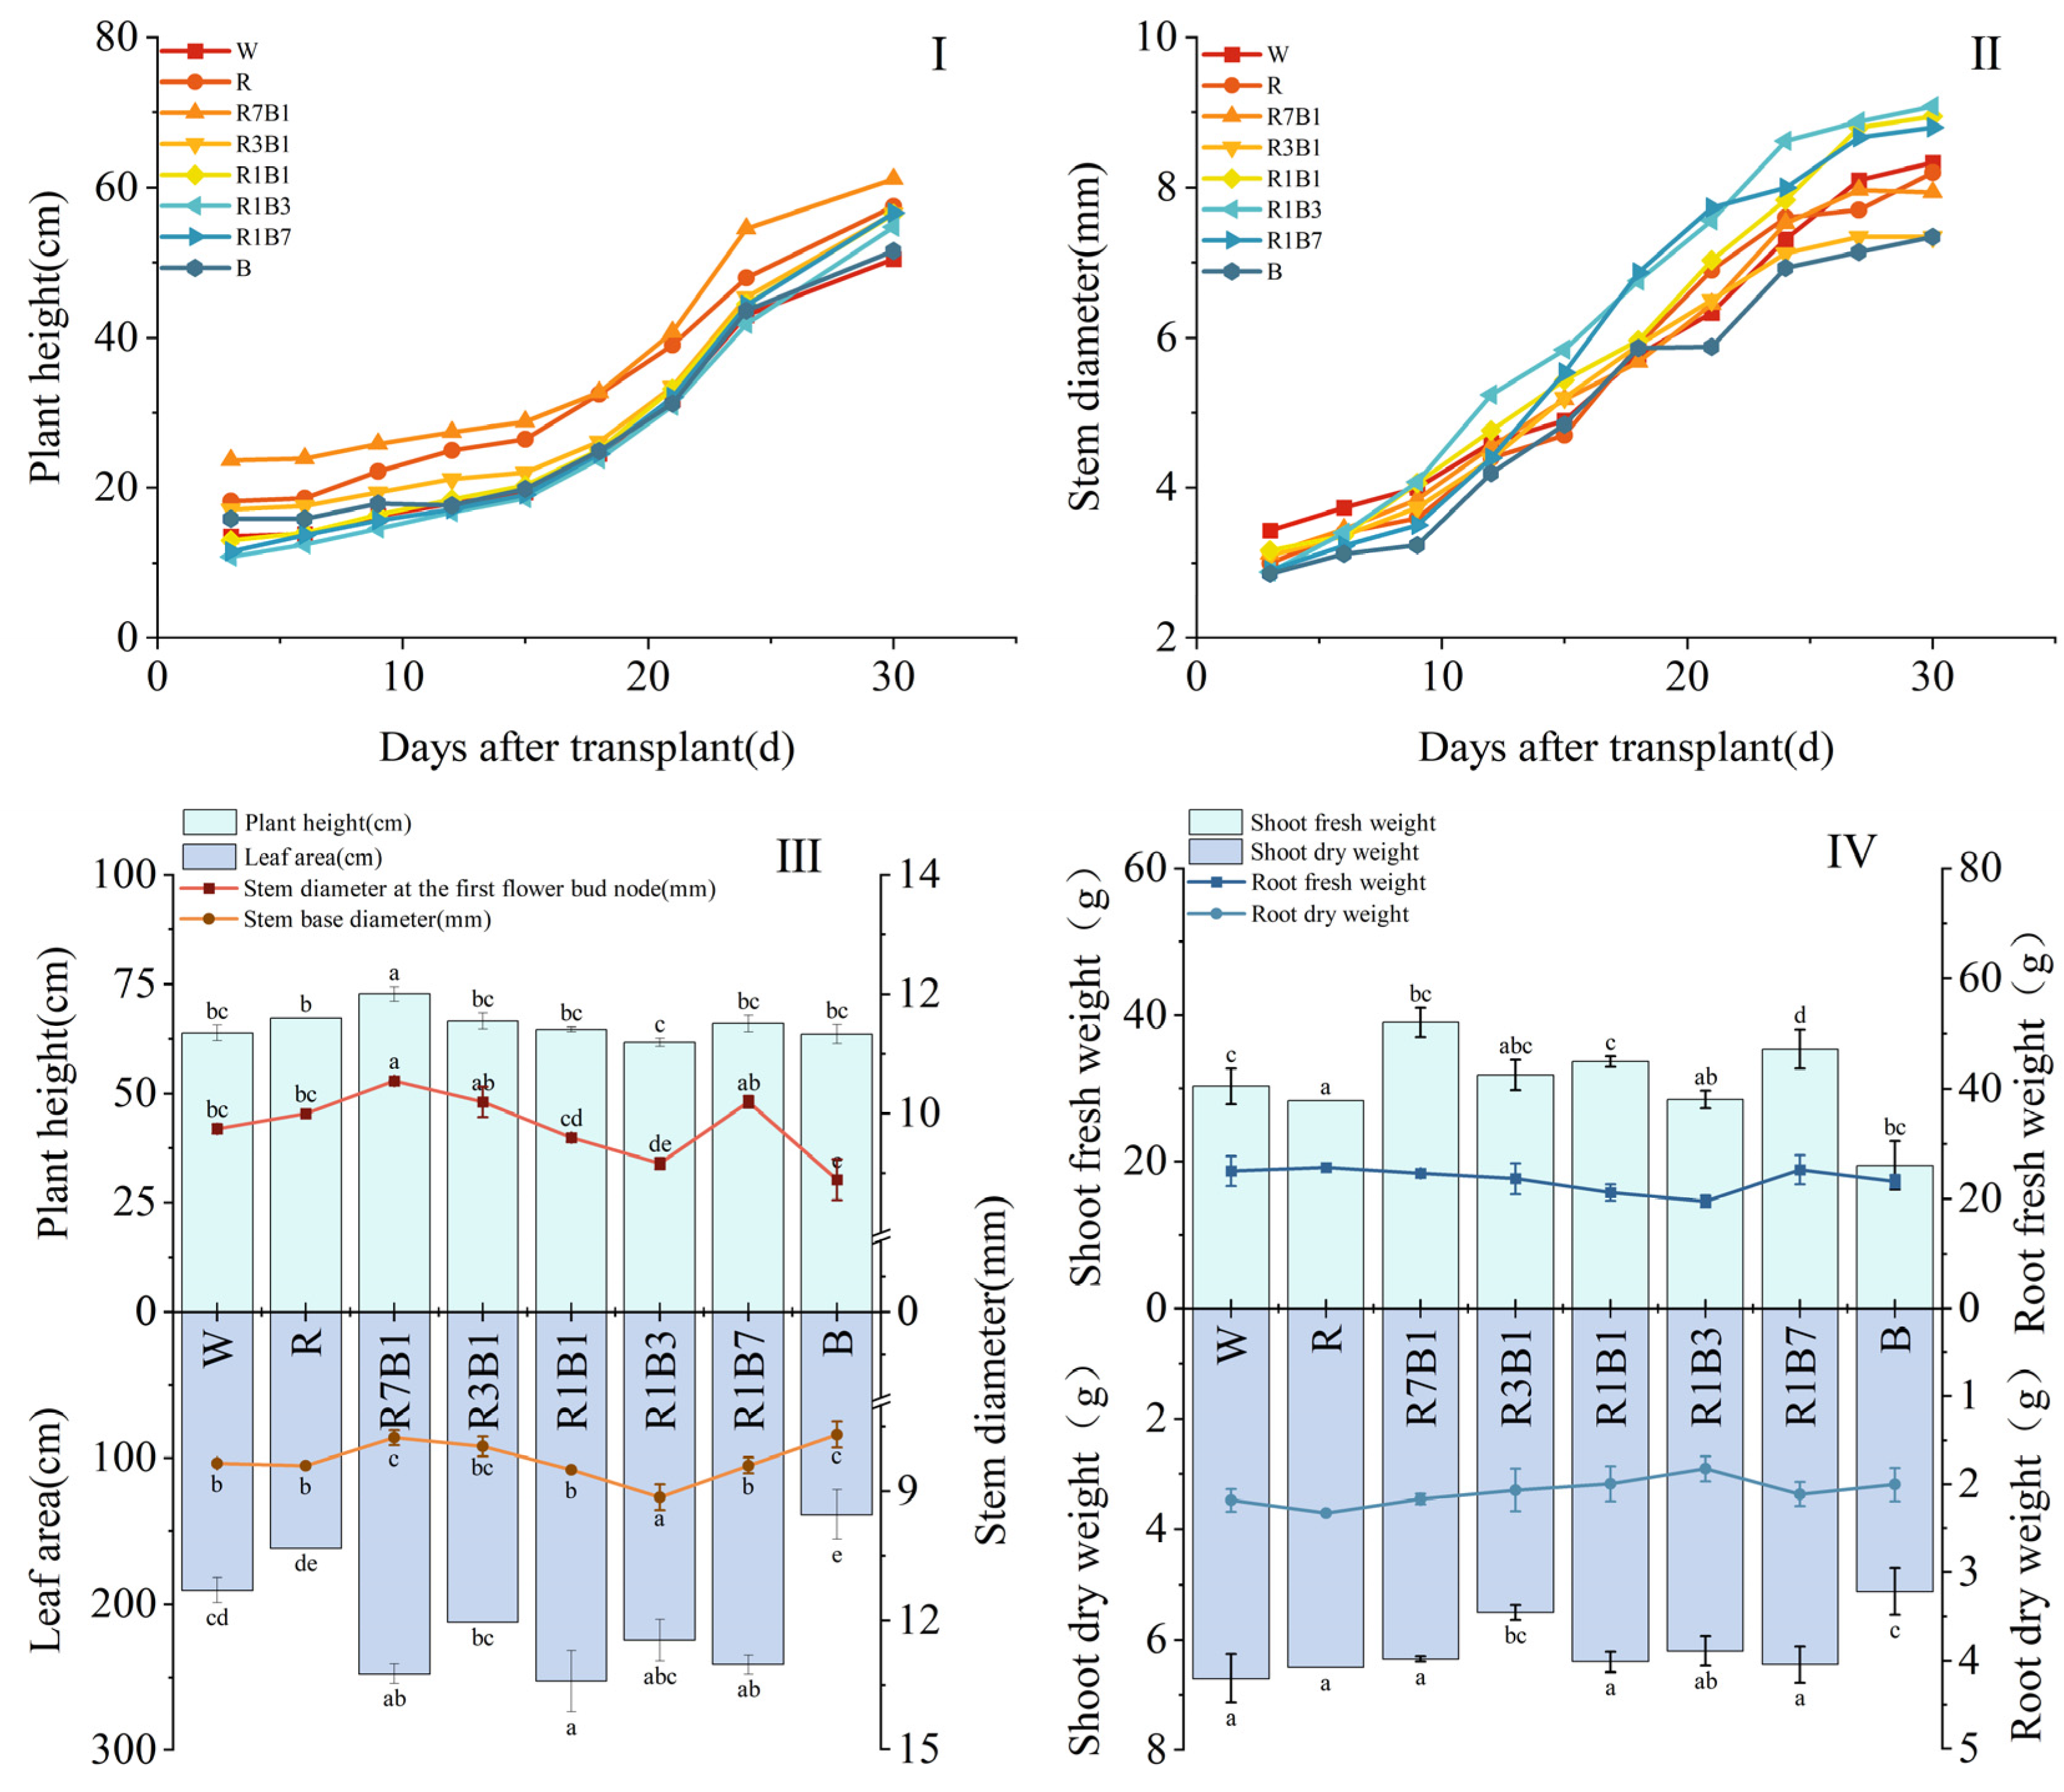
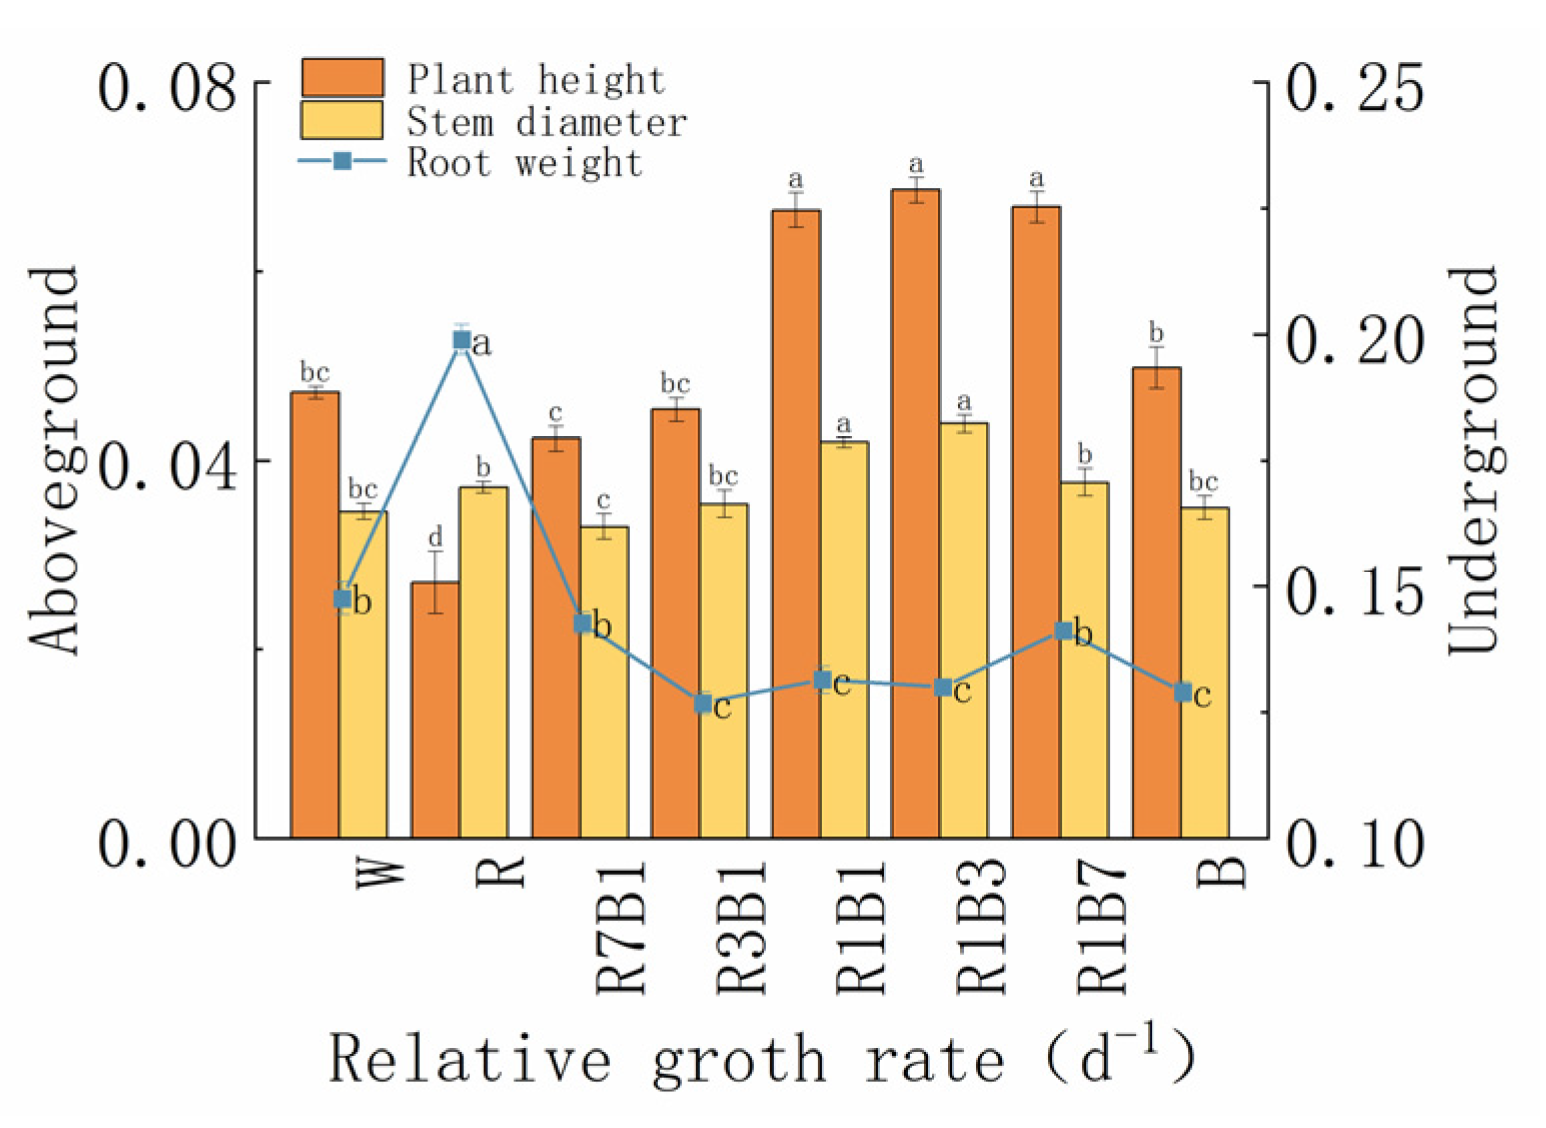
Grafted seedling height increased steadily under all light treatments (Figure 8). Among them, R7B1 and red light (R) conferred the greatest vigor, with final heights of 61.2 cm and 57.5 cm, respectively, at 30 days after grafting.
Stem diameter responded strongly to light quality (Figure 8). R1B3 showed a clear advantage, surpassing all other treatments from 12 days after grafting onward and reaching a final diameter of 9.08 mm. R1B1 also maintained comparatively large stem diameters.
At the initial flowering stage, plant height, basal stem diameter, leaf area, and stem diameter at the first flowering node were measured, and all traits were significantly affected by light-quality pretreatments (Figure 8). Seedlings under R7B1 were tallest (72.77 cm), significantly exceeding most other treatments, while R (67.20 cm) also promoted relatively tall plants. In contrast, R1B3 produced the shortest plants (61.70 cm), with blue light (B, 63.54 cm) also in the lower range.
Stem diameter responses differ by position. For basal stem diameter, R1B3 produced the thickest stems (9.14 mm), significantly greater than all other treatments, with R1B1 and R also maintaining relatively large basal diameters. By contrast, B and R7B1 generated the thinnest basal stems (7.68 mm and 7.75 mm, respectively). At the first flowering node, R7B1 produced the thickest stems (10.55 mm), followed by R3B1 and R1B7, whereas B resulted in the smallest diameter (8.90 mm).
At the late growth stage, the leaf area of grafted tomato seedlings was significantly larger under mixed red–blue light than under light. All mixed light treatments produced leaf areas exceeding 200 cm2, with only minor differences among them.

3.5.2. Effects of Different Light Quality Pretreatments on the Vegetative Growth of Grafted Seedlings

Under the R7B1 treatment, the aboveground fresh weight (39.019 g) and dry weight (4.3707 g) of grafted seedlings were significantly higher than those under all other treatments. White light, R3B1, R1B1, and R1B7 treatments resulted in intermediate levels of aboveground biomass. No significant differences in fresh and dry weight were found among these four treatments, yet their values were significantly higher than those of the R1B3 and blue light (B) treatments. The B treatment resulted in the lowest aboveground fresh weight (19.4887 g) and dry weight (2.1334 g) among all treatments (Figure 8).
No statistically significant differences in underground biomass accumulation were detected among treatments, although clear trends were observed (Figure 8). Red light (R) produced the highest underground fresh weight (25.7355 g), whereas R1B1 yielded the highest underground dry weight (2.3283 g). Overall, the R7B1, W, and R1B7 treatments maintained relatively high root biomass, whereas R1B3 showed the lowest underground fresh and dry weights.

3.5.3. Effects of Different Light Quality Pretreatments on the Relative Growth Rates of Grafted Seedlings

The relative growth rates of plant height, stem diameter and root system of grafted seedlings after grafting were calculated using the corresponding formula. Correlation analysis revealed that significant differences existed in the above parameters among different treatments. Among them, the shoot relative growth rates under R1B3 and R1B7 treatments were significantly higher than those under other treatments, whereas the root relative growth rates were significantly lower.
relative   growth   rates = l n w 1 l n ( w 2 ) t 1 t 2
w1: Initial parameters of grafted seedlings.
w2: Final parameters of grafted seedlings;
t1: Measurement time of initial parameters;
t2: Measurement time of final parameters.

3.6. Different Light Quality Pretreatments on Photosynthetic Capacity and Carbon–Nitrogen Metabolism of Grafted Seedlings

3.6.1. Leaf Light Response Curve Characteristics

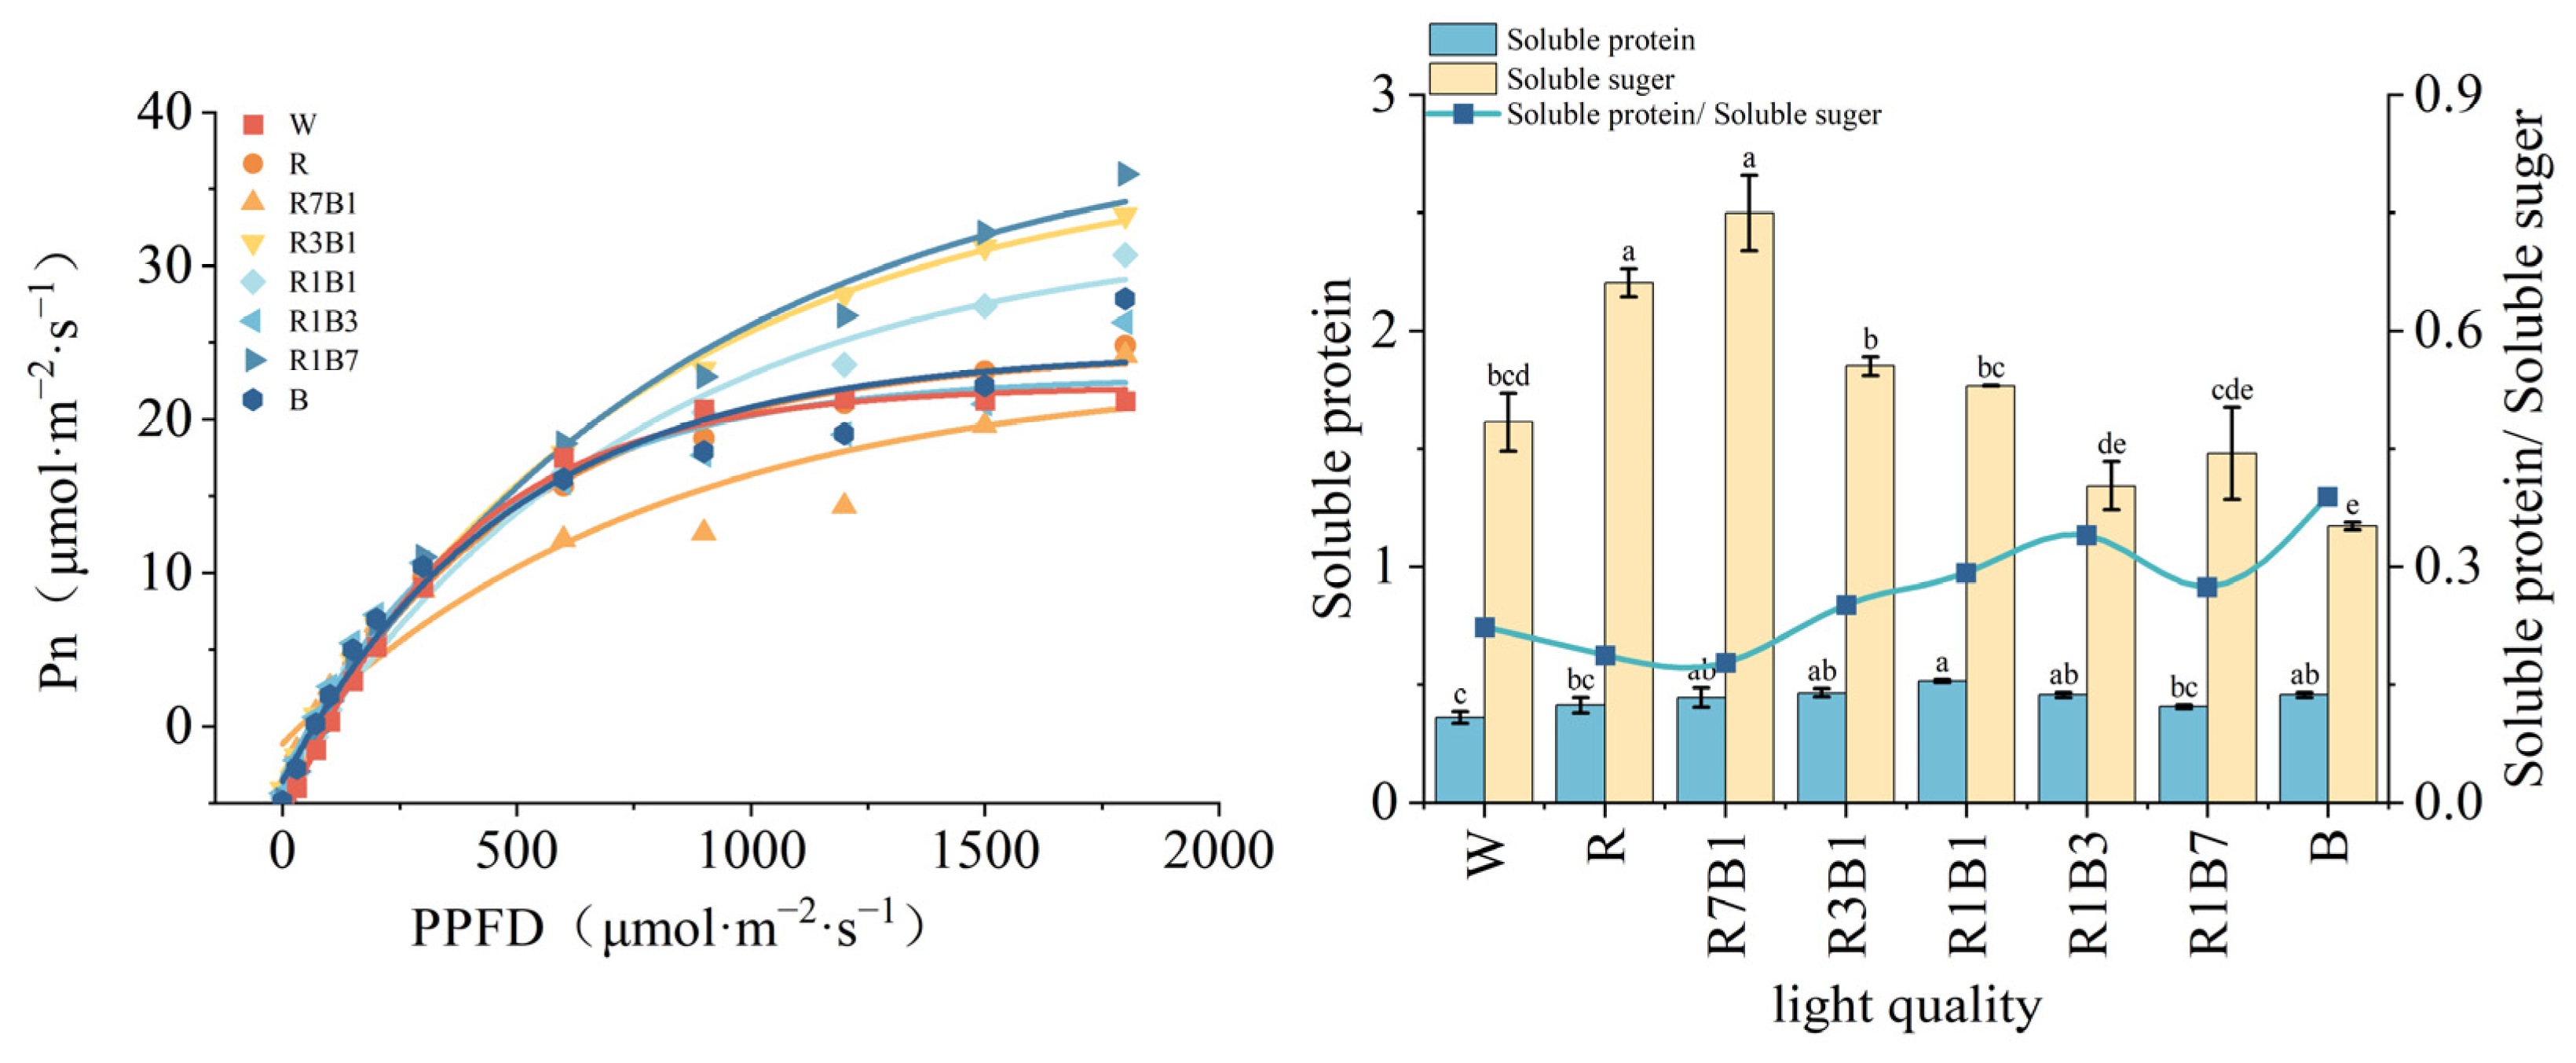
The ExpDec model was employed to fit the light response curves, with the fitting equation expressed as Pn = A1 × exp(− x t 1 ) + y0, where y0 is the offset, A is the amplitude, and t is the time constant. Light quality significantly affected leaf photosynthetic parameters (Figure 9, Table 3). The light compensation point (LCP) was lowest under R7B1, at 36.77 μmol·m−2·s−1, which was 60.17% lower than under white light. The light saturation point (LSP) was highest under R1B7 (1954.68 μmol·m−2·s−1), followed by R3B1 (1825.80 μmol·m−2·s−1) and R7B1 (1792.92 μmol·m−2·s−1), representing increases of 132.39%, 117.07%, and 113.15%, respectively, relative to W. Similarly, the maximum net photosynthetic rate (Pn_max) was highest under R1B7 (39.32 μmol·m−2·s−1), with R3B1 ranking second (37.10 μmol·m−2·s−1), corresponding to increases of 77.43% and 67.42%, respectively, compared with W.

3.6.2. Carbon and Nitrogen Metabolites After Grafting

Different light-quality pretreatments significantly affected the accumulation of carbon and nitrogen metabolites in the leaves of grafted seedlings (Figure 10).
For soluble protein content, R1B1 produced the highest value (0.52 mg·g−1), which was significantly greater than those under W, red light (R), and R1B7 (0.36–0.41 mg·g−1). However, it did not differ significantly from R3B1, R7B1, R1B3, or blue light.
For soluble sugar content, R7B1 (2.50 mg·g−1) and R (2.20 mg·g−1) showed significantly higher levels than all other treatments, whereas B produced the lowest value (1.17 mg·g−1). R3B1 (1.85 mg·g−1) and R1B1 (1.776 mg·g−1) resulted in intermediate levels of soluble sugar accumulation.
The asynchronous responses of carbon and nitrogen metabolites resulted in marked variation in the protein-to-sugar ratio among treatments. R1B1 produced the highest ratio (0.292), whereas R (0.188) and R7B1 (0.178) showed the lowest ratios. These results suggest that R1B1 pretreatment may direct scion metabolic flux toward nitrogen assimilation and protein synthesis, whereas R and R7B1 favor carbohydrate accumulation, with their high soluble sugar contents effectively reducing the protein-to-sugar ratio.

4. Discussion

4.1. Light Quality Influences Plant Biomass Accumulation by Modulating Photosynthetic Responses in Tomato Seedling

In this study, the photosynthetic responses and morphological traits of tomato rootstocks and scions exhibited analogous patterns in response to different light qualities.
Previous research has established that red light and far-red light, as the primary energy sources for plant photosynthesis, effectively drive the electron transport chains of Photosystem II (PSII) and Photosystem I (PSI), thereby enhancing photochemical quantum efficiency [29,30,31]. Consistent with these findings, our experiment demonstrated that a higher proportion of red light in the spectral environment significantly increased the net photosynthetic rate (Pn) of tomato seedlings. Furthermore, parameters, including aboveground dry weight and plant height in scion seedlings were also significantly elevated. This result is consistent with the findings of Jin [32]. Their study found that multiple seedling traits were higher under higher red-to-blue light ratio treatments. These traits included plant height, stem diameter, leaf area, dry matter accumulation, relative chlorophyll content, and net photosynthetic rate, in comparison to treatments with higher blue light proportions. The mechanism by which red light promotes biomass accumulation may involve multiple levels. Firstly, red light can specifically activate phytochrome B (phyB), subsequently upregulating the expression of key Calvin cycle enzyme genes such as RBCS and RBCL [33,34,35]. Secondly, red light also facilitates the translocation and allocation of photoassimilates to the shoot, which is corroborated by our data on plant height and aboveground dry weight. In their study on plant responses to light quality, Cong-Pei Yin [36] found that red light promotes stem elongation but inhibits root activity via the PHY-auxin pathway.
The accumulation of photosynthetic products depends not only on light capture efficiency but is also closely associated with the regulation of carbon assimilation pathways [37]. In our experiment, under treatment with a higher proportion of blue light, tomato plants generally exhibited a trend of lower net photosynthetic rate coupled with higher photosynthetic pigment content. Their photosynthetic reaction centers also showed trends of low initial fluorescence (Fo), low maximum fluorescence (Fm), and high photochemical efficiency (Fv/Fm). This phenotypic profile is consistent with phenomena reported in previous studies. Blue light can promote chloroplast development and the formation of light-harvesting complexes, which is manifested as an increase in photosynthetic pigment content [38,39]. However, it may simultaneously inhibit the carbon assimilation process through multiple mechanisms. Firstly, Hogewoning [40] found in their research on cucumber that pure blue light treatment reduced stomatal conductance by approximately 40%, limiting CO2 supply for photosynthesis. Secondly, blue light may affect the efficiency of dark reactions by regulating the activity of Rubisco activase (RCA). Studies by Ren [41] indicated that blue light influences Rubisco enzyme activity by modulating the expression of photosynthesis-related genes in rice leaves, thereby affecting photosynthetic capacity in rice seedlings.
However, the influence of light quality on these physiological processes is not simply linear. R, B and R1B7 treatments exhibited specific characteristics distinct from other treatments. This finding echoes previous research on light quality interactions. Folta [42] suggests that red and blue light engage in a complex network of interactions when regulating plant growth and development. The specificity observed in our R1B7 treatment might be related to interactions between photoreceptors. When the blue light proportion is extremely high, the over-activation of cryptochrome (cry) may antagonize the phytochrome (phy) signaling pathway [43]. Furthermore, Liang [44] found that blue-light-mediated inhibition of elongation growth in mixed light treatments requires the synergistic action of active phytochrome. In blue light, such phytochrome activity decreases (Photostationary State, PSS 0.50), which could be one reason for the specific promotion of plant height by blue light observed in our experiment.

4.2. Light Quality Indirectly Regulates Tomato Seedlings’ Biomass Allocation and Morphogenesis by Modulating Hormone Levels

Auxin, gibberellin, and cytokinin, as growth-promoting hormones, act synergistically to promote cell division and elongation. In contrast, abscisic acid (ABA), a stress hormone, typically enhances plant stress adaptation by inhibiting growth-related gene expression and promoting stomatal closure [45,46,47]. Research by Gai [48] found that red light promotes auxin and gibberellin accumulation by upregulating genes such as CaGRF and CaARF, thereby regulating pepper morphology, which aligns with the findings of this study. Our results show that under mixed light treatments, the dynamic changes in morphological indices of tomato rootstocks and scions corresponded with the variation trends in auxin, gibberellin, and cytokinin contents. These indices include hypocotyl length, plant height, stem diameter, and leaf area, and their change trends were in contrast to that of ABA content. This supports the classical theory that “growth-promoting hormones facilitate morphogenesis, while ABA inhibits growth.” However, under white light and light treatments (especially red light and blue light), the relationship between morphological indices and hormone levels exhibited greater specificity and complexity, lacking a simple synchronous change pattern. This suggests that under non-balanced spectral conditions, plants may activate regulatory networks beyond the typical hormone pathways. For instance, light signals might directly act on metabolic pathways, energy allocation systems, or epigenetic modification mechanisms. These signals regulate the efficiency and direction of biomass production and allocation, thereby maintaining physiological homeostasis in variable light environments [49,50,51].
Under the R1B1 treatment, the levels of growth-promoting hormones (IAA, GA3, CTK) and related hormone ratios (IAA/CTK, IAA/GA3) in both tomato rootstocks and scions were relatively low. This phenomenon indicates that when red and blue light intensities are comparable, their physiological effects are not simply additive. Instead, they may interact at the signal transduction level. On one hand, red and blue light signaling pathways might synergistically activate shared downstream responses at certain regulatory nodes [52]. On the other hand, they may also exert antagonistic effects by competing for signaling components or activating opposing regulatory circuits [53,54]. This interaction between light signaling systems reflects plants’ adaptive strategies in complex light environments: by integrating signals from different photoreceptors, plants finely tune their signaling networks to achieve optimal growth configuration and resource utilization efficiency [55,56,57].
This study reveals that specific light qualities mediate a dynamic balance mechanism between growth promotion and stress adaptation by regulating plants’ carbon and nitrogen allocation strategies. In this experiment, treatments such as R1B7 and R3B1 significantly increased the levels of growth-promoting hormones in tomato plants, while simultaneously reducing the content of abscisic acid (ABA). Meanwhile, the soluble sugar contents in both the rootstock and scion of tomato showed a concomitant upward trend. In addition, data analysis indicated that plant-soluble sugar content varied in line with the trends of growth-promoting hormones (IAA, GA3). It also showed a significant positive correlation with growth indicators such as biomass accumulation, plant height, and root development. In contrast, soluble protein content showed significant negative correlations with these indicators. This phenomenon implies a regulatory mode through which light signals coordinate plant growth. Light quality first modulates the synthesis and distribution of endogenous hormones via photoreceptor systems (e.g., phytochrome, cryptochrome). This alters the balance between growth-promoting hormones and inhibitory hormones such as ABA [58,59]. Subsequent hormonal changes regulate the activity of key carbon and nitrogen metabolism enzymes and the expression of related genes, thereby influencing the direction and conversion efficiency of photosynthetic product allocation [60,61]. Ultimately, this process manifests as differences in carbon and nitrogen accumulation patterns. Growth-promoting hormones may promote carbon allocation to growing sites by enhancing sucrose transporter activity and the expression of sugar-metabolism-related enzymes [62]. ABA may bias resources toward defense and maintenance functions by promoting nitrogen assimilation and protein synthesis [63]. This mechanism, from the perspective of carbon and nitrogen metabolic resource reallocation, provides an important physiological basis for understanding plant phenotypic plasticity in changing light environments.

4.3. Light Quality Influences Plant Growth Through a “Light Memory” Effect

Szechyńska-Hebda [64] proposed the concept of cellular light memory, suggesting that plants can store and process light-derived information to predict environmental changes and optimize their subsequent responses. Similarly, this study found that after the termination of specific light quality treatments, seedlings continued to exhibit growth trends associated with their pretreatment conditions during subsequent developmental stages. Specifically, at the initial flowering stage, plants pre-treated with different red-blue mixed light qualities showed differential patterns in plant height, basal stem diameter, and dry matter accumulation. These patterns were consistent with those observed during the treatment period. According to this phenomenon, we speculate that plants may possess a light quality memory capability, storing information from specific light environments in certain physiological or molecular forms. Such stored information can then persistently modulate their growth and developmental programs, even in the absence of the original light quality stimulus [65,66,67].
Measurements of photosynthetic performance revealed that grafted seedlings pre-treated with a higher proportion of red light maintained a relatively higher net photosynthetic rate (Pn) under subsequent standard light conditions. This may suggest that the pretreatment not only altered the immediate photosynthetic status of the plants but also potentially influenced the development of the photosynthetic apparatus, the activity of key enzymatic systems, or the expression of photosynthesis-related genes [68,69]. Such changes may contribute to a sustained enhancement of photosynthetic capacity during the observed growth period [70].
The soluble protein content profile of grafted tomato plants at the initial flowering stage mirrored the pattern established during the earlier light quality pretreatments. This might suggest that the physiological effects induced by light quality pretreatment may be systemic and persistent, potentially extending to the regulation of nitrogen metabolism and resource allocation strategies [71]. The initial light conditions might set a “metabolic tonality” for plant nitrogen metabolism by modulating key regulatory nodes, such as nitrogen uptake, assimilation processes (e.g., nitrate reductase and glutamine synthetase activity), or protein synthesis and turnover rates. This perhaps establishes a specific nitrogen allocation pattern that persists into later developmental stages, determining whether nitrogen resources are preferentially allocated to soluble protein synthesis or diverted to other nitrogenous compounds and structural growth components. This enduring imprint on carbon and nitrogen metabolism patterns indicates the observed persistent differences in photosynthetic capacity and growth phenotypes. These changes collectively form the physiological basis of the light quality memory effect.

5. Conclusions

This experiment demonstrated that the R3B1 treatment was most effective in improving the morphological and mechanical adaptability of tomato rootstocks and scions. This experiment demonstrated that the R3B1 treatment exerted the most significant effect on improving the morphological and mechanical adaptability of tomato rootstocks and scions. Under this treatment, scion seedlings exhibited the maximum PSII photochemical efficiency (0.816) and sustained a relatively high net photosynthetic rate (6.42 µmol·m−2·s−1), which resulted in a significant increase in photosynthate accumulation. Moreover, the R3B1 treatment upregulated the levels of growth-promoting hormones while maintaining a relatively low abscisic acid (ABA) content, thus facilitating the efficient distribution and utilization of photoassimilates. After the experimental treatments, key growth parameters of the scions—including stem diameter (2.75 mm), plant height (17.03 cm), and aboveground biomass accumulation (0.36 g)—were significantly increased. In addition, the scions attained the highest comprehensive score (2.06) across all treatments.
For rootstocks, the hypocotyl length (55 mm), root area (0.61 cm2), and root dry weight (0.46 g) of tomato seedlings under the R3B1 treatment also reached relatively high levels, with the highest mechanical adaptability scores (2.57). Meanwhile, while blue light (B) also yielded the highest mechanical adaptability scores (2.9) for rootstocks, this beneficial effect was not statistically significant.
In conclusion, R3B1 is the optimal treatment for cultivating robust seedlings suitable for mechanical grafting, as it coordinately regulates photosynthetic performance and hormonal balance. It should be acknowledged that the present study has certain limitations. Specifically, we separately investigated the effects of light quality on the rootstock and scion. In these grafting experiments, grafted seedlings under different light quality treatments are still affected by their initial light conditions during subsequent growth. Therefore, future research should investigate the interaction effects between rootstocks and scions under different light quality treatments. Furthermore, the survival rate of grafted seedlings following transplantation was not assessed.
This research will provide a systematic theoretical basis and technical guidance for mechanized tomato seedling production.

Author Contributions

Conceptualization, Y.M. and Z.M.; Methodology, Y.M., Z.M. and Y.W. (Yichi Wang); formal analysis, Y.W. (Yexin Wu) and C.Y.; resources, S.G. and X.C.; data curation, Y.W. (Yexin Wu) and C.Y.; writing—original draft preparation, Y.W. (Yexin Wu); writing—review and editing, Y.M. and Z.M.; visualization, Y.W. (Yexin Wu) and C.Y.; supervision, Y.M. and S.G.; project administration, Y.M. and Z.M. All authors have read and agreed to the published version of the manuscript.

Funding

This research was funded by the Department of Agriculture and Rural Affairs of Guangdong Province (2025CXTD01, 2023-NJS-00-011), and Department of Science and Technology of Guangdong Province (2023B0202110001).

Data Availability Statement

Data is contained within the article.

Acknowledgments

We thank the anonymous reviewers for their helpful comments, which significantly improved the manuscript.

Conflicts of Interest

Author Chen Xingping was employed by the company Guangdong Provincial Improved Variety Introduce Service Corp. The remaining authors declare that the research was conducted in the absence of any commercial or financial relationship that could be constructed as a potential conflict of interest.

Abbreviations

The following abbreviations are used in this manuscript:
LEDLight-Emitting Diode
PPFDPhotosynthetic Photon Flux Density
WWhite Light
RRed Light
BBlue Light
R7B1Red light:Blue light = 7:1
R3B1Red light:Blue light = 3:1
R1B1Red light:Blue light = 1:1
R1B3Red light:Blue light = 1:3
R1B7Red light:Blue light = 1:7
Chl aChlorophyll a
Chl bChlorophyll b
CarCarotenoid
PnNet Photosynthetic Rate
GsStomatal Conductance
CiIntercellular CO2 Concentration
TrTranspiration Rate
FoInitial Fluorescence
FmMaximum Fluorescence
Fv/FmMaximum Quantum Yield of Photosystem II
Fv′/Fm′Effective Quantum Yield of PSII
PSIIPhotosystem II
ELISAEnzyme-Linked Immunosorbent Assay
IAAIndole-3-Acetic Acid
GA3Gibberellin A3
ABAAbscisic Acid
CTKCytokinin
PCAPrincipal Component Analysis
ΦPSIIEffective Quantum Yield of PSII
LCPLight Compensation Point
LSPLight Saturation Point
Pn_maxMaximum Net Photosynthetic Rate
PSIPhotosystem I
phyBPhytochrome B

References

  1. Singh, H.; Kumar, P.; Kumar, A.; Marios, C.K.; Colla, G.; Rouphael, Y. Grafting tomato as a tool to improve salt tolerance. Agronomy 2020, 10, 263. [Google Scholar] [CrossRef]
  2. Keinath, A.P.; Hajihassani, A. Grafting tomato to manage southern blight, prevent yield loss, and increase crop value. Plant Dis. 2023, 107, 3064–3070. [Google Scholar] [CrossRef] [PubMed]
  3. Mote, P.K.; Khapt, S.P.; Misal, B.B.; Sarode, S.S.; Agale, M.G.; Shinde, G.S.; Changan, S.S.; Salunkhe, V.N.; Reddy, K.S. Eggplant rootstocks enhance flooding tolerance in grafted tomato compared to wild tomato rootstocks. Rhizosphere 2025, 36, 101194. [Google Scholar] [CrossRef]
  4. Alqardaeai, T.; Alharbi, A.; Alenazi, M.; Alomran, A.; Elfeky, A.; Osman, M.; Obadi, A.; Aldubai, A.; Ortiz, N.R.; Melino, V.; et al. Effect of tomato grafting onto novel and commercial rootstocks on improved salinity tolerance and enhanced growth, physiology, and yield in soilless culture. Agronomy 2024, 14, 1526. [Google Scholar] [CrossRef]
  5. Caradonia, F.; Francia, E.; Alfano, V.; Ronga, D. Grafting and plant density influence tomato production in organic farming system. Horticulturae 2023, 9, 669. [Google Scholar] [CrossRef]
  6. Zhou, L.Q. A Complete Guide to the Identification and Evaluation of Vegetable Seedling Quality; China Agricultural Press: Beijing, China, 2023; p. 108. [Google Scholar]
  7. Gu, S. Integration of vegetable seedling grafting machines with large-scale grafted seedling production. Mod. Agric. Equip. 2024, 45, 2–10. [Google Scholar]
  8. Tian, S.B.; Ashraf, M.A.; Kondo, N.; Shiigi, T.; Momin, M.A. Optimization of machine vision for tomato grafting robot. Sens. Lett. 2013, 11, 1190–1194. [Google Scholar] [CrossRef]
  9. Huang, Y.; Kong, Q.S.; Chen, F.; Bie, Z.L. The history, current status and future prospects of vegetable grafting in china. Acta Hortic. 2015, 1086, 31–40. [Google Scholar] [CrossRef]
  10. Zou, J.; Liu, W.; Wang, D.; Luo, S.; Yang, S.; Ding, X.; Shi, M. Comparative study of artificial light plant factories and greenhouse seedlings of SAOPOLO tomato. PLoS ONE 2025, 20, e0314808. [Google Scholar] [CrossRef] [PubMed]
  11. Yu, W.; Huang, Y.; Ji, F.; He, D.; Li, Z. A microfluidic biosensor for microbial quantitative monitoring of air and nutrient solution in the plant factory. Inf. Process. Agric. 2025, 12, 478–486. [Google Scholar] [CrossRef]
  12. Cai, W.; Bu, K.; Zha, L.; Zhang, J.; Lai, D.; Bao, H. Energy consumption of plant factory with artificial light: Challenges and opportunities. Renew. Sustain. Energy Rev. 2025, 210, 115235. [Google Scholar] [CrossRef]
  13. Wang, Y.; Deng, H.; Ma, L.; Yan, L.; Mu, Z.; Mu, Y.; Gu, S. Effect of light quality on the growth and mechanical property of tomato grafted seedlings. Chiang Mai J. Sci. 2024, 51, 023. [Google Scholar] [CrossRef]
  14. Shomali, A.; De Diego, N.; Zhou, R.; Abdelhakim, L.; Vrobel, O.; Tarkowski, P.; Aliniaeifard, S.; Kamrani, Y.Y.; Ji, Y.; Ottosen, C. The crosstalk of far-red energy and signaling defines the regulation of photosynthesis, growth, and flowering in tomatoes. Plant Physiol. Biochem. 2024, 208, 108458. [Google Scholar] [CrossRef]
  15. Kim, C.; Kubota, C. Contribution of Far-red Photons to light compensation point of leaf photosynthesis in tomato. HortTechnology 2025, 35, 186–190. [Google Scholar] [CrossRef]
  16. Kong, Y.; Kamath, D.; Zheng, Y. Blue versus red light can promote elongation growth independent of photoperiod: A study in four brassica microgreens species. HortScience 2019, 54, 1955–1961. [Google Scholar] [CrossRef]
  17. Uyehara, I.K.; Bechinger, T.; Jordan, A.; van Kleunen, M. Neighbour-detection causes shifts in allocation across multiple organs to prepare plants for light competition. Funct. Ecol. 2024, 38, 1848–1858. [Google Scholar] [CrossRef]
  18. Kon, S.; Toyofuku, K.; Muto, D.; Kimura, S.; Ogawa, A. Irradiating roots of komatsuna (Brassica napus) with various light qualities affects growth and nutrient content in leaves, stems, and roots. Sci. Hortic. 2024, 331, 113179. [Google Scholar] [CrossRef]
  19. Jia, Q.; Yin, Y.; Gai, S.; Tian, L.; Zhu, Z.; Qin, L.; Wang, Y. Onion cryptochrome 1 (AcCRY1) regulates photomorphogenesis and photoperiod flowering in Arabidopsis and exploration of its functional mechanisms under blue light. Plant Physiol. Biochem. 2024, 206, 108300. [Google Scholar] [CrossRef]
  20. Heuvelink, E.; Acevedo-Siaca, L.G.; Van de Poel, B.; der Jeucht, L.V.; Chabrand, S.; Steppe, K.; Ji, Y.; Körner, O.; Kusuma, P.; Langer, S.; et al. Tomato in the spotlight: Light regulation of whole-plant physiology in tomato. J. Exp. Bot. 2025, 76, eraf315. [Google Scholar] [CrossRef] [PubMed]
  21. Wang, Y.; Deng, H.; Li, H.; Ma, L.; He, T.; Yao, Z.; Mu, Z.; Gu, S.; Mu, Y. Growing tomato seedlings suitable for mechanical grafting under regulated light regime. Agronomy 2024, 14, 2322. [Google Scholar] [CrossRef]
  22. Lee, J.H.; Kim, E.A.; Sunwoo, Y.; Cha, E.B.; Joo, S.; Lee, S.; Lee, J.G.; Nam, S.Y. Light Spectrum Strategies to Optimize Yield and Physiological Performance of Korean Thistle (Cirsium setidens (Dunn) Nakai) in a Closed-type Plant Production System. J. People Plants Environ. 2025, 28, 799–823. [Google Scholar] [CrossRef]
  23. Nasiri, Z.; Ghasemi, K.; Bahmanyar, M.A.; Agehara, S. Effects of different LED light spectra and nutrient solution strength on the growth, photosynthetic parameters, and nutrients uptake in tomato seedlings. J. Plant Nutr. 2025, 48, 864–875. [Google Scholar] [CrossRef]
  24. del Carmen Moreno-Perez, E.; Sanchez-Del Castillo, F.; Portillo-Marquez, L.; Jose, V.R. Effects of supplementary light applied in tomato seedlings. Rev. Fitotec. Mex. 2022, 45, 349–357. [Google Scholar] [CrossRef]
  25. Bradford, M.M. A rapid and sensitive method for the quantitation of microgram quantities of protein utilizing the principle of protein-dye binding. Anal. Biochem. 1976, 72, 248–258. [Google Scholar] [CrossRef] [PubMed]
  26. Yemm, E.W.; Willis, A.J. The estimation of carbohydrates in plant extracts by anthrone. Biochem. J. 1954, 57, 508–514. [Google Scholar] [CrossRef]
  27. Morris, D.L. Quantitative determination of carbohydrates with Dreywood’s anthrone reagent. Science 1948, 107, 254–255. [Google Scholar] [CrossRef] [PubMed]
  28. Lichtenthaler, H.K.; Wellburn, A.R. Determinations of total carotenoids and chlorophylls a and b of leaf extracts in different solvents. Biochem. Soc. Trans. 1983, 11, 591–592. [Google Scholar] [CrossRef]
  29. Yang, X.; Xu, H.; Shao, L.; Li, T.; Wang, Y.; Wang, R. Response of photosynthetic capacity of tomato leaves to different LED light wavelength. Environ. Exp. Bot. 2018, 150, 161–171. [Google Scholar] [CrossRef]
  30. Izzo, L.G.; Mele, B.H.; Vitale, L.; Vitale, E.; Arena, C. The role of red and blue light in tomato early photomorphogenesis and photosynthetic traits. Environ. Exp. Bot. 2020, 179, 104195. [Google Scholar] [CrossRef]
  31. Gu, D.; Wang, Y.; Zhao, M.; Chen, H.; Wu, S.; Jin, X.; Deng, L.; Ji, R.; Xu, J.; Zheng, F.; et al. Phytochrome B stabilizes the KNOX transcription factor BP/KNAT1 to promote light-initiated seed germination in Arabidopsis thaliana. Plant Commun. 2025, 6, 101517. [Google Scholar] [CrossRef]
  32. Jin, D.; Su, X.F.; Li, Y.F.; Shi, M.; Yang, B.; Wan, W.; Wen, X.; Yang, S.; Ding, X.; Zou, J. Effect of red and blue light on cucumber seedlings grown in a plant factory. Horticulturae 2023, 9, 124. [Google Scholar] [CrossRef]
  33. Jung, J.-H.; Domijan, M.; Klose, C.; Biswas, S.; Ezer, D.; Gao, M.; Khattak, A.; Box, M.; Charoensawan, V.; Cortijo, S. Phytochromes function as thermosensors in Arabidopsis. Science 2016, 354, 886–889. [Google Scholar] [CrossRef]
  34. Halimeh, H. Red light induced seed germination and seedling growth by modulating antioxidant defense system, Rubisco, and NADPH oxidase activities in Capsicum frutescens. BMC Plant Biol. 2025, 25, 519. [Google Scholar] [CrossRef]
  35. Wies, G.; Mantese, A.I.; Casal, J.J.; Maddonni, G.Á. Phytochrome B enhances plant growth, biomass and grain yield in field-grown maize. Ann. Bot. 2019, 123, 1079–1088. [Google Scholar] [CrossRef]
  36. Yin, C.; Shi, Z.; Tian, C.; Chen, C.; Li, D.; Dong, W.; Zhang, Y. Effects of red and blue light on photosynthetic carbon assimilation and growth-development in plants: A review. J. Appl. Ecol. 2025, 36, 2246–2256. [Google Scholar] [CrossRef]
  37. Johnson, M.P. Author Correction: Structure, regulation and assembly of the photosynthetic electron transport chain. Nat. Rev. Mol. Cell Biol. 2025, 26, 725. [Google Scholar] [CrossRef] [PubMed]
  38. Miao, Y.; Wang, X.; Gao, L.; Chenq, Q.; Qu, M. Blue light is more essential than red light for maintaining the activities of photosystem II and I and photosynthetic electron transport capacity in cucumber leaves. J. Integr. Agric. 2016, 15, 87–100. [Google Scholar] [CrossRef]
  39. Martirosyan, Y.T.; Dilovarova, T.A.; Martirosyan, V.V.; Kreslavskii, V.D.; Kosobryukhov, A.A. Photosynthetic apparatus of potato plants (Solanum tuberosum L.) grown in vitro as influenced by different spectral composition of led radiation. Sel’skokhozyaistv. Biol. 2016, 51, 680–687. [Google Scholar] [CrossRef]
  40. Hogewoning, S.W.; Trouwborst, G.; Maljaars, H.; Poorter, H.; van Ieperen, W.; Harbinson, J. Blue light dose-responses of leaf photosynthesis, morphology, and chemical composition of Cucumis sativus grown under different combinations of red and blue light. J. Exp. Bot. 2010, 61, 3107–3117. [Google Scholar] [CrossRef] [PubMed]
  41. Ren, M.F.; Liu, S.Z.; Tang, C.Z.; Mao, G.; Gai, P.; Guo, X.; Zheng, H.; Tang, Q. Photomorphogenesis and photosynthetic traits changes in rice seedlings responding to red and blue light. Int. J. Mol. Sci. 2023, 24, 11333. [Google Scholar] [CrossRef]
  42. Wang, Y.H.; Folta, K.M. Contributions of green light to plant growth and development. Am. J. Bot. 2013, 100, 70–78. [Google Scholar] [CrossRef] [PubMed]
  43. Ma, D.; Li, X.; Guo, Y.; Chu, J.; Fang, S.; Yan, C.; Noel, J.; Liu, H. Cryptochrome 1 interacts with PIF4 to regulate high temperature-mediated hypocotyl elongation in response to blue light. Proc. Natl. Acad. Sci. USA 2016, 113, 224–229. [Google Scholar] [CrossRef]
  44. Liang, Y.; Kang, C.Q.; Kaiser, E.; Kuang, Y.; Yang, Q.; Li, T. Red/blue light ratios induce morphology and physiology alterations differently in cucumber and tomato. Sci. Hortic. 2021, 281, 109995. [Google Scholar] [CrossRef]
  45. Bennett, T. The evolution of hormonal signalling in plant development. Semin. Cell Dev. Biol. 2021, 109, 1–2. [Google Scholar] [CrossRef]
  46. Duhan, L.; Manoharlal, R.; Kumar, D.; Kumari, D.; Saini, M.; Saiprasad, G.V.S.; Chhillar, A.K.; Pasrija, R. Phytohormones mediated antifungal resistance against Fusarium oxysporum. Acta Physiol. Plant. 2024, 46, 10. [Google Scholar] [CrossRef]
  47. Wu, P.; Yang, Z.F.; Kong, Q.S.; Cui, H.; Liu, Y.; Dong, R.; Zheng, C.; Liu, H.; Cui, J. Phytohormone response to exogenous nitric oxide in cucumber under low-temperature stress. Plants 2025, 14, 3275. [Google Scholar] [CrossRef]
  48. Gai, S.; Su, L.; Tang, C.; Xia, M.; Zhou, Z. The antagonistic effects of red and blue light radiation on leaf and stem development of pepper (Capsicum annuum L.) seedlings. Plant Sci. 2025, 351, 112338. [Google Scholar] [CrossRef] [PubMed]
  49. Xie, Y.; Liu, Y.; Wang, H.; Ma, X.; Wang, B.; Wu, G.; Wang, H. Phytochrome-interacting factors directly suppress MIR156 expression to enhance shade-avoidance syndrome in Arabidopsis. Nat. Commun. 2017, 8, 348. [Google Scholar] [CrossRef] [PubMed]
  50. Takeda, S.; Watanabe, S.; Miura, N.; Shiota, H. Effect of light regime on seedling development of eelgrass (Zostera marina L.). Aquat. Bot. 2025, 200, 103898. [Google Scholar] [CrossRef]
  51. Patitaki, E.; Schivre, G.; Zioutopoulou, A.; Perrella, G.; Bourbousse, C.; Barneche, F.; Kaiserli, E. Light, chromatin, action: Nuclear events regulating light signaling in Arabidopsis. New Phytol. 2022, 236, 333–349. [Google Scholar] [CrossRef]
  52. Feng, S.H.; Martinez, C.; Gusmaroli, G.; Wang, Y.; Zhou, J.; Wang, F.; Chen, F.; Yu, L.; Iglesias-Pedraz, J.M.; Kircher, S.; et al. Coordinated regulation of Arabidopsis thaliana development by light and gibberellins. Nature 2008, 451, 475–479. [Google Scholar] [CrossRef]
  53. De Lucas, M.; Davière, J.-M.; Rodríguez-Falcón, M.; Pontin, M.; Iglesias-Pedraz, J.M.; Lorrain, S.; Fankhauser, C.; Blázquez, A.M.; Titarenko, E.; Prat, S. A molecular framework for light and gibberellin control of cell elongation. Nature 2008, 451, 480–484. [Google Scholar] [CrossRef] [PubMed]
  54. Zhou, J.Y.; Hua, Z.Q.; Zhang, Y.J.; Li, Z.; Xu, S.; Tian, X.; Dong, H.; Li, Z. Light-hormone crosstalk modulates vegetative branching and yield stability in dual-planting cotton systems. Field Crops Res. 2025, 333, 110103. [Google Scholar] [CrossRef]
  55. de Wit, M.; Keuskamp, D.H.; Bongers, F.J.; Hornitschek, P.; Gommers, C.M.M.; Reinen, E.; Martínez-Cerón, C.; Fankhause, C.; Pierik, R. Integration of phytochrome and cryptochrome signals determines plant growth during competition for light. Curr. Biol. 2016, 26, 3320–3326. [Google Scholar] [CrossRef]
  56. Zaghdoud, C.; Ollio, I.; Solano, C.J.; Ochoa, J.; Suardiaz, Z.; Fernández, J.A.; Del, M.; Ballesta, C.M. Red LED light improves pepper (Capsicum annuum L.) seed radicle emergence and growth through the modulation of aquaporins, hormone homeostasis, and metabolite remobilization. Int. J. Mol. Sci. 2023, 24, 4779. [Google Scholar] [CrossRef] [PubMed]
  57. Lafuente, M.T.; Sampedro, R.; Romero, P. Hormones metabolism as affected by LED blue light in citrus fruit. Plant Physiol. Biochem. 2024, 215, 108970. [Google Scholar] [CrossRef]
  58. Li, Y.; Wang, J.; Fan, K.; Guo, L.; Hou, L.; Miao, Y.; Sun, M.; Li, Y.; Bai, L. Alginate oligosaccharide coordinately modulates endogenous phytohormone profiles to enhance tomato growth. Horticulturae 2025, 11, 580. [Google Scholar] [CrossRef]
  59. Wang, X.; Lin, C. The two action mechanisms of plant cryptochromes. Trends Plant Sci. 2025, 30, 775–791. [Google Scholar] [CrossRef]
  60. Li, G.; Li, W.; Liang, Y.; Liang, Y.; Lu, W.; Lu, D. Spraying exogenous hormones alleviate impact of weak-light on yield by improving leaf carbon and nitrogen metabolism in fresh waxy maize. Front. Plant Sci. 2023, 14, 1220827. [Google Scholar] [CrossRef]
  61. Du, X.; Zhang, X.; Kong, L.; Min, X. Split application under reduced nitrogen rate favors high yield by altering endogenous hormones and C/N ratio in sweet potato. Agronomy 2020, 10, 1243. [Google Scholar] [CrossRef]
  62. Zhao, Z.; Wang, C.; Yu, X.; Tian, Y.; Wang, W.; Zhang, Y.; Bai, W.; Yang, N.; Zhang, T.; Zheng, H.; et al. Auxin regulates source-sink carbohydrate partitioning and reproductive organ development in rice. Proc. Natl. Acad. Sci. USA 2022, 119, e2121671119. [Google Scholar] [CrossRef]
  63. Sun, L.; Di, D.-W.; Li, G.; Kronzucker, H.J.; Wu, X.; Shi, W. Endogenous ABA alleviates rice ammonium toxicity by reducing ROS and free ammonium via regulation of the SAPK9–bZIP20 pathway. J. Exp. Bot. 2020, 71, 4562–4577. [Google Scholar] [CrossRef] [PubMed]
  64. Szechyńska-Hebda, M.; Kruk, J.; Górecka, M.; Karpińska, B.; Karpiński, S. Evidence for light wavelength-specific photoelectrophysiological signaling and memory of excess light episodes in Arabidopsis. Plant Cell 2010, 22, 2201–2218. [Google Scholar] [CrossRef]
  65. Hilker, M.; Schmülling, T. Stress priming, memory, and signalling in plants. Plant Cell Environ. 2019, 42, 753–761. [Google Scholar] [CrossRef] [PubMed]
  66. Gallusci, P.; Agius, D.R.; Moschou, P.N.; Dobránszki, J.; Kaiserli, E.; Martinelli, F. Deep inside the epigenetic memories of stressed plants. Trends Plant Sci. 2023, 28, 142–153. [Google Scholar] [CrossRef] [PubMed]
  67. Galviz, Y.C.; Bortolin, G.S.; Souza, G.M. Trade-off between water deficit memory and growth under limiting conditions in rice. Plant Physiol. Biochem. 2025, 226, 110048. [Google Scholar] [CrossRef]
  68. Zeng, S.Y.; Qin, Z.R. The FKF1-ELF3-PRC2 module regulates flowering time in response to light in temperate grasses. Proc. Natl. Acad. Sci. USA 2025, 122, e2508103122. [Google Scholar] [CrossRef]
  69. Gorecka, M.; Lewandowska, M.; Dabrowska-Bronk, J. Photosystem II 22kDa protein level—A prerequisite for excess light-inducible memory, cross-tolerance to UV-C and regulation of electrical signalling. Plant Cell Environ. 2020, 43, 649–661. [Google Scholar] [CrossRef]
  70. Yan, Y.; Zhu, J.P.; Qi, Q.; Li, J.; Cao, X.; Deng, X. The Arabidopsis demethylase REF6 physically interacts with phyB to promote hypocotyl elongation under red light. Proc. Natl. Acad. Sci. USA 2025, 122, e2417253122. [Google Scholar] [CrossRef]
  71. Karpiński, S.; Szechyńska-Hebda, M. Cellular light memory, photo-electrochemical and redox retrograde signaling in plants. BioTechnologia 2012, 93, 27–39. [Google Scholar] [CrossRef]
Figure 1. 3D Spectral Power Distribution Map Inside the Plant Factory.
Horticulturae 12 00340 g001
Figure 2. Growth Tracking of Tomato Scion (left) and Rootstock (right) under different light quality.
Horticulturae 12 00340 g002
Figure 3. Morphological indices of scion and rootstock under different light quality. (I) Scion plant height growth curve; (II) Scion stem diameter growth curve; (III) Scion shoot dry weight growth curve; (IV) Final plant height and stem diameter of scion; (V) Final leaf area and canopy width of scion. (VI) Final shoot dry weight and moisture content of scion; (VII) Rootstock stem diameter curve; (VIII) Rootstock root area growth curve; (IX) Rootstock hypocotyl growth curve; (X) Final hypocotyl length and stem diameter of rootstock; (XI) Final root dry weight and root area of rootstock; (XII) Root moisture content of rootstock. The lowercase letters in the figures indicate there were significance between the light quality treatments.
Horticulturae 12 00340 g003
Figure 4. Photosynthetic characteristics of tomato seedlings under different light quality. (I,II) Photosynthetic and chlorophyll fluorescence parameters of scion; (III) Photosynthetic pigments of the scion; (IV,V) Photosynthetic and chlorophyll fluorescence parameters of rootstock; (VI) Photosynthetic pigments of the rootstock. The lowercase letters in the figures indicate there were significance between the light quality treatments.
Horticulturae 12 00340 g004
Figure 5. Carbon and nitrogen allocation of the scion (left) and the rootstock (right) under different light quality. The lowercase letters in the figures indicate there were significance between the light quality treatments.
Horticulturae 12 00340 g005
Figure 6. Hormone concentration in the scion (left) and the rootstock (right) under different light quality. (Note: hormone concentrations are expressed in nmol·g−1.) The lowercase letters in the figures indicate there were significance between the light quality treatments.
Horticulturae 12 00340 g006
Figure 7. Principal Component Analysis (PCA) and Correlation Heatmap of Morphological and Physiological Traits in Tomato Scions and rootstocks Under Different Light Quality Treatments. (I) Principal Component Analysis (PCA) of Morphological and Physiological Traits in Tomato Scions; (II) Principal Component Analysis (PCA) of Morphological and Physiological Traits in Tomato Rootstocks; (III) Correlation Heatmap of Morphological and Physiological Traits in Tomato Scions; (IV) Correlation Heatmap of Morphological and Physiological Traits in Tomato Rootstocks.
Horticulturae 12 00340 g007
Figure 8. The morphogenesis and biomass accumulation of grafted seedlings under different light quality pretreatments. (I) Dynamic changes in plant height; (II) Dynamic changes in stem diameter; (III) Morphological development at the first flowering stage; (IV) Biomass accumulation at the first flowering stage. The lowercase letters in the figures indicate there were significance between the light quality treatments.
Horticulturae 12 00340 g008
Figure 9. Relative growth rates of plant height, stem diameter and root system of grafted seedlings under different light quality pretreatments. The lowercase letters in the figures indicate there were significance between the light quality treatments.
Horticulturae 12 00340 g009
Figure 10. The effects of different light quality pretreatments on photosynthetic parameters (left) and carbon and nitrogen allocation (right) in grafted seedlings. The lowercase letters in the figures indicate there were significance between the light quality treatments.
Horticulturae 12 00340 g010
Table 1. Comprehensive Evaluation of Scoin Adaptability to Mechanized Operations.
Light QualityStem DiameterPlant HeightResistance to CompressionShoot Dry WeightCanopy SpreadComprehensive Score
W1.1866−0.00440.04220.6012−0.59481.23 ± 0.66 ab
R0.2236−2.0287−1.65550.57321.3926−1.49 ± 0.24 de
R7B10.8350−0.6899−0.04111.2546−0.70360.66 ± 0.43 b
R3B10.2236−0.21261.22171.2061−0.37532.22 ± 0.64 a
R1B1−1.30510.88920.1018−1.3236−0.1176−1.76 ± 0.21 e
R1B3−1.15221.0161−0.3350−0.99770.5785−0.89 ± 0.44 cde
R1B70.07070.88020.6081−0.7572−0.46980.33 ± 0.53 bc
B−0.08220.15020.0578−0.55670.2900−0.14 ± 0.25 bcd
The lowercase letters in the table indicate there were significance between the light quality treatments.
Table 2. Comprehensive Evaluation of Rootstock Adaptability to Mechanized Operations.
Light QualityStem DiameterHypocotyl LengthRoot Dry WeightRoot AreaResistance to CompressionComprehensive Score
W0.58560.0879−0.4817−0.5642−0.6205−0.99 ± 0.3 c
R−0.93492.1298−2.1873−1.9832−1.6326−4.61 ± 0.39 d
R7B10.72380.2230−0.1552−0.50790.37690.66 ± 0.29 b
R3B10.2674−0.50371.17051.02360.66912.57 ± 0.28 a
R1B1−0.8445−0.83400.55690.90981.29141.08 ± 0.63 b
R1B3−0.9828−0.77690.41620.4944−0.2121−1.06 ± 0.18 c
R1B70.5211−0.7672−0.12140.1430−0.3208−0.55 ± 0.37 c
B0.72380.49630.80180.48450.44852.9 ± 0.42 a
The lowercase letters in the table indicate there were significance between the light quality treatments.
Table 3. The Light Saturation Point (LSP), Light Compensation Point (LCP), Maximum Net Photosynthetic Rate (Pnmax) and Spertral response curve Fit Parameters of Grafting seedings in different treatments.
WRR7B1R3B1R1B1R1B3R1B7B
LCP
(μmol m−2 s−1)
92.3271.9936.7761.5482.1658.2971.1166.95
LSP
(μmol m−2 s−1)
841.141136.051792.921825.81708.38993.111954.681124.98
Pnmax
(μmol m−2 s−1)
22.1624.3723.1137.132.3222.8139.3224.41
y022.1624.3723.1137.1032.3222.8139.3224.41
A1−28.53−28.19−24.23−40.09−36.11−26.11−42.75−28.00
t1365.30493.38778.65792.94741.94431.30848.91488.57
Disclaimer/Publisher’s Note: The statements, opinions and data contained in all publications are solely those of the individual author(s) and contributor(s) and not of MDPI and/or the editor(s). MDPI and/or the editor(s) disclaim responsibility for any injury to people or property resulting from any ideas, methods, instructions or products referred to in the content.