Article

Changes in Cr and Cd Concentrations in Certain Crops Based on Species and Organ, and Their Translocation Within Plants


1
Department of Environmental Engineering, Kastamonu University, 37150 Kastamonu, Türkiye
2
Department of Forest Engineering, Düzce University, 81620 Düzce, Türkiye
3
Department of Environmental Engineering, Bartin University, 74100 Bartın, Türkiye
4
Department of Transportation Services, Vocational School of Technical Sciences, Bitlis Eren University, 13100 Bitlis, Türkiye
5
Arac Rafet Vergili Vocational School, Kastamonu University, 37800 Kastamonu, Türkiye
6
Department of Forest Industry Engineering, Bartın University, 74100 Bartın, Türkiye
7
Department of Forest Engineering, Kastamonu University, 37150 Kastamonu, Türkiye
8
Department of Forest Engineering, Bartın University, 74100 Bartın, Türkiye
*
Author to whom correspondence should be addressed.
Horticulturae 2026, 12(4), 400; https://doi.org/10.3390/horticulturae12040400
Submission received: 24 February 2026 / Revised: 21 March 2026 / Accepted: 23 March 2026 / Published: 24 March 2026
(This article belongs to the Section Biotic and Abiotic Stress)

Abstract

In this study, the variation in chromium (Cr) and cadmium (Cd) concentrations in peppers, tomatoes, corn, eggplants, and cucumbers grown adjacent to the industrial area in Düzce, one of Europe’s most polluted cities and known for its high levels of potential toxic element (PTE) pollution, was determined based on species and organ. In addition, the concentrations of these elements in the soil were determined, and the translocation factor (TF) and bioconcentration factor (BCF) in the plant organs were calculated. The study found that Cr pollution, in particular, was well above threshold values in the region and accumulated to high concentrations in all plant organs, including fruits. The study found that soil Cr concentrations were well above the limit values set by international organizations. Cd concentrations in fruits ranged from 0.22 mg/kg to 0.33 mg/kg. Based on these results, Cd concentrations in all species exceed the limit values set by international standards by more than twice. The Cr concentration determined in fruits in the study ranged from 178.47 mg/kg to 579.80 mg/kg. According to these values, the Cr concentration determined in fruits is hundreds of times higher than the limit value in all species. TF values were high for Cd in tomato fruits and Cr in pepper and cucumber fruits. In contrast, TF values for both Cd and Cr were very low in corn fruits. Based on these results, cultivating crops such as tomatoes, cucumbers, and peppers should be avoided in the region, and corn should be emphasized. Thus, the rate of Cr and Cd entering the human body through the food chain can be reduced.

1. Introduction

In parallel with developments in industry and technology over the last century, energy and raw material consumption have increased significantly. Various wastes generated during these processes have exacerbated pollution worldwide [1,2,3,4]. The WHO (World Health Organization) states that nearly 99% of the global population is exposed to air pollution [5,6]. Pollution affects living organisms and humans in different ways. It is stated that 9–12 million people worldwide die each year due to the inhalation of air pollutants, and that approximately 12.5% of global deaths are related to air pollution [7,8].
Airborne pollutants settle to the ground due to gravity, mix with soil and water, and enter living organisms through various pathways. Various pollutants in plants accumulate in animals and humans when these plants are consumed as food [9,10,11]. Thus, various extremely dangerous pollutants, such as pesticides, nanoparticles, and potential toxic elements (PTEs), are absorbed into the human body through the food chain and threaten human health [12,13,14,15,16,17].
Among these pollutants, PTEs are at the forefront of those whose use has increased the most in recent years and are extremely dangerous to human health [18,19,20]. PTEs are released into the environment from anthropogenic sources such as mining, industry, vehicles, domestic fuel combustion, agricultural activities, and human activities in urban areas, and PTE concentrations in the air, water, soil, and plants are continually increasing [19,21]. These PTEs enter the human body by inhalation and seriously threaten human health [20,22]. In addition, PTEs also enter the human body through the consumption of plants cultivated in areas with elevated toxic element contamination, causing serious health problems and even death [23,24]. This is because some elements are toxic and harmful to humans even at low concentrations. Moreover, they are not easily excreted from the human body and tend to bioaccumulate. Elements are also not easily degraded or destroyed in nature; only their form changes [25]. Moreover, in recent years, the intermingling of urban, highways, industrial, and agricultural areas, which are sources of PTE pollution, has made the plants grown in these areas extremely harmful to humans [9].
However, studies show that PTE accumulation levels differ across plant organs [10]. Therefore, determining which crops and organs accumulate PTEs in crops grown in areas known to have high levels of element pollution can provide important information for protecting human health. This study also sought to determine the accumulation and translocation of cadmium (Cd) and chromium (Cr) elements, whose use and concentrations in the environment have been steadily increasing in recent years, in various organs of certain crops.
The elements used in the study are highly harmful to human health. They are therefore listed as priority pollutants by organizations such as the ATSDR (Agency for Toxic Substances and Disease Registry) and the EPA (Environmental Protection Agency) [26]. Exposure to Cd can cause fever, tremors, muscle pain, lung, kidney, and bone damage, cancer, chest pain, muscle weakness, vomiting, stomach irritation, and diarrhea. Exposure to Cr may cause nose, lung, and throat irritation, eye damage, lung cancer, skin ulcers, dermatitis, shortness of breath, asthma, and respiratory cancer [26]. When Cr oxidizes from trivalent (Cr+3) to hexavalent (Cr+6), it becomes a hazardous carcinogen. As a non-essential element for humans, Cd is categorized as a Group 1 human carcinogen by the International Agency for Research on Cancer [27].
There are several reasons for choosing pepper, tomato, maize, eggplant, and cucumber crops for this study. First, these species comprise approximately 28% of local field crop and vegetable production areas according to provincial agricultural statistics and represent the most commonly grown and consumed crops in the study region (https://duzce.tarimorman.gov.tr/Belgeler/PLANVERAPOR/Duzce_Faaliyet_Raporu-2024.pdf, accessed on 20 February 2026). Second, these crops have different edible parts (fruits and seeds) and growth habits, enabling assessment of PTE transport to be harvested organs. Third, previous studies have shown differences in PTE accumulation among these species, making them suitable models for investigating species-specific differences in Cr and Cd uptake and transport. Finally, these crops are important food sources globally, ensuring the findings are applicable beyond the local context.
In this study, the accumulation and translocation of Cr and Cd in plant organs were determined for some crops grown in Düzce, a region known for high levels of heavy metal pollution. The primary reason for evaluating Cr and Cd elements in this study was the report that these elements are found in high concentrations in the region and accumulate at high levels in plants [28,29]. The fact that these elements are among the most harmful to human health also influenced their selection. In addition, the fact that industrial establishments and traffic density in the region are significant sources of Cr and Cd also influenced the selection of these elements. In this study, the accumulation and translocation of these elements in the organs of pepper, tomato, corn, eggplant, and cucumber, which are among the most commonly consumed crops, were determined. Subsequently, calculations were made to determine the health risks they pose.

2. Materials and Method

Five crops [pepper (Capsicum annuum L. var. ‘Zıpkın F1’), tomato (Solanum lycopersicum L. var. ‘Marmande’), corn (Zea mays L. var. indentata Sturt.), eggplant (Solanum melongena L. var. ‘Kemer’), and cucumber (Cucumis sativus L. var. ‘Beith Alpha’)] were used in the study. The seeds were obtained from the Provincial Directorate of Agriculture. Seedlings grown from these seeds were planted in mid-May in an industrial area located in Düzce, Türkiye.
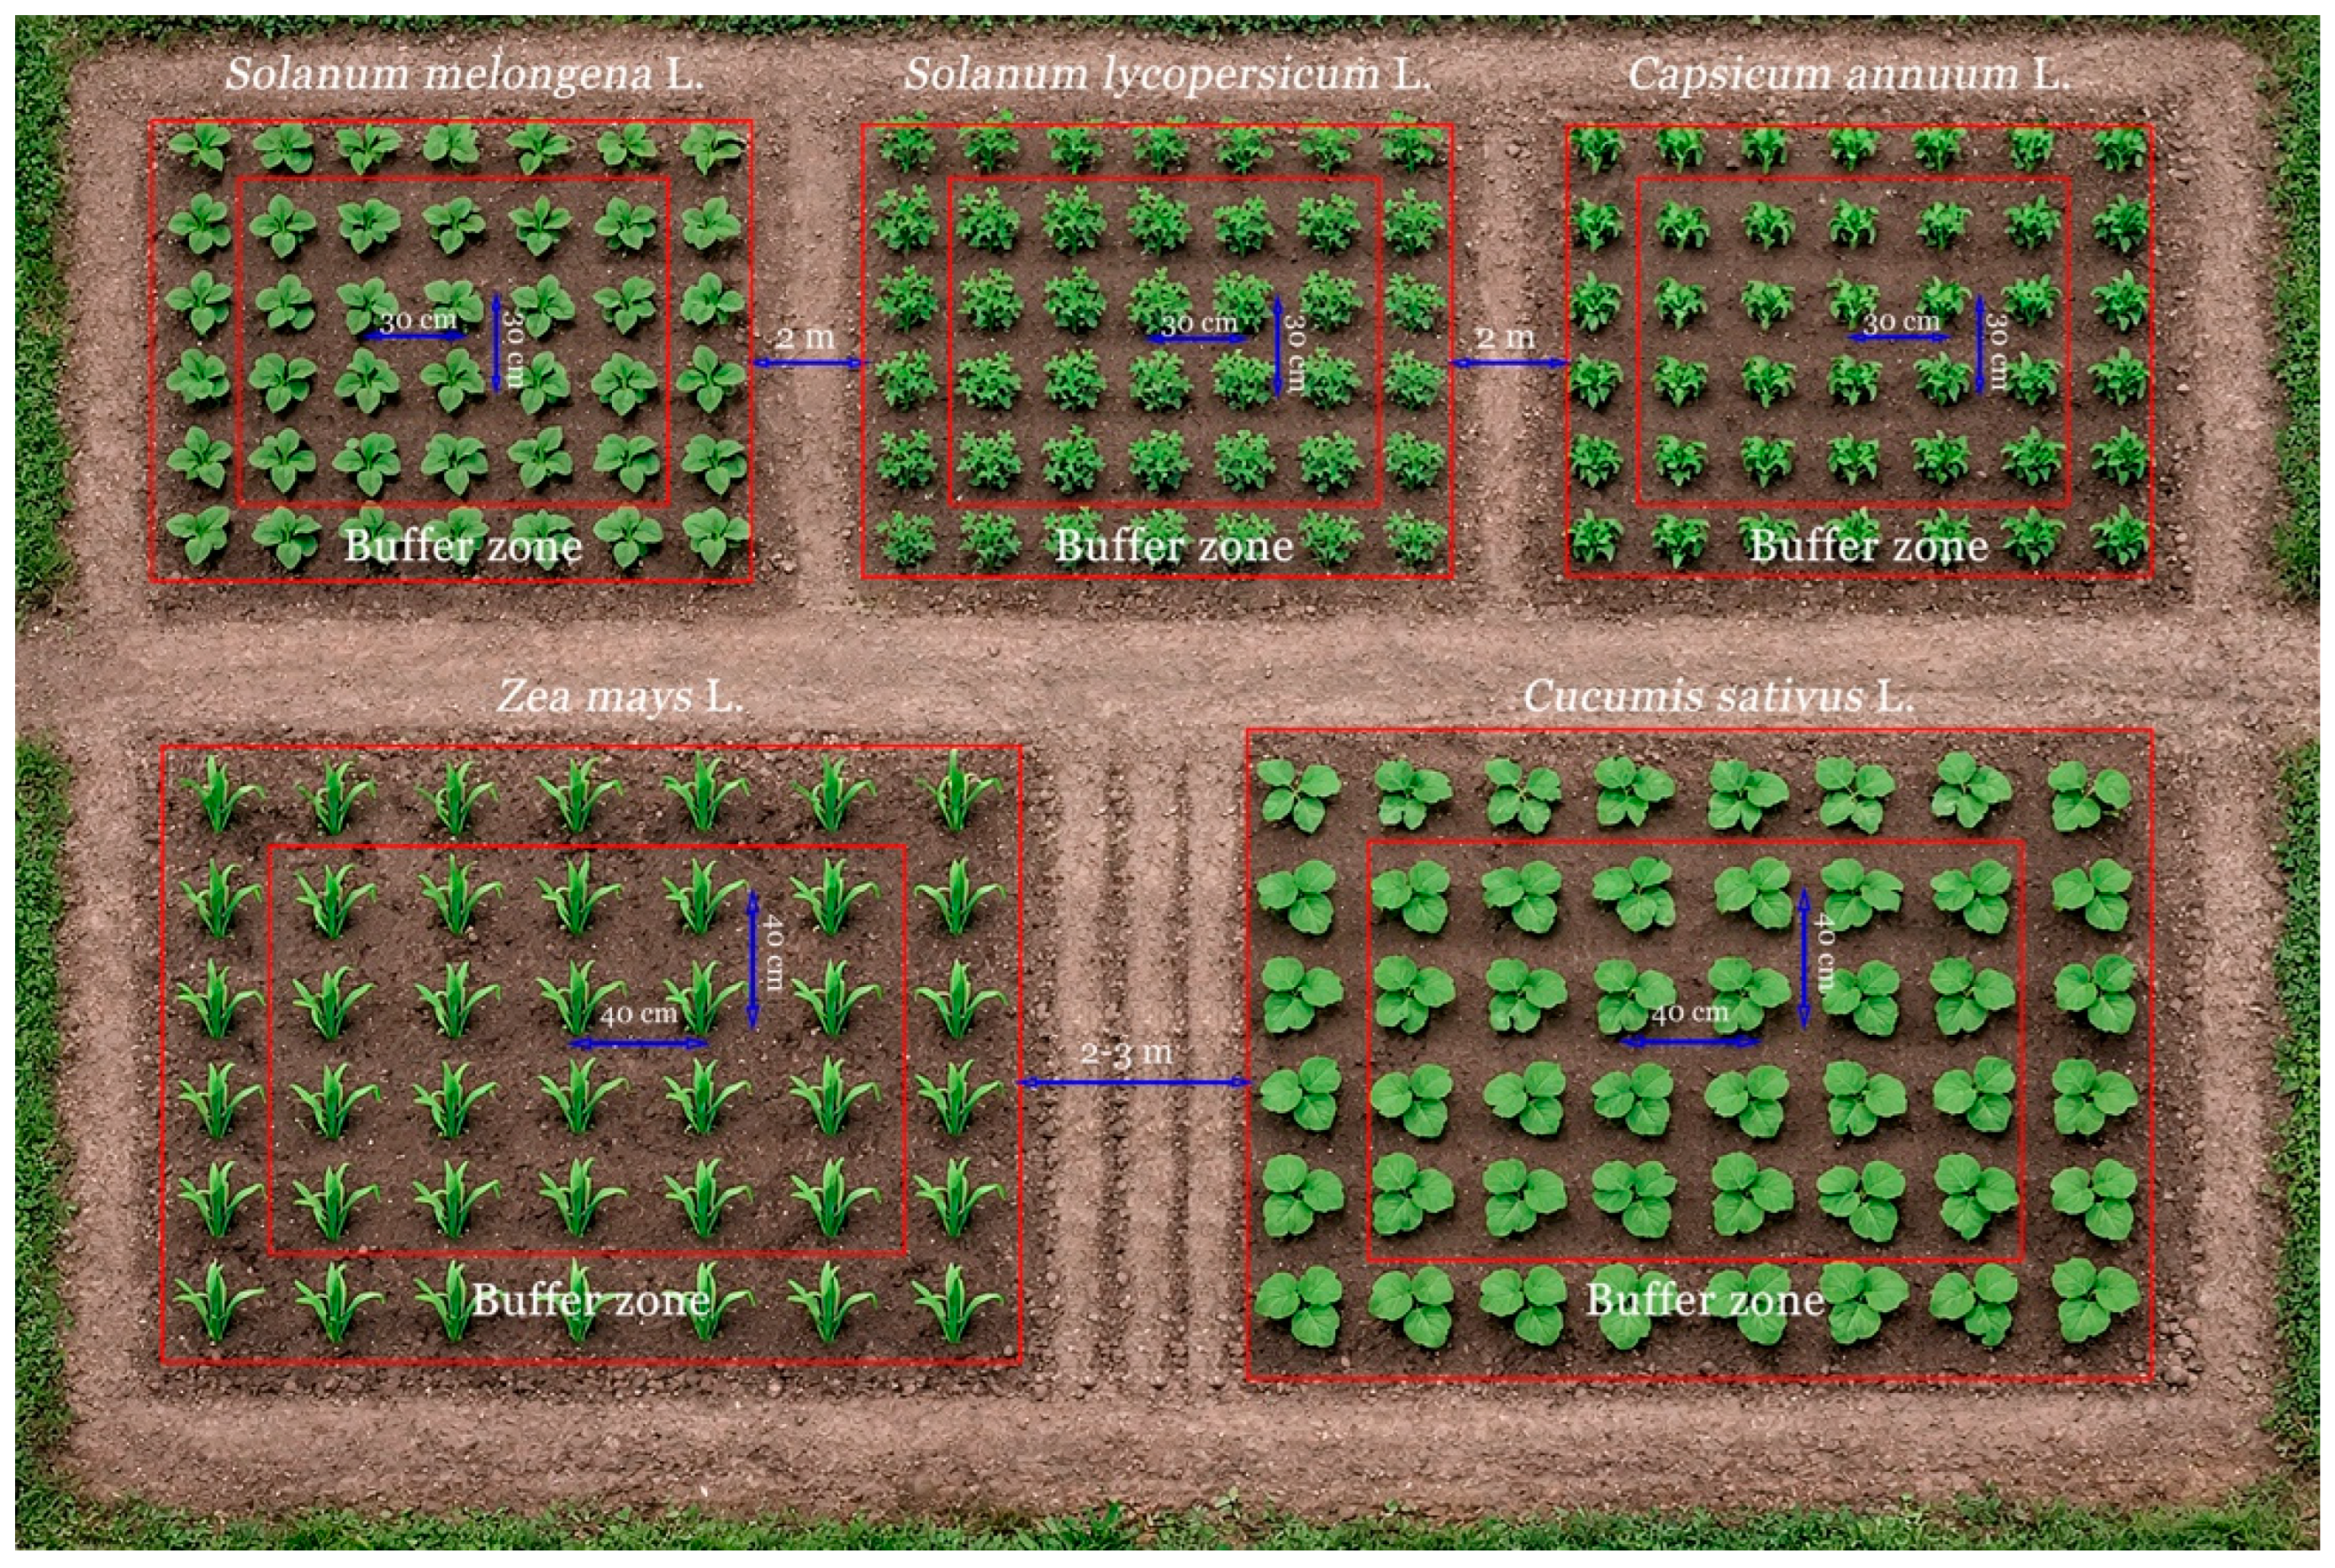
The crops were cultivated in experimental plots established on agricultural land within the industrial zone (Figure 1). In this region, industrial, residential, highway, and agricultural areas are intertwined and adjacent to one another. Previous studies have shown that agricultural areas in the region are predominantly contaminated with toxic elements. Nevertheless, the production of various agricultural products consumed for food purposes continues across vast areas. The field used in this study remains under agricultural production, despite the experimental design being a controlled setup. The central coordinates of the study area are 40°51′00″ N and 31°06′40″ E, with an approximate elevation of 135 m. The soil texture of the experimental plots was classified as clay-loam.
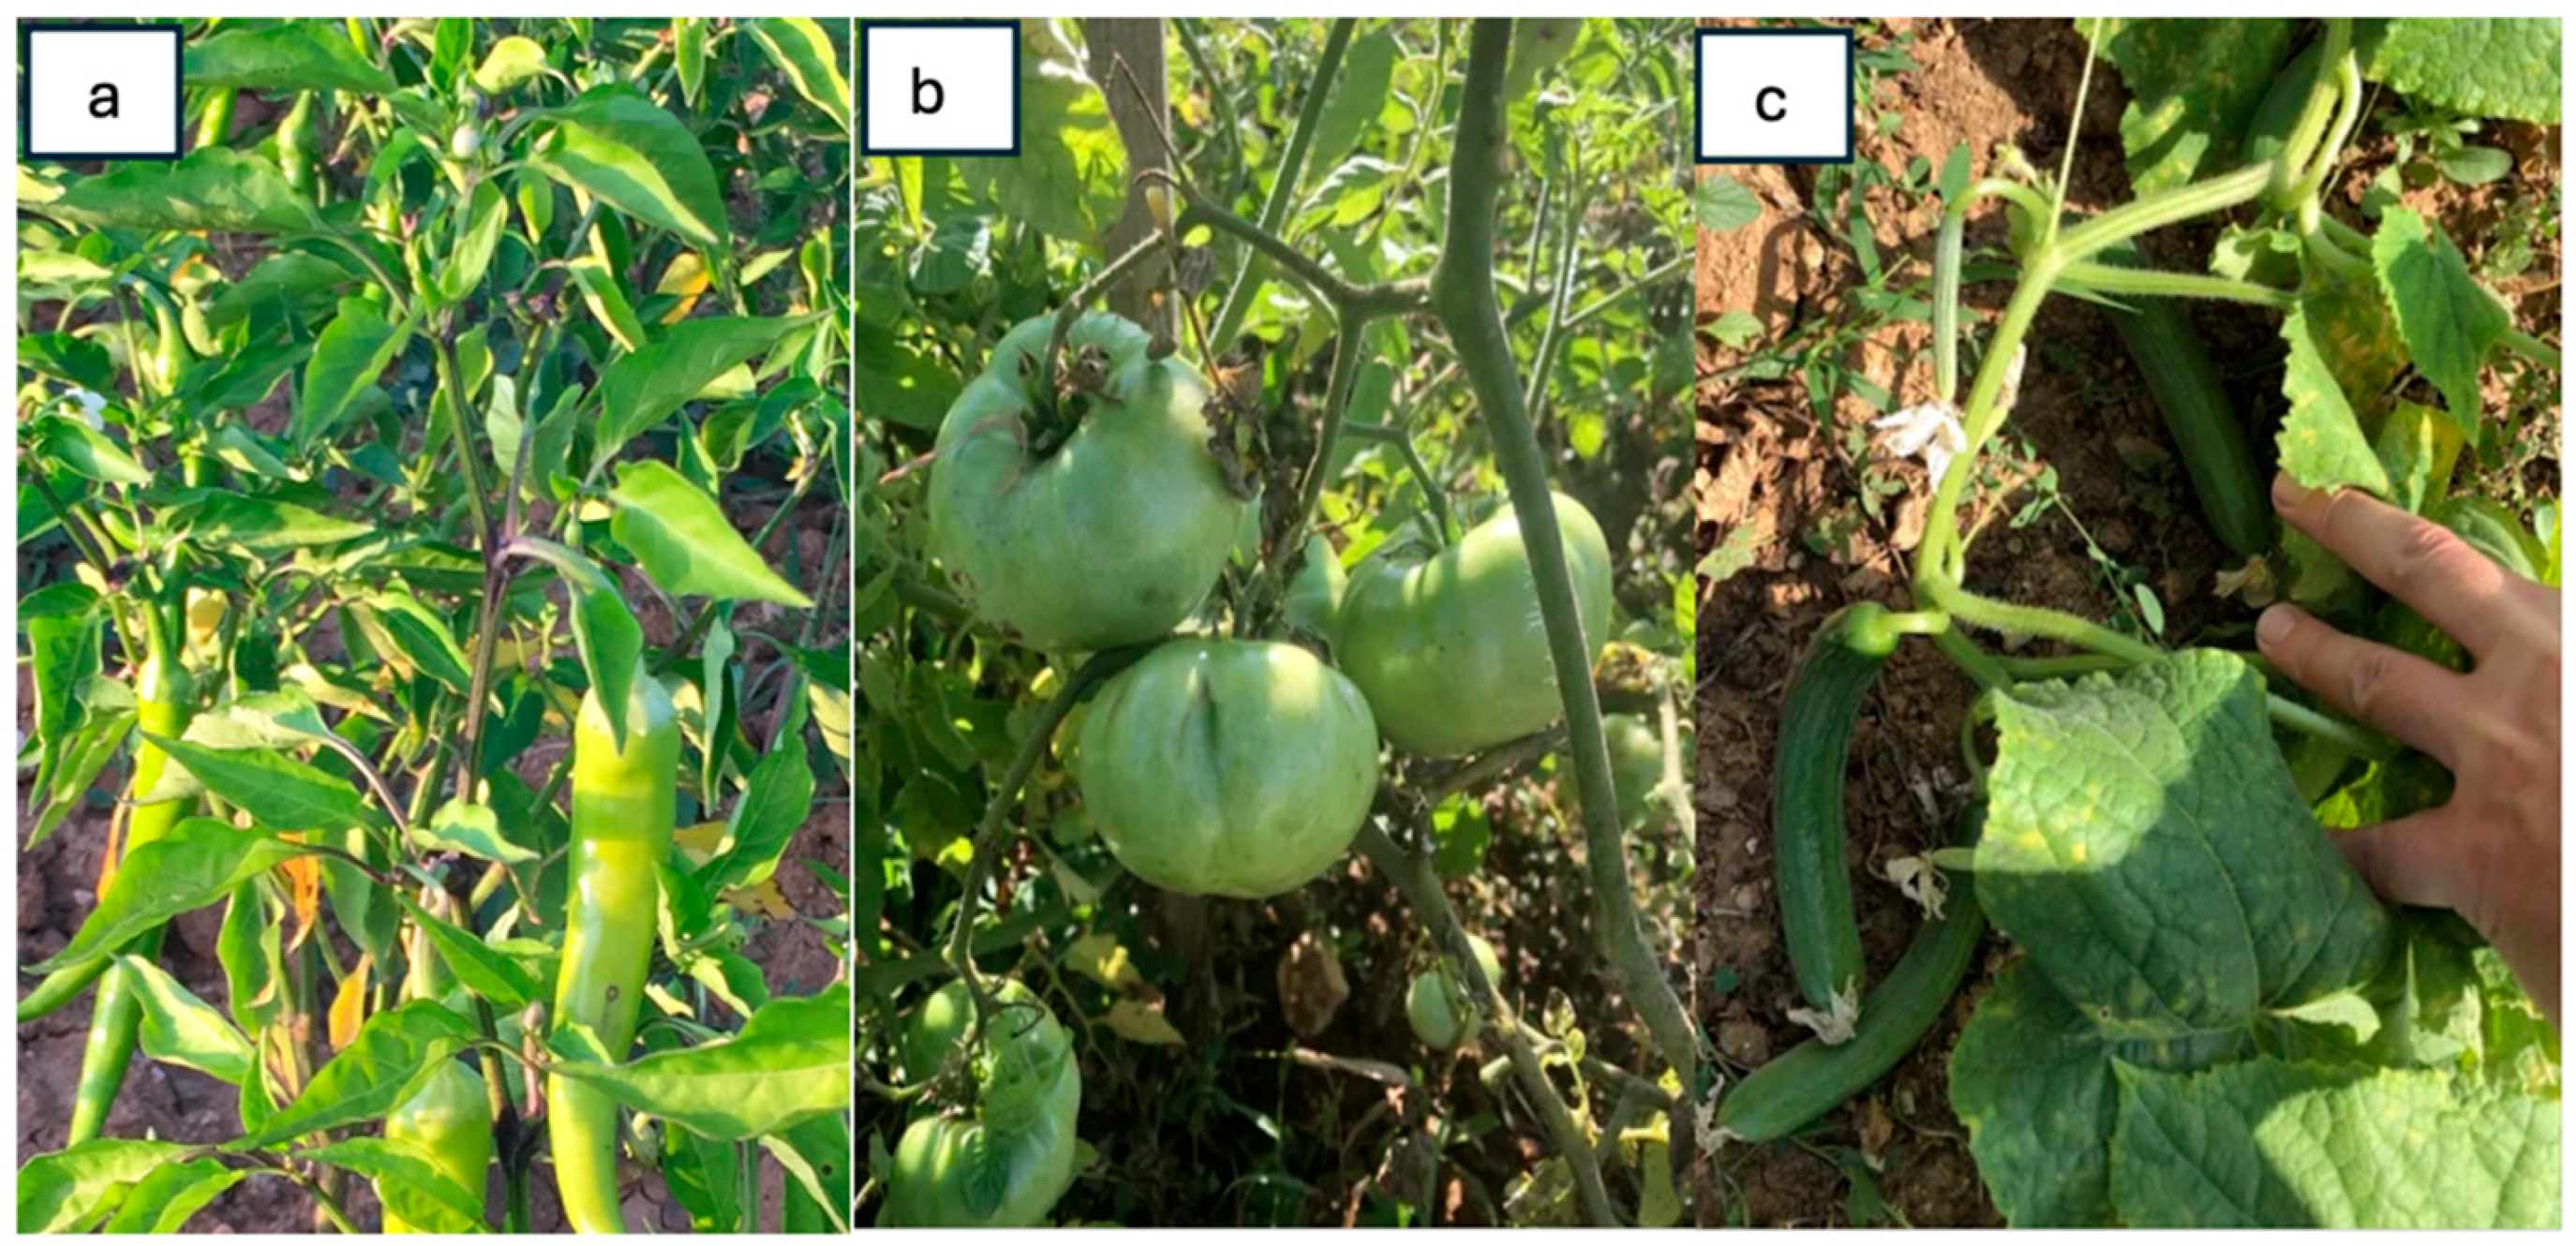
The study also aimed to determine the levels of Cd and Cr contamination in agricultural soils. For this purpose, seeds of all crops were sown in five separate plots located close to each other, with approximately 2–3 m spacing between plots. In each plot, 42 seedlings of each species were planted. The outer rows of seedlings in each plot were designated as a buffer zone, and 20 seedlings located within the inner area were selected for research. The general appearance of some crops is presented in Figure 2.
The plants were routinely watered and maintained, but no fertilizers, hormones, or pesticides were applied. In late summer (August), the plants were uprooted, keeping the root soil intact, and transported to the laboratory. Five seedlings of each crop were randomly selected from each plot, and the analyses were performed on these plants.
For plant samples, the roots were separated from the soil and washed thoroughly with tap water to remove adhering soil particles, followed by three rinses with deionized water. The plants were separated into roots, stems, leaves, and fruits. After thorough washing, the organs were rinsed with deionized water. They were then chopped with stainless steel knives, positioned in Petri dishes, and labeled.
The samples were kept in the Petri dishes with their lids open for 15 days in a well-ventilated laboratory away from direct sunlight. This pre-drying step was because the samples had high water content and were wet from washing. The samples were then dried in an oven for two weeks (at 45 ± 2 °C). After drying, the samples were ground to a powder using a stainless-steel blender, weighed to 0.5 g, and placed in Teflon tubes designed for microwave use (Ethos One, Milestone GmbH, Bargteheide, Germany). Ten milliliters of 65% HNO3 was added to the samples, which were then digested in a microwave device at 280 PSI pressure and 180 °C for 20 min. After the process, the cooled samples were diluted to 50 mL with deionized water and filtered through Whatman no. 42 (Whatman™, Cytiva, Maidstone, United Kingdom) filter paper.
For soil samples, after separation from roots, the soil was air-dried at room temperature for 7 days, then sieved through a 2-mm stainless steel sieve to remove stones, plant debris, and other coarse materials. The soil samples were then ground in an agate mortar to pass through a 0.15-mm sieve. For digestion, 0.5 g of homogenized soil sample was weighed into Teflon digestion vessels, and 10 mL of aqua regia (HCl:HNO3, 3:1 v/v) was added. The samples were digested in the same microwave system at 200 °C and 280 PSI for 30 min. After cooling, the digests were filtered through Whatman No. 42 filter paper and diluted to 50 mL with deionized water.
Cr and Cd concentrations were determined using an Inductively Coupled Plasma—Optical Emission Spectroscopy (GBC Integra XL –SDS-270 ICP-OES) (GBC Scientific Equipment Pty Ltd., Melbourne, Australia) device. Where initial readings exceeded the calibration range, new calibration charts were prepared at adjusted concentration levels (ppm and ppb), and the analyses were repeated.
Quality assurance and quality control (QA/QC) procedures were applied throughout the analytical process. Blank samples were used to prevent possible contamination during sample preparation and analysis. Blank samples, prepared in the same way as the other samples but without the addition of plant or soil material, were processed through all stages of the digestion and analytical procedure to monitor for potential contamination. Calibration standards were reanalyzed after every 20 samples, and recalibration was performed when deviations exceeded 5%. Five-point calibration curves were created using certified stock solutions (1000 mg/L or ppm, Merck, Germany). Calibration points for Cd were 0.01, 0.05, 0.1, 0.5, and 2.0 ppm, while for Cr they were 0.1, 0.5, 1.0, 5.0, and 10.0 ppm. For both elements, the calibration curve correlation coefficient (R2) exceeded 0.998. The established detection limits (LOD) were 0.149 mg/kg for Cd and 0.014 mg/kg for Cr, with corresponding quantification limits (LOQ) of 0.028 mg/kg and 0.236 mg/kg, respectively. Each sample was analyzed in triplicate. Finally, all determined element concentrations were adjusted by their dilution factor and are reported on a dry weight (dw) basis in units of mg/kg or µg/kg.
A total of 300 samples (5 crop species × 5 plants × 4 plant organs × 3 replications) were taken for element analysis. Seventy-five soil samples (5 crop species × 5 plants × 3 replications) were used for element analysis. This pretreatment and PTE analysis procedure has been often used in various recent research [9,10].
The Cr and Cd elements were analyzed using SPSS version 21.1. Analysis of variance was applied to the concentrations, and the Duncan test was performed for factors with an F value, error rate, and statistically significant variances at a confidence level of at least 95%. The results are presented as mean.
The bioaccumulation factor (BCF) and translocation factor (TF) were also calculated in the study. Thus, we determined which crops and organs accumulated more Cd and Cr. The calculations used the following formulas [30].
BCF = (Concentration in the organ)/(Concentration in the soil)
TF = (BCF of the organ)/(BCF of the root soil).
Estimated Daily Intake (EDI) and Health Risk Index (HRI) calculations were performed according to the method used by Al-Hwaiti and Al-Khashman (2015) [31]. Daily intake of metals (DIM) calculations were performed according to the following formula:
DIM = Cmetal × Cfactor × Dfoodintake/Baverageweight
The health risk index (HRI) was calculated using the formula HRI = DIM/RfD, where RfD is the reference oral dose for each element [31].
In the EDI calculation, the metal concentrations measured in crop, a fresh–dry weight conversion factor of 0.085, daily crop consumption of 0.345 kg/day, and an average adult body weight of 55.9 kg were used. For children, daily crop consumption was calculated based on 0.232 kg/day and an average body weight of 32.7 kg [31].

3. Results

3.1. Variation in Cd Concentration (µg/kg)

The outcomes of the variance analysis and Duncan test regarding the variations in Cd concentration in crops based on organ and species are given in Table 1.
As shown in the table, Cd concentration changed significantly in all crops by organs and all organs by each crop (p < 0.001). The concentrations obtained in the fruits of all crops were in the lowest group according to the Duncan test. Except for tomatoes, the maximum concentration was found in the roots; in tomatoes, the highest values were obtained in the leaves. It was determined that the Cd concentration in fruits was ranked as corn < cucumber < pepper < eggplant < tomato. According to the averages, the difference between species is not statistically noteworthy (p > 0.05). The variation in BCF values based on organ and species is given in Table 2.
BCF values for Cd are generally relatively low, ranging from 0.180 (corn fruit) to 0.995 (corn root). Average BCF by species ranges from 0.280 (eggplant) to 0.636 (pepper). Organ-based BCF values range from 0.290 (fruit) to 0.539 (root). TF values calculated for Cd are given in Table 3.
When TF values for Cd are examined, the minimum values are found in the fruit in all crops except corn and eggplant. The average TF values by species were calculated as 1.408 in tomato and 1.043 in pepper, and the TF values in other species do not exceed 1. The highest TF values by organ were calculated in the stem of pepper (1.292), the leaf of tomato (1.848), and the stem of cucumber (0.729). On average, TF values were calculated as 0.830 in stems, 0.894 in leaves, and 0.635 in fruits. In fruits, only the tomato (1.026) has a TF value exceeding 1.

3.2. Variation in Cr Concentration (mg/kg)

The outcomes of the variance analysis and Duncan test regarding the change in Cr concentration are given in Table 4.
Measurements revealed that Cr concentrations were significantly higher than Cd concentrations. According to the calculations, the change in Cr concentration is statistically significant in all crops and organs (p < 0.001). The minimum concentrations were obtained in the roots of peppers and cucumbers, in the fruits of tomatoes and corn, and in the stems of eggplant. The maximum concentrations were obtained in the stems of peppers and tomatoes, the roots of corn and eggplant, and the leaves of cucumbers. The Cr concentrations determined in the fruits ranged from 178.47 mg/kg to 579.80 mg/kg. According to the average values, the difference between species is not statistically significant (p > 0.05). The Cr concentration in soils, by species, is as follows: pepper < eggplant < tomato < corn < cucumber. The variation in BCF values across species and organs is given in Table 5.
BCF values for the Cr element vary from 0.100 (corn stem and fruit) to 1.225 (pepper stem) (Table 5). The lowest average value by organ was obtained in fruits (0.323), while the highest average value was obtained in roots (0.530). By species, the lowest values were observed in eggplant (0.283) and cucumber (0.314), while the highest were observed in pepper (0.934) and corn (0.355). In terms of average values, crops other than pepper show very similar values. The calculated TF values for Cr are illustrated in Table 6.
Table 6 shows that TF values exceed 1 in all organs of peppers and cucumbers, and in all organs of tomatoes except the fruit. The highest value, 2.410, was obtained in cucumber leaves. The minimum values were calculated in corn in all organs, ranging from 0.101 (stem and fruit) to 0.235 (leaf). Based on averages, TF values are above 1 in the stem and leaf organs and in peppers, tomatoes, and cucumbers as species.
The concentrations of Cd and Cr elements in crop fruits, along with the calculated EDI and HRI values for adults, are presented in Table 7. Examination of the values shows that, for adults, the lowest HRI value for Cd was observed in corn (0.117) and the highest in tomato (0.173). For Cr, the lowest value was obtained in tomato (0.070) and the highest in pepper (0.202) (Table 7).
The concentrations of Cd and Cr in crop fruits, along with the calculated EDI and HRI values for children, are presented in Table 8. For children, HRI values for Cd ranged from 0.135 (corn) to 0.199 (tomato). For Cr, the lowest value was obtained in corn (0.072) and the highest in pepper (0.233) (Table 8). The calculated HRI values for both adults and children remained well below 1 in all crops.

4. Discussion

The study was conducted in Düzce, one of Türkiye’s most polluted cities, and was ranked among Europe’s five most polluted cities according to the international air pollution organization in 2021. Previous studies in the region have examined both the elements chromium (Cr) [28,29] and cadmium (Cd) [29]. Furthermore, studies conducted in this region have revealed that some elements, such as Al, Ni, Zn, Sr, Mo, Sn, Tl, and V, which can pose significant risks to human health even at low concentrations, are also present in very high concentrations [8,32,33,34,35]. In Düzce in 2023, the 24-h average guideline value of 15 µg/m3 set by the WHO (World Health Organization) for PM2.5 exceeded 305 days throughout the year. Düzce is the 2nd station in Türkiye where this value is exceeded the most [36]. Studies have shown that elevated PTEs are correlated with the region’s traffic capacity, industrial activity, and topography.
This research assessed the accumulation and translocation of Cr and Cd elements in some frequently consumed crops. Cd and Cr, the subjects of this study, have no known biological function in plants; therefore, they are not required by plants and are known as non-essential PTEs [37]. However, they can pose a serious threat to human health. For this reason, they have been included in the priority pollutant list by organizations such as the EPA and ATSDR, and limit values have been set for crops consumed as food. Cd limits for various crops are accepted as 0.1–0.3 mg/kg in the standards adopted by the WHO, the European Commission, FSSAI (Food Safety and Standards Authority of India), and China [38]. For Cr, the National Health Commission (NHC) and China’s limit is 0.5 mg/kg [39], while the EU limit is 1.1 mg/kg [40]. Within the scope of the study, Cd concentrations in fruits ranged from 223.63 µg/kg (0.22 mg/kg) to 330.20 µg/kg (0.33 mg/kg). Based on these results, it can be concluded that the Cd concentration in all species exceeds the limit values set by international standards by more than twice. Only tomatoes exceed the EU limit value (0.3 mg/kg).
Studies on this subject have determined that Cd concentrations in crops grown in contaminated areas exceed the limit values. Cd exhibits carcinogenic, mutagenic, and teratogenic effects. It disrupts hormonal balance. Interactions with calcium homeostasis in biological systems can cause kidney failure and chronic anemia [41]. Despite this, many studies have found Cd concentrations above the limit values. Gültekin (2020) determined that the Cd concentration in the fruits of plants grown in the city center was 87.3 µg/kg in peppers and 73.6 µg/kg in beans, 129.6 µg/kg in tomatoes, and 144.9 µg/kg in corn [42]. Tunçer (2020) found that traffic density affected Cd accumulation in plants, and that this effect varied with traffic density and washing. Cd concentration in fruits ranged from 168.4 to 409.7 µg/kg in peppers, 119.7 µg/kg to 491.8 µg/kg in tomatoes, and 131.6 µg/kg to 368.3 µg/kg in cucumbers [43]. These results are consistent with those obtained in our study.
Chromium is among the 129 most important environmental pollutants and is considered one of the 14 most harmful substances to the health of living organisms in its hexavalent form [44]. The Cr concentration determined in fruits in the study ranged from 178.47 mg/kg to 579.80 mg/kg. The EU limit value for crops is 1.1 mg/kg [40]. According to these values, the Cr concentration determined in fruits is hundreds of times higher than the limit value in all species. Similar outcomes have been found in studies on the subject. In his study, Tunçer (2020) determined that the Cr concentration in washed fruit samples grown in areas with heavy traffic was 496.1 mg/kg in peppers, 2094.9 mg/kg in tomatoes, and 2057.3 mg/kg in cucumbers [43]. The method used by Tunçer (2020) [43] is the same as the method used in our study. However, the higher values than in our study are probably related to the pollution source. Tunçer (2020) [43] conducted his study in Ankara, the capital of Türkiye, and a city with a much higher population, traffic, and industrial density. Therefore, the higher values may be related to higher levels of pollution from industry, traffic, and urban areas [43]. If Cr is ingested at high levels through the digestive tract, it can cause stomach complaints and ulcers, kidney and liver diseases, and even death [41].
PTEs can enter plant tissues directly from the soil via roots, from the air via stomata on leaves, or through stem sections [44]. However, soil is considered the primary source of PTE entry into plant tissues. Therefore, based on the study’s results, the Cr and Cd concentrations in the soil must be considered. In Türkiye, the threshold value for Cr in soils is set at 100 mg/kg [45]. The total chromium limit in agricultural and residential areas in Poland has been set at 150 mg/kg [46]. Limit values of 34 mg/kg in Belgium, 80 mg/kg in Sweden, 100 mg/kg in Australia and the Netherlands, and 300 mg/kg in Thailand exist [47]. The study found that soil Cr concentrations ranged from 652.00 mg/kg to 1857.43 mg/kg. According to these values, the Cr concentration in all soils in the study area exceeds all specified limit values. Moreover, this result is consistent with similar studies conducted in our country. A study conducted in Osmaniye determined that the Cr concentration in agricultural soils reached 530 mg/kg [45]. İstanbullu et al. (2023) found that Cr concentration varied significantly depending on anthropogenic activities, reaching a maximum of 28.6 mg/kg in forested areas and exceeding 211 mg/kg in industrial areas [48].
Cadmium (Cd), one of the most dangerous PTEs for humans, is found at very low concentrations in the Earth’s crust, with Cd concentrations in uncontaminated soils below 1 mg/kg. According to EU Directive 86/278/EEC, the most cited regulation on toxic metals in agricultural soil, the concentration of cadmium is 1–3 mg/kg [49]. This element is found in minimal amounts in plants [50]. The study found that Cd concentrations ranged from 39,108.10 µg/kg (39.1 mg/kg) to 94,725.58 µg/kg (94.7 mg/kg). Based on these results, Cd levels are well above the specified limit values. This is consistent with the Cd concentration in plant organs. Similar outcomes have been found in studies on this subject. When Cd values in soil samples collected along the Bingöl-Erzurum highway were examined, they ranged from 9.2 mg/kg to 10.7 mg/kg [51]. It is stated that Cd concentration has increased significantly due to industrial sources [48].
As a result of the current research, TF values were commonly elevated in leaves or foliage than in other organs. While the TF value exceeded 1 in the leaves of many crops, only tomatoes had a value of 1 for Cd in fruits. For Cr, values exceeding 1 were obtained in the fruits of cucumber and pepper. The TF value is an important criterion indicating a species’ PTE accumulation potential. The higher this value, the higher the species’ potential to accumulate PTEs in that organ [52]. Strong accumulators of the pertinent metals are defined as plant species with TF values greater than 1 [53]. According to these results, the crops studied can strongly accumulate Cr and Cd in their leaves. It can be said that tomatoes have a very high potential to accumulate Cd, while cucumbers and peppers have a very high potential to accumulate Cr in their fruits.
However, when the study results are evaluated overall, it has been determined that soil Cr concentrations are very high and exceed the limits specified in many countries. In parallel, Cr concentrations in all organs, including fruits, are quite high. In particular, Cr concentrations in fruits are hundreds of times higher than the limit values determined by international health organizations. In contrast, the BCF and TF values were quite low as a result of the calculations. A study conducted in the study area found that TF values were higher for different elements. For example, Demirci et al. (2026) calculated a TF value of 3.421 for Zn in pepper leaves [10]. In other studies, TF values were reported as 5.84 for Cr, 10.00 for Mn, 4.00 for Ni, 5.00 for Zn, and 38.57 for Cu across different plant organs [54]. However, when the values in these studies are examined, it is evident that PTE concentrations are not very high.
The study determined that HRI values in the fruits of the crops ranged from 0.117 to 0.173 for Cd and from 0.062 to 0.202 for Cr in adults. For children, these values ranged from 0.135 to 0.199 for Cd and from 0.081 to 0.233 for Cr. HRI values below 1 indicate that consumption of these crops does not pose a significant health risk in terms of Cd and Cr. However, the high concentration of Cr, in particular, is significant considering long-term exposure and the total metal load from multiple food sources.
Similar values have been reported in studies on the accumulation of Cr and Cd in crops. Al-Hwaiti and Al-Khashman (2015) found that HRI values for Cd in tomatoes and peppers ranged from 0.089 to 0.131 for adults and from 0.102 to 0.150 for children [31]. These values were reported as around 0.001 for adults and 0.003 for children for Cr [31]. Cao et al. (2022) reported HRI values below 1 for Cr across all 12 crops they studied [55].
The accumulation of Cr and Cd in the plant species and organs studied varies greatly. Studies have also shown that PTEs can vary significantly across plant species and organs [28,56,57,58]. This situation stems from PTE entry and accumulation in plants, which is a complex mechanism involving multiple interacting factors. The entry of PTEs into plants and their accumulation in plant organs can also vary depending on numerous factors, such as the structure of the PTE, the structure of the plant and organ, the interaction of the PTE with the plant, and atmospheric conditions [19,35,59]. However, in all cases, elements that are not essential nutrients for plants to accumulate at high levels in the plant body must be present in the environment at high concentrations [35]. In this case, it can be said that Cr concentrations are particularly high in the study area. Cr, an element naturally found in volcanic dust and rocky soils, is classified as carcinogenic by the IARC (International Agency for Research on Cancer) [60]. Cr(VI) is a natural carcinogen even in trace amounts. Cr(III) found in soil naturally oxidizes to Cr(VI) in the presence of alkaline conditions or increased manganese content [61,62].

5. Conclusions

The study found that Cd concentrations in crops exceeded the WHO and EU limits by more than double across all types of fruit, with only tomatoes exceeding the EU limits. The Cd concentration in the soil is close to but below the permitted limit values. Nevertheless, it can be said that Cd pollution is high in the area, and that the products grown there are affected by this.
The study results show that the Cd concentration in the soils remained below the EU limits, while the Cd concentration in the crops was far above the WHO and EU limits. According to this result, the Cd concentration in the crops is due to air pollution. Therefore, it is recommended that crop farming not be permitted in regions with high levels of Cd pollution, or that it be carried out in controlled greenhouses.
According to the study results, Cr pollution is a severe problem in the region. The concentration of Cr, one of the most harmful metals to human health, in the region’s soil and plants is well above permitted limit values. This problem threatens the health of other living organisms and the health of humans in the region. Authorities should take urgent measures regarding this issue. Considering the high levels of Cr pollution in the soils, it is recommended that crop production be carried out in controlled environments, in clean soils, or in soilless culture medium in greenhouses. In addition, since other studies have determined that the region also has high levels of other heavy metals, it would be most logical to avoid using the area for crop production. It is suggested that the region’s agricultural land be used to grow non-food products, such as biofuels, timber, or ornamental plants.
In addition to the high levels of Cr pollution in the region, TF values in peppers and cucumbers grown there were very high. However, TF values for both Cd and Cr are very low in corn fruits. Based on these results, crops such as cucumbers and peppers should not be grown in the region, and emphasis should be placed on growing corn. This would reduce the rate at which Cr and Cd are absorbed into the human body through the food chain. However, it is known that the TF value is calculated as the ratio of PTE in soil, roots, and organs. In other words, the TF value indicates the rate at which PTE passes from the soil to the roots and organs. Therefore, even if PTE levels in plant organs are very high and exceed dangerous health limits, the TF values may still be low. For this reason, it is suggested that the TF value not be used as a risk indicator.

Author Contributions

H.S.: Conceptualization, software, formal analysis, writing—original draft—review and editing. I.K.: Conceptualization, methodology, writing—original draft—review and editing. H.U.O.: Conceptualization, writing—review and editing. F.A.: Methodology, review and editing. R.E.: Conceptualization, writing—review and editing. E.I.: Conceptualization, review and editing. A.O.P.: Conceptualization, review and editing. H.B.O.: Methodology, review and editing. All authors have read and agreed to the published version of the manuscript.

Funding

This research received no external funding.

Institutional Review Board Statement

Not applicable.

Informed Consent Statement

Not applicable.

Data Availability Statement

The original contributions presented in this study are included in the article. Further inquiries can be directed to the corresponding author.

Conflicts of Interest

The authors declare no conflicts of interest.

References

  1. Czatzkowska, M.; Rolbiecki, D.; Korzeniewska, E.; Harnisz, M. Heavy metal and antimicrobial residue levels in various types of digestate from biogas plants—A review. Sustainability 2025, 17, 416. [Google Scholar] [CrossRef]
  2. Cai, K.; He, X.; Wang, L.; Song, Q.; Yuan, W.; Li, W.; Yang, G.; Li, J.; Ma, Y. Heavy metal pollution from standardized e-waste dismantling activities: Pollution index, risk assessment and intervening measures. J. Hazard. Mater. 2025, 484, 136614. [Google Scholar] [CrossRef]
  3. Lu, M.; Zhou, C.; Wang, C.; Jackson, R.B.; Kempes, C.P. Worldwide scaling of waste generation in urban systems. Nat. Cities 2024, 1, 126–135. [Google Scholar] [CrossRef]
  4. Yatoo, A.M.; Hamid, B.; Sheikh, T.A.; Ali, S.; Bhat, S.A.; Ramola, S.; Ali, M.N.; Baba, Z.A.; Kumar, S. Global perspective of municipal solid waste and landfill leachate: Generation, composition, eco-toxicity, and sustainable management strategies. Environ. Sci. Pollut. Res. 2024, 31, 23363–23392. [Google Scholar] [CrossRef]
  5. Bougault, V.; Carlsten, C.; Adami, P.E.; Sewry, N.; Schobersberger, W.; Soligard, T.; Engebretsen, L.; Budgett, R.; Schwellnus, M.; Fitch, K. Air quality, respiratory health and performance in athletes: A summary of the IOC consensus subgroup narrative review on ‘Acute Respiratory Illness in Athletes’. Br. J. Sports Med. 2025, 59, 480–490. [Google Scholar] [CrossRef] [PubMed]
  6. Rentschler, J.; Leonova, N. Global air pollution exposure and poverty. Nat. Commun. 2023, 14, 4432. [Google Scholar] [CrossRef] [PubMed]
  7. Henning, R.J. Particulate matter air pollution is a significant risk factor for cardiovascular disease. Curr. Probl. Cardiol. 2024, 49, 102094. [Google Scholar] [CrossRef] [PubMed]
  8. Kulac, S.; Pulatoglu, A.O.; Koç, İ.; Sevik, H.; Ozel, H.B. Assessing Tree Species for Monitoring and Mitigating Strontium Pollution in Urban Environments. Water Air Soil Pollut. 2025, 236, 605. [Google Scholar] [CrossRef]
  9. Gültekin, Y.; Bayraktar, M.K.; Sevik, H.; Cetin, M.; Bayraktar, T. Optimal vegetable selection in urban and rural areas using artificial bee colony algorithm: Heavy metal assessment and health risk. J. Food Compos. Anal. 2025, 139, 107169. [Google Scholar] [CrossRef]
  10. Demirci, H.; Sevik, H.; Koc, I.; Ucun Ozel, H.; Erdem, R.; Adiguzel, F.; Imren, E.; Ozel, H.B. Organ-Based accumulation, translocation, and associated health risk of Al, Ni, and Zn in tomatoes, peppers, eggplants, cucumbers, and corn from an ındustrial zone in Düzce, Türkiye. Foods 2026, 15, 196. [Google Scholar] [CrossRef]
  11. Iordache, A.M.; Voica, C.; Roba, C.; Nechita, C. Lithium content and its nutritional beneficence, dietary intake, and impact on human health in edibles from the Romanian market. Foods 2024, 13, 592. [Google Scholar] [CrossRef] [PubMed]
  12. Alengebawy, A.; Abdelkhalek, S.T.; Qureshi, S.R.; Wang, M.-Q. Heavy metals and pesticides toxicity in agricultural soil and plants: Ecological risks and human health implications. Toxics 2021, 9, 42. [Google Scholar] [CrossRef] [PubMed]
  13. Sarker, A.; Kim, J.-E.; Islam, A.R.M.T.; Bilal, M.; Rakib, M.R.J.; Nandi, R.; Rahman, M.M.; Islam, T. Heavy metals contamination and associated health risks in food webs—A review focuses on food safety and environmental sustainability in Bangladesh. Environ. Sci. Pollut. Res. 2022, 29, 3230–3245. [Google Scholar] [CrossRef]
  14. Iordache, A.M.; Voica, C.; Roba, C.; Nechita, C. Evaluation of potential human health risks associated with Li and their relationship with Na, K, Mg, and Ca in Romania’s nationwide drinking water. Front. Public Health 2024, 12, 1456640. [Google Scholar] [CrossRef] [PubMed]
  15. Voica, C.; Nechita, C.; Iordache, A.M.; Roba, C.; Zgavarogea, R.; Ionete, R.E. ICP-MS assessment of essential and toxic trace elements in foodstuffs with different geographic origins available in Romanian supermarkets. Molecules 2021, 26, 7081. [Google Scholar] [CrossRef]
  16. Nechita, C.; Iordache, A.M.; Pluhacek, T.; Filip, G.; Camarero, J.J. Hazardous metals coupled with increasing summer diurnal temperature range contributed to growth decline of two oak species in a heavily industrialized area. J. Hazard. Mater. 2025, 496, 139519. [Google Scholar] [CrossRef]
  17. Nechita, C.; Iordache, A.M.; Roba, C.; Sandru, C.; Zgavarogea, R.; Camarero, J.J. Heavy metal health risk assessment in Picea abies L. forests along an altitudinal gradient in Southern Romania. Plants 2025, 14, 968. [Google Scholar] [CrossRef]
  18. Sharafi, S.; Salehi, F. Comprehensive assessment of heavy metal (HMs) contamination and associated health risks in agricultural soils and groundwater proximal to industrial sites. Sci. Rep. 2025, 15, 7518. [Google Scholar] [CrossRef]
  19. Nieder, R.; Benbi, D.K. Potentially toxic elements in the environment–a review of sources, sinks, pathways and mitigation measures. Rev. Environ. Health 2024, 39, 561–575. [Google Scholar] [CrossRef]
  20. Chen, L.; Fang, L.; Yang, X.; Luo, X.; Qiu, T.; Zeng, Y.; Huang, F.; Dong, F.; White, J.C.; Bolan, N. Sources and human health risks associated with potentially toxic elements (PTEs) in urban dust: A global perspective. Environ. Int. 2024, 187, 108708. [Google Scholar] [CrossRef]
  21. Ali, M.U.; Liu, G.; Yousaf, B.; Ullah, H.; Abbas, Q.; Munir, M.A.M. A systematic review on global pollution status of particulate matter-associated potential toxic elements and health perspectives in urban environment. Environ. Geochem. Health 2019, 41, 1131–1162. [Google Scholar] [CrossRef]
  22. Pandey, S.; Kumar, V.; Ain, S.; Ain, Q.; Nagar, N.R.C.; Kumar, B. Impact of heavy metals on respiratory disease. Int. J. Res. Pharm. Allied Sci. 2025, 4, 1–12. [Google Scholar] [CrossRef]
  23. Munir, N.; Jahangeer, M.; Bouyahya, A.; El Omari, N.; Ghchime, R.; Balahbib, A.; Aboulaghras, S.; Mahmood, Z.; Akram, M.; Ali Shah, S.M. Heavy metal contamination of natural foods is a serious health issue: A review. Sustainability 2021, 14, 161. [Google Scholar] [CrossRef]
  24. Lawal, K.K.; Ekeleme, I.K.; Onuigbo, C.M.; Ikpeazu, V.O.; Obiekezie, S.O. A review on the public health implications of heavy metals. World J. Adv. Res. Rev. 2021, 10, 255–265. [Google Scholar] [CrossRef]
  25. Rabbani, A.; Bag, R.; Samui, P.; Kumari, S.; Akash. Remediation of heavy metals from contaminated soil: State of the art review of sources, risk, policies and available remediation techniques. Trans. Indian Natl. Acad. Eng. 2025, 10, 19–31. [Google Scholar] [CrossRef]
  26. Leadlab. Available online: https://leadlab.com/what-are-the-13-priority-pollutant-metals/ (accessed on 20 November 2025).
  27. Isinkaralar, K.; Koc, I.; Erdem, R.; Sevik, H. Atmospheric Cd, Cr, and Zn deposition in several landscape plants in Mersin, Türkiye. Water Air Soil Pollut. 2022, 233, 120. [Google Scholar] [CrossRef]
  28. Koc, I.; Cobanoglu, H.; Canturk, U.; Key, K.; Kulac, S.; Sevik, H. Change of Cr concentration from past to present in areas with elevated air pollution. Int. J. Environ. Sci. Technol. 2024, 21, 2059–2070. [Google Scholar] [CrossRef]
  29. Isinkaralar, K.; Isinkaralar, O.; Koç, İ.; Şevik, H.; Özel, H.B. Atmospheric trace metal exposure in a 60-year-old wood: A sustainable methodological approach to measurement of dry deposition. Int. J. Environ. Res. 2025, 19, 112. [Google Scholar] [CrossRef]
  30. Ergül, H.A.; Kuşçu, İ.S.K. Variations in Cu, Co, Cr, Cd, and Pb concentrations based on soil depth, plant species, and plant organs at copper mining sites. BioResources 2025, 20, 6116. [Google Scholar] [CrossRef]
  31. Al-Hwaiti, M.; Al-Khashman, O. Health risk assessment of heavy metals contamination in tomato and green pepper plants grown in soils amended with phosphogypsum waste materials. Environ. Geochem. Health 2015, 37, 287–304. [Google Scholar] [CrossRef] [PubMed]
  32. Şen, S.G. Long-term monitoring of thallium uptake and phytoremediation potential of Robinia pseudoacacia. Turk. J. Agric.-Food Sci. Technol. 2025, 13, 3026–3031. [Google Scholar]
  33. Cebi Kilicoglu, M.; Zeren Cetin, I. Determination of the suitable biomonitors to be used in monitoring the change for reducing the concentration of V in areas with high-level of air pollution. Bull. Environ. Contam. Toxicol. 2024, 113, 63. [Google Scholar] [CrossRef]
  34. Yiğit, N. Determination of sixteen woody species’ ability to sequester Sr, Mo, and Sn pollutants. BioResources 2024, 19, 784. [Google Scholar] [CrossRef]
  35. Canturk, U. Determining the plants to be used in monitoring the change in thallium concentrations in the air. Cerne 2023, 29, e-103282. [Google Scholar] [CrossRef]
  36. Temiz Hava Hakkı. Kara Rapor 2024. Hava kirliliği ve Sağlık Etkileri; Printworld: Ankara, Türkiye, 2024; Available online: https://temizhavahakki.org/wp-content/uploads/2024/12/Kara-Rapor-2024_final.pdf (accessed on 20 March 2026).
  37. Wuana, R.A.; Okieimen, F.E. Heavy metals in contaminated soils: A review of sources, chemistry, risks and best available strategies for remediation. Int. Sch. Res. Not. 2011, 2011, 402647. [Google Scholar] [CrossRef]
  38. Pan, X.-D.; Han, J.-L. Distribution of cadmium in fresh vegetables marketed in Southeast China and its dietary exposure assessment. Foods 2023, 12, 1204. [Google Scholar] [CrossRef]
  39. Saleem, M.; Wang, Y.; Pierce, D.; Sens, D.A.; Somji, S.; Garrett, S.H. Concentration and potential non-carcinogenic and carcinogenic health risk assessment of metals in locally grown vegetables. Foods 2025, 14, 2264. [Google Scholar] [CrossRef]
  40. Ejaz, U.; Khan, S.M.; Khalid, N.; Ahmad, Z.; Jehangir, S.; Fatima Rizvi, Z.; Lho, L.H.; Han, H.; Raposo, A. Detoxifying the heavy metals: A multipronged study of tolerance strategies against heavy metals toxicity in plants. Front. Plant Sci. 2023, 14, 1154571. [Google Scholar] [CrossRef]
  41. Bakırcı, S. Comparison of Heavy Metal Levels in Some Bee Products Produced in Aydın Province. Master’s Thesis, Adnan Menderes University, Aydın, Türkiye, 2019. [Google Scholar]
  42. Gültekin, Y. Variation of Heavy Metal Concentrations in Some Cultivar Plants in the Ordu City Center. Master’s Thesis, Graduate School of Natural and Applied Sciences Department of Sustainable Agriculture and Natural Plant Resources, Kastamonu University, Kastamonu, Türkiye, 2020. [Google Scholar]
  43. Tunçer, B. Change of Heavy Metal Concentrations in Some One Year Plants. Master’s Thesis, Kastamonu University, Kastamonu, Türkiye, 2020. [Google Scholar]
  44. Zhang, K.; Liang, Y.; Ma, C.; Guo, H.; Liu, F.; Gao, A.; Liu, N.; Zhang, H. Stomata as the main pathway for the penetration of atmospheric particulate matter Pb into wheat leaves. Toxics 2025, 13, 185. [Google Scholar] [CrossRef] [PubMed]
  45. Şimşek, T.; Kalkancı, N.; Büyük, G. Tarım topraklarındaki ağır metallerin kirlilik düzeylerinin belirlenmesi: Osmaniye örneği. Mustafa Kemal Üniversitesi Tarım Bilim. Derg. 2021, 26, 106–116. [Google Scholar] [CrossRef]
  46. Leśniewska, B.; Gontarska, M.; Godlewska-Żyłkiewicz, B. Selective separation of chromium species from soils by single-step extraction methods: A critical appraisal. Water Air Soil Pollut. 2017, 228, 274. [Google Scholar] [CrossRef]
  47. Liu, Y.; Zhou, Q.; Wang, Y.; Cheng, S.; Hao, W. Deriving soil quality criteria of chromium based on species sensitivity distribution methodology. Toxics 2021, 9, 58. [Google Scholar] [CrossRef]
  48. Istanbullu, S.N.; Sevik, H.; Isinkaralar, K.; Isinkaralar, O. Spatial distribution of heavy metal contamination in road dust samples from an urban environment in Samsun, Turkiye. Bull Env. Contam Toxicol 2023, 110, 78. [Google Scholar] [CrossRef]
  49. European Commission. On the Protection of the Environment, and in Particular of the Soil, When Sewage Sludge Is Used in Agriculture. 86/278/EEC. 1986. Available online: https://eur-lex.europa.eu/legal-content/EN/TXT/PDF/?uri=CELEX:31986L0278 (accessed on 3 February 2026).
  50. Rehman, A.U.; Nazir, S.; Irshad, R.; Tahir, K.; ur Rehman, K.; Islam, R.U.; Wahab, Z. Toxicity of heavy metals in plants and animals and their uptake by magnetic iron oxide nanoparticles. J. Mol. Liq. 2021, 321, 114455. [Google Scholar] [CrossRef]
  51. Elaltuntaş, E. Bingöl İlini Erzurum Muş Çevre İllerine Bağlayan Karayolu Kenarındaki Tarım Topraklarında Motorlu Taşıtlardan Kaynaklanan Ağır Metal Kirliliği. Master’s Thesis, Bingöl Üniversitesi, Bingöl, Türkiye, 2017. [Google Scholar]
  52. Wang, Z.; Liu, X.; Qin, H. Bioconcentration and translocation of heavy metals in the soil-plants system in Machangqing copper mine, Yunnan Province, China. J. Geochem. Explor. 2019, 200, 159–166. [Google Scholar] [CrossRef]
  53. Takarina, N.D.; Pin, T.G. Bioconcentration factor (BCF) and translocation factor (TF) of heavy metals in mangrove trees of Blanakan fish farm. Makara J. Sci. 2017, 21, 77–81. [Google Scholar] [CrossRef]
  54. Ogori, B.O.; Lubis, S.; Bakji, G. Determination of the concentrations of radionuclides and heavy metals and their transfer factor from soil to crops/vegetables in some agricultural soils in Barkin Ladi Area, Plateau State, Nigeria. Int. J. Res. Innov. Appl. Sci. 2023, 8, 124–130. [Google Scholar] [CrossRef]
  55. Cao, C.; Yang, Y.; Kwan, M.-P.; Ma, Z.-B.; Karthikeyan, R.; Wang, J.-J.; Chen, H. Crop selection reduces potential heavy metal (loid) s health risk in wastewater contaminated agricultural soils. Sci. Total Environ. 2022, 819, 152502. [Google Scholar] [CrossRef] [PubMed]
  56. Giunchino, F.; Mucciarelli, M.; Malandrino, M.; Sordello, F.; Lanfranco, L.; Primo, L.; Calza, P. Assessing PTEs in a polluted urban green environment and proposing sustainable approaches for its recovery. Ecol. Eng. 2026, 222, 107784. [Google Scholar] [CrossRef]
  57. Modlitbová, P.; Pořízka, P.; Kaiser, J. Laser-induced breakdown spectroscopy as a promising tool in the elemental bioimaging of plant tissues. TrAC Trends Anal. Chem. 2020, 122, 115729. [Google Scholar] [CrossRef]
  58. Tarish, M.; Ali, R.T.; Shan, M.; Amjad, Z.; Rui, Q.; Akher, S.A.; Al Mutery, A. Plant tissues as biomonitoring tools for environmental contaminants. Int. J. Plant Biol. 2024, 15, 375–396. [Google Scholar] [CrossRef]
  59. Canturk, U.; Koç, İ.; Ozel, H.B.; Sevik, H. Identification of proper species that can be used to monitor and decrease airborne Sb pollution. Environ. Sci. Pollut. Res. 2024, 31, 56056–56066. [Google Scholar] [CrossRef] [PubMed]
  60. Sharma, A.; Kapoor, D.; Wang, J.; Shahzad, B.; Kumar, V.; Bali, A.S.; Jasrotia, S.; Zheng, B.; Yuan, H.; Yan, D. Chromium bioaccumulation and its impacts on plants: An overview. Plants 2020, 9, 100. [Google Scholar] [CrossRef] [PubMed]
  61. Benimeli, C.S.; Polti, M.A.; Albarracín, V.H.; Abate, C.M.; Amoroso, M.J. Bioremediation potential of heavy metal–resistant actinobacteria and maize plants in polluted soil. In Biomanagement of Metal-Contaminated Soils; Springer: Berlin/Heidelberg, Germany, 2011; pp. 459–477. [Google Scholar]
  62. Suzuki, R.; Tani, Y.; Naitou, H.; Miyata, N.; Tanaka, K. Sequestration and oxidation of Cr (III) by fungal Mn oxides with Mn (II) oxidizing activity. Catalysts 2019, 10, 44. [Google Scholar] [CrossRef]
Figure 1. Basic appearance of experimental design.
Horticulturae 12 00400 g001
Figure 2. Plants and fruits of cultivated crops (a) pepper, (b) tomato, (c) cucumber.
Horticulturae 12 00400 g002
Table 1. Organ-based variation in Cd (µg/kg) concentration in five crops.
SpeciesOrganSoil
StemFruitLeafRootF ValueAverage
Pepper456.20 eD273.40 cA375.53 dC352.933 bD480.976 **364.51572.90 a
Tomato433.60 dB330.20 dA593.96 eC320.73 aA1701.605 **419.621063.50 b
Corn197.06 aA223.63 aA228.33 aA1091.00 dB2064.483 **432.001096.33 b
Eggplant260.46 bA275.83 cA303.23 cB434.76 cC199.113 **318.571138.17 b
Cucumber313.93 eC230.30 bA281.16 bB430.93 cD1524.140 **314.08988.36 b
F Value1348.501 **639.296 **3734.692 **993.412 ** 1.008 ns130.677 **
Average332.25 A266.67 A356.44 B384.84 B4.218 *
Note: * = p < 0.05; ** = p < 0.001; ns = not significant. Lowercase letters compare crops vertically for each organ separately, while capital letters compare organs horizontally for each crop. Concentrations with different letters differ statistically.
Table 2. Bioconcentration factor (BCF) for Cd in five crops.
SpeciesOrgan
StemFruitLeafRootAverage
Pepper0.7960.4770.6550.6160.636
Tomato0.4080.3100.5580.3020.395
Corn0.1800.2040.2080.9950.397
Eggplant0.2290.2420.2660.3820.280
Cucumber0.2930.2150.2630.4020.293
Average0.3810.2900.3900.539
Table 3. Translocation factor (TF) for Cd in five crops.
SpeciesOrgan
StemFruitLeafAverage
Pepper1.2920.7741.0631.043
Tomato1.3511.0261.8481.408
Corn0.1810.2050.2090.198
Eggplant0.5990.6340.6960.643
Cucumber0.7290.5350.6540.639
Average0.8300.6350.894
Table 4. Organ-based variation in Cr (mg/kg) concentration in five crops.
SpeciesOrganSoil
StemFruitLeafRootF ValueAverage
Pepper798.83 dD579.80 eC570.10 cB486.60 bA6977.5 **608.83652.00 a
Tomato860.56 eD200.90 bA652.80 dC500.46 cB59,893.7 **553.681635.53 c
Corn179.633 aA178.47 aA415.567 bB1766.96 eC492,901.1 **635.151788.30 d
Eggplant322.56 bA450.30 dC400.23 aB642.96 dD17,437.6 **454.011606.43 b
Cucumber572.10 cC416.60 cB948.80 eD393.50 aA105,347.9 **582.751857.43 e
F Values41,988.5 **50,582.4 **27,757.1 **353,603.0 ** 0.472 ns49,918.2 **
Average546.74 AB365.21 A597.50 B505.88 AB3.783 *
Note: * = p < 0.05; ** = p < 0.001; ns = not significant. Lowercase letters compare crops vertically for each organ separately, while capital letters compare organs horizontally for each crop. Concentrations with different letters differ statistically.
Table 5. Bioconcentration factor (BCF) for Cr in five crops.
SpeciesOrganAverage
StemFruitLeafRoot
Pepper1.2250.8890.8740.7460.934
Tomato0.5260.1230.3990.3060.339
Corn0.1000.1000.2320.9880.355
Eggplant0.2010.2800.2490.4000.283
Cucumber0.3080.2240.5110.2120.314
Average0.4720.3230.4530.530
Table 6. Translocation factor (TF) for Cr in five crops.
SpeciesOrganAverage
StemFruitLeaf
Pepper1.6421.1921.1721.335
Tomato1.7190.4021.3041.142
Corn0.1010.1010.2350.146
Eggplant0.5030.7000.6230.609
Cucumber1.4531.0572.4101.640
Average1.0840.6901.149
Table 7. Estimated Daily Intake (EDI) and Health Risk Index (HRI) values for adults in crop fruits.
SpeciesCd
(mg/kg)
Cd–EDI (mg/kg.Day)Cd–HRICr
(mg/kg)
Cr–EDI (mg/kg.Day)Cr–HRI
Pepper0.27340.0001430.143579.80.30260.202
Tomato0.33020.0001730.173200.90.10490.070
Corn0.22360.0001170.117178.470.09320.062
Eggplant0.27580.0001440.144450.30.23500.157
Cucumber0.23030.0001200.120416.60.21750.145
Table 8. Estimated Daily Intake (EDI) and Health Risk Index (HRI) values for children in crop fruits.
SpeciesCd
(mg/kg)
Cd–EDI (mg/kg.Day)Cd–HRICr
(mg/kg)
Cr–EDI (mg/kg.Day)Cr–HRI
Pepper0.27340.0001650.165579.800.34970.233
Tomato0.33020.0001990.199200.900.12120.081
Corn0.22360.0001350.135178.470.10760.072
Eggplant0.27580.0001660.166450.300.27160.181
Cucumber0.23030.0001390.139416.600.25120.167
Disclaimer/Publisher’s Note: The statements, opinions and data contained in all publications are solely those of the individual author(s) and contributor(s) and not of MDPI and/or the editor(s). MDPI and/or the editor(s) disclaim responsibility for any injury to people or property resulting from any ideas, methods, instructions or products referred to in the content.