Article

Expression Characteristics and Functional Analysis of Prunus persica Gene PpNAC036

1
College of Horticulture, Hebei Agricultural University, Baoding 071000, China
2
Tongliao Forestry and Grassland Science Research Institute, Tongliao 028000, China
3
Key Laboratory of Horticulture Crops Germplasm Resources Utilization, Ministry of Agriculture, Research Institute of Pomology, Chinese Academy of Agricultural Sciences (CAAS), Xingcheng 125100, China
4
National Engineering Research Center for Agriculture in Northern Mountainous Areas, Agricultural Technology Innovation Center in Mountainous Areas of Hebei Province, Hebei Agricultural University, Baoding 071000, China
*
Author to whom correspondence should be addressed.
These authors contributed equally to this work.
Horticulturae 2026, 12(2), 247; https://doi.org/10.3390/horticulturae12020247

Submission received: 9 January 2026 / Revised: 14 February 2026 / Accepted: 16 February 2026 / Published: 19 February 2026

Abstract

Peach trees exhibit vigorous growth that is often difficult to manage, frequently leading to canopy closure and the outward migration of fruiting positions, which ultimately results in diminished yield and fruit quality. Therefore, it is of great importance to study the key genes regulating peach tree vigor. Preliminary experiments identified PpNAC036 as a candidate gene potentially associated with vigor. In this study, we characterized the expression profile of PpNAC036 across various peach tissues. Our results demonstrate that PpNAC036 is most highly expressed in stems and responds rapidly to hormonal treatments, with expression levels increasing 3.6-fold and 3.9-fold under IAA and NPA treatments, respectively (5 min to 1 h). Subsequently, the PpNAC036 gene was cloned and overexpressed in Arabidopsis thaliana. Compared to the wild type, transgenic Arabidopsis exhibited a 28–50% reduction in primary root length and a 31.6–36.8% decrease in hypocotyl length. Conversely, at maturity, the transgenic Arabidopsis displayed enhanced vegetative vigor, with fresh and dry weights increasing by 37–48% and 29–46%, respectively. This growth was accompanied by a nearly two-fold increase in stem diameter and a 1.5- to 2-fold elevation in lignin content; simultaneously, genes related to lignin biosynthesis were upregulated. Hormonal profiling revealed that PpNAC036 overexpression led to a 7-fold increase in IAA, a 22–60% rise in GAs, and a 97–106% increase in CTKs, whereas ABA levels decreased by 5–6%. Furthermore, the transgenic Arabidopsis exhibited delayed germination and flowering, along with alterations in the number of floral organs. Transcriptomic analysis identified 2797 common DEGs, which were enriched in pathways related to cell wall organization and hormone signaling. Collectively, these findings elucidate the function of PpNAC036 as a pivotal regulator of plant vigor and secondary cell wall development, positioning it as a promising candidate gene for molecular breeding and architectural optimization in peach.

1. Introduction

Peach (Prunus persica L.) holds significant economic importance among fruit trees in China. In most peach orchards, high-density planting is practiced. Meanwhile, peach trees are characterized by vigorous shoot growth, frequent lateral shoot formation, and strong tree vigor. These factors often give rise to canopy overcrowding. The overcrowded canopy leads to poor ventilation and light penetration. As a consequence, flowering and fruit set are negatively affected, and ultimately, fruit quality is compromised [1]. Therefore, it is of great urgency to research the genes associated with tree growth vigor.
Gibberellin, auxin, cytokinin, and abscisic acid form a complex signaling network that finely regulates plant growth, development, and responses to environmental stresses. These hormonal pathways are not isolated but are interconnected via extensive crosstalk, creating a dynamic regulatory network. In recent years, the NAC transcription factor family has garnered significant attention due to its central role in various biological processes. In rice, OsNAC2 has been identified as a key negative regulator of the GA pathway. Research has demonstrated that overexpression of OsNAC2 leads to plant dwarfism, delayed flowering, and reduced sensitivity to gibberellin (GA) [2]. In addition to GA, auxin—a central hormone in regulating plant growth and development—also has a close connection between its signaling pathway and NAC transcription factors. Auxin not only regulates key processes such as cell elongation, division, and differentiation, but also interacts with other plant hormones to function across various developmental stages and tissues, playing a critical role in plant growth and development [3]. Studies have shown that auxin-regulated cell elongation is crucial during plant growth, including organ growth [4] and bending growth [5]. Research has demonstrated that NAC transcription factors can directly integrate auxin signaling, especially in crosstalk with environmental stress signals. In previous studies, OsNAC2 was shown to directly bind to the promoters of the auxin-amido synthetase genes OsGH3.6 and OsGH3.8, as well as the auxin response factor gene OsARF25. By activating GH3 genes, OsNAC2 reduces free IAA levels. Concurrently, by regulating OsARF25, it influences the downstream auxin response network, ultimately suppressing auxin signaling and inhibiting root initiation and elongation [6]. In Arabidopsis, the membrane-associated NAC transcription factor NTM2 has been shown to integrate auxin signaling with salt stress responses during seed germination, thereby negatively regulating auxin signaling and ultimately delaying seed germination under high-salinity conditions [7]. These findings reveal that NAC transcription factors are not merely terminal effectors of individual hormone pathways; instead, they serve as key nodes that integrate multiple hormonal signals. By directly or indirectly regulating downstream target genes, they coordinate plant growth and development.
The plant secondary cell wall (SCW) is composed of polymers such as cellulose, hemicellulose, and lignin. It provides mechanical support and protection to plants and facilitates the transportation of water and nutrients. Additionally, it plays a critical role in responses to abiotic stress and is essential for plant growth and development [8,9]. Recent studies have revealed that the biosynthesis of the SCW is controlled by a highly complex, multilayered transcriptional regulatory network. In this network, the NAC transcription factor family acts as a “master switch” and plays a central role [9,10,11]. In the model plant Arabidopsis thaliana, members of the NAC family, such as NAC Secondary Wall Thickening Promoting Factor 1/2/3 (NST1/2/3) and Vascular-Related NAC-Domain 1–7 (VND1–VND7), have been identified as key regulators for secondary wall formation in different cell types. These NAC proteins bind to specific cis-acting elements, such as the Secondary Wall NAC Binding Element (SNBE), and directly activate the expression of a set of downstream genes involved in secondary wall synthesis. As a result, they initiate and regulate the entire secondary wall biosynthesis program [12,13]. In woody plants such as Populus spp., the homologs of NST/SND and Sombrero-Related Protein 09–12 (VNS09–VNS12) have been demonstrated to be key regulators controlling secondary wall formation in xylem fibers, phloem fibers, and wood ray parenchyma cells [14]. In the economic crop cotton (Gossypium hirsutum), GhFSN5 has been identified as a fiber-specific NAC factor that negatively regulates SCW formation. Predominantly expressed during the fiber SCW thickening stage, it inhibits the biosynthesis of cellulose, xylan, and lignin. Cinnamyl alcohol dehydrogenase (CAD) is one of the rate-limiting enzymes in the lignin biosynthetic pathway. Recent studies have demonstrated that in Populus simonii, PsiCAD5 specifically catalyzes the reduction of caffealdehyde to caffeyl alcohol, identifying it as a key gene driving the monomer synthesis of C-lignin [15]. Beyond transcriptional regulation, epigenetic modifications also play a pivotal role in lignin biosynthesis. For instance, the histone acetyltransferase GCN5 has been identified as a negative regulator of PRX71 and PRX33, thereby promoting lignin deposition in Arabidopsis under both normal and salt stress conditions [16].
During their growth, plants frequently encounter various abiotic stresses, such as drought and salinity, which can significantly impede crop development and limit yield. To cope with these adverse conditions, plants have evolved sophisticated molecular regulatory mechanisms. In recent years, numerous studies have demonstrated that NAC transcription factors play crucial roles in drought and salt stress adaptation. In maize, ZmNAC55 was identified as a NAC transcription factor that negatively regulates drought stress. Overexpression of ZmNAC55 makes plants more sensitive to drought, while its knockdown enhances drought resistance [17]. In wheat, overexpression of TaNAC2 can enhance the plant’s tolerance to both drought and high-salinity environments by increasing the expression levels of abiotic stress-related genes [18]. Research on woody species like Argania spinosa demonstrates that coordinated antioxidant and osmotic shifts facilitate salinity adaptation. Salt stress triggers robust defenses by enhancing CAT and POX activities and accumulating proline and soluble sugars. These mechanisms mitigate oxidative damage and improve germination [19].
In addition to their pivotal roles in stress responses, recent studies have revealed that NAC transcription factors are also widely involved in regulating plant developmental processes. Specifically, they play significant parts in floral organ development and the control of flowering time. For instance, NAC050 and NAC052 have been identified as novel transcriptional repressors that interact with the histone demethylase JMJ14 to coregulate the expression of a set of flowering-related genes [20]. JMJ14 is an H3K4 demethylase involved in repressing the expression of key flowering integrator genes, such as FT and SOC1 [21,22].
In this study, we focus on a specific NAC family member, PpNAC036. We explored its tissue-specific expression patterns in the peach cultivars ‘Jiuyan’ and ‘You Pan No. 9’, as well as its sensitivity to exogenous hormone signals. Subsequently, we evaluated the biological function of PpNAC036 by analyzing phenotypic changes in plant height, organ development, and secondary wall deposition resulting from its heterologous overexpression in Arabidopsis thaliana. Finally, through RNA-seq analysis of these transgenic lines, we identified the potential downstream target genes through which PpNAC036 modulates plant architecture. This study not only provides empirical evidence for the role of PpNAC036 as a potential regulator of vegetative growth but also offers a theoretical foundation for the molecular breeding of peach tree architecture.

2. Materials and Methods

2.1. Plant Materials

Prunus persica cv. ‘Jiuyan’ peach trees were used for tissue expression analysis. Samples of stems, leaves, flowers, and fruits were collected, immediately snap-frozen in liquid nitrogen, and stored at −80 °C for the determination of gene expression levels. P. persica cv. ‘Youpan No. 9’ was used for phytohormone treatment experiments. For this phytohormone application, uniformly growing and healthy ‘Youpan No. 9’ trees were randomly selected as materials. Phytohormone treatments were applied to the shoot apices. A 0.7% anhydrous ethanol solution was used as the control treatment in the experiment. The experimental groups were foliar-sprayed with 100 mg/L indole-3-acetic acid (IAA), 100 mg/L gibberellic acid (GA), 50 mg/L N-1-naphthylphthalamic acid (NPA), and 100 mg/L abscisic acid (ABA), respectively. The spraying continued until droplets began to form and fall from the leaf margins. Three individual trees were selected for each treatment group. Leaf samples were collected at 0 min (before treatment) and at 3 min, 5 min, 1 h, 3 h, and 24 h after treatment. Three replicates were collected for each treatment, immediately snap-frozen in liquid nitrogen, and stored at −80 °C for further analysis. Arabidopsis thaliana Col-0 was used for genetic transformation. PpNAC036-5, PpNAC036-7, and wild-type Col-0 were subjected to phenotypic analysis and RNA-seq.

2.2. Seed Germination Assay

Wild-type and transgenic Arabidopsis thaliana seeds were sown and vernalized (4 °C, 2–3 d). For each replicate, 50 seeds were sown. Germination was recorded every 4 h, with the emergence of the white radicle through the seed coat serving as the criterion for germination. The germination rate was calculated as: germination rate(%) = (number of germinated seeds/total number of seeds) − 100%. The experiment was performed in triplicate, and the mean values were used for further analysis.

2.3. Measurement of Plant Morphological Parameters

Wild-type and transgenic Arabidopsis seeds were sown and allowed to germinate. Seedlings exhibiting uniform germination were selected and transferred to Petri dishes containing partitioned MS medium. The plates were placed vertically in a growth chamber. Seven days later, twenty seedlings were randomly selected, and their hypocotyl and root lengths were measured using a ruler. The remaining seedlings with consistent growth status were transplanted into soil for further cultivation. After 30 days of growth, twenty plants were selected to measure the length and width of rosette leaves, as well as stem diameter (60 d), using a vernier caliper. Subsequently, the aerial parts were harvested, and their fresh weight and dry weight were determined using an electronic balance.

2.4. Determination of Lignin Content

Stems of 60-day-old Arabidopsis plants were collected for lignin content determination. Lignin content was measured using a lignin assay kit (Solarbio, Beijing, China) based on ultraviolet spectrophotometry. Each sample was measured in triplicate.

2.5. Agrobacterium-Mediated Transformation

The full-length coding sequence (CDS) of PpNAC036 was cloned from peach (Prunus persica L.) and inserted into the pRI101-flag vector under the control of the 35S promoter, fused with the flag tag. The Agrobacterium rhizogenes strain GV3101 carrying the target construct was adjusted to an OD600 = 0.6. Arabidopsis transformation was performed using the floral dip method. The T0 seeds were surface-sterilized and germinated on Murashige and Skoog (MS) medium supplemented with 50 mg/L kanamycin. After growing in a culture chamber, healthy seedlings were transferred to soil for seven days. The T1 seeds were individually collected and numbered. After two additional rounds of screening, homozygous T2 seeds were obtained. Genomic DNA was extracted from T2 Arabidopsis leaves. Specific primers were designed based on the expression vector structure for PCR verification. The recombinant plasmid containing the target gene served as the positive control, while wild-type Arabidopsis DNA was used as the negative control. After analyzing the PCR products, PpNAC036-overexpressing Arabidopsis lines were identified.

2.6. Transcriptional Activation Assay

The coding sequence (CDS) of PpNAC036 was cloned into the pGBT9 vector. Subsequently, the constructed plasmid and pGAD424 were co-transformed into yeast strains. These transformed yeast strains were then plated on DDO medium (synthetic dropout medium lacking leucine and tryptophan, denoted as -L/-T) for cultivation. After that, single colonies were picked. These colonies were screened on both DDO and QDO media (synthetic dropout medium lacking leucine, tryptophan, histidine, and adenine, denoted as -L/-T/-H/-A) to observe the self-activation activity of PpNAC036.

2.7. Real-Time Fluorescence Quantitative PCR

The RNA extraction from plant samples was performed using the RNAprep Pure Plant Plus Kit (Tiangen, Beijing, China), and the extracted RNA was subsequently tested. Subsequently, the first-strand cDNA synthesis was conducted using the TRUEscript RT Master Mix (Aidlab, Beijing, China) according to the manufacturer’s instructions. The primers for the target genes and the reference gene (Actin) are listed in Table A1. The experimental procedure was as follows: the qRT-PCR reaction program consisted of 95 °C for 60 s, followed by 45 cycles of 95 °C for 10 s, 58 °C for 10 s, and 72 °C for 10 s; the melting curve program was 95 °C for 10 s, 60 °C for 60 s, and 97 °C for 10 s. The 2−ΔΔCT method was used to calculate the relative gene expression levels. The experiment was repeated three times, and the average value was taken.

2.8. RNA Sequencing Analysis

Transcriptome sequencing was performed on PpNAC036-5, PpNAC036-7, and wild-type Arabidopsis plants by Novogene Co., Ltd. (Beijing, China). Genes with a false discovery rate (FDR) below 0.05 and | fold change| ≥ 2 were considered DEGs.

2.9. Data Processing and Analysis

In terms of experimental design, the experiment followed a completely randomized design, and all treatments were conducted in at least three independent biological replicates to ensure reproducibility. Statistical analyses were performed using IBM SPSS Statistics 25. To ensure the validity of the parametric tests, the normality of data distribution and homogeneity of variance were pre-tested. For comparisons among multiple groups, a one-way analysis of variance (ANOVA) was conducted, followed by Duncan’s multiple-range test to identify specific differences between treatment means. For comparisons between two independent groups, an unpaired Student’s t-test was employed. Data are presented as the mean ± standard error (SE); p < 0.05 was considered statistically significant.

3. Results

3.1. NAC036 Was Significantly Upregulated in PpSAUR5-Overexpressing Arabidopsis thaliana

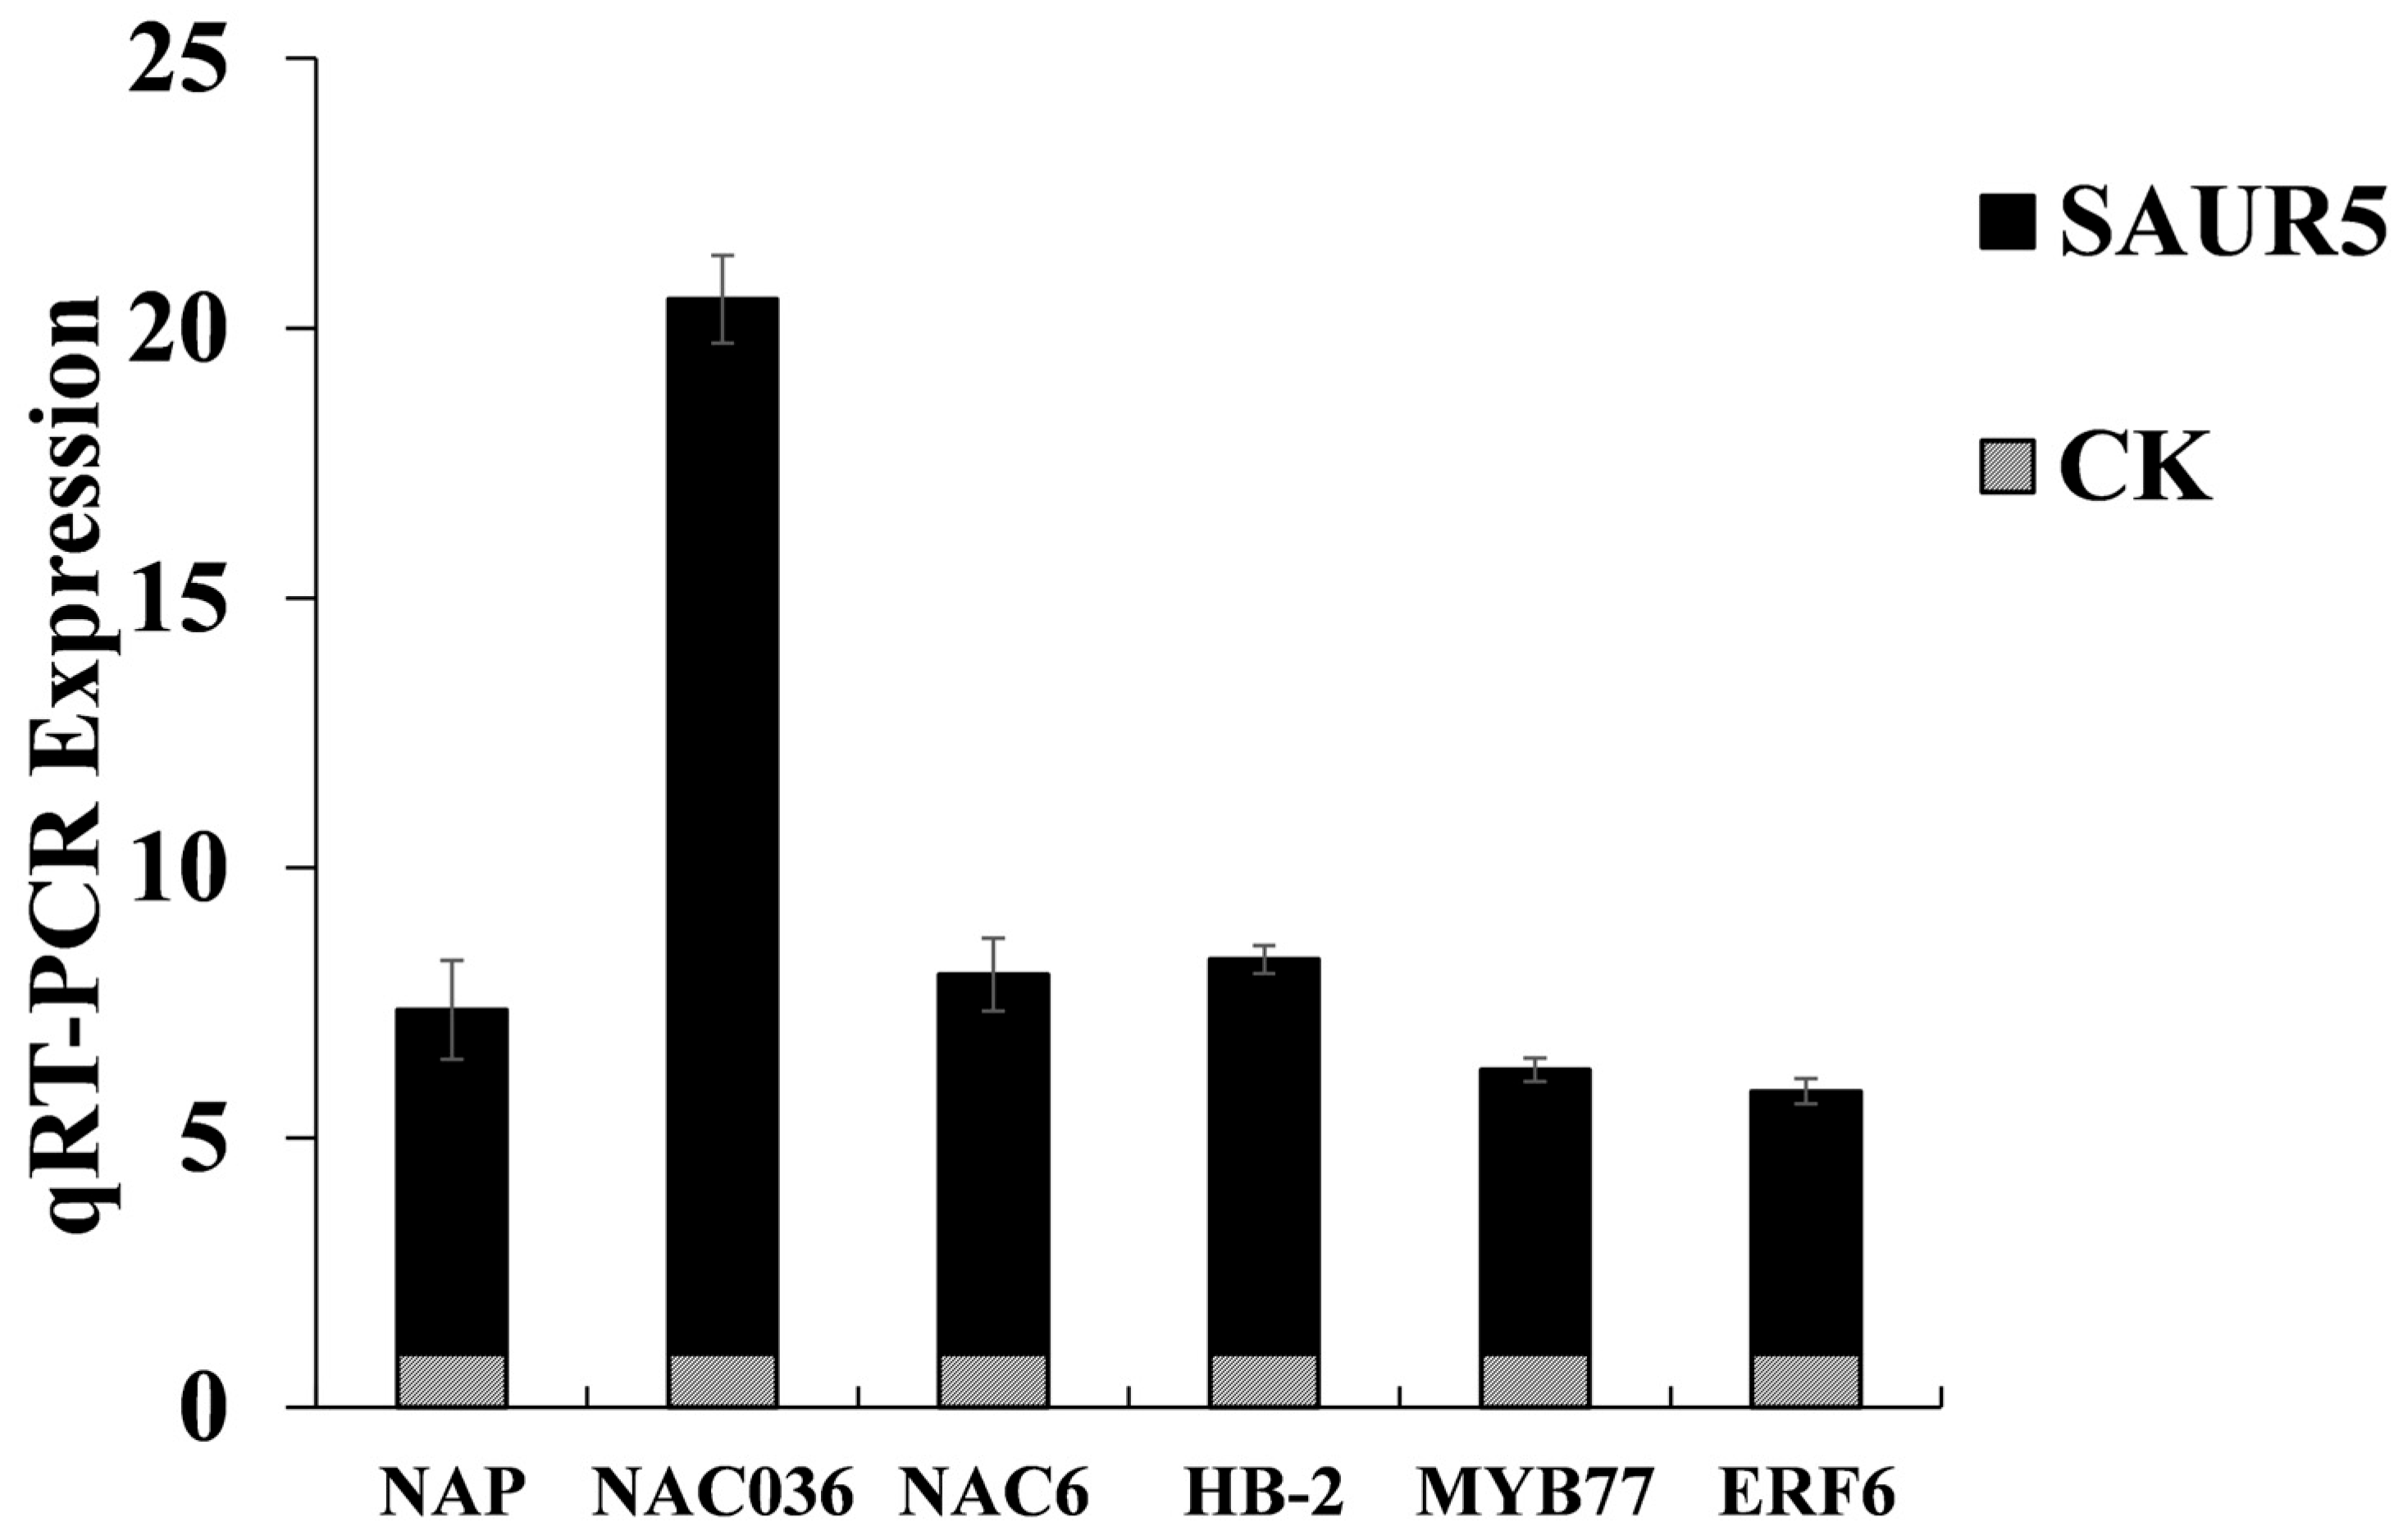
Previous laboratory studies found that PpSAUR5 is associated with plant vigor. To explore this relationship further, we analyzed the transcriptome data from Arabidopsis thaliana overexpressing PpSAUR5. Through this analysis, we identified six Arabidopsis genes related to plant growth: NAP, NAC036, NAC6, HB-2, MYB77, and ERF6. Subsequently, we conducted a qRT-PCR analysis. The results revealed that NAC036 expression was 19.5 times that of the control, higher than that of the other identified genes. Using NCBI, we identified a peach homolog of NAC036, named PpNAC036 (PRUPE_8G174800), and selected PpNAC036 as a candidate gene for further study (Figure A1).

3.2. PpNAC036 Responds to Plant Growth Regulators and Exhibits Transcriptional Self-Activation Activity

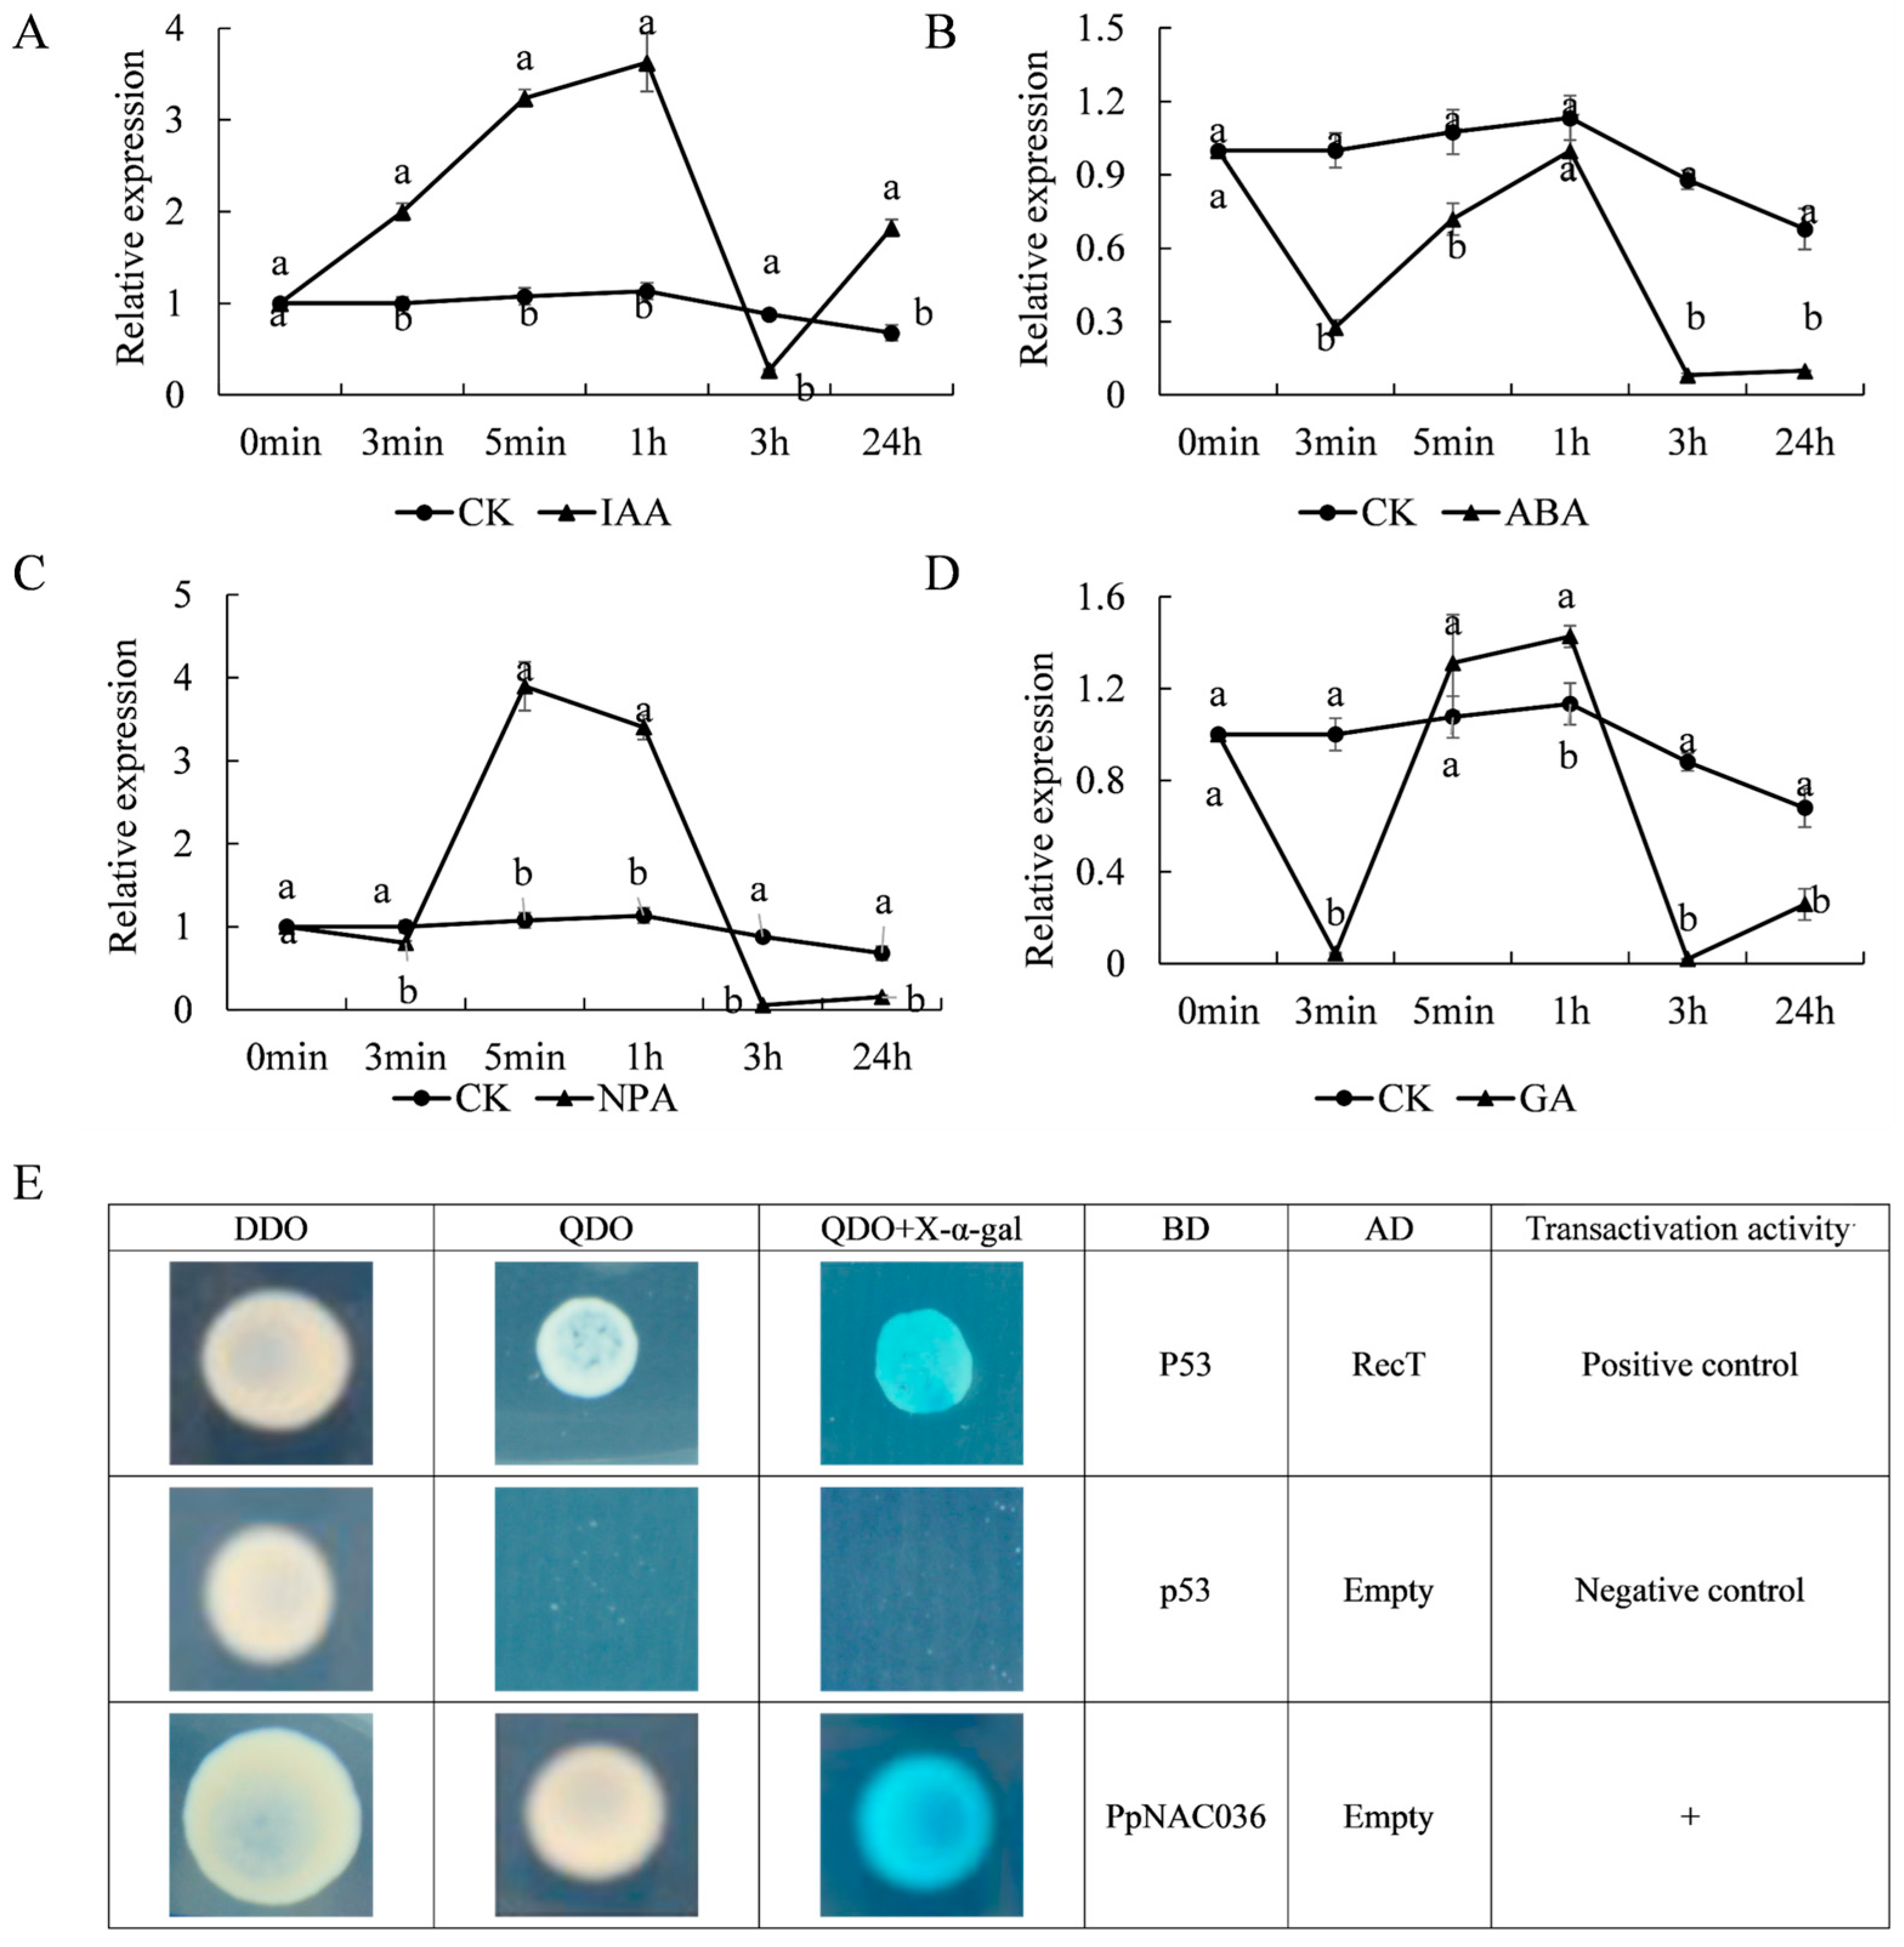
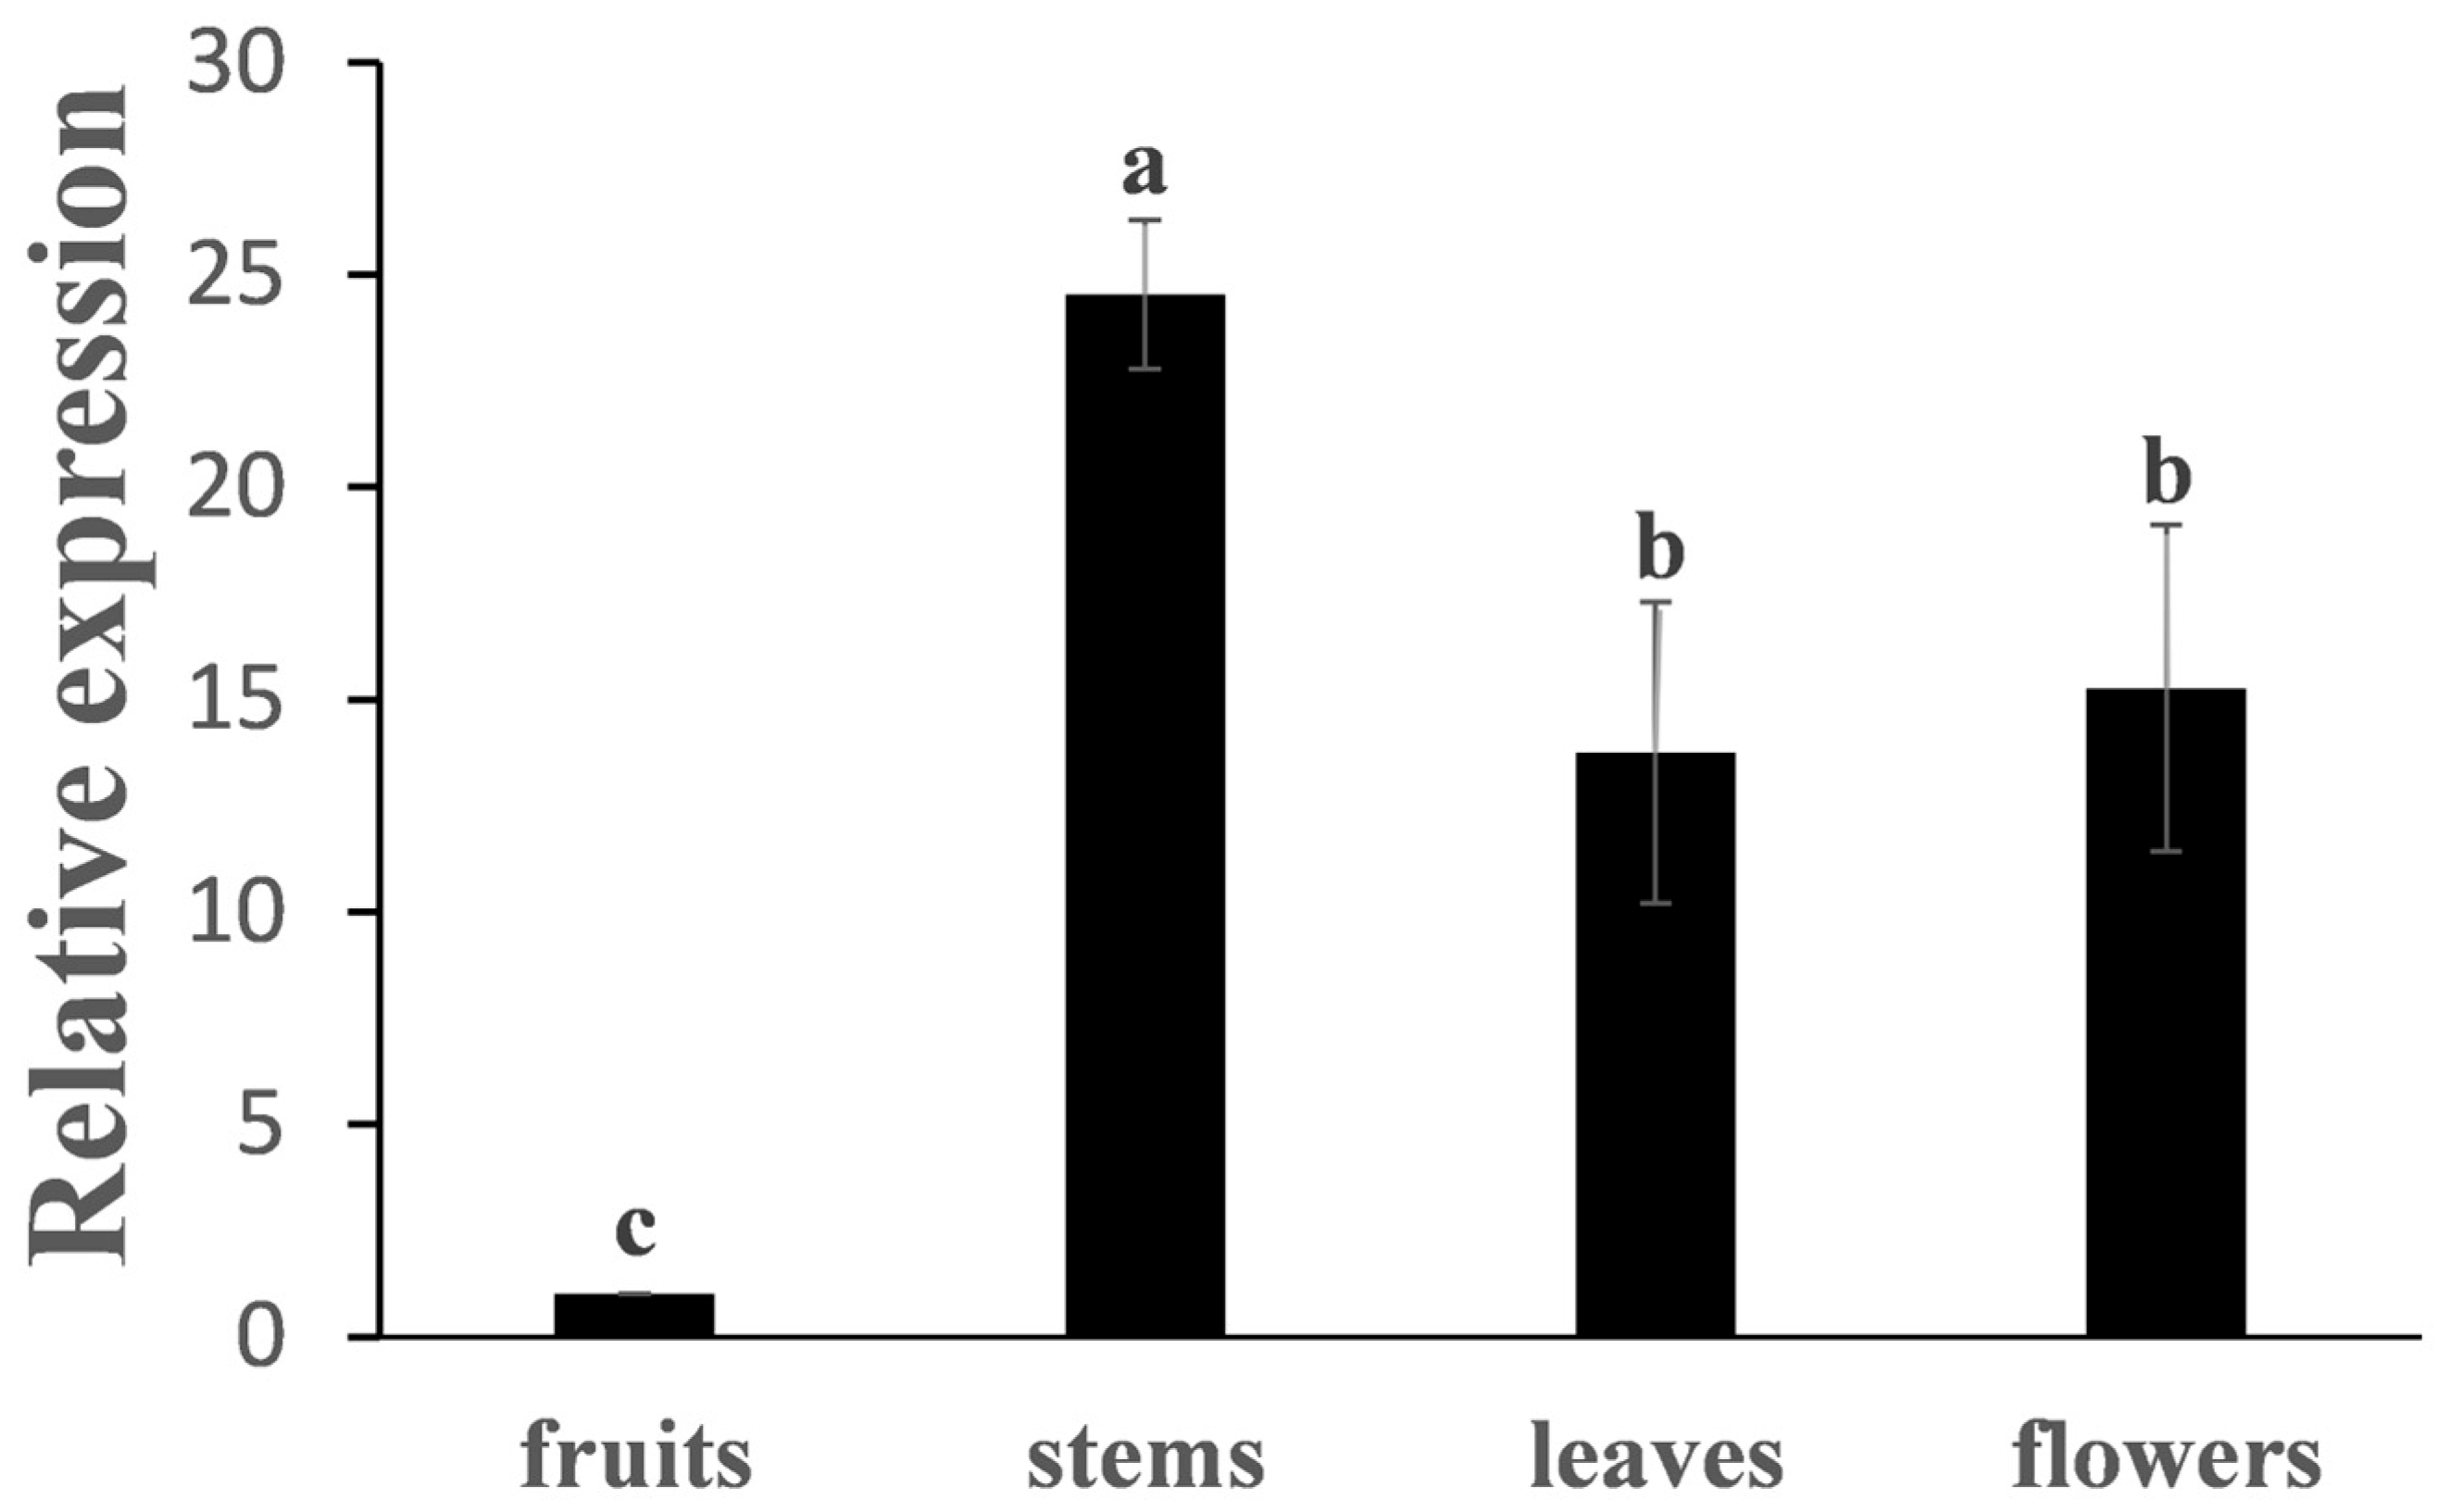
In this study, tissue expression analysis of PpNAC036 was performed in peach. The results showed that PpNAC036 expression was very low in fruits and relatively high in leaves and flowers, with the highest expression levels observed in stems (Figure A2). To investigate the response of peach PpNAC036 to plant growth regulators, we sprayed peach shoot apices with various hormones, collected samples, and performed qRT-PCR analysis after RNA extraction. The expression level of PpNAC036 increased rapidly, followed by a gradual decrease after IAA treatment. Specifically, the expression level increased sharply to 3.2-fold the control within 5 min and peaked at 3.6-fold after 1 h. In contrast, GA treatment induced an opposite expression pattern, characterized by an initial decline (0.04-fold of the control within 3 min), followed by a transient increase (1.4-fold at 1 h), and a subsequent rapid decrease to 0.02-fold at 3 h. Under NPA treatment, PpNAC036 expression reached its maximum (3.9-fold the control) at 5 min, then gradually declined to its lowest level (0.06-fold) at 3 h, showing an overall trend of initial upregulation followed by downregulation. For ABA treatment, the expression levels were comparable to the control at 1 h, but consistently lower at other time points. These data demonstrate that treatments with plant growth regulators induce a rapid and sustained response in PpNAC036, which persists for at least 24 h (Figure 1A–D).
For transcriptional activation analysis, the recombinant plasmid pGBT-PpNAC036 was co-transformed with pGAD424 into yeast cells, which were then plated on DDO medium. After that, the colonies were subsequently streaked onto DDO and QDO media for selection. The results showed that pGBT-PpNAC036 + AD grew normally on DDO medium, confirming successful yeast transformation. On QDO + X-α-gal medium, the colonies exhibited normal growth and turned blue, indicating that PpNAC036 possesses transcriptional self-activation activity (Figure 1E).

3.3. PpNAC036 Inhibits Arabidopsis Root Growth by Altering Plant Sensitivity to Growth Regulators

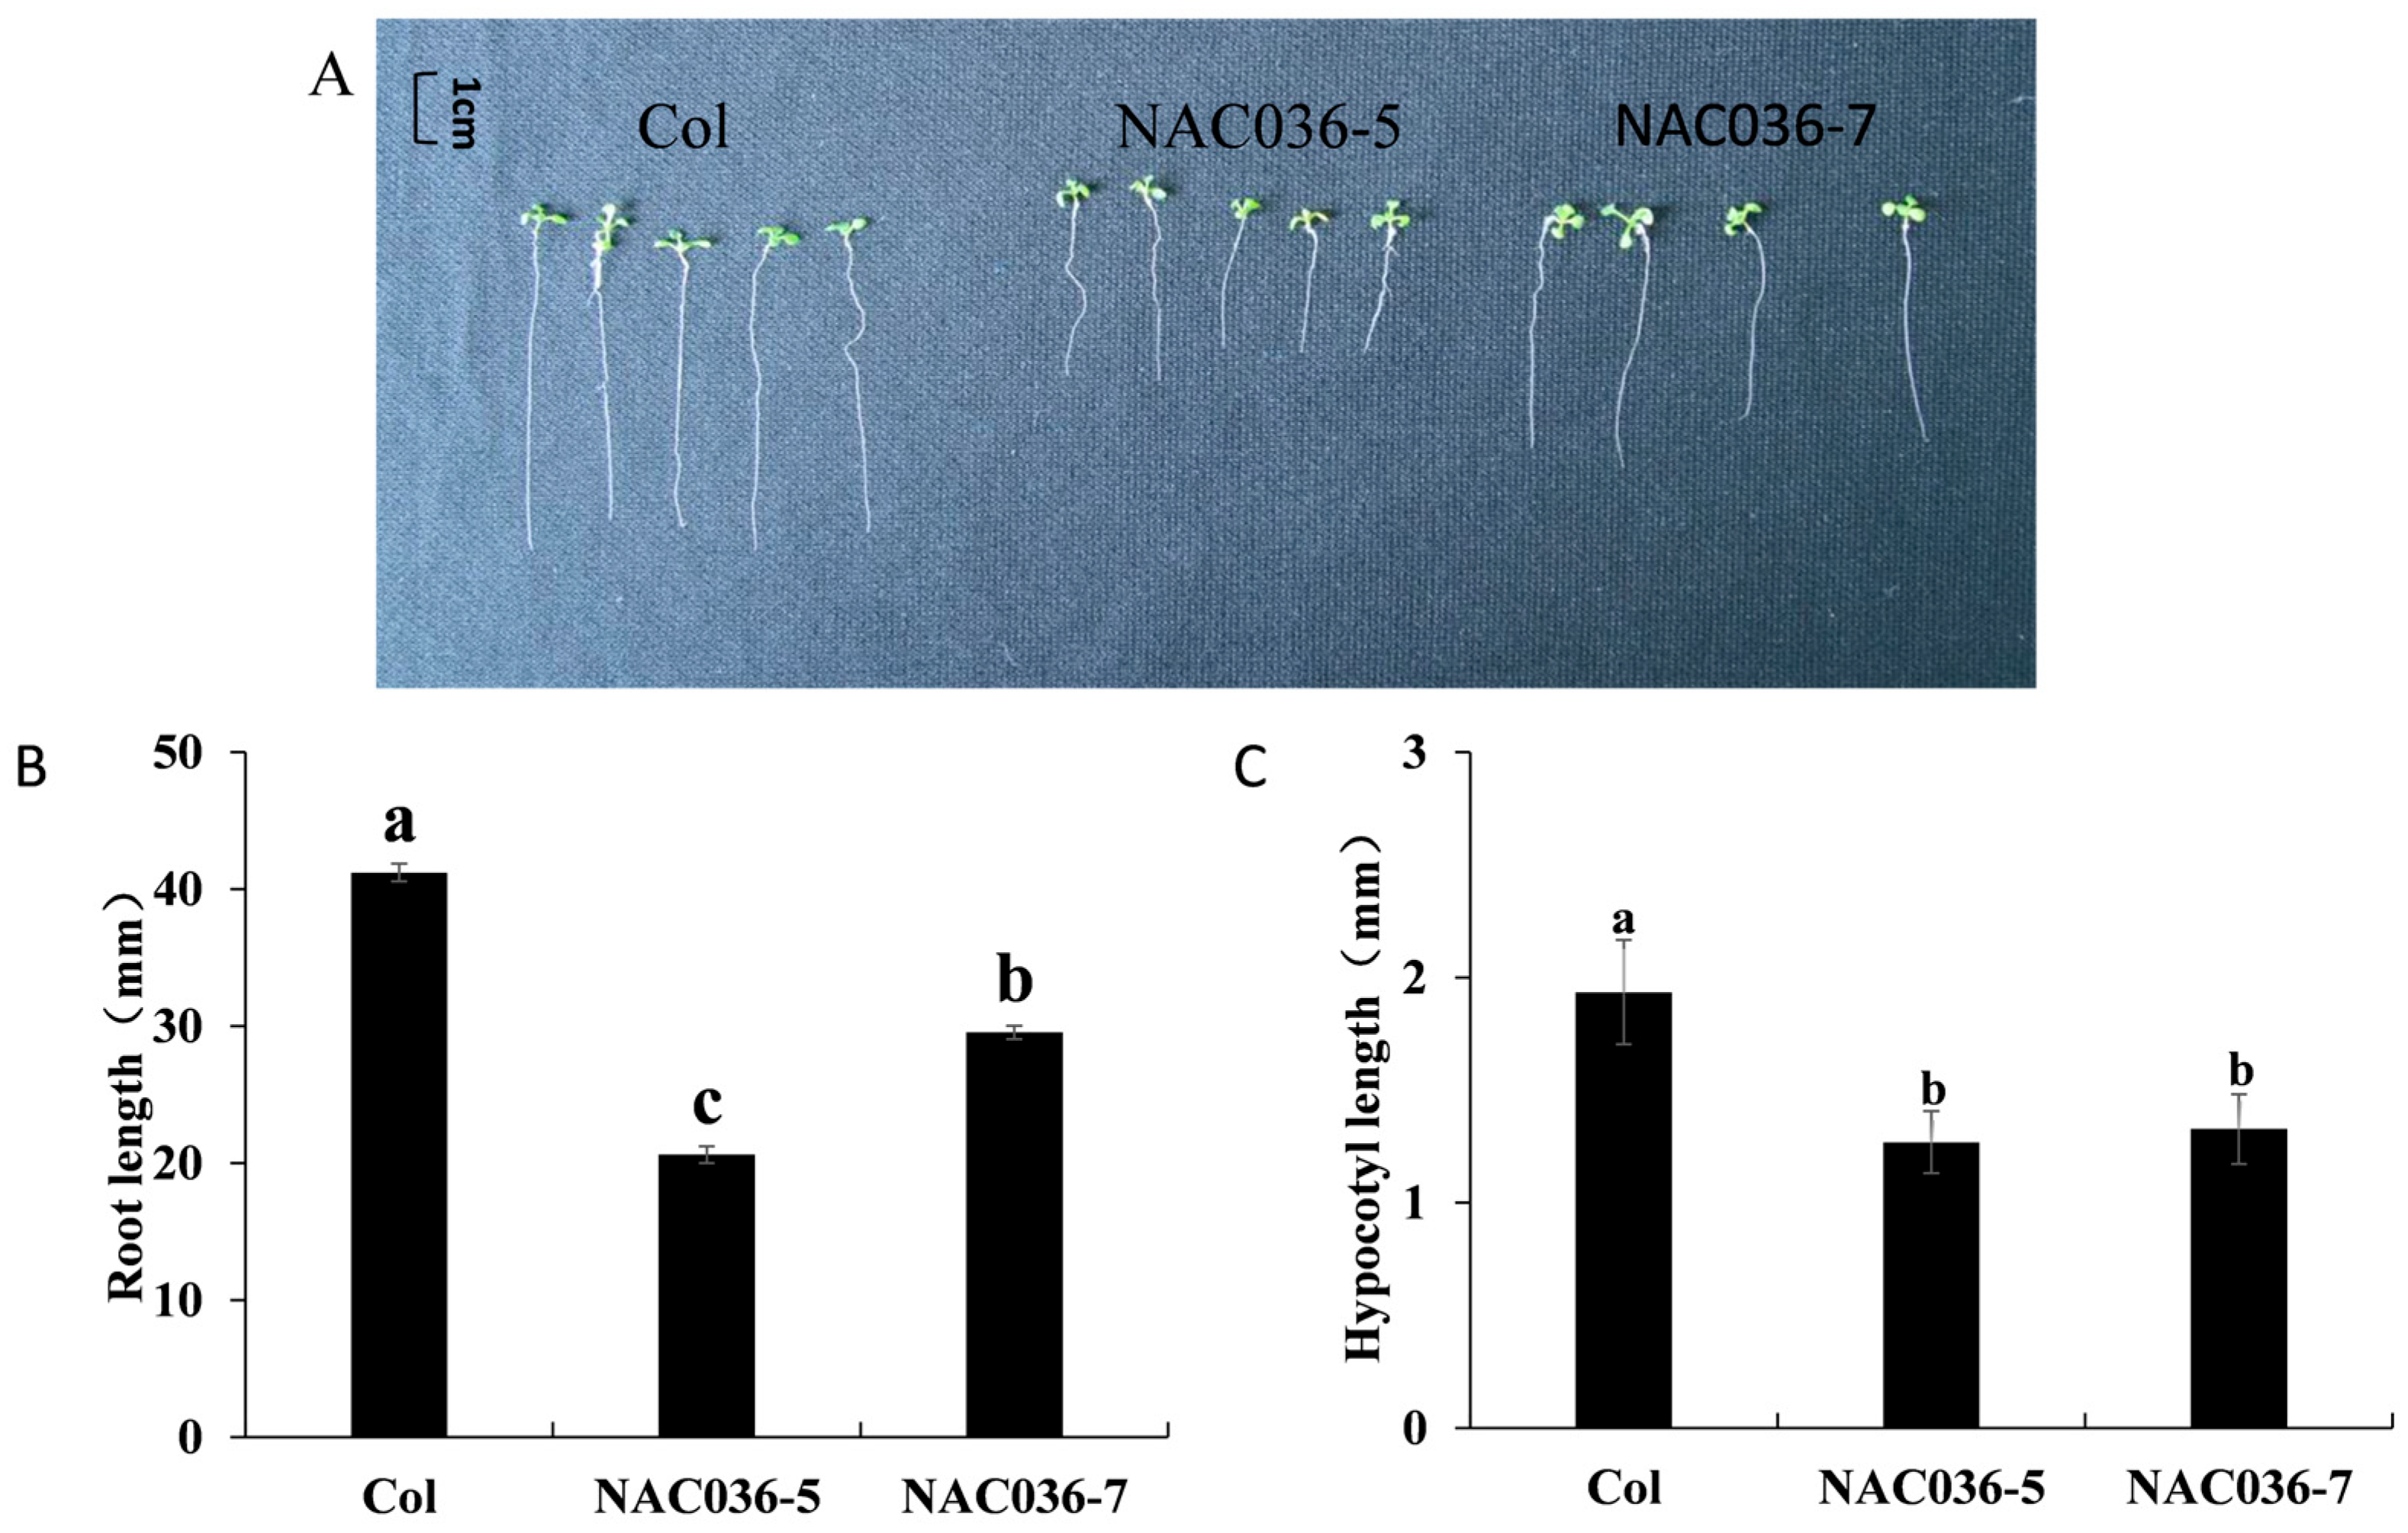
To examine whether PpNAC036 affects organ elongation in Arabidopsis, seeds of the wild-type (Col-0) and PpNAC036-overexpressing lines were sown on MS medium and vertically cultivated in a culture chamber for 7 days. Subsequently, the lengths of roots and hypocotyls were measured. Root lengths of Col-0, PpNAC036-5, and PpNAC036-7 were 41.2 mm, 20.62 mm, and 29.56 mm, respectively. Compared to the Col-0, the root lengths of PpNAC036-overexpressing lines were significantly reduced: by 50% in PpNAC036-5 and 28% in PpNAC036-7 (Figure 2A,B). Hypocotyl lengths of Col-0, PpNAC036-5, and PpNAC036-7 were 1.9 mm, 1.2 mm, and 1.3 mm, respectively, representing reductions of 36.8% and 31.6% in the overexpression lines (Figure 2C).
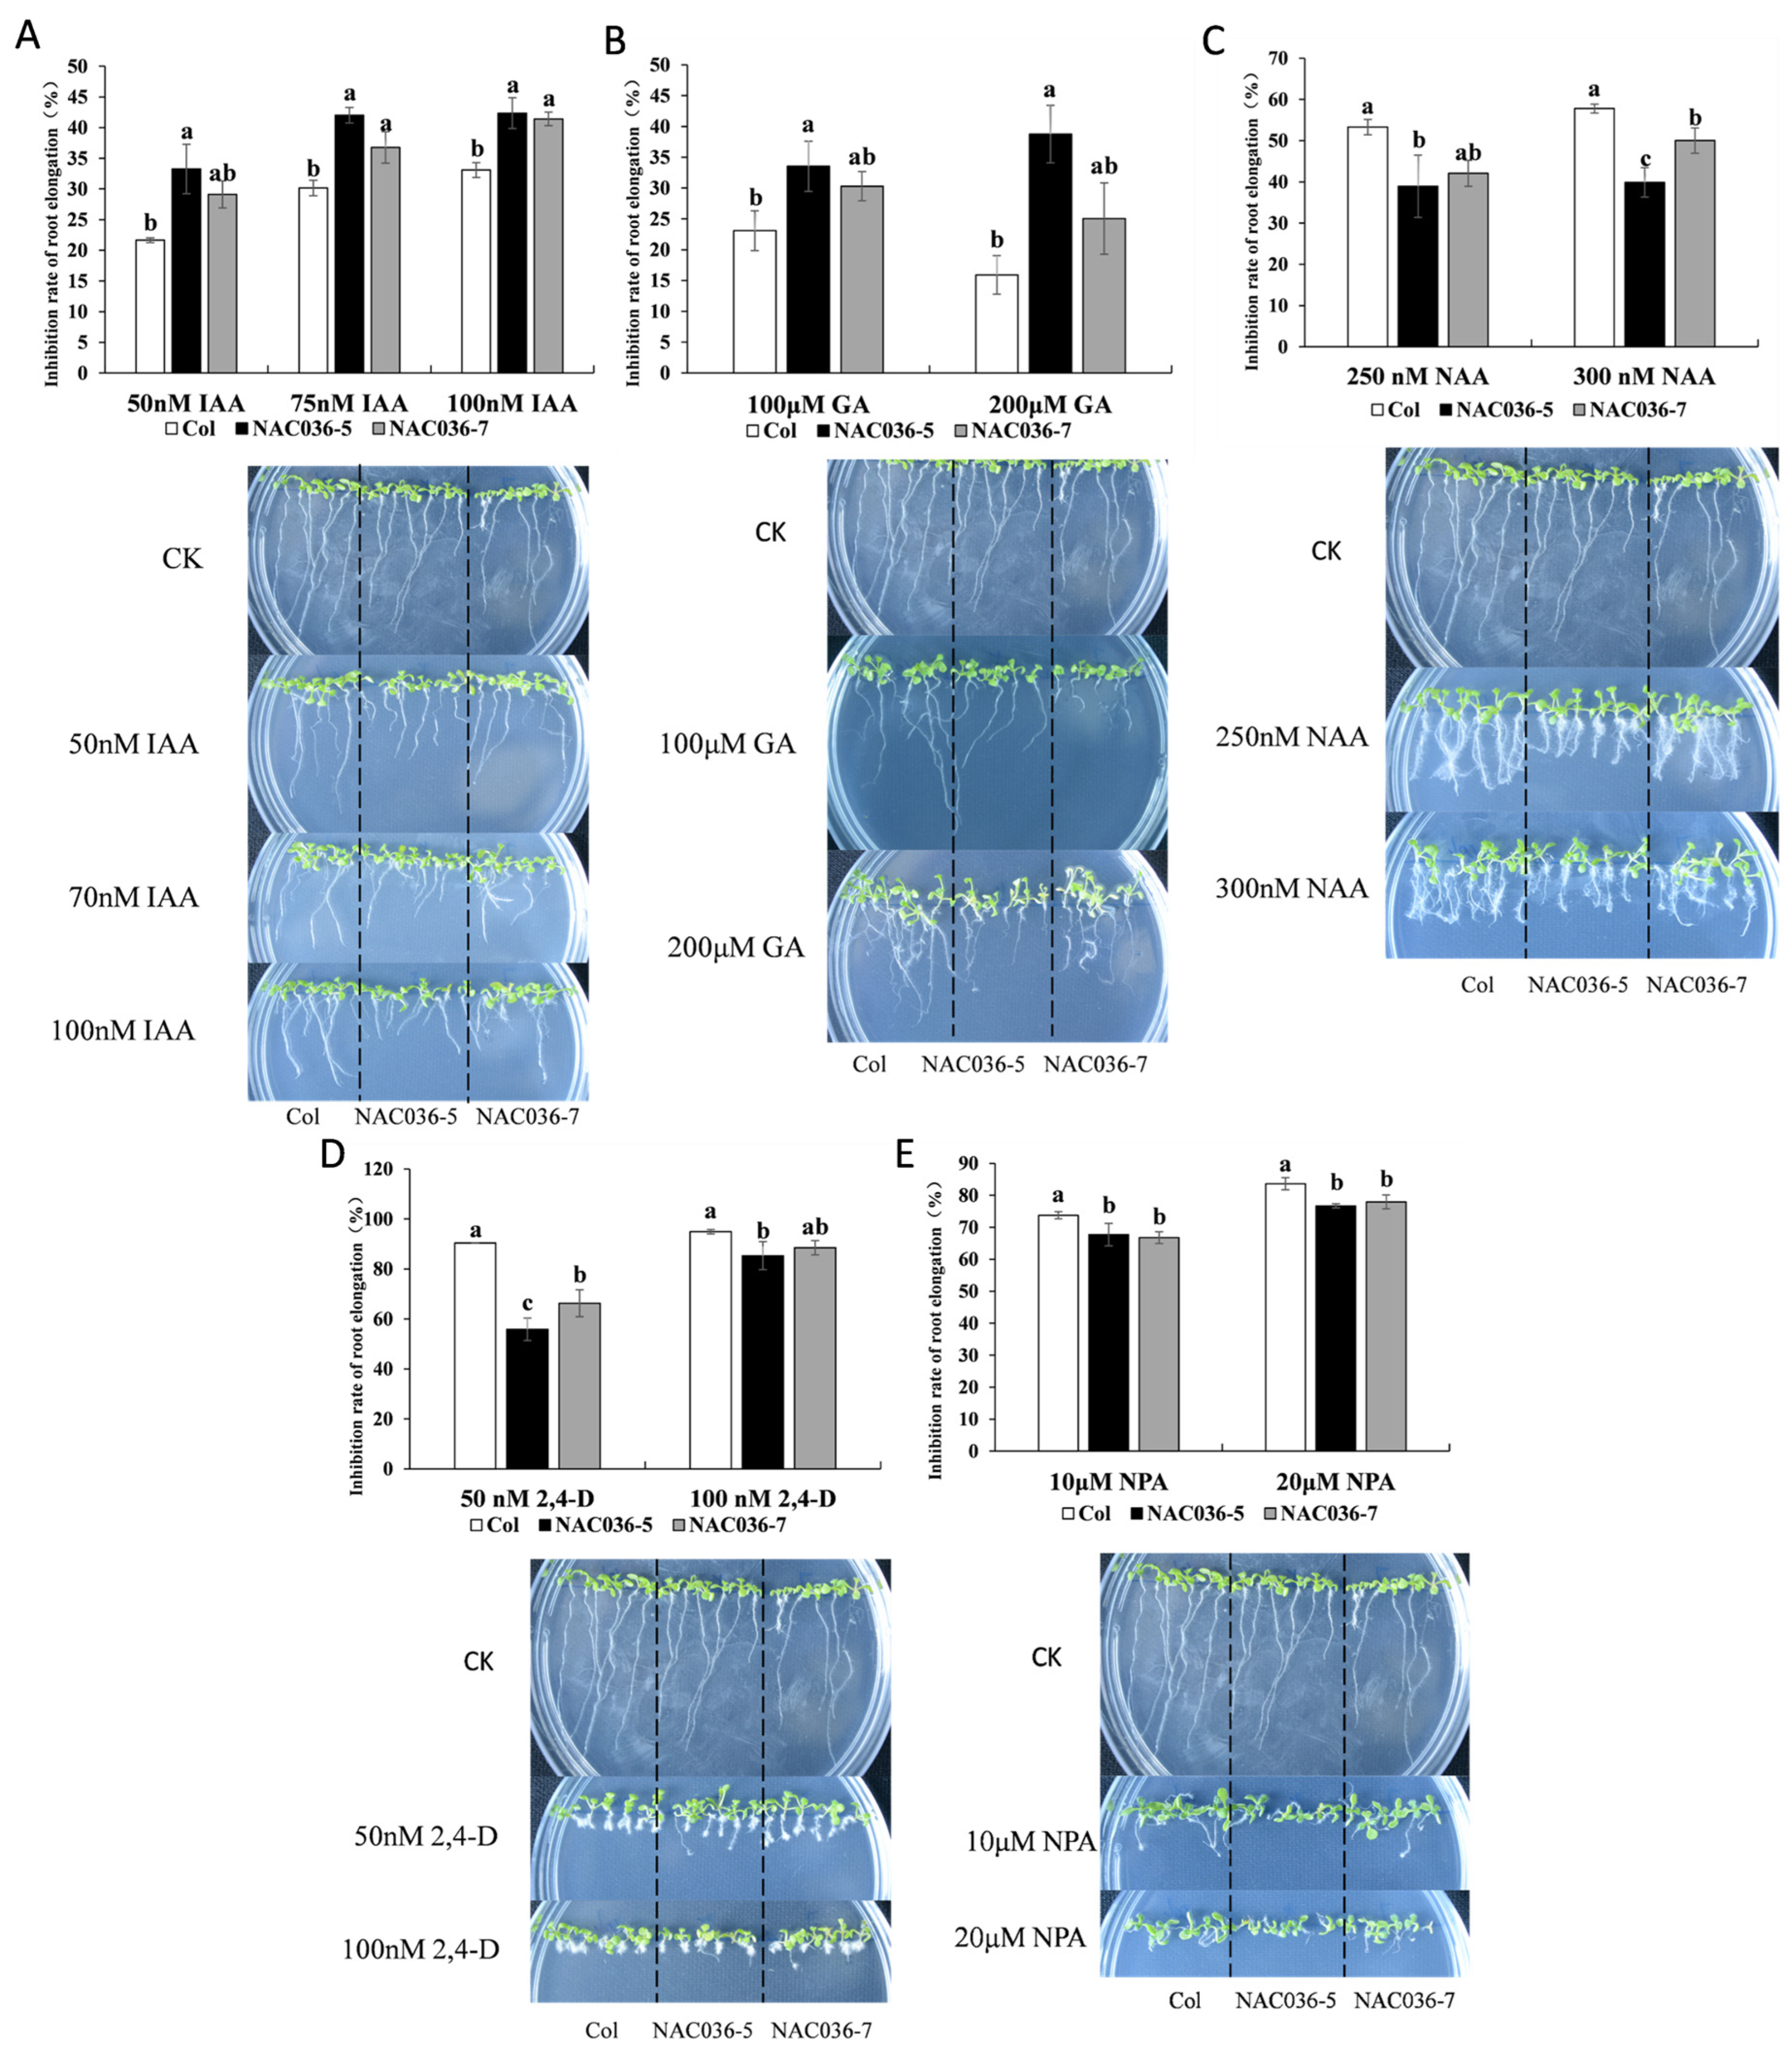
After treatment of peach leaves with plant growth regulators, PpNAC036 was found to be responsive to the treatment. To validate the responsiveness of PpNAC036 to growth regulators observed in peach leaves, Col-0 and transgenic Arabidopsis lines were treated with varying concentrations of IAA, GA, NPA, NAA, and 2,4-D. The results demonstrated that the PpNAC036-overexpressing lines exhibited substantially enhanced sensitivity to IAA and GA compared to Col-0 (Figure 3A,B). Under 50 nM IAA treatment, the root growth inhibition rates in transgenic lines increased significantly. Specifically, the inhibition rate increased by 11% in PpNAC036-5 and 7% in PpNAC036-7. At 75 nM IAA, the inhibition rates were higher than those at 50 nM, but the increases remained nearly unchanged (11% and 6%, respectively). At 100 nM IAA, the inhibition rates in the overexpression lines rose to 9% (PpNAC036-5) and 8% (PpNAC036-7), with diminished rate increments compared to lower concentrations. Under 100 μM GA treatment, the root growth inhibition rates in the overexpression lines increased by 10% (PpNAC036-5) and 7% (PpNAC036-7), and further elevated to 22% and 9% at 200 μM GA, respectively. In contrast, the PpNAC036-overexpressing plants showed significantly reduced sensitivity to NAA, NPA, and 2,4-D (Figure 3C–E). At 250 nM NAA, the root growth inhibition rates decreased by 14% (PpNAC036-5) and 11% (PpNAC036-7) compared to Col-0. At 300 nM NAA, the inhibition rates were reduced by 17% and 7%, respectively. In 10 μM NPA medium, the inhibition rates decreased by 6% (PpNAC036-5) and 7% (PpNAC036-7). At 20 μM NPA, the reductions were 6% and 5%, respectively. Under 50 nM 2,4-D treatment, inhibition rates dropped markedly: by 34% (PpNAC036-5) and 24% (PpNAC036-7). At 100 nM 2,4-D, the inhibition rates were further reduced by 9% and 6%, respectively.

3.4. PpNAC036 Facilitates Plant Growth via the Regulation of Endogenous Phytohormone Levels

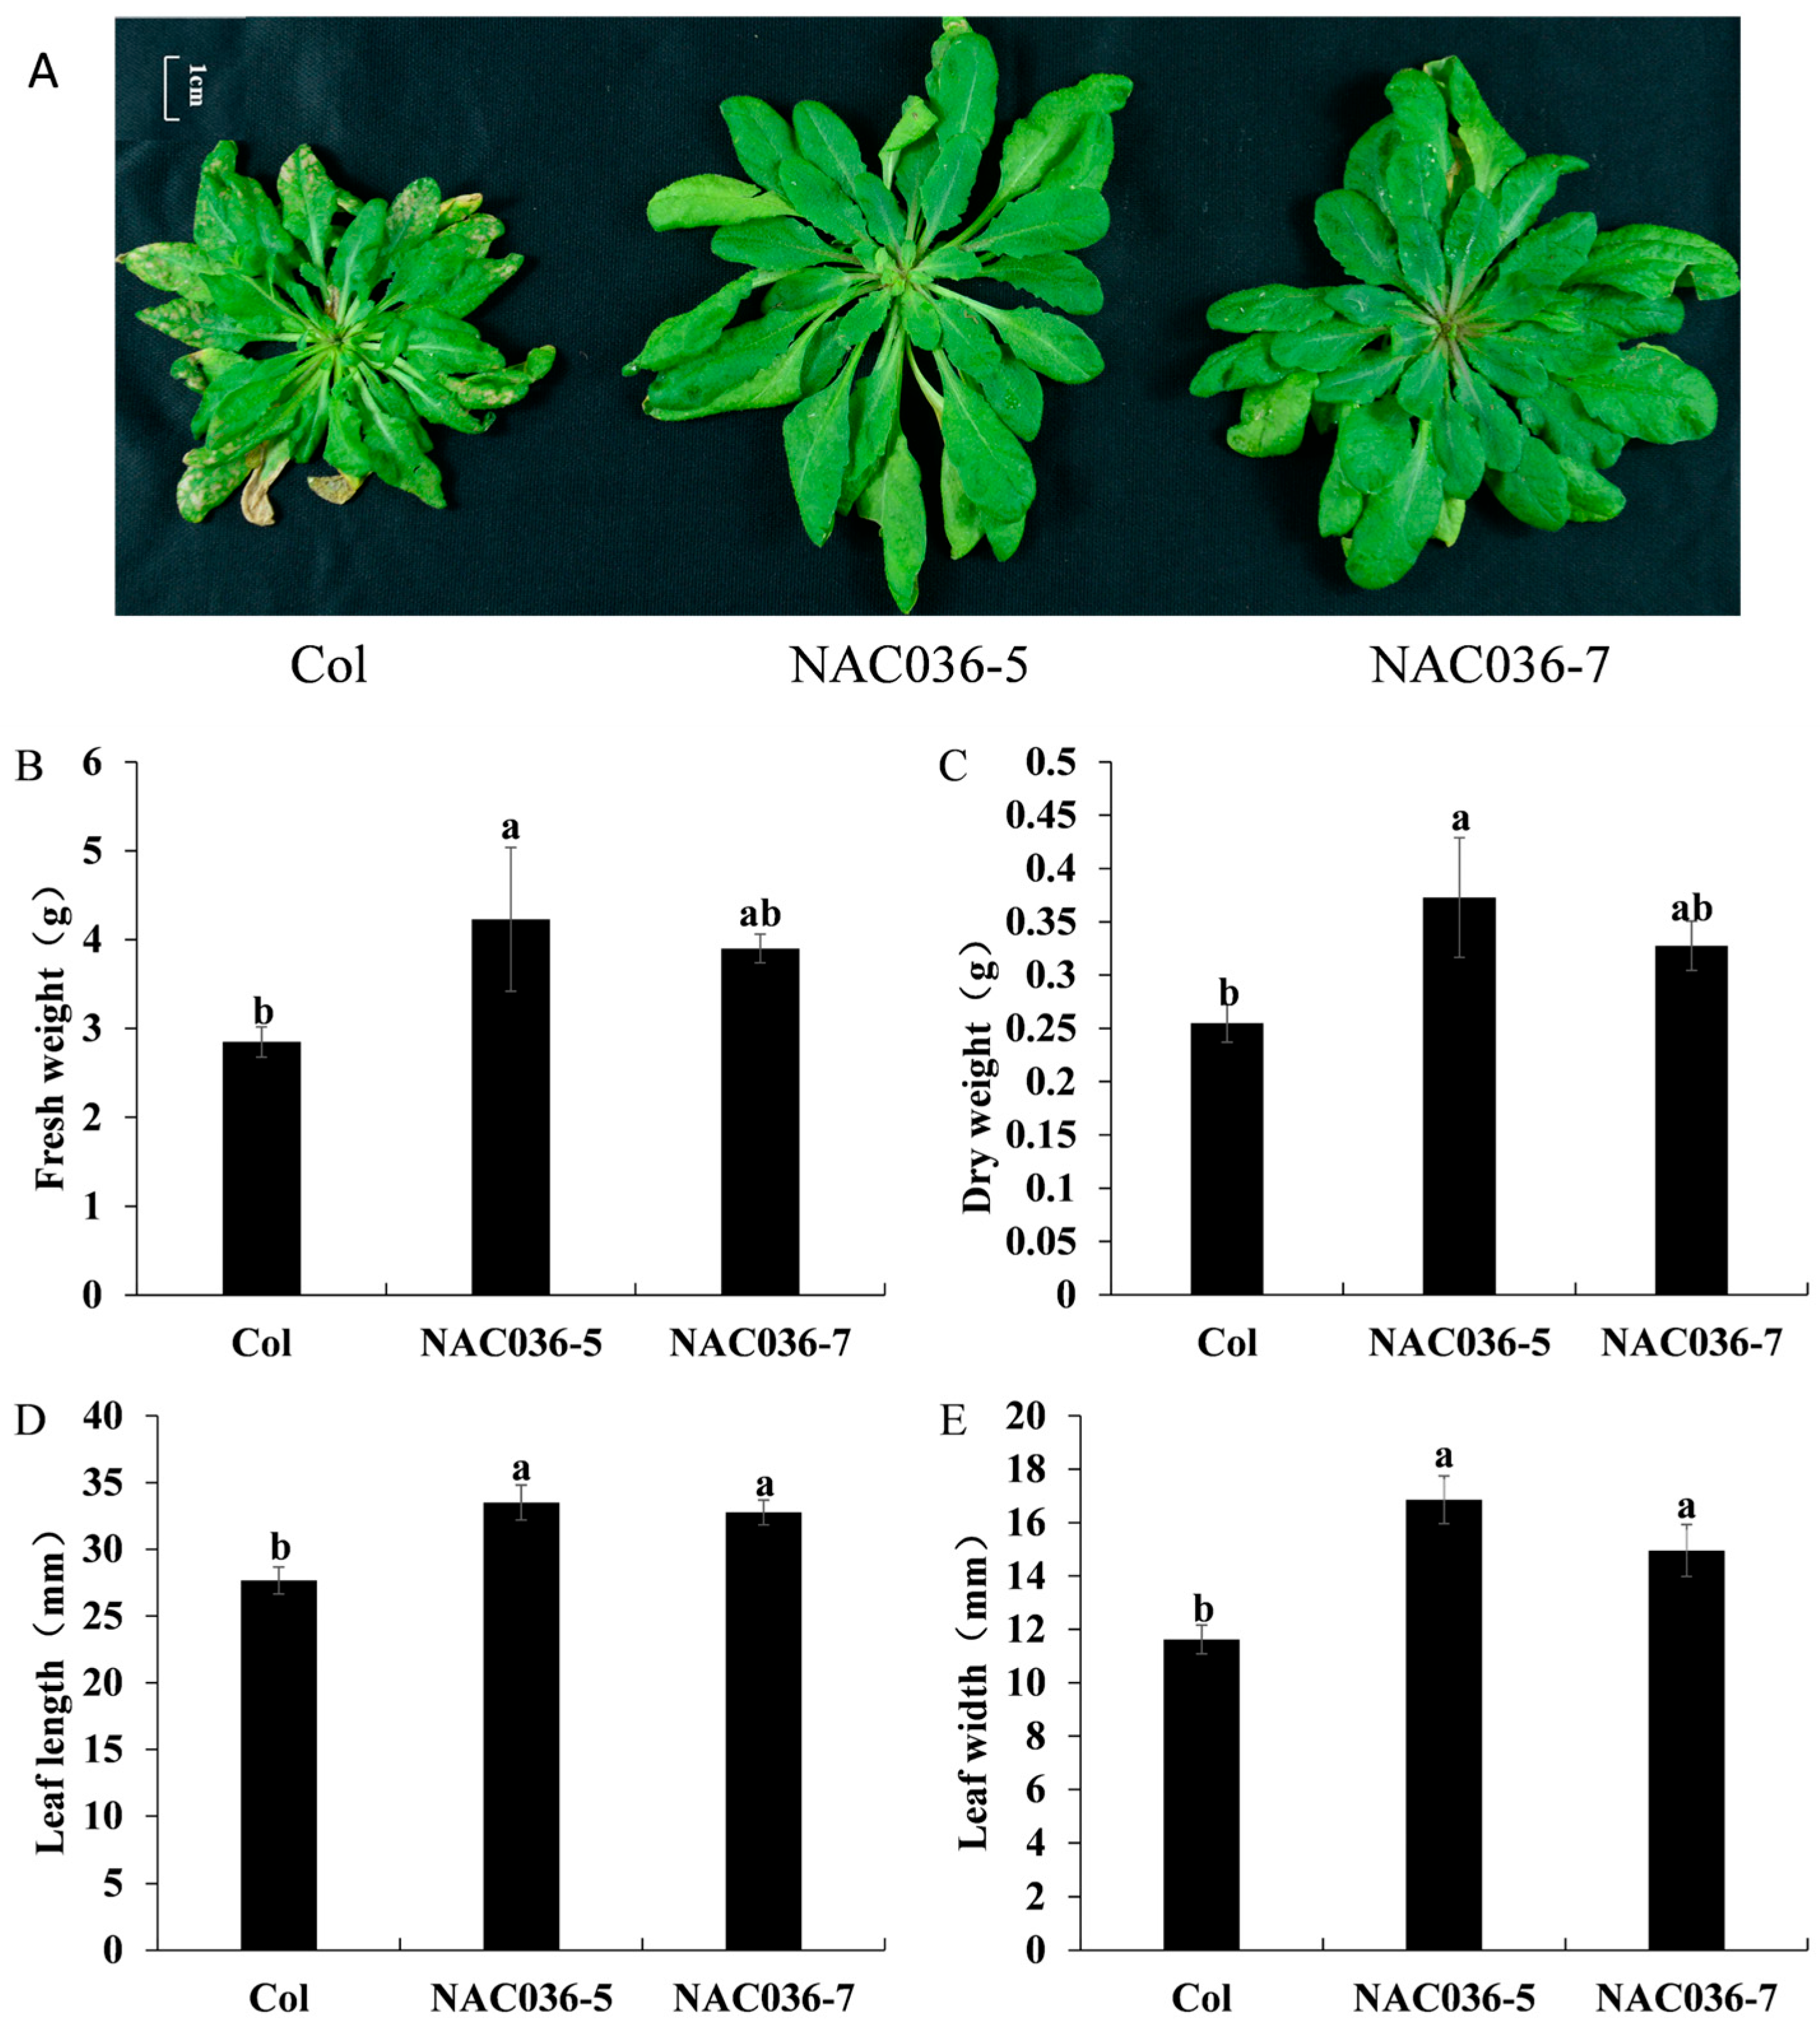
To investigate the effects of PpNAC036 overexpression on plant growth, wild-type (Col-0) and two transgenic lines (PpNAC036-5 and PpNAC036-7) were cultivated under short-day conditions for 30 days. Subsequently, we conducted phenotypic observations and measured leaf length, leaf width, fresh weight, and dry weight. The results demonstrated that Arabidopsis plants overexpressing PpNAC036 exhibited significantly enlarged basal rosette leaves compared to the wild type (Figure 4A). Subsequent quantitative analyses revealed that Col-0 biomass was lower than that of the transgenic lines, with PpNAC036-5 and PpNAC036-7 showing 48% and 37% increases in fresh weight, respectively (Figure 4B), and 46% and 29% increases in dry weight, respectively (Figure 4C). Leaf length measurements recorded 27 mm, 33 mm, and 32 mm for Col-0, PpNAC036-5, and PpNAC036-7, respectively, while leaf widths were 11 mm, 16 mm, and 14 mm, respectively, indicating significantly larger leaves in PpNAC036-overexpressing plants compared to the wild type (Figure 4D,E). These findings collectively demonstrate that PpNAC036 overexpression markedly enhances vegetative growth in transgenic Arabidopsis.
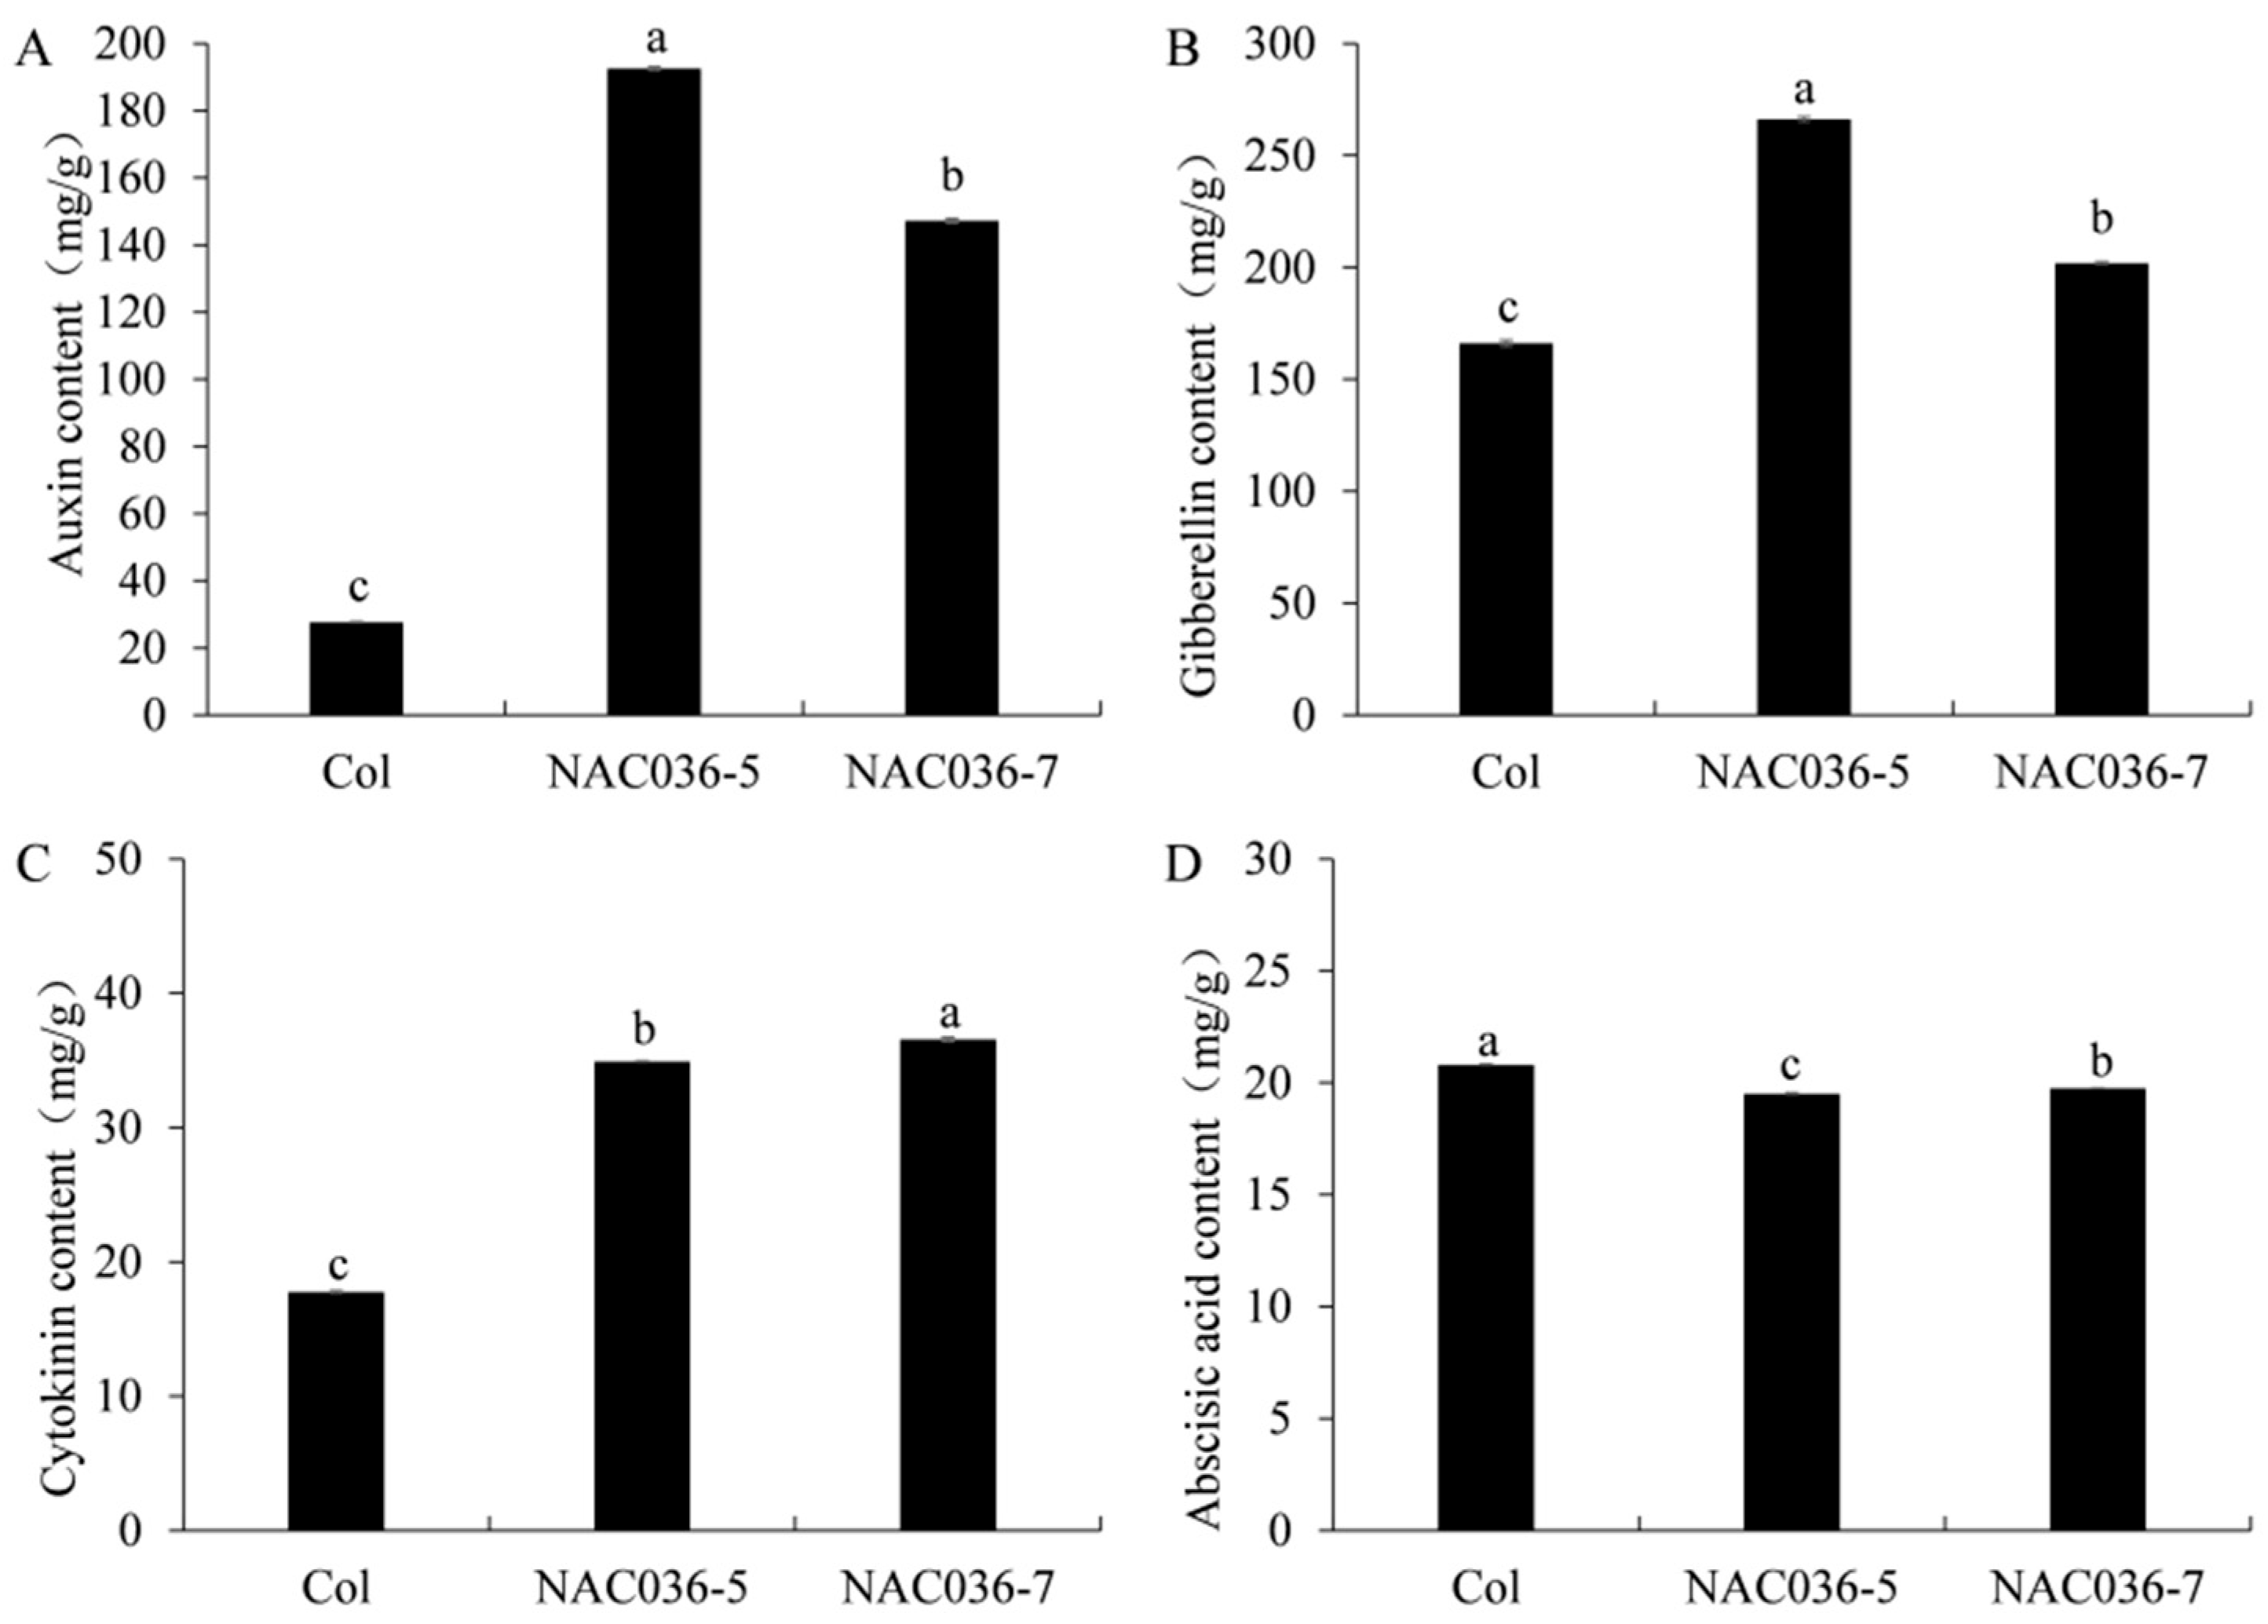
Given the crucial regulatory roles of phytohormones in plant development, we further examined the endogenous hormone levels in the 30-day-old leaves of wild-type and transgenic plants using high-performance liquid chromatography (HPLC). As shown in Figure A3, PpNAC036-overexpressing plants displayed significantly elevated concentrations of auxin, gibberellin, and cytokinin, along with a reduced abscisic acid (ABA) content compared to Col-0. Specifically, auxin levels reached 192 mg/g and 147 mg/g in PpNAC036-5 and PpNAC036-7, respectively, representing approximately 7-fold increases relative to the wild-type value of 27 mg/g (Figure A3A). Gibberellin content increased by 60% and 22% (Figure A3B). For cytokinin, levels rose by 97% and 106% in PpNAC036-5 and PpNAC036-7, respectively (Figure A3C). Conversely, the ABA content decreased by 6% and 5% in PpNAC036-5 and PpNAC036-7, respectively (Figure A3D). These results suggest that PpNAC036 overexpression may regulate endogenous phytohormone homeostasis, thereby promoting plant growth.

3.5. PpNAC036 Promotes Stem Radial Expansion in Arabidopsis thaliana by Transcriptionally Activating Lignin Biosynthetic Genes Thereby Driving Lignin Deposition

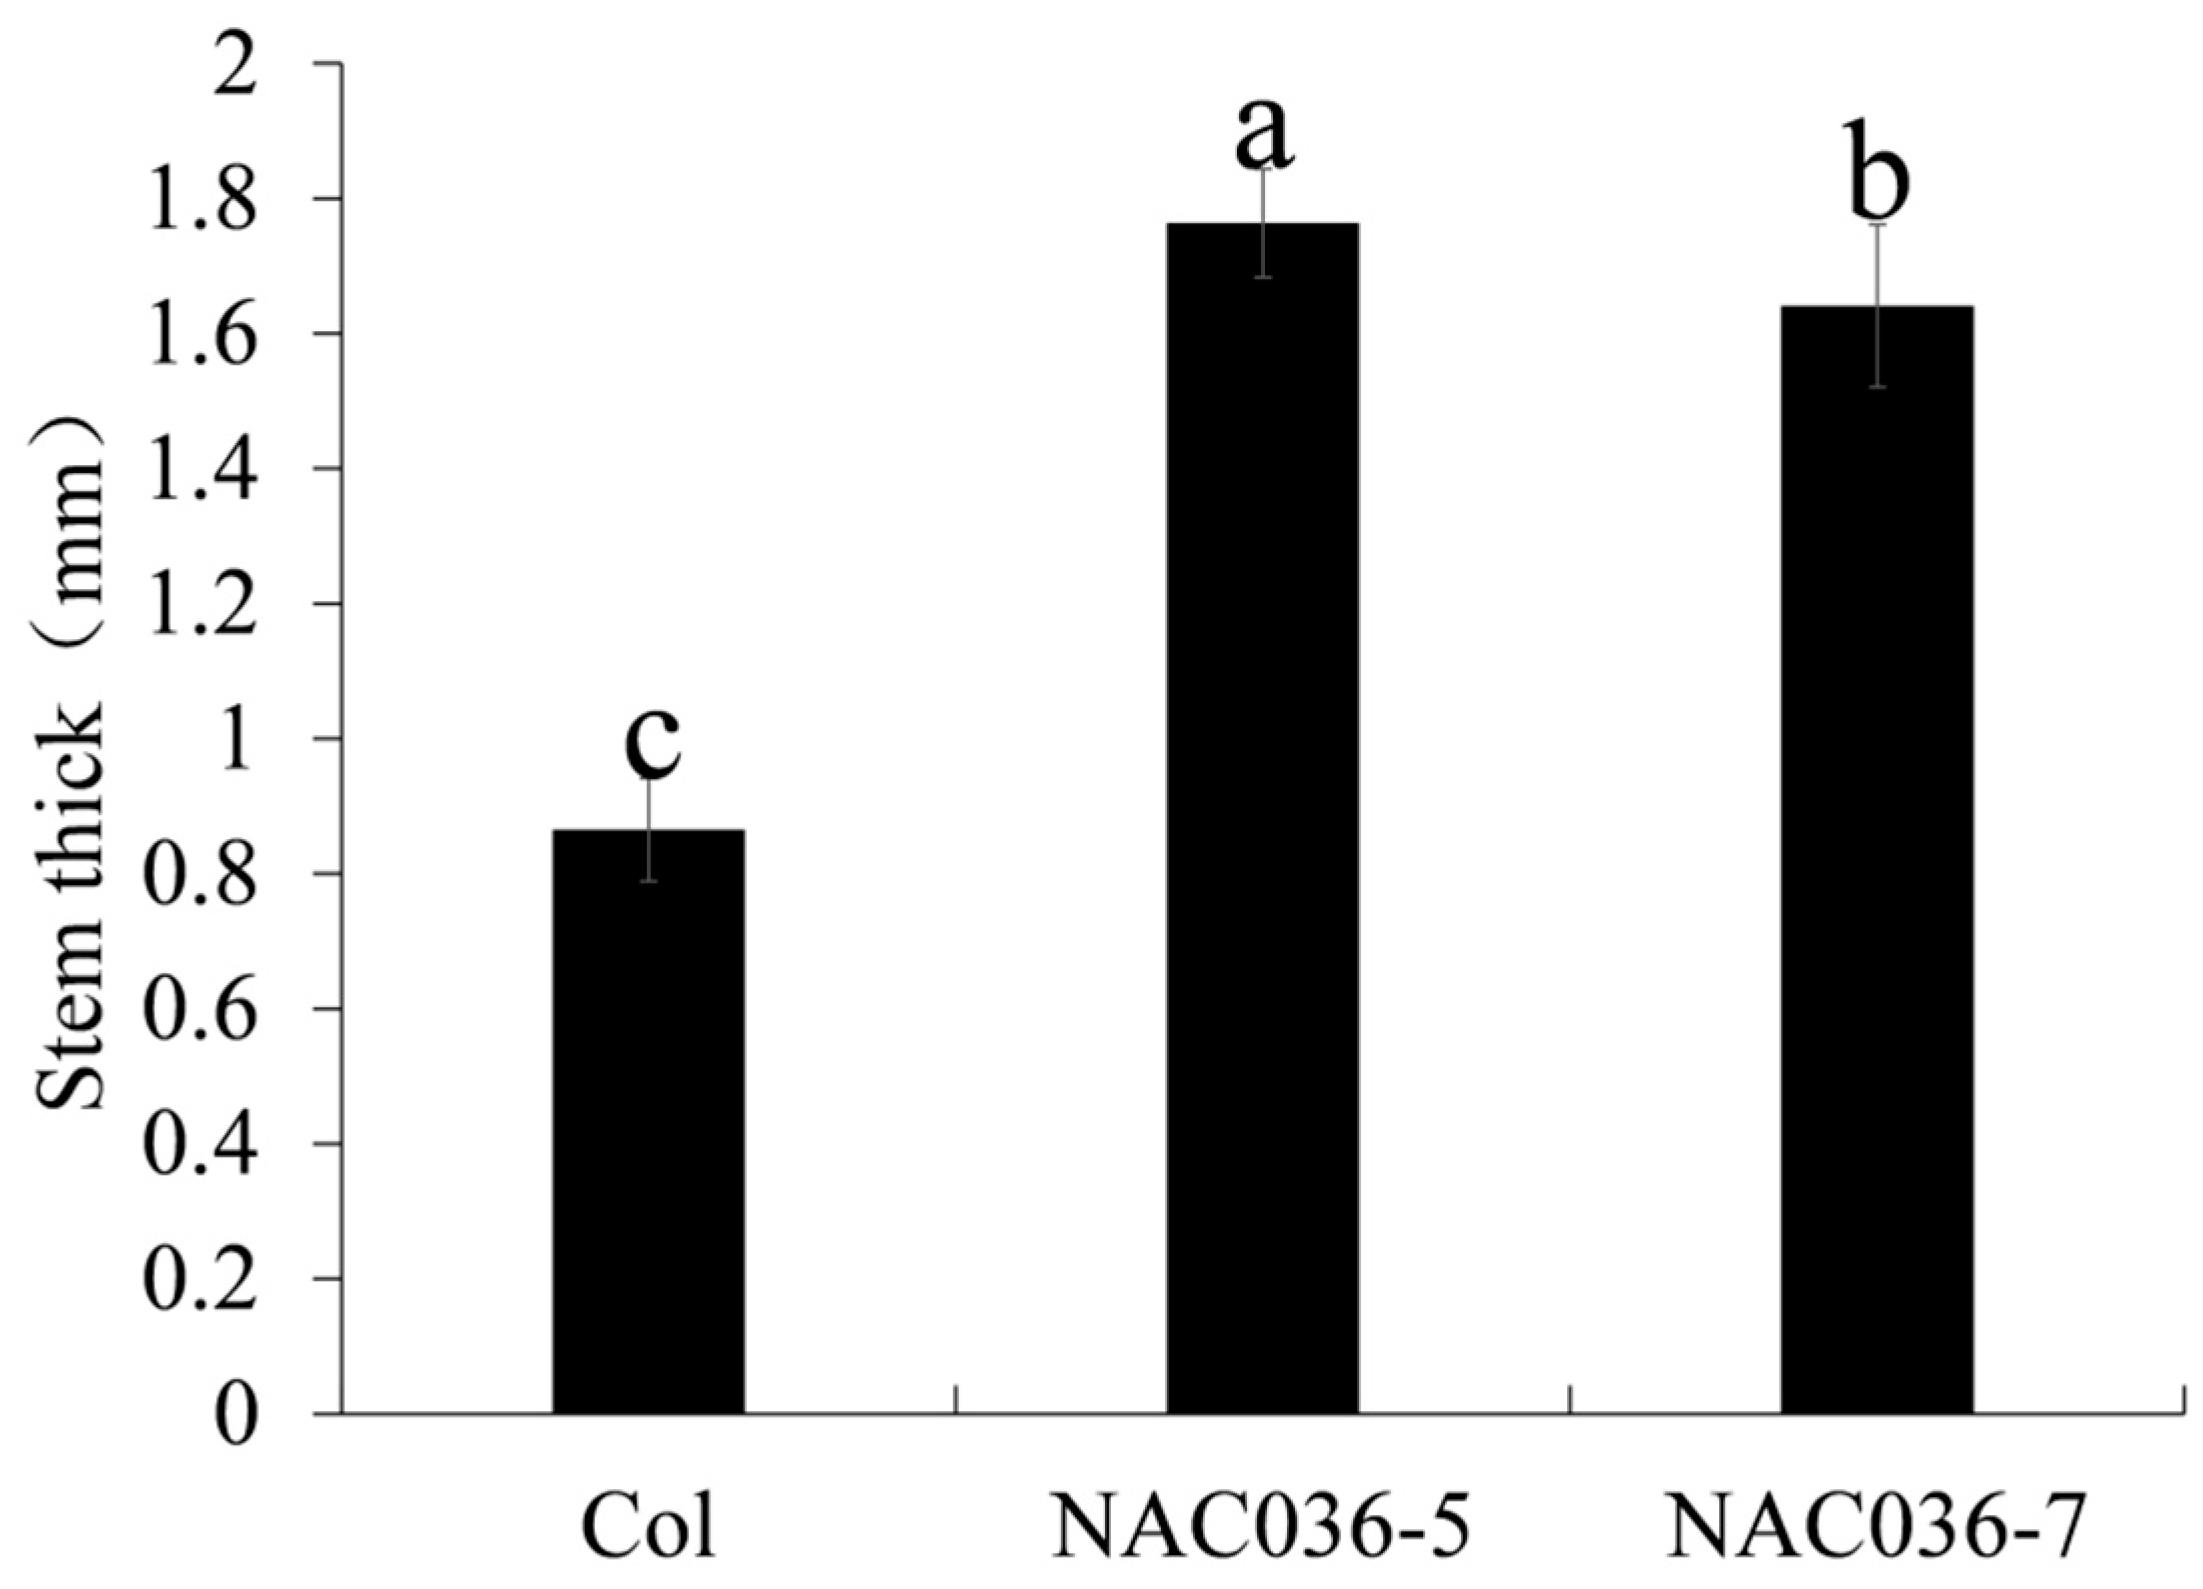
At 60 days post-germination, stem diameters of wild-type (Col-0) and PpNAC036-overexpressing Arabidopsis thaliana plants were measured. For this measurement, 20 randomly selected individuals from each line were used. The Col-0 control exhibited an average stem diameter of 0.8 mm. In contrast, the overexpression lines showed significantly increased diameters of 1.7 mm and 1.6 mm, respectively (Figure A4).
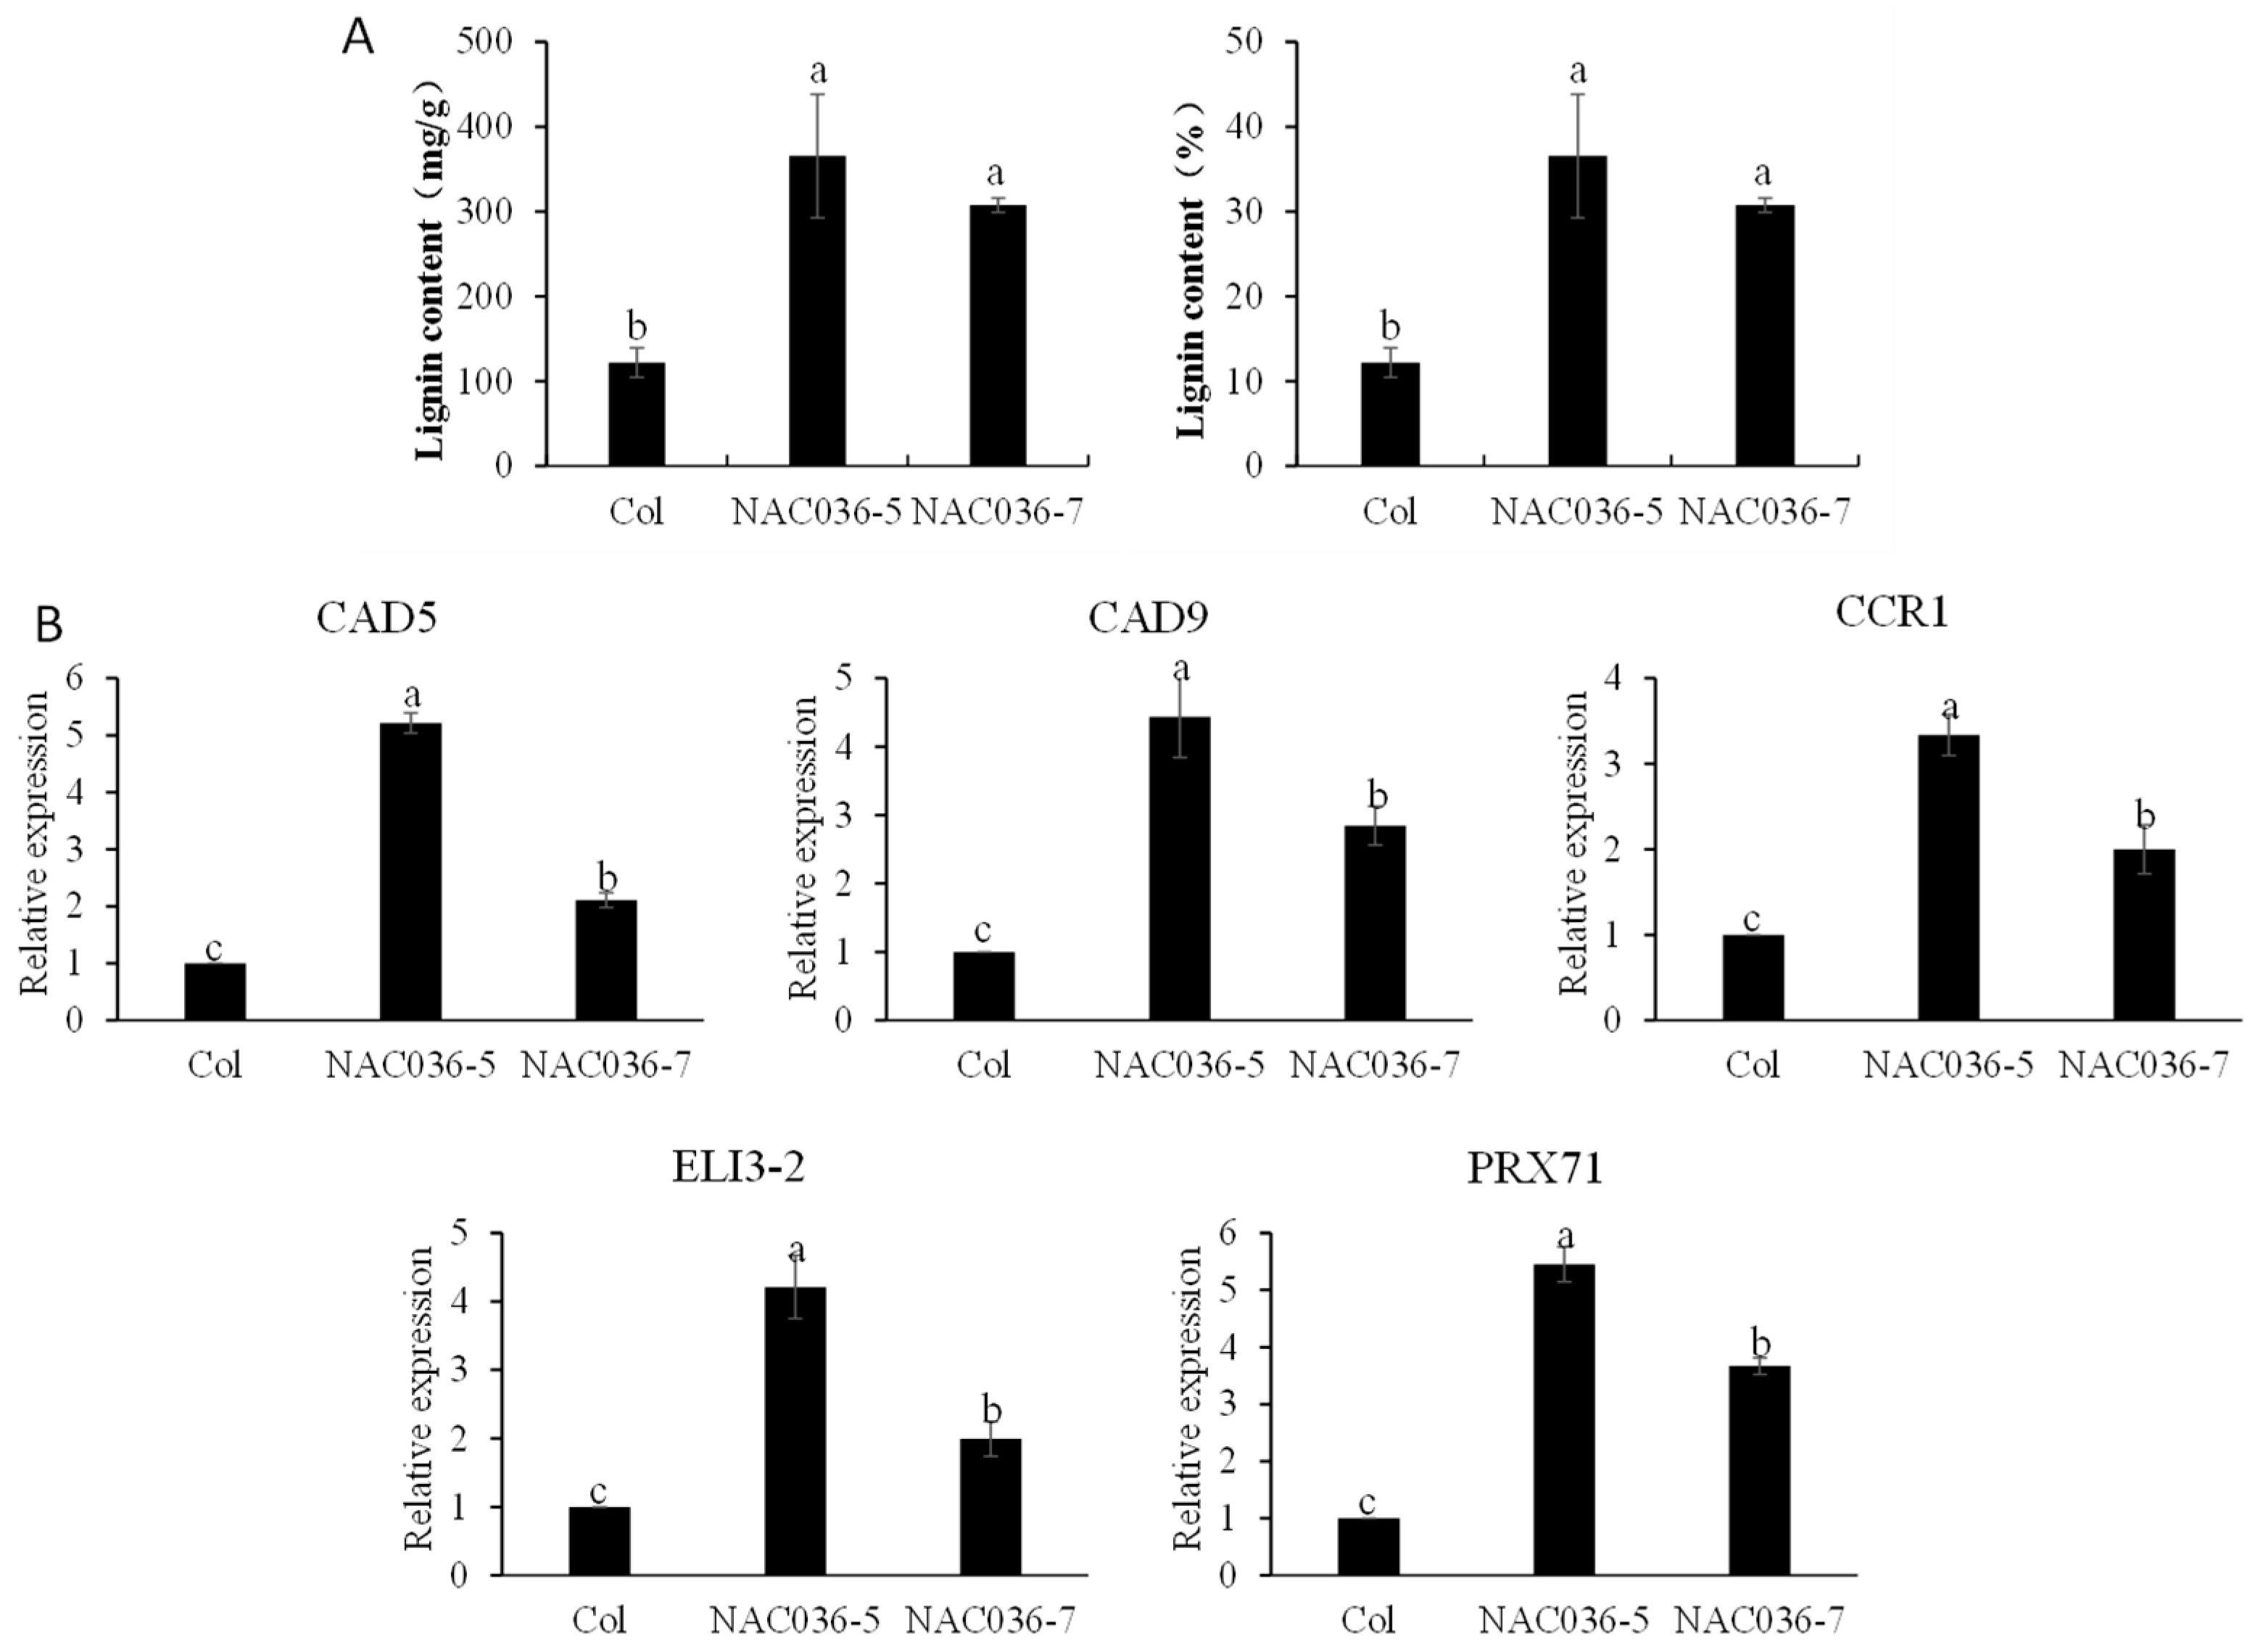
Lignin constitutes a vital structural component of plant stems and has a critical influence on vegetative growth. To investigate the role of PpNAC036 in plant development, we quantified the lignin content and analyzed the expression of biosynthetic genes. The lignin concentrations in PpNAC036-5 and PpNAC036-7 were 365 mg/g and 307 mg/g, respectively. Compared to the Col-0 baseline (122 mg/g), this represented increases of 24% and 18%, respectively (Figure 5A).
qRT-PCR analysis demonstrated significant upregulation of key lignin biosynthesis genes (CAD5, CAD9, and CCR1) in transgenic lines (Figure 5B). These molecular and biochemical findings strongly suggest that overexpression of PpNAC036 positively regulates the lignin biosynthesis pathway, thereby enhancing secondary cell wall deposition and promoting subsequent vegetative growth vigor.

3.6. PpNAC036 Negatively Regulates Seed Germination, and Synergistically Enhances Stress-Induced Germination Inhibition

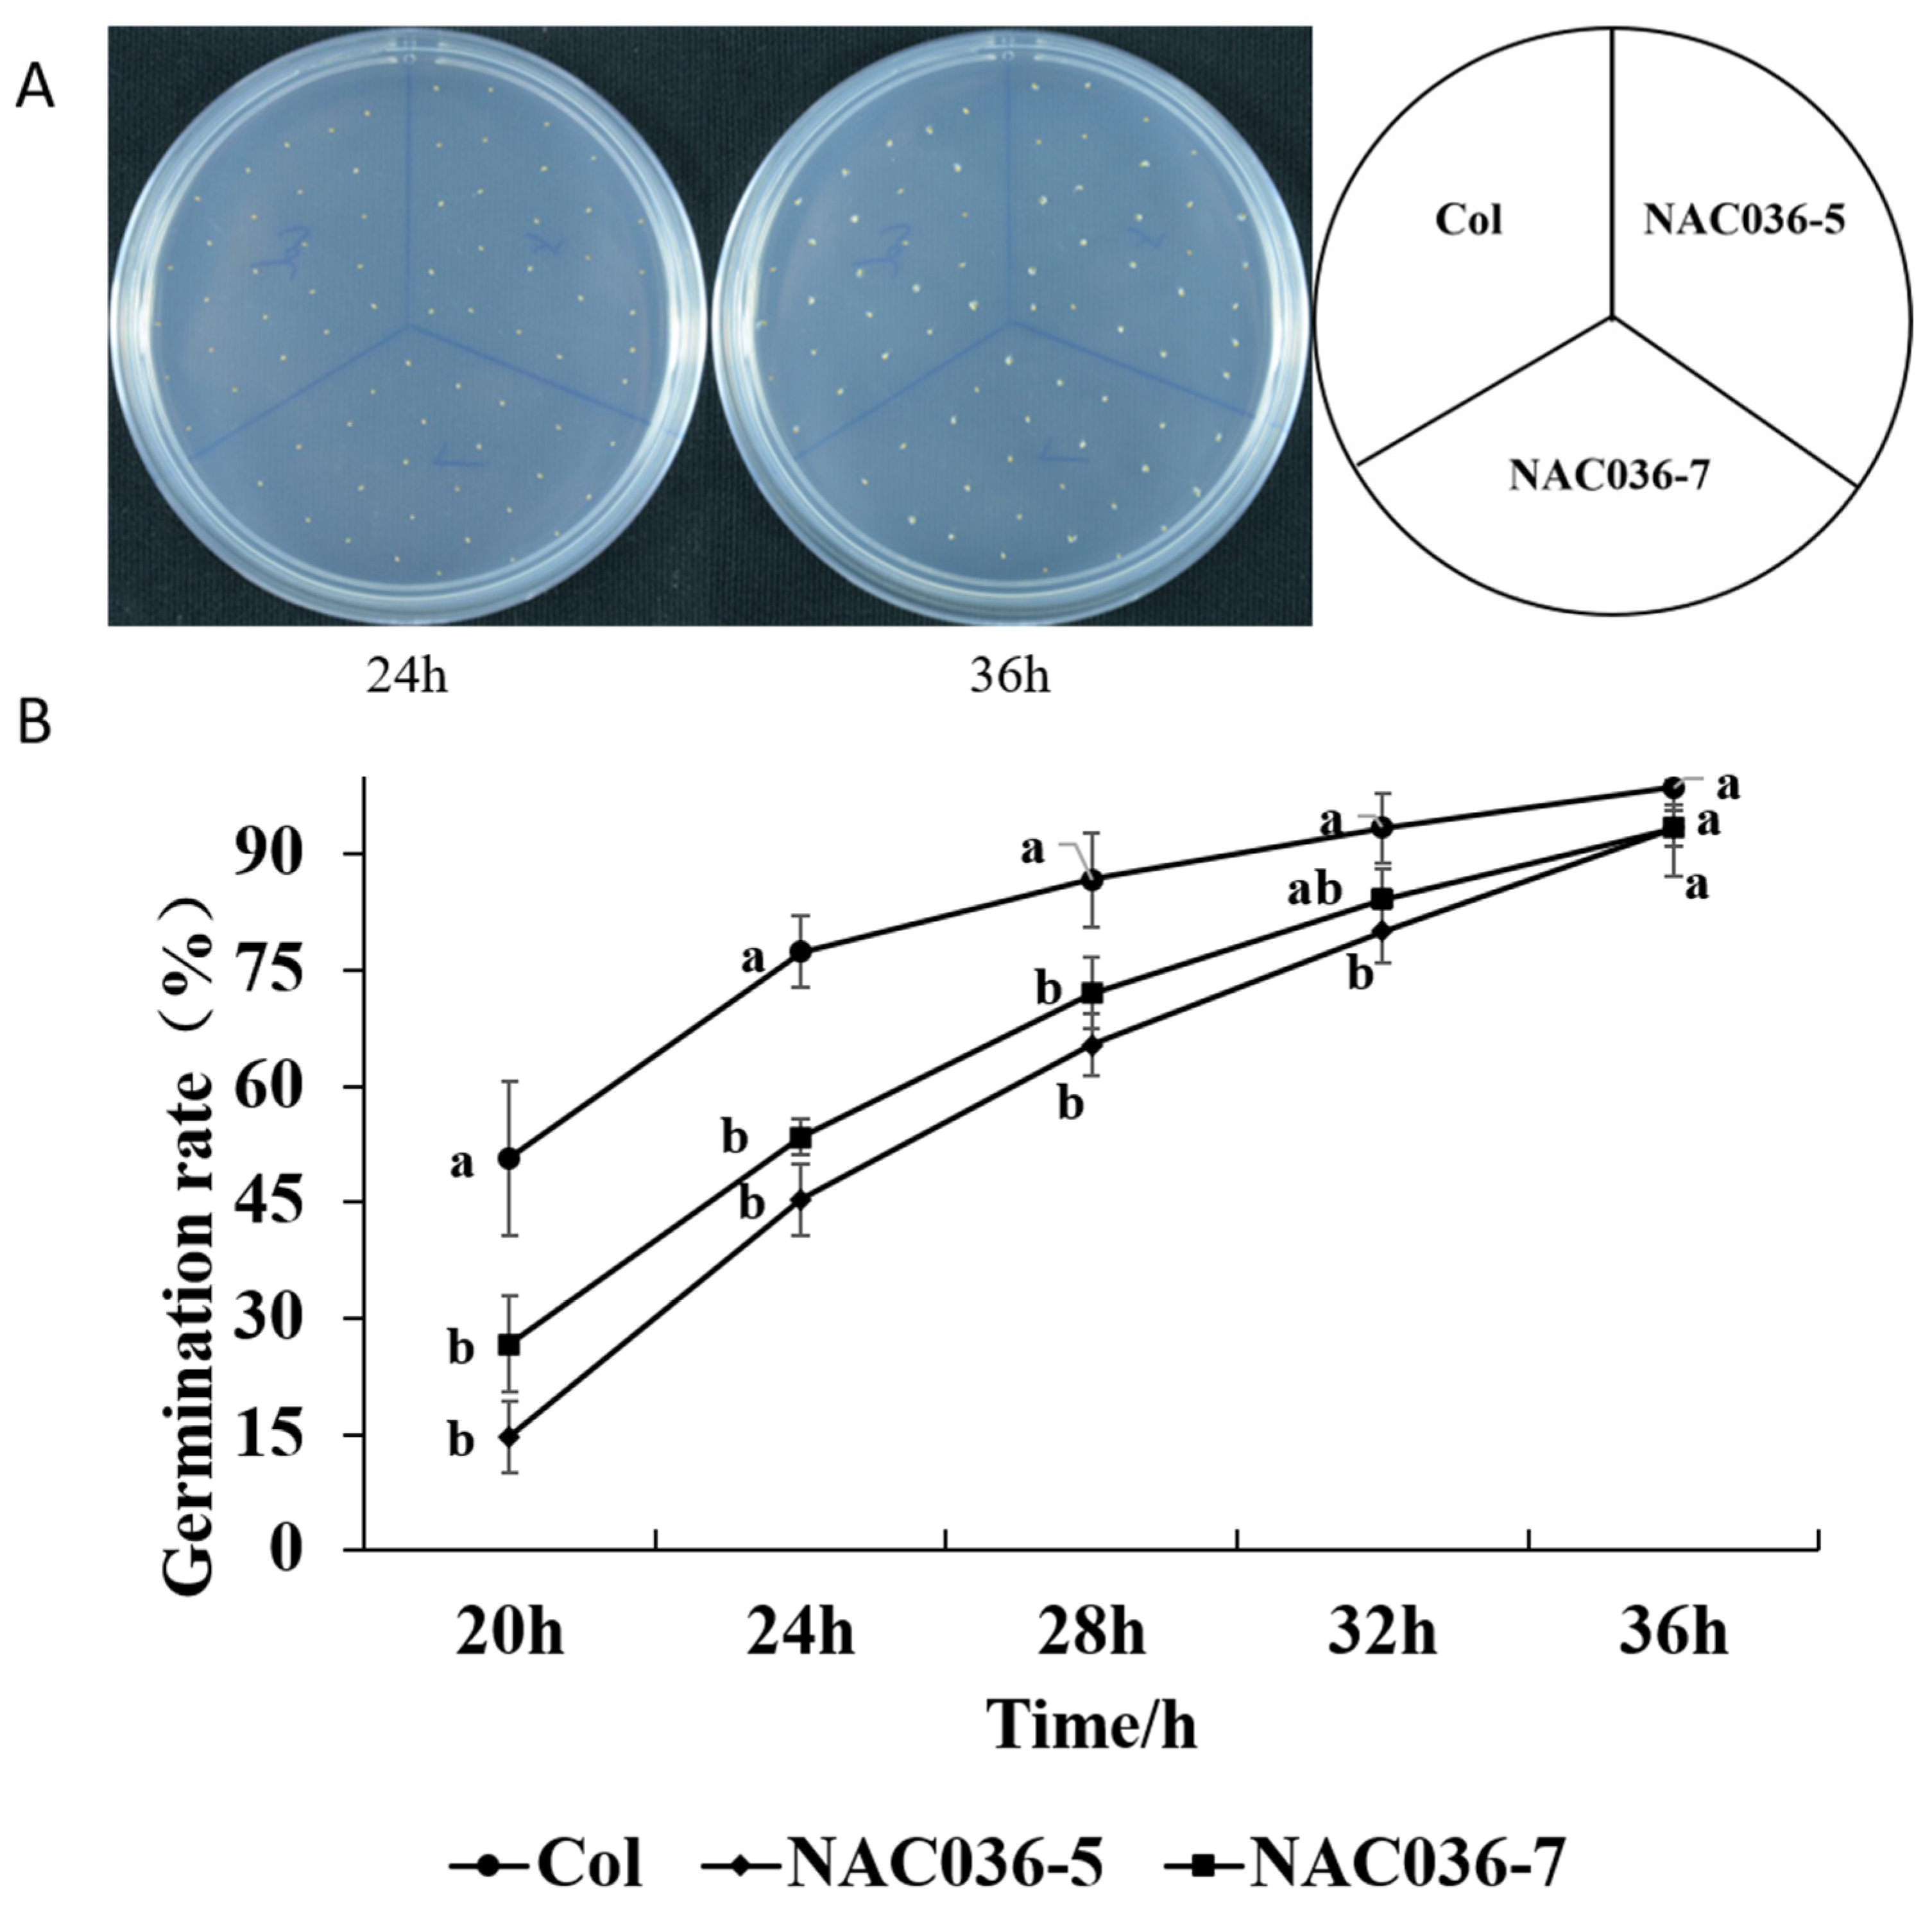
Gibberellin (GA) is a crucial plant hormone that plays a pivotal role in seed germination. In this study, Arabidopsis seedlings were treated with varying GA concentrations, and PpNAC036 overexpression increased Arabidopsis sensitivity to GA compared with WT. To investigate whether PpNAC036 functions during seed germination, Arabidopsis seeds were stratified for 2 days and then placed in a culture chamber. Observations were made every 4 h. The results revealed that the germination rate of PpNAC036-overexpressing Arabidopsis was significantly lower than that of the WT (Figure A5A). At 20 h, the germination rate of the WT (Col-0) was 51%, while those of PpNAC036-overexpressing lines were 14% and 26%, respectively (Figure A5B).
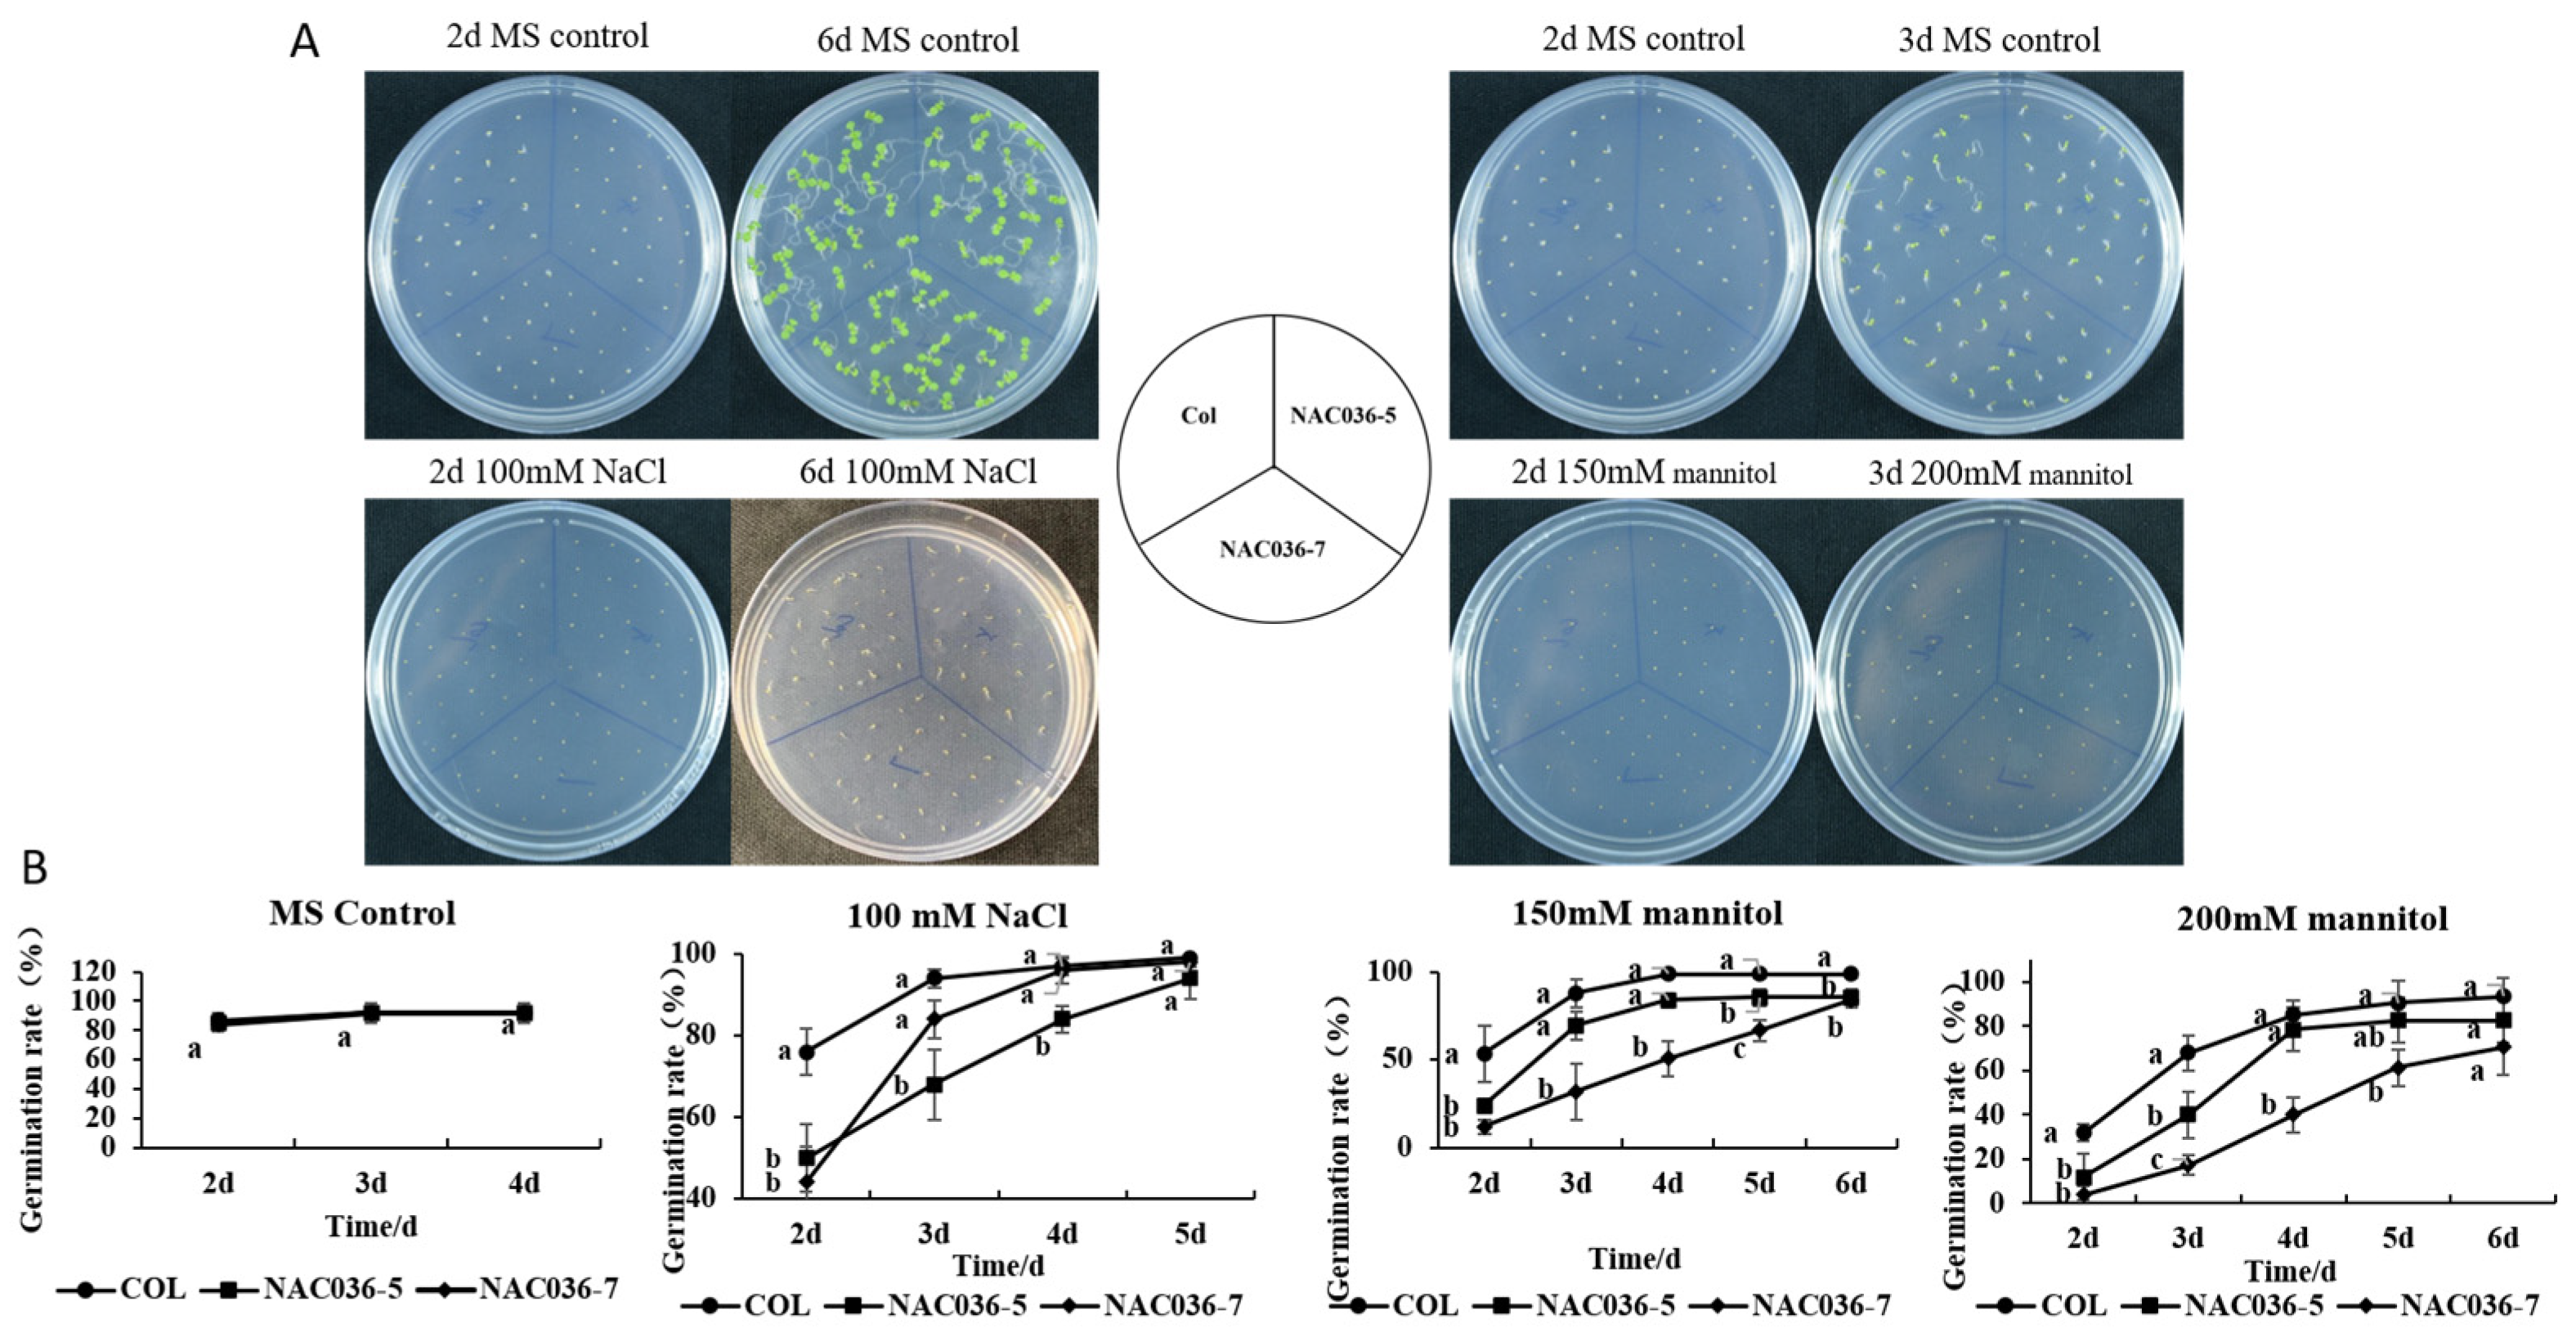
Abiotic stresses adversely affect plant growth and may even lead to plant death. NAC transcription factors are well-known to play a significant role in plant responses to abiotic stress. To explore whether PpNAC036 is involved in abiotic stress responses, seeds of WT and PpNAC036-overexpressing Arabidopsis were treated with different concentrations of mannitol (to simulate drought) and subjected to salt stress. The results showed distinct differences in germination rates under various stress conditions. Specifically, when treated with 100 mM NaCl for 2 days, the germination rates of PpNAC036-overexpressing lines were significantly reduced to 50% and 44%, compared to 76% for the WT. Under 150 mM mannitol treatment for 2 days, the germination rates of the WT and PpNAC036-overexpressing lines were 53%, 24%, and 12%, respectively. After 5 days of treatment, the corresponding germination rates were 98%, 85%, and 66%, respectively. Under 200 mM mannitol stress, germination in all seed lines was delayed compared to the MS control. After 2 days of treatment, the germination rates of the WT and PpNAC036-overexpressing lines were 32%, 12%, and 4%, respectively. After 3 days, the germination rates were 68%, 40%, and 17%, respectively (Figure 6). These findings demonstrate that PpNAC036 negatively regulates seed germination and synergistically enhances stress-induced inhibition of germination.

3.7. PpNAC036 Significantly Delays Flowering Time in Arabidopsis thaliana by Regulating the Expression of Flowering-Related Genes

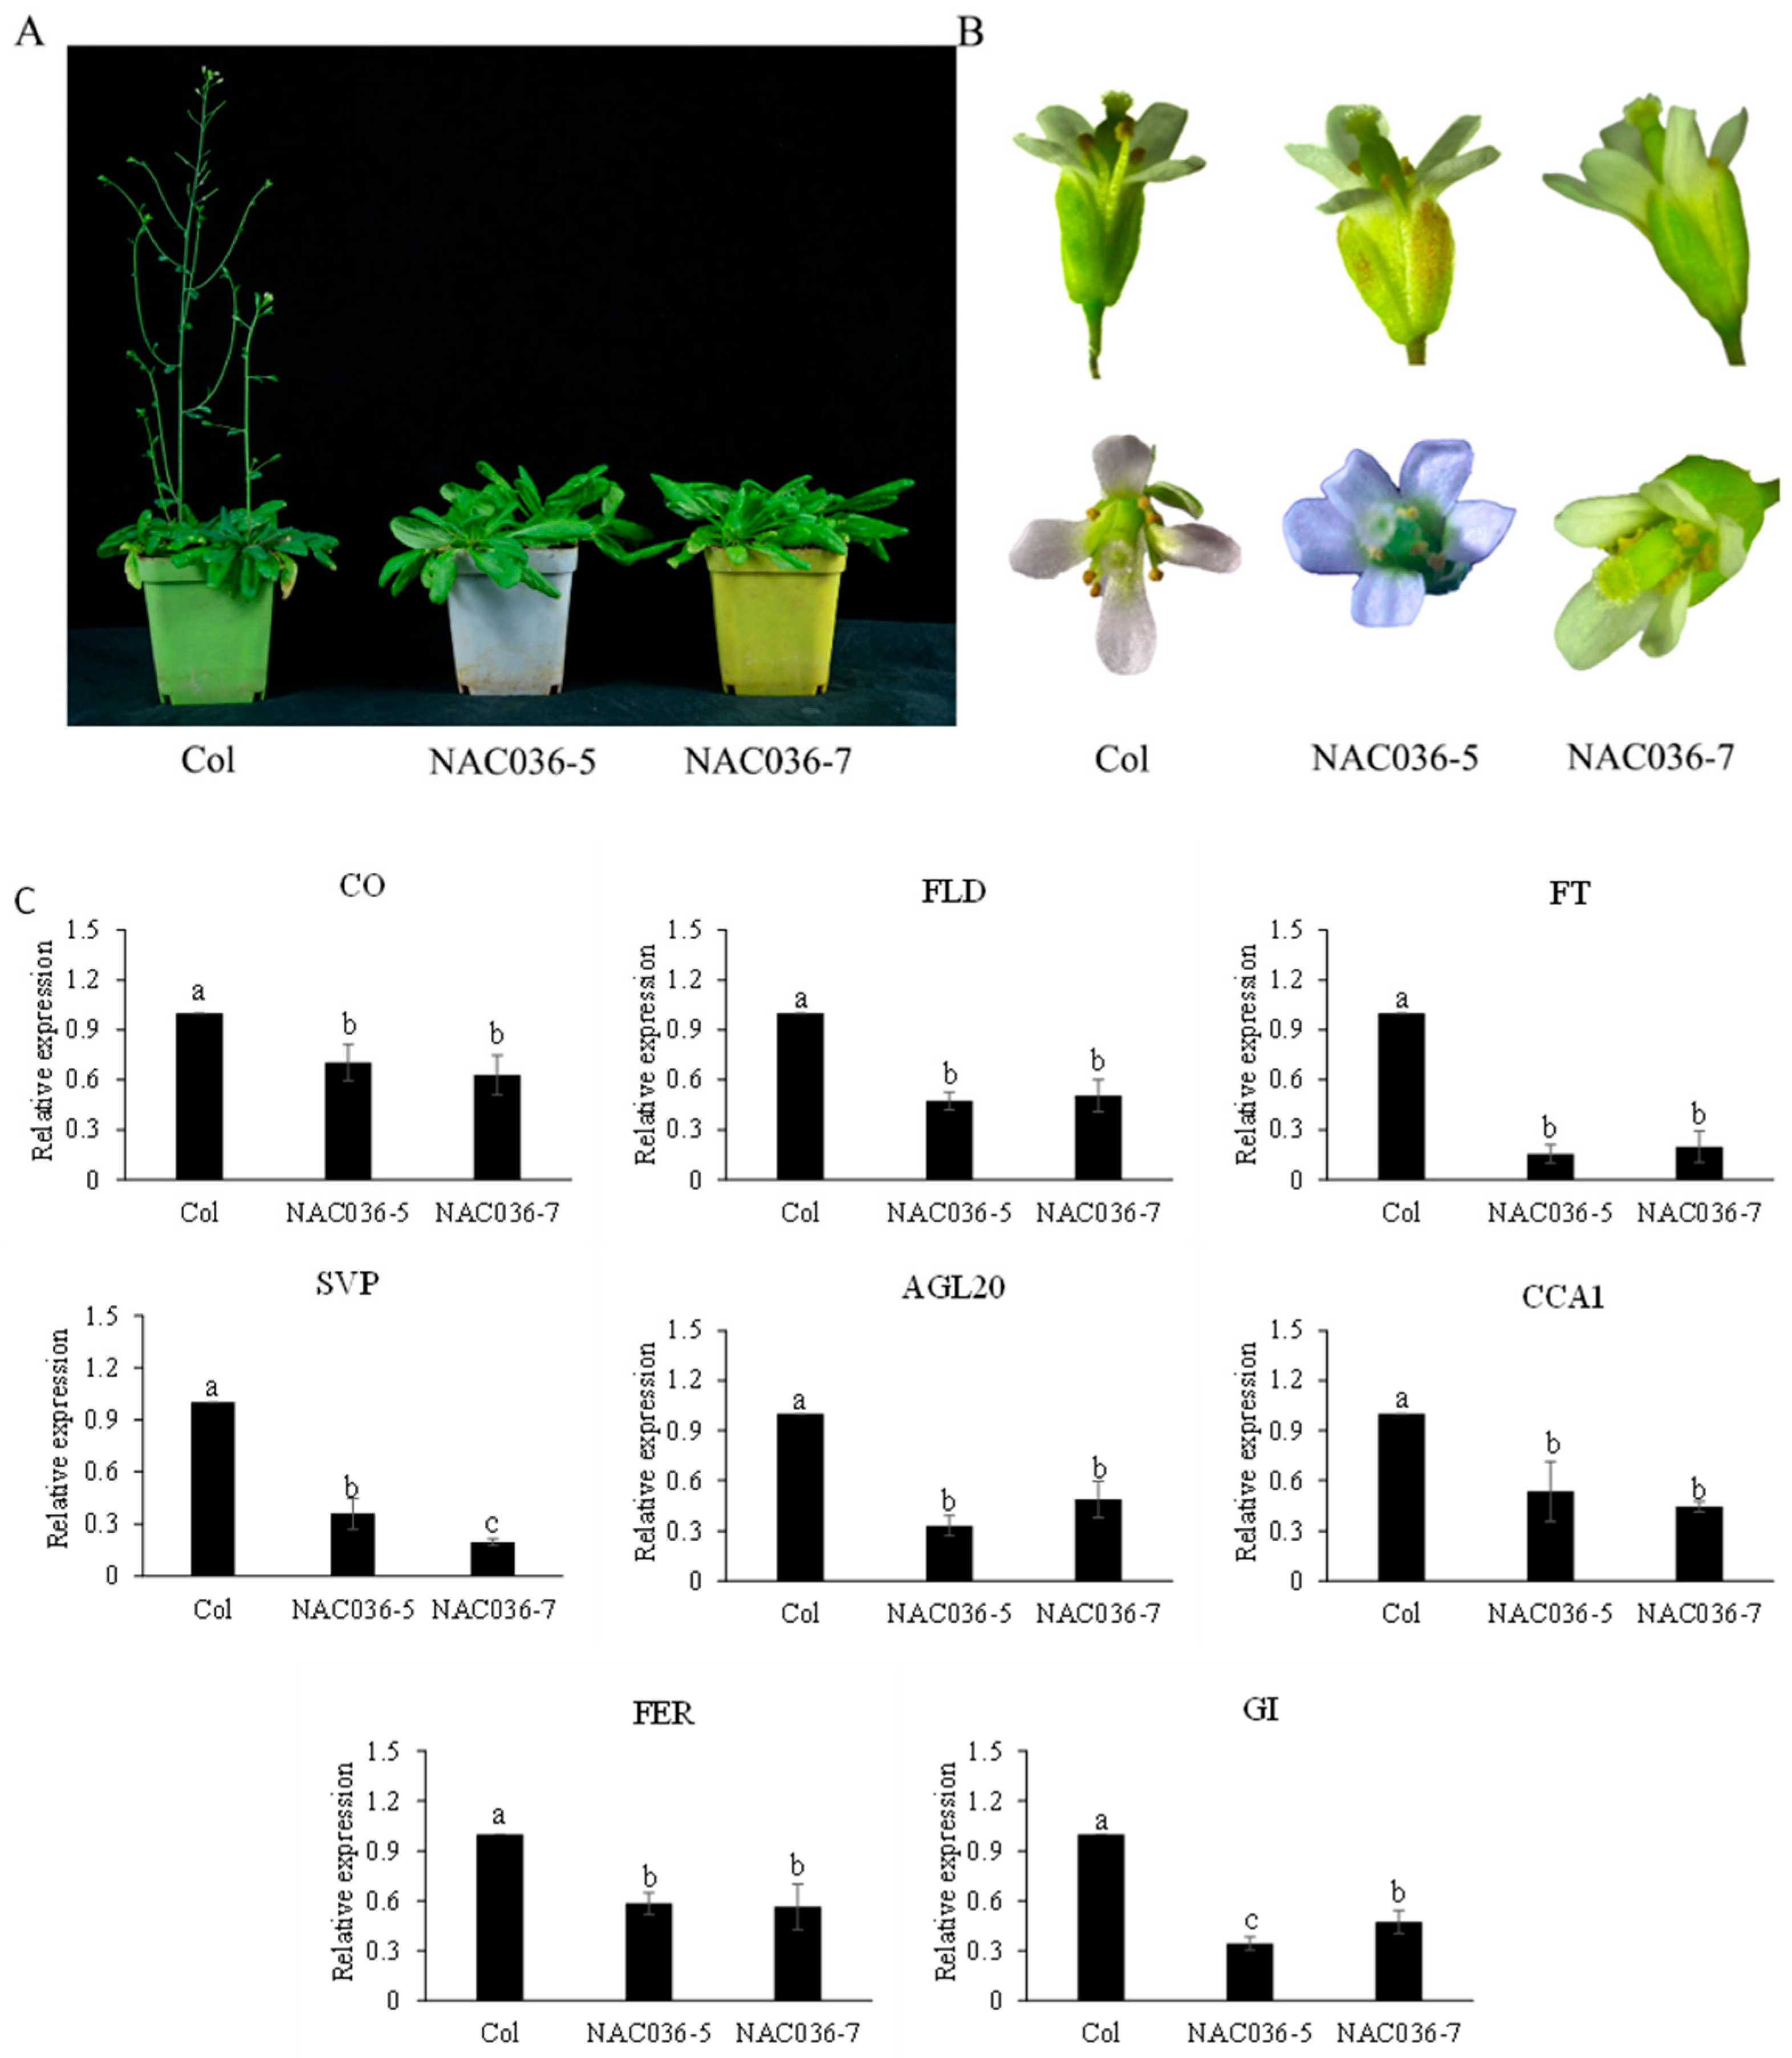
When wild-type (Col-0) and PpNAC036-overexpressing Arabidopsis thaliana plants were cultivated in nutrient-rich soil for 45 days, a notable phenotypic difference was observed. The overexpression lines exhibited a delay in flowering of approximately 10 days compared to wild-type controls (Figure 7A). Moreover, at the full-bloom stage, wild-type flowers displayed four petals, whereas PpNAC036-overexpressing flowers frequently developed five petals (Figure 7B). These phenotypic variations strongly suggest that PpNAC036 overexpression regulates both flowering time and floral development. qRT-PCR analysis revealed a significant downregulation of several key flowering-related genes, including AGL20, SVP, GI, CO, FLD, FT, CCA1, and FER (Figure 7C). AGL20 (a central hub in the flowering time and floral development regulatory network) interacts with multiple flowering regulators and floral homeotic genes. SVP modulates diverse developmental pathways, including vegetative growth, floral organogenesis, and hormone signaling. GI, CO, and FT function in the photoperiod-dependent flowering pathway, promoting flowering under long-day conditions. CCA1 regulates circadian rhythms, while FER influences cell expansion during floral morphogenesis. Collectively, these molecular and phenotypic data demonstrate that overexpression of PpNAC036 likely delays flowering by repressing critical components of the photoperiodic, circadian, and floral integrator pathways.

3.8. PpNAC036 Regulates Petal Number and Floral Organ Morphology in Arabidopsis thaliana by Modulating the Expression of Key Floral Developmental Genes

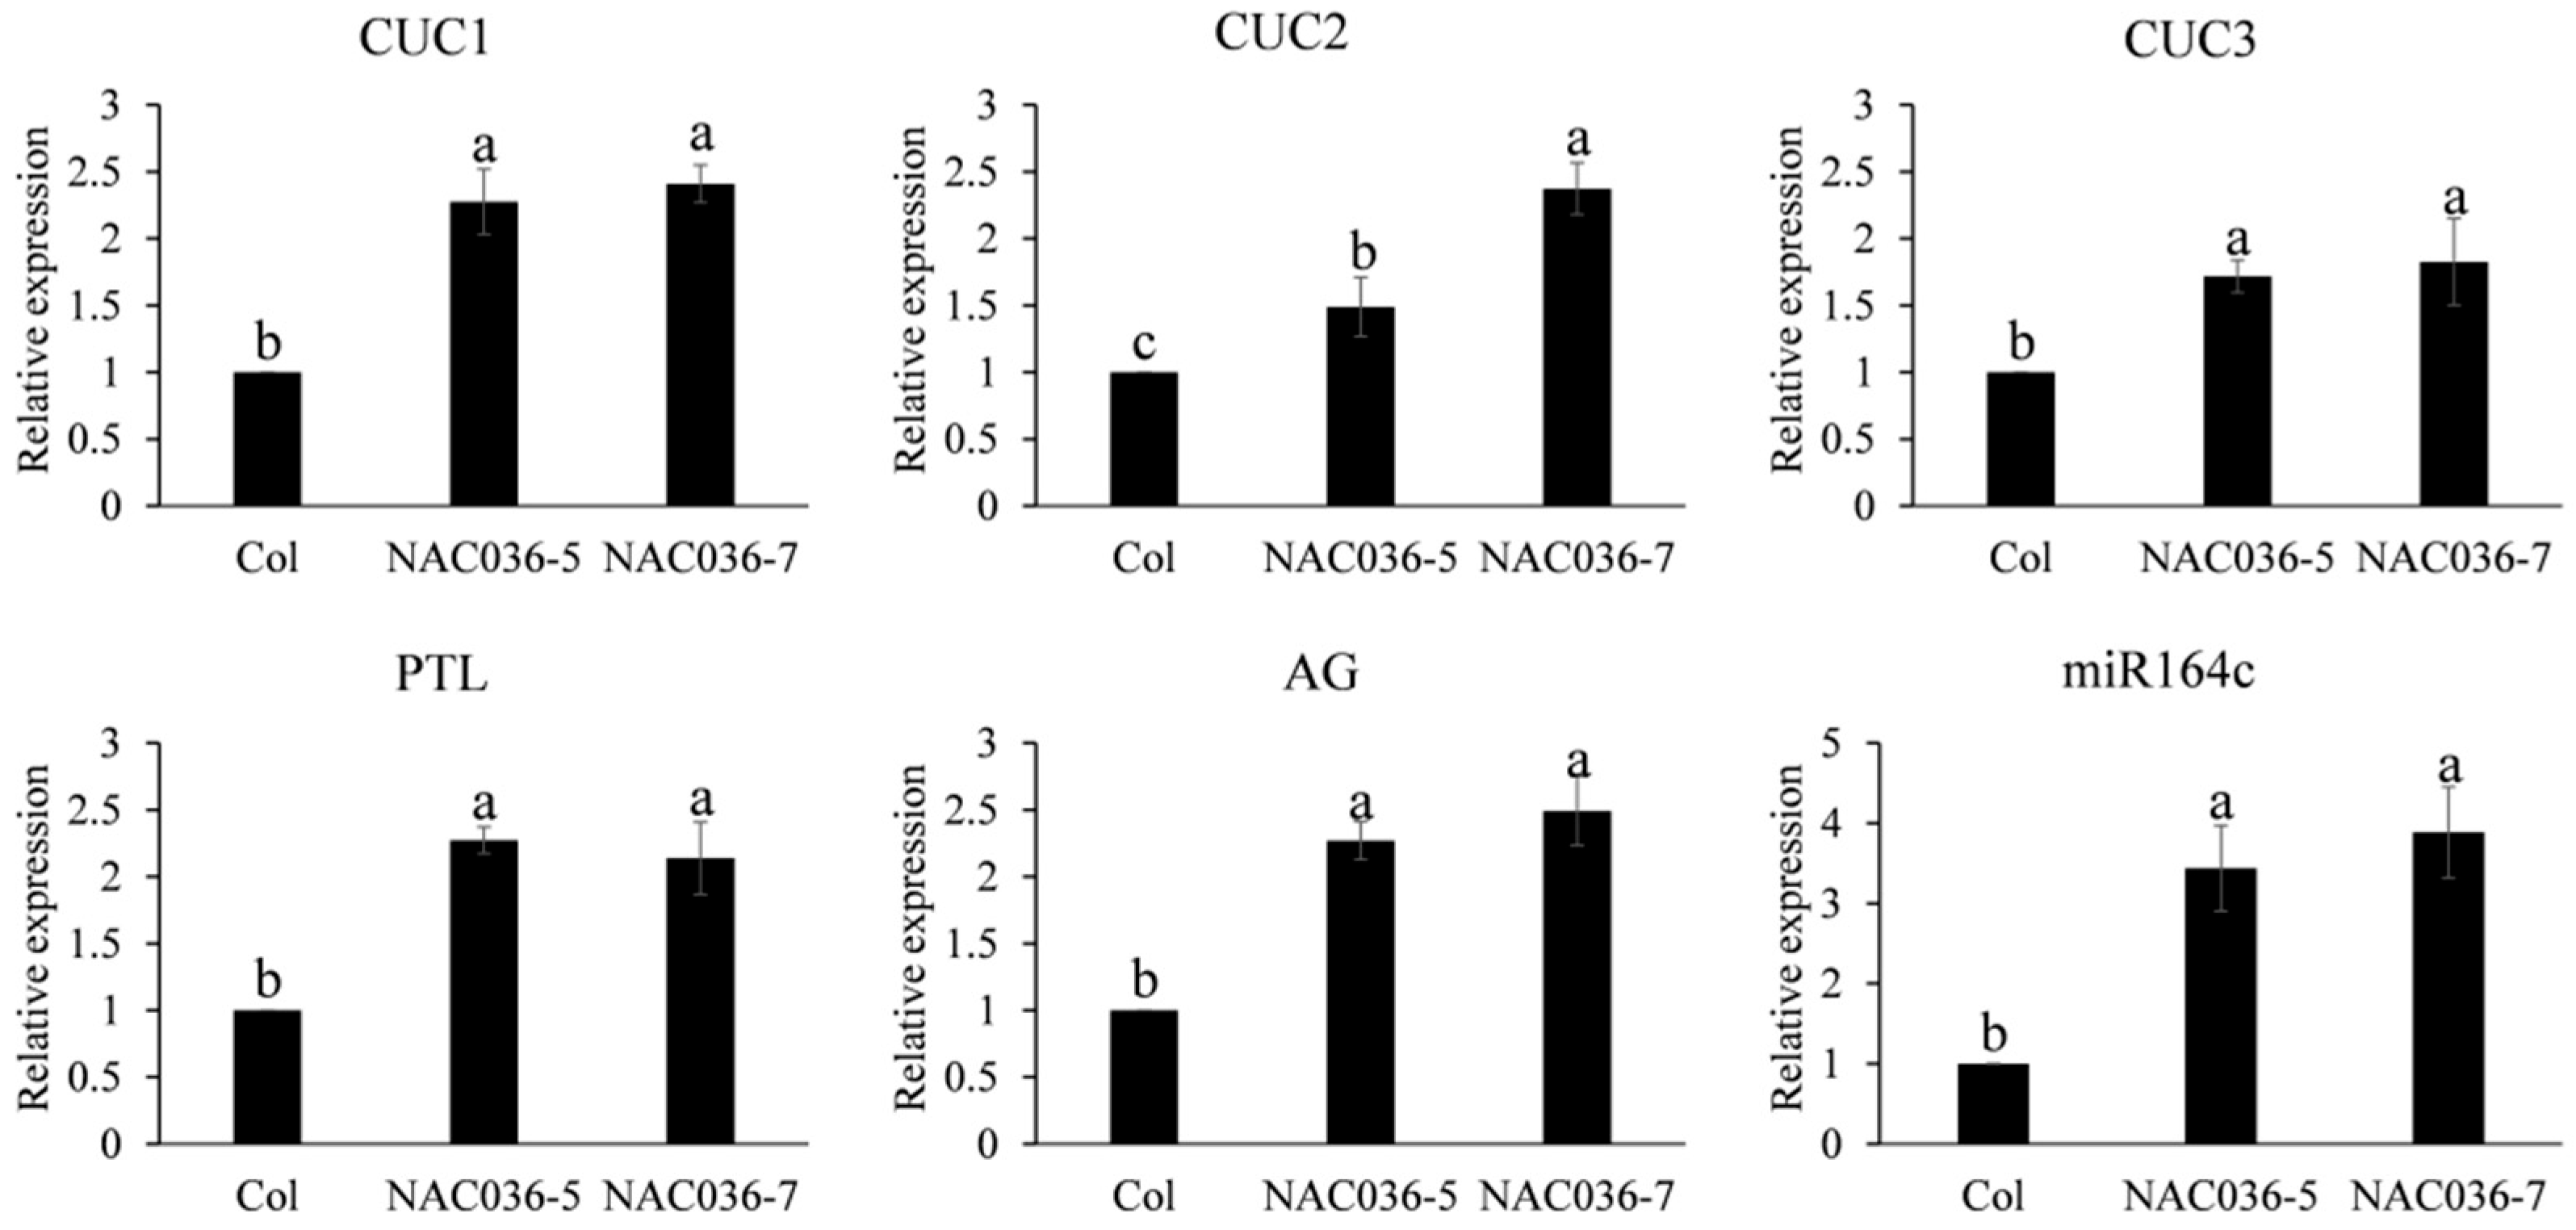
During the full flowering stage of Arabidopsis, we observed that wild-type flowers typically possess four petals. In contrast, flowers overexpressing PpNAC036 exhibit a five-petal phenotype (Figure 7B). This difference suggests that the overexpression of PpNAC036 may play a regulatory role in floral development. To further investigate this phenomenon, unopened floral buds from both wild-type and PpNAC036-overexpressing Arabidopsis plants were collected during the full flowering stage. RNA was extracted, reverse-transcribed, and subjected to qRT-PCR analysis. The results indicate that genes associated with floral organ development, such as CUC1 and PTL, were upregulated. CUC1 is known to inhibit growth in the boundary region of sepal tissues, while PTL regulates the size of these boundaries. Additionally, miR164c mediates the biosynthesis of CUC1 and CUC2, which are involved in controlling petal number (Figure A6). Therefore, it is plausible that overexpression of PpNAC036 exerts a regulatory influence on the development of floral organs.

3.9. Comparative Analysis of Differential Expression Profiles Between Wild-Type and PpNAC036 Transgenic Lines

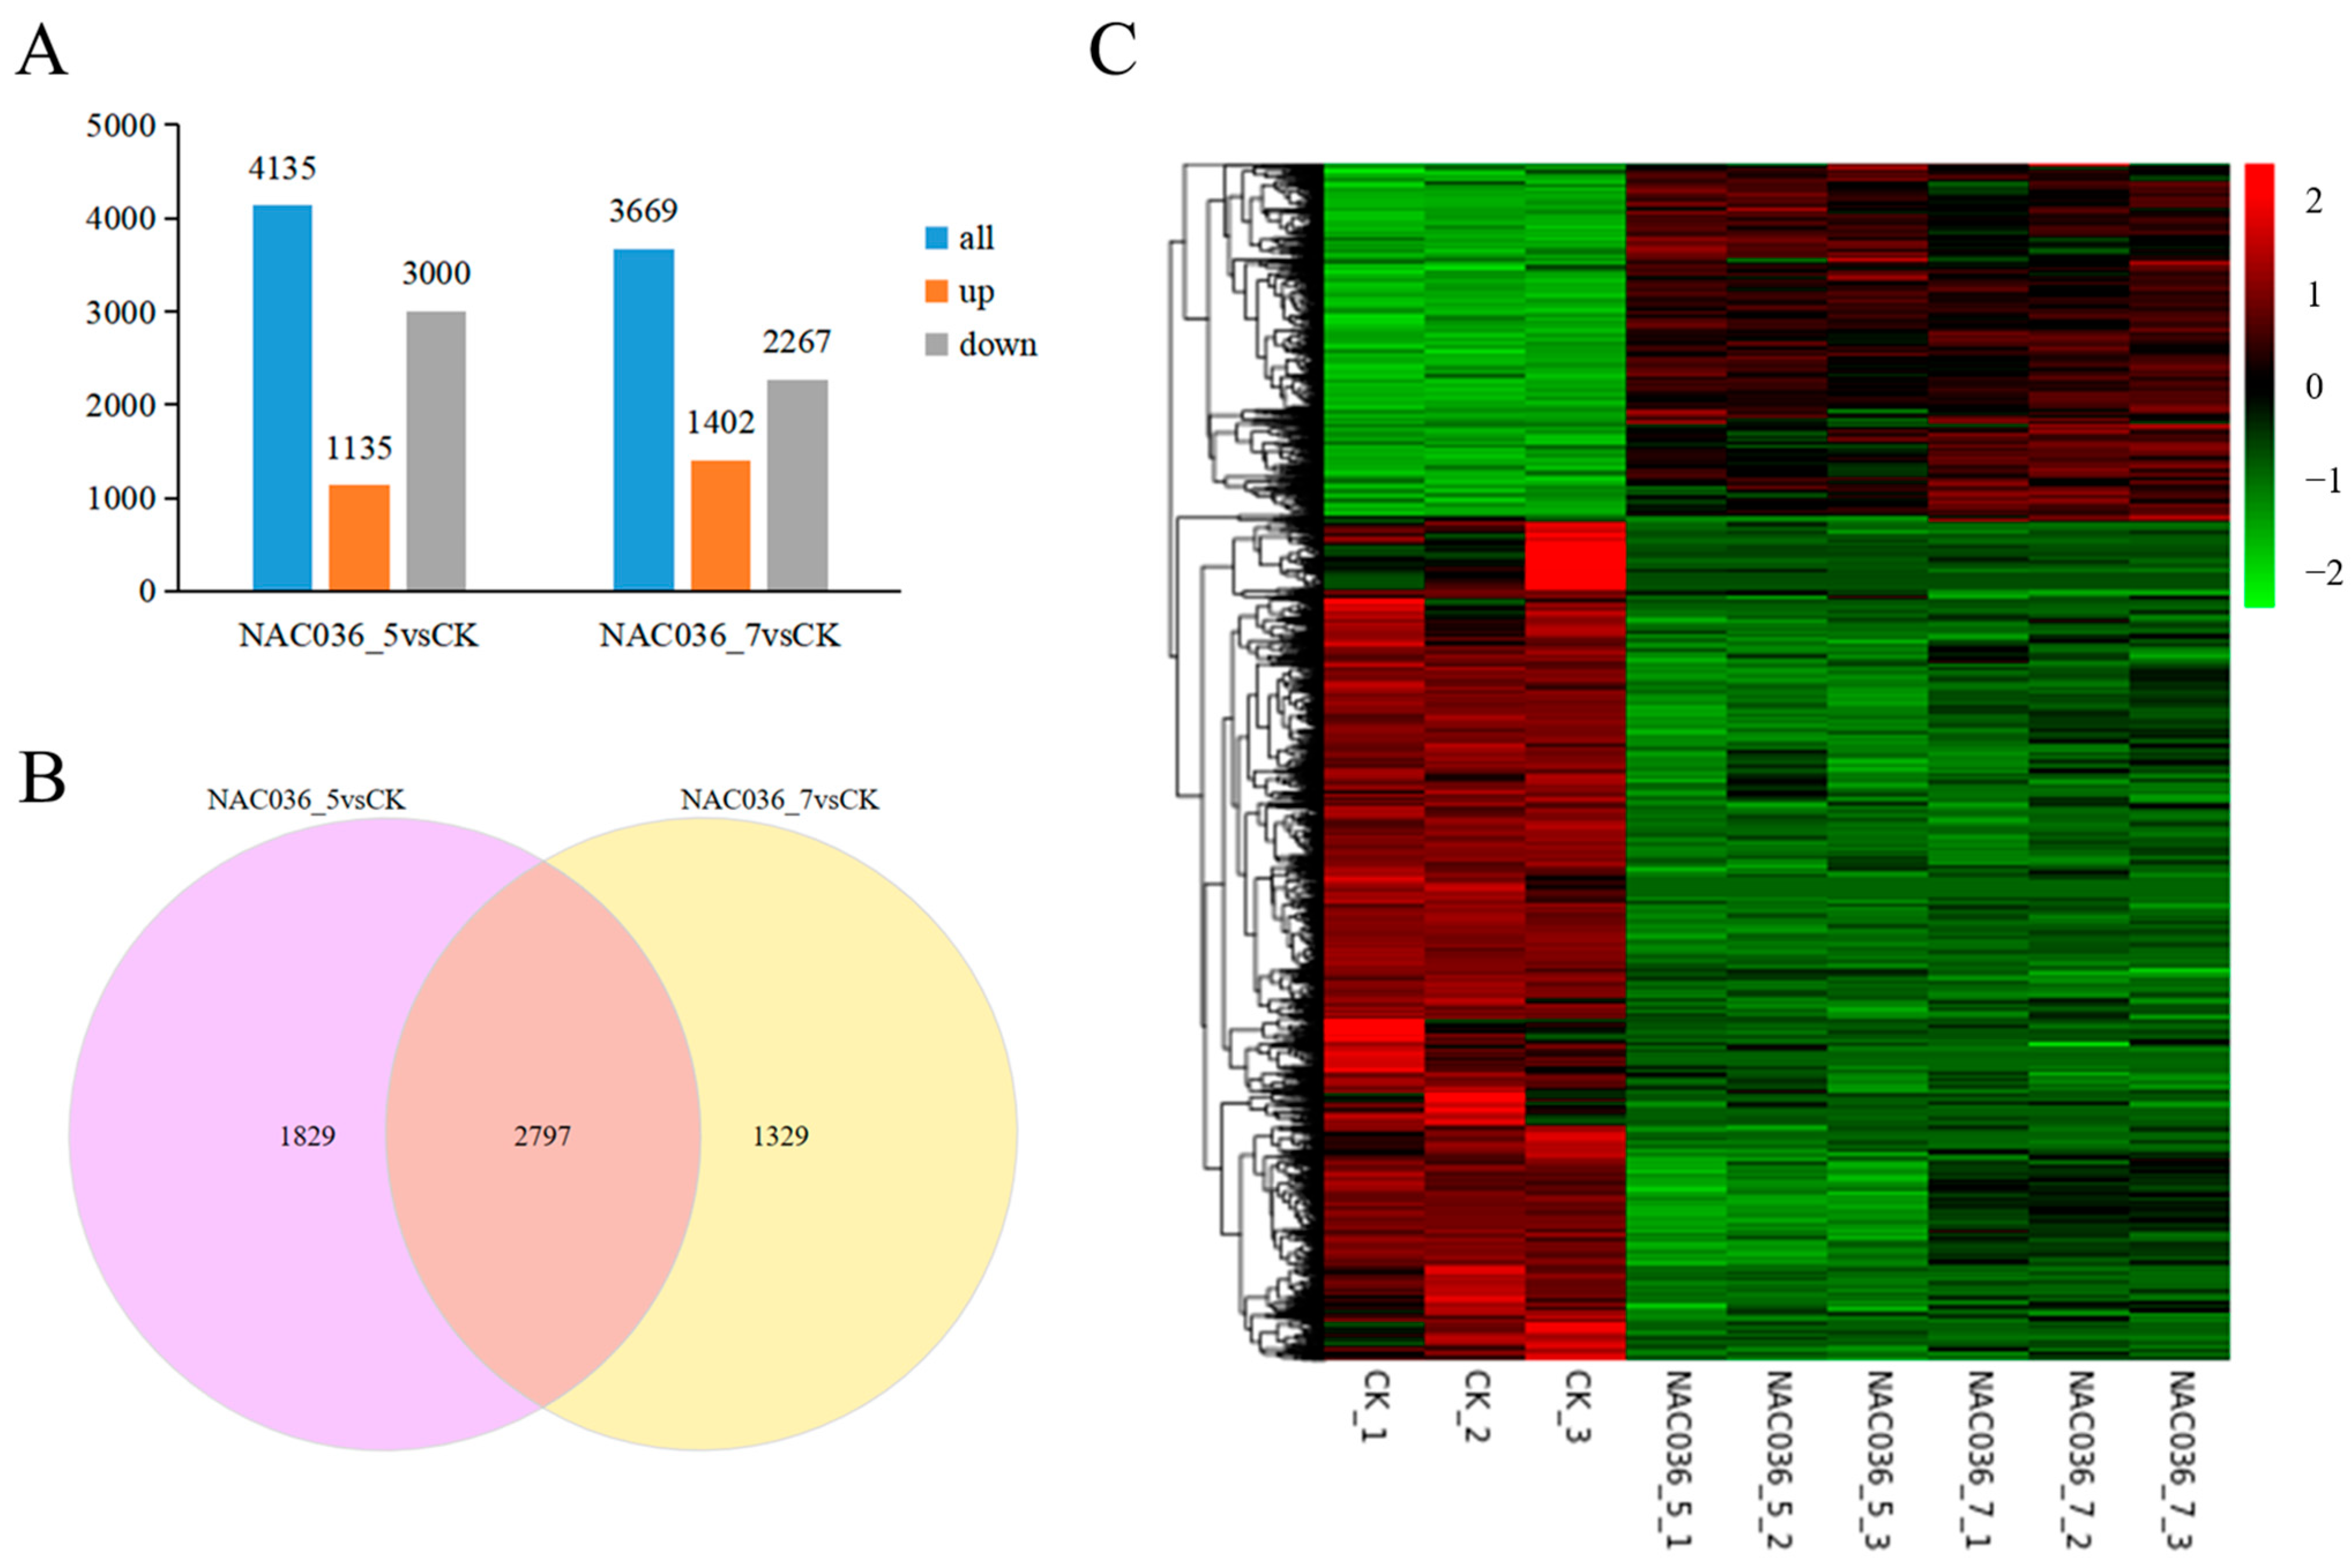
Transcriptomic analysis revealed 21,878 constitutively expressed genes shared among the wild-type, PpNAC036-5, and PpNAC036-7 lines. Differential comparison analysis was performed between CK and PpNAC036-5 and between CK and PpNAC036-7. The results showed 4135 differentially expressed genes (DEGs) between PpNAC036-5 and CK, of which 1135 were upregulated, and 3000 were downregulated. Meanwhile, 3669 DEGs were identified between PpNAC036-7 and CK, with 1402 upregulated genes and 2267 downregulated genes (Figure A7A). A total of 2797 common DEGs were identified across the wild-type and the two transgenic lines (Figure A7B). A heatmap was generated for these common DEGs (Figure A7C).

3.10. Gene Ontology (GO) Functional Enrichment Analysis and Kyoto Encyclopedia of Genes and Genomes (KEGG) Pathway Enrichment Analysis with Statistical Significance

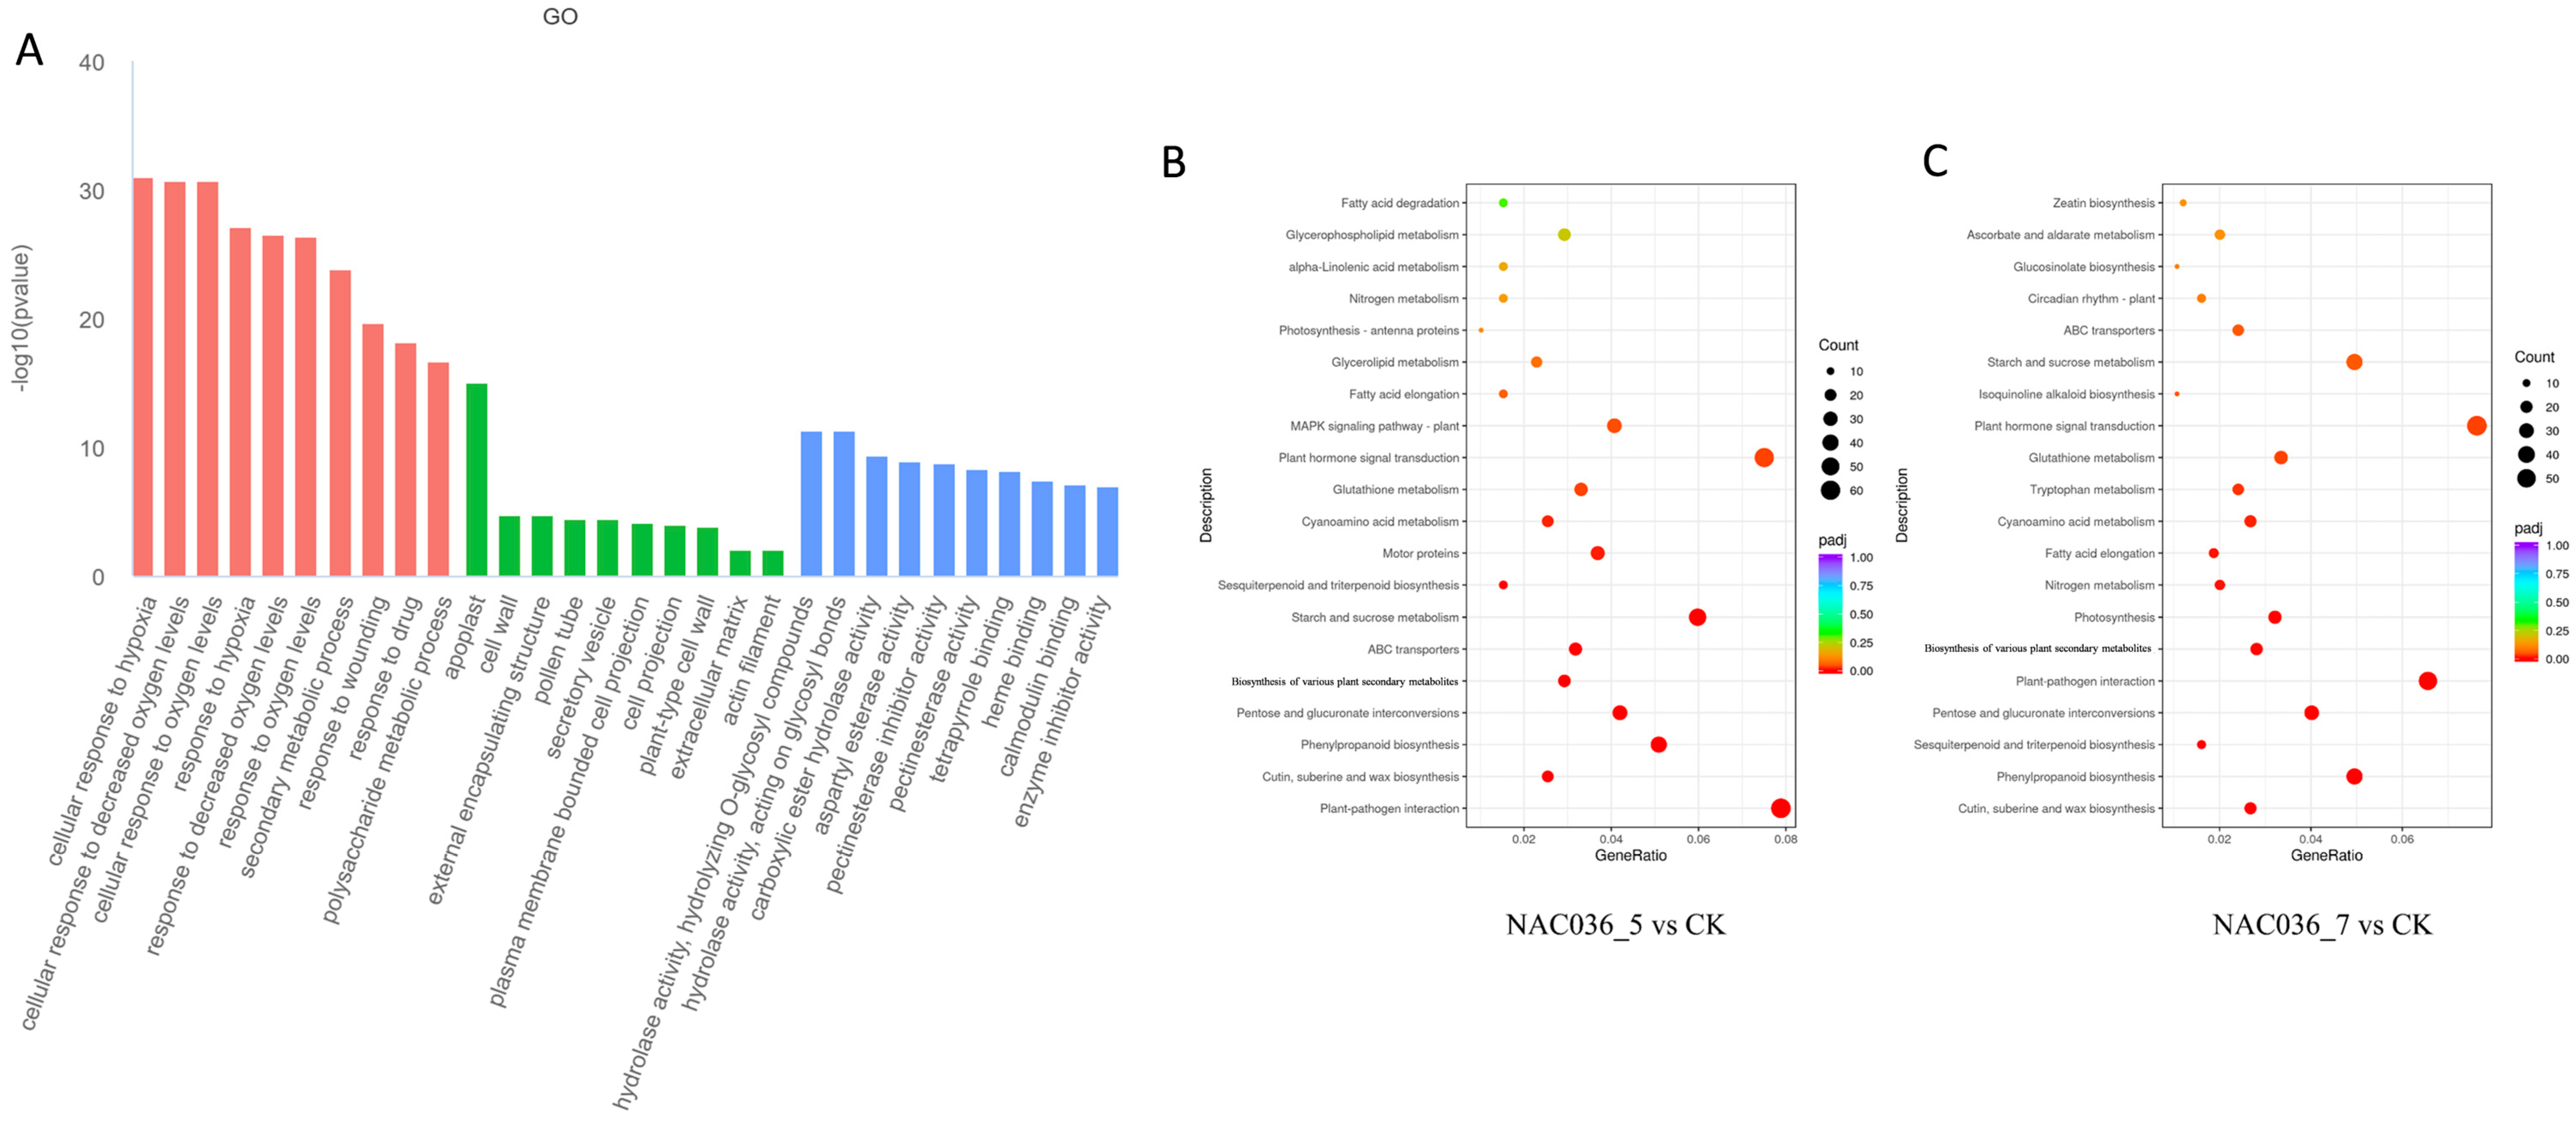
A total of 2797 common differentially expressed genes (DEGs) were identified among the wild-type (CK) and the transgenic lines PpNAC036-5 and PpNAC036-7. Gene Ontology (GO) enrichment analysis revealed that these genes were predominantly associated with biological processes (BP), including secondary metabolic processes, polysaccharide metabolic processes, response to hypoxia, response to decreased oxygen levels, and response to oxygen levels. Cellular component (CC) annotations were enriched in the apoplast, cell wall, pollen tube, secretory vesicle, cell projection, and plant-type cell wall (Figure A8A).
To further explore the functions of these DEGs, pairwise comparisons between CK and individual transgenic lines (PpNAC036-5 and PpNAC036-7) were subjected to Kyoto Encyclopedia of Genes and Genomes (KEGG) pathway enrichment analysis (Figure A8B,C). The DEGs were significantly enriched in pathways including phenylalanine biosynthesis, plant hormone signal transduction, plant-pathogen interaction, starch and sucrose metabolism, pentose and glucuronate interconversions, ABC transporters, and the MAPK signaling pathway.

3.11. PpNAC036 Orchestrates Multilayered Stress Adaptation in Plants: Integrated Dissection of Hormonal Signaling, Starch Metabolism, and MAPK Network Dynamics

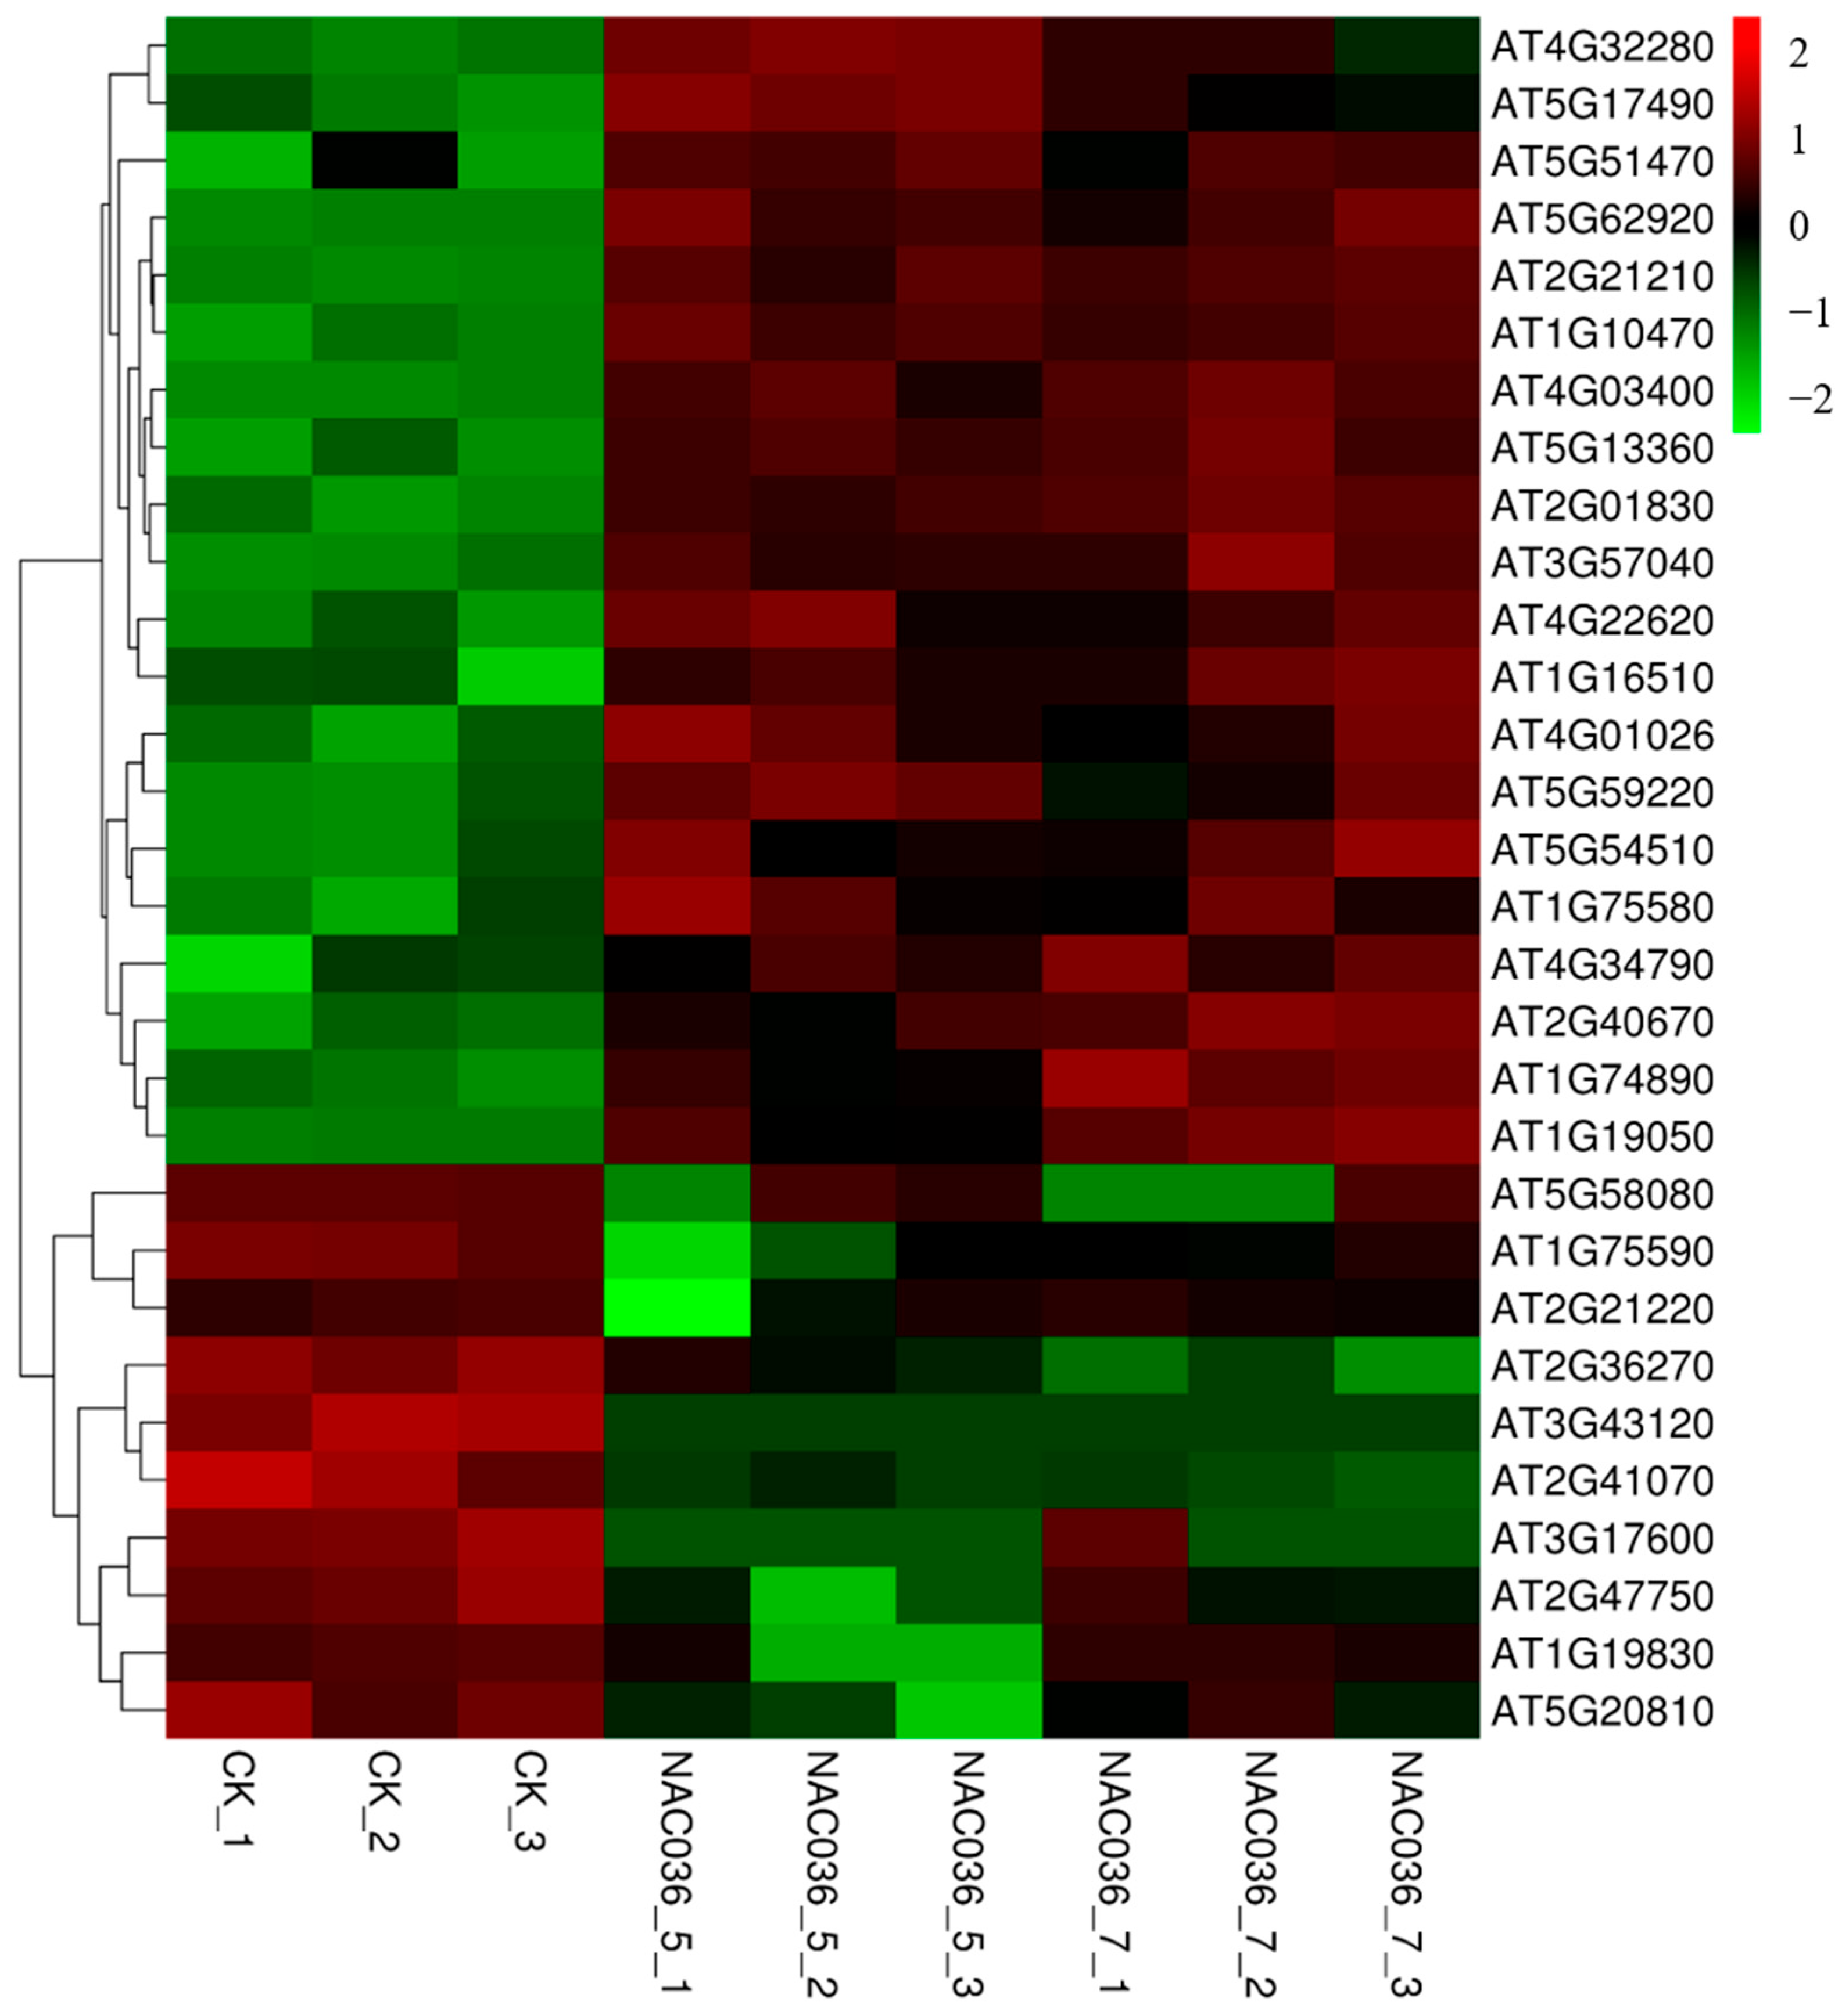
In plant hormone signal transduction pathways, differentially expressed genes are specifically enriched in auxin, gibberellin, cytokinin, and abscisic acid signal transduction pathways. A total of 30 differentially expressed genes were identified, including 20 upregulated genes and 10 downregulated genes (Figure 8). In the auxin signal transduction pathway, AT4G32280 (IAA29) and AT3G17600 (IAA31) negatively regulate the auxin signal transduction; AT4G03400 (DFL2), AT5G54510 (DFL1), and AT2G47750 (GH3.9) can regulate the elongation of the hypocotyl and root in Arabidopsis; AT1G16510 (SAUR41) regulates cell expansion and salt tolerance in Arabidopsis seedlings. In the gibberellin signal transduction process, AT5G17490 (RGL3) is a direct target of MYC2 and can regulate the jasmonic acid signal transduction response. In the abscisic acid signal transduction pathway, AT4G01026 (PYL7) and AT5G59220 (HAI1) are both negative regulators of abscisic acid signaling. Meanwhile, AT2G36270 (ABI5) can regulate hypocotyl growth and seed germination. In the cytokinin signal transduction process, AT5G17490 (RR18) has a positive regulatory effect. AT2G01830 (AHK4) is a cytokinin receptor that can regulate organ growth.
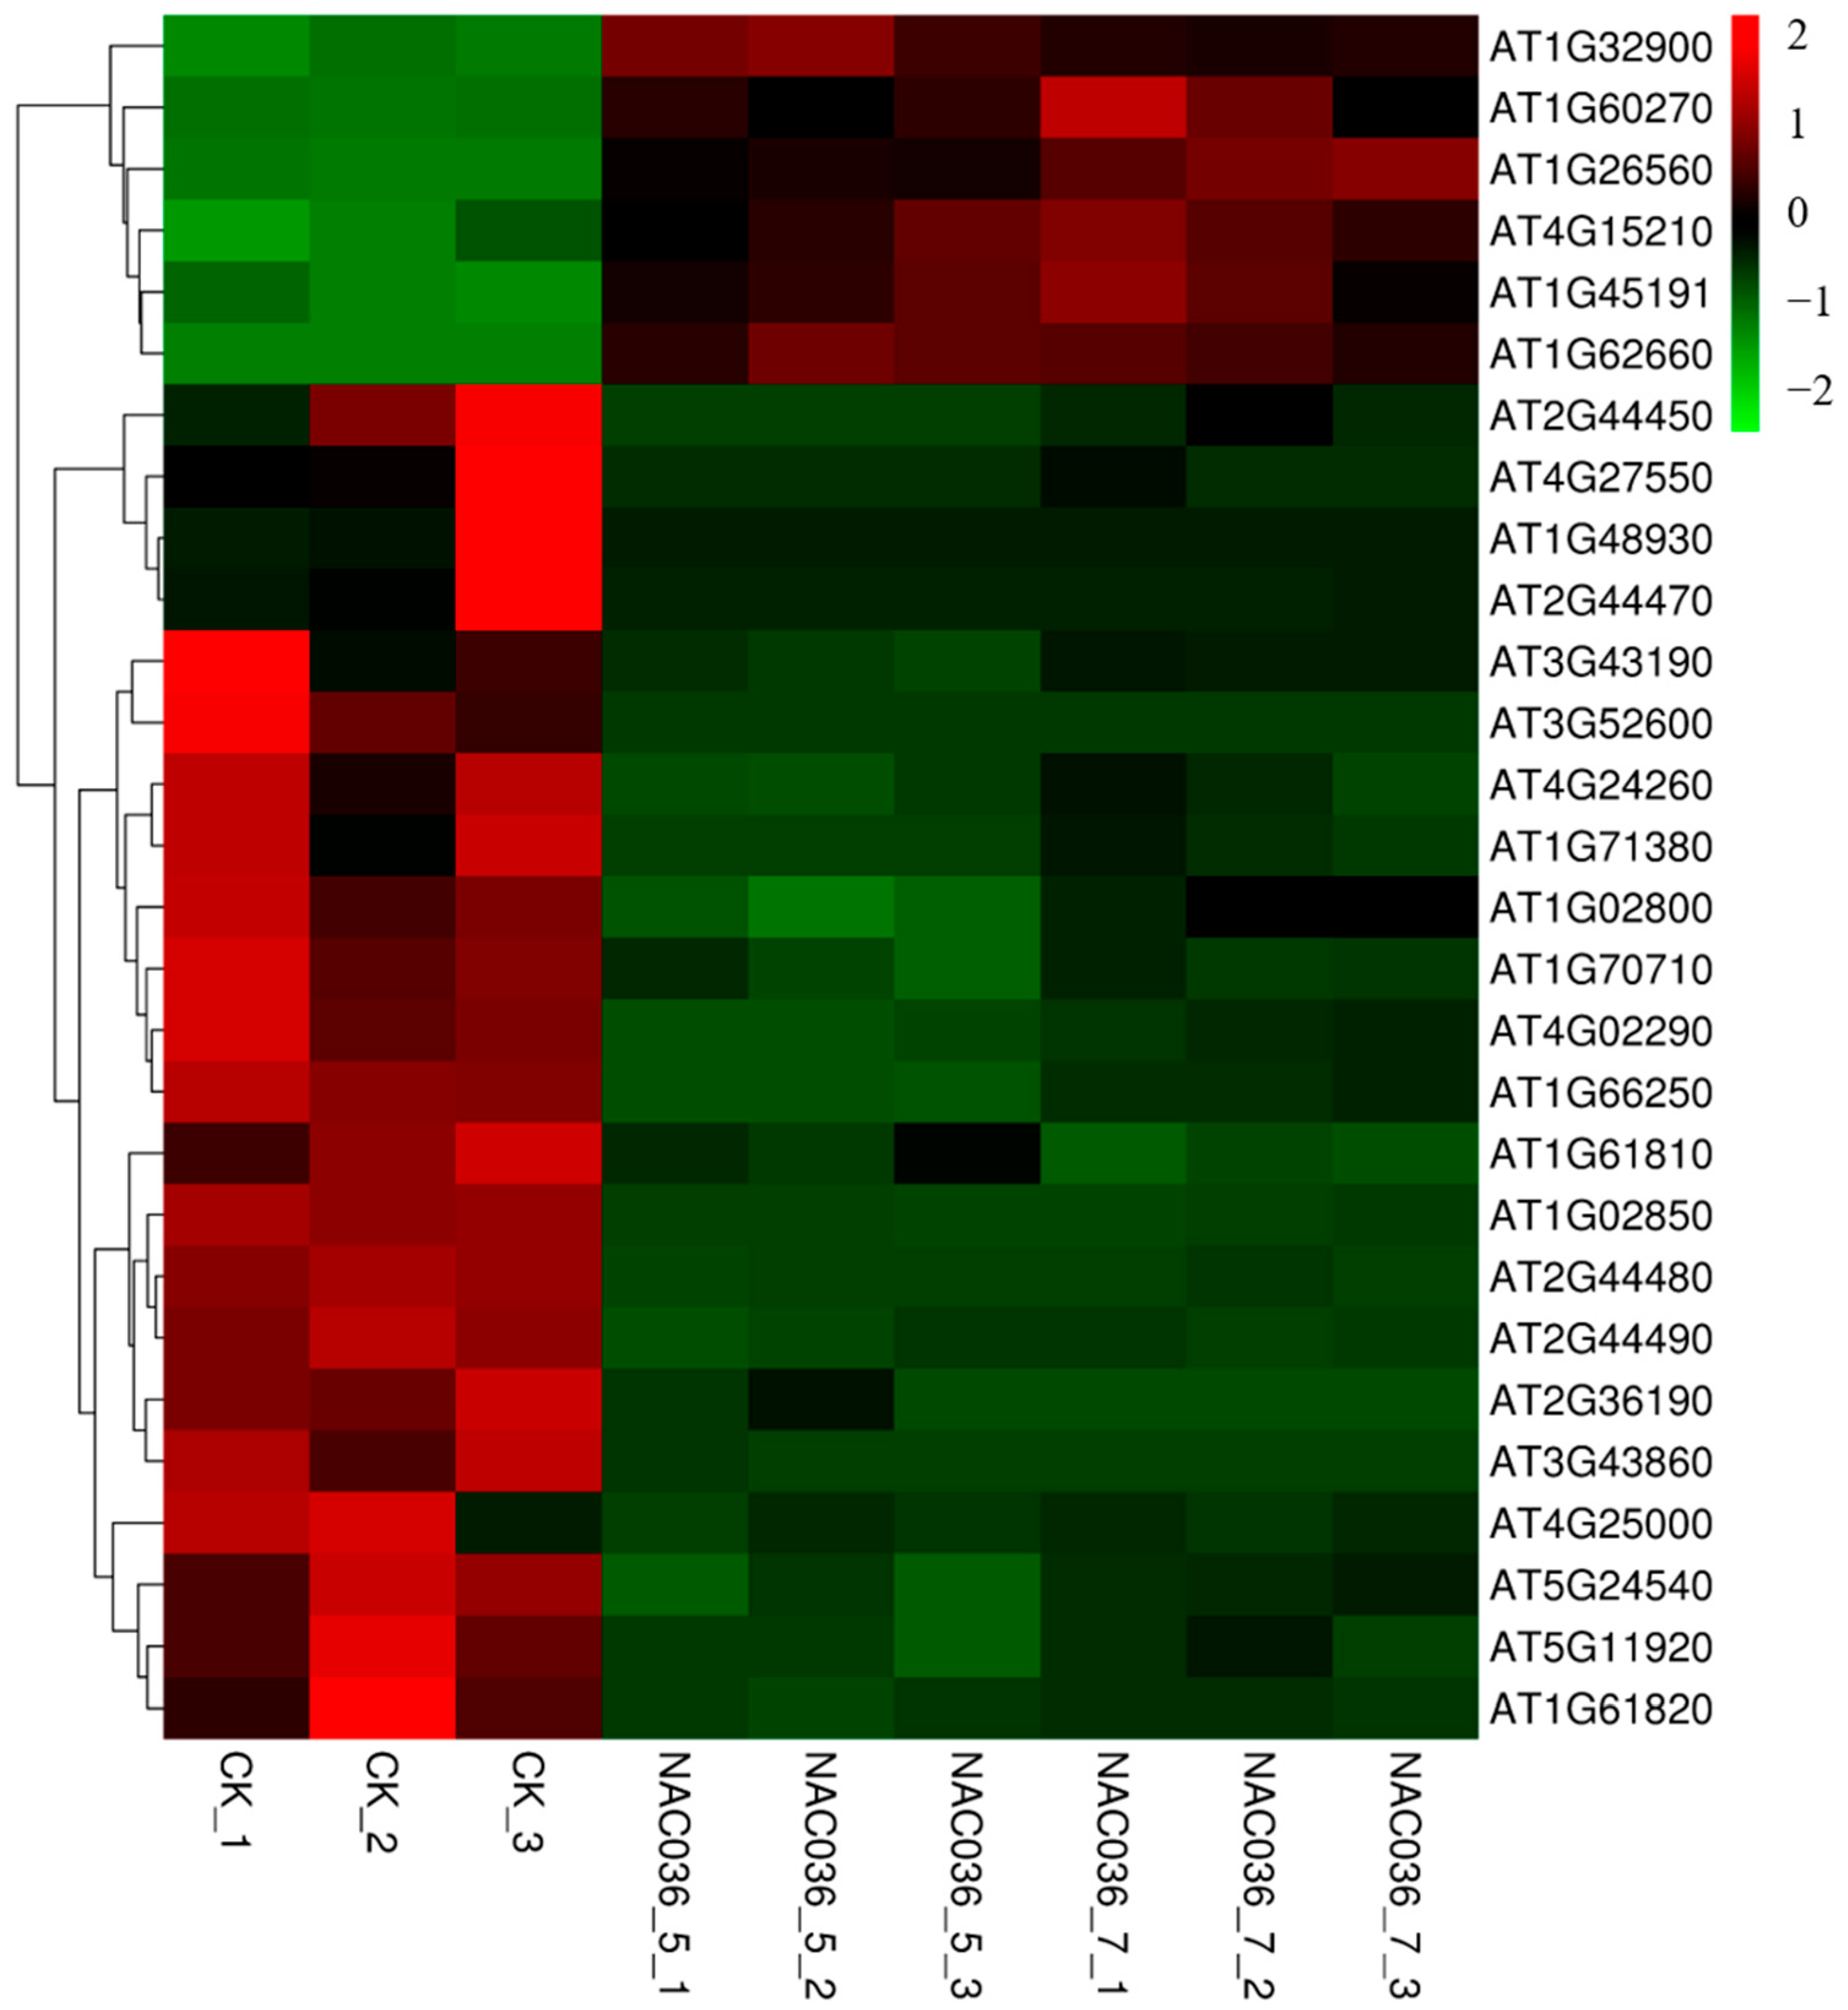
In the starch and sucrose metabolism pathway, a total of 28 differentially expressed genes were identified. Among them, genes such as AT1G60270 (BGLU6), AT1G45191 (BGLU1), AT4G15210 (BAM5), AT1G26560 (BGLU40), AT1G32900 (GBSS1), and AT1G62660 are upregulated, while the other 22 genes are downregulated (Figure A9). Specifically, different genes have distinct functions. AT1G70710 (CEL) is related to plant growth, xylem development, and cell wall thickening; AT1G48930 (GH9C1) is associated with root hair formation, cell wall weakening during growth, and the successive rupture of the endosperm cell wall; AT4G25000 (AMY1) is highly expressed in leaves, stems, and flowers and is related to flowering time. AT3G43860 (GH9A4) may play a role in pollen and pollen tube growth. AT3G52600 (CWINV2) mediates sugar signaling and regulates ovule formation by modulating downstream auxin signaling.
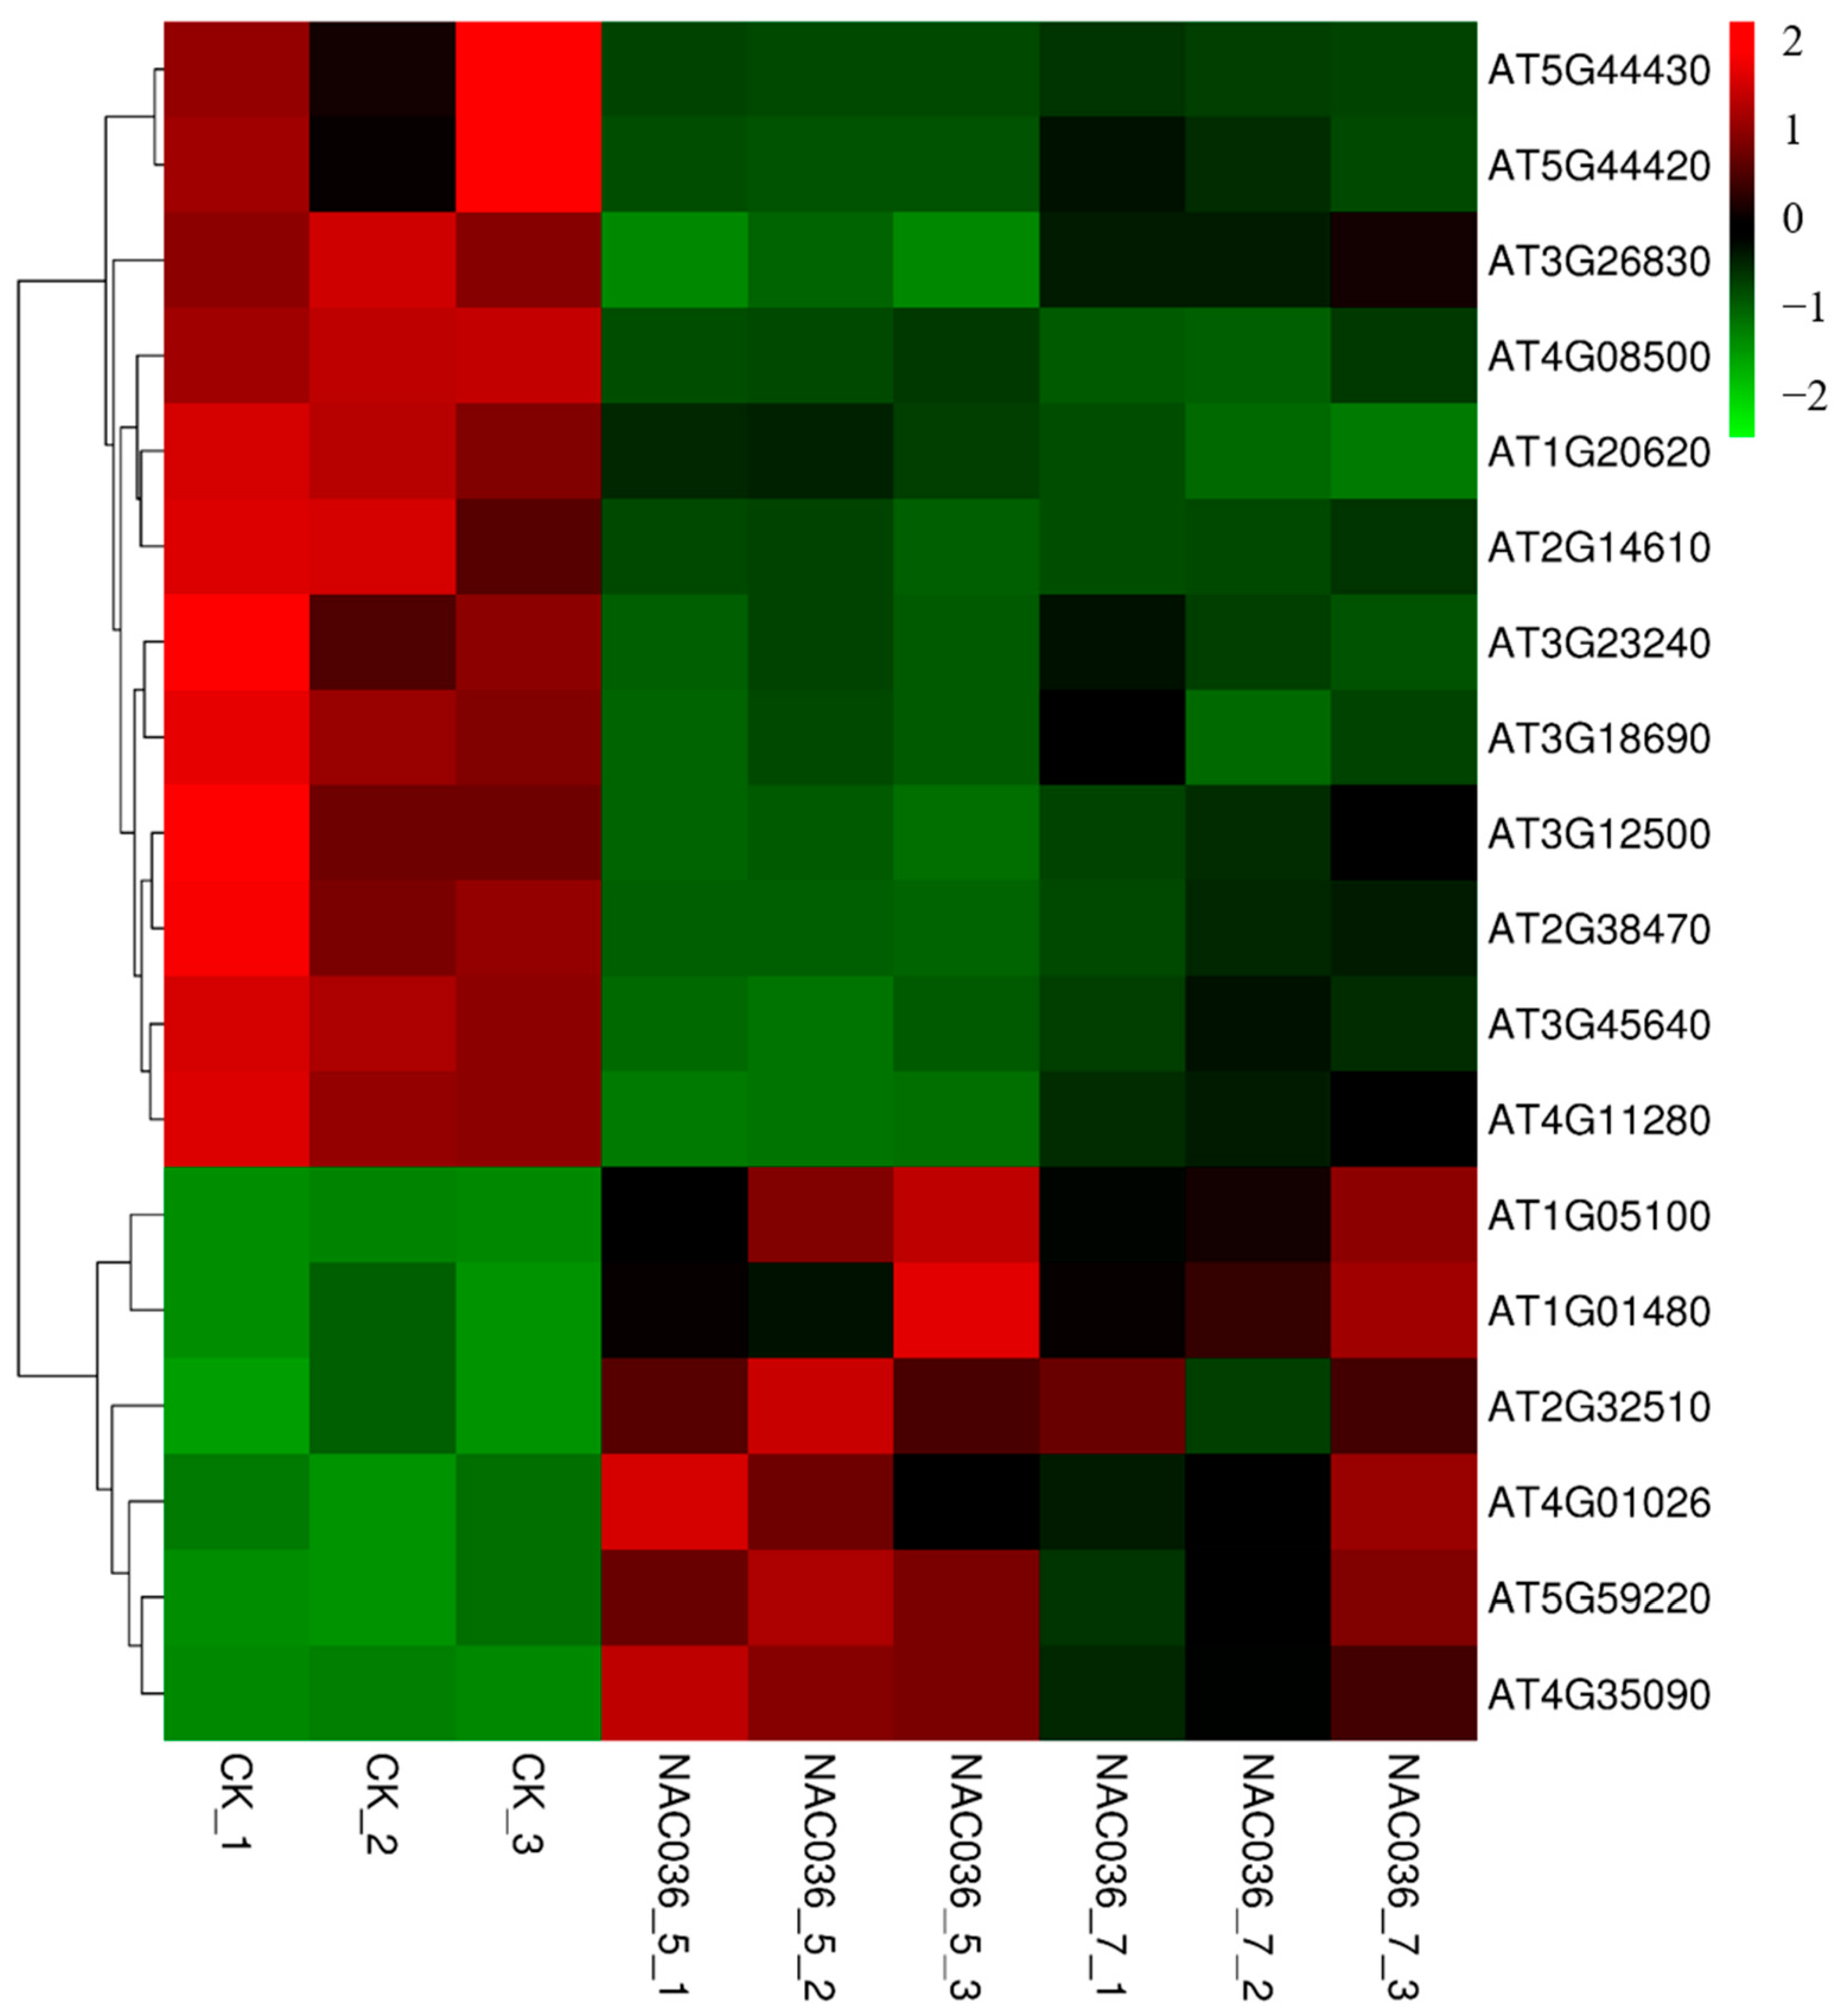
The MAPK pathway is involved in cell proliferation, differentiation, and stress responses in plants. When plants are exposed to exogenous signal stimulation, they activate the MAP kinase kinase kinase (MKKK) through various mechanisms. After phosphorylation, MKKK activates the MAP kinase kinase (MKK), which in turn activates MAPK [23]. After MAPK is phosphorylated, it can further activate downstream protein kinases and transcription factors (such as WRKY), which can regulate the expression of corresponding functional genes, thereby leading to specific physiological and biochemical responses of plant cells to environmental changes [24]. In the MAPK signal transduction pathway, a total of 18 differentially expressed genes were identified. Among them, six genes were upregulated, including AT2G32510 (MAPKKK17), AT1G05100 (MAPKKK18), AT1G01480 (ACS2), AT4G01026 (PYL7), AT5G59220 (HAI1), and AT4G35090 (CAT2). On the other hand, 12 genes were downregulated, including AT3G45640 (MPK3), AT3G26830 (PAD3), AT1G20620 (CAT3), AT3G12500 (HCHIB), AT4G08500 (MEKK1), AT4G11280 (ACS6), AT2G14610 (PR1), AT3G23240 (ERF1), AT3G18690 (MKS1), AT5G44430 (PDF1.2c), AT5G44420 (PDF1.2), and AT2G38470 (WRKY33) (Figure A10).

4. Discussion

Peach, as a major fruit crop in China, has its fruit yield and quality closely linked to economic returns. During peach growth, excessive vegetative shoots and canopy overcrowding negatively affect reproductive development. The NAC transcription factor family, unique to plants, exhibits functional diversity due to structural variability and plays critical roles in plant growth, development, and stress responses. Studies demonstrate that GA positively regulates tree size by inducing the degradation of DELLA proteins, GA signaling repressors. The peach DELLA protein PpeDGYL interacts with growth-related proteins PpeARF6-1 and PpeARF6-2. It remains undegraded under GA treatment, and causes dwarf phenotypes when overexpressed in Arabidopsis and poplar [25]. SlNAC5 and SlNAC7-10 transcription levels are differentially induced by hormones, including IAA, GA3, and ABA [26]. In rice, OsWRKY5 indirectly upregulates senescence-related genes OsNAP and OsNAC2 to participate in ABA biosynthesis [27]. This study found that seed germination was delayed in PpNAC036-overexpressing Arabidopsis. GA, ABA, and auxin collectively regulate seed germination. GA activity influences auxin levels and transport during germination, indicating crosstalk among these hormones [7]. Hormone treatments revealed that transgenic Arabidopsis had an enhanced sensitivity to IAA and GA. Endogenous hormone analysis showed elevated auxin, GA, and cytokinin levels alongside reduced ABA in overexpression lines. In the ABA signaling pathway, PpNAC036 upregulates ABA biosynthesis-inhibiting genes PYL7 and HAI1. ABI5 regulates seed germination via feedback regulation of PYL receptor gene expression [28]. Furthermore, PpNAC036 participates in the auxin and GA signaling pathways, suggesting its role in modulating seed germination through phytohormone signaling.
NAC transcription factors play critical roles in plant tissue growth and development. In Arabidopsis, AtNAP, AtNAC016, and AtNAC2 are involved in leaf senescence [29,30,31,32]. AtNAP mediates leaf senescence by promoting chlorophyll degradation through its involvement in GA and ABA biosynthesis [29,30,31,32]. NAC transcription factors regulating lateral root growth have been identified in potato and soybean [33]. A novel auxin-OsNAC2-cytokinin model has been proposed. In this model, OsNAC2 regulates rice root development by mediating the auxin and cytokinin pathways [6]. In soybean, GmNAC19 enhances root length and biomass, and its overexpression can improve grain yield under drought conditions [34]. This study observed shorter hypocotyls and roots in PpNAC036-overexpressing Arabidopsis seedlings compared to wild-type. However, when cultivated in soil for 30 days, the transgenic plants exhibited more vigorous rosette leaf growth with significantly increased leaf length and width. Fresh weight and dry weight of the transgenic plants were also markedly higher than those of the wild-type plants. These results suggest that PpNAC036 may inhibit the elongation of plant organs during the early seedling stages. Nevertheless, it strongly promotes plant growth in the later stages. The lignin biosynthesis pathway constitutes a vast and complex transcriptional regulatory network, in which NAC transcription factors are key participants [35]. Several NAC family members have been reported to be involved in lignin synthesis in rice, eucalyptus, Melilotus albus, and poplar [36,37,38,39]. Transcriptome sequencing of wild-type and PpNAC036-overexpressing Arabidopsis lines identified 2797 differentially expressed genes (DEGs). GO enrichment analysis revealed predominant enrichment in biological processes (BP), including secondary metabolic processes, cellular response to oxygen levels, and polysaccharide metabolism. Cellular component (CC) enrichment involved the apoplast, cell wall, pollen tube, and plant-type cell wall, while molecular function (MF) enrichment included hydrolase activity acting on glycosyl bonds, aspartic esterase activity, carboxylic ester hydrolase activity, pectinesterase activity, and calmodulin binding. KEGG pathway analysis identified multiple peroxidase-encoding genes associated with lignin synthesis in the phenylalanine metabolism pathway. Notably, AT1G14540 (PER4), a photoperiod-regulated alkaline peroxidase, is critical for cell wall lignification [40], and AT5G42180 (PER64) participates in sclerenchyma lignification [41]. These results indicate that PpNAC036 most likely functions as a key transcription factor in the lignin biosynthetic pathway. This study also found a delayed flowering phenomenon in PpNAC036-overexpressing Arabidopsis, which is consistent with the delayed flowering phenotype observed in OsNAC2-overexpressing rice [6]. Low temperature is a key factor influencing flowering time, and plant cold-stress response pathways and flowering time regulation overlap. It has been found that PpNAC036 overexpression downregulates CO expression. However, the potential role of PpNAC036 in coordinating the flowering time and cold stress pathways requires further investigation. Existing studies indicate that NAC family members regulate both flowering time and floral organ fusion. The cuc1 and cuc2 double mutant exhibits defects in embryonic organ separation, floral organ identity, shoot apical meristem formation, and a reduction in the number of petals and stamens [42]. Increased petal number is regulated by cytokinins, with CUC2 and CUC3 playing critical roles in cytokinin signaling during floral development [43]. Winter et al. proposed that the floral regulator LFY might positively regulate CUC gene expression [44]. qRT-PCR results showed upregulated CUC and LFY expression in PpNAC036-overexpressing Arabidopsis, accompanied by a double-flower phenotype. This suggests that PpNAC036 plays a significant role in floral development.
Based on our findings, we propose that PpNAC036 acts as a pivotal stage-dependent regulator that fine-tunes the balance between plant growth, structural integrity, and developmental transitions. Its multifaceted roles can be categorized into four distinct developmental phases: Seed Germination. During the earliest stage, PpNAC036 functions as a negative regulator of germination. PpNAC036 may exert its function by regulating the balance or sensitivity of ABA/GA. Early Seedling Development. In young seedlings, ectopic expression of PpNAC036 leads to the inhibition of hypocotyl and root elongation. This suppression is likely a consequence of interfered hormone homeostasis, and early secondary cell wall deposition reduces cell wall extensibility, thereby restricting longitudinal growth. As the plant transitions to mature growth, enhancing secondary cell wall thickening and strengthening the vascular system leads to increased stem diameter and total biomass. Finally, PpNAC036 plays a regulatory role in the transition from vegetative to reproductive growth. By modulating key floral integrators and the MAPK signaling pathway, it delays flowering time.
Our findings indicate that the ectopic expression of PpNAC036 in Arabidopsis regulates seed germination, growth, and development, while also mediating responses to hormone signaling. Furthermore, the data suggest it plays a significant regulatory role in lignin biosynthesis and floral organ development. Although further functional validation in peach is necessary, this study identifies PpNAC036 as a promising candidate gene for modulating tree vigor in future research.

5. Conclusions

In this study, we identified PpNAC036, a NAC transcription factor from peach that plays a multifaceted role in plant growth and development. It responds rapidly to various plant growth regulators, particularly IAA and GA. Overexpression of PpNAC036 in Arabidopsis significantly promotes vegetative growth vigor, characterized by increased biomass and stem radial expansion, and PpNAC036 negatively regulates seed germination and delays flowering time.

Author Contributions

Y.T. planned and designed the research. X.L., Y.H. and C.Y. performed the experiments, analyzed the data, and wrote the manuscript draft. D.W., H.W., J.G., X.A. and H.C. provided experimental guidance. All authors have read and agreed to the published version of the manuscript.

Funding

This research was funded by the Modern Agricultural Industry Technology System in Hebei Province (Grant No. HBCT2024160403) China Agriculture Research System (Peach) (CARS-30), and the Natural Science Foundation of Hebei Province (C2023204220).

Data Availability Statement

The original contributions presented in the study are included in the article. During the preparation of this manuscript, the author did not use any generative artificial intelligence tools for generating text, data, or graphics, or for study design, data collection, analysis, or interpretation of data. Sequence data that support the findings of this study have been deposited in NCBI with the accession code PRJNA1414410. The SRA submission will be released on 2030-01-26 or upon publication: https://www.ncbi.nlm.nih.gov/sra/PRJNA1414410 (accessed on 15 February 2026).

Conflicts of Interest

The authors declare no conflicts of interest.

Abbreviations

The following abbreviations are used in this manuscript:
IAAIndole-3-acetic acid
GAGibberellic acid
NAAα-Naphthaleneacetic acid
NPANaptalam
CTKCytokinin
2,4-D2,4-Dichlorophenoxyacenc acid
ABAAbscisic Acid
SAURSmall auxin-up RNA
qRT-PCRQuantitative real-time polymerase
GOGene Ontology
KEGGKyoto Encyclopedia of Genes and Genomes
Col-0Columbia-0
DEGsDifferentially expressed genes

Appendix A

Figure A1. qRT-PCR analysis of Arabidopsis genes.
Horticulturae 12 00247 g0a1
Figure A2. Expression analysis of PpNAC036. Different letters above the bars indicate significant differences.
Horticulturae 12 00247 g0a2
Figure A3. Detection of endogenous hormone content in wild-type and PpNAC036-overexpressing Arabidopsis thaliana leaves. (A) Auxin content in the leaves of wild-type (Col-0) and transgenic lines; (B) Gibberellin content in the leaves of wild-type (Col-0) and transgenic lines; (C) Cytokinin content in the leaves of wild-type (Col-0) and transgenic lines; (D) Abscisic acid (ABA) content in the leaves of wild-type (Col-0) and transgenic lines. For each sample, 20 seedlings were selected for statistical analysis. Different letters above the bars indicate significant differences.
Horticulturae 12 00247 g0a3
Figure A4. Stem thick of Arabidopsis thaliana. For each sample, 20 seedlings were selected for statistical analysis. Different letters above the bars indicate significant differences.
Horticulturae 12 00247 g0a4
Figure A5. Seed germination of Col-0 and PpNAC036 overexpression Arabidopsis thaliana. (A) Germination of Col-0 and PpNAC036-overexpressing lines after 24 h and 36 h of treatment; (B) Germination rate of Col-0 and PpNAC036-overexpressing lines at different time points. Different letters indicate significant differences. Fifty seeds of each Arabidopsis line were sown for each treatment, and each treatment was replicated three times.
Horticulturae 12 00247 g0a5
Figure A6. qRT-PCR analysis of genes related to floral organ development. Different letters above the bars indicate significant differences.
Horticulturae 12 00247 g0a6
Figure A7. Differential expression genes Venn map among samples. (A) DEGs histogram; (B) Venn diagram of DEGs; (C) Common DEGs heatmap. The color scale represents the Z-score of gene expression levels, ranging from green (low expression) to red (high expression).
Horticulturae 12 00247 g0a7
Figure A8. Gene ontology enrichment analysis and KEGG enrichment analysis. (A) Gene Ontology (GO) Enrichment Analysis; (B) KEGG Pathway Enrichment for PpNAC036-5 vs. CK; (C) KEGG Pathway Enrichment for PpNAC036-7 vs. CK.
Horticulturae 12 00247 g0a8
Figure A9. Differential gene heat map of the starch sucrose metabolic pathway. The color scale represents the Z-score of gene expression levels, ranging from green (low expression) to red (high expression). The same applies below.
Horticulturae 12 00247 g0a9
Figure A10. Differential gene heatmap of the MAPK signal transduction pathway. The color scale represents the Z-score of gene expression levels, ranging from green (low expression) to red (high expression). The same applies below.
Horticulturae 12 00247 g0a10
Table A1. Primer sequences.
NamePrimer Sequence (5′→3′)
PpNAC036FTGATCCTTGGGACTTGCCTG
RTTCCTCCACTGCCATGCTTC
ubq5FAACCCTTGAGGTTGAATCATCC
RGTCCTTCTTTCTGGTAAACGT
SVPFTTCCACCGGAAAACTGTTCG
RCACTGTTCTCAACCAGCTGTA
AGL20FGCTCAAGCAAAAGGAGAAAGC
RCGCTTTCATGAGATCCCCACT
ELF3FGACCATCTAGTCAGCCTTGTG
RGCTTGGTTTGCGGCTGAAG
ELF4FATGAAGAGGAACGGCGAGAC
RAAGATTCTCCCACATCGCCG
CCA1FAGAGGAGCTTAGTGATGGAGAC
RCGTATATGGCTTCCGAGTCTTA
FERFAAGTCCTACGCCCGACTACT
RCTGCGGTAAGCACCAAACAC
GIFTTGGTCCGGCATCAGTATCC
RGAAGGACAAACATCGCCAGC
HOS15FACTTCTTGCGTCAGGGTCTG
RACGACCAGTATGCACAGCTT
COFAAGAATCAAGGGGCCACCAG
RGGATGAAATGTATGCGTTATGGT
FLDFGAGACAATGCCACCCACTGA
RCCTTGAGGTTCATAAATACCCCT
FTFACTGGAACAACCTTTGGCAAT
RCTGCCAAGCTGTCGAAACAA
PTLFGAAGGTGGCCGAGACAAGAA
RTGTTCCTCGGACATAATCCTAGA
miR164cFACTTGATGGAGAAGCAGGGC
RGGAGTAGTAGAACACGTGCG
AGFACCCATCTCTTCACCAGCAC
RTACTAGCCTGACCTGTTGGG
LFYFGTCATTTGCTACTCTCCGCC
RAACCCTGTCCAATCATCTTCTT
CAD5FCACACATAAACAGCAAAAGCGTG
RTCCTCTGGTCCAGTCTCTCTAA
CAD9FTCCCTCTTGTTCTCGGAAGGA
RGCCTCTCCATCGCAGTGTTA
CCR1FGGCGACGTTATCGATTCTAAGATCA
RAATCGCATCCCTCATGGCTT
ELI3-2FAAGAGGCGTTCGGATTAGCC
RCCACGATCTCATGCCCTGG
PRX71FCCGGTCCGAACCTCAATCTC
RAGCCTGTTCCTTGAGTGAGAA
MYB77FTTTGCTCCGGTGGATACTGG
RCTGCGGAACCACCGTAAAAC
HB-2FCAAACGGAGGTAGACTGCGA
RGTCAAAGTAGTGGGTGGGCT
ERF6FGACGGCGATAGATGACTGGG
RGGTGTGGAGATAACGGCGAT
CUC1FGGAGAGAAGAGTTGTTGGGTCA
RGAGAACCCATTCATCCTTAGCG
NAPFCGTGTTCGCTGGCTCATTTG
RCCCCGAACCAACTAGACTCC
NAC036FTGGAGCAAAGGGCAGAGATG
RTACTTGAGGAGCACGGAACG
NAC6FTGTCCACGAGTCCAAAGACG
RTGTACCGGACGAATCACGAC
ERF104FGCGGCTAGGGTTAAAGTGGA
RCCATCTCCTGCTCCCACATC
CUC2FTGCACTTGTTGGGATGAAGAAG
RATCACCCATTCATCCTTGGAGC
CUC3FGGTCTCTCCGGCATTCACAT
RCCCATCTTCGCCATTTCTGGT

References

  1. Wang, X.; Yan, L.; Li, T.; Zhang, J.; Zhang, Y.; Zhang, J.; Lian, X.; Zhang, H.; Zheng, X.; Hou, N.; et al. The lncRNA1-miR6288b-3p-PpTCP4-PpD2 module regulates peach branch number by affecting brassinosteroid biosynthesis. New Phytol. 2024, 243, 1050–1064. [Google Scholar] [CrossRef]
  2. Chen, X.; Lu, S.; Wang, Y.; Zhang, X.; Lv, B.; Luo, L.; Xi, D.; Shen, J.; Ma, H.; Ming, F. OsNAC2 encoding a NAC transcription factor that affects plant height through mediating the gibberellic acid pathway in rice. Plant J. 2015, 82, 302–314. [Google Scholar] [CrossRef]
  3. Du, M.; Spalding, E.P.; Gray, W.M. Rapid Auxin-Mediated Cell Expansion. Annu. Rev. Plant Biol. 2020, 71, 379–402. [Google Scholar] [CrossRef]
  4. Feraru, E.; Feraru, M.I.; Barbez, E.; Waidmann, S.; Sun, L.; Gaidora, A.; Kleine-Vehn, J. PILS6 is a temperature-sensitive regulator of nuclear auxin input and organ growth in Arabidopsis thaliana. Proc. Natl. Acad. Sci. USA 2019, 116, 3893–3898. [Google Scholar] [CrossRef]
  5. Li, L.; Gallei, M.; Friml, J. Bending to auxin: Fast acid growth for tropisms. Trends Plant Sci. 2022, 27, 324–326. [Google Scholar] [CrossRef]
  6. Mao, C.; He, J.; Liu, L.; Deng, Q.; Yao, X.; Liu, C.; Qiao, Y.; Li, P.; Ming, F. OsNAC2 integrates auxin and cytokinin pathways to modulate rice root development. Plant Biotechnol. J. 2019, 18, 429–442. [Google Scholar] [CrossRef] [PubMed]
  7. Song, J.; Liu, X.; Li, X.; Wang, H.; Chu, R.; Qu, F.; Zhang, S.; Li, Q. Transcriptome Analysis Reveals Genes and Pathways Associated with Salt Tolerance during Seed Germination in Suaeda liaotungensis. Int. J. Mol. Sci. 2022, 23, 12229. [Google Scholar] [CrossRef]
  8. Zhang, B.; Gao, Y.; Zhang, L.; Zhou, Y. The plant cell wall: Biosynthesis, construction, and functions. J. Integr. Plant Biol. 2020, 63, 251–272. [Google Scholar] [CrossRef] [PubMed]
  9. Lyczakowski, J.J.; Bourdon, M.; Terrett, O.M.; Helariutta, Y.; Wightman, R.; Dupree, P. Structural Imaging of Native Cryo-Preserved Secondary Cell Walls Reveals the Presence of Macrofibrils and Their Formation Requires Normal Cellulose, Lignin and Xylan Biosynthesis. Front. Plant Sci. 2019, 10, 1398. [Google Scholar] [CrossRef]
  10. Sun, Q.; Huang, J.; Guo, Y.; Yang, M.; Guo, Y.; Li, J.; Zhang, J.; Xu, W. A cotton NAC domain transcription factor, GhFSN5, negatively regulates secondary cell wall biosynthesis and anther development in transgenic Arabidopsis. Plant Physiol. Biochem 2020, 146, 303–314. [Google Scholar] [CrossRef] [PubMed]
  11. Singh, S.; Koyama, H.; Bhati, K.K.; Alok, A. Correction to: The biotechnological importance of the plant-specific NAC transcription factor family in crop improvement. J. Plant Res. 2021, 134, 643. [Google Scholar] [CrossRef]
  12. Han, K.; Zhao, Y.; Sun, Y.; Li, Y. NACs, generalist in plant life. Plant Biotechnol. J. 2023, 21, 2433–2457. [Google Scholar] [CrossRef] [PubMed]
  13. Hong, R.; Lee, C.; Haghighat, M.; Ye, Z.-H. Xylem vessel-specific SND5 and its homologs regulate secondary wall biosynthesis through activating secondary wall NAC binding elements. New Phytol. 2021, 231, 1496–1509. [Google Scholar] [CrossRef]
  14. Takata, N.; Awano, T.; Nakata, M.T.; Sano, Y.; Sakamoto, S.; Mitsuda, N.; Taniguchi, T. Populus NST/SND orthologs are key regulators of secondary cell wall formation in wood fibers, phloem fibers and xylem ray parenchyma cells. Tree Physiol. 2019, 39, 514–525. [Google Scholar] [CrossRef]
  15. Liu, X.; Li, H.; Xiao, Y.; Hao, X.; Wang, M.; Song, Y.; Zhang, R. Genome-Wide Identification of LAC and CAD Gene Family and the Function of Lignin Biosynthesis by Co-Expressed PsiLAC8-PsiCAD5 Module in Populus simonii. Plant Physiol. Biochem. 2026, 230, 110742. [Google Scholar] [CrossRef]
  16. Sharma, M.; Masood, J.; Kerchev, P.; Mozgova, I.; Wrzaczek, M. GCN5 Negatively Regulates Class III Peroxidases PRX71 and PRX33 to Promote Lignin Deposition in Arabidopsis. bioRxiv 2026. [Google Scholar] [CrossRef]
  17. Fan, K.; Wu, Y.; Mao, Z.; Yin, K.; He, Y.; Pan, X.; Zhu, X.; Liao, C.; Cui, L.; Jia, Q.; et al. A novel NAC transcription factor ZmNAC55 negatively regulates drought stress in Zea mays. Plant Physiol. Biochem. 2024, 214, 108938. [Google Scholar] [CrossRef] [PubMed]
  18. Jing, Y.; Shen, C.; Li, W.; Peng, L.; Hu, M.; Zhang, Y.; Zhao, X.; Teng, W.; Tong, Y.; He, X. TaLBD41 interacts with TaNAC2 to regulate nitrogen uptake and metabolism in response to nitrate availability. New Phytol. 2024, 242, 641–657. [Google Scholar] [CrossRef]
  19. Ait Hammou, R.; Ben El Caid, M.; Harrouni, C.; Daoud, S. Germination enhancement, antioxidant enzyme activity, and metabolite changes in late Argania spinosa kernels under salinity. J. Arid Environ. 2023, 219, 105095. [Google Scholar] [CrossRef]
  20. van Rooijen, R.; Schulze, S.; Petzsch, P.; Westhoff, P. Targeted misexpression of NAC052, acting in H3K4 demethylation, alters leaf morphological and anatomical traits in Arabidopsis thaliana. J. Exp. Bot. 2020, 71, 1434–1448. [Google Scholar] [CrossRef]
  21. Woo, J.-E.; Choi, Y.-Y.; Park, J.; Jung, J.-H. TOE1 interacts with FLM and SVP to repress flowering in Arabidopsis. J. Plant Biol. 2026, 69, 63–73. [Google Scholar] [CrossRef]
  22. Tao, R.; Trivedi, I.; Trimborn, L.; Ponnu, J.; Tóth, B.V.; Hoecker, U. TCP3 is a substrate of the COP1/SPA ubiquitin ligase to regulate anthocyanin accumulation and flowering time in Arabidopsis. Proc. Natl. Acad. Sci. USA 2025, 122, e2426423122. [Google Scholar] [CrossRef]
  23. Zhang, M.; Zhang, S. Mitogen-activated protein kinase cascades in plant signaling. J. Integr. Plant Biol. 2022, 64, 301–341. [Google Scholar] [CrossRef]
  24. Dong, N.-Q.; Lin, H.-X. Contribution of phenylpropanoid metabolism to plant development and plant–environment interactions. J. Integr. Plant Biol. 2020, 63, 180–209. [Google Scholar] [CrossRef] [PubMed]
  25. Chen, Y.; Zhang, M.; Wang, X.; Shao, Y.; Hu, X.; Cheng, J.; Zheng, X.; Tan, B.; Ye, X.; Wang, W.; et al. Peach DELLA Protein PpeDGYLA Is Not Degraded in the Presence of Active GA and Causes Dwarfism When Overexpressed in Poplar and Arabidopsis. Int. J. Mol. Sci. 2023, 24, 6789. [Google Scholar] [CrossRef]
  26. Zhu, M.; Hu, Z.; Zhou, S.; Wang, L.; Dong, T.; Pan, Y.; Chen, G. Molecular Characterization of Six Tissue-Specific or Stress-Inducible Genes of NAC Transcription Factor Family in Tomato (Solanum lycopersicum). J. Plant Growth Regul. 2014, 33, 730–744. [Google Scholar] [CrossRef]
  27. Kim, T.; Kang, K.; Kim, S.-H.; An, G.; Paek, N.-C. OsWRKY5 Promotes Rice Leaf Senescence via Senescence-Associated NAC and Abscisic Acid Biosynthesis Pathway. Int. J. Mol. Sci. 2019, 20, 4437. [Google Scholar] [CrossRef]
  28. Zhao, H.; Nie, K.; Zhou, H.; Yan, X.; Zhan, Q.; Zheng, Y.; Song, C.-P. ABI5 modulates seed germination via feedback regulation of the expression of the PYR/PYL/RCAR ABA receptor genes. New Phytol. 2020, 228, 596–608. [Google Scholar] [CrossRef] [PubMed]
  29. Peng, H.; Zhai, Y.; Neff, M.M. The NAC Transcription Factor ATAF2 Enhances Arabidopsis Biomass and Chlorophyll a Accumulations at the Early Growth Stage. BMC Res. Notes 2025, 18, 388. [Google Scholar] [CrossRef]
  30. Qiu, K.; Li, Z.; Yang, Z.; Chen, J.; Wu, S.; Zhu, X.; Gao, S.; Gao, J.; Ren, G.; Kuai, B.; et al. EIN3 and ORE1 Accelerate Degreening during Ethylene-Mediated Leaf Senescence by Directly Activating Chlorophyll Catabolic Genes in Arabidopsis. PLoS Genet. 2015, 11, e1005399. [Google Scholar] [CrossRef] [PubMed]
  31. Sakuraba, Y.; Han, S.-H.; Lee, S.-H.; Hörtensteiner, S.; Paek, N.-C. Arabidopsis NAC016 promotes chlorophyll breakdown by directly upregulating STAYGREEN1 transcription. Plant Cell Rep. 2015, 35, 155–166. [Google Scholar] [CrossRef]
  32. Lei, W.; Li, Y.; Yao, X.; Qiao, K.; Wei, L.; Liu, B.; Zhang, D.; Lin, H. NAP is involved in GA-mediated chlorophyll degradation and leaf senescence by interacting with DELLAs in Arabidopsis. Plant Cell Rep. 2019, 39, 75–87. [Google Scholar] [CrossRef]
  33. Zhang, L.; Yao, L.; Zhang, N.; Yang, J.; Zhu, X.; Tang, X.; Calderón-Urrea, A.; Si, H. Lateral Root Development in Potato Is Mediated by Stu-mi164 Regulation of NAC Transcription Factor. Front. Plant Sci. 2018, 9, 383. [Google Scholar] [CrossRef]
  34. Mazarei, M.; Coffey, N.; Shipp, S.E.A.; Stewart, C.N.; Hewezi, T. Increased root growth and seed yield in transgenic soybean overexpressing NAC genes GmNAC19 and GmGRAB1. Plant Cell Rep. 2025, 44, 154. [Google Scholar] [CrossRef] [PubMed]
  35. Wang, Y.; Hou, Y.; Wang, J.; Zhao, H. Analyzing lignin biosynthesis pathways in rattan using improved co-expression networks of NACs and MYBs. BMC Plant Biol. 2022, 22, 411. [Google Scholar] [CrossRef]
  36. Chen, L.; Wu, F.; Zhang, J. NAC and MYB families and lignin biosynthesis-related members identification and expression analysis in Melilotus albus. Plants 2021, 10, 303. [Google Scholar] [CrossRef]
  37. Yang, Y.; Yoo, C.G.; Rottmann, W.; Winkeler, K.A.; Collins, C.M.; Gunter, L.E.; Jawdy, S.S.; Yang, X.; Pu, Y.; Ragauskas, A.J.; et al. PdWND3A, a wood-associated NAC domain-containing protein, affects lignin biosynthesis and composition in Populus. BMC Plant Biol. 2019, 19, 486. [Google Scholar] [CrossRef]
  38. Sun, Y.; Jiang, C.; Jiang, R.; Wang, F.; Zhang, Z.; Zeng, J. A Novel NAC Transcription Factor From Eucalyptus, EgNAC141, Positively Regulates Lignin Biosynthesis and Increases Lignin Deposition. Front. Plant Sci. 2021, 12, 642090. [Google Scholar] [CrossRef] [PubMed]
  39. Jung, S.E.; Kim, T.H.; Shim, J.S.; Bang, S.W.; Bin Yoon, H.; Oh, S.H.; Kim, Y.S.; Oh, S.-J.; Seo, J.S.; Kim, J.-K. Rice NAC17 transcription factor enhances drought tolerance by modulating lignin accumulation. Plant Sci. 2022, 323, 111404. [Google Scholar] [CrossRef] [PubMed]
  40. Fernández-Pérez, F.; Vivar, T.; Pomar, F.; Pedreño, M.A.; Novo-Uzal, E. Peroxidase 4 is involved in syringyl lignin formation in Arabidopsis thaliana. J. Plant Physiol. 2015, 175, 86–94. [Google Scholar] [CrossRef]
  41. Barzegargolchini, B.; Movafeghi, A.; Dehestani, A.; Mehrabanjoubani, P. Increased cell wall thickness of endodermis and protoxylem in Aeluropus littoralis roots under salinity: The role of LAC4 and PER64 genes. J. Plant Physiol. 2017, 218, 127–134. [Google Scholar] [CrossRef] [PubMed]
  42. González-Carranza, Z.H.; Zhang, X.; Peters, J.L.; Boltz, V.; Szecsi, J.; Bendahmane, M.; Roberts, J.A. HAWAIIAN SKIRT controls size and floral organ number by modulating CUC1 and CUC2 expression. PLoS ONE 2017, 12, e0185106. [Google Scholar] [CrossRef]
  43. Gonçalves, B.; Hasson, A.; Belcram, K.; Cortizo, M.; Morin, H.; Nikovics, K.; Vialette-Guiraud, A.; Takeda, S.; Aida, M.; Laufs, P.; et al. A conserved role for CUP-SHAPED COTYLEDON genes during ovule development. Plant J. 2015, 83, 732–742. [Google Scholar] [CrossRef] [PubMed]
  44. Winter, C.M.; Austin, R.S.; Blanvillain-Baufumé, S.; Reback, M.A.; Monniaux, M.; Wu, M.-F.; Sang, Y.; Yamaguchi, A.; Yamaguchi, N.; Parker, J.E.; et al. LEAFY Target Genes Reveal Floral Regulatory Logic, cis Motifs, and a Link to Biotic Stimulus Response. Dev. Cell 2011, 20, 430–443. [Google Scholar] [CrossRef] [PubMed]
Figure 1. Expression analysis of PpNAC036 under different hormone treatments by qRT-PCR. (A) Effect of IAA treatment; (B) Effect of ABA treatment; (C) Effect of NPA treatment; (D) Effect of GA treatment; (E) Transcriptional self-activation test results, The ‘+’ symbol in the table indicates positive transactivation activity. n = 3. Data represent means ± SE from n independent biological replicates. Significant differences were detected using Duncan’s multiple-range test (p < 0.05), and different letters above the data points in the line chart indicate significant differences. The same applies below.
Horticulturae 12 00247 g001
Figure 2. Effect of PpNAC036 overexpression on root and hypocotyl growth in Arabidopsis. (A) Phenotypes of 7-day-old seedlings of wild-type (Col-0) and PpNAC036-overexpressing lines (PpNAC036-5 and PpNAC036-7) grown on MS medium; (B) Root length of Col-0 and PpNAC036-overexpressing lines; (C) Hypocotyl length of Col-0 and PpNAC036-overexpressing lines. For each sample, 20 seedlings were selected for statistical analysis, and different letters above the bars indicate significant differences.
Horticulturae 12 00247 g002
Figure 3. Effect of PpNAC036 overexpression on root growth responses of Arabidopsis to different plant growth regulators. (A) Root growth inhibition rates of wild-type (Col-0) and PpNAC036-overexpressing lines (PpNAC036-5 and PpNAC036-7) under different concentrations of IAA treatment (50, 75, and 100 nM); (B) Root growth inhibition rates of Col-0 and PpNAC036-overexpressing lines under GA treatment (100 and 200 μM); (C) Root growth inhibition rates of Col-0 and PpNAC036-overexpressing lines under NAA treatment (250 and 300 nM); (D) Root growth inhibition rates of Col-0 and PpNAC036-overexpressing lines under NPA treatment (10 and 20 μM); (E) Root growth inhibition rates of Col-0 and PpNAC036-overexpressing lines under 2,4-D treatment (50 and 100 nM). Different letters indicate significant differences. For each sample, 20 seedlings were selected for statistical analysis. Different letters above the bars indicate significant differences.
Horticulturae 12 00247 g003
Figure 4. Effects of PpNAC036 overexpression on vegetative growth of Arabidopsis thaliana cultivated for 30 days; (A) Phenotypes of wild-type (Col-0) and transgenic lines (PpNAC036-5 and PpNAC036-7); (B) Fresh weight; (C) Dry weight; (D) Leaf length; (E) Leaf width. For each sample, 20 seedlings were selected for statistical analysis. Different letters above the bars indicate significant differences.
Horticulturae 12 00247 g004
Figure 5. Lignin content detection and related gene expression analysis. (A) Lignin content in stems of 60-day-old wild-type (Col-0) and transgenic lines; (B) Relative expression levels of lignin biosynthesis genes determined by qRT-PCR in wild-type and transgenic lines. Data represent means ± SE from three independent biological replicates; the same applies below. Different letters above the bars indicate significant differences.
Horticulturae 12 00247 g005
Figure 6. Germination of wild-type (Col-0) and PpNAC036-overexpressing Arabidopsis thaliana seeds under abiotic stress conditions. (A) Seed germination phenotypes of WT (Col-0) and PpNAC036-overexpressing Arabidopsis lines under different stress treatments. Images show germination on MS medium (control), 100 mM NaCl, 150 mM mannitol, and 200 mM mannitol for 2 to 6 days; (B) Germination rates of WT (Col-0) and PpNAC036-overexpressing lines under different treatments (MS control, 100 mM NaCl, 150 mM mannitol, and 200 mM mannitol) over time (2, 3, 4, 5, and 6 days). Fifty seeds of each Arabidopsis line were sown for each treatment, and each treatment was replicated three times. Different letters indicate significant differences.
Horticulturae 12 00247 g006
Figure 7. Phenotypic of Col-0 and overexpressed Arabidopsis thaliana and RT-PCR analysis of flowering time-related genes. (A) Rosette leaf phenotype; (B) Floral organ phenotype; (C) Relative expression levels of key flowering-related genes. Different letters above the bars indicate significant differences.
Horticulturae 12 00247 g007
Figure 8. Differential gene heat map of plant hormone signal transduction pathway. The color scale represents the Z-score of gene expression levels, ranging from green (low expression) to red (high expression). The same applies below.
Horticulturae 12 00247 g008
Disclaimer/Publisher’s Note: The statements, opinions and data contained in all publications are solely those of the individual author(s) and contributor(s) and not of MDPI and/or the editor(s). MDPI and/or the editor(s) disclaim responsibility for any injury to people or property resulting from any ideas, methods, instructions or products referred to in the content.