Article

Biostimulatory Effects of Seaweed Extracts and Beneficial Fungi and Bacteria on Crop Performance and Chemical Profile of Sonchus oleraceus, Cichorium spinosum and Scolymus hispanicus


by
Nikolaos Polyzos
1,
Christina Chaski
1,
Giannis Neofytou
2,
Nikolaos Tzortzakis
2 and
Spyridon A. Petropoulos
1,*
1
Laboratory of Vegetable Production, Department of Agriculture Crop Production and Rural Environment, University of Thessaly, Fytokou Street, 38446 Volos, Greece
2
Department of Agricultural Sciences, Biotechnology and Food Science, Cyprus University of Technology, 3603 Limassol, Cyprus
*
Author to whom correspondence should be addressed.
Horticulturae 2026, 12(2), 177; https://doi.org/10.3390/horticulturae12020177
Submission received: 24 December 2025 / Revised: 26 January 2026 / Accepted: 27 January 2026 / Published: 31 January 2026

Abstract

Climate change necessitates direct measures in horticultural crop production, including the adoption of sustainable agronomic practices, such as the use of biostimulants and the inclusion of alternative species in agroecosystems. The aim of the present study was to evaluate the effect of two biostimulant formulations, one based on beneficial bacteria and fungi and the other based on seaweed extracts, on the growth, nutritional value, and bioactive properties of three wild edible species, namely, Sonchus oleraceus, Cichorium spinosum, and Scolymus hispanicus, grown in a greenhouse under optimal conditions. Our results indicate that biostimulant application had a variable effect on crop performance depending on the biostimulant formulation and species, with Bactiva showing a clear beneficial effect on the fresh weight, number of leaves, and leaf area of S. oleraceus (increased by 63.2%, 32.4%, and 51.1%, respectively, compared to the control), while seaweed extracts mostly improved the crop performance of S. hispanicus and the number of leaves and the Soil Plant Analysis Development (SPAD) index of C. spinosum (increased by 1.1% and 24.8%, respectively, compared to the control). Moreover, Bactiva significantly increased the leaf protein content of all the studied species (increased by 2.1%, 5.2%, and 6.9% for S. oleraceus, C. spinosum, and S. hispanicus, respectively, compared to the control), whereas a varied response was observed for the rest of the macronutrients, depending on the species and biostimulant. Similarly, the macromineral content (N, P, and K) increased for the application of Bactiva and/or seaweed extracts in S. oleraceus (increased by 2.1%, 22.4%, and 14.0% for N, P and K, respectively, compared to the control) and C. spinosum (increased by 5.2%, 19.3%, and 14.7% for N, P, and K, respectively, compared to the control) leaves, while for S. hispanicus leaves, only N and K increased for Bactiva (increase by 7.0% and 17.9% for N and K, respectively, compared to the control). Finally, the use of the studied biostimulants had a varied effect on the polyphenol content of the three species, and the antioxidant activity also varied among the three assays implemented. In conclusion, the use of biostimulants on these underexplored species showed promising results in terms of crop performance and chemical composition/. However, considering that the plants were subjected to optimal conditions, further research is needed to reveal the stress-mitigating effects of these biostimulant formulations for their integration as a sustainable agronomic tool for the commercial exploitation of wild edible greens.

1. Introduction

Currently, the horticultural species cropping sector must address several challenges related to climate change and the increasing world population, which puts global food security at risk [1,2,3]. Rising temperatures, lack of good-quality irrigation water, and increasing frequency of extreme weather events make it increasingly difficult to meet global food demands and render products less available to the general population due to increasing production costs and high retail prices [4]. The intensification of cropping systems may partially overcome these obstacles, although it is accompanied by the depletion of natural resources and a high environmental burden [5]. The loss of agrobiodiversity is another aspect to consider, as intensified systems are based on monoculture or the cultivation of a low number of species, which affects the conservation and sustainability of agroecosystems [6].
In an effort to slow down biodiversity loss, wild edible species have recently become the focus of the research community due to their valuable nutritional and functional properties, as well as their agronomic adaptability, which renders them potential alternatives to conventional crops for farming in the challenging setting of modern crop production [7,8,9]. This endeavor is crucial for the preservation of agrobiodiversity, which is in decline not only because of monoculture and the shift to high-yielding cultivars and hybrids but also because of anthropogenic activities that disturb the natural habitats of wild edible species [10]. Therefore, several species have been evaluated under various agronomic conditions and in different cropping systems. Sonchus oleraceus L., or common sowthistle, is an annual wild species of the Asteraceae family that is considered an invasive weed owing to its rapid development, broad dispersal around the world, and resilience under variable edaphoclimatic conditions [11]. Although it commonly infests several commercial crops, it is currently considered a promising alternative horticultural species with high adaptability to changing environmental conditions and functional properties that could benefit the human diet [12,13]. Cichorium spinosum L., or spiny chicory, is a native perennial species of the same family that can mostly be found in coastal and rocky areas [14]. It is also highly appreciated by rural communities as a nutritious and health-beneficial edible green with several applications in local cuisine [15]. Similarly, Scolymus hispanicus L., or common golden thistle, is a species of the Asteraceae family that can be found in several circum-Mediterranean countries, mostly in uncultivated fields and roadsides [16].
The use of biostimulants has become a useful agronomic tool that facilitates high yields without negatively affecting the quality of the products, especially under unfavorable conditions due to the prevalence of abiotic stressors and climate change, since these formulations are expected to improve plant tolerance via the regulation of metabolic and physiological processes [17,18,19]. However, apart from using biostimulants when plants face stress conditions, it is a common farming practice to also use them under optimum conditions, especially in horticultural crops, which can compensate for the expected increase in cost production, as they can enhance nutrient and water use efficiency, improve yield and quality of the edible product, and enhance soil health in the long term [20,21].
Biostimulants have been implemented in the cropping of several conventional horticultural species, whereas there is a lack of information regarding their effects on less explored wild edible species [22,23]. For instance, Grammenou et al. [24] suggested that the use of fulvic and humic acids in S. oleraceus and Plantago weldenii plants may alleviate the toxic effects of Cd and allow the use of these species for phytoremediation purposes in contaminated areas, while similar results were reported for other biostimulant formulations (e.g., products based on beneficial bacteria and fungi or humic substances) applied to S. oleraceus grown in mining soil contaminated with potentially toxic elements (e.g., Cd, Cu, Pb and Zn) [25]. Moreover, Ntanasi et al. [26] suggested a varied impact of protein hydrolysates and seaweed extracts on the fresh biomass yield of three underexploited species (e.g., purslane, iceplant, and corn salad) grown in a soilless cropping system under different nitrogen fertilization scenarios. Baldotto et al. [27] also indicated the positive effects of humic acids on root development and initial growth of Achillea millefolium plants, while Carillo et al. [28] suggested the positive effects of a tropical plant extract on Corchorus olitorius L. grown under low-input conditions. In contrast, Voutsinos-Frantzis et al. [29] reported that the fresh leaf weight of C. spinosum plants was beneficially affected by protein hydrolysates only when plants were grown under optimum fertilization and irrigation conditions and not under fertilizer and water constraints, while biostimulatory effects were suggested for fungal culture filtrates on C. intybus plants [30].
In this context, the aim of the present work was to determine the impact of two biostimulant formulations, one based on beneficial bacteria and fungi and the other on seaweed extracts, on the crop performance and chemical composition of three wild edible species, namely, S. oleraceus, S. hispanicus, and C. spinosum, grown under greenhouse conditions. The specific species were selected based on increasing scientific interest and the current efforts of our team to integrate them into commercial cropping systems as alternative edible greens. The main objectives were to test whether biostimulant use has a positive effect on the growth of the studied species, even when they are grown under optimal conditions, and whether the application of biostimulant formulation could be suggested as a novel agronomic tool for the commercial exploitation of the species under study. Another objective was to assess whether biostimulant application regulates the chemical profile and bioactive properties of the studied species, thereby enhancing the quality of the edible product. The obtained results will be useful for farmers for the valorization of wild edible species in intensified cropping systems through the adaptation of sustainable agronomic tools, such as biostimulant application.

2. Materials and Methods

2.1. Plant Material and Experimental Parameters

The experiment was conducted during the winter–spring period of 2021–2022 in an unheated greenhouse on the experimental farm of the University of Thessaly in Velestino, Greece. Seeds of three wild edible species (Cichorium spinosum L., Scolymus hispanicus L., and Sonchus oleraceus L.) were sown in seed trays filled with peat on 1 October 2021 (C. spinosum and S. hispanicus) and 1 November 2021 (S. oleraceus). Seedlings were transplanted directly to the soil when they reached the 3–4 true leaf stage (2 December 2021). Soil properties were as follows: soil type: clay (26% sand, 32% silt, and 42% clay), pH: 8.0 (1:1 soil/H2O), organic matter content: 3.1%, CaCO3: 10.8%, available P: 70.9 mg/kg, total N: 1.8 g/kg, exchangeable K2O: 195 mg/kg, and electrical conductivity (ECe): 0.95 dS/m. The meteorological conditions throughout the growing period are presented in Table 1. The plants were cultivated under natural daylight conditions, without supplemental lighting.
The tested biostimulants were Bactiva (Bactiva GmbH, Straelen, Germany) and Acadian (Acadian Seaplants Limited, Dartmouth, NS, Canada). The biostimulants were applied through fertigation with 50 mL of solution every 10 d with four applications in total throughout the growing period, starting directly after transplantation. The application dose was 1.5 kg/ha for Bactiva and 1.0 kg/ha for seaweed extracts (Acadian), whereas the control plants were treated with tap water. Bactiva contains beneficial bacteria (Bacillus subtilis, B. polymyxa, B. megaterium, and Pseudomonas fluorescens at 100,000,000 CFU/g (1 × 10⁸ CFU/g)) and beneficial fungi (Trichoderma harzianum, T. reesei, T. viride, and Gliocladium virens at 100,000,000 CFU/g (1 × 10⁸ CFU/g)). Acadian is a seaweed extract obtained from Ascophyllum nodosum that contains 0.5% total nitrogen (water soluble) and 17% soluble potash (K2O). Throughout the growing period, the plants were irrigated with a drip irrigation system.
The plant density was 60,600 plants/ha (plant distance of 0.33 cm within the row and 0.50 cm between the rows). Each experimental plot for each species was approximately 6 m2, with 0.25 around each plot used as corridors, and included 24 plants (three rows with eight plants each), while three replications (blocks) were used for each treatment (r = 3) and nine plots in total for each species (216 plants in total for each species).

2.2. Measurements

Plants were harvested when they reached marketable maturity, that is, when they formed large rosettes with green and tender leaves and before flowering initiation (visible formation of flowering stalk at the center of the rosette). In particular, plants of S. oleraceus and C. spinosum were harvested on 10 February 2022, while those of S. hispanicus were harvested on 31 March 2022. The chlorophyll content of the leaves (expressed as Soil Plant Analysis Development (SPAD) values) was recorded before harvesting using a portable chlorophyll meter (SPAD 502; Konica Minolta Optics, Osaka, Japan). After harvest, the aerial part was separated from the root system, and the rosette of the leaves was washed with distilled water to remove soil debris and allowed to dry before determining the fresh weight and number of leaves. Five samples from each treatment were selected for the determination of the leaf area (LA) index and specific leaf area (SLA). Leaf area was measured using a LA meter (Li-COR, 3100, Lincoln, NE, USA), and the leaves of the same plants were used for the estimation of dry weight by placing them in an oven at 72 °C for 72 h until a constant weight was achieved. SLA was determined as the total leaf area divided by the dry leaf weight and expressed in m2/kg. Especially for S. hispanicus plants, the fresh and dry weights of the roots were also determined.

2.3. Chemical Profile

2.3.1. Nutritional Value

The nutritional value, such as moisture, protein, fat, carbohydrates and ash content, was determined in the freeze-dried samples of leaves and stems using AOAC methods [31]. Briefly, nutrient content was determined using the Kjeldahl (N × 6.25), petroleum ether Soxhlet extraction, and incineration (600 °C) methods for protein, fat, and moisture, respectively. The carbohydrate content was calculated by difference, and the energetic value was estimated according to the following Formula (1):
Energy (kcal/100 g dried tissue) = 4 × (g of protein/100 g + g of carbohydrate/100 g) + 9 × (g of fat/100 g)
The results were presented in g per 100 g of dried tissue.

2.3.2. Mineral Composition of Leaves and Roots

Four replicates were analyzed per treatment, with each replicate consisting of a pooled sample from six plants. Samples of fresh leaves and stems were dried to a constant weight (at 65 °C for approximately 4 d) and then burned to ash at 450 °C for 6 h. The potassium (K) content was determined by flame photometry (Lasany Model 1832, Lasany International, Panchkula, India; Relative Standard Deviation (RSD) value: <1%) following acid digestion (2 M HCl), while the phosphorus (P) content was assessed using the molybdate–vanadate method (RSD value: <1%) [32]. Finally, nitrogen (N) was determined using the Kjeldahl method (BUCHI, Digest automat K-439 and Distillation Kjeldahl K-360, Flawil, Switzerland; RSD value: <1%). Data were presented in grams per kilogram of dry weight.

2.3.3. Total Phenols and Flavonoids and Antioxidant Activity Assays

Ethanolic extracts from freeze-dried samples of leaves and stems (four replicates per treatment) were prepared [33]. The plant material (2 g) was macerated with 5 mL of pure ethanol (1:2.5 v/v) in a shaking incubator at 160 rpm in glass bottles. After 72 h of shaking, the material was filtered, and the ethanolic extract was concentrated to dryness using a rotary evaporator (Laborota 4011 digital, Heidolph Instruments, Schwabach, Germany).
Following drying, methanolic plant extracts were prepared using 50% methanol (2 mL), resulting in a final concentration of 2 mg/mL. Methanolic extracts were used to determine the total phenol content according to the Folin–Ciocalteu method, with slight modifications [33]. The results are presented as Gallic acid equivalents per gram of extract.
The total flavonoid content was determined using a modified aluminum chloride (AlCl3) colorimetric assay [32], and the results were expressed as rutin equivalents per gram of extract.
The antioxidant activity was determined based on the following assays: the ferric reducing antioxidant power (FRAP), the 2,2-diphenyl-1-picrylhydrazyl (DPPH), and the 2,2′-azinobis-(3-ethylbenzothiazoline-6-sulfonic acid) (ABTS) assays. Briefly, for the FRAP assay, 3 mL of freshly prepared ferric reducing/antioxidant power (FRAP) solution (0.3 mol/L acetate buffer, pH 3.6), containing 10 mmol/L TPTZ (Tripyridil-s-triazine), 40 mmol/L FeCl3·10H2O, and 20 μL of extract (50 mg/mL), was incubated at 37 °C for 4 min, and the absorbance was measured at 593 nm. The absorbance change was converted into a FRAP value by relating the change in absorbance at 593 nm of the test sample to that of the standard solution of Trolox ((±)-6-Hydroxy-2,5,7,8-tetramethylchromane-2-carboxylic acid). The 2,2-Diphenyl-1-picrylhydrazyl (DPPH) radical scavenging activity of the plant extracts was measured based on the bleaching of the purple-colored 0.3 mM solution of DPPH. One milliliter of the DPPH solution in ethanol, 1.98 mL (50% v/v) methanol, and 0.02 mL of plant extract were mixed. After shaking, the mixture was incubated at room temperature in the dark for 30 min, and the absorbance was measured at 517 nm. The 2,2′-Azino bis-3-ethylbenzothiazoline-6-sulfonic acid (ABTS) radical cation decolorization assay was used to determine the antioxidant activity of the plant extracts. A 7 μM ABTS solution in water was mixed with 2.45 μM (final concentration) of potassium persulfate. The solution was kept in the dark for 12–16 h and then diluted in water until the absorbance at 734 nm was 0.700 ± 0.02. The reaction was performed with 3 mL of the solution and 20 μL of the plant extracts. Absorbance was measured after a 6 min incubation at 30 °C, at 734 nm wavelength. For all assays, Trolox ((±)-6-hydroxy-2,5,7,8-tetramethylchromane-2-carboxylic acid) was used as a positive control, and the results were expressed as Trolox equivalents (mg Trolox per g of extract) [32].

2.4. Statistical Analysis

All data were tested for normal distribution based on the Shapiro–Wilk test and then analyzed using one-way analysis of variance (ANOVA) using the JMP v. 16.1 (SAS Institute Inc., Cary, NC, USA) software package. Means were compared using Duncan’s Multiple Range test (DMRT) at p < 0.05. The results were expressed as mean values and standard deviations. Finally, a principal component analysis (PCA) was performed to evaluate the contribution of each variable to the total diversity, aiming to classify the studied samples based on growth parameters (fresh and dry weight of plant tissues, e.g., leaves and roots), nutritional value, mineral composition, and bioactive properties. Prior to analysis, the data were checked with Bartlett’s test (p < 0.001) and the Kaiser–Meyer–Olkin (KMO) test, and then, the data were normalized (z-score normalization), since the KMO test showed that there were variables with values lower than 0.5. For all analyses, the statistical software JMP v. 16.1 (SAS Institute Inc., Cary, NC, USA) was implemented.

3. Results

3.1. Plant Growth Parameters

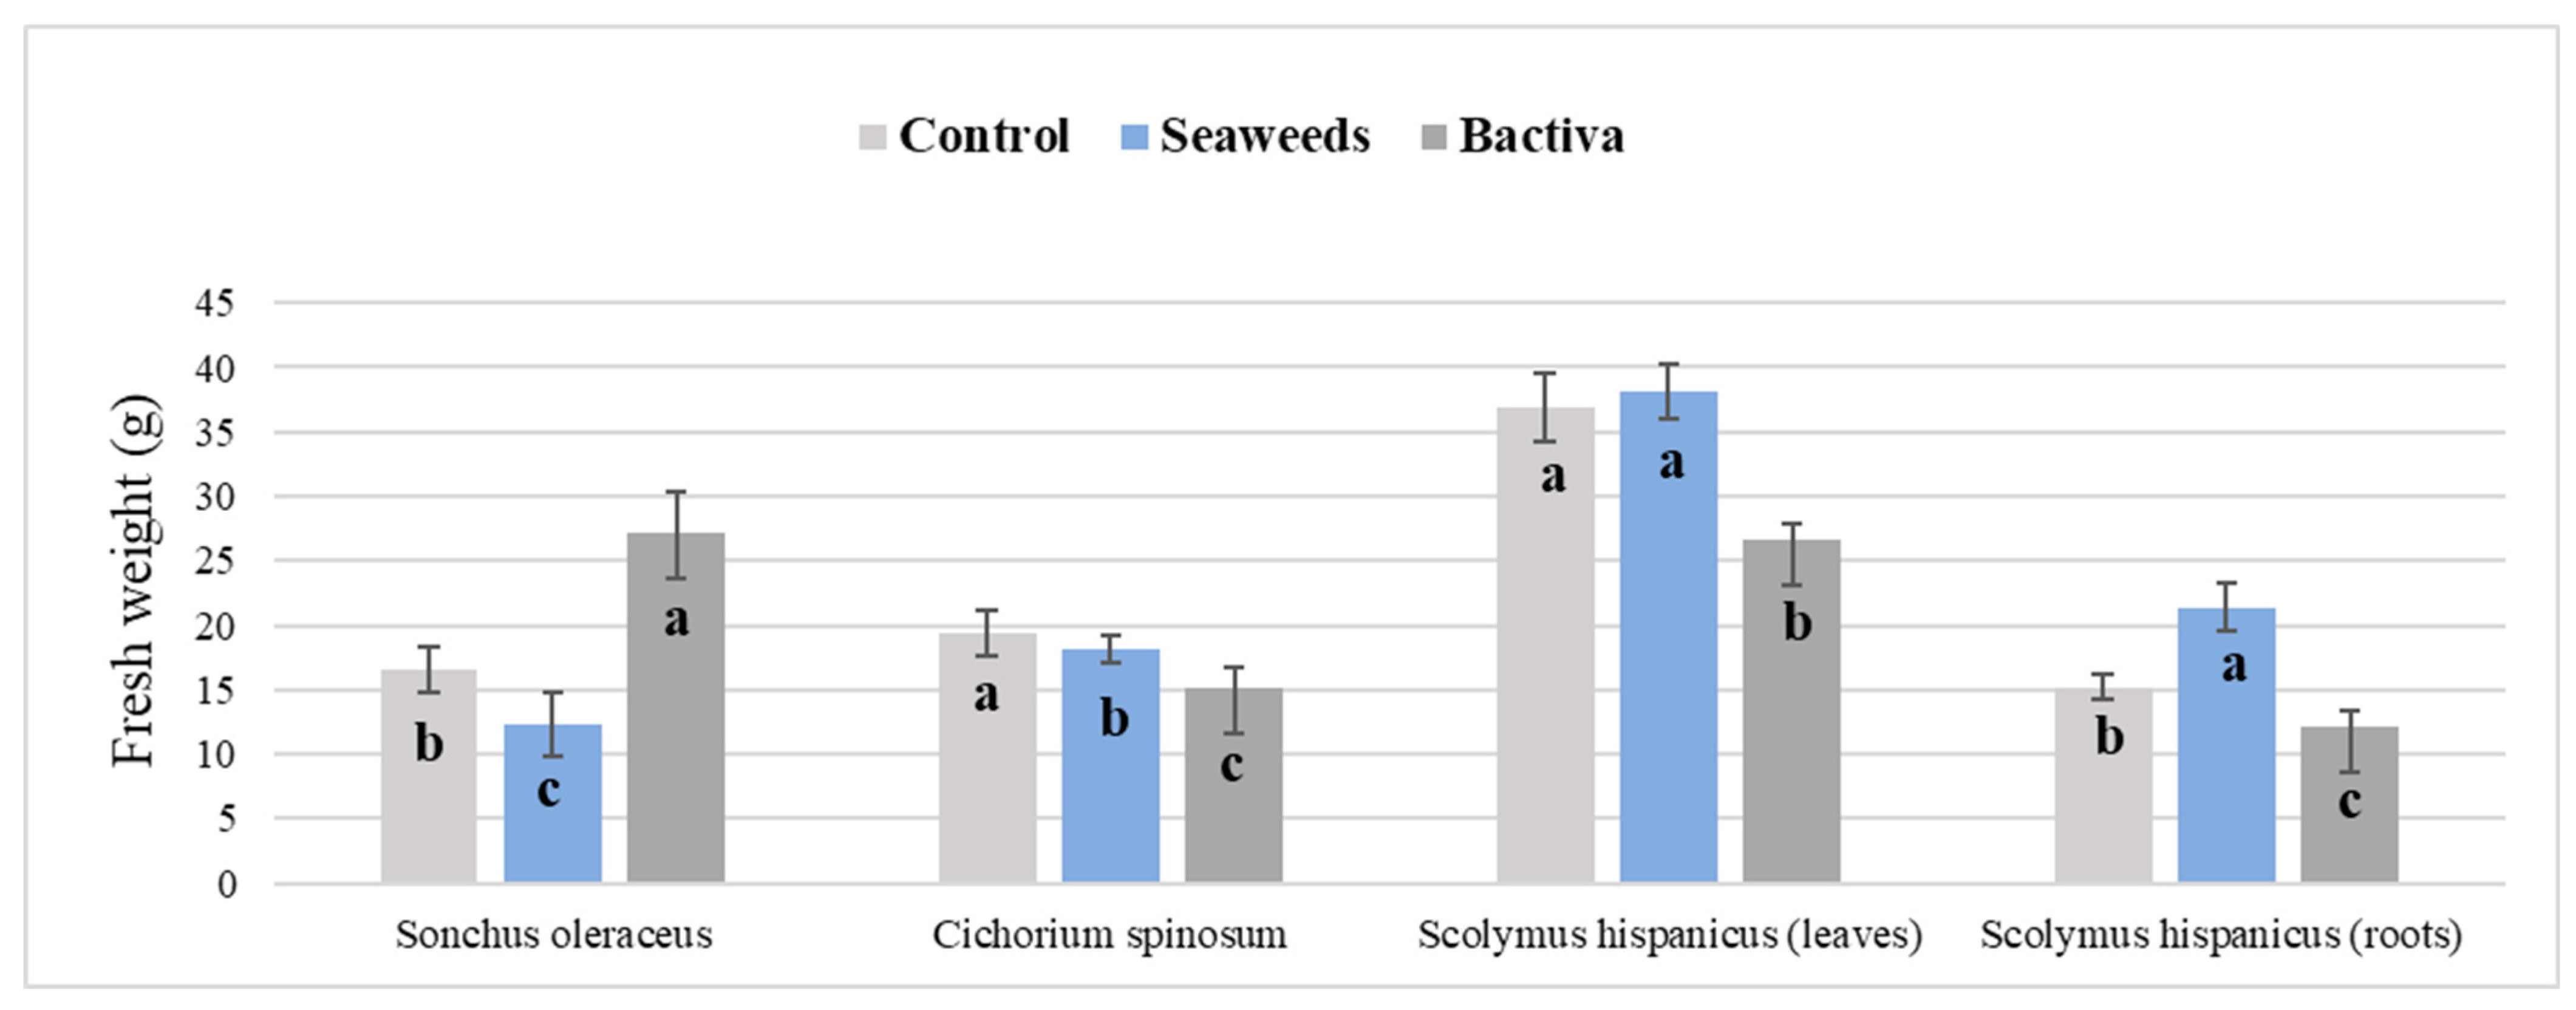
The results of the plant growth parameters for the three studied species are presented in Figure 1 and Table 2, where the tested biostimulants had varied effects depending on the evaluated species. In particular, beneficial fungi and bacteria (e.g., Bactiva) improved most of the studied growth parameters in S. oleraceus plants (p < 0.05), including fresh weight, number of leaves, leaf area (LA), leaf area index (LAI), and SPAD index. However, no significant differences were observed between the treatments (the two biostimulants and the control) in terms of dry weight of leaves and specific leaf area (SLA). In contrast, Bactiva had a significant negative effect (p < 0.05) on the fresh weight, LA, and LAI of C. spinosum plants, whereas the control treatment recorded the highest overall values for the fresh weight of leaves, LA, LAI and SLA without being significantly different from the treatment of seaweed extracts (except for fresh weight, where all the treatments varied significantly from each other). Finally, seaweed extracts and the control improved the fresh weight of leaves, LA, and LAI compared to the seaweed extracts, while the number of leaves did not differ among the tested treatments in the case of S. hispanicus. Moreover, seaweed extracts significantly increased (p < 0.05) the fresh and dry weights of roots, whereas SLA and SPAD index values were the lowest for the control treatment.

3.2. Nutritional Value

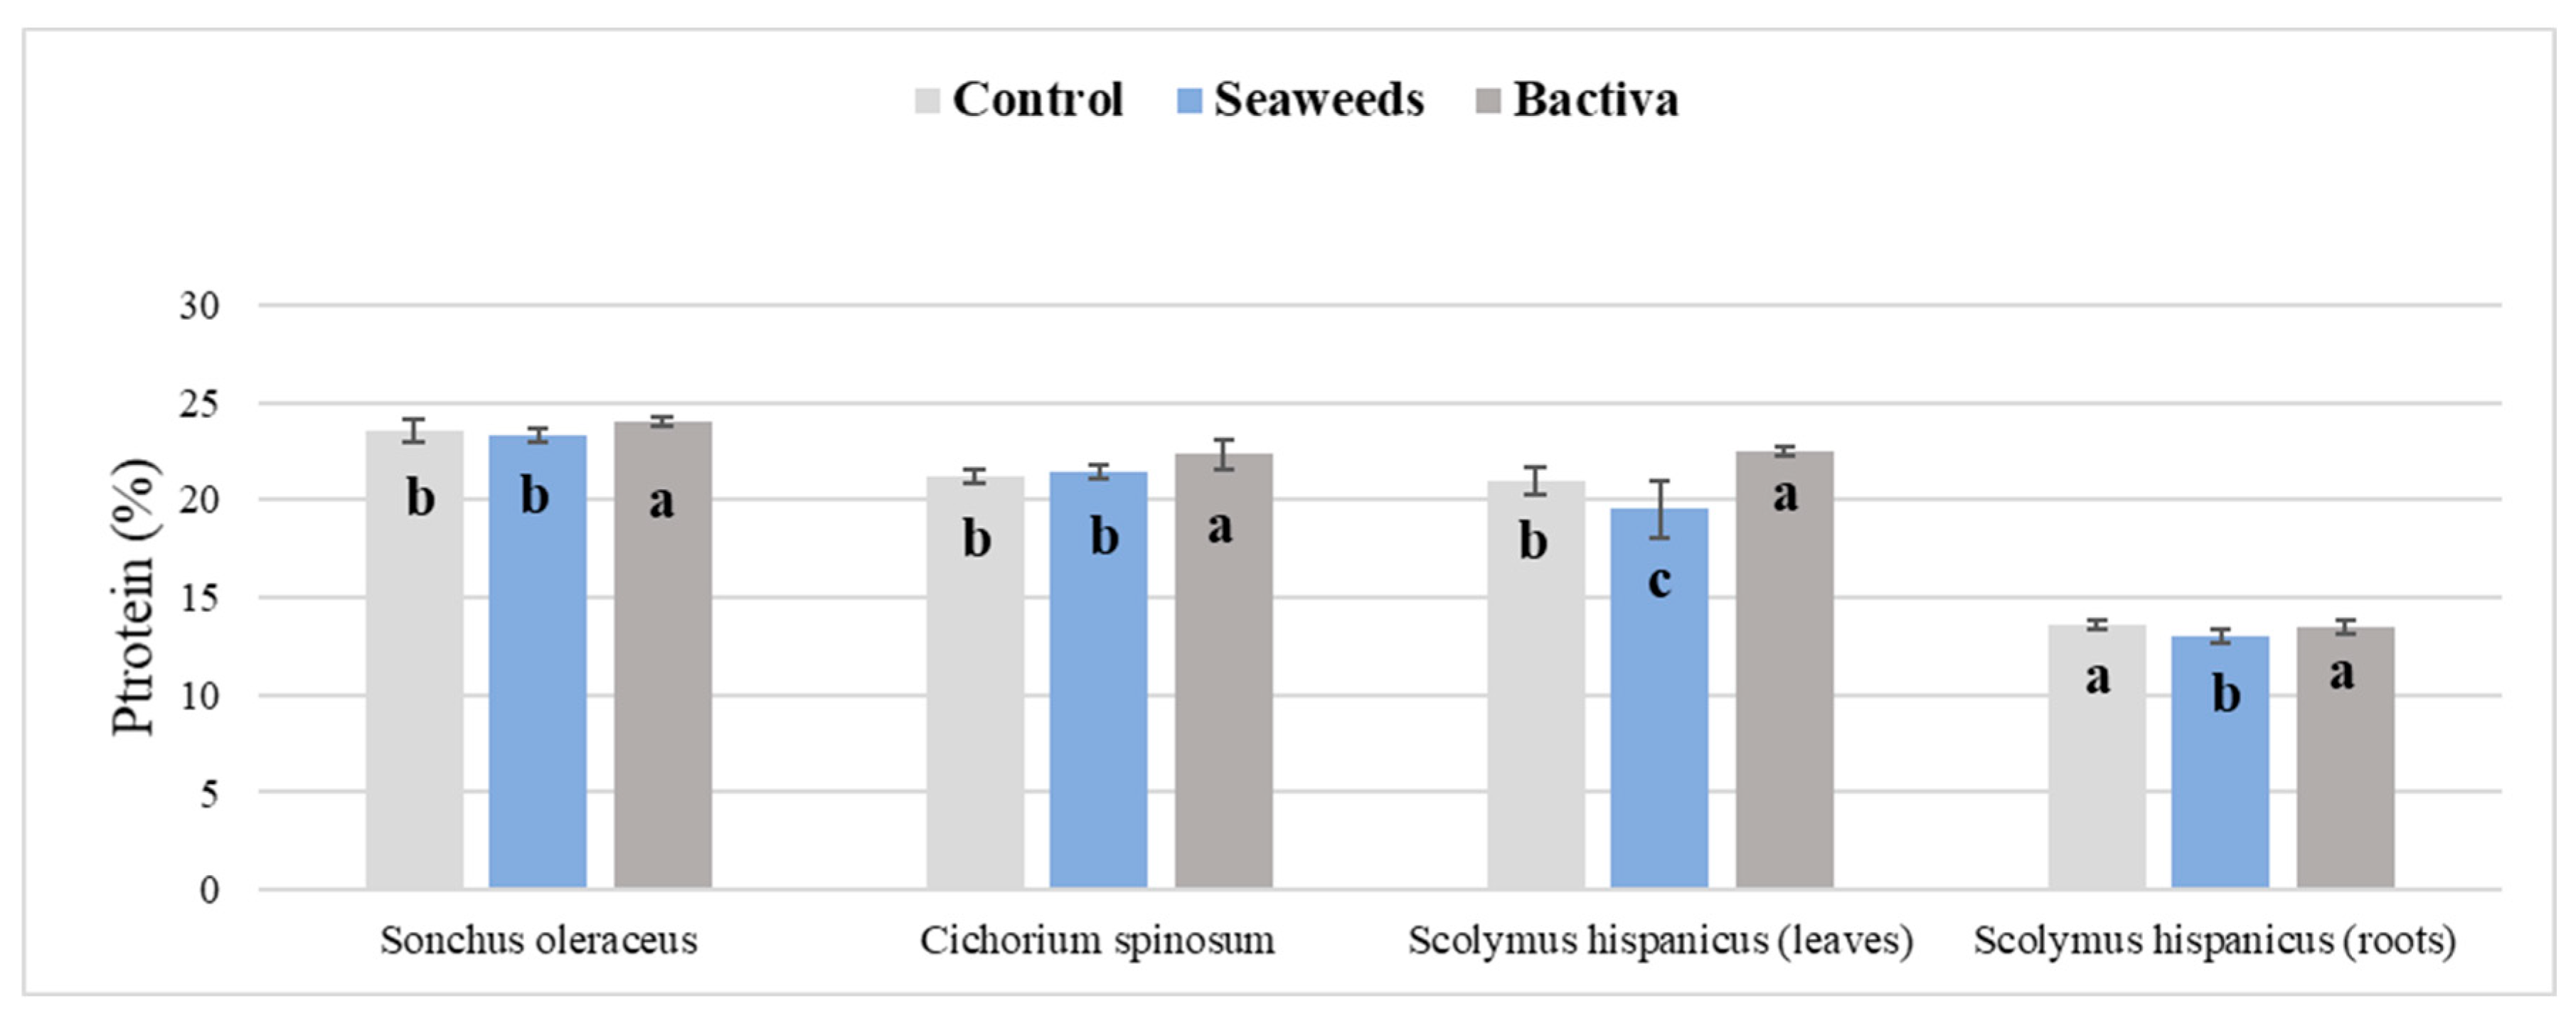
The proximate composition of the studied species is presented in Figure 2 and Table 3, where a varied response to biostimulant application was found depending on the species and plant part (in the case of S. hispanicus). In particular, the ash content was not affected by any of the biostimulants tested in the leaves of S. oleraceus and C. spinosum, whereas seaweed extracts increased the ash content in the leaves and roots of S. hispanicus plants (Table 3). The fat content was variably affected and either benefited from seaweed extracts (C. spinosum and roots of S. hispanicus) and Bactiva (leaves of S. hispanicus) or was not affected by biostimulant application (S. oleraceus) (Table 3), respectively. Beneficial fungi and bacteria significantly increased the protein content in all the studied species, except for the roots of S. hispanicus, where no significant variation was observed between the Bactiva-treated and untreated plants (Figure 2). Moreover, biostimulant application improved the carbohydrate content in S. oleraceus and C. spinosum leaves, especially seaweed extracts, while the opposite trend was recorded in S. hispanicus, where both biostimulants decreased the carbohydrate content in both leaves and roots, although no significant differences were observed between Bactiva and the control treatment in the case of roots (Table 3). Finally, seaweed extracts and the control treatment resulted in the lowest energetic value in S. oleraceus and C. spinosum, respectively, while in the case of S. hispanicus, only seaweed extracts improved the energy content in roots (Table 3).

3.3. Mineral Composition

The mineral composition of the studied species in terms of major macronutrients is presented in Table 4. The Bactiva application significantly improved the leaf nitrogen (N) and potassium (K) content for all the studied species, while their content in the roots of S. hispanicus either did not vary significantly from the control treatment (N content) or decreased compared to the control treatment (K content). In contrast, the phosphorus (P) content was beneficially affected by biostimulant application only in the cases of S. oleraceus and C. spinosum, whereas in both roots of S. hispanicus, the control treatment showed the highest overall values. The positive effect of Bactiva on the N content was also reflected in the protein content (see the results in Table 4), which indicates that the increased uptake of N is associated with increased biosynthesis of proteins.

3.4. Bioactive Properties

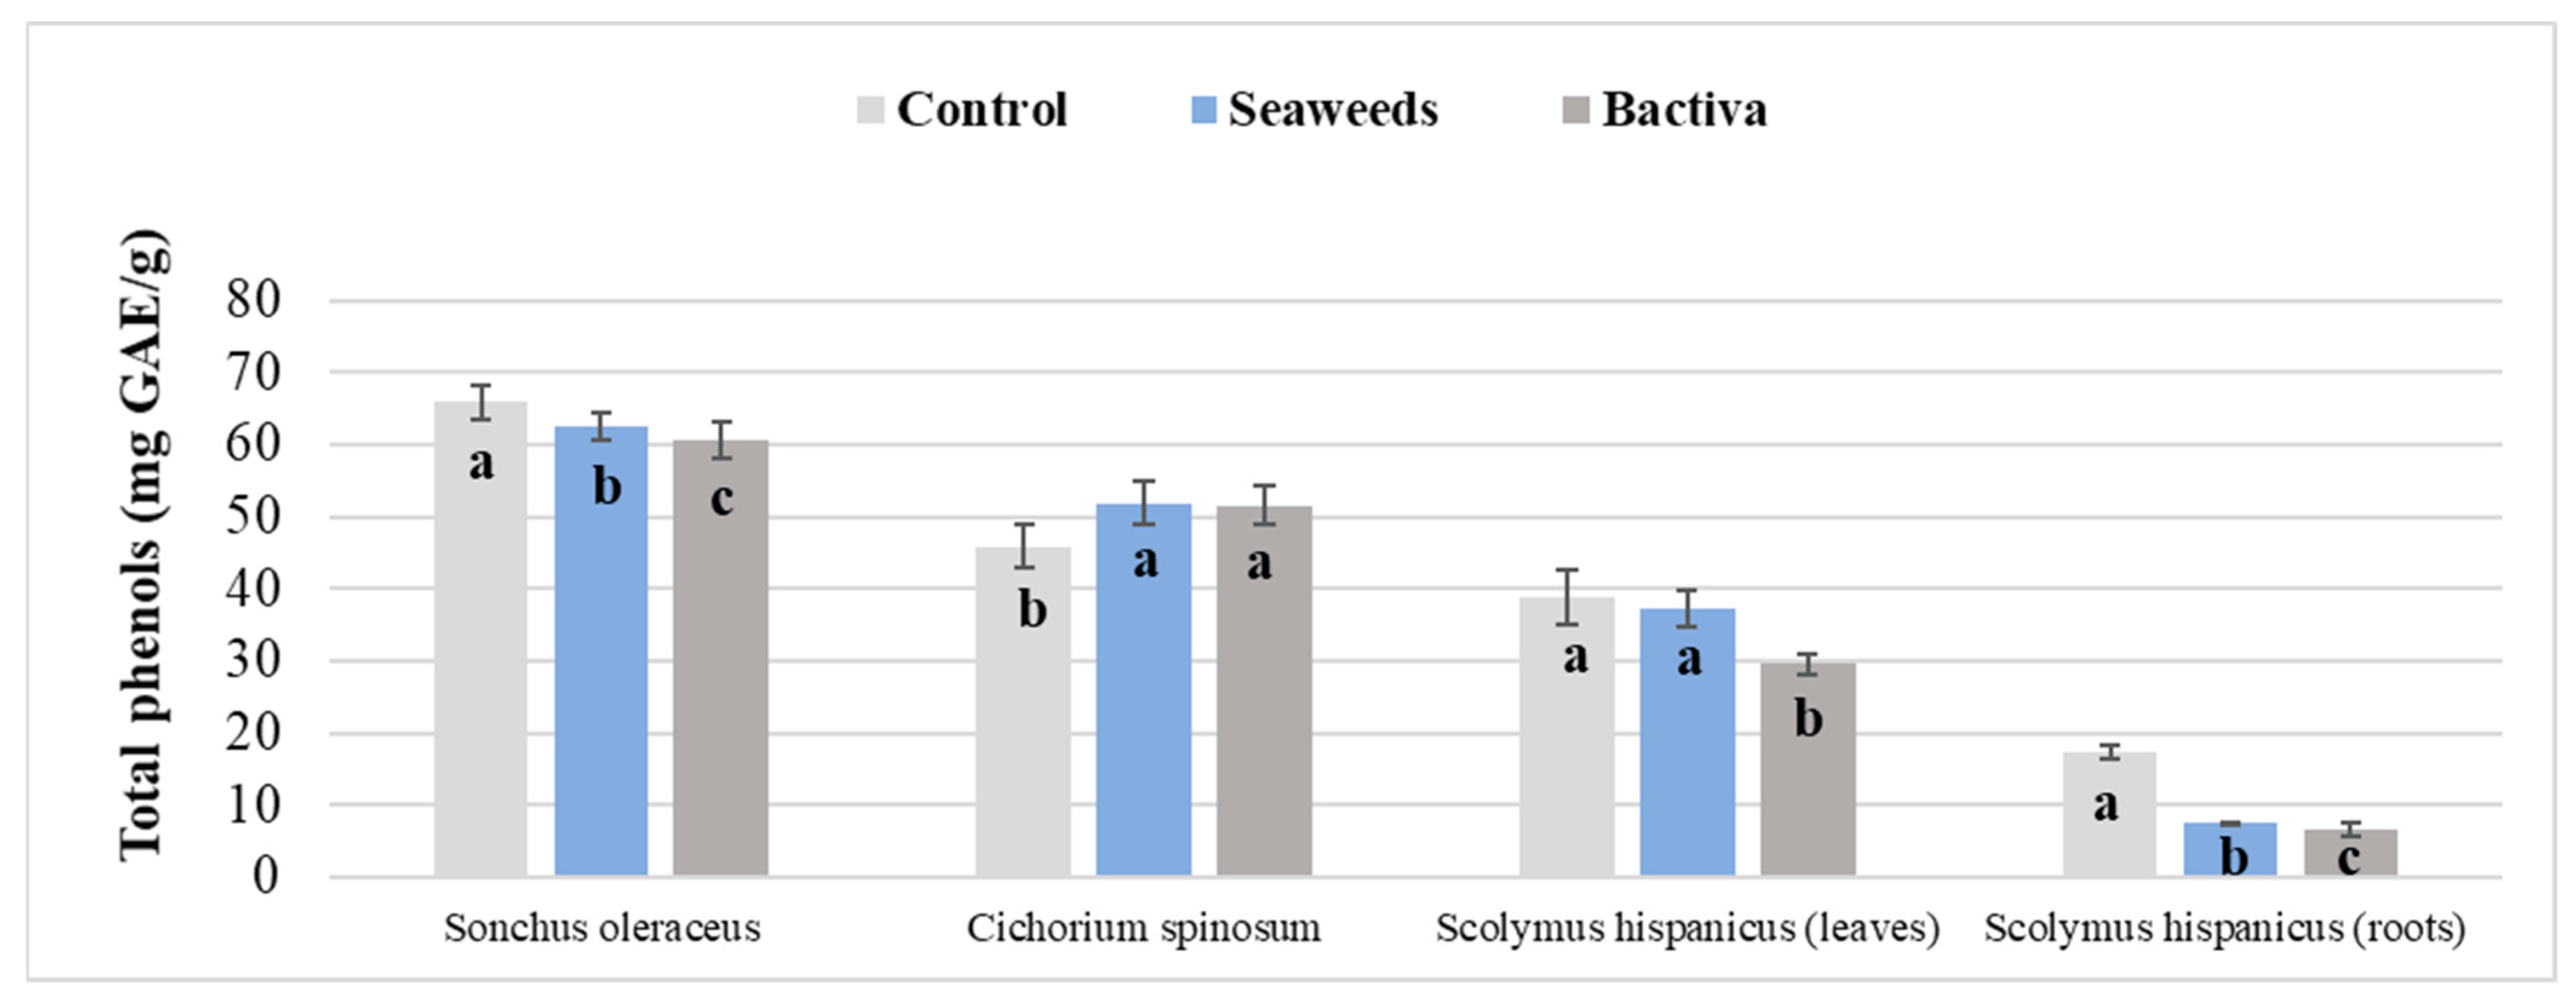
The polyphenol content and antioxidant efficacy of the tested species are shown in Figure 3 and Table 5. Our results indicate that the association between the polyphenol content and antioxidant activity varied among species. In particular, the total phenol content in S. oleraceus leaves was the highest for the control treatment, where the highest FRAP and ABTS activities were also recorded (Figure 3). In contrast, the use of seaweed extracts resulted in a significant increase in total flavonoids, which was associated with the highest DPPH activity. In C. spinosum leaves, seaweed extracts and Bactiva application significantly increased the total phenol content, whereas the latter formulation also recorded the highest total flavonoid content. However, the increased polyphenol content was partly associated with high antioxidant activity in the implemented assays (e.g., the highest activity for seaweed extracts and the control treatment was found in the FRAP and DPPH assays, while seaweed extracts also increased the antioxidant activity in the ABTS assay). In contrast, the highest DPPH activity was measured for the control treatment, where the lowest overall total phenol content was recorded. A variable response was also found in S. hispanicus leaves, where the highest total phenol content for the control treatment and/or seaweed extracts resulted in the highest antioxidant activity only in the FRAP assay, whereas for the DPPH and ABTS assays, the highest activity was measured in the control treatment and seaweed extracts, respectively. In contrast, the highest total flavonoid content for the Bactiva treatment was not associated with high activity in any of the implemented assays. Finally, a similar response was recorded in the roots of S. hispanicus, where the highest total phenol and lowest total flavonoid content in the control treatment resulted in the highest antioxidant activity for all the implemented assays.

3.5. Principal Component Analysis

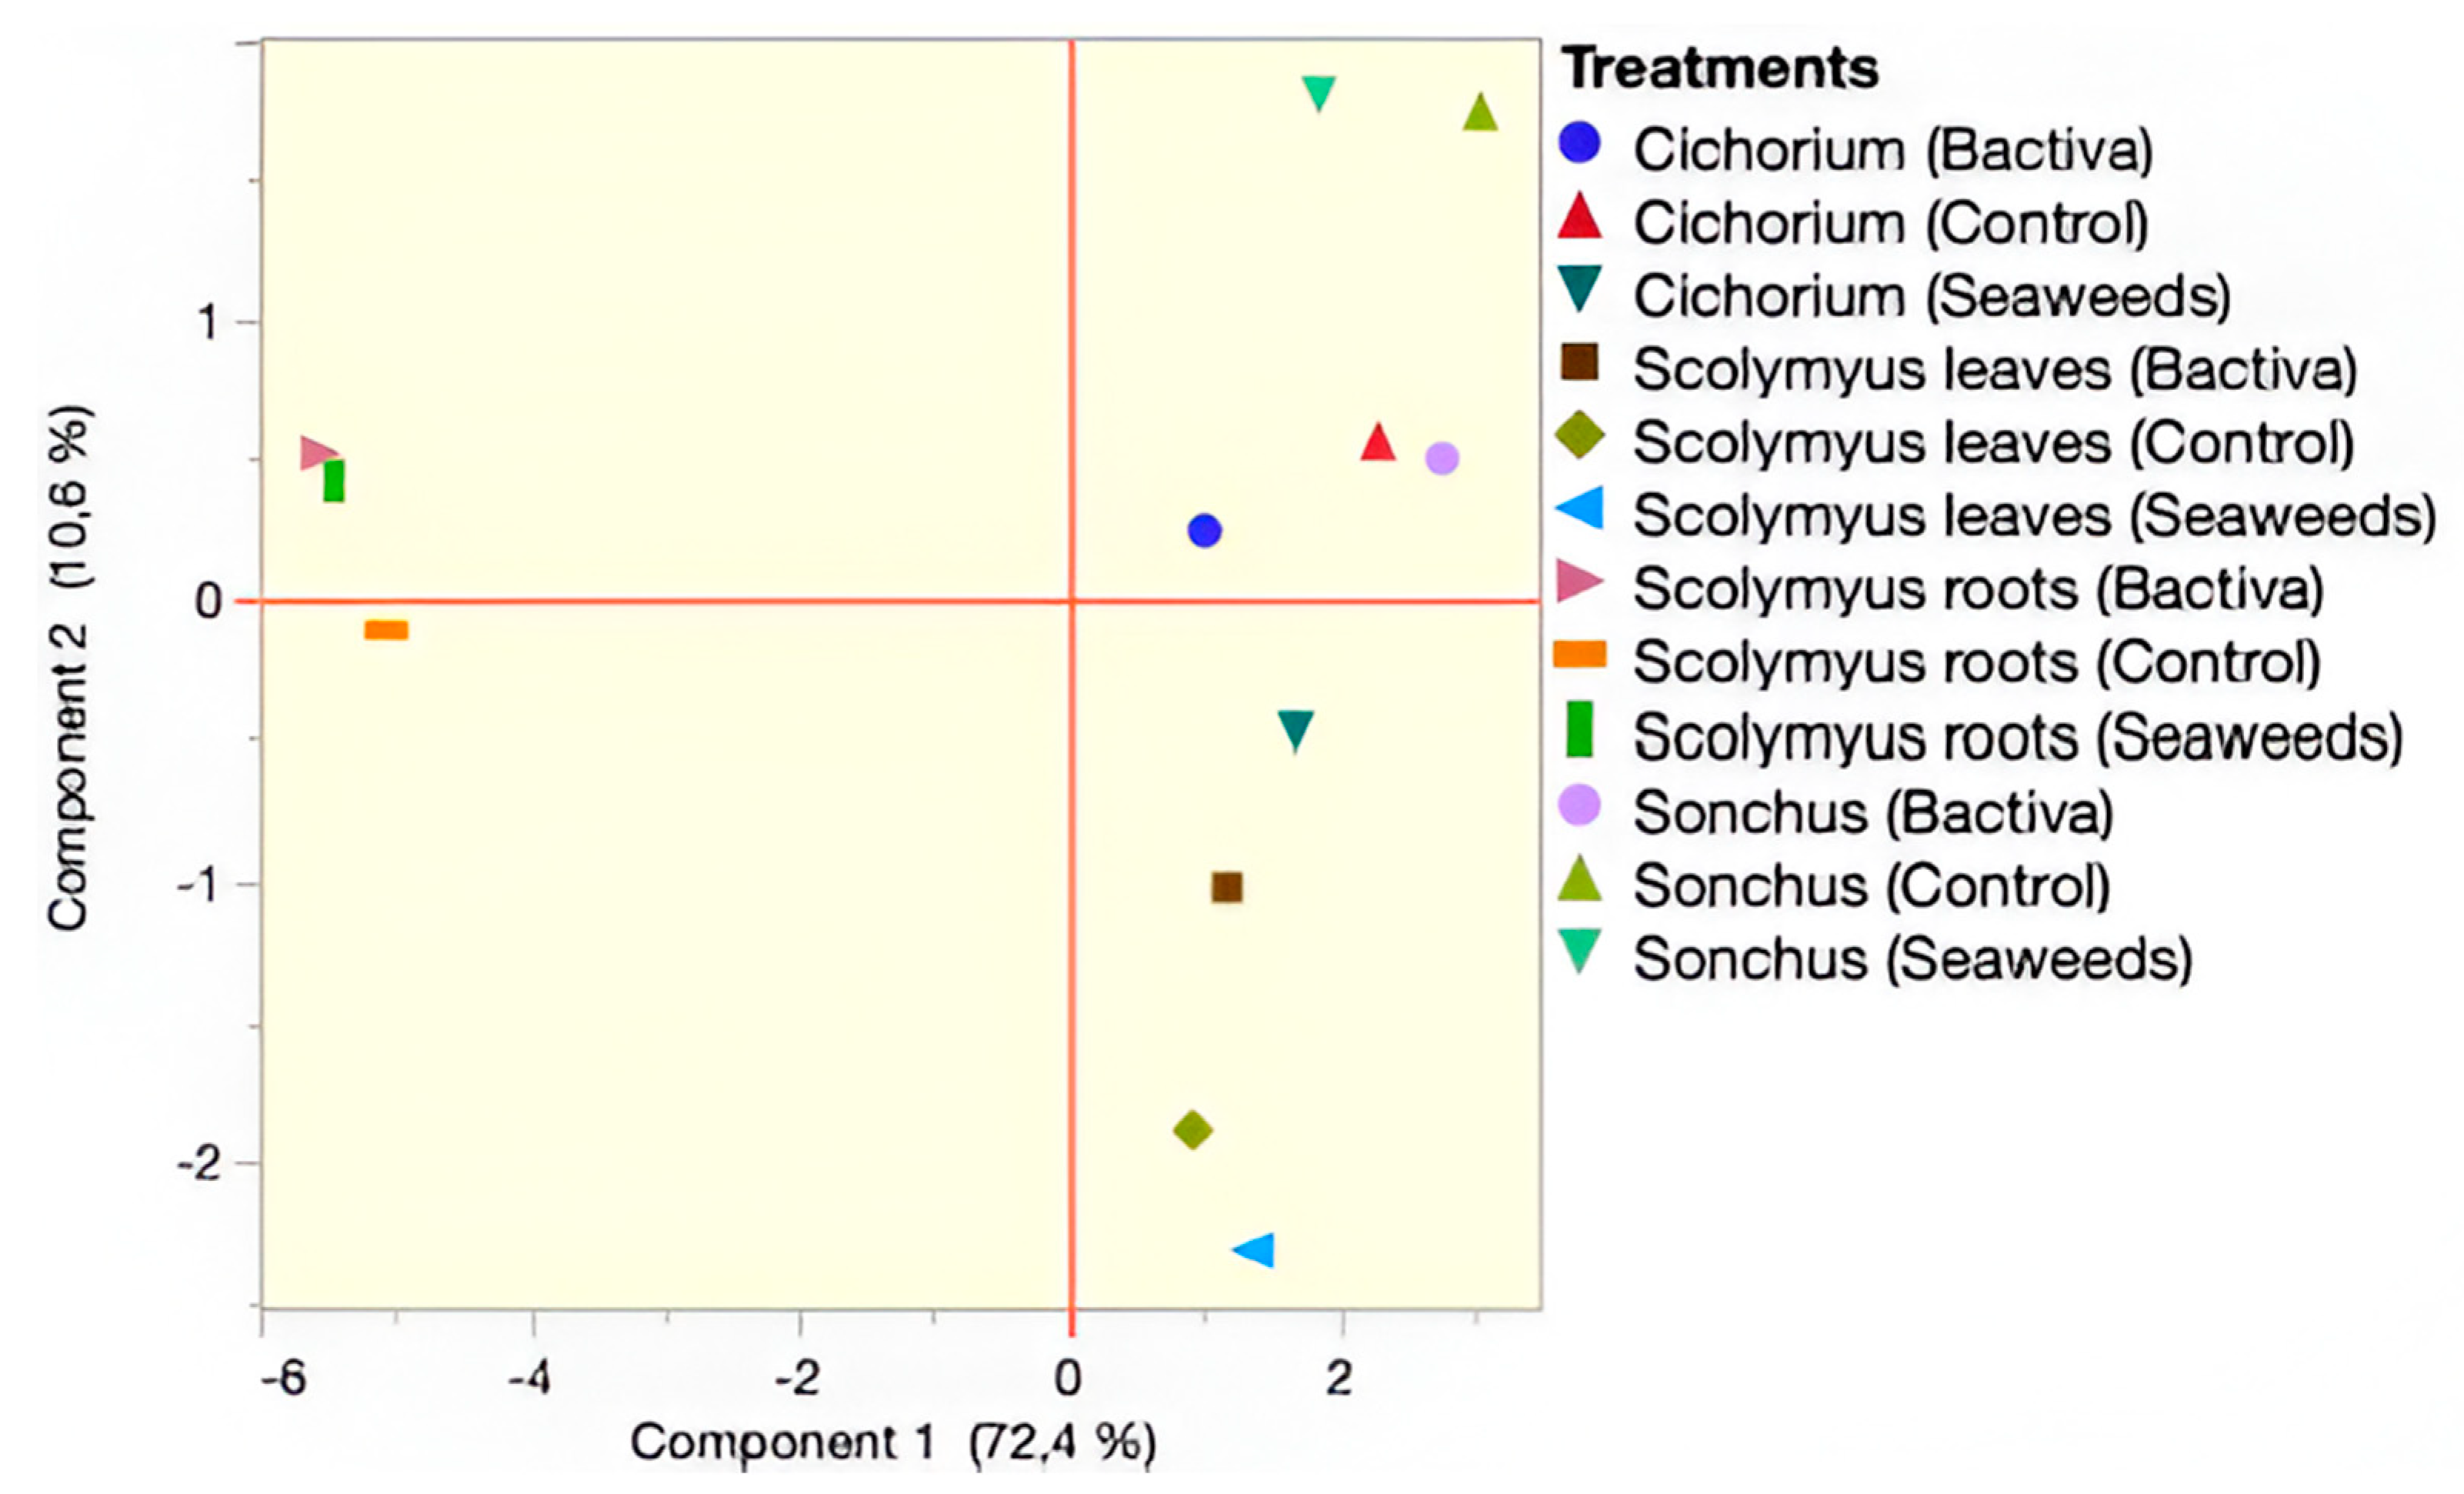
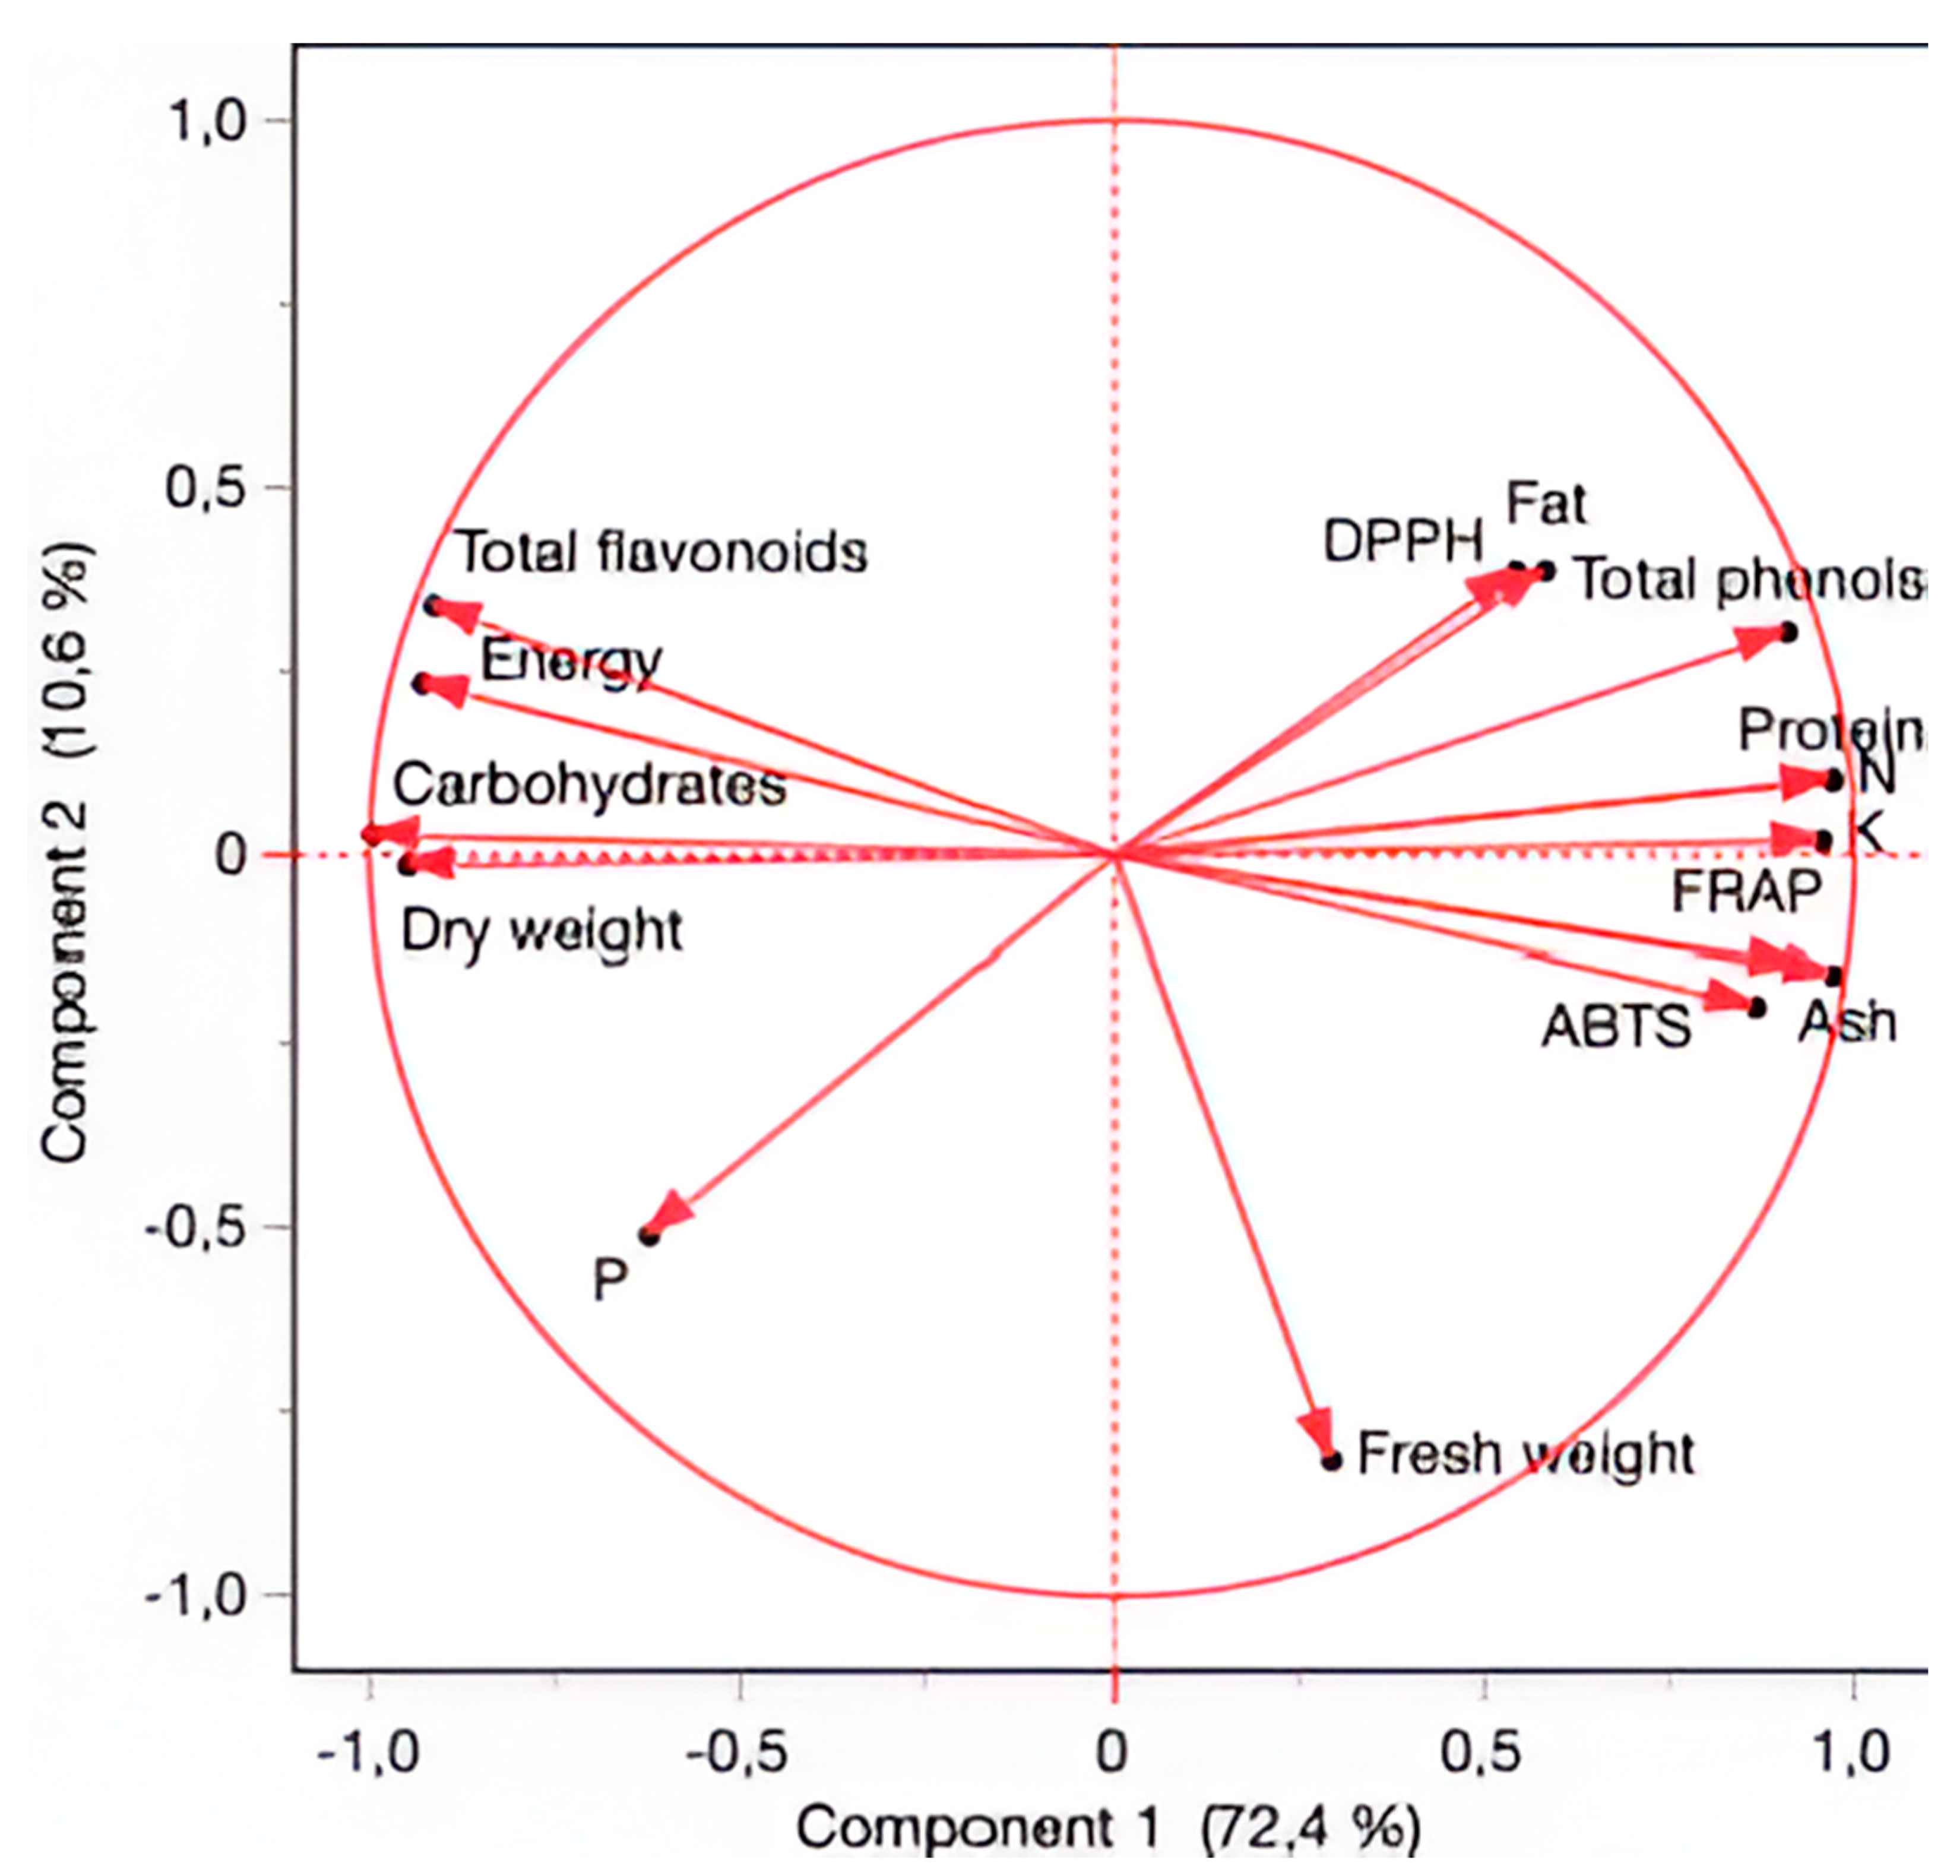
Principal component analysis (PCA) is commonly used when aiming to reduce the complexity of multivariate data, as well as to identify patterns and express data in a way that highlights similarities and differences among the tested treatments. In our study, we aimed to identify groups of samples with similarities in terms of plant growth, mineral composition, nutritional value, phenolic compound composition, and antioxidant activity. The first two principal components (PCs) were associated with eigenvalues higher than 1 and explained 83.03% of the cumulative variance, with PC1 accounting for 72.39% and PC2 for 10.64%. PC1 was positively correlated with ash content and negatively correlated with dry weight and carbohydrate content. PC2 was negatively correlated with fresh weight and P content. These results indicate the correct implementation of PCA, allowing differentiation between the tested samples depending on the evaluated variables (Figure 4 and Figure 5). The scatterplot (Figure 4) shows a clear discrimination of the tested samples according to species and biostimulant product. Cichorium spinosum samples were positioned around the center (origin) on the right side of PC1, Sonchus oleraceus samples were clustered on the positive side of PC1, and Scolymus hispanicus leaves and roots were located on the positive and negative sides of PC1, respectively. Moreover, PC2 clearly discriminated specific biostimulant treatments within each species. In particular, the control and seaweed treatments in S. hispanicus and S. oleraceus leaves were separated from the Bactiva treatment, whereas for S. hispanicus roots, the control treatment was clearly separated from the two biostimulants. For C. spinosum, all biostimulant treatments were clearly separated from each other. Therefore, PC1, which accounts for most of the total variability, captures the genotypic differences among the species, while PC2 highlights more subtle differences between the particular biostimulant treatments. Regarding the discrimination among the species and plant parts, S. hispanicus roots were clearly separated from the rest of the samples owing to their high carbohydrate content, total flavonoid and dry matter; S. hispanicus and S. oleraceus leaves were separated owing to their high fresh weight and total phenol content, respectively.
Figure 5 shows the loading plot of the first two components for the tested wild edible species treated with the two biostimulants. The length and position of each arrow represent the strength and direction of the relationship between each variable and the respective principal component. Therefore, long arrows in the right direction, such as total phenols, protein, ash, N, K, FRAP, and ABTS, indicate strong positive loading with PC1, whereas those variables in the left direction, such as carbohydrate content, dry weight, total flavonoid, and energy, indicate strong negative loading with PC1. For PC2, only fresh weight showed a strong negative loading. Moreover, small angles between arrows, such as protein and N, DPPH and total phenols, and carbohydrates and dry weight, indicate a positive correlation with each other. However, arrows that point in opposite directions (angle near 180°), such as FRAP and ABTS with total flavonoids, or carbohydrates and dry weight with protein, N, and K, indicate a negative correlation.

4. Discussion

To mitigate ongoing biodiversity loss, the scientific community has recently turned its attention to the exploitation of wild edible species [34,35]. Owing to their rich nutritional profiles and high agronomic plasticity, these plants may serve as promising alternatives to conventional crops, particularly in the demanding context of intensified modern horticulture and food security. Investigating these species is essential for conserving agrobiodiversity, which is currently threatened by the prevalence of monocultures, reliance on high-yielding hybrids, and disturbance of natural habitats due to anthropogenic activities. Therefore, numerous wild species have been assessed across various cultivation systems in the past year. In the present work, we aimed to evaluate the response of three wild edible species to biostimulant application as a means to improve both crop performance and quality of the edible product.
Our findings indicate a significant impact of biostimulant application on the growth parameters of the studied species, which varied depending on the formulation and species. The results of literature reports also indicate a varied impact of biostimulants on the growth parameters of several vegetables. For example, Schiattone et al. [36] suggested that the application of seaweed extracts significantly enhanced the fresh marketable yield of wild rocket plants (Diplotaxis tenuifolia (L.) DC.), mostly due to the formation of more leaves, as leaf dimensions were not affected compared to untreated plants. The same authors suggested that biostimulant application was associated with higher chlorophyll content, resulting in improved photosynthesis and increased biomass production, which was also the case for S. oleraceus and S. hispanicus plants in the present study. In contrast, although C. spinosum plants showed a higher SPAD index for seaweed extracts in the present study, this did not result in a higher biomass yield, a finding that could be due to the morphology of leaves that form a more compact rosette with overlapping leaves compared to the other two species, thus reducing the leaf surface that is directly exposed to light [37]. This argument is also corroborated by the LAI values for the respective treatments of the species studied in this work (Table 1, Table 2 and Table 3). A varied response to biostimulant application was also suggested by Carillo et al. [28], who tested whether the use of a tropical plant extract could alleviate the negative effects of nutrient deprivation on Corchorus olitorius plants. According to that study, no significant effects were recorded for biostimulant application when plants were grown under optimum conditions, whereas the tropical plant extract significantly enhanced fresh biomass yield when plants were fed with half- or quarter-strength nutrient solution [28]. Similar findings were reported by Voutsinos-Frantzis et al. [29], who also found a beneficial effect of protein hydrolysates on C. spinosum plants only when they were grown under limited nitrogen conditions. Grammenou et al. [25] did not record significant variation in the growth parameters of S. oleraceus plants grown in contaminated mining soil and treated with various biostimulant formulations. Moreover, Atero-Calvo et al. [38] suggested that the use of a biostimulant formulation containing algal extracts, plant extracts, amino acids and glycine betaine significantly increased the fresh weight and leaf area of lettuce plants grown under optimal conditions, regardless of the application rate. Finally, Spinelli et al. [30] reported varied effects of two microbial inoculants on the growth of aerial and root parts and the LA of wild chicory (C. intybus L.) plants, whereas no significant differences were found for SLA. According to the literature, the negative effects of the application of Bactiva on C. spinosum plants could be associated with competition for nutrients and water due to high application rates and the direct competition of microorganisms with plants, toxic effects on plant’ roots due to excessive application rates, especially in the case of T. harzianum, a hormonal imbalance due to high concentrations of ABA and ethylene that bacteria may produce, or negative effects on photosynthetic parameters, which eventually affect the production of assimilates and plant growth [39,40,41,42]. Therefore, more evidence is needed to elucidate the mechanism of this inhibition. Moreover, the contradictory results in the literature highlight the varied responses of wild edible species to biostimulant application in a species- and growing-condition-specific manner, thus indicating the need for more studies to fine-tune the practice guides of this innovative agronomic tool in less explored species and reveal any ecological and physiological implications that may regulate the impact of biostimulants.
Regarding nutritive value, biostimulant application may variably change the proximate composition of the edible parts of plants. In particular, it may increase the protein content in lettuce leaves under both optimum and nitrogen deprivation conditions, especially in the case of amino acid-based formulations [43]. Moreover, borage leaf and moringa extracts also had a beneficial effect on total soluble proteins in lettuce and rocket leaves, respectively, in a dose-dependent manner [44,45]. The type of biostimulant and species may also regulate the response of plants, since Candido et al. [46] did not observe any significant effect on nitrogen uptake from wild rocket plants that could result in increased protein content, while Melito et al. [47] reported a varied efficacy of biostimulants in mitigating salt stress in wild and cultivated rocket plants, as expressed by protein, carbohydrate and lipid content. Considering that biostimulant application is associated with improved photosynthetic activity, it is expected that the carbohydrate and ash content in leaves will increase [48,49]. However, there have been studies where the carbohydrate content in leaves showed decreasing trends either due to dilution effects and translocation to other organs or due to a metabolic shift to biosynthetic pathways that convert sugars into other compounds [50]. The study by Francke et al. [51] also did not show any impact on total soluble and reducing sugars in shallot leaves after the use of two biostimulant formulations, one based on effective microorganisms and the other based on seaweed extracts. According to the same study [51], biostimulants based on humic and fulvic acids, B subtilis and oligosaccharide granules increased the ash content in garlic leaves, while no significant differences were found in bulbs and stems, and the fat content remained unchanged in leaves. Therefore, the contradictory results from the literature reports indicate that the proximate composition of the edible portions of plants may be regulated depending on the species, plant part and composition of biostimulant formulations, as any effects on photosynthetic activity may regulate the biosynthesis of assimilates and consequently affect the nutritional value of edible parts.
Our findings indicate that biostimulant application had a significant impact on the macromineral content of the leaves of the studied species, whereas no significant effects were recorded in the roots of S. hispanicus. In contrast to our findings, Francke et al. [51] suggested that the N content in shallot leaves was not affected by biostimulant application (effective microorganisms or seaweed extracts), while they also reported a beneficial effect on P (both effective microorganisms and seaweed extracts) and K (only effective microorganisms) content. Similarly, Atero-Calvo et al. [38] reported that biostimulant application enhanced only the nitrogen content in lettuce leaves grown under optimum conditions due to the composition of the formulation (e.g., organic nitrogenous compounds), whereas P and K were not affected. In contrast, Carillo et al. [52] recorded the opposite trend for a vegetal-based biostimulant with no effects on the N content of lettuce leaves and a significant increase compared to the untreated plants for P and K. Polo et al. [43] suggested that biostimulants increased the N content in lettuce leaves compared to a control treatment only under N deprivation conditions (40% and 70% of optimum fertilization rates). The importance of biostimulant composition regarding its effect on mineral composition was highlighted by El-Nakhel et al. [53], who tested various formulations based on protein hydrolysates, betaine and minerals, and plant-based extracts and algae on wild rocket plants. They suggested a variable effect of nitrate content and increasing trends for P and K content for all the biostimulants tested. Therefore, the variable responses for mineral concentration in relation to biostimulant applications are primarily explained by differences in the composition of formulations, while other factors, such as growing conditions and species, may also have implications on the mineral composition of leaves, as they may regulate the uptake of minerals from plants and their concentration in plant tissues [38,43,54].
The biostimulant formulations had a variable impact on the polyphenol content and antioxidant activity of the evaluated wild edible species. A varied response of total phenol and flavonoid content to biostimulant application was also suggested by Atero-Calvo et al. [38], who found that the application of increasing rates (3 and 5 mL/L) of a biostimulant based on algae and plant extracts, amino acids, glutamate, and glycine betaine significantly increased polyphenol content in lettuce leaves in comparison to untreated plants, but this increase was not linear. The same authors also reported that the highest rate was not beneficial for the antioxidant activity of leaves determined using the FRAP and TEAC assays [38]. In addition to dose, genotype may also affect the response to biostimulant application. According to Al-Karaki et al. [54], the change in polyphenols and antioxidant activity of two lettuce types (e.g., romaine and iceberg) compared to untreated plants varied between the two genotypes. Although the romaine plants showed a higher content and activity, the iceberg type was more responsive to an amino acid-based biostimulant. Moreover, Jędrszczyk et al. [50] showed that biostimulant composition may also affect the response of garlic plants depending on the plant part (e.g., leaves, stems, and bulbs). However, there are contradictory results in the scientific literature regarding the impact of biostimulants with similar formulations on different plant species. In particular, the application of plant-derived biostimulants has been reported to increase polyphenol contents in perennial wall rocket [55] and spinach [56], whereas a similar formulation may decrease polyphenol contents in spinach [57], cabbage [58], and basil [59]. Overall, our findings and those from the literature reports highlight the variability in plant responses to biostimulant application due to several factors, including the genotype, biostimulant composition, application rate and growing conditions, among others, which may trigger the biosynthesis of secondary metabolites such as polyphenols and antioxidant compounds. Therefore, further research is needed to obtain solid results regarding the use of biostimulants as a sustainable agronomic tool in horticultural production, especially when plants are grown under optimal conditions.

5. Conclusions

In conclusion, the application of seaweed extracts and Bactiva was effective in improving the crop performance of the studied wild edible species under optimum growing conditions. In particular, Bactiva and seaweed extracts were more beneficial for the fresh biomass yield of S. oleraceus and Scolymus hispanicus, respectively, while for C. spinosum, they increased both the polyphenol content and antioxidant activity of the leaves in most of the tested assays. However, despite the increasing interest in using biostimulants in sustainable cropping systems, this field is still underexplored in wild edible greens, which are highly appreciated for their plasticity to unfavorable conditions and are suggested as alternative horticultural crops within the climate change context. Therefore, further studies are required to test more of such species under variable growing conditions and determine their response to biostimulants with varied compositions under both optimal and stressful environments, such as high salinity, drought or high temperature stress.

Author Contributions

Conceptualization, S.A.P.; methodology, N.P., C.C., G.N., N.T. and S.A.P.; software, N.P., C.C. and G.N.; validation, N.P. and C.C.; formal analysis, N.P., C.C. and G.N.; investigation, N.P., C.C. and G.N.; resources, N.T. and S.A.P.; data curation, N.P. and S.A.P.; writing—original draft preparation, N.P., C.C., G.N., N.T. and S.A.P.; writing—review and editing, N.T. and S.A.P.; visualization, S.A.P.; supervision, N.T. and S.A.P.; project administration, S.A.P.; funding acquisition, N.T. and S.A.P. All authors have read and agreed to the published version of the manuscript.

Funding

Financial support was provided by PRIMA (grant Numbers Prima2019-11, PRI-MA/0009/2019, P2P/PRIMA/1218/0006, 01DH20006, Prima2019-12, STDF Valuefarm, 18-3-2021, TUBITAK-119N494, 301/18 October 2020, PCI2020-112091), a program supported by the European Union, with co-funding provided by the Funding Agencies RIF—Cyprus and by the General Secretariat for Research and Technology of Greece.

Data Availability Statement

The original contributions presented in this study are included in the article. Further inquiries can be directed to the corresponding author.

Conflicts of Interest

The authors declare no conflicts of interest.

References

  1. Singh, R.P.; Singh, D.; Tiwari, N.K.; Mishra, B.K.; Singh, A. The impact of climate change variability on horticultural productivity: A review. Int. J. Adv. Biochem. Res. 2024, 8, 329–333. [Google Scholar] [CrossRef]
  2. Gora, J.; Verma, A.; Singh, J.; Choudhary, D. Climate Change and Production of Horticultural Crops. In Agricultural Impacts of Climate Change; Kumar, R., Singh, V.P., Mirabbasi, R., Eds.; CRC Press: London, UK, 2019; pp. 45–61. ISBN 9780367345235. [Google Scholar]
  3. Yuan, X.; Li, S.; Chen, J.; Yu, H.; Yang, T.; Wang, C.; Huang, S.; Chen, H.; Ao, X. Impacts of Global Climate Change on Agricultural Production: A Comprehensive Review. Agronomy 2024, 14, 1360. [Google Scholar] [CrossRef]
  4. Lee, C.; Zeng, M.; Luo, K. How does climate change affect food security? Evidence from China. Environ. Impact Assess. Rev. 2024, 104, 107324. [Google Scholar] [CrossRef]
  5. Jing, H.; Liu, Y.; Hou, J. Impacts of agricultural intensification on biodiversity: Habitat loss, agrochemical use, water depletion, and soil degradation. J. Environ. Manag. 2025, 395, 128036. [Google Scholar] [CrossRef]
  6. José-María, L.; Armengot, L.; Blanco_moreno, L.; Bassa, M.; Sans, F. Effects of agricultural intensification on plant diversity in Mediterranean dryland cereal fields. J. Appl. Ecol. 2010, 47, 832–840. [Google Scholar] [CrossRef]
  7. Nettle, R.; Ayre, M.; Reichelt, N.; Santhanam-martin, M.; Vikas, A. Farm transformation in the context of climate change: Beyond the incremental-transformational divide. J. Rural Stud. 2025, 116, 103628. [Google Scholar] [CrossRef]
  8. Sentil, A.; Reverté, S.; Lhomme, P.; Bencharki, Y.; Rasmont, P.; Christmann, S.; Michez, D. Wild vegetation and ‘farming with alternative pollinators’ approach support pollinator diversity in farmland. J. Appl. Entomol. 2022, 146, 1155–1168. [Google Scholar] [CrossRef]
  9. Petropoulos, S.A.; Karkanis, A.; Martins, N.; Ferreira, I.C.F.R. Edible halophytes of the Mediterranean basin: Potential candidates for novel food products. Trends Food Sci. Technol. 2018, 74, 69–84. [Google Scholar] [CrossRef]
  10. Gori, B.; Cossu, T.; Zein, H.; Liu, U.; Ulian, T.; Bacchetta, G. A comprehensive checklist of Mediterranean wild edible plants: Diversity, traditional uses, and knowledge gaps. Plants People Planet 2025. Early view. [Google Scholar] [CrossRef]
  11. Widderick, M.; Walker, S.; Sindel, B. Better management of Sonchus oleraceus L. (common sowthistle) based on the weed’s ecology. In Proceedings of the Fourteenth Australian Weeds Conference; Council of Australasian Weed Societies: Muswellbrook, NSW, Australia, 2004; pp. 535–537. [Google Scholar]
  12. Karkanis, A.; Asprogeraka, A.C.; Paouris, E.; Ntanasi, T.; Karavidas, I.; Rumbos, C.I.; Athanassiou, C.G.; Ntatsi, G. Yellow mealworm frass: A promising organic fertilizer for common sowthistle (Sonchus oleraceus L.) and bristly oxtongue (Helminthotheca echioides (L.) Holub) cultivation. Heliyon 2024, 10, e35508. [Google Scholar] [CrossRef] [PubMed]
  13. De Cortes Sánchez-Mata, M.; Tardío, J. Mediterranean wild edible plants: Ethnobotany and food composition tables. In Mediterranean Wild Edible Plants: Ethnobotany and Food Composition Tables; Springer: Berlin/Heidelberg, Germany, 2016; pp. 1–478. [Google Scholar] [CrossRef]
  14. Petropoulos, S.A.; Fernandes, Â.; Ntatsi, G.; Levizou, E.; Barros, L.; Ferreira, I.C.F.R. Nutritional profile and chemical composition of Cichorium spinosum ecotypes. LWT—Food Sci. Technol. 2016, 73, 95–101. [Google Scholar] [CrossRef]
  15. Tsakiraki, M.; Grammatikopoulou, M.G.; Stylianou, C.; Tsigga, M. Nutrition transition and health status of Cretan women: Evidence from two generations. Public Health Nutr. 2010, 14, 793–800. [Google Scholar] [CrossRef]
  16. Polo, S.; Tardío, J.; Vélez-del-Burgo, A.; Molina, M.; Pardo-de-Santayana, M. Knowledge, use and ecology of golden thistle (Scolymus hispanicus L.) in Central Spain. J. Ethnobiol. Ethnomed. 2009, 5, 42. [Google Scholar] [CrossRef]
  17. Arinaitwe, U.; Yabwalo, D.N.; Hangamaisho, A. Unlocking the Potential of Biostimulants: A Review of Classification, Mode of Action, Formulations, Efficacy, Mechanisms, and Recommendations for Sustainable Intensification. Int. J. Plant Biol. 2025, 16, 122. [Google Scholar] [CrossRef]
  18. Carillo, P. Plant Stress Can biostimulants enhance plant resilience to heat and water stress in the Mediterranean hotspot ? Plant Stress 2025, 16, 100802. [Google Scholar] [CrossRef]
  19. Zulfiqar, F.; Moosa, A.; Ali, H.M.; Bermejo, N.F.; Munn, S. Biostimulants: A sufficiently effective tool for sustainable agriculture in the era of climate change? Plant Physiol. Biochem. 2024, 211, 108699. [Google Scholar] [CrossRef] [PubMed]
  20. Boutahiri, S.; Benrkia, R.; Tembeni, B.; Idowu, O.E.; Olatunji, O.J. Effect of biostimulants on the chemical profile of food crops under normal and abiotic stress conditions. Curr. Plant Biol. 2024, 40, 100410. [Google Scholar] [CrossRef]
  21. Grammenou, A.; Petropoulos, S.A.; Thalassinos, G.; Rinklebe, J.; Shaheen, S.M.; Antoniadis, V. Biostimulants in the Soil–Plant Interface: Agro-environmental Implications—A Review. Earth Syst. Environ. 2023, 7, 583–600. [Google Scholar] [CrossRef]
  22. Singh, M.; Subahan, G.M.; Sharma, S.; Singh, G.; Sharma, N.; Sharma, U.; Kumar, V. Enhancing Horticultural Sustainability in the Face of Climate Change: Harnessing Biostimulants for Environmental Stress Alleviation in Crops. Stresses 2025, 5, 23. [Google Scholar] [CrossRef]
  23. Colla, G.; Rouphael, Y. Biostimulants in horticulture. Sci. Hortic. 2015, 196, 1–2. [Google Scholar] [CrossRef]
  24. Grammenou, A.; Petropoulos, S.A.; Antoniadis, V. Bioavailability of Cd in Plantago weldenii and Sonchus oleraceus Plants: The Effects of a Humic and Fulvic Acids-Based Biostimulant. Horticulturae 2024, 10, 74. [Google Scholar] [CrossRef]
  25. Grammenou, A.; Petropoulos, S.A.; Thalassinos, G.; Antoniadis, V. Biostimulants efficacy in growing Sonchus oleraceus plants in contaminated mining soil with potentially toxic elements (PTEs). Environ. Sci. Pollut. Res. 2025, 32, 15374–15387. [Google Scholar] [CrossRef]
  26. Ntanasi, T.; Karavidas, I.; Giannothanasis, E.; Spyrou, G.P.; Karaviti, T.; Marka, S.; Napoli, S.; Neocleous, D.; Ntatsi, G. Enhancing Soilless Production of Portulaca oleracea, Mesembryanthemum crystallinum and Valerianella locusta Through Nitrogen Form Ratio Optimization and Biostimulant Application. Horticulturae 2025, 11, 1076. [Google Scholar] [CrossRef]
  27. Baldotto, M.A.; Cristina, A.; De Oliveira, G.; Souza, C. Initial performance of Achillea millefolium in response of humic acids. Rev. Ceres 2021, 68, 498–502. [Google Scholar] [CrossRef]
  28. Carillo, P.; Colla, G.; El-Nakhel, C.; Bonini, P.; Amelia, L.D.; Aversana, E.D.; Pannico, A.; Giordano, M.; Sifola, M.I.; Kyriacou, M.C.; et al. Biostimulant Application with a Tropical Plant Extract Enhances Corchorus olitorius Adaptation to Sub-Optimal Nutrient Regimens by Improving Physiological Parameters. Agronomy 2019, 9, 249. [Google Scholar] [CrossRef]
  29. Voutsinos-Frantzis, O.; Karavidas, I.; Savvas, D.; Ntanasi, T.; Kaimpalis, V.; Consentino, B.B.; Aliferis, K.A.; Karkanis, A.; Sabatino, L.; Ntatsi, G. Impact of Nitrogen Limitation, Irrigation Levels, and Nitrogen-Rich Biostimulant Application on Agronomical and Chemical Traits of Hydroponically Grown Cichorium spinosum L. Horticulturae 2024, 10, 1063. [Google Scholar] [CrossRef]
  30. Spinelli, V.; Brasili, E.; Sciubba, F.; Ceci, A.; Giampaoli, O.; Miccheli, A.; Pasqua, G.; Persiani, A.M. Biostimulant Effects of Chaetomium globosum and Minimedusa polyspora Culture Filtrates on Cichorium intybus Plant: Growth Performance and Metabolomic Traits. Front. Plant Sci. 2022, 13, 879076. [Google Scholar] [CrossRef] [PubMed]
  31. Horwitz, W.; Latimer, G. (Eds.) AOAC Official Methods of Analysis of Association of Official Analytical Chemists; AOAC Inter.: Gaithersburg, MD, USA, 2019; ISBN 0935584773. [Google Scholar]
  32. Chrysargyris, A.; Charalambous, S.; Xylia, P.; Litskas, V.; Stavrinides, M.; Tzortzakis, N. Assessing the Biostimulant Effects of a Novel Plant-Based Formulation on Tomato Crop. Sustainability 2020, 12, 8432. [Google Scholar] [CrossRef]
  33. Chrysargyris, A.; Petrovic, J.D.; Tomou, E.M.; Kyriakou, K.; Xylia, P.; Kotsoni, A.; Gkretsi, V.; Miltiadous, P.; Skaltsa, H.; Soković, M.D.; et al. Phytochemical Profiles and Biological Activities of Plant Extracts from Aromatic Plants Cultivated in Cyprus. Biology 2024, 13, 45. [Google Scholar] [CrossRef]
  34. Alexopoulos, A.A.; Marandos, E.; Assimakopoulou, A.; Vidalis, N.; Petropoulos, S.A.; Karapanos, I.C. Effect of Nutrient Solution pH on the Growth, Yield and Quality of Taraxacum officinale and Reichardia picroides in a Floating Hydroponic System. Agronomy 2021, 11, 1118. [Google Scholar] [CrossRef]
  35. Petropoulos, S.; Fernandes, Â.; Karkanis, A.; Ntatsi, G.; Barros, L.; Ferreira, I. Successive harvesting affects yield, chemical composition and antioxidant activity of Cichorium spinosum L. Food Chem. 2017, 237, 83–90. [Google Scholar] [CrossRef]
  36. Schiattone, M.I.; Boari, F.; Cantore, V.; Castronuovo, D.; Denora, M.; Di Venere, D.; Perniola, M.; Sergio, L.; Todorovic, M.; Candido, V. Effect of water regime, nitrogen level and biostimulants application on yield and quality traits of wild rocket [Diplotaxis tenuifolia (L.) DC.]. Agric. Water Manag. 2023, 277, 108078. [Google Scholar] [CrossRef]
  37. Duan, M.; Zhang, X.; Wei, Z.; Chen, X.; Zhang, B. Effect of Maize Canopy Structure on Light Interception and Radiation Use Efficiency at Different Canopy Layers. Agronomy 2024, 14, 1511. [Google Scholar] [CrossRef]
  38. Atero-Calvo, S.; Izquierdo-Ramos, M.; García-Huertas, C.; Rodríguez-Alcántara, M.; Navarro-Morillo, I.; Navarro-León, E. An Evaluation of the Effectivity of the Green Leaves Biostimulant on Lettuce Growth, Nutritional Quality, and Mineral Element Efficiencies under Optimal Growth Conditions. Plants 2024, 13, 917. [Google Scholar] [CrossRef]
  39. Lei, Q.; Luo, P.; Tao, W.; Jiang, Z.; Chen, H.; Liu, J.; Shan, Y.; Wang, Q.; Deng, M. Effects of Bacillus subtilis on photosynthesis and yield of pakchoi under magnetoelectric brackish water irrigation. Sci. Hortic. 2025, 340, 113934. [Google Scholar] [CrossRef]
  40. Wan, T.; Zhao, H.; Wang, W. Effect of biocontrol agent Bacillus amyloliquefaciens SN16-1 and plant pathogen Fusarium oxysporum on tomato rhizosphere bacterial community composition. Biol. Control 2017, 112, 1–9. [Google Scholar] [CrossRef]
  41. Ortiz, A.; Sansinenea, E. Bacillus sp. as biofertilizers applied in horticultural crops. In Bio-Inoculants in Horticultural Crops; Elsevier: Amsterdam, The Netherlands, 2024; ISBN 9780323960052. [Google Scholar]
  42. Yang, X.; Wan, Q.; Wu, D.; Wang, J.; Abbas, T.; Zhang, Q. The impact of novel azotobacter Bacillus sp. T28 combined sea buckthorn pomace on microbial community structure in paddy soil. Environ. Res. 2023, 224, 115548. [Google Scholar] [CrossRef] [PubMed]
  43. Polo, J.; Atero-calvo, S.; Navarro-leo, E.; Ruiz, J.M. Physiological efficacy of the amino acid-based biostimulants Pepton 85/16, Pepton origin, and Nutriterra in lettuce grown under optimal and reduced synthetic nitrogen fertilization. Front. Plant Sci. 2025, 16, 1645768. [Google Scholar] [CrossRef] [PubMed]
  44. Bulgari, R.; Morgutti, S.; Cocetta, G.; Negrini, N.; Farris, S.; Calcante, A.; Spinardi, A.; Ferrari, E.; Mignani, I.; Oberti, R.; et al. Evaluation of borage extracts as potential biostimulant using a phenomic, agronomic, physiological, and biochemical approach. Front. Plant Sci. 2017, 8, 935. [Google Scholar] [CrossRef]
  45. Abdalla, M.M. The potential of Moringa oleifera extract as a biostimulant in enhancing the growth, biochemical and hormonal contents in rocket (Eruca vesicaria subsp. sativa) plants. Int. J. Plant Physiol. Biochem. 2013, 5, 42–49. [Google Scholar] [CrossRef]
  46. Candido, V.; Cantore, V.; Castronuovo, D.; Denora, M.; Schiattone, M.I.; Sergio, L.; Todorovic, M.; Boari, F. Effect of Water Regime, Nitrogen Level, and Biostimulant Application on the Water and Nitrogen Use Efficiency of Wild Rocket [Diplotaxis tenuifolia (L.) DC]. Agronomy 2023, 13, 507. [Google Scholar] [CrossRef]
  47. Melito, S.; Sarais, G.; Dessi, D.; Santaniello, A.; Povero, G.; Piga, G.; Giannini, V. Root-promoting Biostimulant Enhances Salinity Tolerance in Wild and Cultivated Rocket Salads. J. Soil Sci. Plant Nutr. 2024, 24, 6268–6282. [Google Scholar] [CrossRef]
  48. Esperanza, S.; Mart, M.; Bel, A.; Almagro, L. Higher Plant-Derived Biostimulants: Mechanisms of Action and Their Role in Mitigating Plant Abiotic Stress. Antioxidants 2024, 13, 318. [Google Scholar] [CrossRef] [PubMed]
  49. Rana, V.S.; Sharma, S.; Rana, N.; Sharma, U. Sustainable production through biostimulants under fruit orchards. CABI Agric. Biosci. 2022, 3, 38. [Google Scholar] [CrossRef]
  50. Jędrszczyk, E.; Kopeć, A.; Bucki, P.; Ambroszczyk, A.M.; Skowera, B. The Enhancing Effect of Plants Growth Biostimulants in Garlic Cultivation on the Chemical Composition and Level of Bioactive Compounds in the Garlic Leaves, Stems and Bulbs. Not. Bot. Horti Agrobot. Cluj-Napoca 2019, 47, 81–91. [Google Scholar] [CrossRef]
  51. Francke, A.; Majkowska-Gadomska, J.; Kaliniewicz, Z.; Jadwisieńczak, K. No Effect of Biostimulants on the Growth, Yield and Nutritional Value of Shallots Grown for Bunch Harvest. Agronomy 2022, 12, 1156. [Google Scholar] [CrossRef]
  52. Carillo, P.; De Micco, V.; Ciriello, M.; Formisano, L.; El-Nakhel, C.; Giordano, M.; Colla, G.; Rouphael, Y. Morpho-Anatomical, Physiological, and Mineral Composition Responses Induced by a Vegetal-Based Biostimulant at Three Rates of Foliar Application in Greenhouse Lettuce. Plants 2022, 11, 2030. [Google Scholar] [CrossRef] [PubMed]
  53. El-Nakhel, C.; Petropoulos, S.A.; Di Mola, I.; Ottaiano, L.; Cozzolino, E.; Rouphael, Y.; Mori, M. Biostimulants of Different Origins Increase Mineral Content and Yield of Wild Rocket While Reducing Nitrate Content through Successive Harvests. Horticulturae 2023, 9, 580. [Google Scholar] [CrossRef]
  54. Al-Karaki, G.N.; Othman, Y. Effect of foliar application of amino acid biostimulants on growth, macronutrient, total phenol contents and antioxidant activity of soilless grown lettuce cultivars. S. Afr. J. Bot. 2023, 154, 225–231. [Google Scholar] [CrossRef]
  55. Caruso, G.; De Pascale, S.; Cozzolino, E.; Giordano, M.; El-Nakhel, C.; Cuciniello, A.; Cenvinzo, V.; Colla, G.; Rouphael, Y. Protein Hydrolysate or Plant Extract-based Biostimulants Enhanced Yield and Quality Performances of Greenhouse Perennial Wall Rocket Grown in Different Seasons. Plants 2019, 8, 208. [Google Scholar] [CrossRef]
  56. Rouphael, Y.; Giordano, M.; Cardarelli, M.; Cozzolino, E.; Mori, M.; Kyriacou, M.C.; Bonini, P.; Colla, G. Plant-and seaweed-based extracts increase yield but differentially modulate nutritional quality of greenhouse spinach through biostimulant action. Agronomy 2018, 8, 126. [Google Scholar] [CrossRef]
  57. Carillo, P.; Colla, G.; Fusco, G.M.; Dell’Aversana, E.; El-Nakhel, C.; Giordano, M.; Pannico, A.; Cozzolino, E.; Mori, M.; Reynaud, H.; et al. Morphological and Physiological Responses Induced by Protein Hydrolysate-Based Biostimulant and Nitrogen Rates in Greenhouse Spinach. Agronomy 2019, 9, 450. [Google Scholar] [CrossRef]
  58. Godlewska, K.; Biesiada, A.; Michalak, I.; Pacyga, P. sustainability The Effect of Botanical Extracts Obtained through Ultrasound-Assisted Extraction on White Head Cabbage (Brassica oleracea L. var. capitata L.) Seedlings Grown under Controlled Conditions. Sustainability 2020, 12, 1871. [Google Scholar] [CrossRef]
  59. Rouphael, Y.; Carillo, P.; Ciriello, M.; Formisano, L.; El-nakhel, C.; Ganugi, P.; Fiorini, A.; Moreno, B.M.; Zhang, L.; Cardarelli, M.; et al. Copper boosts the biostimulant activity of a vegetal-derived protein hydrolysate in basil: Morpho-physiological and metabolomics insights. Front. Plant Sci. 2023, 14, 1235686. [Google Scholar] [CrossRef] [PubMed]
Figure 1. The effect of biostimulant application on the fresh weight (g) of leaves and roots of the studied species (n = 24). Different lowercase Latin letters above each bar for the same species and plant part indicate significant differences at p < 0.05, according to Duncan’s Multiple Range test. Vertical lines above each bar represent the standard deviation (SD).
Horticulturae 12 00177 g001
Figure 2. Protein content in the roots and leaves of the studied wild edible species in relation to biostimulant application (n = 4; mean ± SD). Different lowercase Latin letters above each bar for the same species and plant part indicate significant differences at p < 0.05 according to Duncan’s Multiple Range test. Vertical lines above each bar represent the standard deviation (SD).
Horticulturae 12 00177 g002
Figure 3. Total phenol content of the studied wild edible species in relation to biostimulant application (n = 4; mean ± SD). Different lowercase Latin letters above each bar for the same species and plant part indicate significant differences at p < 0.05 according to Duncan’s Multiple Range test. GAE: gallic acid equivalents.
Horticulturae 12 00177 g003
Figure 4. Scatterplot of principal components 1 and 2 for the tested wild edible species treated with the two biostimulants.
Horticulturae 12 00177 g004
Figure 5. Loading plot of principal components 1 and 2 for the tested wild edible species treated with the two biostimulants.
Horticulturae 12 00177 g005
Table 1. Meteorological conditions (mean, maximum and minimum temperature (°C) and relative humidity (RH; %) throughout the growing period).
Temperature (°C)RH (%)
MonthMeanMaxMinMeanMaxMin
October17.4942.736.177.6995.0430.16
November14.4239.692.4382.6297.4834.44
December10.7633.81−3.6281.2596.6233.73
January9.4633.41−4.5182.296.8632.43
February10.2538.24−3.970.9398.2928.77
March15.0733.973.1462.4794.316.62
Table 2. The effect of biostimulant application on the number of leaves (g), dry weight of plants (%), leaf area (LA; cm2), specific leaf area (SLA; m2/kg), leaf area index (LA), chlorophyll content of leaves (SPAD index), and dry weight of roots of Sonchus oleraceus, Cichorium spinosum, and Scolymus hispanicus plants (n = 24; mean ± SD).
Number of LeavesLA cm2LAIDry Weight of Leaves (%)SLA (m2/kg)SPADDry Weight of Roots (%)
Sonchus oleraceus
Control14.8 ± 1.2 b303 ± 14 b0.18 ± 0.08 b9.4 ± 0.8 a22.1 ± 2.6 a29.2 ± 2.9 b-
Seaweeds13.7 ± 1.6 b257 ± 12 c0.16 ± 0.07 b9.0 ± 1.0 a22.0 ± 3.3 a24.4 ± 3.0 c-
Bactiva19.6 ± 1.6 a458 ± 36 a0.28 ± 0.02 a9.3 ± 1.0 a21.1 ± 3.5 a34.2 ± 2.0 a-
Cichorium spinosum
Control15.7 ± 1.1 ab262 ± 18 a0.16 ± 0.05 a7.5 ± 0.7 c18.8 ± 1.4 a60.8 ± 6.2 b-
Seaweeds16.8 ± 1.4 a252 ± 14 a0.15 ± 0.09 a8.7 ± 0.5 b15.1 ± 2.4 b75.9 ± 6.8 a-
Bactiva14.8 ± 1.7 b213 ± 29 b0.13 ± 0.06 b9.3 ± 0.3 a18.4 ± 1.7 a62.3 ± 7.8 b-
Scolymus hispanicus
Control12.7 ± 2.5 a424 ± 27 a0.26 ± 0.17 a11.6 ± 1.7 a11.5 ± 1.1 c47.4 ± 2.6 b14.9 ± 1.6 c
Seaweeds13.5 ± 4.0 a433 ± 20 a0.26 ± 0.12 a10.4 ± 2.1 b13.2 ± 9.0 b53.1 ± 4.9 a17.4 ± 2.9 a
Bactiva12.2 ± 1.5 a323 ± 14 b0.20 ± 0.09 b9.4 ± 1.9 c15.6 ± 3.6 a50.6 ± 4.0 ab16.3 ± 1.1 b
Mean values and standard deviations in the same column followed by different Latin letters are significantly different at p < 0.05 according to Duncan’s Multiple Range test.
Table 3. Proximate composition of leaves and roots of the studied wild edible species in relation to biostimulant application (n = 4; mean ± SD).
Ash (%)Fat (%)Carbohydrates (%)Energy kcal/100 g
Sonchus oleraceusLeaves
Control19.27 ± 0.16 a3.62 ± 0.20 a53.55 ± 0.64 c341.01 ± 1.60 a
Seaweeds18.33 ± 1.46 b1.65 ± 0.02 c57.17 ± 2.34 a332.60 ± 11.96 b
Bactiva18.00 ± 1.13 b3.15 ± 0.60 b55.30 ± 0.89 b341.23 ± 9.28 a
Cichorium spinosumLeaves
Control20.00 ± 0.56 a2.37 ± 0.16 b56.41 ± 0.67 b331.85 ± 1.67 b
Seaweeds16.73 ± 0.58 c2.56 ± 0.01 a59.26 ± 0.88 a345.88 ± 2.31 a
Bactiva15.88 ± 0.27 b2.07 ± 0.01 c59.72 ± 0.81 a346.82 ± 1.15 a
Scolymus hispanicusLeaves
Control17.98 ± 0.84 c1.67 ± 0.11 b59.35 ± 1.48 a336.47 ± 3.73 a
Seaweeds20.47 ± 0.24 a1.47 ± 0.07 c58.52 ± 1.66 b325.46 ± 0.65 b
Bactiva19.31 ± 0.6 b1.73 ± 0.01 a57.50 ± 0.45 c326.4 ± 2.42 b
Scolymus hispanicusRoots
Control4.27 ± 0.32 b0.31 ± 0.02 c81.83 ± 0.42 a384.49 ± 1.31 b
Seaweeds4.40 ± 0.39 a2.34 ± 0.07 a80.27 ± 0.81 b394.07 ± 1.31 a
Bactiva4.29 ± 0.3 b0.57 ± 0.03 b81.67 ± 0.17 a385.67 ± 1.07 b
Mean values and standard deviations in the same column and for the same species followed by different lowercase Latin letters are significantly different at p < 0.05, according to Duncan’s Multiple Range test.
Table 4. Mineral composition of leaves and roots of the studied wild edible species in relation to biostimulant application (n = 4; mean ± SD).
N (g/kg)P (g/kg)K (g/kg)
Sonchus oleraceusLeaves
Control37.70 ± 0.78 b (2.07%)1.25 ± 0.24 c (15.89%)44.28 ± 0.99 c (1.82%)
Seaweeds37.31 ± 0.50 b (1.10%)1.53 ± 0.32 a (17.38%)47.75 ± 6.79 b (11.62%)
Bactiva38.48 ± 0.36 a (0.77%)1.40 ± 0.04 b (2.43%)50.48 ± 1.61 a (2.61%)
Cichorium spinosumLeaves
Control33.95 ± 0.54 b (2.78%)1.86 ± 0.23 b (5.33%)44.76 ± 0.22 c (1.98%)
Seaweeds34.33 ± 0.56 b (6.09%)2.23 ± 0.34 a (13.07%)48.46 ± 3.44 b (2.06%)
Bactiva35.72 ± 1.22 a (0.78%)2.22 ± 0.14 a (21.10%)51.35 ± 2.35 a (5.25%)
Scolymus hispanicusLeaves
Control33.60 ± 1.14 b (1.45%)2.35 ± 0.15 a (1.10%)38.73 ± 0.94 c (1.10%)
Seaweeds31.26 ± 2.33 c (1.10%)1.97 ± 0.32 b (1.10%)41.26 ± 1.04 b (1.10%)
Bactiva35.94 ± 0.35 a (1.10%)1.81 ± 0.47 c (1.10%)45.66 ± 2.94 a (1.10%)
Scolymus hispanicusRoots
Control21.73 ± 0.38 a (2.26%)2.50 ± 0.1 a (3.35%)18.54 ± 0.51 a (2.26%)
Seaweeds20.79 ± 0.58 b (1.45%)2.05 ± 0.2 c (8.05%)17.69 ± 2.01 b (9.28%)
Bactiva21.56 ± 0.58 a (2.19%)2.31 ± 0.09 b (3.00%)17.95 ± 1.17 b (5.34%)
Mean values and standard deviations in the same column and for the same species followed by different lowercase Latin letters are significantly different at p < 0.05 according to Duncan’s Multiple Range test. Values in parentheses indicate the relative standard deviations (RSDs; %).
Table 5. Total phenol and flavonoid content and antioxidant activity of the studied wild edible species in relation to biostimulant application (n = 4; mean ± SD).
DPPH (mg Trolox/g Dried Extract)FRAP (mg Trolox/g Dried Extract)ABTS (mg Trolox/g Dried Extract)Total Flavonoids (mg Rutin/g Dried Extract)
Sonchus oleraceusLeaves
Control26.58 ± 1.76 b88.68 ± 2.99 a64.72 ± 3.72 a48.55 ± 1.63 b
Seaweeds32.01 ± 2.53 a66.6 ± 5.38 c38.17 ± 2.35 c55.62 ± 2.03 a
Bactiva21.37 ± 2.34 c78.91 ± 1.94 b54.96 ± 2.06 b43.64 ± 3.52 c
Cichorium spinosumLeaves
Control34.56 ± 1.42 a82.10 ± 3.96 b70.36 ± 2.35 a53.76 ± 3.09 b
Seaweeds14.86 ± 1.11 c84.16 ± 3.51 a71.68 ± 2.76 a42.16 ± 1.58 c
Bactiva17.10 ± 0.55 b80.85 ± 3.16 c49.76 ± 2.32 b56.56 ± 2.08 a
Scolymus hispanicusLeaves
Control23.97 ± 0.82 a81.29 ± 5.37 a55.47 ± 3.67 b46.81 ± 2.58 a
Seaweeds15.99 ± 1.44 c80.93 ± 4.50 a59.58 ± 4.31 a41.47 ± 1.89 b
Bactiva20.27 ± 1.80 b63.21 ± 1.67 b49.83 ± 2.01 c47.67 ± 2.02 a
Scolymus hispanicusRoots
Control18.91 ± 1.42 a47.23 ± 0.58 a30.32 ± 1.50 a71.61 ± 0.98 c
Seaweeds8.21 ± 0.27 b15.84 ± 1.07 c20.71 ± 1.29 b81.28 ± 0.32 a
Bactiva18.34 ± 1.24 a23.18 ± 0.07 b21.15 ± 1.53 b76.14 ± 0.53 b
Mean values and standard deviations in the same column and for the same species followed by different lowercase Latin letters are significantly different at p < 0.05, according to Duncan’s Multiple Range test.
Disclaimer/Publisher’s Note: The statements, opinions and data contained in all publications are solely those of the individual author(s) and contributor(s) and not of MDPI and/or the editor(s). MDPI and/or the editor(s) disclaim responsibility for any injury to people or property resulting from any ideas, methods, instructions or products referred to in the content.