Article

Green Light Enhances the Postharvest Quality of Lettuce During Cold Storage

1
Department of Bioresource Engineering, Macdonald Campus, McGill University, Montreal, QC H9X 3V9, Canada
2
Controlled Environment Agriculture Center, College of Agriculture and Natural Resources, University of Tehran, Tehran 1417614411, Iran
*
Author to whom correspondence should be addressed.
Horticulturae 2025, 11(7), 792; https://doi.org/10.3390/horticulturae11070792
Submission received: 6 May 2025 / Revised: 23 June 2025 / Accepted: 2 July 2025 / Published: 4 July 2025

Abstract

The postharvest quality of lettuce (Lactuca sativa) is significantly influenced by the lighting environment during storage. This study evaluated the effects of green LEDs at 500 nm and 530 nm, white LEDs (400–700 nm), and dark storage on lettuce quality over 14 days at 5 °C. All treatments were applied at 10 µmol m−2 s−1 under a 12 h photoperiod. Quality parameters measured included moisture loss, relative water content (RWC), photosynthetic rate, chlorophyll content (SPAD), total soluble solids (TSSs), electrolyte leakage (EL), color change (∆E), texture (crispness), and overall visual quality (OVQ). Lettuce stored under green LEDs, particularly 530 nm, exhibited superior postharvest quality. Compared to dark storage, 530 nm reduced moisture loss by 7.1%, increased RWC by 9.2%, and reduced transpiration rate. The green light preserved photosynthetic activity (43% decline vs. 77% in the dark), increased TSS, reduced color change by 42%, improved crispness by 46.1%, and limited EL to 54.5%. Shelf life was extended by approximately four days. The 500 nm treatment showed notable improvements, including an 8.4% reduction in moisture loss, 8.2% higher RWC, a smaller photosynthesis decline (25%), and the lowest EL (53.1%). It improved color retention (∆E reduced by 45.3%) and crispness (46.8%). Both green wavelengths effectively maintained lettuce quality during cold storage, with 530 nm being the most effective overall. These results suggest that targeted green LED lighting is a promising, energy-efficient strategy to preserve postharvest quality and extend shelf life in leafy greens.

Graphical Abstract

1. Introduction

Ensuring the quality of fresh produce and reducing postharvest losses are critical for establishing a sustainable food system, as food insecurity is exacerbated by widespread postharvest losses and food waste. An estimated 20% to 50% of harvested fruits and vegetables are wasted due to post harvest losses, intensifying the pressure on agricultural systems to meet the escalating global food demand [1].
Leafy vegetables are particularly perishable, typically undergoing rapid metabolic processes and wilting after harvest [2]. These changes are often accompanied by color changes, chlorophyll degradation, moisture loss, and decay, all of which contribute to a decrease in quality and may lead to consumer rejection [3,4]. Lettuce, as a widely consumed salad vegetable, faces significant postharvest challenges and losses [4].
To address this postharvest challenge, postharvest light-emitting diode (LED) lighting has emerged as an effective method for extending the shelf life of vegetable crops [5,6]. LED treatments offer several advantages over traditional preservation techniques, including being non-toxic, cost-effective, residue-free, and environmentally friendly [7]. Numerous studies have demonstrated the effectiveness of LED irradiation in preserving sensory and nutritional quality, extending the shelf life of tomato (Solanum lycopersicum) [8], strawberry (Fragaria ananassa) [9], pakchoi (Brassica rapa ssp. chinensis) [10], spinach (Spinacia oleracea) [11], and kale (Brassica oleracea) [12]. LEDs maintain produce quality by preserving sugars, suppressing microbial growth, decreasing decay incidence, minimizing moisture loss, and preventing color change [3,4,13]. Fresh-cut amaranth (Amaranthus dubius) exposed to blue LEDs (460 nm) at intensities of 10, 20, and 30 µmol m−2 s−1 under continuous illumination at 4 °C and 90% RH for 12 days exhibited significant improvements in postharvest quality. Blue LED irradiation enhanced antioxidant enzyme activity and effectively inhibited microbial growth, extending the shelf life by 2–3 days. However, increased light intensity led to higher biomass loss [14]. Fresh-cut pak choi (Brassica rapa) treated with red-violet LED light (660 and 405 nm) at 15 µmol m−2 s−1 under an intermittent 12 h per day photoperiod at 4 °C and 90% RH for 12 days demonstrated delayed senescence and improved quality retention. The LED treatment increased antioxidant enzyme activity and regulated chlorophyll metabolism [15].
Despite the well-documented benefits of blue, red, and white LEDs on postharvest quality, the role of green light remains underexplored, particularly in leafy vegetables like lettuce.
Blue and red LEDs generally promote stomatal opening on both leaf surfaces, while green LEDs (530 nm), especially at lower PPFDs, reduce stomatal opening [16]. This regulation may help minimize transpiration and water loss, contributing to improved postharvest quality and extended shelf life of leafy greens. A previous study examining the effects of green LEDs (500 nm and 530 nm), white LEDs (400–700 nm), and dark storage on lettuce under controlled conditions (light intensity of 10 µmol m−2 s−1, 12 h photoperiod, 5 °C for 14 days) reported that green LED treatments significantly enhanced antioxidant activity, total phenolic content, and flavonoid accumulation [17]. In particular, the 530 nm green LED increased anthocyanin, carotenoid, and chlorophyll a content in lettuce [17].
This study aimed to investigate green light as a potential alternative or complementary treatment to the more commonly studied spectra. The effects of green light wavelengths (500 nm and 530 nm) were compared with those of white LEDs (400–700 nm) at a low intensity (10 µmol m−2 s−1) and under dark conditions on postharvest lettuce quality attributes. It was hypothesized that green wavelengths, by enhancing biochemical parameters [17] and promoting stomatal closure [16] during postharvest storage, could influence physiological responses and extend shelf life. Findings suggest that this approach may help maintain lettuce quality for retail and wholesale markets while providing a cost-effective solution for the agricultural sector.

2. Materials and Methods

2.1. Sample Preparation

Hydroponically cultivated romaine lettuce (Lactuca sativa var. ‘Breen’) was purchased from La Boîte Maraîchère (Laval, QC, Canada). The lettuce was transported to the laboratory within 1 h of harvesting. Lettuce heads with consistent size, color, and no signs of disease were selected.

2.2. Light Sources and Experimental Conditions

Two green LED arrays emitting light at peak wavelengths of 500 nm and 530 nm, along with white LEDs (400–700 nm) (UTechnology Corp., Calgary, AB, Canada), were used with a lighting regime comprising 12 h light and 12 h dark cycles (Figure 1). The intensity of light from all three LED sources was standardized to 10 µmol m−2 s−1, measured using a light meter (Model MQ500, Apogee Instruments Inc., Logan, UT, USA). Dark cold storage served as the control.
Lettuce heads were divided randomly into four experimental groups, each comprising three lettuce heads with three replications (overall nine lettuce heads obtained for each treatment). Each individual lettuce head was positioned inside a transparent polyethylene terephthalate clamshell (LBM AGTECH, Laval, QC, Canada) measuring 30 cm (L) × 13 cm (W) × 15 cm (H). These groups were distributed among separate shelves within a cold storage room with a temperature of 5 °C ± 1 °C, with relative humidity (RH) maintained between 90% and 95% for a duration of 14 d (Figure 1). The control group underwent dark conditions within the same room. To prevent light interactions among groups, shelves were covered and divided with black cardboard. The experiment was replicated three times for every storage condition.

2.3. Quality Assessment

2.3.1. Moisture Loss

Lettuce was weighed at the beginning of the experiment just before the light treatment. Measurements were conducted every 2 d throughout the storage period. Moisture loss was expressed as the percentage loss of the initial mass using Equation (1):
Moisture loss (%) = ((Mi − Mf)/Mi) × 100
where Mi and Mf refer to the initial mass and final mass of the samples.

2.3.2. Color Measurement

Lettuce color was measured using a CR-300 Chromometer (Minolta CR-300, Tokyo, Japan) that underwent calibration with a standard white plate before each measurement. Color measurements were taken at three specific points on the upper surface of lettuce leaves in each package (3 points on one outer leaf and 3 leaves per head). The color scale employed was CIE (L*a*b*) with the Hunter–Scofield equation (Equation (2)), and the saturation index or chroma (C*) was calculated with Equation (3):
∆E = √(Lp − Li)2 + (ap − ai)2 + (bp − bi)2
C* = √(a2 + b2)
where L signifies lightness and ranges from black (0) to white (100), a span from green (−) to red (+), and b encompasses blue (−) to yellow (+). i and p refer to reference values (fresh lettuce) and after-treatment sample values, respectively. A higher ∆E denotes a greater color change from the reference material. Also, chromaticity (C*) increases as the values of a* and/or b* rise. For each lettuce, three separate readings were taken, and the average of these readings was subsequently calculated.

2.3.3. Texture Measurements

Texture measurements of the lettuce samples were collected with an Instron universal testing machine (Model 4502, Canton, MA, USA) controlled by a PC-based data acquisition system, following the methodology established by Firouz et al. [18]. After the designated storage period, one outer leaf was removed from each sample, yielding a total of three outer leaves from each experimental group. Rectangular strips were then cut from the outer leaves, positioned between and parallel to the major veins, using a razor blade. These strips measured 10 mm in width and 70 mm in length. The sampling strips were prepared immediately before conducting the mechanical experiments. Tensile tests were performed at a controlled speed of 0.5 mm·s−1. A pair of holder grippers were employed to secure the strip sample at its ends. The effective length of the sample was standardized to 50 mm. The tensile force was monitored in relation to distance until a rupture occurred within the strip sample. Crispness (stiffness) was derived from the Young modulus (i.e., elastic modulus) that quantifies the tensile or compressive crispness of a solid material when subjected to longitudinal force, whereby a higher Young’s modulus corresponds to increased crispness. Equation (4) illustrates the relationship between crispness and elastic modulus within lettuce crops, as previously established by Firouz et al. [18]:
E = L/WT × ⅆf/ⅆx
where L represents the length of the strip, W and T are the width and thickness of the sample, and ⅆf/ⅆx signifies the crispness of the lettuce leaf. The prepared strips were uniform in both length (50 mm) and width (10 mm). By assuming a consistent thickness across all samples, the product’s crispness was directly proportional to its elasticity.

2.4. Gas Exchange Measurements

Net photosynthesis and transpiration rates were measured at the start of the experiment and at 7d intervals using a portable photosynthesis system (LI-6400, LI-COR Inc., Lincoln, NE, USA). Measurements were taken from three fully expanded leaves per plant, on three plants per treatment. Leaves were placed in the infrared gas analyzer (IRGA) chamber, which detects changes in CO2 and H2O vapor concentrations to calculate gas exchange parameters.

2.5. Chlorophyll Content (SPAD Index)

Chlorophyll content (the SPAD index) was estimated using a SPAD-502 chlorophyll meter (Konica Minolta, Osaka, Japan). For each treatment, measurements were taken on three plants, with SPAD readings collected from three leaves per plant (the same leaves used for photosynthesis rate measurements). Each leaf was measured at three different locations, and the average SPAD value was calculated for analysis.

2.6. Relative Water Content (RWC)

RWC was determined gravimetrically. For each treatment, three lettuce leaf samples were collected, and their fresh masses were immediately recorded. To determine the turgid mass, each lettuce leaf sample was floated on de-ionized water in laboratory vials for 4–6 h under normal room light and temperature and subsequently reweighed. Lettuce leaf samples were then subjected to oven-drying at 80 °C for 12 h, and the mass of the oven-dried leaf was determined following the method described by Barrs and Weatherley [19] based on the following Equation (5):
RWC (%) = [(Fresh Mass − Dry Mass)/(Turgid Mass − Dry Mass)] × 100

2.7. Electrolyte Leakage

To assess electrolyte leakage or membrane stability, fresh leaf samples (0.1 g) were placed in vials containing 10 mL deionized water. The vials were sealed and placed in a water bath at a constant temperature of 32 °C. After a period of 2 h, the initial electrical conductivity of the water medium (EC1) was measured using an EC meter (Hanna Instrument, HI-98129 Smithfield, RI, USA). The leaf samples were then placed in a boiling water bath at 100 °C for 1 h and allowed to cool down to 27 °C. The electrical conductivity of the leaf samples (EC2) was measured again. Electrolyte leakage was determined using Equation (6) as described by Kiran [20]:
EL (%) = (EC1/(EC2)) × 100

2.8. Assessment of Overall Visual Quality (OVQ)

A panel of three students from the Department of Bioresource Engineering at McGill University (Sainte-Anne-de-Bellevue, QC, Canada) were trained to evaluate the overall visual quality (OVQ) of lettuce and were blinded to the experimental conditions. Each treatment involved the assessment of three lettuce heads by this panel. The rating method outlined by Kader, Lipton, and Morris [21] was employed to evaluate the esthetic quality of lettuce for its commercial appeal. The rating scale ranged from 9 (representing “excellent” lettuce heads with minimal defects) to 1 (indicating “extremely poor” and non-usable lettuce heads). The OVQ of the product was categorized as “poor” (exhibiting excessive defects, unsellable), “fair” (slightly to moderately objectionable defects, reduced sales appeal), or “good” (possessing minor defects that are not objectionable). Building upon prior research, an OVQ score of at least 6 was considered suitable for the market [22]. Visual evaluations for visual quality attributes were conducted every two days over a 14 day period.

2.9. Statistical Analysis

Statistical analyses were conducted using SAS software version 8.1 (SAS Institute Inc., Cary, NC, USA) through a Randomized Complete Block Design (RCBD), with a significance level set to p = 0.01. For each response variable, data were first subjected to a two-way factorial ANOVA with the light spectrum and storage day as fixed factors; biological replicates served as blocks. When the Spectrum × Day interaction was not significant (p > 0.01), results were interpreted on the basis of the two main effects; otherwise, simple-effect means were compared. Pairwise comparisons of means were performed using the Duncan multiple range test. Principal component analysis (PCA), as one of the multivariate data analysis methods to reduce the dimensions of complex datasets [23], was additionally performed in its graphical representation (PCA biplot); vectors representing parameters that formed an acute angle were considered correlated parameters, while those that were perpendicular were considered uncorrelated.

3. Results and Discussion

Different light wavelengths markedly influenced the plants’ physiological responses, impacting biochemical composition and secondary metabolite composition [24]. While extensive studies have investigated the influence of light on plant growth and yield in controlled environments, limited research has focused on the effect of light quality, particularly green LEDs on postharvest performance, in leafy vegetables such as lettuce. Green LED light (500–530 nm) can improve postharvest quality in leafy greens by reducing moisture loss through stomatal closure and maintaining photosynthesis near the light compensation point [16,25] and enhancing phytochemical content [17], yet its effects remain less studied compared to other light spectra. The present study aimed to investigate and compare the postharvest performance of harvested lettuce when subjected to cold storage under green LEDs, white LEDs, and dark conditions, of which the latter two are conventional storage strategies for harvested produce.

3.1. Green Light Effect on Lettuce Moisture Loss, Transpiration Rate, and RWC

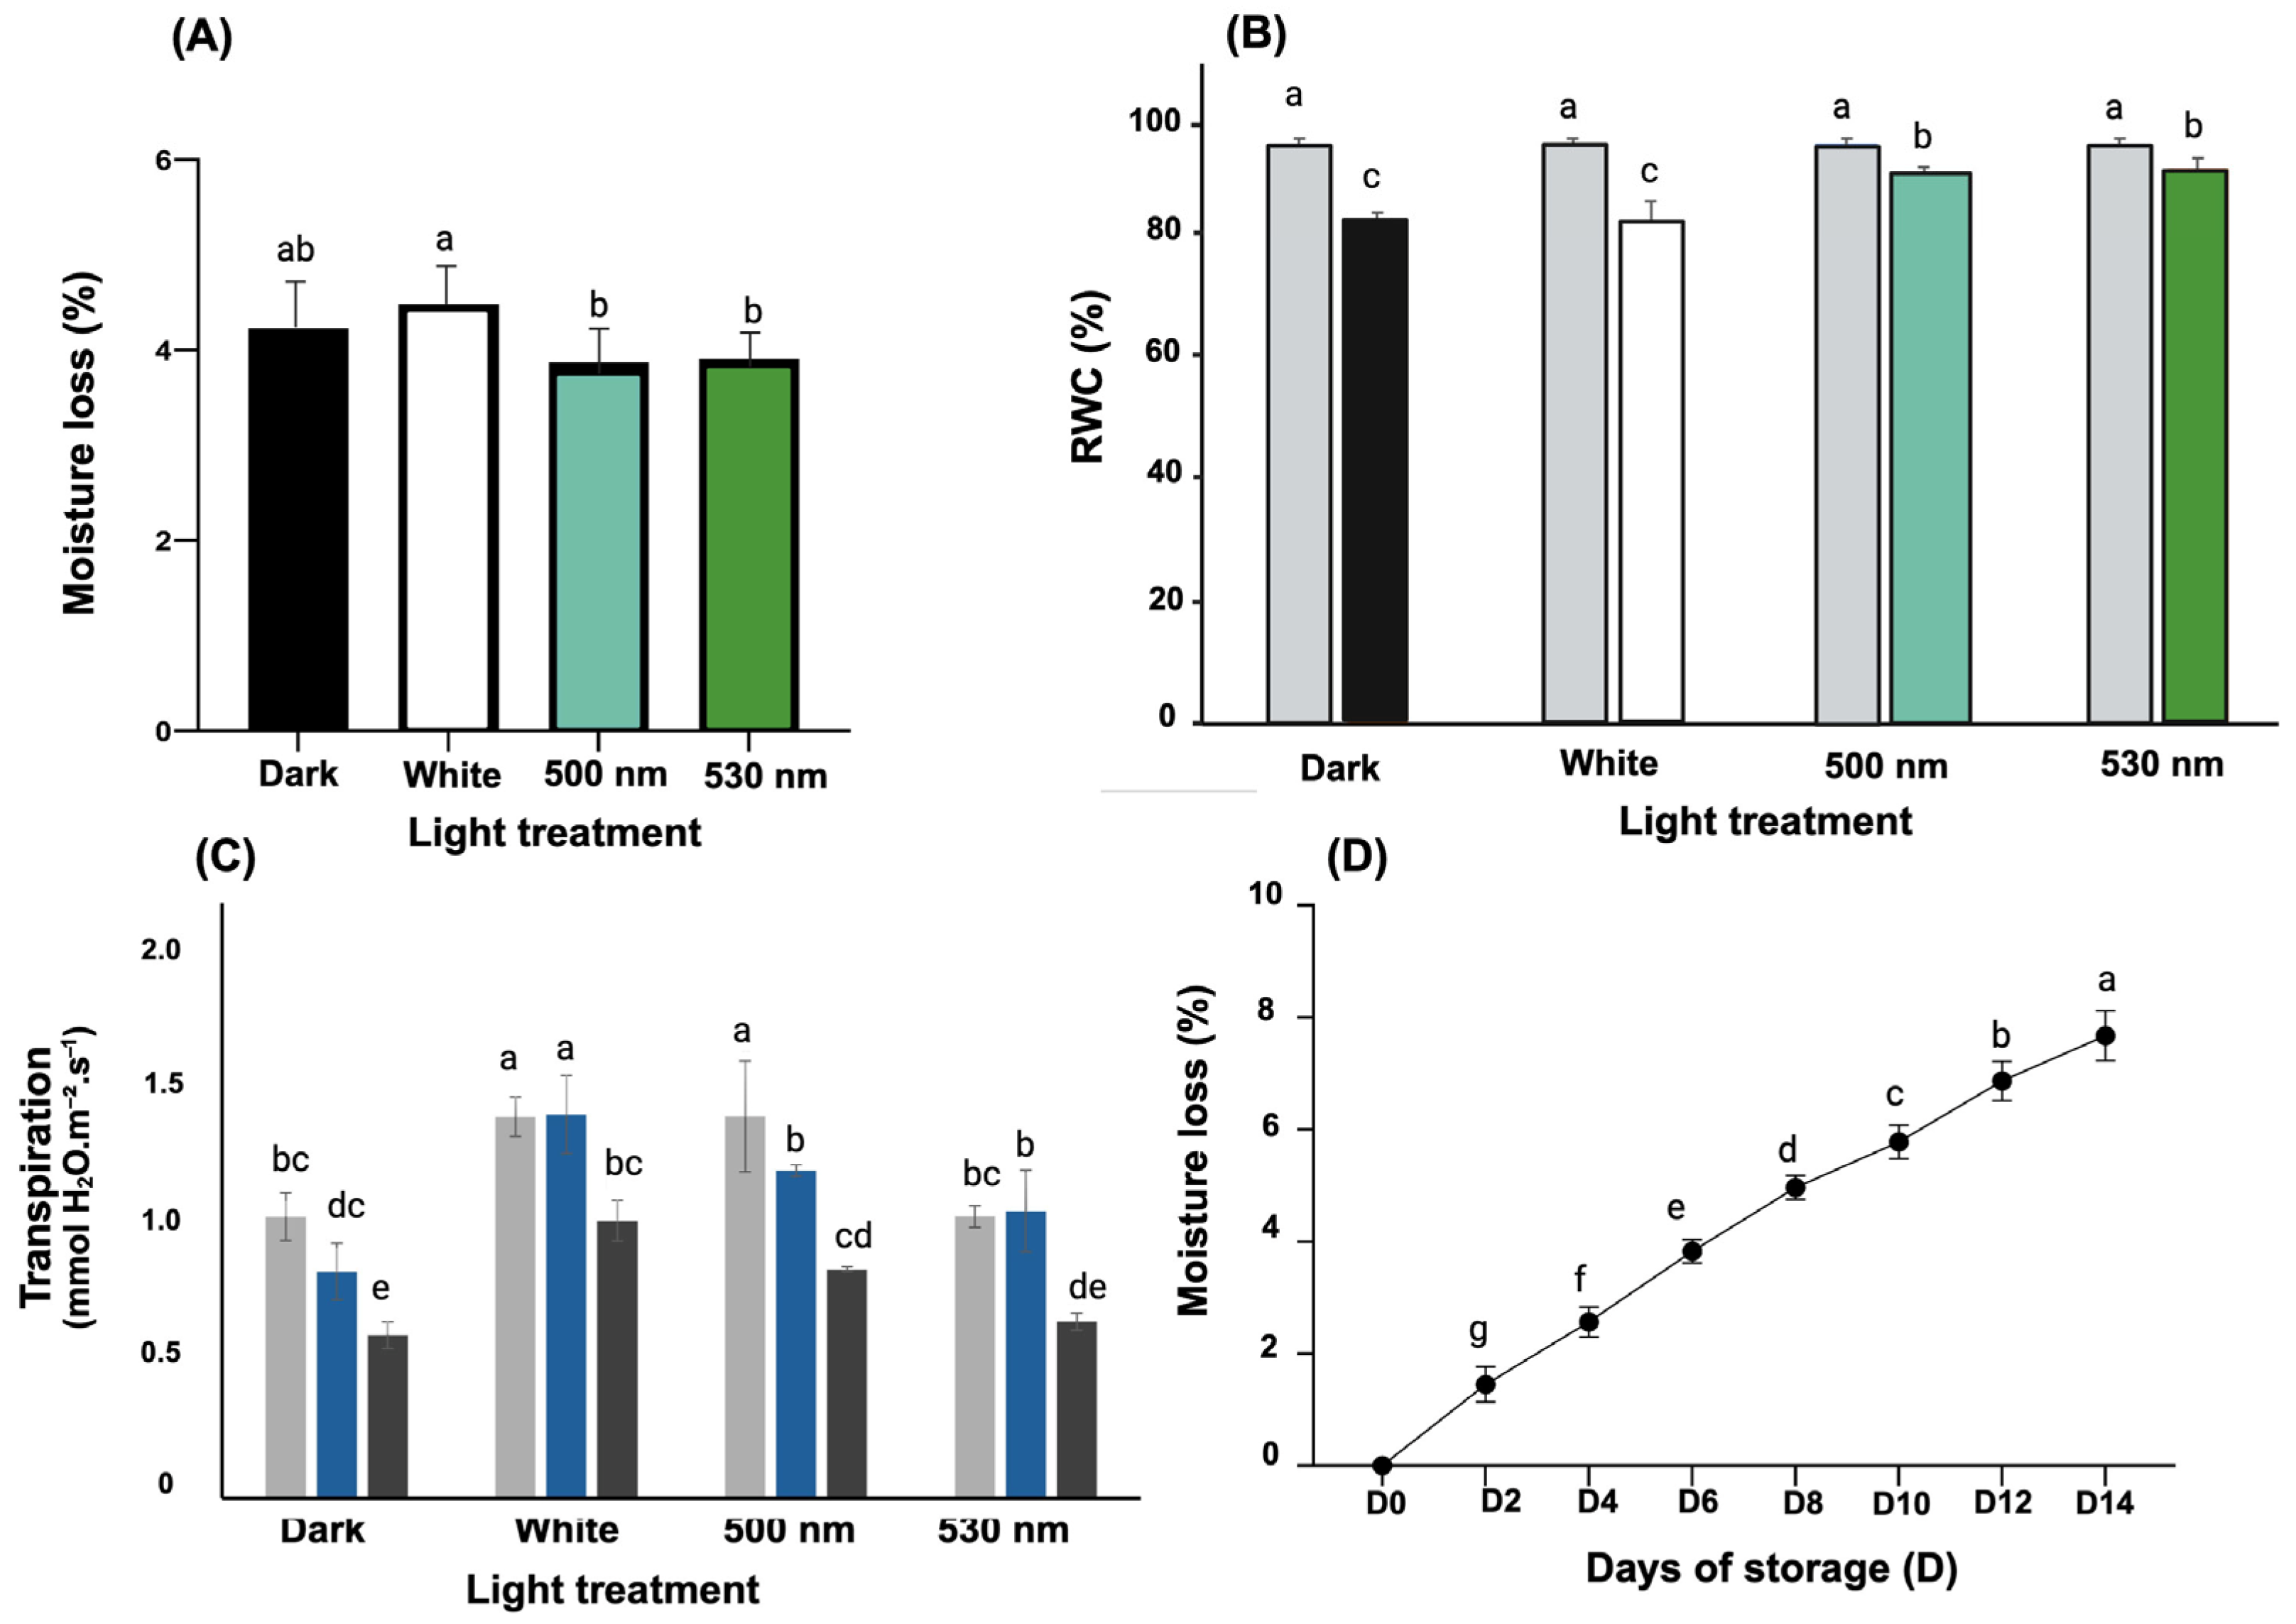
Irrespective of the LED spectrum, all lettuce used in this study exhibited a reduction in moisture content over the storage period (Figure 2A,D). The observed moisture loss reported herein can be attributed to both respiration induced moisture loss and evaporation from the interior of the lettuce [26]. Comparatively, lettuce treated with green LEDs at 500 nm and 530 nm experienced 9.2% and 7.1% lower moisture losses, respectively, than those kept in the dark, although this difference was not statistically significant (p > 0.01). Similar findings were observed in kale and spinach, where treatment with green LEDs at 560 nm resulted in the lowest moisture loss, while the control group showed the highest moisture loss for both vegetables [12]. In contrast, moisture loss was 14.3% and 12.6% higher in lettuce stored under white LEDs compared to those stored under 500 and 530 nm, respectively (p < 0.01). It has been previously reported that a light treatment containing a high blue fraction in the spectrum (white light usually encompasses a high proportion of blue spectral ranges) exhibited more pronounced mass losses [24]. Consistent with the trends shown in Figure 2C, treatments containing a blue light component (white LEDs) maintained the highest transpiration rates throughout storage, whereas green LEDs and darkness suppressed stomatal water loss. Blue light is well known to trigger stomatal opening in growing lettuce and other leafy greens [16,25,27,28]; the same mechanism appears to persist post harvest, explaining the elevated transpiration under white LEDs. By day 14, the mean transpiration rate under white LEDs was significantly higher than under both green LED treatments (p < 0.01). Lettuce kept in the dark showed the lowest values at every time point. Among the green spectra, 530 nm LEDs produced only an 8.1% increase in transpiration relative to the dark control on day 14, a difference that was not statistically significant, indicating that this wavelength kept stomatal conductance close to the baseline. These observations align with reports that darkness and specific green wavelengths promote partial stomatal closure, thereby limiting water loss [16,25,29]. Although moisture loss (Figure 2A) was numerically 6.3% higher under white LEDs and 9.2% and 7.1% lower under 500 nm and 530 nm LEDs, respectively, none of these differences reached significance versus the dark control (p > 0.01). Thus, while blue-rich light clearly accelerates transpiration, the overall moisture content of the heads did not differ statistically among treatments over the 14 day period.
Figure 2B illustrates that, by day 14, lettuce stored under green LEDs retained significantly more water than the dark control: RWC was 9.2% higher at 530 nm and 8.2% higher at 500 nm (p < 0.01). Storage under white LEDs produced an RWC only 0.5% below the dark treatment—a difference that was not significant (p > 0.01). Relative to day 0, RWC declined by 13.5% (white LEDs) and 13.0% (dark), whereas the 500 nm and 530 nm treatments showed much smaller losses of 5.2% and 4.2%. These data confirm that green light storage consistently slows water depletion, echoing the reduced moisture loss trends discussed earlier.

3.2. Green Light Effect on Lettuce Photosynthesis, SPAD Values, and ∆E

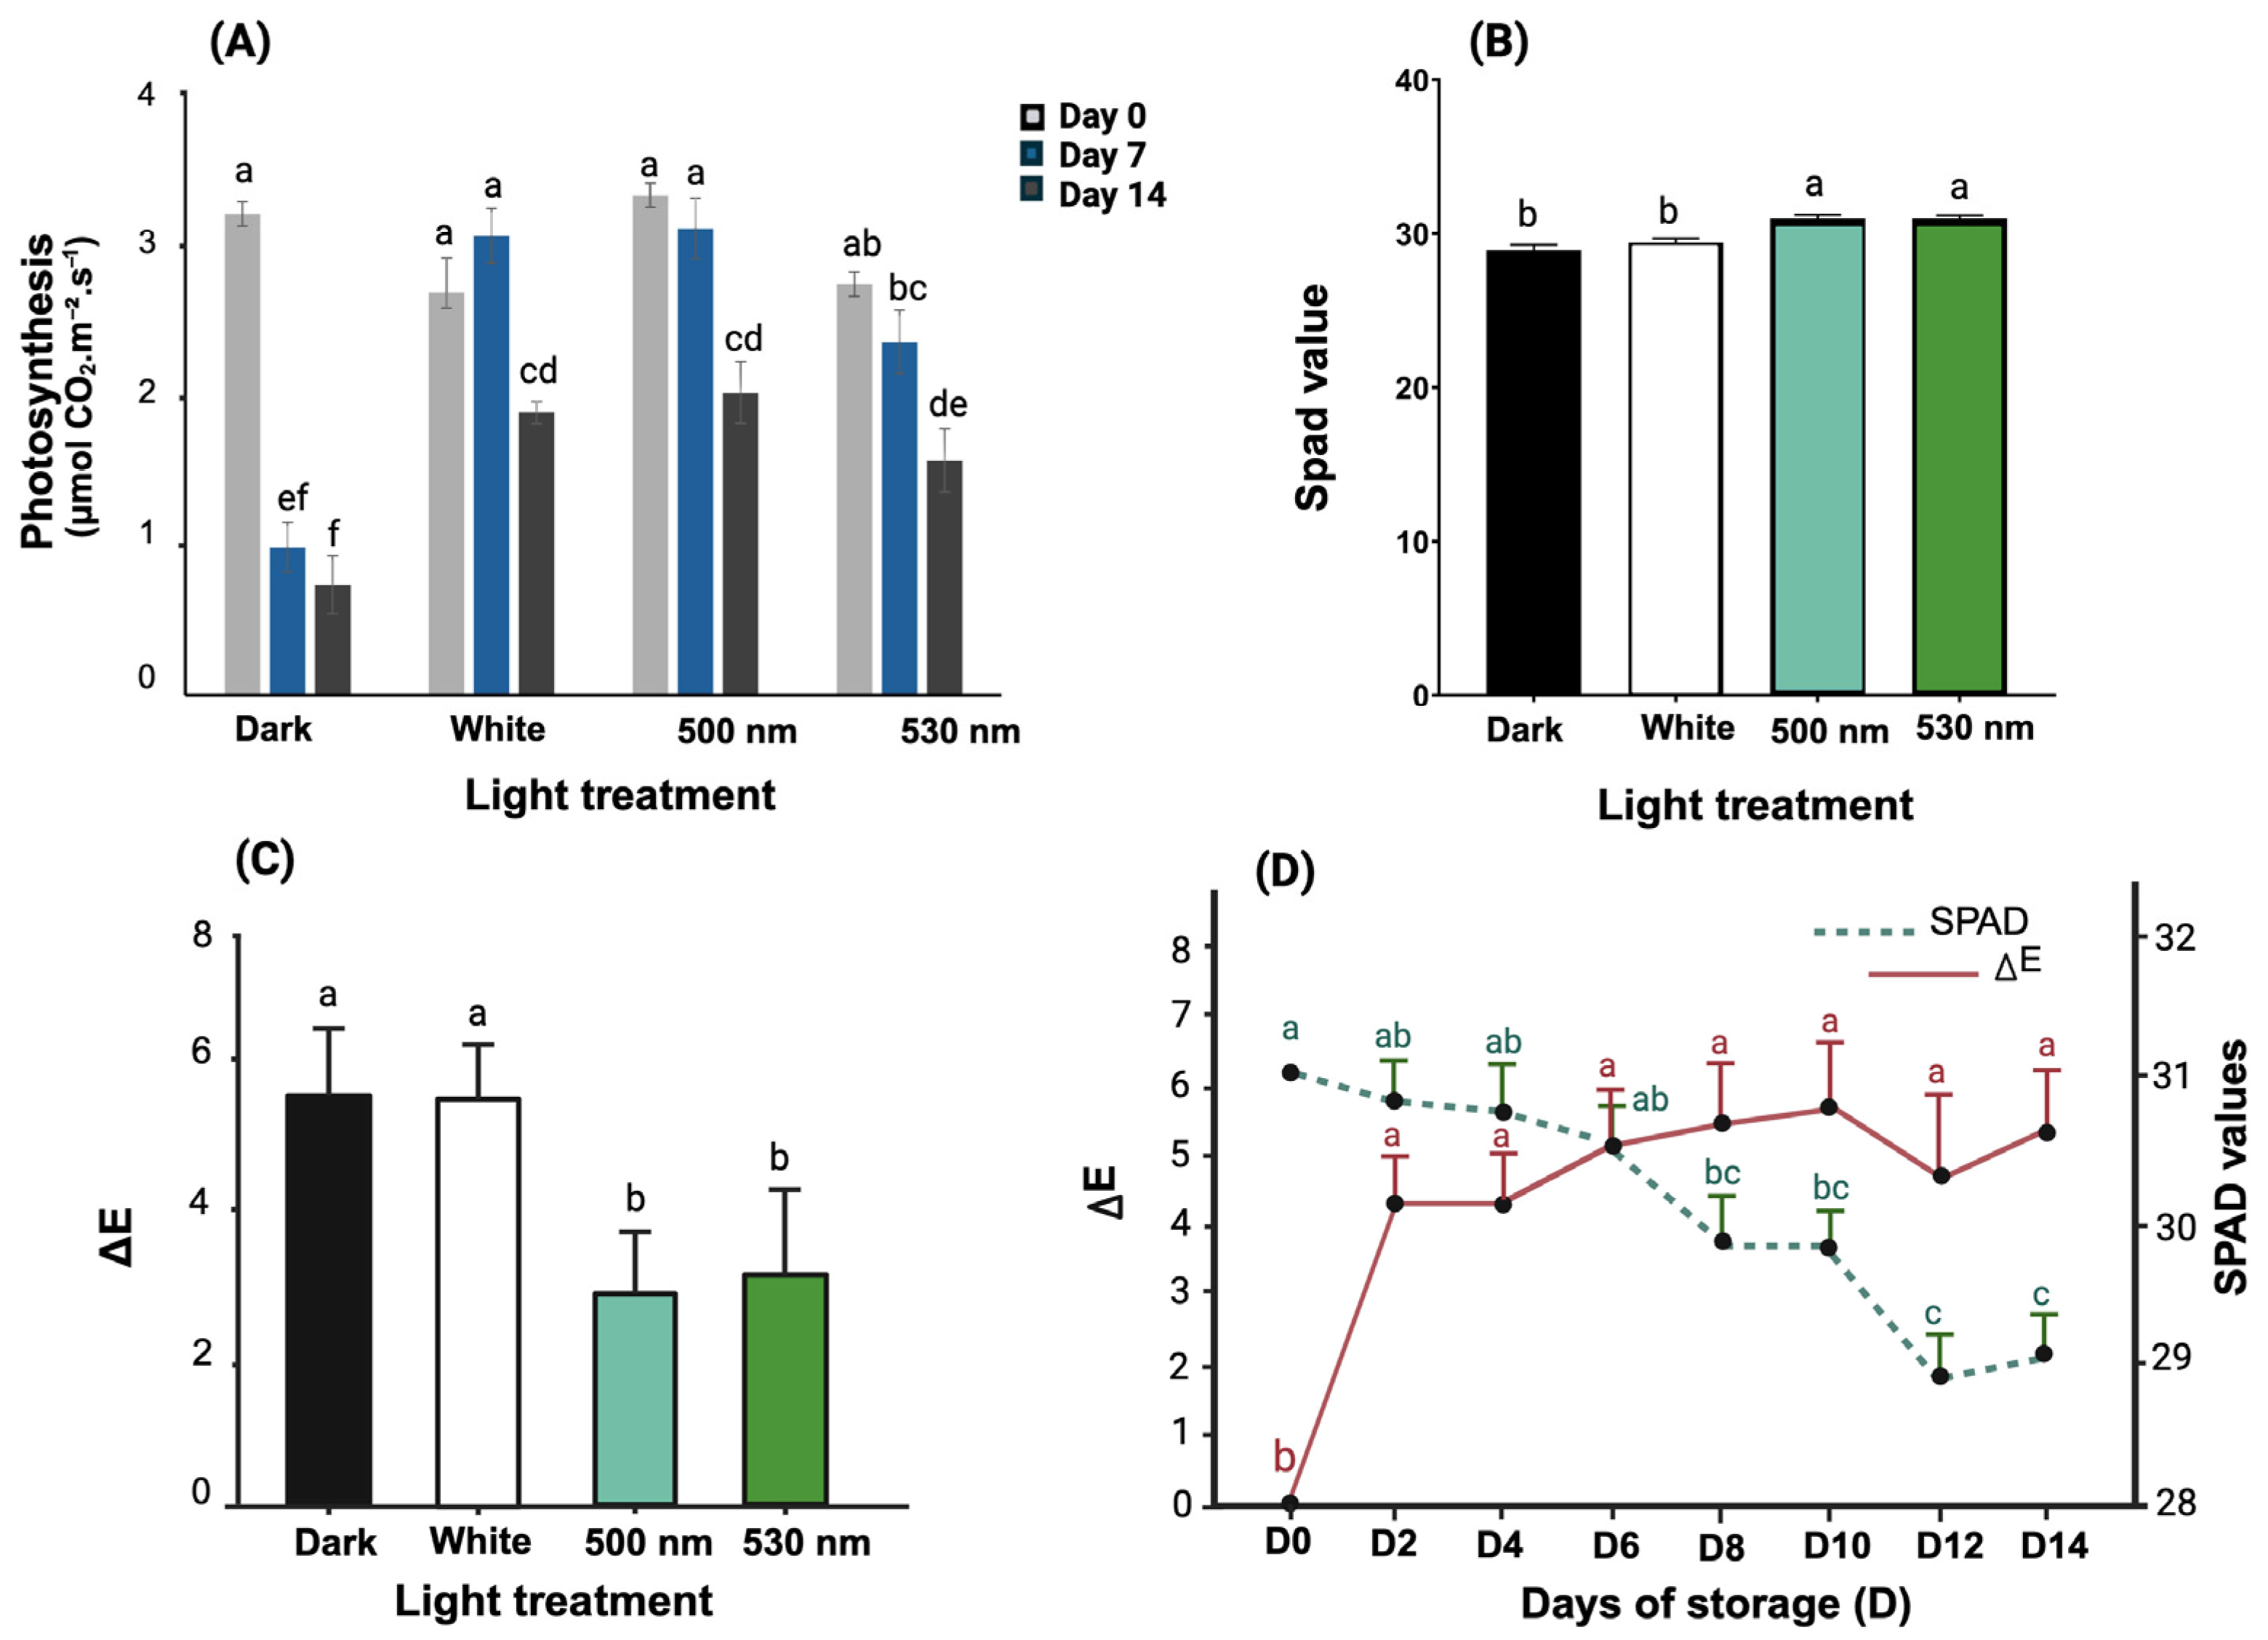
Lettuce stored in the dark experienced the greatest reduction in photosynthetic rate (about 77% below the initial measurement) compared to all other treatments (Figure 3A). Lettuce exposed to the 530 nm and 500 nm green LED lights exhibited 43% and 25% declines, respectively (p < 0.01), over the 14 d period. By the end of the experiment, the photosynthetic rate of lettuce under the 500 nm green LED was 2.7 times higher than that of the dark stored lettuce, indicating that green 500 nm LEDs helped maintain photosynthetic activity for a longer duration. This sustained photosynthesis likely supported the synthesis of soluble sugars (e.g., glucose, fructose, and sucrose) and other metabolites, which may help slow tissue deterioration relative to darkness [30]. Because green wavelengths can penetrate deeper into chlorophyll layers of the leaf [31], storing lettuce under green LEDs could provide sufficient light energy to sustain aspects of its metabolism over a longer period compared to dark storage. In agreement with these findings, Zhan et al. [32] reported that the exposure of broccoli to light in the early storage phase increased photosynthetic compounds and boosted total soluble solids. Kasim and Kasim [4] similarly demonstrated that green LED light was effective in conserving both chlorophyll and TSSs in lettuce, compared to dark storage, during a 14 d storage period. A green color, representing higher chlorophyll content, is a key quality attribute for lettuce, and leaves become visibly yellow as chlorophyll content in plant tissue decreases [33]. Throughout the 14 day storage period, there was a declining trend in SPAD values for all lettuce samples (Figure 3D), reflecting gradual chlorophyll loss. However, significantly higher SPAD values (p < 0.01), indicative of total chlorophyll content, were observed in samples stored under green LEDs, 12% and 15% higher on day 14, respectively (500 and 530 nm) compared to lettuce stored in the dark (Figure 3B). This finding aligns with the results of Jin et al. [13], who demonstrated that green LEDs increased chlorophyll content after 2 d of storage at 25 °C. Contrarily, Hasperué et al. [33] reported an increase in chlorophyll content under white light treatment. In this study, white LEDs did not exhibit a positive effect on chlorophyll levels compared to the samples treated with green LEDs. Similar findings were reported by Loi et al. [34] and by Salehinia et al. [17] for white LED light. This may be due to the occurrence of photoinhibition and degradation of chlorophyll molecules under cold conditions [35].
Leaf color metrics, lightness (L*), and total color difference (ΔE) serve as visual markers of senescence in leafy greens [24]. Across the 14 d of storage, L* changed only slightly and did not differ statistically among treatments (Figure 3A). However, ΔE diverged in behavior as both dark storage and white LED treatments showed a steady increase, while green LED exposure significantly slowed the color change. Because the Spectrum × Day interaction for ΔE was not significant (Supplementary Table S1), panel C shows the main-effect means, i.e., ΔE values averaged over days 0, 7, and 14 for each spectrum. After 14 d, ΔE under 500 nm and 530 nm green light was 45.3% and 42.0% lower than in the dark control, respectively, evidence that green LEDs restrained color degradation, consistent with Lee et al.’s [26] findings for cabbage stored under green light. This preservation mirrors the higher SPAD (chlorophyll) values recorded for the same treatments (Figure 3B) and is visually apparent in the photographs (Figure 4). The time–course curves confirm an inverse relationship between SPAD and ΔE (Figure 3D): as chlorophyll declines and leaves turn yellow, ΔE rises across all treatments, but far more slowly under green light. Thus, green LEDs effectively delay chlorophyll loss and the accompanying color change, whereas white light offers no advantage over darkness.
C* and L* both increased from day 0 to 14 in all treatments (Figure 5B,D), reflecting the normal bleaching that accompanies senescence. The extent of that shift, however, differed by spectrum. After 14 days of cold storage, lettuce treated with 530 nm green LED light showed significantly lower chromaticity (C*) and lightness (L*) values compared to the white light group. Specifically, C* values were reduced by 20.9% under 530 nm compared to those under white LEDs and were not significantly different from those observed under dark and 500 nm green LED conditions (Figure 5A; p < 0.01). Similarly, L* values were significantly lower under 500 and 530 nm green LEDs (5.7% and 5.2%, respectively) compared to those under storage in darkness (Figure 5C; p < 0.01). These results suggest that the green LED treatments, particularly at 500 nm and 530 nm, were effective in preserving the color and OVQ of lettuce during storage. The reduced C* and L* values indicate less yellowing and better retention of green pigmentation, which is often associated with freshness. Green light may delay senescence by affecting pigment biosynthesis pathways, particularly the maintenance of chlorophyll and reduction in carotenoid accumulation [17]. Therefore, monochromatic green light appears to help preserve both the visual and potentially nutritional quality of leafy vegetables during postharvest cold storage.

3.3. Green Light Effect on Lettuce Texture and EL

The postharvest quality of leafy vegetables is influenced by various factors, and texture stands out as a key determinant in this regard [36]. In this study, green LED-treated (500 and 530 nm) lettuce exhibited the highest crispness values (46.8% and 46.1%, respectively), while dark-stored lettuce had the lowest values (Table 1). Lettuce samples treated with white LEDs showed a 26.4% increase compared to those stored in darkness on day 14 (p < 0.01). At the end of the experiment, lettuce stored in the dark displayed significantly lower values of crispness (1.7 mN mm−1) (p < 0.01). Olarte et al. [37] and Ayala et al. [38] observed increases in the crispness of broccoli, cauliflower, and fresh-cut leek when exposed to light during storage compared to those stored in the dark. A factor that may contribute to changes in the texture and quality of fruits and vegetables is lignin synthesis. Research has demonstrated that specific light conditions can trigger lignification in plant tissues [38]. However, our study did not specifically investigate lignin levels.
A significant increase in EL in all lettuce samples over the 14-day storage period compared to the initial value was detected in all lettuce samples (Table 1). Lettuce samples stored in darkness showed higher electrolyte leakage (62.3%) compared to the initial values, followed by white (56.9%), green/530 nm (54.5%), and green/500 nm LEDs (53.1%), although this difference was not statistically significant (p > 0.01).

3.4. Green Light Effect on Lettuce Overall Visual Quality (OVQ) During Cold Storage

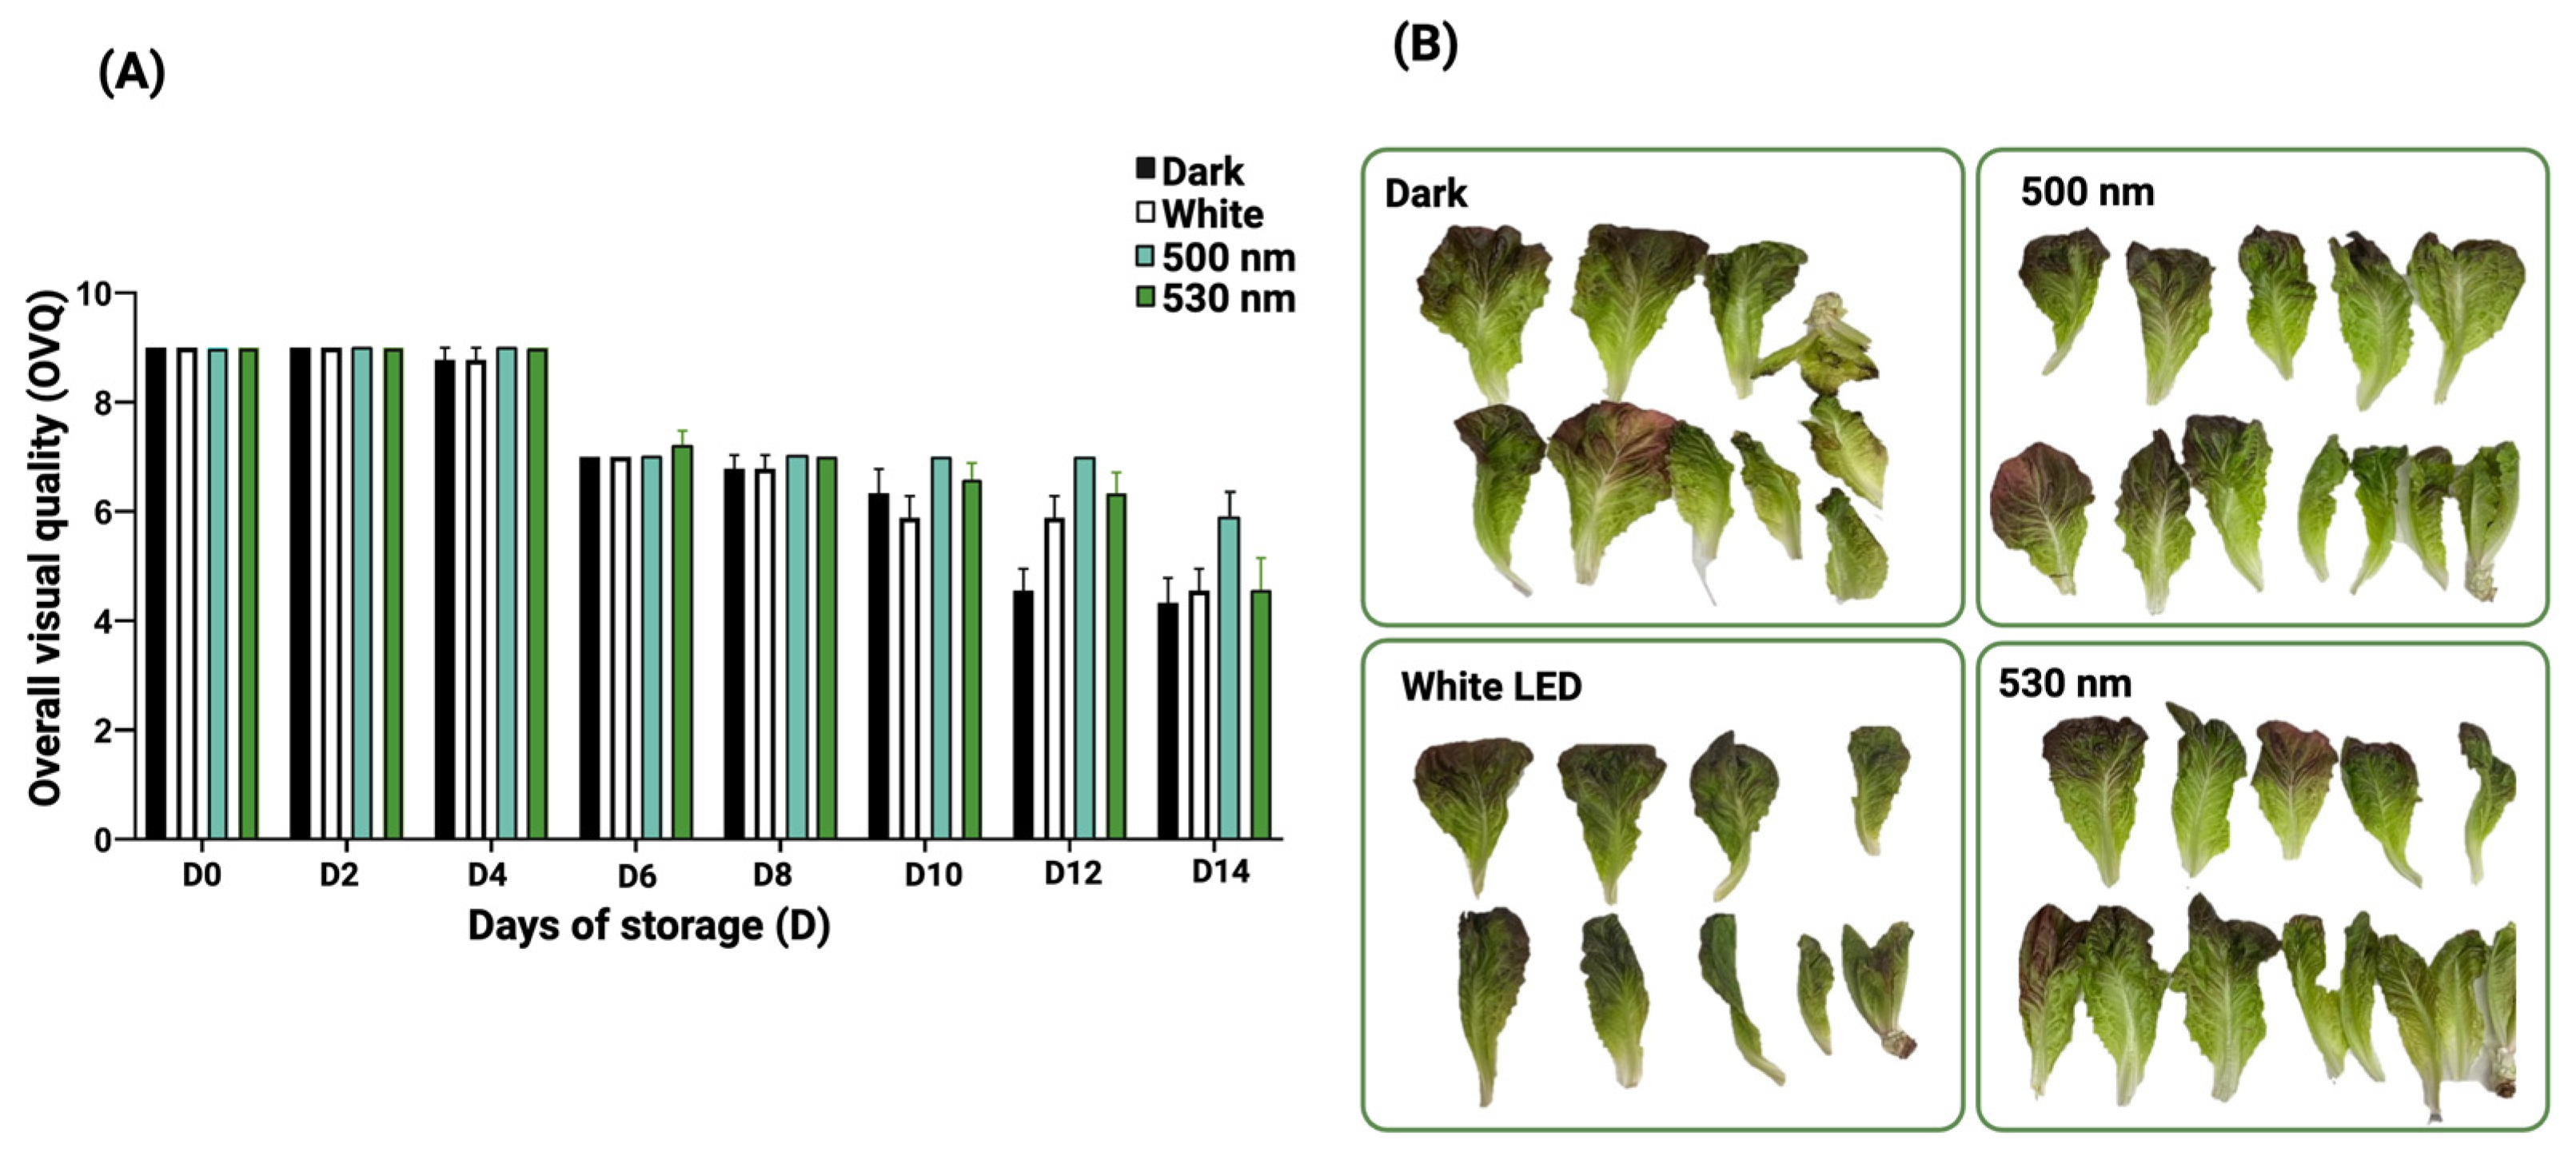
Leaf-edge browning and wilting are the primary defects leading to lower OVQ in romaine lettuce. The implementation of green LED lighting notably enhanced the postharvest quality of lettuce in our study. This improvement was evident in the prolonged shelf life (4 days), accompanied by reduced wilting and leaf-edge browning observed (from day 4 until the end of the experiment) in lettuce stored under green LEDs compared to those stored in the dark (Figure 4A,B). Green LEDs similarly extended the shelf life of spinach and kale [25]. This can be attributed to the closure of stomatal apertures and maintaining photosynthesis near the light compensation point induced by green LEDs [12,28]. The increase in TSSs, SPAD values, and crispness and the reduction in color change (∆E) in lettuces under green LEDs likely influence the OVQ assessment in this study. The increased TSSs may serve as a resource for ascorbic acid production, which delays leaf-edge browning [30].

3.5. Impact of Postharvest Lighting Environment on the Correlation Matrix and PCA

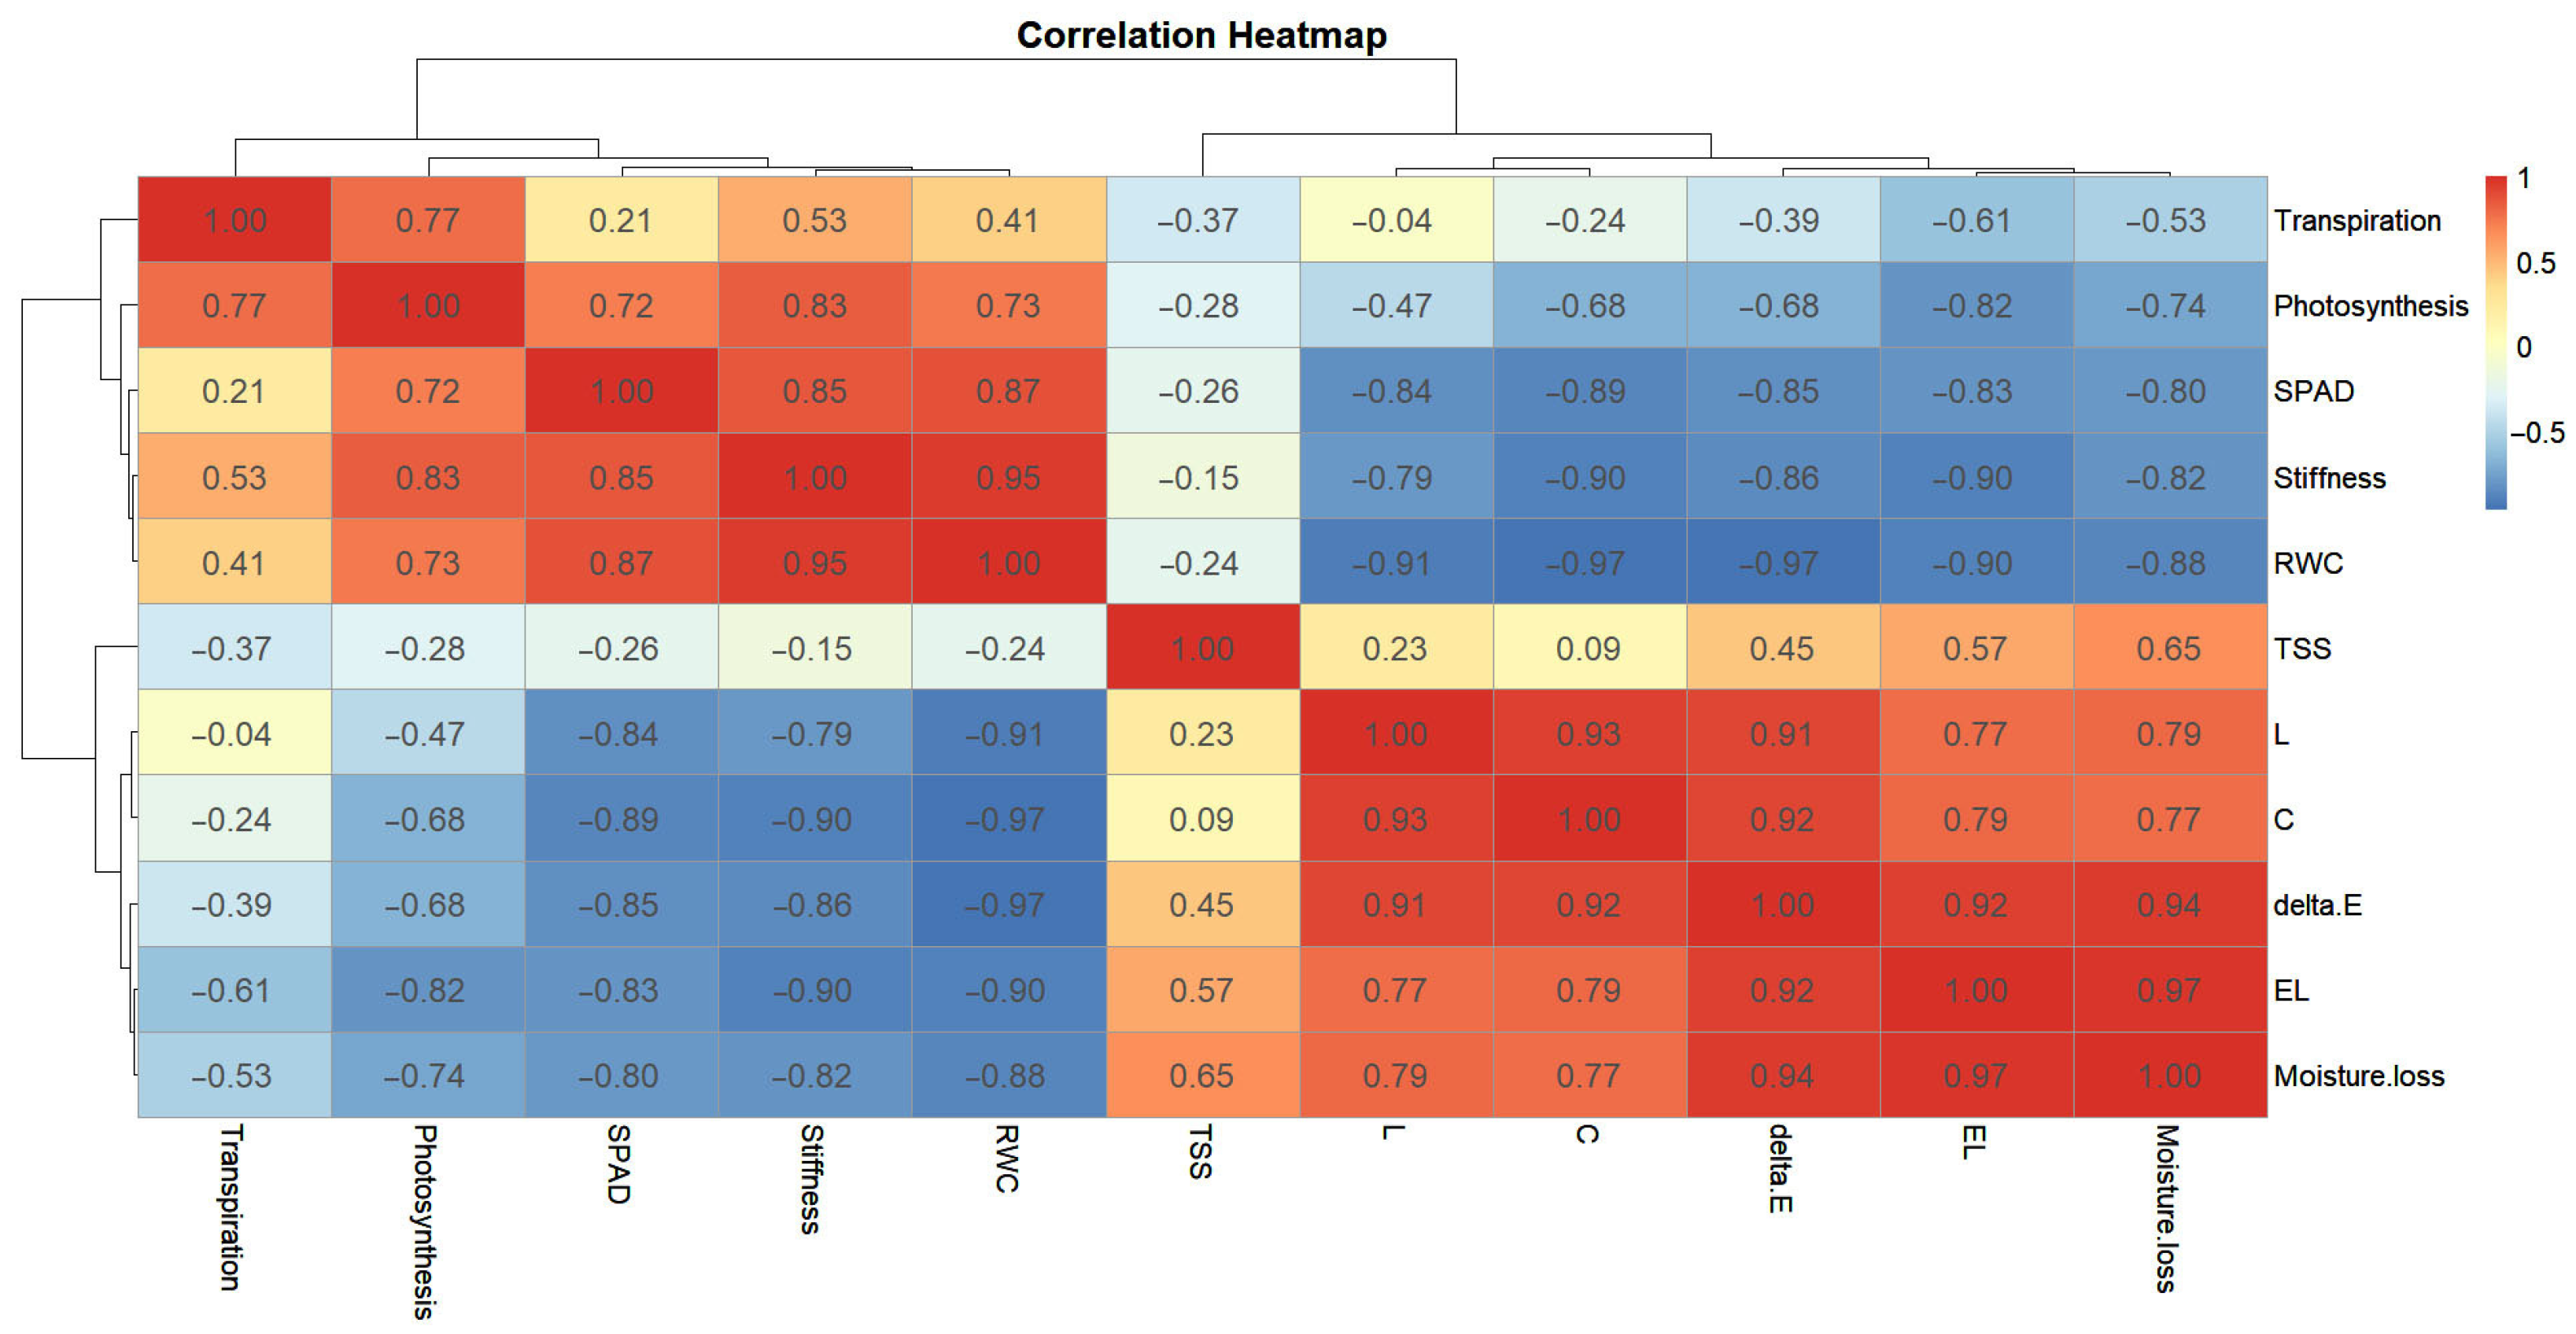
The correlation matrix revealed significant interrelationships between various postharvest quality parameters for lettuce under different lighting conditions (Figure 6). Photosynthesis exhibits strong negative correlations with EL (−0.82), moisture loss (−0.74), and ∆E (−0.68). These correlations indicate that increased photosynthetic activity is associated with reduced cell membrane damage, lower moisture loss, and minimal color degradation, thus maintaining overall lettuce quality. The strong negative correlation observed between crispness and moisture loss (−0.82), underscores the relationship between the mechanical strength and water content of lettuce leaves, supporting findings reported by Huyskens-Keil et al. [39]. Crispness was positively correlated with RWC (0.95) and SPAD values (0.87), highlighting the role of water retention and chlorophyll in maintaining leaf integrity. Moisture loss shows significant positive correlations with EL (0.97) and ∆E (0.92), indicating that higher moisture loss leads to increased cell membrane permeability and color changes, detrimental to lettuce quality. Based on the sister study [17], the TSS value was measured, and it was statistically significant. The TSS value tracks closely with the dehydration and color-shift markers—moisture loss, electrolyte leakage, ΔE, L*, and C* (r = 0.45–0.94, p < 0.05)—and is negatively related to photosynthesis, SPAD, and RWC (r = −0.24 to −0.68). Because lettuce leaves are >90% water, even modest desiccation concentrates soluble sugars; senescence-related starch and cell wall breakdown add further hexoses. Thus, a higher TSS reading in this context reflects water loss and tissue aging, not improved quality, explaining its alignment with the deterioration indicators under all light treatments. These findings suggest that optimizing lighting conditions, particularly with green LEDs, can mitigate some negative postharvest changes by enhancing photosynthesis, retaining moisture, and preserving chlorophyll content, thereby extending the shelf life and maintaining the freshness of lettuce. The PCA biplot illustrates the relationships between the postharvest quality parameters for lettuce and the different lighting treatments over the storage period (Figure 7A). The PCA identified two main components that collectively explain 87.3% of the total variance. The first principal component (F1) accounts for 73.6% of the variance and is primarily influenced by ∆E, EL, L*, C*, and moisture loss. This indicates that these parameters are crucial in determining the overall physiological response of lettuce to light exposure during storage. The second principal component (F2), explaining 13.8% of the variance, is characterized by parameters such as SPAD values, RWC, crispness, photosynthesis, and transpiration rate, highlighting their importance in another aspect of lettuce’s postharvest physiology. The TSS vector lies on the negative side of PC1, alongside moisture loss and electrolyte leakage, and points away from the quality retention traits (photosynthesis, SPAD, RWC, stiffness) on the positive side. Because PC1 alone explains 73.6% of the variance, this orientation indicates that increases in TSS content coincide with water loss and membrane breakdown rather than with metabolic vitality. In practical terms, lettuce samples that plot near the TSS/moisture-loss quadrant (e.g., dark and white LED treatments at day 14) experienced greater senescence, whereas those stored under green LEDs cluster toward the opposite side of PC1 with lower TSSs and better physiological status.
PCA shows that lettuce stored under green/530 nm LEDs for 14 d (530-d14) and green/500 nm LEDs (500-d14) clusters closely with higher SPAD values, RWC, and crispness, suggesting that these treatments help maintain chlorophyll content, water retention, and leaf turgidity. Conversely, lettuce stored in the dark for 14 d (D-d14) and under white LEDs for 14 d (W-d14) is associated with higher EL, moisture loss, and color change, indicating greater deterioration in these conditions. The clustering of observations additionally revealed that the initial storage conditions (day 0) for all treatments exhibit minimal variance, underscoring the marked changes that occur during the storage period. These findings suggest that green LED treatments are more effective in preserving the postharvest quality of lettuce compared to dark and white light storage conditions, as they better maintain physiological attributes critical for freshness and shelf life.
The dendrogram (Figure 7B) further corroborated the PCA by grouping the post-harvest lighting treatments into two distinct clusters based on dissimilarity. Cluster 1 (C1) included all day 0 treatments (500-d0, W-d0, D-d0, and 530-d0), indicating their initial similarity before storage. Cluster 2 (C2) splits into two subclusters, one containing the dark (D-d14) and white LED (W-d14) treatments after 14 d and the other containing the green LED treatments after 14 d (500-d14 and 530-d14). This separation highlights the significant impact of storage duration and light treatment on the quality parameters of lettuce.
The dissimilarity within Cluster 2 emphasizes the greater deterioration of lettuce quality in dark and white LED conditions compared to green LED conditions. The green LED treatments (500-d14, 530-d14) remained more similar to each other and less dissimilar to the initial conditions, reinforcing their effectiveness in maintaining quality attributes such as photosynthesis, RWC, and crispness over the storage period. The clear segregation of treatments based on light exposure and storage duration underscores the potential benefits of using green LED lights to extend the shelf life and preserve the quality of postharvest lettuce.
Taken together, the findings suggest that utilizing green LED light during postharvest cold storage could potentially extend shelf life by 4 days and sustain lettuce freshness by slowing natural color changes and preserving chlorophyll content and crispness. These factors contribute to the superior OVQ of green LED-treated samples compared to those stored in white light or darkness.

4. Conclusions

The impact of green light on the postharvest performance of lettuce suggests that applying green LED wavelengths effectively preserves several quality attributes during cold storage. This includes delaying yellowing and preventing texture degradation. Green LEDs enhance photosynthesis during postharvest storage, leading to higher TSSs and chlorophyll content while reducing transpiration and moisture loss compared to white LEDs. By maintaining photosynthesis and RWC, lettuce samples exposed to green light exhibit reduced leaf color change, delaying senescence while maintaining OVQ and crispiness during storage. Thus, storing lettuce heads under a green light may prove a useful tool in maintaining produce quality for a longer duration during postharvest handling, storage and display.

Supplementary Materials

The following supporting information can be downloaded at: https://www.mdpi.com/article/10.3390/horticulturae11070792/s1, Table S1. Two-way factorial ANOVA (RCBD) summarizing the effects of light regime (dark, white, 500 nm green, and 530 nm green), storage time (0, 7, and 14 d), and their interaction on key postharvest traits of lettuce stored at 5 °C. Shown for each response variable are the mean square (MS), F value, and associated p-value for the three sources of variation: light regime, time, and light × time. Asterisks indicate significance at p < 0.01; “ns” = not significant. Measurements: moisture loss ((% fresh mass), SPAD (chlorophyll index), photosynthesis (µmol CO2 m−2 s−1), transpiration (mmol H2O m−2 s−1), color difference (ΔE), lightness (L*), and electrolyte leakage (EL, %).

Author Contributions

S.S.: Conceptualization, Investigation, Methodology, Formal Analysis, and Writing—Original Draft. F.D.: Formal analysis and Writing—Review and Editing. S.A.: Methodology and Writing—Review and Editing. S.M.: Writing—Review and Editing. Y.G.: Methodology. M.L.: Conceptualization, Project Administration, Writing—Review and Editing, Methodology, Supervision, and Funding Acquisition. All authors have read and agreed to the published version of the manuscript.

Funding

This work was supported by UTechnology Corporation (Calgary, Alberta, Canada) and the Natural Sciences and Engineering Research Council of Canada (NSERC #CRDPJ 524170-18).

Data Availability Statement

Data will be made available upon request.

Acknowledgments

The authors would like to extend their heartfelt appreciation to all their colleagues in the Biomass Production Laboratory for their unwavering support throughout the project, with a special mention to Anthony Iheonye for their invaluable assistance. During the preparation of this work the author(s) used ChatGPT version GPT-3 in order to assist with language editing and improving clarity. After using this tool/service, the author(s) re-viewed and edited the content as needed and take(s) full responsibility for the content of the published study.

Conflicts of Interest

The authors declare that they have no recognized financial conflicts of interest or personal connections that might have influenced the research presented in this study.

References

  1. Shezi, S.; Magwaza, L.S.; Mditshwa, A.; Tesfay, S.Z. Changes in biochemistry of fresh produce in response to ozone postharvest treatment. Sci. Hortic. 2020, 269, 109397. [Google Scholar] [CrossRef]
  2. Kader, A.A. Postharvest Technology of Horticultural Crops; University of California Agriculture and Natural Resources: Davis, CA, USA, 2002. [Google Scholar]
  3. Jiang, A.; Zuo, J.; Zheng, Q.; Guo, L.; Gao, L.; Zhao, S.; Wang, Q.; Hu, W. Red LED irradiation maintains the postharvest quality of broccoli by elevating antioxidant enzyme activity and reducing the expression of senescence-related genes. Sci. Hortic. 2019, 251, 73–79. [Google Scholar] [CrossRef]
  4. Kasim, M.U.; Kasim, R. While continuous white LED lighting increases chlorophyll content (SPAD), green LED light reduces the infection rate of lettuce during storage and shelf-life conditions. J. Food Process. Preserv. 2017, 41, e13266. [Google Scholar] [CrossRef]
  5. Zhan, L.; Hu, J.; Pang, L.; Li, Y.; Shao, J. Light exposure reduced browning enzyme activity and accumulated total phenols in cauliflower heads during cool storage. Postharvest Biol. Technol. 2014, 88, 17–20. [Google Scholar] [CrossRef]
  6. Zhang, X.; Zhang, M.; Xu, B.; Mujumdar, A.S.; Guo, Z. Light-emitting diodes (below 700 nm): Improving the preservation of fresh foods during postharvest handling, storage, and transportation. Compr. Rev. Food Sci. Food Saf. 2022, 21, 106–126. [Google Scholar] [CrossRef] [PubMed]
  7. Lefsrud, M.G.; Kopsell, D.A.; Sams, C.E. Irradiance from distinct wavelength light-emitting diodes affect secondary metabolites in kale. HortScience 2008, 43, 2243–2244. [Google Scholar] [CrossRef]
  8. Dhakal, R.; Baek, K.-H. Short period irradiation of single blue wavelength light extends the storage period of mature green tomatoes. Postharvest Biol. Technol. 2014, 90, 73–77. [Google Scholar] [CrossRef]
  9. Xu, F.; Cao, S.; Shi, L.; Chen, W.; Su, X.; Yang, Z. Blue light irradiation affects anthocyanin content and enzyme activities involved in postharvest strawberry fruit. J. Agric. Food Chem. 2014, 62, 4778–4783. [Google Scholar] [CrossRef]
  10. Song, Y.; Qiu, K.; Gao, J.; Kuai, B. Molecular and physiological analyses of the effects of red and blue LED light irradiation on postharvest senescence of pak choi. Postharvest Biol. Technol. 2020, 164, 111155. [Google Scholar] [CrossRef]
  11. Lester, G.E.; Makus, D.J.; Hodges, D.M. Relationship between fresh-packaged spinach leaves exposed to continuous light or dark and bioactive contents: Effects of cultivar, leaf size, and storage duration. J. Agric. Food Chem. 2010, 58, 2980–2987. [Google Scholar] [CrossRef]
  12. Rufyikiri, A.S. The Use of Light Emitting Diodes (LEDs) for Shelf Life Extension of Spinach and Kale; McGill University: Montreal, QC, Canada, 2018. [Google Scholar]
  13. Jin, P.; Yao, D.; Xu, F.; Wang, H.; Zheng, Y. Effect of light on quality and bioactive compounds in postharvest broccoli florets. Food Chem. 2015, 172, 705–709. [Google Scholar] [CrossRef]
  14. Jin, S.; Ding, Z.; Xie, J. Study of postharvest quality and antioxidant capacity of freshly cut amaranth after blue LED light treatment. Plants 2021, 10, 1614. [Google Scholar] [CrossRef]
  15. Zhang, Y.; Xie, J. The effect of red and violet light emitting diode (LED) treatments on the postharvest quality and biodiversity of fresh-cut pakchoi (Brassica rapa L. Chinensis). Food Sci. Technol. Int. 2022, 28, 297–308. [Google Scholar] [CrossRef] [PubMed]
  16. Salehinia, S.; Didaran, F.; Aliniaeifard, S.; Macpherson, S.; Orsat, V.; Lefsrud, M. Effects of different light spectra and intensities on stomatal function in lettuce and basil. J. Hortic. Res. 2025, 33, 1. [Google Scholar] [CrossRef]
  17. Salehinia, S.; Didaran, F.; Aliniaeifard, S.; Zohrabi, S.; MacPherson, S.; Lefsrud, M. Green light enhances the phytochemical preservation of lettuce during postharvest cold storage. PLoS ONE 2024, 19, e0311100. [Google Scholar] [CrossRef]
  18. Firouz, M.S.; Alimardani, R.; Mobli, H.; Mohtasebi, S.S. Effect of modified atmosphere packaging on the mechanical properties of lettuce during shelf life in cold storage. Inf. Process. Agric. 2021, 8, 485–493. [Google Scholar]
  19. Barrs, H.; Weatherley, P. A re-examination of the relative turgidity technique for estimating water deficits in leaves. Aust. J. Biol. Sci. 1962, 15, 413–428. [Google Scholar] [CrossRef]
  20. Kiran, S. Effects of vermicompost on some morphological, physiological and biochemical parameters of lettuce (Lactuca sativa var. crispa) under drought stress. Not. Bot. Horti Agrobot. Cluj-Napoca 2019, 47, 352–358. [Google Scholar] [CrossRef]
  21. Kader, A.A.; Lipton, W.J.; Morris, L.L. Systems for Scoring Quality of Harvested Lettuce1. HortScience 1973, 8, 408–409. [Google Scholar] [CrossRef]
  22. Tian, W.; Lv, Y.; Cao, J.; Jiang, W. Retention of iceberg lettuce quality by low temperature storage and postharvest application of 1-methylcyclopropene or gibberellic acid. J. Food Sci. Technol. 2014, 51, 943–949. [Google Scholar] [CrossRef]
  23. Alipasandi, A.; Mahmoudi, A.; Sturm, B.; Behfar, H.; Zohrabi, S. Application of meta-heuristic feature selection method in low-cost portable device for watermelon classification using signal processing techniques. Comput. Electron. Agric. 2023, 205, 107578. [Google Scholar] [CrossRef]
  24. Pennisi, G.; Orsini, F.; Castillejo, N.; Gómez, P.A.; Crepaldi, A.; Fernández, J.A.; Egea-Gilabert, C.; Artés-Hernández, F.; Gianquinto, G. Spectral composition from led lighting during storage affects nutraceuticals and safety attributes of fresh-cut red chard (Beta vulgaris) and rocket (Diplotaxis tenuifolia) leaves. Postharvest Biol. Technol. 2021, 175, 111500. [Google Scholar] [CrossRef]
  25. Rufyikiri, A.-S.; Addo, P.W.; Wu, B.-S.; MacPherson, S.; Orsat, V.; Lefsrud, M. The use of LEDs for the stomatal response, light compensation points, and storage of spinach and kale. J. Photochem. Photobiol. B Biol. 2024, 257, 112959. [Google Scholar] [CrossRef]
  26. Lee, Y.J.; Ha, J.Y.; Oh, J.E.; Cho, M.S. The effect of LED irradiation on the quality of cabbage stored at a low temperature. Food Sci. Biotechnol. 2014, 23, 1087–1093. [Google Scholar] [CrossRef]
  27. Pennisi, G.; Orsini, F.; Blasioli, S.; Cellini, A.; Crepaldi, A.; Braschi, I.; Spinelli, F.; Nicola, S.; Fernandez, J.A.; Stanghellini, C.; et al. Resource use efficiency of indoor lettuce (Lactuca sativa L.) cultivation as affected by red: Blue ratio provided by LED lighting. Sci. Rep. 2019, 9, 14127. [Google Scholar] [CrossRef]
  28. Salehinia, S. Effects of Different Light Emitting Diode Spectra and Intensities on the Stomatal Functioning of Lettuce and Basil; McGill University: Montreal, QC, Canada, 2023. [Google Scholar]
  29. Roura, S.I.; Davidovich, L.; Valle, C.D. Quality loss in minimally processed Swiss chard related to amount of damaged area. LWT-Food Sci. Technol. 2000, 33, 53–59. [Google Scholar] [CrossRef]
  30. Woltering, E.; Witkowska, I. Effects of pre-and postharvest lighting on quality and shelf life of fresh-cut lettuce. In Proceedings of the VIII International Symposium on Light in Horticulture 1134, East Lansing, MI, USA, 22–26 May 2016. [Google Scholar]
  31. Rahman, M.M.; Field, D.L.; Ahmed, S.M.; Hasan, M.T.; Basher, M.K.; Alameh, K. LED illumination for high-quality high-yield crop growth in protected cropping environments. Plants 2021, 10, 2470. [Google Scholar] [CrossRef]
  32. Zhan, L.; Hu, J.; Li, Y.; Pang, L. Combination of light exposure and low temperature in preserving quality and extending shelf-life of fresh-cut broccoli (Brassica oleracea L.). Postharvest Biol. Technol. 2012, 72, 76–81. [Google Scholar] [CrossRef]
  33. Hasperué, J.H.; Rodoni, L.M.; Guardianelli, L.M.; Chaves, A.R.; Martínez, G.A. Use of LED light for Brussels sprouts postharvest conservation. Sci. Hortic. 2016, 213, 281–286. [Google Scholar] [CrossRef]
  34. Loi, M.; Liuzzi, V.C.; Fanelli, F.; De Leonardis, S.; Creanza, T.M.; Ancona, N.; Paciolla, C.; Mulè, G. Effect of different light-emitting diode (LED) irradiation on the shelf life and phytonutrient content of broccoli (Brassica oleracea L. var. italica). Food Chem. 2019, 283, 206–214. [Google Scholar] [CrossRef]
  35. Ashrostaghi, T.; Aliniaeifard, S.; Shomali, A.; Azizinia, S.; Abbasi Koohpalekani, J.; Moosavi-Nezhad, M.; Gruda, N.S. Light intensity: The role player in cucumber response to cold stress. Agronomy 2022, 12, 201. [Google Scholar] [CrossRef]
  36. Serrano, M.; Martinez-Romero, D.; Guillen, F.; Castillo, S.; Valero, D. Maintenance of broccoli quality and functional properties during cold storage as affected by modified atmosphere packaging. Postharvest Biol. Technol. 2006, 39, 61–68. [Google Scholar] [CrossRef]
  37. Olarte, C.; Sanz, S.; Echávarri, J.F.; Ayala, F. Effect of plastic permeability and exposure to light during storage on the quality of minimally processed broccoli and cauliflower. LWT-Food Sci. Technol. 2009, 42, 402–411. [Google Scholar] [CrossRef]
  38. Ayala, F.; Echávarri, J.F.; Olarte, C.; Sanz, S. Quality characteristics of minimally processed leek packaged using different films and stored in lighting conditions. Int. J. Food Sci. Technol. 2009, 44, 1333–1343. [Google Scholar] [CrossRef]
  39. Huyskens-Keil, S.; Eichholz-Dündar, I.; Hassenberg, K.; Herppich, W. Impact of light quality (white, red, blue light and UV-C irradiation) on changes in anthocyanin content and dynamics of PAL and POD activities in apical and basal spear sections of white asparagus after harvest. Postharvest Biol. Technol. 2020, 161, 111069. [Google Scholar] [CrossRef]
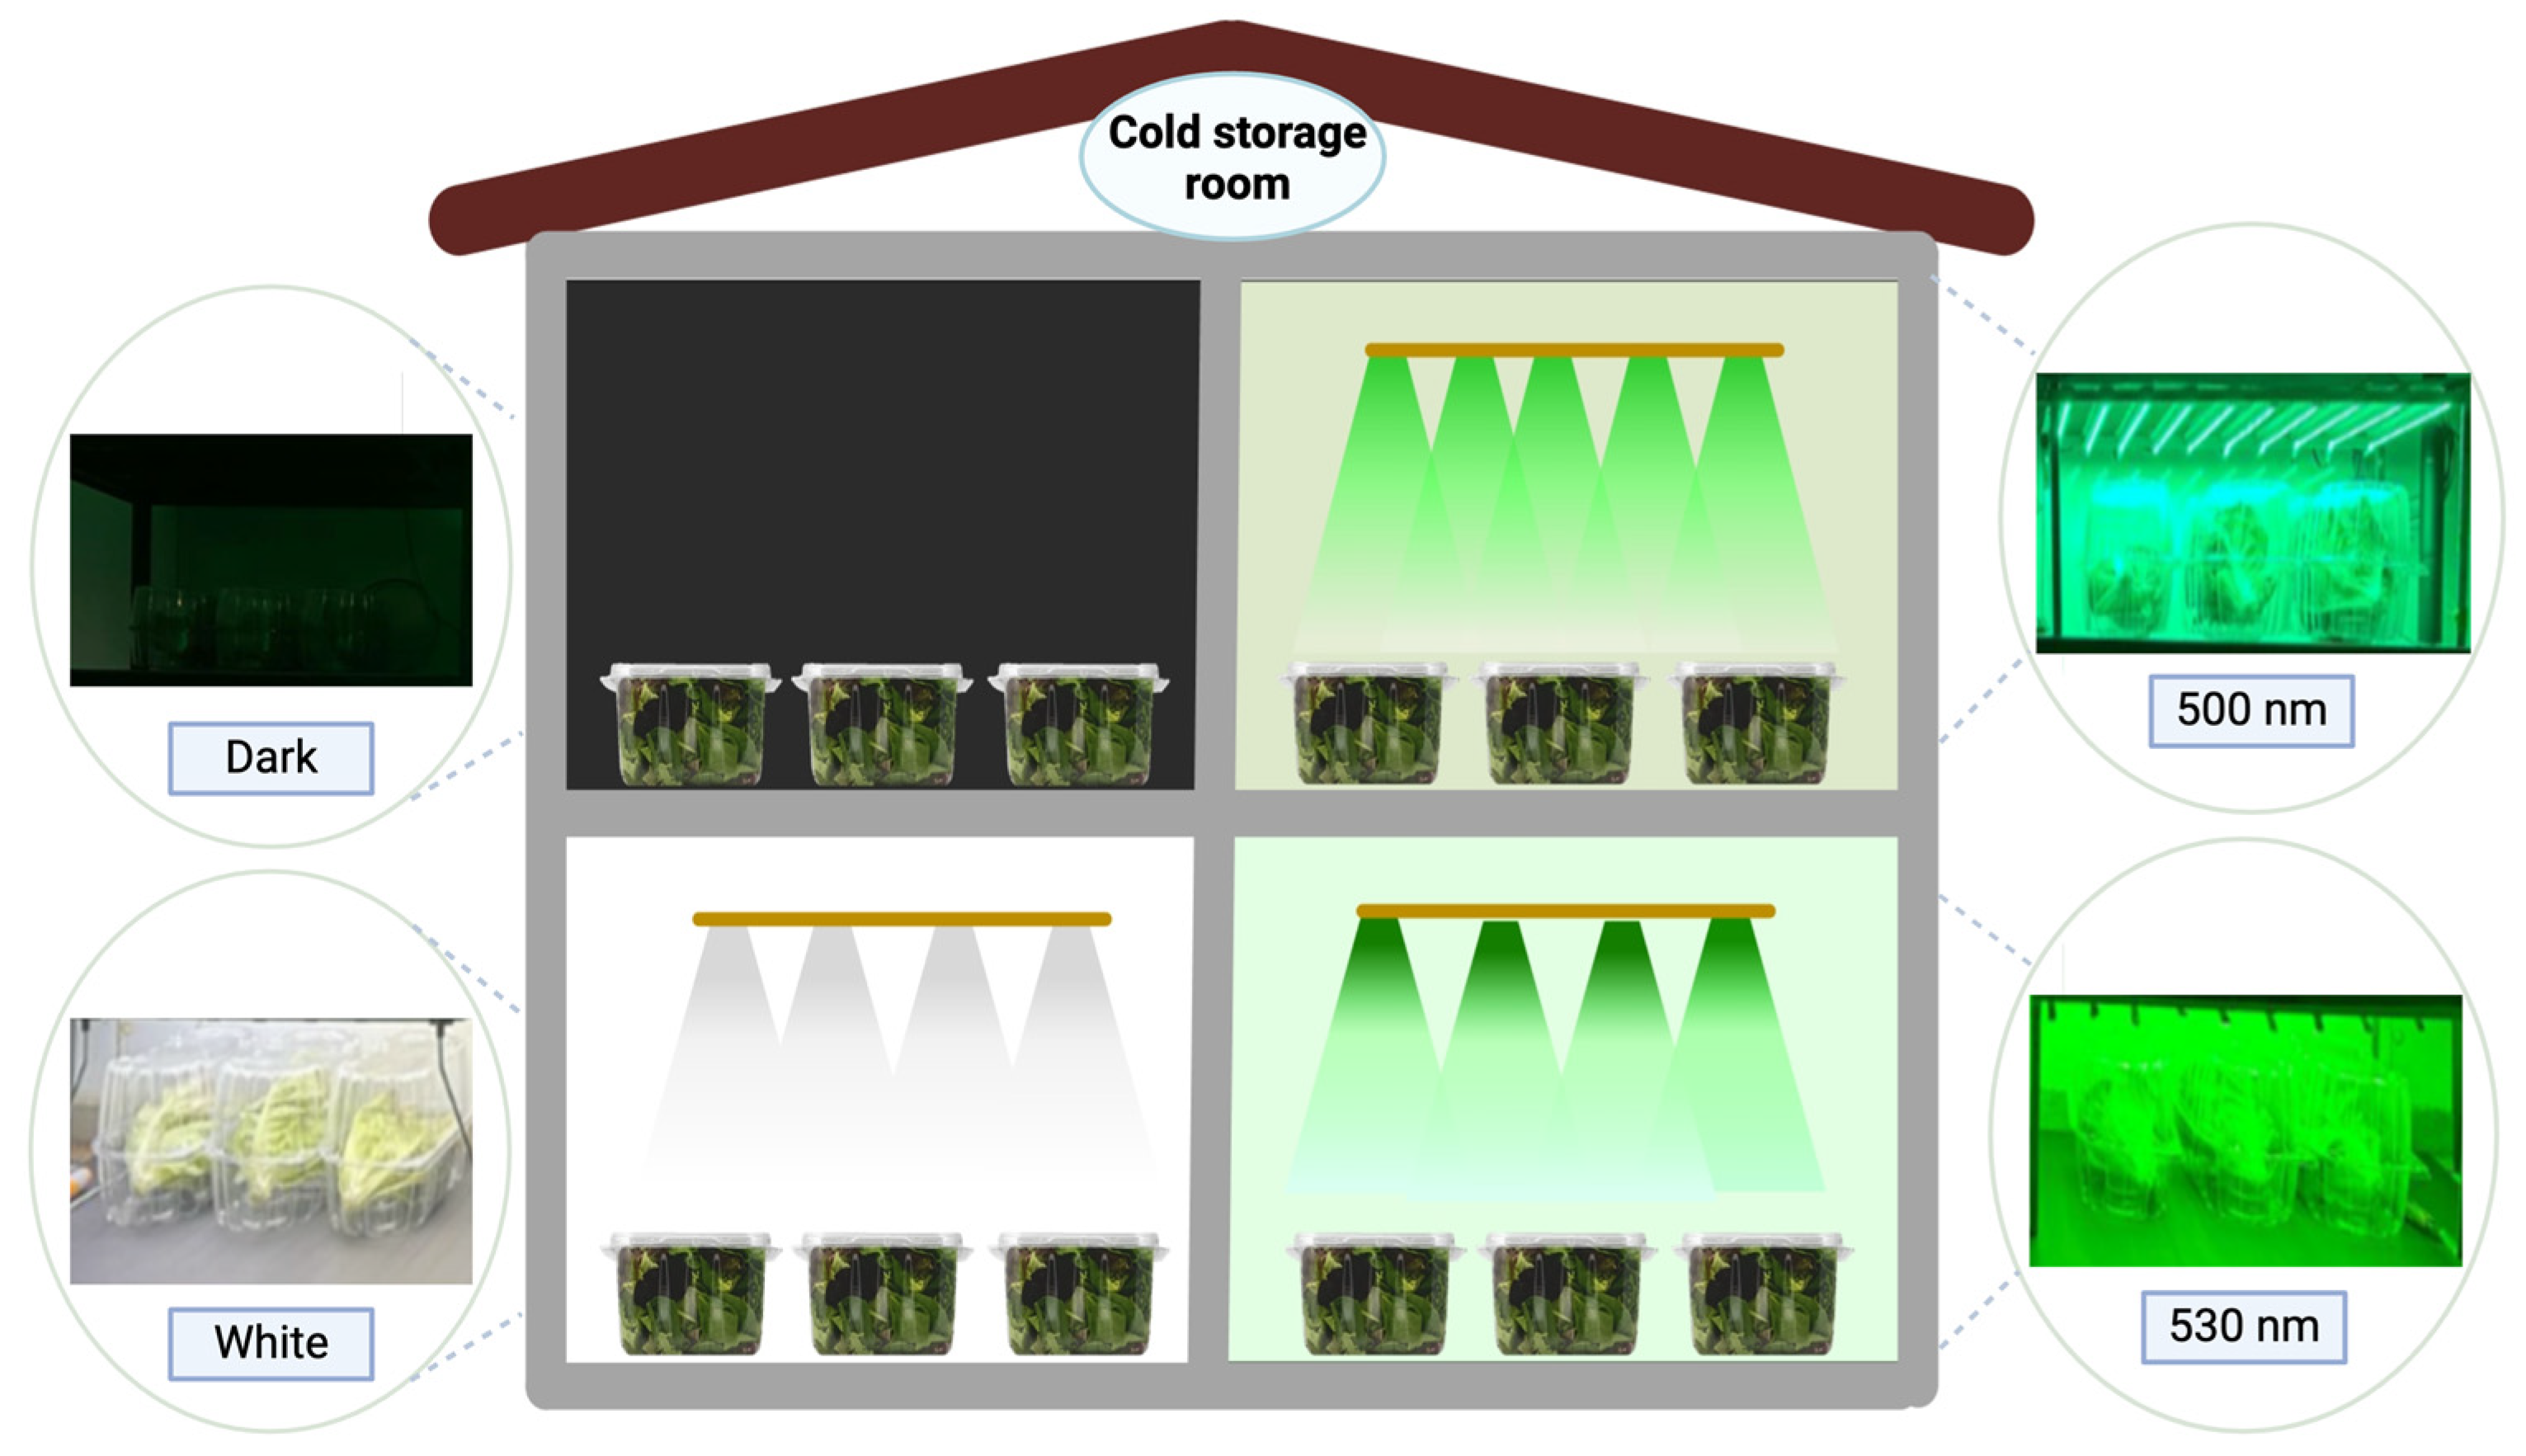
Figure 1. Representative image of lettuces under different cold storage conditions, including dark (top left shelf), green LEDs with peaks at 500 nm (top right shelf) and 530 nm (bottom right shelf), and white LEDs (400–700 nm; bottom left shelf).
Horticulturae 11 00792 g001
Figure 2. Effect of postharvest light spectra on moisture loss (%) ((A)—main-effect mean for each spectrum (averaged across days)), relative water content (%) [RWC; ((B)—light-gray bars = day 0; colored bars = day 14)], and transpiration rate ((C)—light gray = day 0; blue = day 7; dark gray = day 14). (D) Moisture loss versus storage day (from day 0 to day 14) for lettuces stored for 14 days at 5 °C under green LEDs (with 500 nm and 530 nm peak), white LEDs (400–700 nm), and dark storage conditions. Values represent the means of three replications ± SEs. Data in columns with different letters are significantly different p < 0.01.
Horticulturae 11 00792 g002
Figure 3. Effect of postharvest light spectra on net photosynthesis ((A)—at day 0, 7, and 14), SPAD value ((B)—average values across all storage days, because the Spectrum × Day interaction was not significant), and color change [∆E; ((C)—average values across all days, because the Spectrum × Day interaction was not significant)], in lettuce stored for 14 days at 5 °C under green LEDs (500 nm and 530 nm), white LEDs (400–700 nm), and dark conditions. (D) Time–course curves for SPAD (dashed line) and ΔE (solid line), shown as means across spectra (from day 0 to day 14). Values represent the means of three replications ± SE. The data in columns with different letters are significantly different (p < 0.01).
Horticulturae 11 00792 g003
Figure 4. The effect of different postharvest light spectra on overall visual quality (OVQ) in lettuce (A) stored for 14 days at 5 °C under varying conditions: green LEDs (500 nm and 530 nm), white LEDs (400–700 nm), and a dark control. Values are shown as the means of three replications ± SEs. Data in columns with different letters indicate significant differences at p < 0.01. (B) Representative images of lettuce stored for 14 days at 5 °C in the following conditions: dark (top left), 500 nm green LEDs (top right), white LEDs (bottom left), and 530 nm green LEDs (bottom right).
Horticulturae 11 00792 g004
Figure 5. Effect of postharvest light spectra on chroma and lightness [C* and L*; (A,C)—main-effect means for each spectrum, averaged across days 0, 7 and 14 because the Spectrum × Day interaction was not significant] in lettuce stored for 14 days at 5 °C under green LEDs (500 nm and 530 nm), white LEDs (400–700 nm), and dark conditions. (B,D) Time–course curves for C* and L*, plotted as means across all spectra (from day 0 to day 14). Values represent the means of three replications ± SE. The data in columns with different letters are significantly different p < 0.01.
Horticulturae 11 00792 g005
Figure 6. The correlation matrix of lettuce stored for 14 days at 5 °C under green LEDs (500 nm and 530 nm), white LEDs (400–700 nm), and a dark control.
Horticulturae 11 00792 g006
Figure 7. Principal component analysis (PCA) of quality attributes in lettuce stored 14 d at 5 °C under different light spectra. (A) Biplot: red vectors = active variables—moisture loss, EL (electrolyte leakage), RWC (relative water content), SPAD (chlorophyll index), photosynthesis, transpiration, TSSs (total soluble solids), and the color metrics L* (lightness), C* (chroma), and ΔE (total color difference). Blue symbols = active observations coded by light treatment–sampling day (D = dark; W = white LED 400–700 nm; 500 = 500 nm green LED; 530 = 530 nm green LED; d0/d14 = day 0 or day 14). The first two principal components (F1 = 73.56%, F2 = 13.77%) explain 87.33% of the total variance. (B) Dendrogram: ward-linkage clustering of the same observations; clusters C1 and C2 are separated at the dashed dissimilarity threshold.
Horticulturae 11 00792 g007
Table 1. Effect of different postharvest light spectra on lettuce leaf TSS and crispness (stiffness) after a 14 d storage period at 5 °C under green LEDs (500 nm 530 nm), white LEDs (400–700 nm), and dark conditions. Values represent the means of three replications ± SEs, and data in columns with different letters are significantly different p < 0.01.
Day 0Day 14
-DarkWhite500 nm530 nm
Crispness (mN.mm−1)2.83 a1.717 c2.17 b2.5 a2.52 a
Standard error (+/−)0.210.1320.2320.3670.315
Electrolyte leakage17.483 b38.148 a33.42 a29.873 a31.90 a
Standard error (+/−)1.852.041.7761.6841.716
Disclaimer/Publisher’s Note: The statements, opinions and data contained in all publications are solely those of the individual author(s) and contributor(s) and not of MDPI and/or the editor(s). MDPI and/or the editor(s) disclaim responsibility for any injury to people or property resulting from any ideas, methods, instructions or products referred to in the content.